
Optimization of Scanning Protocol for AI-Integrated Assessment of HER2 Dual Bright-Field In-Situ Hybridization Application in Breast Cancer

 , , , and
Abstract

1. Introduction
2. Materials and Methods
2.1. Cases and Slide Preparation
2.2. Dual BF ISH
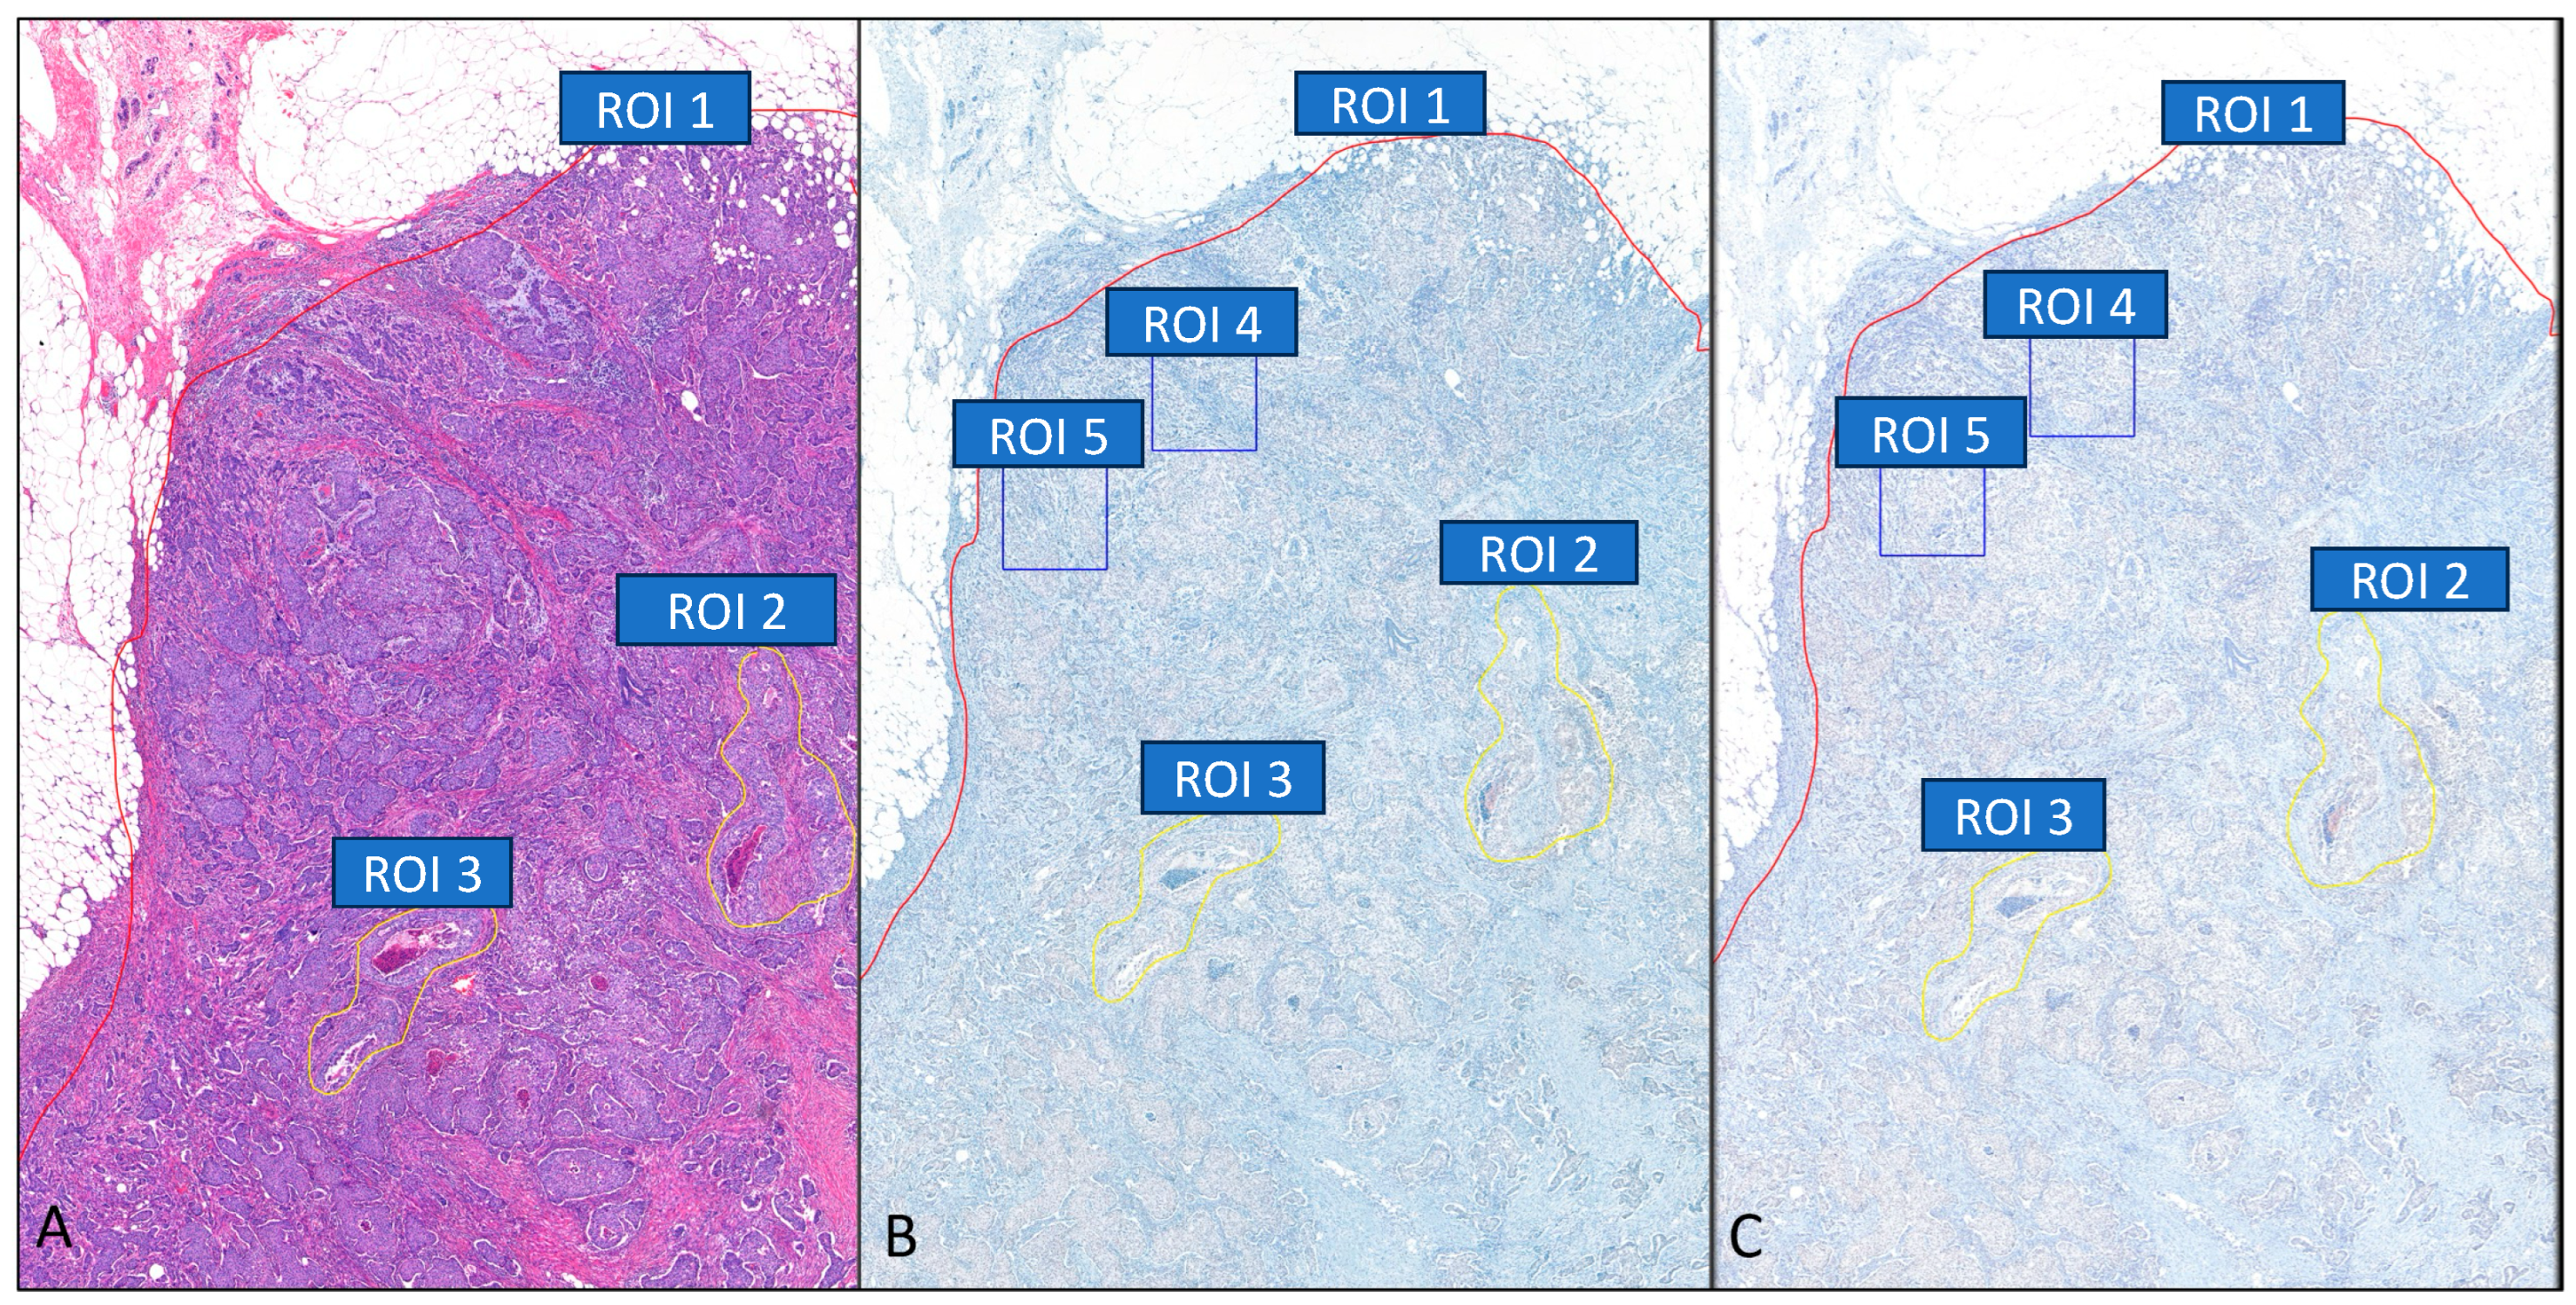
2.3. Regions of Interest (ROI)
2.4. WSI Scanner and Scanning Protocol
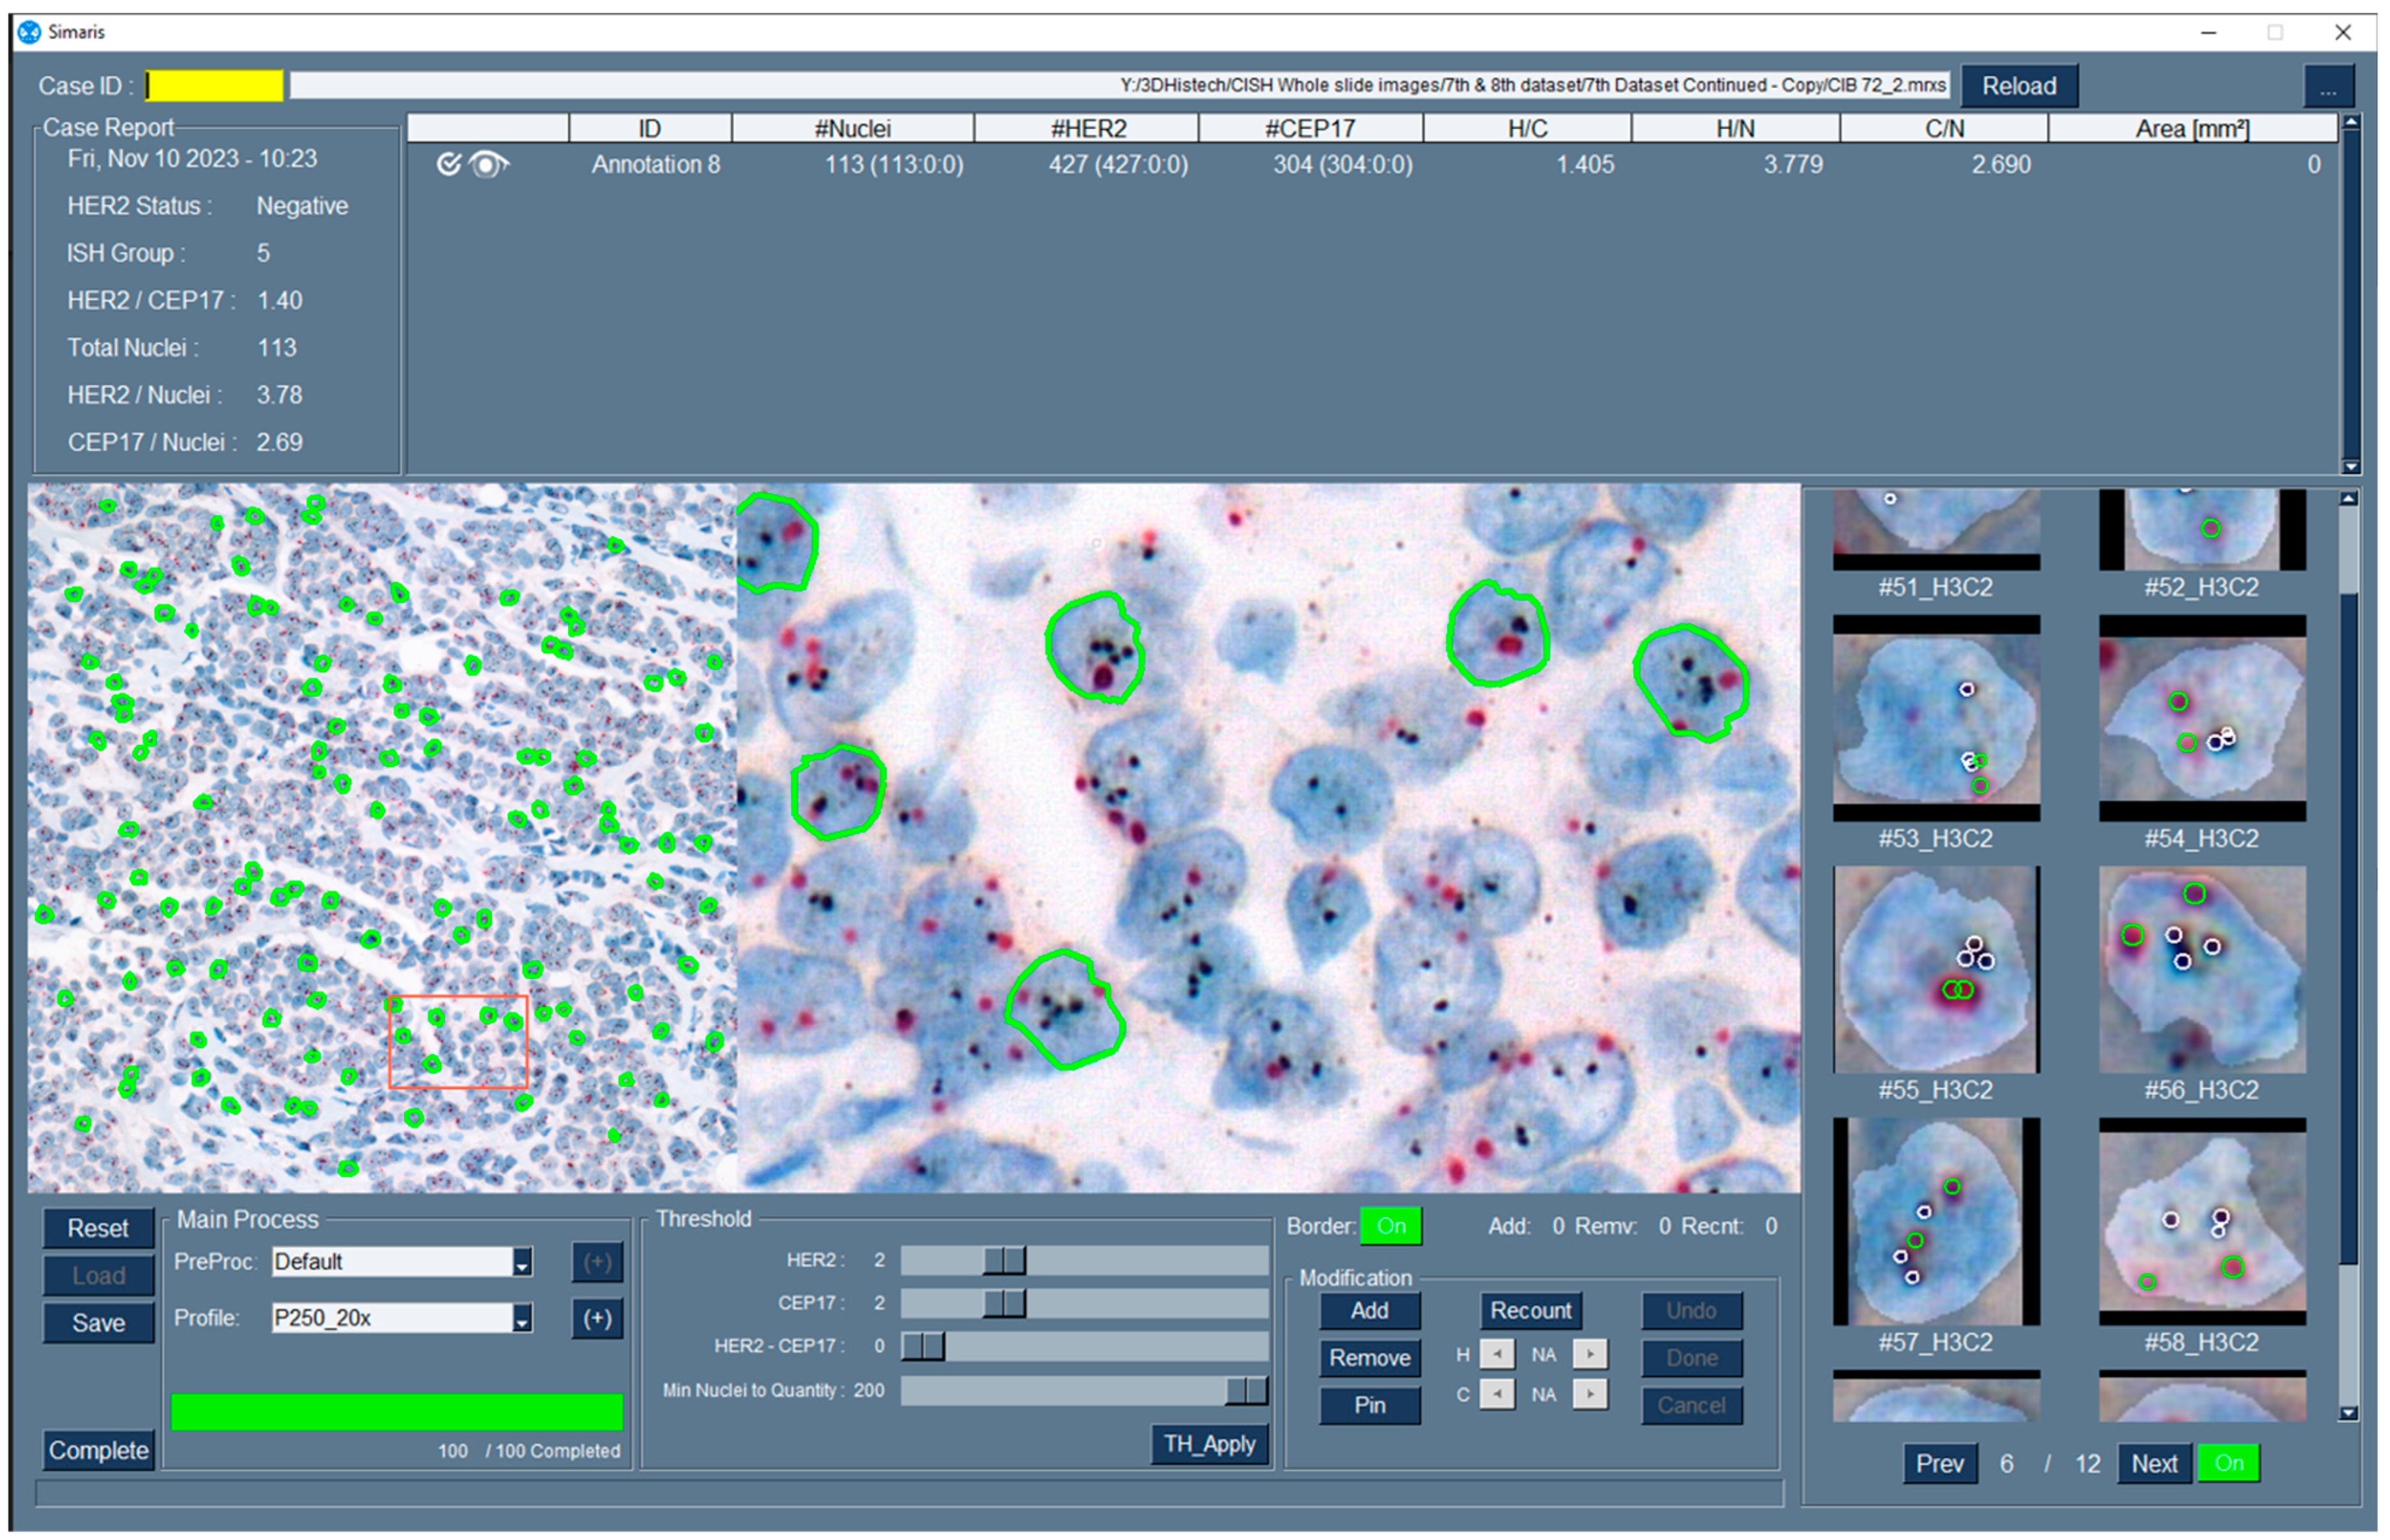
2.5. AI-Integrated Dual BF ISH Application
2.6. HER2 Status and ASCO/CAP ISH Group Diagnosis
2.7. Performance Analysis
2.8. Ground Truth of HER2 Status and ASCO/CAP ISH Group
2.9. Statistical Analysis
3. Results
3.1. Scanning Time
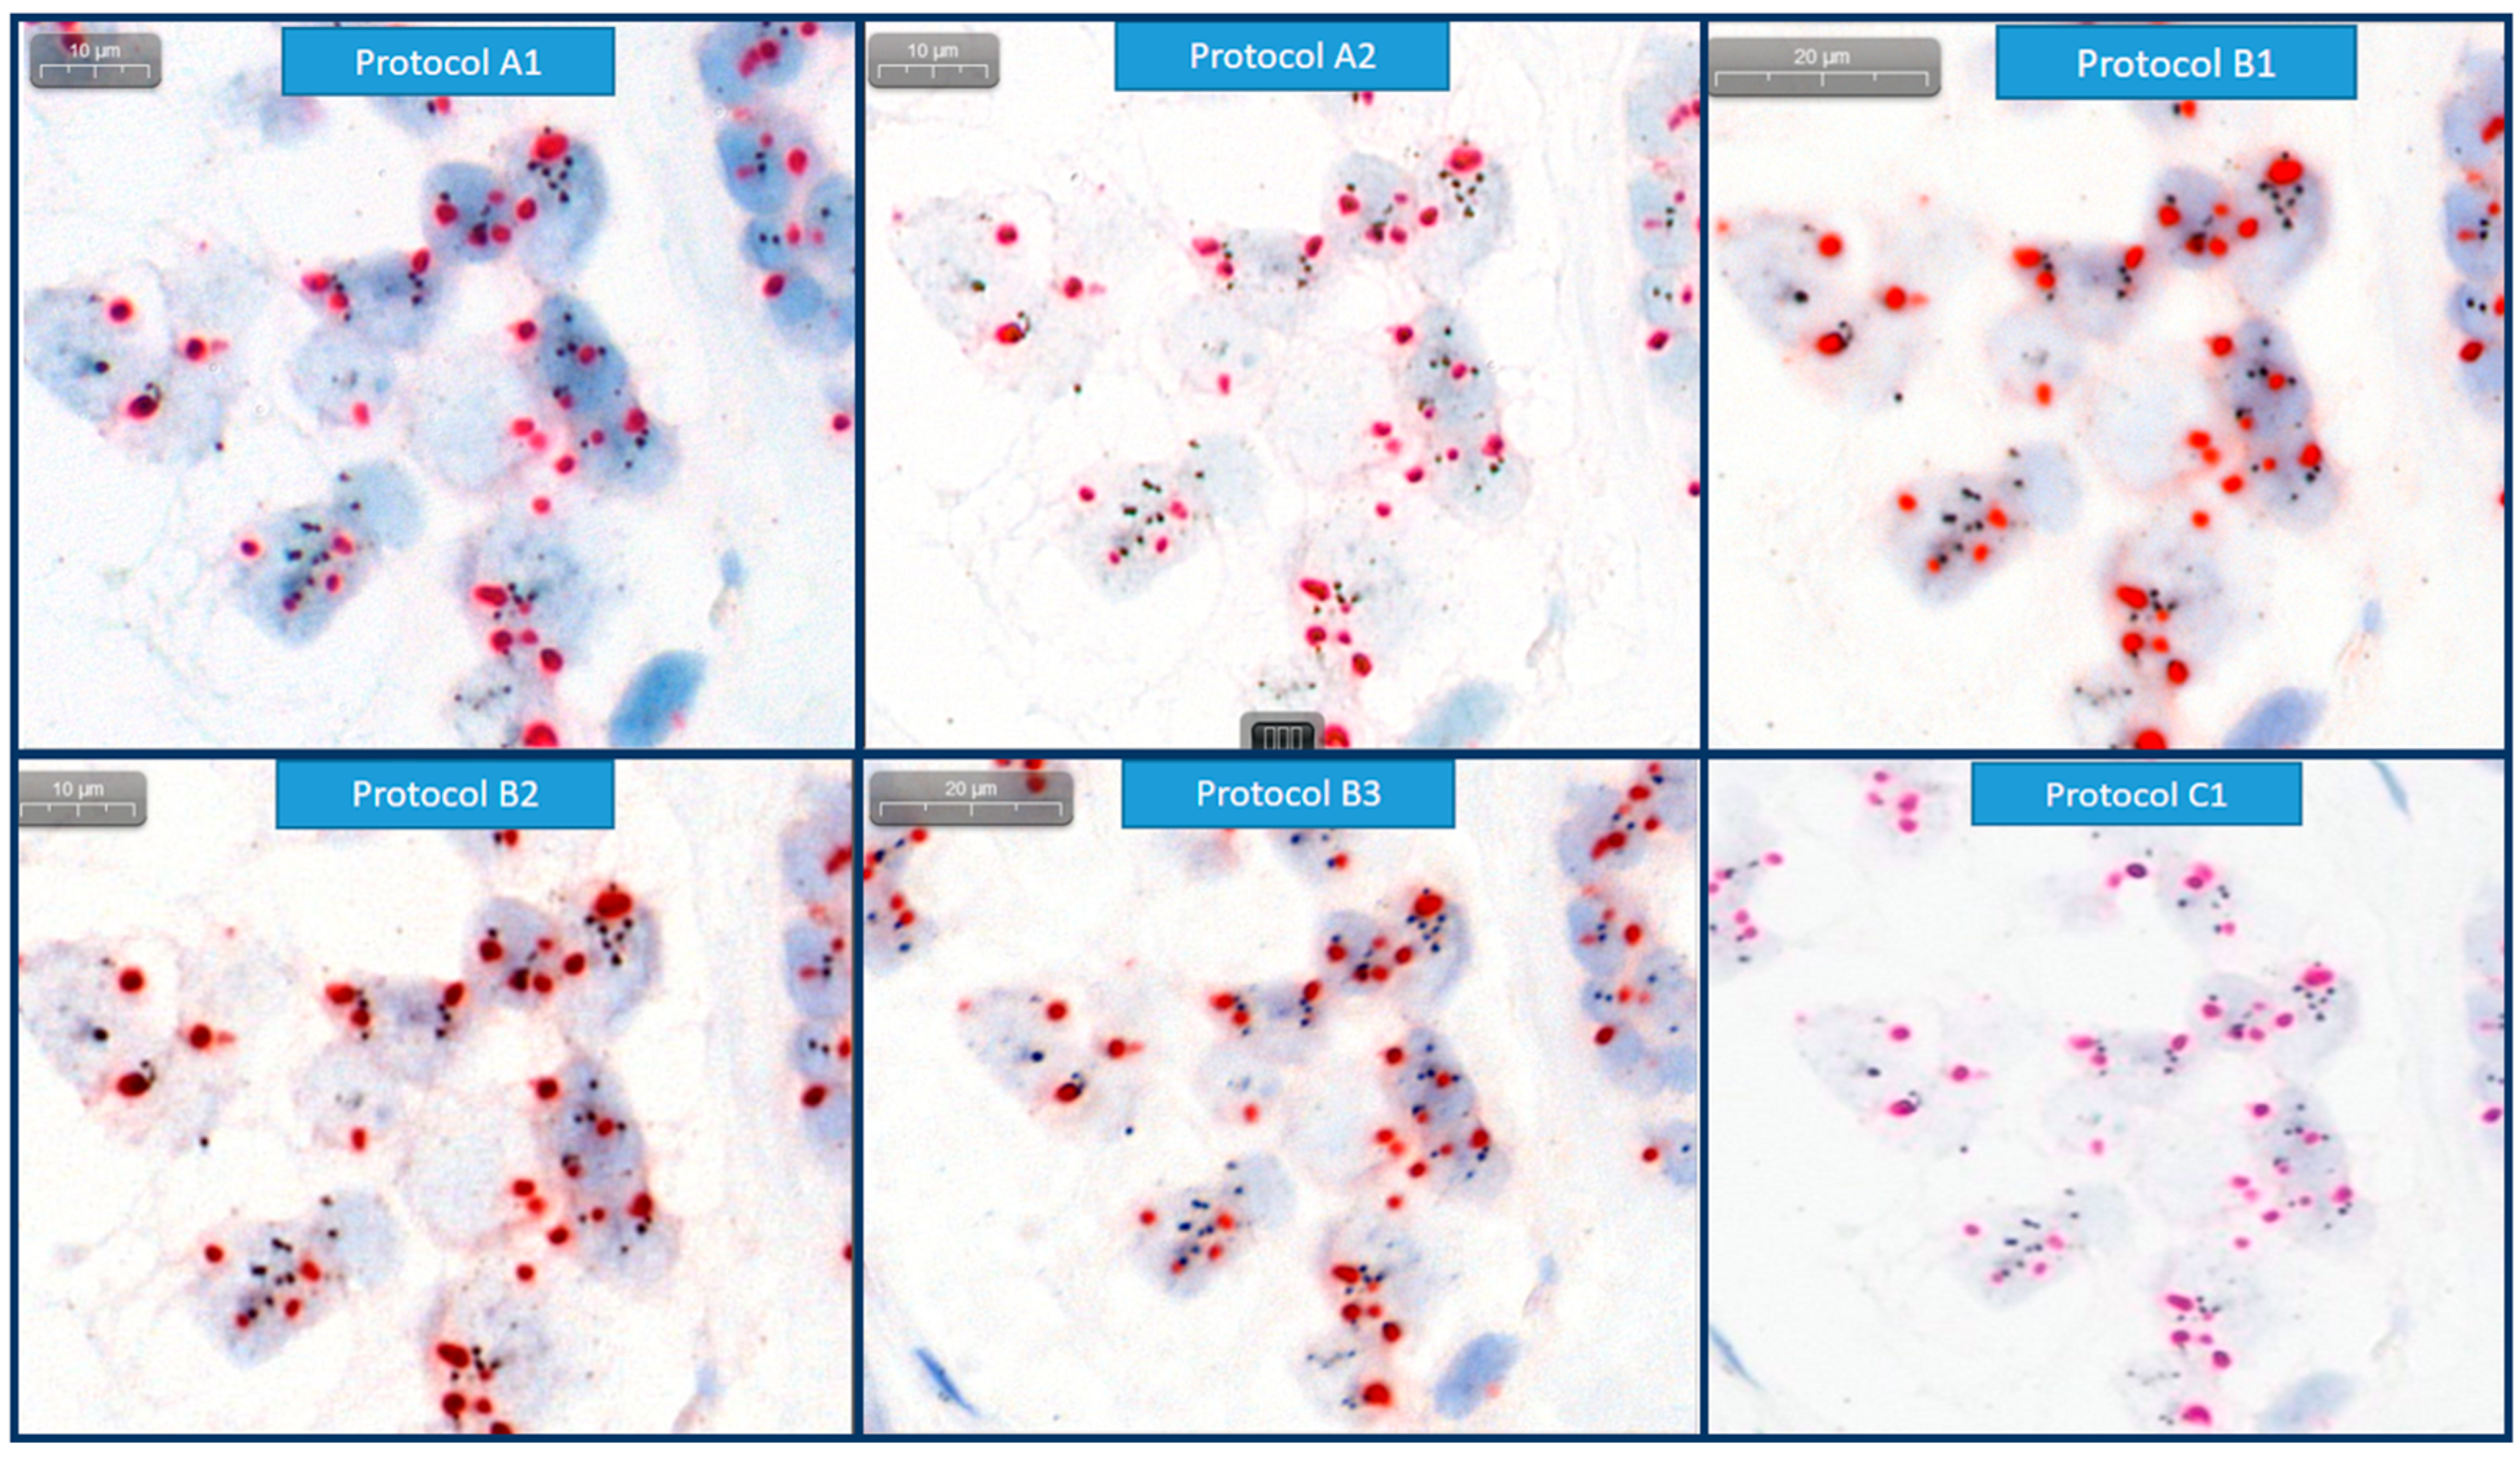
3.2. Image Quality
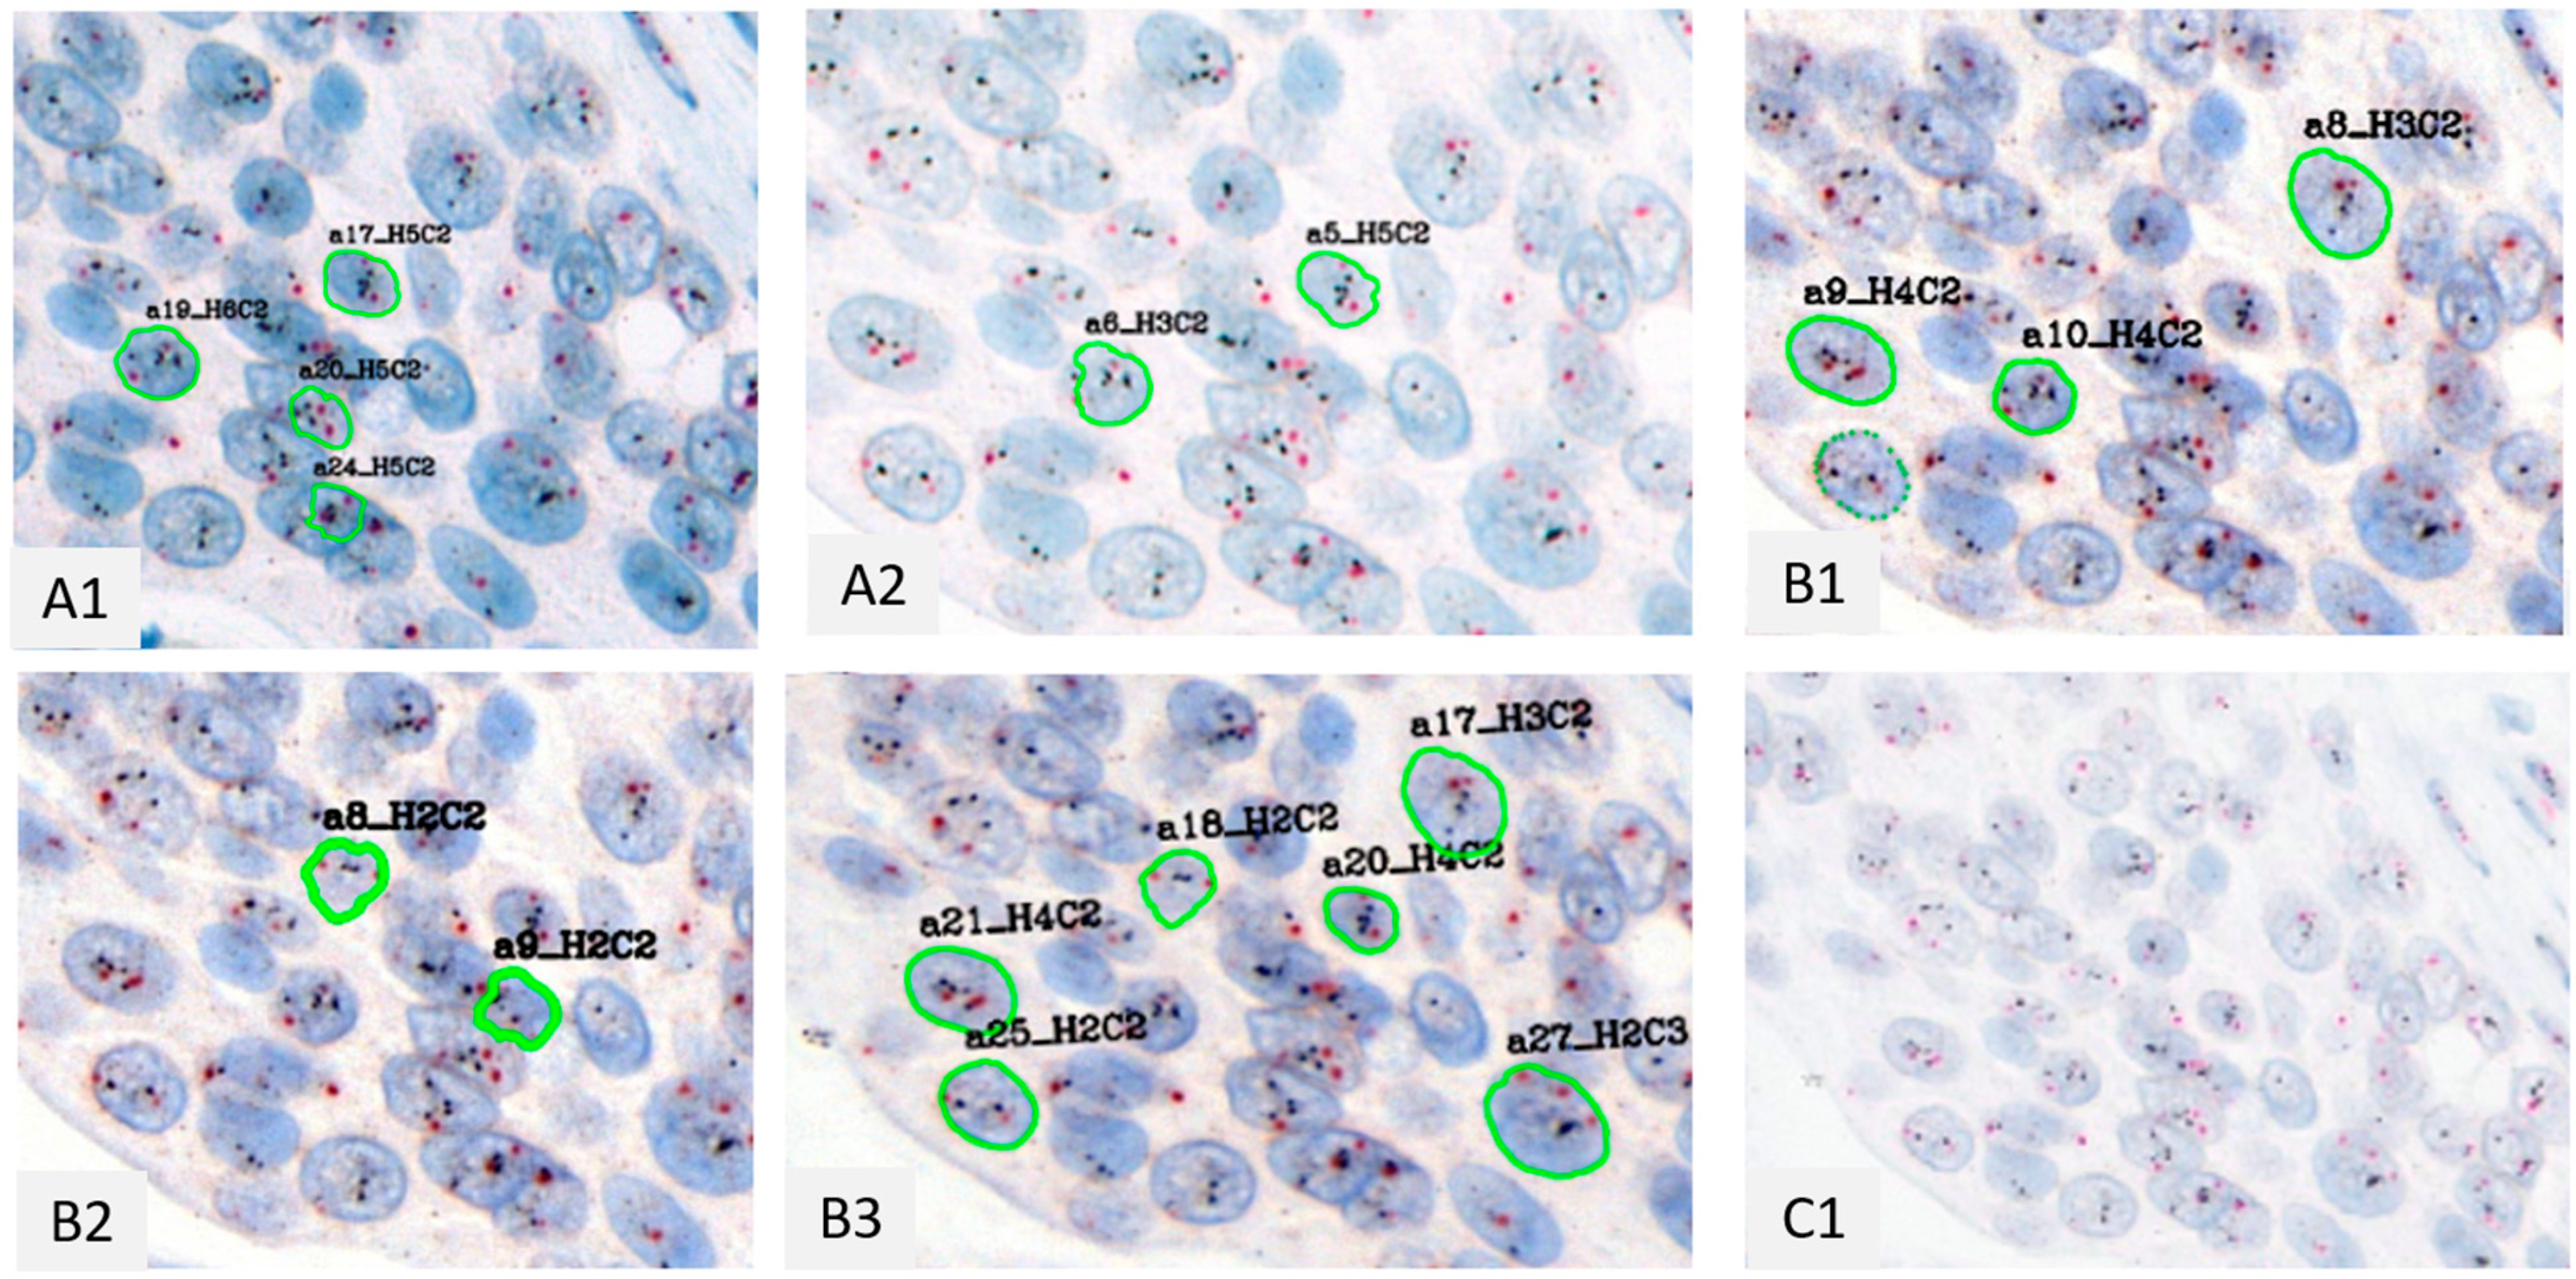
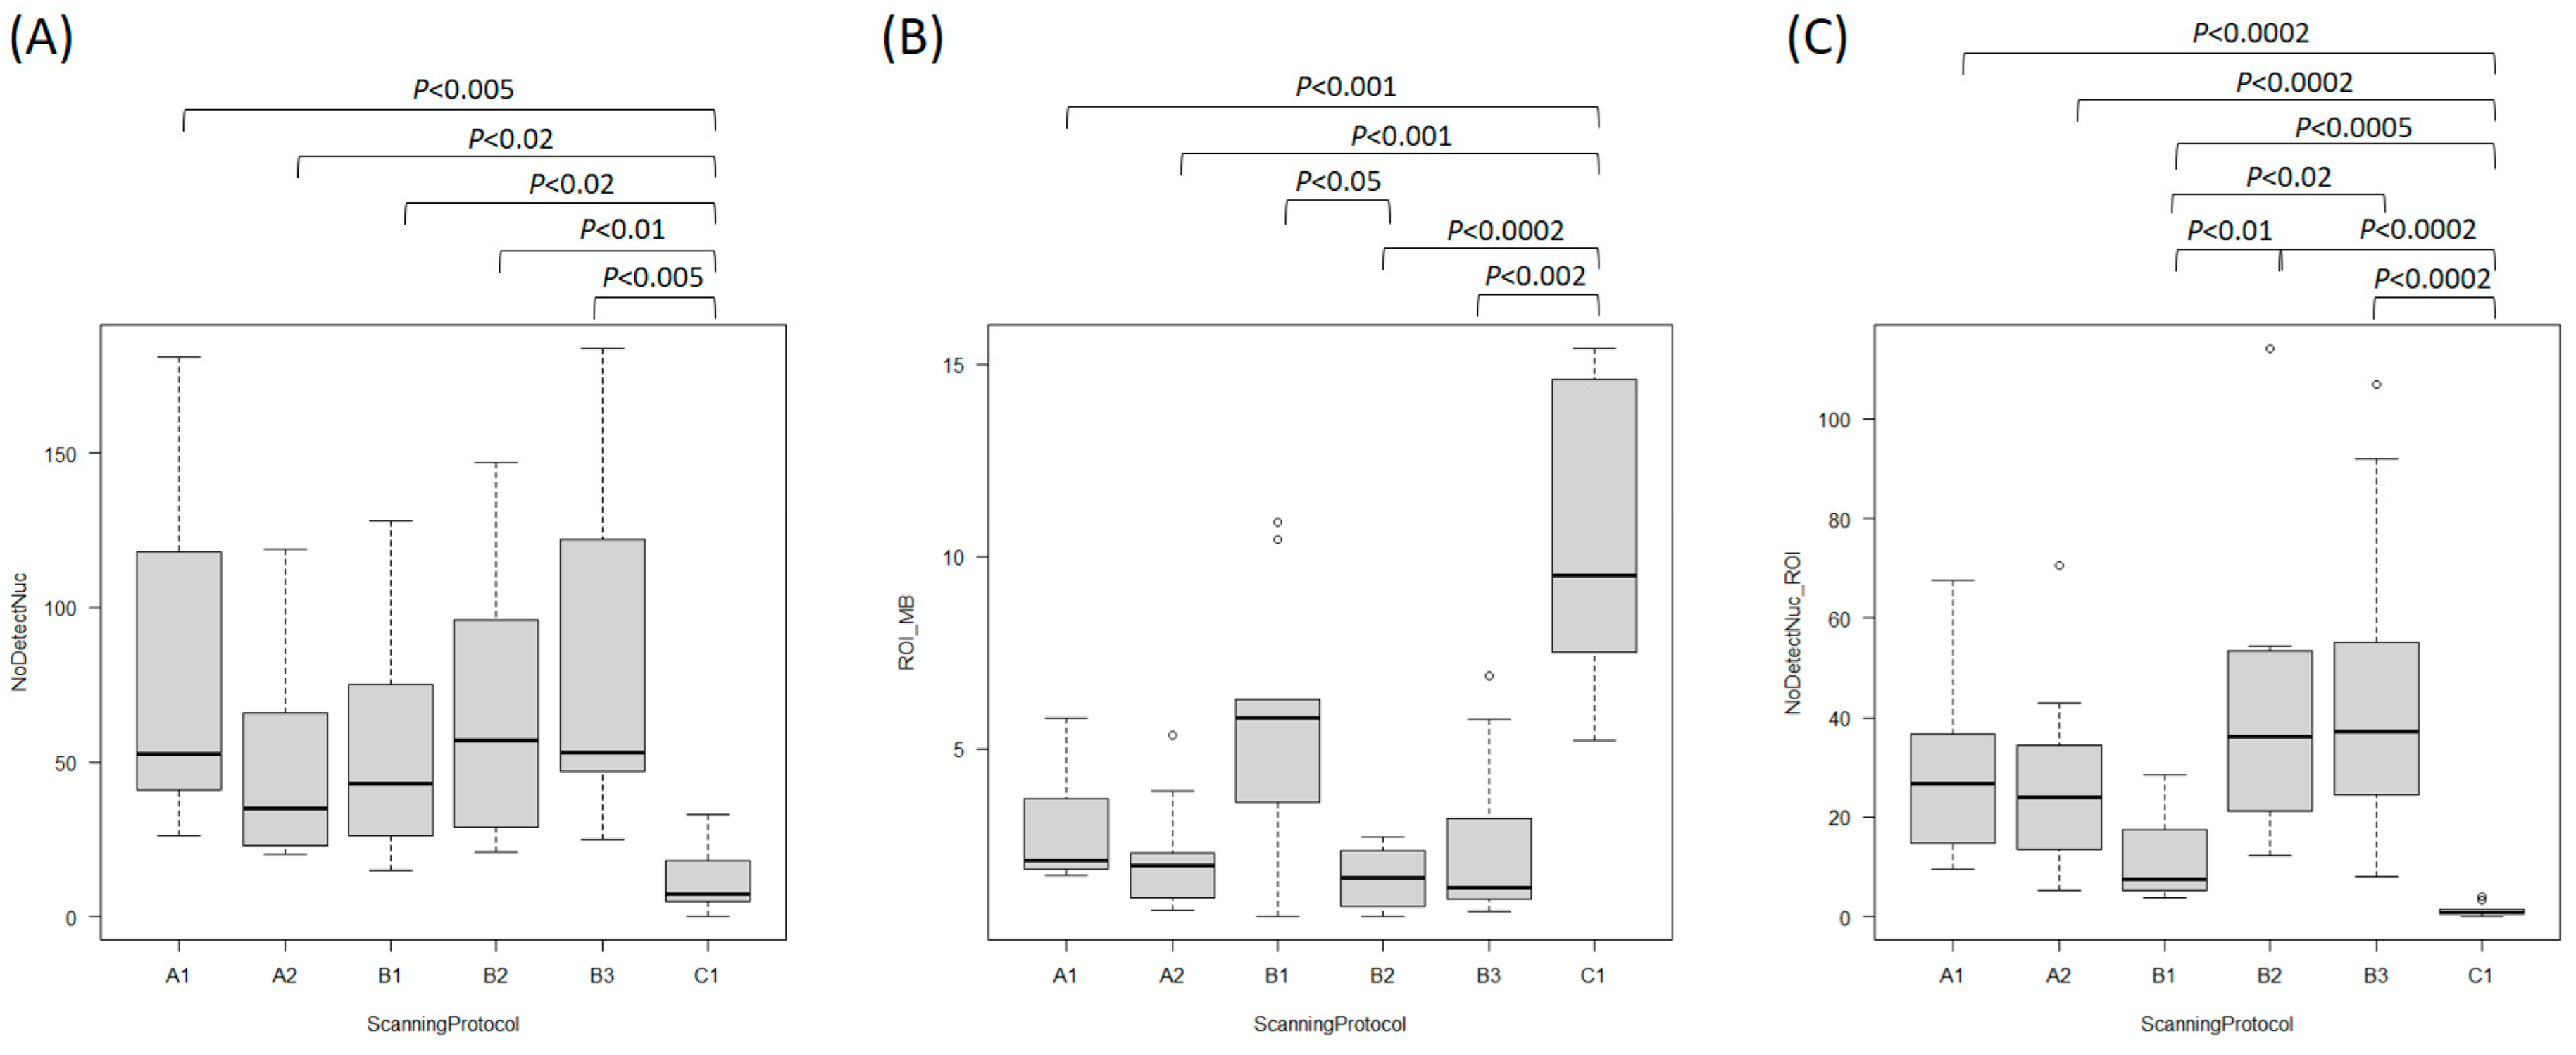
3.3. Number of Detected Nuclei by Automated Image Analysis in Application
3.4. HER2 Status and ASCO/CAP ISH Group
4. Discussion
5. Conclusions
Author Contributions
Funding
Institutional Review Board Statement
Informed Consent Statement
Data Availability Statement
Acknowledgments
Conflicts of Interest
Abbreviations
| AI | Artificial Intelligence |
| ISH | In situ hybridization |
| IHC | Immunohistochemistry |
| ASCO/CAP | American Society of Clinical Oncology/College of American Pathologist |
| BF | Bright-Field |
| HER-2 | Human Epidermal Growth Factor Receptor 2 |
| CEP17 | Chromosome Enumeration Probe 17 |
| ROI | Region of Interest |
| WSI | Whole slide image |
| SVM | Support vector machine |
| CNN | Convolutional neural network |
References
- Yarden, Y.; Sliwkowski, M.X. Untangling the ErbB signalling network. Nat. Rev. Mol. Cell Biol. 2001, 2, 127–137. [Google Scholar] [CrossRef] [PubMed]
- Rakha, E.A.; WHO Classification of Tumours Editorial Board. Invasive breast carcinoma: General overview. In Breast Tumours WHO Classification of Tumours, 5th ed.; World Health Organization: Lyon, France, 2019; Volume 5, pp. 82–101. [Google Scholar]
- Yoder, A.; Inge, L.J.; Chen, C.C.; Marati, V.R.; Nguyen, T.K.; Zuiderveld, K.; Martin, J.; Gladden, S.; Miri, M.S.; Venugopal, R.; et al. Computer-aided scoring of erb-b2 receptor tyrosine kinase 2 (HER2) gene amplification status in breast cancer. J. Pathol. Inform. 2022, 13, 100116. [Google Scholar] [CrossRef]
- Lim, T.H.; Lim, A.S.; Tien, S.L.; Tan, P.H. Impact of the updated 2018 American Society of Clinical Oncology/College of American Pathologists (ASCO/CAP) guidelines on human epidermal growth factor receptor 2 (HER2) gene testing in invasive breast cancers: A single center study. Ann. Diagn. Pathol. 2022, 58, 151935. [Google Scholar] [CrossRef] [PubMed]
- Wolff, A.C.; Hammond, M.E.; Allison, K.H.; Harvey, B.E.; Mangu, P.B.; Bartlett, J.M.; Bilous, M.; Ellis, I.O.; Fitzgibbons, P.; Hanna, W.; et al. Human epidermal growth factor receptor 2 testing in breast cancer: American Society of Clinical Oncology/College of American Pathologists clinical practice guideline focused update. Arch. Pathol. Lab. Med. 2018, 142, 1364–1382. [Google Scholar] [CrossRef]
- Woo, J.W.; Lee, K.; Chung, Y.R.; Jang, M.H.; Ahn, S.; Park, S.Y. The updated 2018 American Society of Clinical Oncology/College of American Pathologists guideline on human epidermal growth factor receptor 2 interpretation in breast cancer: Comparison with previous guidelines and clinical significance of the proposed in situ hybridization groups. Hum. Pathol. 2020, 98, 10–21. [Google Scholar] [CrossRef] [PubMed]
- Wang, C.W.; Khalil, M.A.; Lin, Y.J.; Lee, Y.C.; Chao, T.K. Detection of ERBB2 and CEN17 signals in fluorescent in situ hybridization and dual in situ hybridization for guiding breast cancer HER2 target therapy. Artif. Intell. Med. 2023, 141, 102568. [Google Scholar] [CrossRef]
- Rathi, A.; Sahay, A.; Shet, T.M.; Patil, A.; Desai, S.B. Validation of Dual-Color Dual In-situ Hybridization for HER2/neu Gene in Breast Cancer. Arch. Pathol. Lab. Med. 2024, 148, 453–460. [Google Scholar] [CrossRef]
- Hossain, M.S.; Syeed, M.M.; Fatema, K.; Hossain, M.S.; Uddin, M.F. Singular nuclei segmentation for automatic her2 quantification using cish whole slide images. Sensors 2022, 22, 7361. [Google Scholar] [CrossRef]
- Gough, M.; Liu, C.; Srinivasan, B.; Wilkinson, L.; Dunk, L.; Yang, Y.; Schreiber, V.; Tuffaha, H.; Kryza, T.; Hooper, J.D.; et al. Improved concordance of challenging human epidermal growth factor receptor 2 dual in-situ hybridisation cases with the use of a digital image analysis algorithm in breast cancer. Histopathology 2023, 83, 647–656. [Google Scholar] [CrossRef]
- Salto-Tellez, M.; Maxwell, P.; Hamilton, P. Artificial intelligence-the third revolution in pathology. Histopathology 2019, 74, 372–376. [Google Scholar] [CrossRef]
- Furrer, D.; Jacob, S.; Caron, C.; Sanschagrin, F.; Provencher, L.; Diorio, C. Validation of a new classifier for the automated analysis of the human epidermal growth factor receptor 2 (HER2) gene amplification in breast cancer specimens. Diagn. Pathol. 2013, 8, 17. [Google Scholar] [CrossRef] [PubMed]
- Konsti, J.; Lundin, J.; Jumppanen, M.; Lundin, M.; Viitanen, A.; Isola, J. A public-domain image processing tool for automated quantification of fluorescence in situ hybridization signals. J. Clin. Pathol. 2007, 61, 278–282. [Google Scholar] [CrossRef]
- van der Logt, E.M.; Kuperus, D.A.; van Setten, J.W.; van den Heuvel, M.C.; Boers, J.E.; Schuuring, E.; Kibbelaar, R.E. Fully automated fluorescent in situ hybridization (FISH) staining and digital analysis of HER2 in breast cancer: A validation study. PLoS ONE 2015, 10, e0123201. [Google Scholar] [CrossRef]
- Iourov, I.Y.; Soloviev, I.V.; Vorsanova, S.G.; Monakhov, V.V.; Yurov, Y.B. An approach for quantitative assessment of fluorescence in situ hybridization (FISH) signals for applied human molecular cytogenetics. J. Histochem. Cytochem. 2005, 53, 401–408. [Google Scholar] [CrossRef] [PubMed]
- Grigoryan, A.M.; Dougherty, E.R.; Kononen, J.; Bubendorf, L.; Hostetter, G.; Kallioniemi, O. Morphological spot counting from stacked images for automated analysis of gene copy numbers by fluorescence in situ hybridization. J. Biomed. Opt. 2002, 7, 109–122. [Google Scholar] [CrossRef]
- Klijanienko, J.; Couturier, J.; Galut, M.; El-Naggar, A.K.; Maciorowski, Z.; Padoy, E.; Mosseri, V.; Vielh, P. Detection and quantitation by fluorescence in situ hybridization (FISH) and image analysis of HER-2/neu gene amplification in breast cancer fine-needle samples. Cancer Cytopathol. Interdiscip. Int. J. Am. Cancer Soc. 1999, 87, 312–318. [Google Scholar] [CrossRef]
- Wong, W.; Shakhawat, H.; Hanna, M.; Inoue, T.; Stueben, B.; Ibrahim, K.; Teplov, A.; Edelweiss, M.; Brogi, E.; Hameed, M. A Feasibility Study in The Automated Quantification of HER2 Gene Amplification in Breast Cancer Using Chromogenic In-situ Hybridization Whole Slide Images. Lab. Investig. 2020, 100 (Suppl. 1), 286. [Google Scholar] [CrossRef]
- Hossain, M.S.; Hanna, M.G.; Uraoka, N.; Nakamura, T.; Edelweiss, M.; Brogi, E.; Hameed, M.R.; Yamaguchi, M.; Ross, D.S.; Yagi, Y. Automatic quantification of HER2 gene amplification in invasive breast cancer from chromogenic in situ hybridization whole slide images. J. Med. Imaging 2019, 6, 047501. [Google Scholar] [CrossRef]
- College of American Pathologists. Algorithms. 2022. Available online: https://www.cap.org/protocols-and-guidelines/cap-guidelines/current-cap-guidelines/recommendations-for-human-epidermal-growth-factor-2-testing-in-breast-cancer (accessed on 8 August 2022).
- Gunn, S.; Yeh, I.T.; Lytvak, I.; Tirtorahardjo, B.; Dzidic, N.; Zadeh, S.; Kim, J.; McCaskill, C.; Lim, L.; Gorre, M.; et al. Clinical array-based karyotyping of breast cancer with equivocal HER2 status resolves gene copy number and reveals chromosome 17 complexity. BMC Cancer 2010, 10, 396. [Google Scholar] [CrossRef]
- Kanda, Y. Investigation of the freely available easy-to-use software ‘EZR’ for medical statistics. Bone Marrow Transpl. 2013, 48, 452–458. [Google Scholar] [CrossRef]
- Rakha, E.A.; Tan, P.H.; Quinn, C.; Provenzano, E.; Shaaban, A.M.; Deb, R.; Callagy, G.; Starczynski, J.; Lee, A.H.S.; O Ellis, I.; et al. UK recommendations for HER2 assessment in breast cancer: An update. J. Clin. Pathol. 2022, 76, 217–227. [Google Scholar] [CrossRef] [PubMed]
- Ohnishi, T.; Bakoglu, N.; Hanna, M.; Ntiamoah, P.; Edelweiss, M.; Brogi, E.; Hameed, M.; Ross, D.; Yagi, Y. AI-Integrated Automated CISH Analysis in Breast Invasive Carcinomas: Evaluation of HER2 Status and ASCO/CAP Group’s Classification & Investigation of Number of Nuclei for the Best Results. Lab. Investig. 2023, 103 (Suppl. 1), S1309–S1310. [Google Scholar]
- Lee, R.E.; McClintock, D.S.; Laver, N.M.; Yagi, Y. Evaluation and optimization for liquid-based preparation cytology in whole slide imaging. J. Pathol. Inform. 2011, 2, 46. [Google Scholar] [CrossRef] [PubMed]
- Theodosiou, Z.; Kasampalidis, I.N.; Karayannopoulou, G.; Kostopoulos, I.; Bobos, M.; Bevilacqua, G.; Aretini, P.; Starita, A.; Lyroudia, K.; Pitas, I. Evaluation of FISH image analysis system on assessing HER2 amplification in breast carcinoma cases. Breast 2008, 17, 80–84. [Google Scholar] [CrossRef]
- Raimondo, F.; Gavrielides, M.A.; Karayannopoulou, G.; Lyroudia, K.; Pitas, I.; Kostopoulos, I. Automated evaluation of Her-2/neu status in breast tissue from fluorescent in situ hybridization images. IEEE Trans. Image Process. 2005, 14, 1288–1299. [Google Scholar] [CrossRef] [PubMed]
- Stevens, R.; Almanaseer, I.; Gonzalez, M.; Caglar, D.; Knudson, R.A.; Ketterling, R.P.; Schrock, D.S.; Seemayer, T.A.; Bridge, J.A. Analysis of HER2 gene amplification using an automated fluorescence in situ hybridization signal enumeration system. J. Mol. Diagn. 2007, 9, 144–150. [Google Scholar] [CrossRef]
- Hanna, M.G.; Reuter, V.E.; Hameed, M.R.; Tan, L.K.; Chiang, S.; Sigel, C.; Hollmann, T.; Giri, D.; Samboy, J.; Moradel, C.; et al. Whole slide imaging equivalency and efficiency study: Experience at a large academic center. Mod. Pathol. 2019, 32, 916–928. [Google Scholar] [CrossRef]
- Menter, T.; Nicolet, S.; Baumhoer, D.; Tolnay, M.; Tzankov, A. Intraoperative frozen section consultation by remote whole-slide imaging analysis–validation and comparison to robotic remote microscopy. J. Clin. Pathol. 2019, 73, 350–352. [Google Scholar] [CrossRef]
- Buck, T.P.; Dilorio, R.; Havrilla, L.; O’Neill, D.G. Validation of a whole slide imaging system for primary diagnosis in surgical pathology: A community hospital experience. J. Pathol. Inform. 2014, 5, 43. [Google Scholar] [CrossRef]

| Case ID | Sample | Diagnosis | Primary vs. Met | AMP | IHC Score | FISH Ratio | HER2/Nucleus | CEP17/Nucleus | ISH Group |
|---|---|---|---|---|---|---|---|---|---|
| 1 | BX | IDC with lobular growth pattern | Primary | NA | 1+ to 2+ | 1.41 | 3.82 | 2.7 | 5 |
| 2 | BX | IDC involving dermis and Muscle | Met | NA | 2+ | 1.31 | 2.36 | 1.8 | 5 |
| 3 | EX | IDC with focal micropapillary features | Primary | NA | 1+ to 2+ | 1.14 | 2.62 | 2.3 | 5 |
| 4 | EX | ILC with focal pleomorphic features | Primary | NA | 1+ to 2+ | 1.48 | 4.11 | 2.8 | 4 |
| 5 | EX | IDC | Primary | NA | 2+ | 1.73 | 4.64 | 2.7 | 4 |
| 6 | EX | IDC | Primary | A | 3+ | n/a | n/a | n/a | 1 |
| 7 | BX | IDC | Primary | A | 2+ | 3.89 | 7.18 | 1.8 | 1 |
| 8 | EX | IDC | Primary | A | 2+ | 2.65 | 7.2 | 2.7 | 1 |
| 9 | EX | IDC with focal micropapillary features | Primary | A | 1+ to 2+ | 2.49 | 11.19 | 4.5 | 1 |
| 10 | BX | IDC, with focal micropapillary features | Primary | A | 3+ | 8.88 | 18.65 | 2.1 | 1 |
| Scanning Protocol | ||||||
|---|---|---|---|---|---|---|
| Features | A1 | A2 | B1 | B2 | B3 | C1 |
| Magnification of the objective lens | 40× | 40× | 40× | 20× | 20× | 40× |
| Numerical aperture | 0.95 | 1.2 * | 0.95 | 0.8 | 0.8 | Unknown |
| Resolution (µm/pixel) | 0.12 | 0.12 | 0.08 | 0.17 | 0.17 | 0.26 |
| Z-stack | None | None | None | None | Extended focus of 3 layers at 1.4 µm interval | None |
| Case ID | Tissue Areas (mm2) | Scanning Protocol | |||
|---|---|---|---|---|---|
| A1&2 | B1 | B2 | B3 | ||
| 1 | 140 | 65 | 106 | 34 | 229 |
| 7 | 280 | 145 | 175 | 42 | 703 |
| 4 | 473 | 204 | 272 | 54 | 863 |
| Case ID | Scanning Protocol | Manual FISH (Ground Truth) | Manual Dual BF ISH | |||||||||||||
|---|---|---|---|---|---|---|---|---|---|---|---|---|---|---|---|---|
| A1 | A2 | B1 | B2 | B3 | C1 | |||||||||||
| G | S | G | S | G | S | G | S | G | S | G | S | G | AMP | G | AMP | |
| 1 | 5 | N | 5 | N | 5 | N | 5 | N | 5 | N | 5 | N | 5 | NA | 5 | NA |
| 2 | 5 | N | 5 | N | 5 | N | 5 | N | 5 | N | n/a | n/a | 5 | NA | 5 | NA |
| 3 | 5 | N | 5 | N | 5 | N | 5 | N | 5 | N | n/a | n/a | 5 | NA | 5 | NA |
| 4 | 4 | N | 4 | N | 5 | N | 5 | N | 4 | N | 5 | N | 4 | NA | 5 | NA |
| 5 | 4 | N | 4 | N | 4 | N | 4 | N | 4 | N | n/a | n/a | 4 | NA | 4 | NA |
| 6 | 1 | P | 1 | P | 1 | P | 1 | P | 1 | P | n/a | n/a | 1 | A | 1 | A |
| 7 | 1 | P | 1 | P | 1 | P | 1 | P | 1 | P | n/a | n/a | 1 | A | 1 | A |
| 8 | 1 | P | 1 | P | 1 | P | 1 | P | 1 | P | 5 | N | 1 | A | 1 | A |
| 9 | 1 | P | 1 | P | 1 | P | 1 | P | 1 | P | 5 | N | 1 | A | 1 | A |
| 10 | 1 | P | 1 | P | 1 | P | 1 | P | 1 | P | n/a | n/a | 1 | A | 1 | A |
| Concordance with Manual FISH % | 100 | 100 | 100 | 100 | 90 | 100 | 90 | 100 | 100 | 100 | 10 | 20 | ||||
Disclaimer/Publisher’s Note: The statements, opinions and data contained in all publications are solely those of the individual author(s) and contributor(s) and not of MDPI and/or the editor(s). MDPI and/or the editor(s) disclaim responsibility for any injury to people or property resulting from any ideas, methods, instructions or products referred to in the content. |
© 2025 by the authors. Licensee MDPI, Basel, Switzerland. This article is an open access article distributed under the terms and conditions of the Creative Commons Attribution (CC BY) license (https://creativecommons.org/licenses/by/4.0/).
Share and Cite
Bakoglu Malinowski, N.; Ohnishi, T.; Cesmecioglu, E.; Ross, D.S.; Tsukamoto, T.; Yagi, Y. Optimization of Scanning Protocol for AI-Integrated Assessment of HER2 Dual Bright-Field In-Situ Hybridization Application in Breast Cancer. Bioengineering 2025, 12, 569. https://doi.org/10.3390/bioengineering12060569
Bakoglu Malinowski N, Ohnishi T, Cesmecioglu E, Ross DS, Tsukamoto T, Yagi Y. Optimization of Scanning Protocol for AI-Integrated Assessment of HER2 Dual Bright-Field In-Situ Hybridization Application in Breast Cancer. Bioengineering. 2025; 12(6):569. https://doi.org/10.3390/bioengineering12060569
Chicago/Turabian StyleBakoglu Malinowski, Nilay, Takashi Ohnishi, Emine Cesmecioglu, Dara S. Ross, Tetsuya Tsukamoto, and Yukako Yagi. 2025. "Optimization of Scanning Protocol for AI-Integrated Assessment of HER2 Dual Bright-Field In-Situ Hybridization Application in Breast Cancer" Bioengineering 12, no. 6: 569. https://doi.org/10.3390/bioengineering12060569
APA StyleBakoglu Malinowski, N., Ohnishi, T., Cesmecioglu, E., Ross, D. S., Tsukamoto, T., & Yagi, Y. (2025). Optimization of Scanning Protocol for AI-Integrated Assessment of HER2 Dual Bright-Field In-Situ Hybridization Application in Breast Cancer. Bioengineering, 12(6), 569. https://doi.org/10.3390/bioengineering12060569