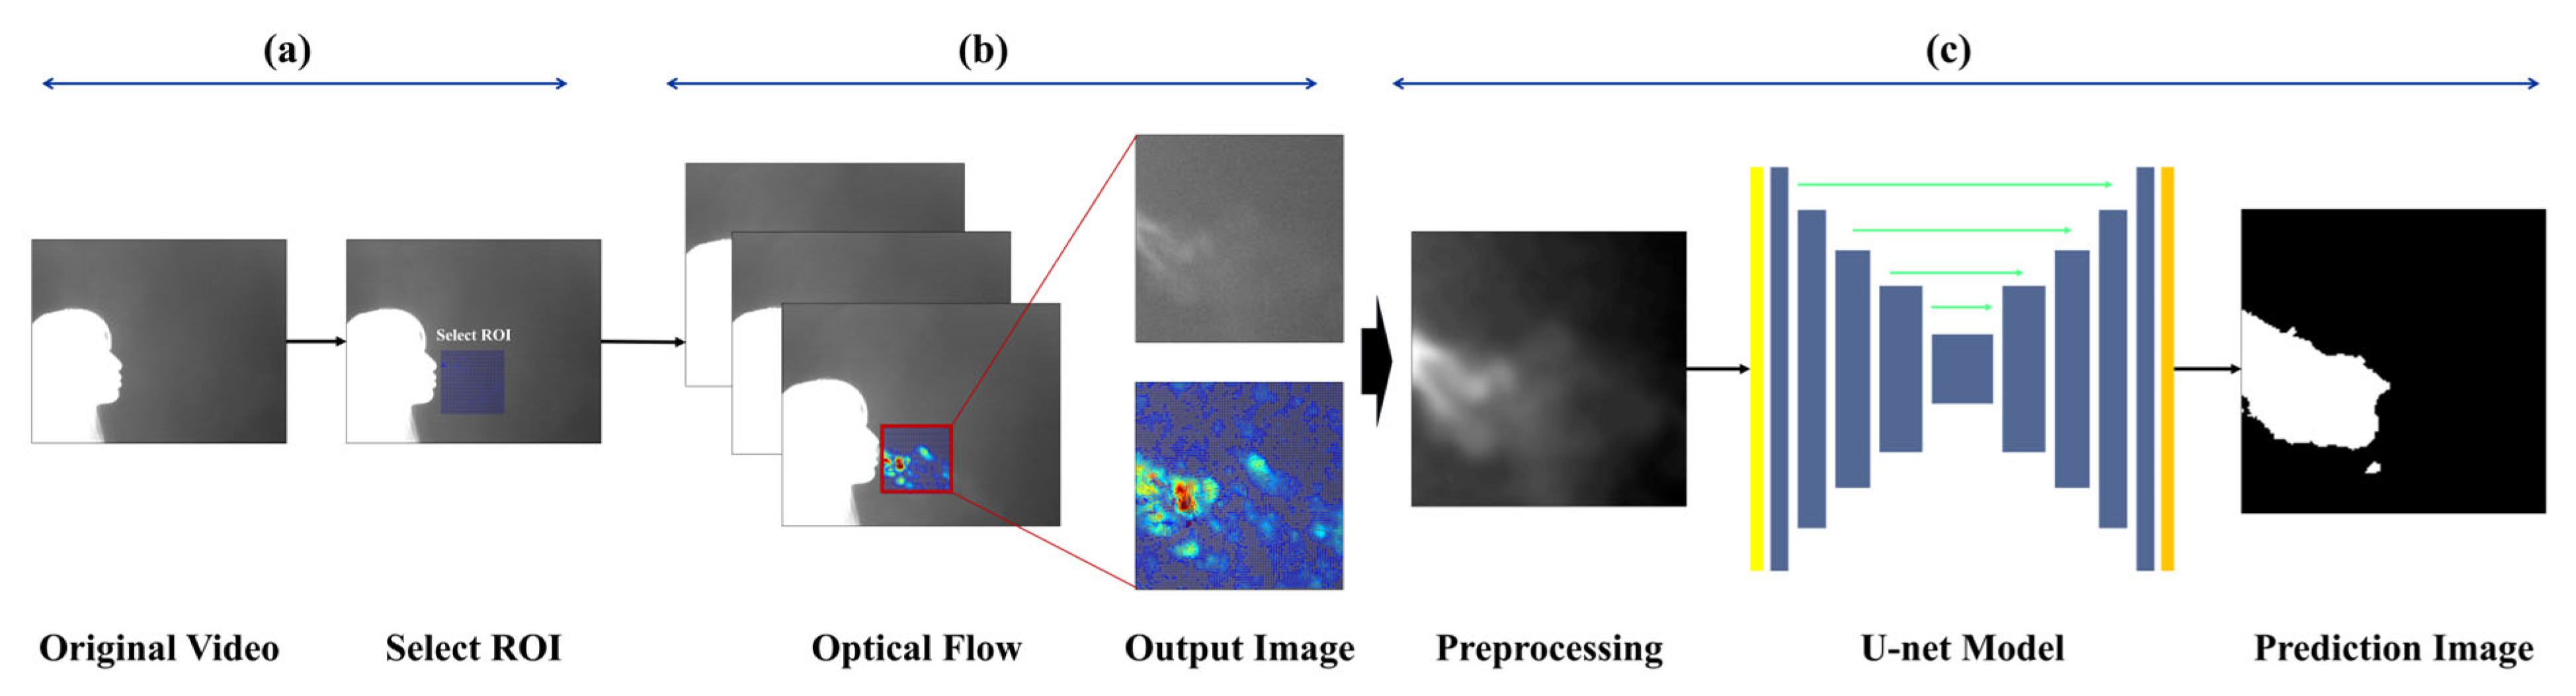
The goal of image-based expiration/inspiration segmentation and expiration segmentation is to estimate lung volume and describe pulmonary function. The proposed method helps visually identify the characteristics of expiration, making it possible to estimate individual breathing patterns and respiratory volume. Unlike traditional methods that only separate expiration and inspiration using the chest or nose areas, this approach captures actual expiratory volume and reflects individual respiratory traits. The pipeline is as follows:
3.2. Data Collection
Each subject participated in a single experiment lasting approximately 5 to 10 min, during which thermal video data comprising about 1000 frames (approximately 1 min in duration) was recorded using a mid-wave infrared (MWIR) thermal camera (640 × 512 pixels @ 25 Hz).
Table 1 summarizes the camera specifications:
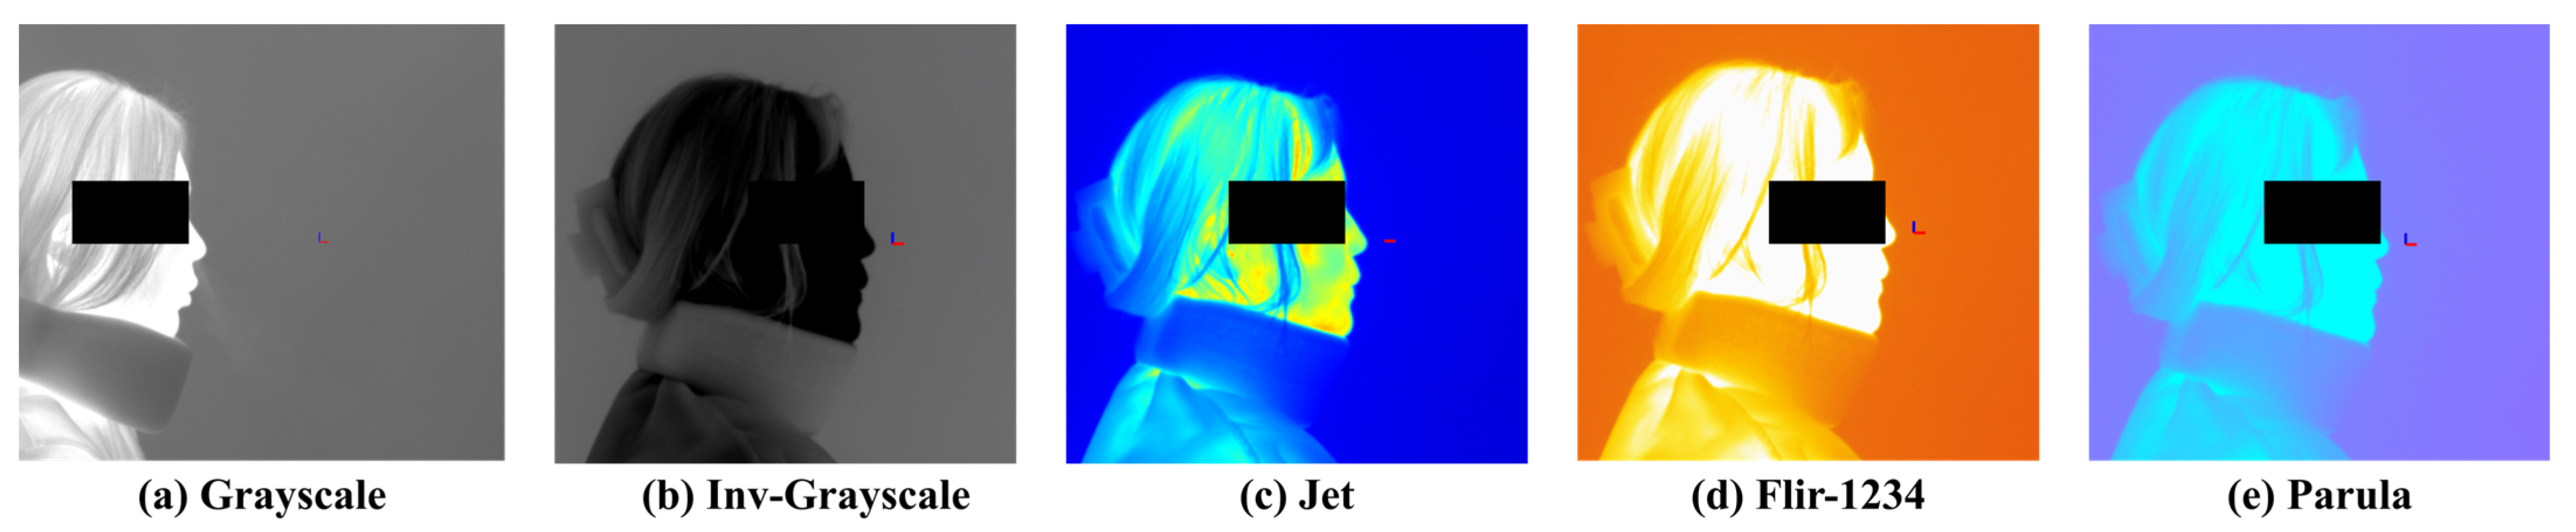
To maintain a certain level of normalization across recordings, the camera was positioned approximately 1 m distance from the participant, and captured a frontal view with the subject oriented laterally. A background screen was placed behind the participant. To minimize thermal noise, the indoor temperature was maintained at approximately 20−22 °C. The thermal camera was connected to a computer in real time, and the video was recorded by custom software developed by a collaborative research and development team. The recorded video was processed using the software’s built-in colormap adjustment tool (Dynamic Range Scaling Tool), which allowed pixel value modification. The software also enabled color correction and image preprocessing based on user settings.
Figure 2 presents examples of visualization results based on different colormap selections. The available colormaps include Grayscale, Inverted Grayscale, Jet, Parula, Rainbow, FLIR-1234, Fusion, Highlight, and Cool. Among them, Grayscale and Inverted Grayscale convert the images into monochrome representations, while the remaining colormaps render the images in color using RGB values. Color-based visualizations can be further adjusted using a threshold bar to enhance the visibility of objects.
3.3. Data Preprocessing
The respiratory data consist of a sequence of images recorded for each frame, and appropriate image preprocessing has a significant impact on model training outcomes. Respiratory images often lack clear boundaries, and the thermal distribution in the background can vary considerably depending on the ambient room temperature and the subject’s body temperature. As well, various noise caused by non-expiratory airflow makes it difficult to establish a reliable criterion to extract valid respiratory data. In this study, particular emphasis was placed on clearly identifying and visualizing the respiratory region within the input images to enable accurate quantification of respiration.
To collect respiration-focused data, a region of interest (ROI) was defined to limit the analysis area. The ROI was set based on regions where respiratory activity was clearly observed, and was individually assigned for each subject to account for physiological differences. The ROI was fixed at 160 × 160 pixels, and expiration and inspiration behaviors were tracked within this area. To track respiratory motion, the Horn-Schunck [
13,
45] optical flow algorithm used in a previous study was employed. This algorithm performs parallel computation of optical flow based on the flow field mapped within the ROI, and visualizes the gradients of the resulting vectors for further analysis.
This algorithm is based on the brightness constancy assumption and the smoothness constraint of the flow field. These assumptions imply that: (1) the brightness of a pixel remains constant over time, and (2) the motion of neighboring pixels is similar.
Equation (1) gives the equation derived from the brightness constancy assumption:
where
,
, and
represent the partial derivatives of image intensity with respect to the
x,
y, and time directions, respectively, while
and
denote the pixel velocities in the
x and
y directions.
Equation (2) gives the equation based on the similarity of neighboring pixels:
Equation (3) presents the final energy function of the algorithm:
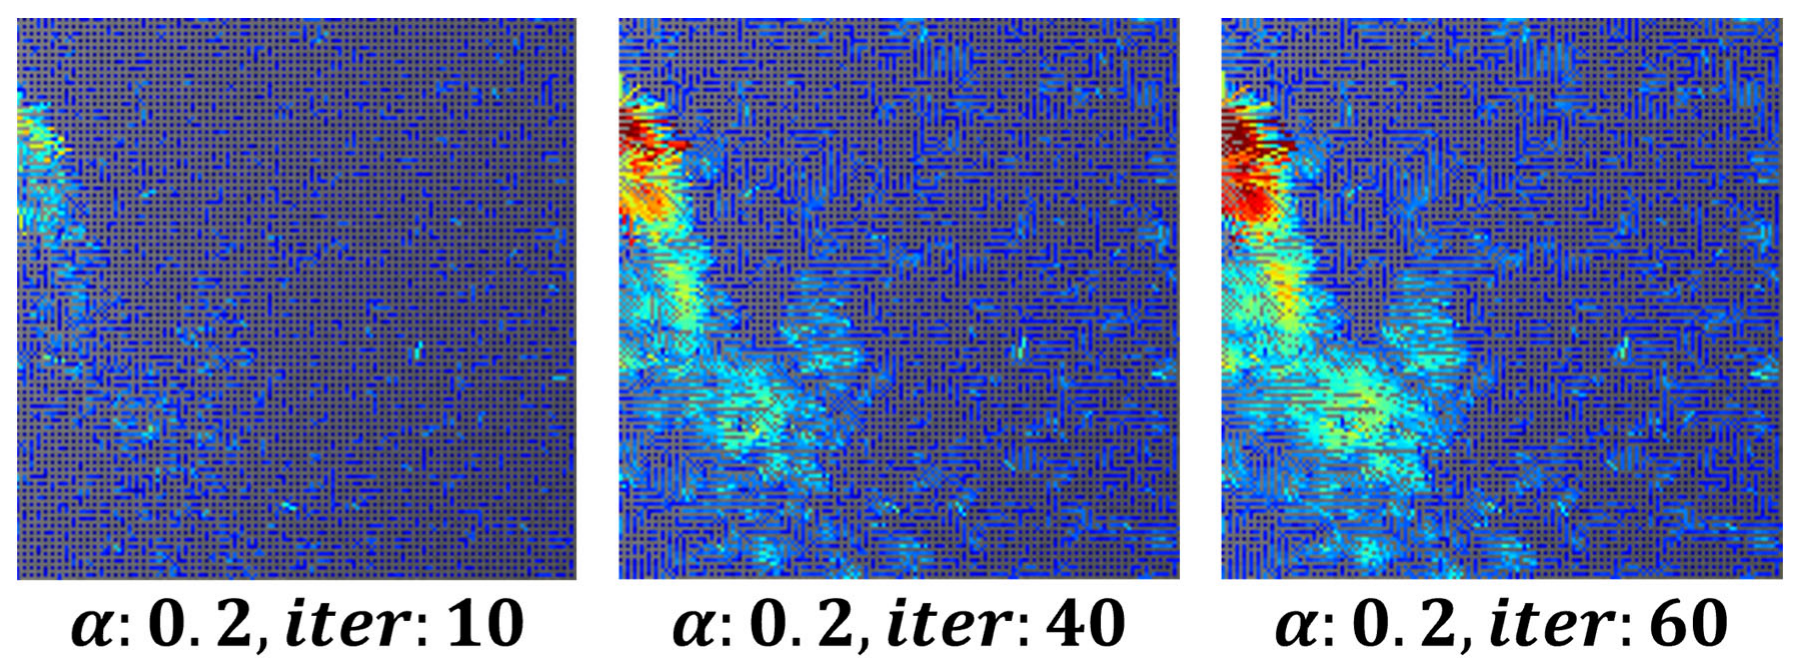
To remove minor fluctuations in the flow field and achieve stable visualization, the parameter was set to
0.3, 80 iterations, while the number of iterations for both
and
increased. This approach ensured the stability of respiration visualization using image derivatives in the x and y directions.
Figure 3 shows an example of a visualized image generated using the optical flow-based flow field method.
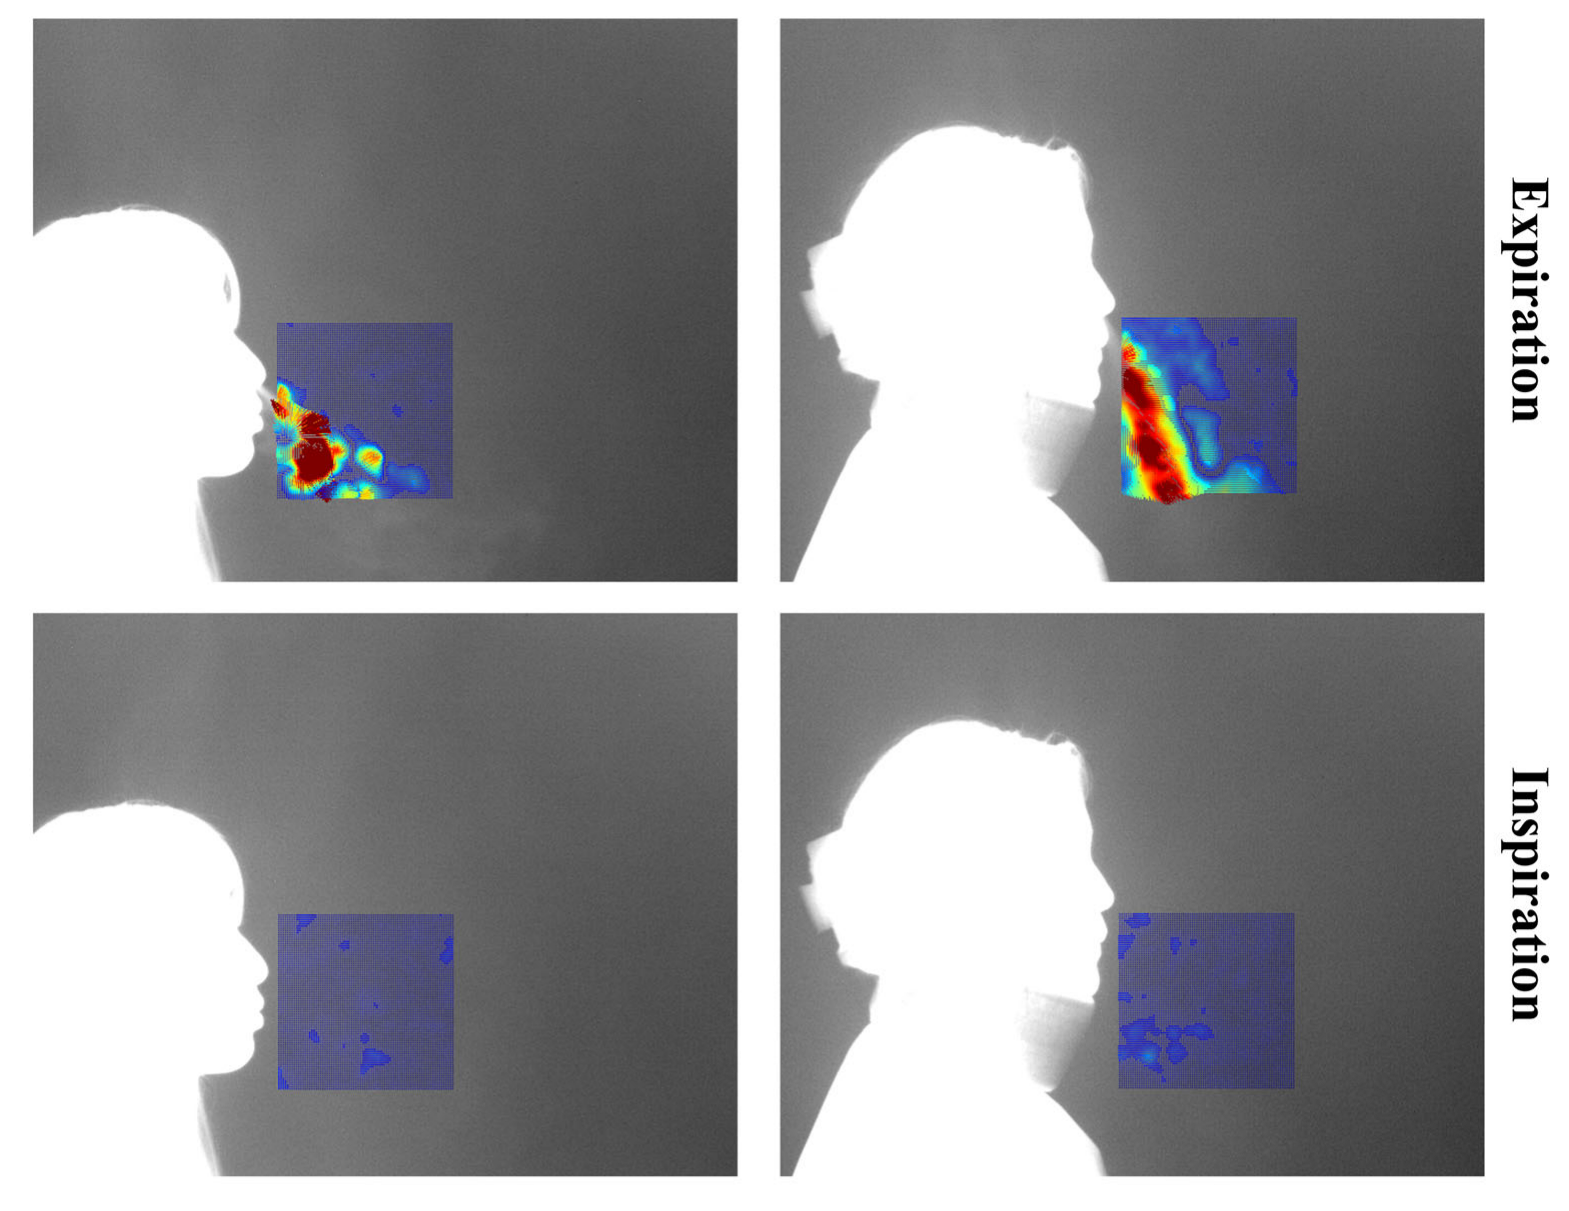
Each video consists of the first frame used to define the region of interest (ROI), followed by 999 subsequent frames for optical flow computation. These 999 frames visualize the respiratory patterns during inspiration and expiration over time. In this study, a threshold-based method was applied to distinguish between expiration and inspiration. However, classification based solely on vector flow fields can lead to errors in visually noisy environments. To address this, the proposed method excludes vectors with low directionality or indistinct flow, and determines expiration or inspiration based on the visualization of vectors with strong, consistent direction. The colors used in vector visualization are determined by the gradient magnitude of each vector: strong gradients are shown in red hues, while weak gradients appear in blue hues. Based on this, blue pixels below the threshold were removed to clarify the respiratory region. If the number of remaining (non-removed) pixels exceeded 3% of the total ROI pixels, the frame was classified as expiration; otherwise, it was classified as inspiration.
Figure 4 shows the flow field visualizations for inspiration and expiration:
Images classified as “expiration” within the ROI serve as the foundation to quantify and analyze expiratory volume [
13]. These images are labeled as ground truth through a four-step process.
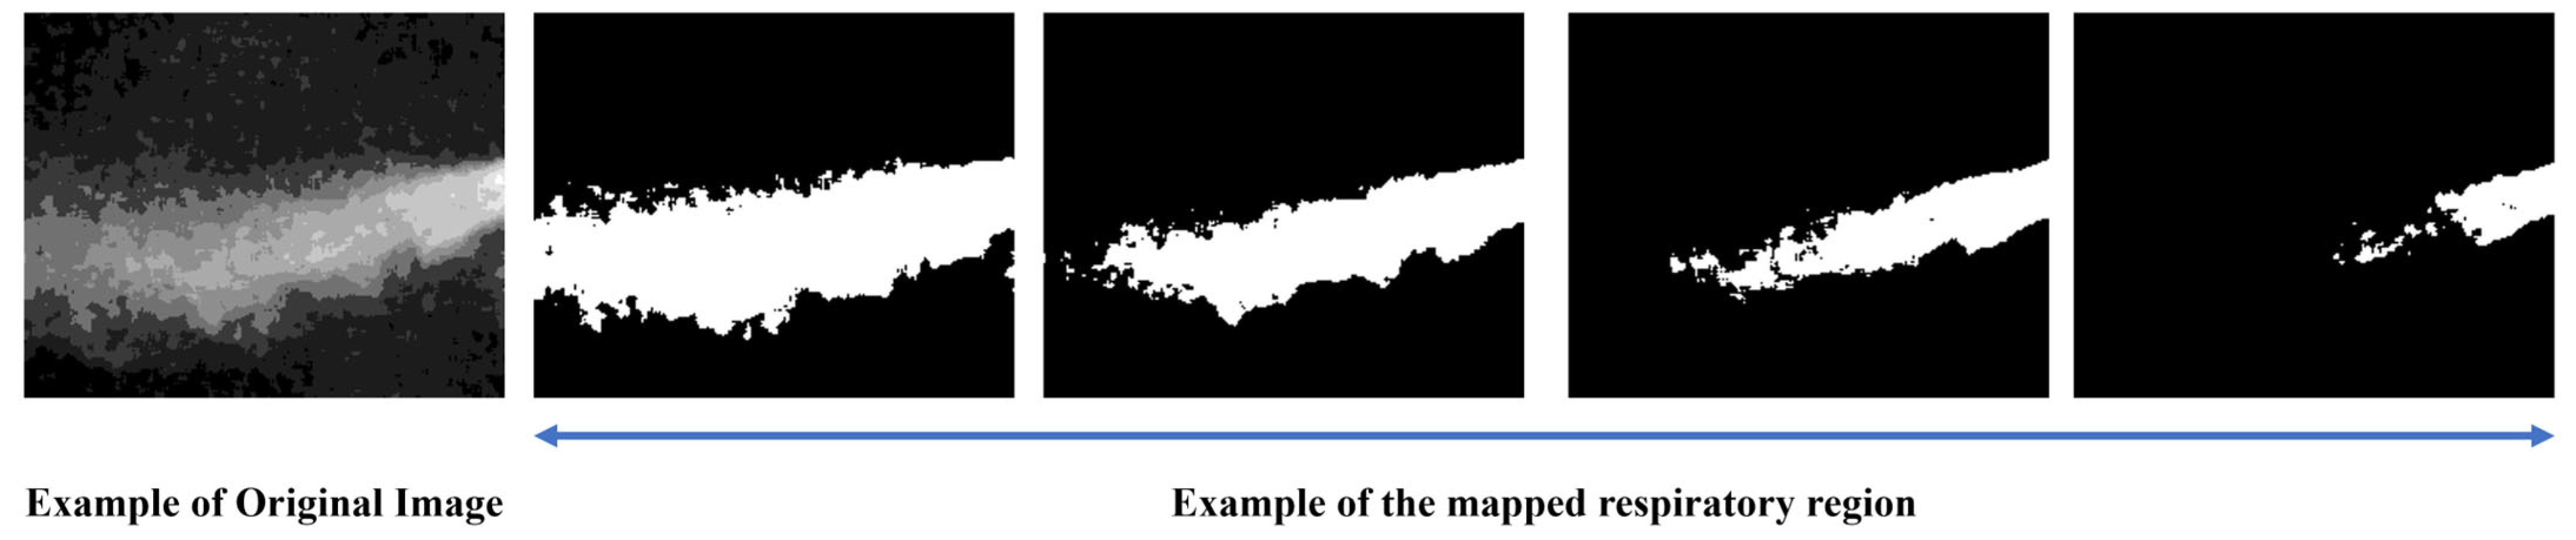
Respiration can be broadly divided into three spatial regions: the core expiratory region, the surrounding region, and the background region. However, these categories can also be further subdivided into more detailed segments.
Figure 5 visually illustrates the areas associated with respiration:
To generate ground truth labels, we conducted a set of experiments aimed at clearly defining the expiratory region for image preprocessing. The key considerations in the experiment were as follows:
Definition of the core respiratory region
Determination of the broader expiratory area
A method for non-subjective respiratory mapping
The collected expiration images included various respiratory patterns and noise from multiple subjects, and due to individual differences, such as temperature and airflow, certain respiratory regions could be either overemphasized or overlooked. To address this, several criteria were established to consistently identify the respiratory region.
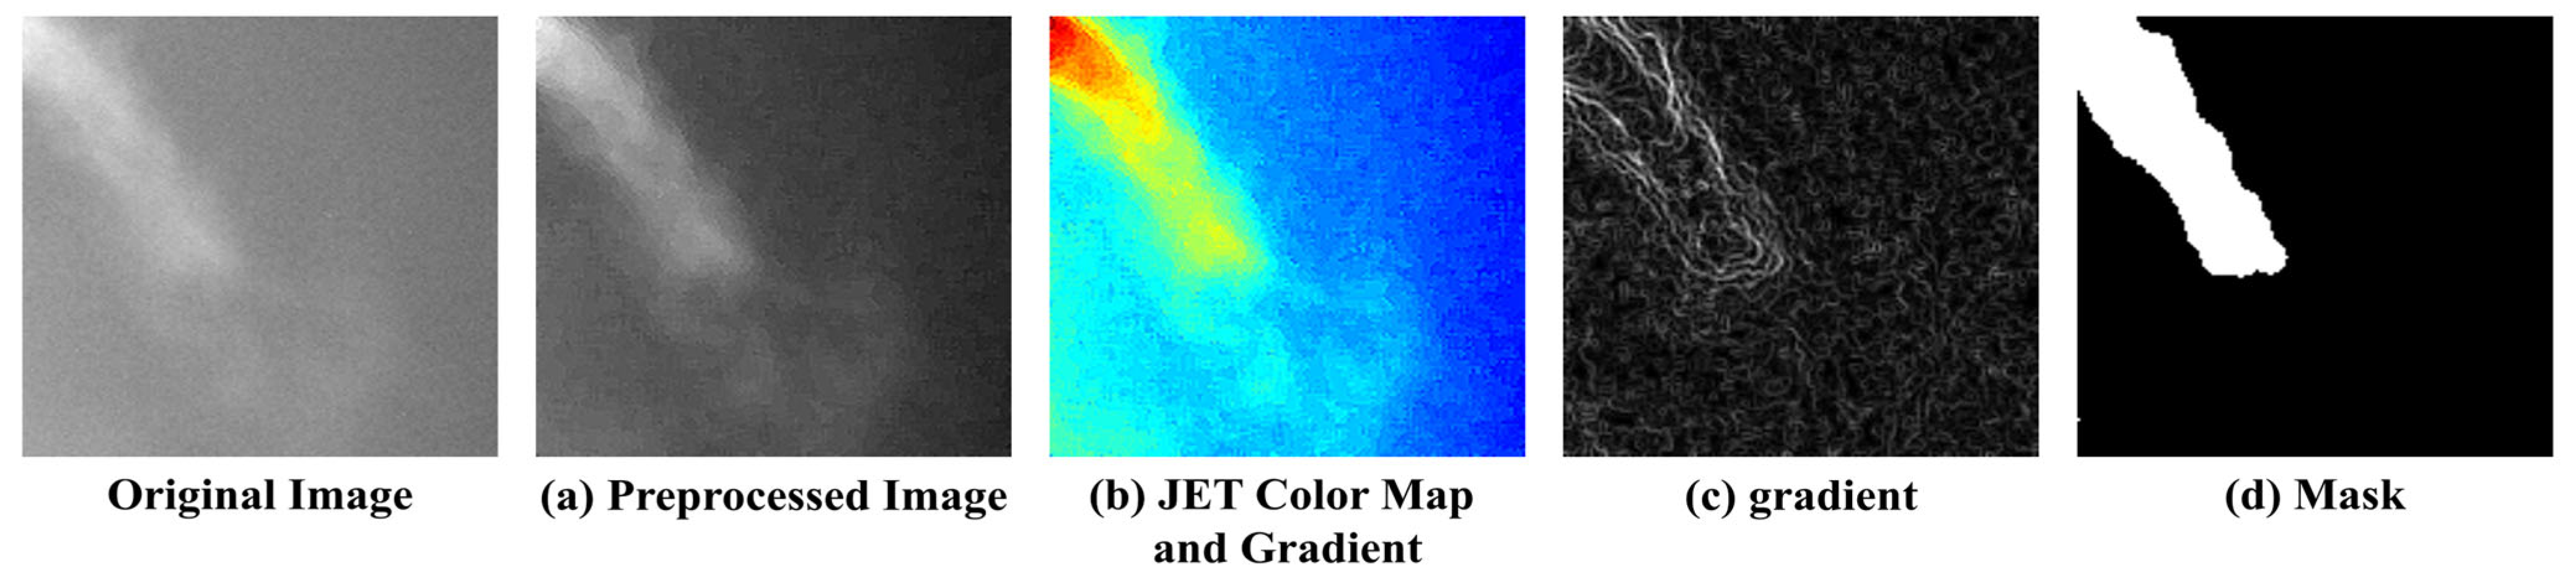
Figure 6 illustrates the process of mapping the respiratory region and generating binary masks based on these criteria. (a) To reduce noise, a 5 × 5 median filter was applied, and sharpening was performed to emphasize the boundaries of the respiratory region. Subsequently, normalization was applied to smooth out pixel intensity variations, reduce noise, and enhance the visibility of the respiratory area. (b) A JET colormap was applied to separate the respiratory region by assigning consistent color values based on image brightness. (c) A gradient overlay was then performed on the color-mapped image to determine a threshold at an appropriate point where the gradient gradually became more moderate. Regions within this threshold, where noticeable brightness differences occurred due to respiration, were defined as the respiratory region, while the areas where the gradient became more gradual were classified as surrounding airflow or background. (d) Finally, the confirmed respiratory region was mapped, and a 3 × 3 median filter was applied to remove remaining salt-and-pepper noise, completing the labeling process.
3.4. Segmentation for Quantitative Evaluation of Respiration
3.4.1. Selection of the Model
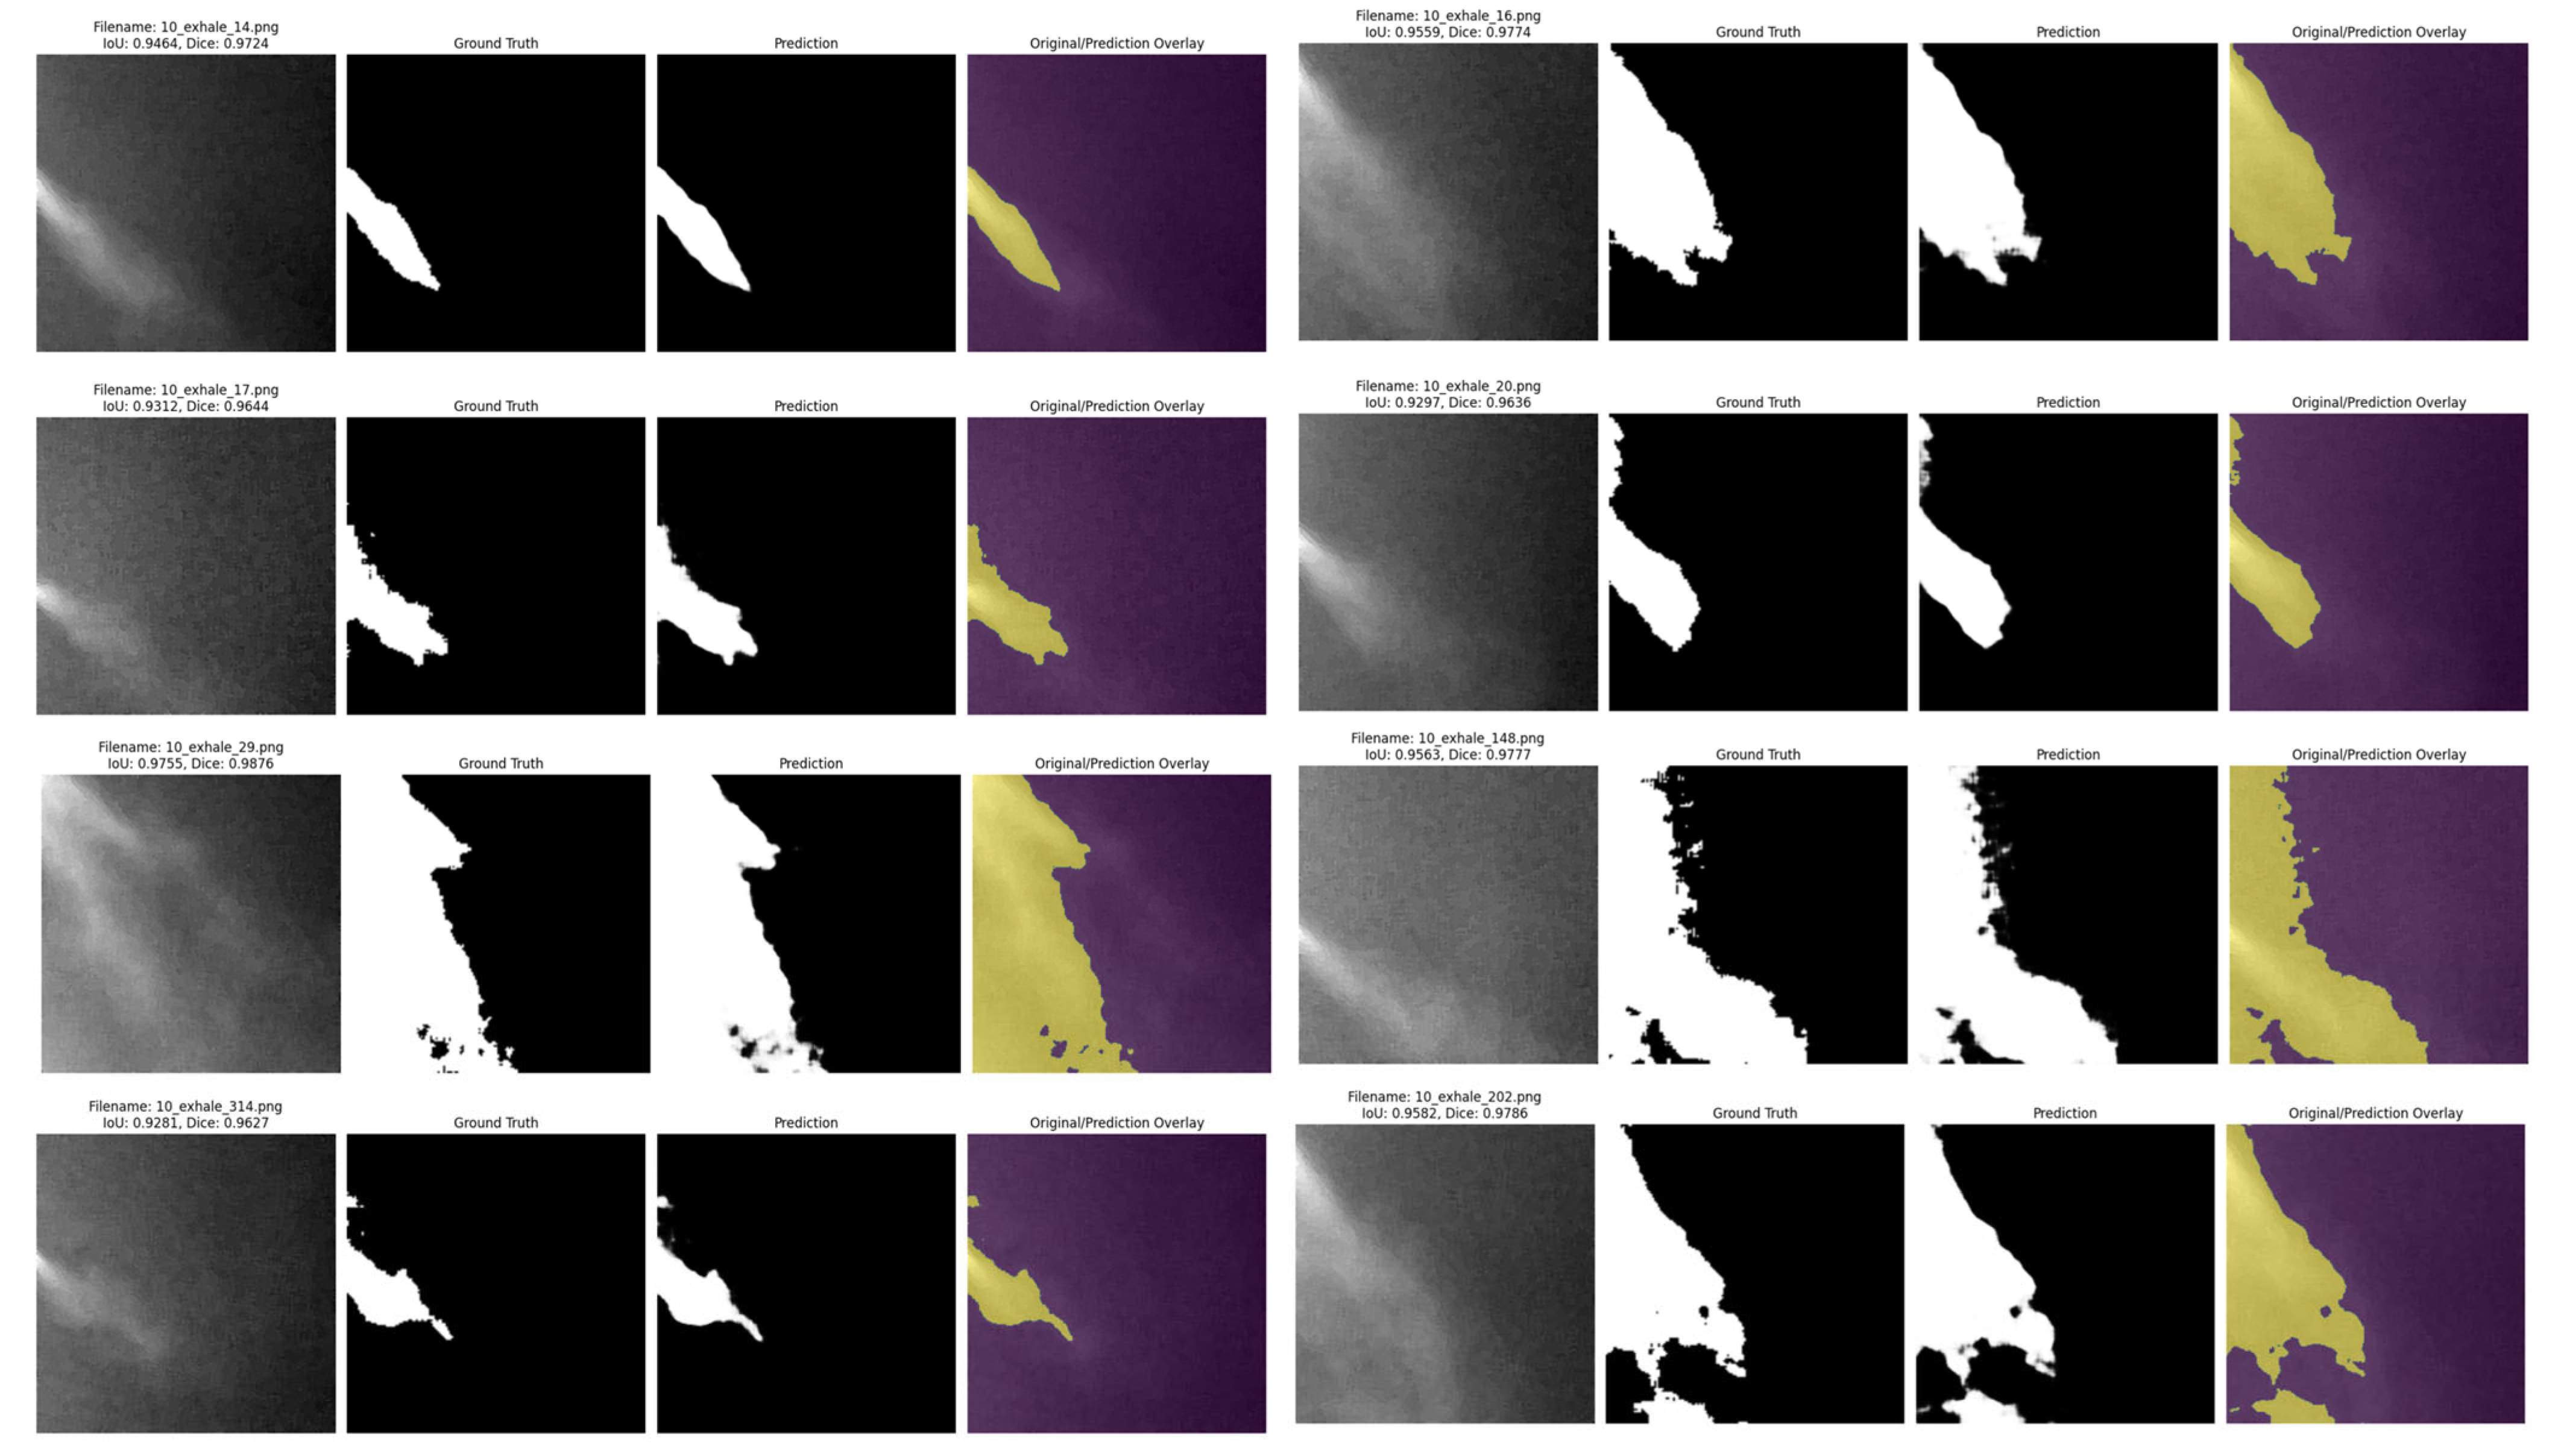
Quantitative evaluation of expiration is one of the key indicators to assess lung volume and pulmonary health status. In this study, to evaluate the expiratory volume during expiration, image sequences defined as “expiration” based on optical flow analysis were fed into an encoder, which performed binary classification between the respiratory region and the background. Segmentation of the respiratory region was conducted based on this classification. Since respiration occurs within a localized area even inside the ROI, training was performed using a U−Net-based segmentation algorithm, which is optimized to capture fine-grained and spatially limited regions.
U-Net is a network architecture that is proposed to minimize the loss of spatial information in medical image analysis. While conventional CNN-based models may lose local details due to their deep hierarchical structure, U-Net preserves global information by transferring encoder features directly to the decoder through skip connections.
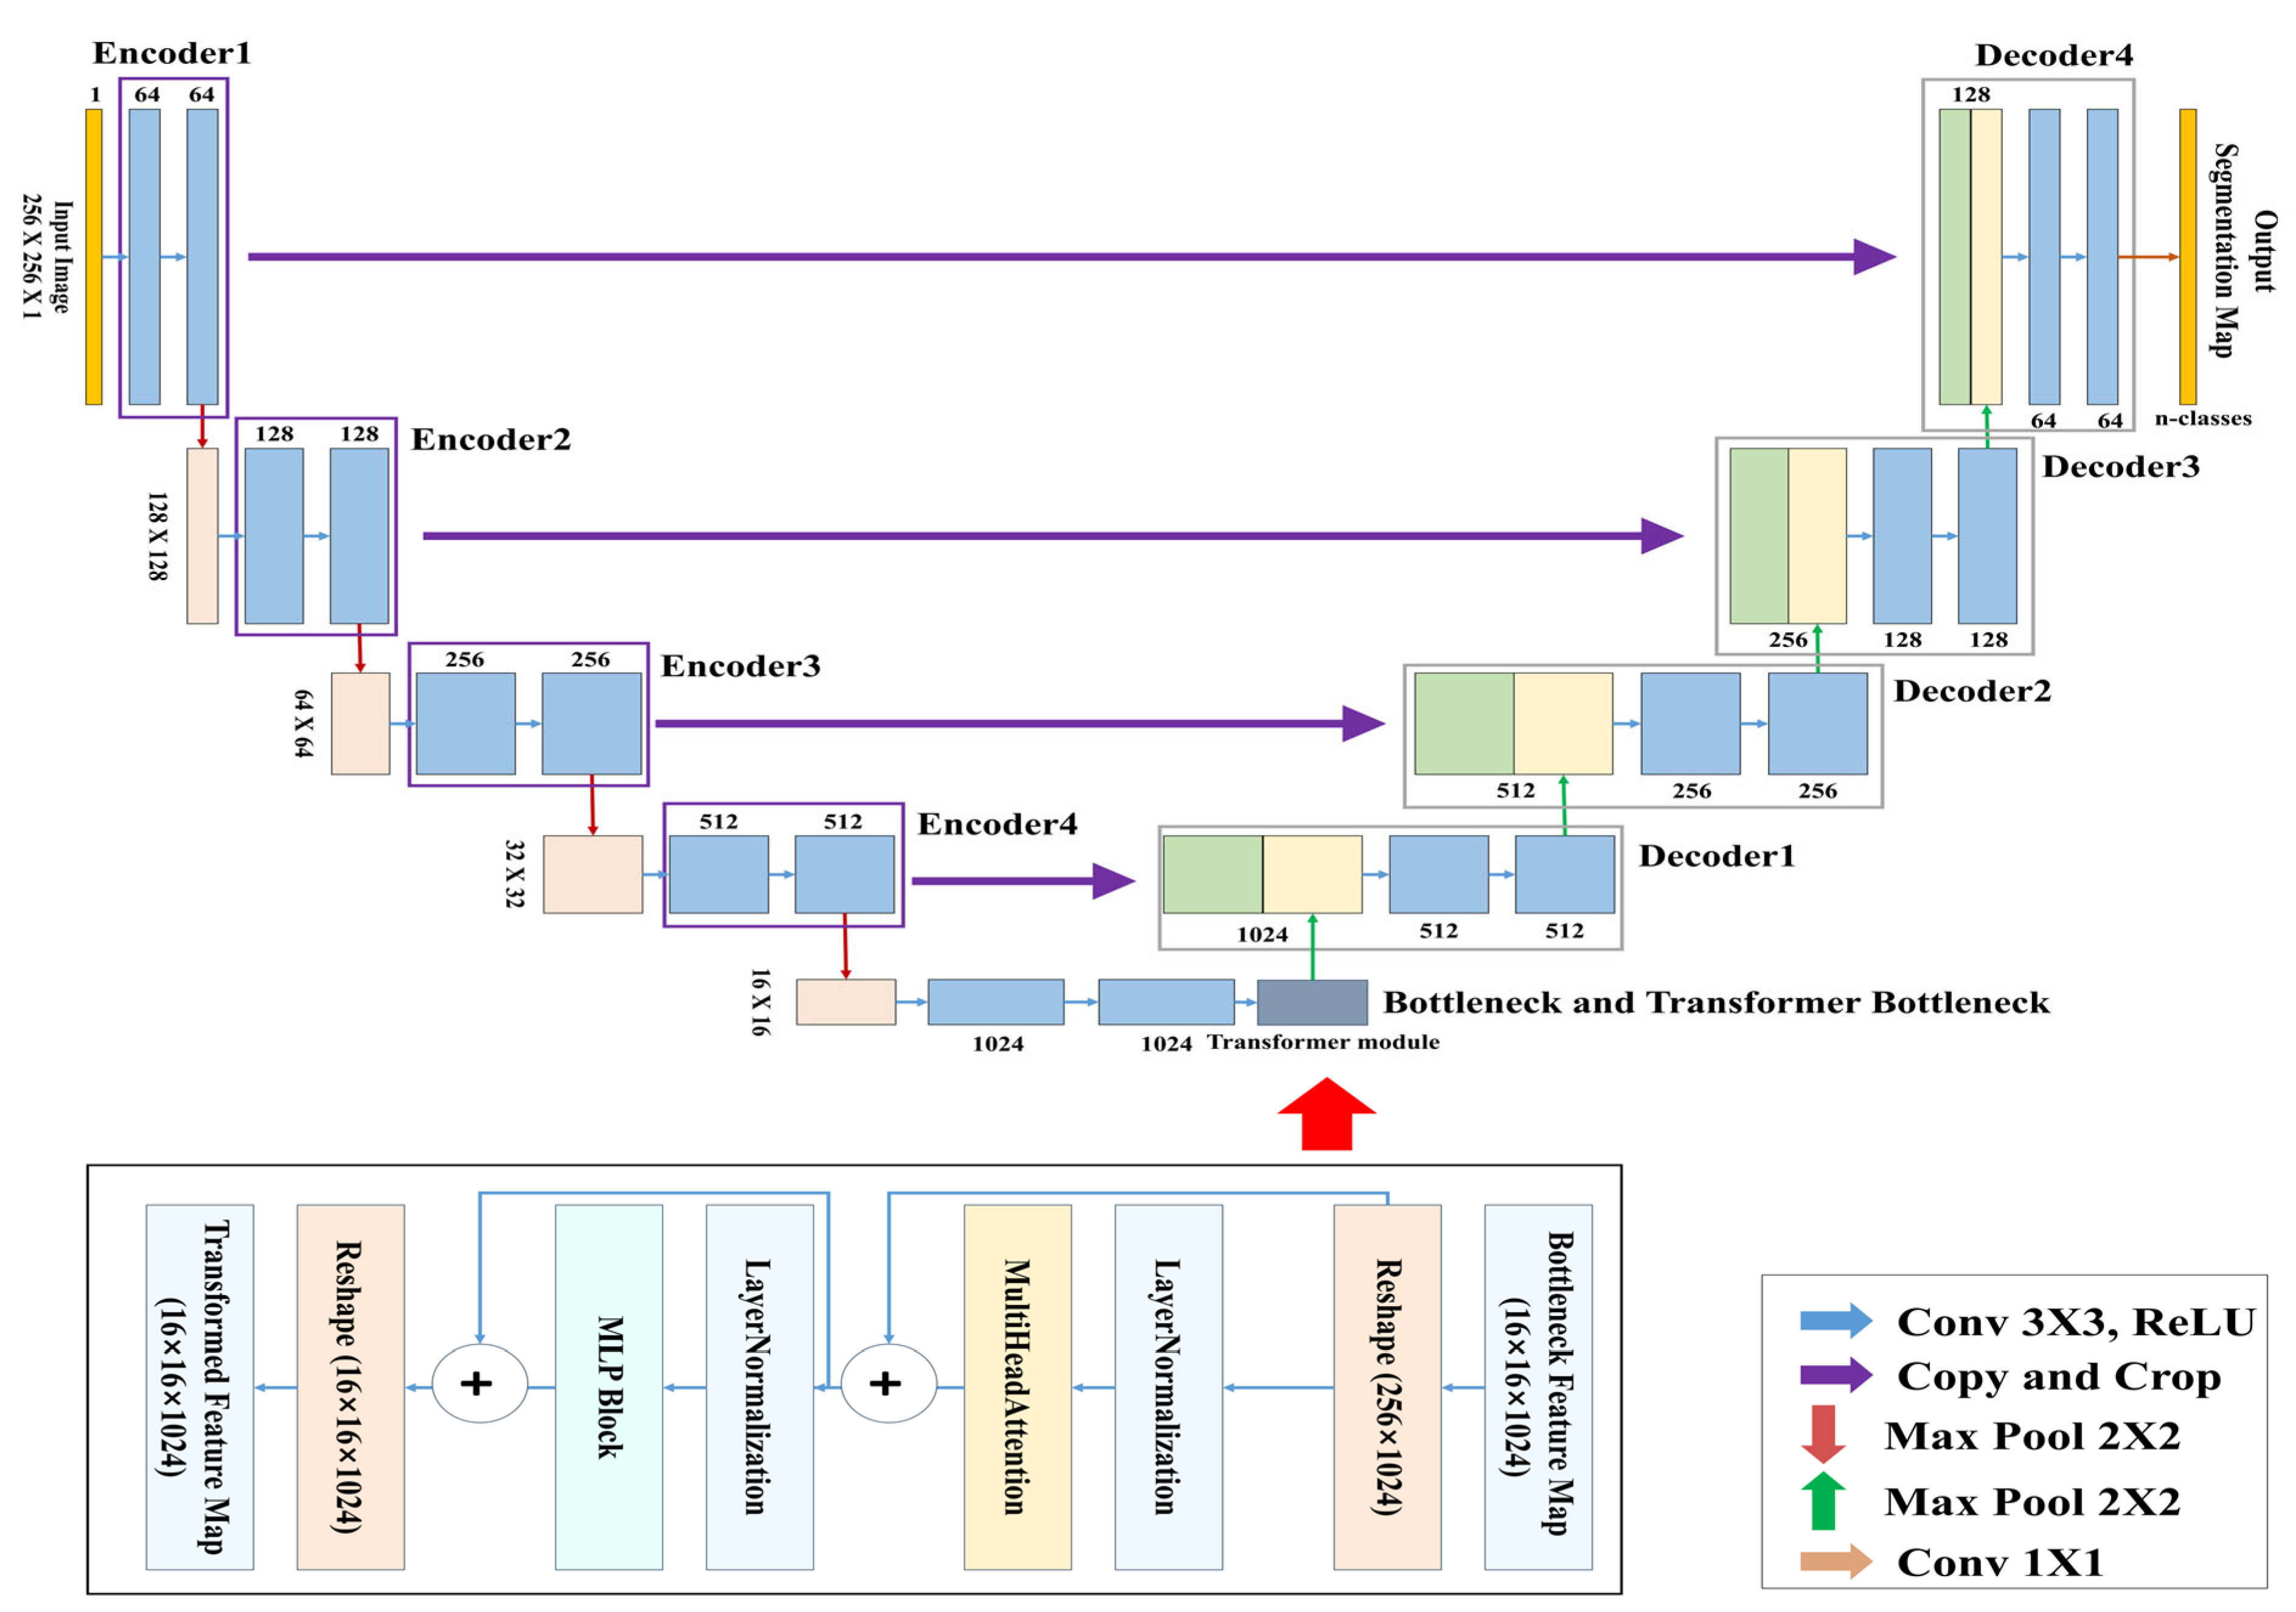
In this study, the TransUNet architecture was used for training, in which CNN-based structures were applied to the encoder and decoder, and a Transformer module was inserted into the central bottleneck (bridge) layer.
Table 2 shows the computing specifications used to train the model:
3.4.2. TransUNet Architecture
Figure 7 presents the complete architecture of the TransUNet used for learning and segmenting the respiratory region. This model is a segmentation network designed by combining the traditional U-Net architecture with a Transformer-based global feature encoder. The overall structure consists of three main components: the encoder, the Transformer module, and the decoder.
The objective of this study is to segment respiratory regions by training a TransUNet model to learn both the shape and global position of respiration. This is achieved through a network that predicts respiration based on its occurrence within the image and the correlation between pixels. Both the encoder and decoder are composed of standard CNN-based convolutional blocks, while the bottleneck (bridge) layer incorporates a Transformer encoder block consisting of multi-head attention and a multi-layer perceptron (MLP).
Table 3 above summarizes the detailed architecture of the TransUNet used in this study.
In this study, a binary segmentation mask is generated by processing input data of size 256 × 256 × 1 through four encoder stages, followed by Transformer processing at the bottleneck, and then passing through four up-sampling decoder stages with skip connections, culminating in a sigmoid activation function at the output. While the original TransUNet typically uses ResNet-50 as the backbone encoder, this study adopts a lightweight CNN-based architecture to reduce model complexity. In addition, the global feature information extracted through the CNN encoder is tokenized at the bridge stage, processed by the Transformer module, and then passed to the decoder, allowing the model to effectively incorporate global contextual information during segmentation.


