Abstract
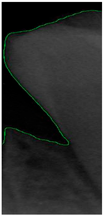
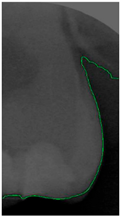
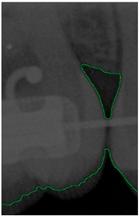
In the field of dentistry, the presence of dental calculus is a commonly encountered issue. If not addressed promptly, it has the potential to lead to gum inflammation and eventual tooth loss. Bitewing (BW) images play a crucial role by providing a comprehensive visual representation of the tooth structure, allowing dentists to examine hard-to-reach areas with precision during clinical assessments. This visual aid significantly aids in the early detection of calculus, facilitating timely interventions and improving overall outcomes for patients. This study introduces a system designed for the detection of dental calculus in BW images, leveraging the power of YOLOv8 to identify individual teeth accurately. This system boasts an impressive precision rate of 97.48%, a recall (sensitivity) of 96.81%, and a specificity rate of 98.25%. Furthermore, this study introduces a novel approach to enhancing interdental edges through an advanced image-enhancement algorithm. This algorithm combines the use of a median filter and bilateral filter to refine the accuracy of convolutional neural networks in classifying dental calculus. Before image enhancement, the accuracy achieved using GoogLeNet stands at 75.00%, which significantly improves to 96.11% post-enhancement. These results hold the potential for streamlining dental consultations, enhancing the overall efficiency of dental services.
1. Introduction
According to the oral health issue proposed by the World Health Organization (WHO) in 2023 [1], the proportion of the global population suffering from oral diseases is increasing annually, with nearly half of the population concentrated in low- and middle-income countries. This issue demonstrates the dilemma faced by many individuals unable to access preventive and therapeutic services for oral diseases. Furthermore, promoting oral health is crucial for healthy aging [2], as good oral health enhances the quality of life for older adults and reduces societal resource demands. In this context, the elevation of dental healthcare awareness becomes particularly important. In the field of dental medicine, medical digital imaging technology plays a crucial role [3], as it facilitates the introduction of more convenient and efficient treatment approaches. The utilization of medical imaging necessitates dentists to undergo requisite training to ensure their proficiency in mastering these novel techniques, a process that demands additional time and resources. Furthermore, the subjective interpretation of symptoms via digital imaging may lack standardized protocols, potentially resulting in disparate diagnostic outcomes for different dental practitioners. To mitigate these existing challenges, artificial intelligence deployment in image recognition has emerged as a viable solution [4]. This technology delivers precise and swift automatic identification results and aids dentists in conserving the valuable diagnosis time, enabling patients to access comprehensive treatment.
Dental calculus is recognized as a mineralized biofilm that comprises diverse calcium phosphate crystals, which may accumulate on the root surface both supra- and subgingivally [5]. A positive correlation between calculus deposits and periodontitis has been confirmed in multiple studies [6,7]. Despite clear evidence that the surface roughness of calculus alone does not initiate gingivitis, it is important to emphasize that calculus is consistently covered by an unmineralized layer of a viable biofilm [8], which is a primary factor in gingival inflammation [9]. The characteristics of dental calculus are not obvious in a BW image, as shown in Figure 1. The mechanical removal of subgingival plaque and calculus stands as the gold standard in the treatment of periodontitis [10]. While supragingival calculus can easily be seen and removed through sonic/ultrasonic instruments, subgingival calculus is invisible during intra-oral examination. Therefore, the identification of subgingival calculus is critical for the diagnostic process. Radiographic images have been widely used across various applications in the dental field [11]. Subgingival calculus is generally detected during periodontal probing, while radiographic examination can only show calculus on the proximal surfaces [12,13]. Meanwhile, Buchanan et al. [14] reported that the detection of dental calculus on the root surface by radiography had shown low sensitivity but high specificity, and a manual diagnosis can only detect dental calculus in 44% of the 275 datasets that truly have the condition. The detection ability can be increased to 82.2% by staining teeth with 1% methylene blue [15]. Galal et al. [16] observed that periapical films and intra-oral surveys showed comparable efficacy in calculus detection, with a particularly significant enhancement in detection when supplemented with radiographs. In comparison, other dental conditions like caries and periodontal disease have higher detection rates with manual methods. The detection rate for caries is approximately 70–85%, and for periodontal disease, it is around 65–80% [1]. Subgingival calculus documentation is crucial for periodontal assessment. Although clinical assessments are more common for detecting calculus, utilizing BW radiographs offers several advantages in calculus assessment. Firstly, BW images provide a comprehensive view of the tooth structure, allowing for a more thorough examination of interdental spaces where calculus often accumulates. Additionally, BW radiographs enable dentists to visualize areas that may be difficult to access during a clinical examination such as posterior regions. This enhanced visualization can aid in the early detection of calculus, leading to timely interventions and improved patient outcomes.
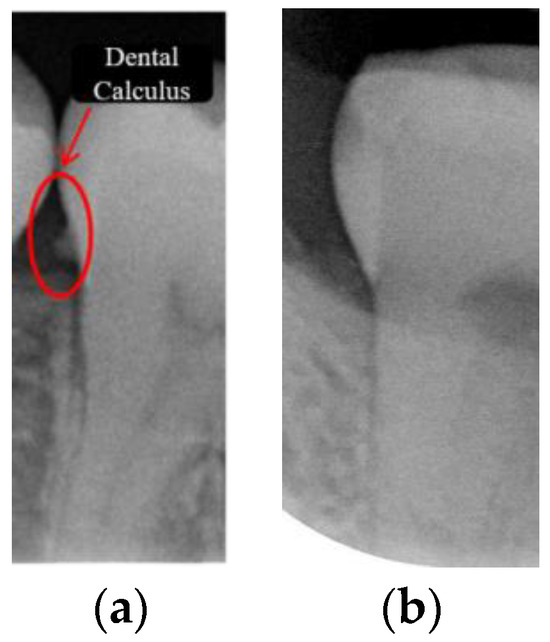
Figure 1.
Dental calculus symptoms on a BW image: (a) dental calculus symptoms; (b) absence of dental calculus symptoms.
Considering the substantial workload faced by dentists who deal with a large volume of dental X-rays daily, this study integrates deep learning models and image-processing techniques to detect a single tooth in BW images and uses convolutional neural networks to classify dental calculus features. In the field of dentistry, several studies have focused on the AI analysis of dental X-ray images. For instance, the AI recognition of tooth positioning and caries was achieved using BW images [17], demonstrating an impressive accuracy of up to 90%. Convolutional neural networks were employed for detecting periodontal diseases [18,19] and periapical lesions [20] in periapical radiographs, yielding detection accuracies of 90%, 94%, and 96%, respectively. Various diseases were identified through image-segmentation and -enhancement techniques in DPR images in studies such as [21,22,23]. Object-detection models were utilized to detect features in DPR images [24], achieving an accuracy exceeding 90% in individually locating each tooth image. Convolutional neural networks (CNNs) were employed for symptom diagnosis [25]. Despite these studies, there is relatively limited research specifically addressing dental calculus symptoms in BW images. As mentioned above, numerous dental-related studies have now addressed this research gap by introducing the You Only Look Once (YOLO) object-detection model, providing more comprehensive and accurate information for diagnosis and treatment in the dental field. These studies typically utilize CNN classification based on transfer learning and image-processing techniques for symptom diagnosis in X-ray images, along with YOLOv8 and image-segmentation algorithms [26] for single-tooth segmentation in BW images.
The database used in this study is the BW image database provided by the Chang Gung Memorial Hospital in Taoyuan, Taiwan. Each BW image was authorized by the patient for research purposes in this study and was approved by the IRB: 02002030B0. The presence of dental calculus in BW images was determined by dentists with over five years of experience. The dentists categorized the database into two groups: one containing 435 BW images with dental calculus and another containing 165 BW images without dental calculus. This database was utilized by the researchers for the image processing and training of deep learning models. The primary contributions of this study are as follows:
- Using the YOLOv8 model as a method for BW image detection achieves an accuracy of 97%, representing a 2–14% improvement compared to the latest segmentation algorithms in current research.
- Integrating a median filter and bilateral filter to reduce image noise effectively enhances the RoI while improving training accuracy. The accuracy can be enhanced to a 13–20% accuracy.
- This study uses transfer learning and image enhancement to detect dental calculus symptoms and achieve 96.11% in GoogLeNet, which is 13.9% higher than the latest research.
2. Materials and Methods
This study uses image enhancement and deep learning to identify dental calculus symptoms in BW images. An accurate diagnosis requires the integration of these technologies. To achieve this goal, the research process was divided into four stages, as shown in Figure 2. The first is YOLO object detection. This stage can detect and record the position of the teeth in the BW image. In the BW image-segmentation stage, the tooth positions recorded in the previous stage are used to separate the teeth from the BW image. Next is the single-tooth image-enhancement stage, where techniques are employed to enhance the edges of dental calculus. Finally, training and evaluation are conducted using a classic convolution neural network. The ultimate objective of this study’s technology is to provide dentists with an auxiliary diagnostic model to reduce misdiagnosis risks and enhance hygiene education for patients.

Figure 2.
The flowchart used in this study.
2.1. Detection of Single-Tooth Location in BW Images
Object-detection technology has become increasingly prominent in recent decades, due to advancements in machine learning and artificial intelligence playing a significant role in image processing [27]. Some well-known object-detection models, such as U-Net, Faster R-CNN, and the YOLO series, have been widely applied in various domains. However, the techniques used for dental calculus detection are still predominantly based on manual identification. Research on object detection in dental calculus remains relatively scarce. Therefore, this study chose to employ the YOLO model due to its promising performance and training potential. By leveraging YOLO, we aim to explore and improve the outcomes of object-detection training in the context of dental calculus. Therefore, the database was not easy to obtain, and this study used 435 BW images containing dental calculus, and each BW image contains at least one to three dental calculi. This study used a BW image database provided and annotated by dentists for the location of the dental calculus. During the research process, this study randomly selected X-rays from this database to create the training dataset. Before training the YOLO model, this study utilized the commonly used software tool “LabelImg” (version 1.8.1) for object annotation in YOLO. Additionally, dental experts assisted in annotating dental features for subsequent training purposes. In the image-annotation step of this study, rectangle boxes were used to label individual teeth in the BW images. This labeling method preserves larger surrounding features of the teeth. This is because placing the annotation box too close to the edges of the teeth may prevent YOLO training from fully extracting the features of dental calculus. Dental calculus typically appears on both sides of the teeth. The labeling method for teeth is illustrated in Figure 3. This study randomly selected 200 BW images that contain dental calculus and annotated 65% of the dataset images as the YOLO image training dataset, and the remaining 35% of the images were used as the validation dataset. The image dataset distribution is shown in Table 1. This study utilized YOLOv4, v5, v7, and v8 for image detection. In the YOLO models, there are slight differences in the architecture of each version. YOLOv4 uses CSPDarknet53 as the backbone, combined with PANet as the neck structure, and adopts the traditional YOLO head. YOLOv5 uses a customized CSPNet as the backbone, still employs PANet as the neck structure, and retains the YOLO head. YOLOv7 further improves the backbone by using an extended CSPNet and introduces E-ELAN as the neck structure, while the head part adopts a decoupled design. YOLOv8 [28] uses a mixture of experts’ models as the backbone, with an improved PANet as the neck structure, and the head part also uses a decoupled design to enhance detection performance, shown in Table 2. Before training, appropriate hyperparameters need to be set for each model, and these are shown, in detail, in Table 3. In this stage, the training results of YOLO will record the coordinates of detected teeth. These tooth coordinates will be utilized in subsequent stages for the segmentation of individual teeth in BW images through algorithms developed in this study. After multiple experiments and evaluations, this study found that different YOLO models require varying epoch lengths. Therefore, this study set up interrupts during YOLO training to automatically adjust algorithm parameters based on the results to achieve optimization.
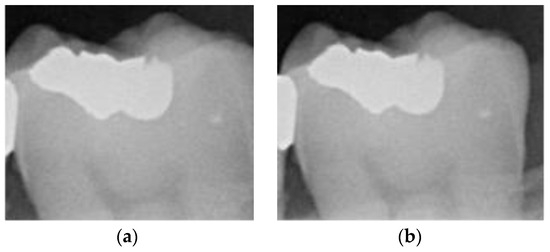
Figure 3.
Image-annotation step preserves edges on both sides of the tooth: (a) less of the tooth edge is retained; (b) more of the tooth edge is retained.

Table 1.
YOLO image dataset distribution.

Table 2.
YOLO architecture comparison.

Table 3.
YOLO model training hyperparameters.
2.2. Single-Tooth Segmentation from BW Images
BW images provide valuable information for dentists to evaluate the alignment, structure, and spacing of teeth. Unlike symptoms such as implants or root canals, dental calculus typically forms on the proximal surfaces of teeth, where its characteristics are not readily apparent and require additional image-processing methods for enhancement. However, directly enhancing dental calculus symptoms on BW images is not a practical approach, as it may not effectively address the presence of calculus. Therefore, this study employed image-segmentation techniques to extract individual teeth from BW images, using image-segmentation algorithms and combines YOLO object-detection technology to locate individual teeth for the enhancement of symptoms.
This step aims to effectively separate the target of interest (individual tooth images) from the background (non-dental regions), as illustrated in Figure 4. This process involves multiple image-processing steps and identifies peaks and valleys for segmentation through accumulated pixel values. Considering that dental calculus symptoms often occur on both sides of the teeth, to enhance the effectiveness of CNN training, this study divided each tooth into two equal parts vertically.

Figure 4.
The flowchart used in single-tooth image segmentation.
- A.
- Image Preprocessing
To obtain clearer images and to reduce noise, mean filtering was applied to the original images of the BW images in this study. Mean filtering is a form of linear filtering that computes the average pixel value within a window region and assigns this average value to the pixel at the center of the window. This method is simple and efficient, effectively blurring noise information. The formula for mean filtering is as shown in (1), and the filter results are shown in Figure 5a.
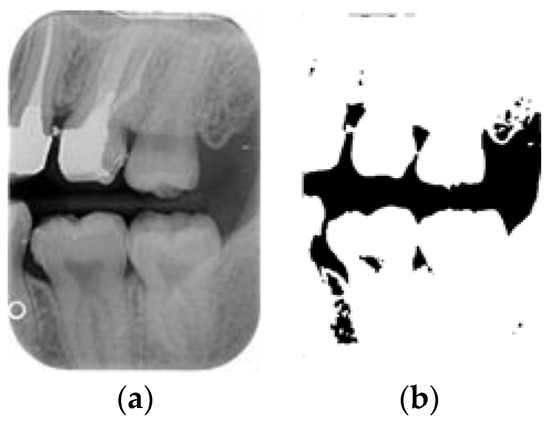
Figure 5.
The BW image-preprocessing results: (a) mean filter; (b) binarization.
After the mean filter-smoothing process, the BW images retained a significant amount of information. This study used image processing to simplify the image structure and reduce excessive information by converting the grayscale BW images into binary images containing only two-pixel values: 0 and 255. By setting a threshold of 170, pixels with values greater than 170 were set to 255, while pixels with values less than or equal to 170 were set to 0. The results are illustrated in Figure 5b. The binary images effectively reduced the complexity of the BW images, allowing for a clearer identification of key features and structures. This simplified representation facilitated further analysis and interpretation, enabling us to focus on specific areas of interest with greater precision and clarity. The streamlined visual data provided a solid foundation for subsequent quantitative and qualitative assessments, enhancing the overall efficacy of this study’s findings.
- B.
- BW Image Pixel-Projection Algorithm
This study employed image segmentation to enhance the precision of diagnosing dental calculus symptoms by segmenting the BW image into individual teeth. At first, horizontal projection was utilized to detect the coordinates of the pixel accumulation with the lowest value in the BW image (refer to Figure 6b). Subsequently, based on these coordinates, the image was divided into upper and lower parts, as illustrated in the segmentation results shown in Figure 6a. Following the initial step, vertical projection was employed to identify the spaces between the teeth. A threshold of 400 for the total pixel values was established to facilitate the identification of multiple points falling below this threshold (refer to Figure 6d). Subsequently, when cropping the image, 50 pixels were subtracted from the smaller X coordinate, and 50 pixels are added to the larger X coordinate to prevent an inadvertent truncation of the tooth edges. The segmented individual teeth are depicted in Figure 6c.
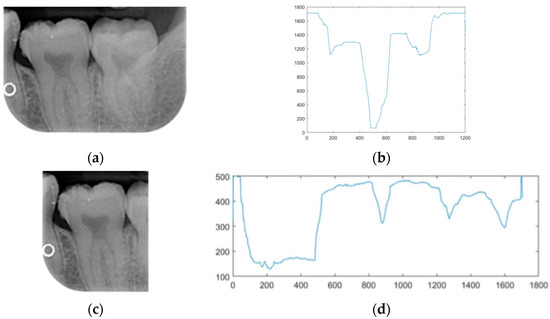
Figure 6.
The results of pixel projection: (a) horizontal pixel projection; (b) horizontal pixel projection-coordinate graph; (c)vertical pixel projection; (d) vertical pixel projection-coordinate graph.
2.3. Single-Tooth Image Enhancement
Dental calculus typically appears on the surface of teeth or in the areas between teeth and gums, presenting as white or gray-white areas on X-ray images, with higher contrasts compared to surrounding teeth and tissues [29]. The visibility of dental calculus on BW images depends on factors such as its size, density, and location, as well as the angle and quality of the X-ray images. However, there may be challenges in discerning the signs of dental calculus. This study developed a dental calculus-enhancement algorithm tailored for BW images. The algorithm flowchart shown in Figure 7 integrates image-filter and morphological algorithms to enhance tooth edge structures in BW images, effectively highlighting dental calculus signs through edge-detection algorithms.

Figure 7.
Image-enhancement flowchart.
2.3.1. Median Filter
BW image-segmentation results often contain a lot of noise, and dental calculus symptoms are not always clearly visible. Therefore, it is necessary to perform primary filtering on the noise in an image using a median filter. The median filter is an effective filtering method that removes noise while preserving image details and edge information, without causing excessive blurring of the image. This helps to improve the accuracy of dental calculus symptom detection. The process begins by selecting a pixel in the image and creating a window around it. The pixel values within the window are then sorted, and the median value is calculated. This median value is assigned to the pixel being processed. This process is repeated for each pixel in the image, resulting in a denoised image with preserved details and edges. The algorithm for the median filter used in this study is as shown in Algorithm 1:
| Algorithm 1. Median Filter. |
| Input : filtering input image. K: neighborhood kernel. : kernel’s width and height. Output filtering output image. Hint: m |
2.3.2. Bilateral Filter
This study introduced the bilateral filter technique to enhance the quality of individual tooth images. Compared to median filtering, a bilateral filter is more effective in handling images with different textures while preserving the clarity of image textures. This technique combines spatial- and pixel-value domain similarities, overcoming the limitations of traditional filtering methods in retaining texture details. The bilateral filter algorithm in Algorithm 2 computes the spatial distance between each pixel and its surrounding pixels, along with the difference in pixel values. It then uses these differences to calculate the weights of the pixels and applies these weights to each pixel in the image. It obtains the new pixel values by applying a weighted average of the pixel values in the surrounding region. A bilateral filter is useful for enhancing specific details in dental images, making the edges of the teeth clearer while preserving the natural texture of the image. Applying this technique can improve the accuracy of detecting dental calculus symptoms and can make tooth images more suitable for further analysis and processing.
| Algorithm 2. Bilateral Filter. |
| Input : filtering input image. X: the coordinates of the current pixel. Ω: the window center centered in X. : the range kernel for smoothing differences in intensities. : the spatial kernel for smoothing differences in coordinates. W: normalization term between spatial closeness () and intensity difference (). Output filtering output image. Hint: |
2.3.3. Binarization
The grayscale images of individual teeth obtained through two sets of image filters have pixel-intensity values ranging from 0 (black) to 255 (white). These images display intricate details and layers, allowing for a clear depiction of dental structural characteristics. Dental calculus located at the boundaries of teeth may not be distinctly recognizable in grayscale images. In this study, image binarization was used to simplify and enhance the visibility of teeth against the background to improve the detection of pathological features. Binarized images contain only two-pixel values, typically used to separate objects from the background, thereby enhancing the clarity of object contours and structures. Adaptive thresholding was applied in this study to ensure more accurate binarization results under varying illumination conditions. The binarization results, as shown in Figure 8a, demonstrate a clear contrast between the teeth and the background.
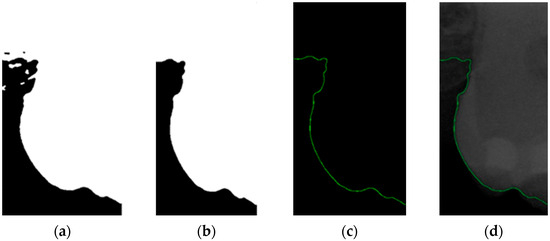
Figure 8.
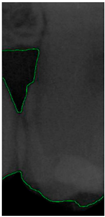
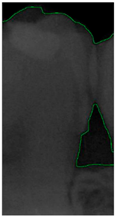
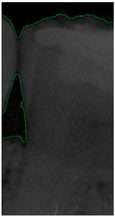
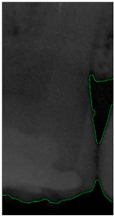
Image-enhancement results: (a) binarization; (b) mathematical morphology; (c) added green line represents canny; (d) overlap onto the original image.
2.3.4. Mathematical Morphology
This study utilized morphological operations to improve the success rate of edge detection. Morphological operations are fundamental operations in mathematical morphology, which are primarily used to enhance specific features of images such as edges, shapes, and structures that are widely applied in image processing. Opening and closing are the two main operations, and their formulas are as shown in (2) and (3). These operations are based on combinations of dilation and erosion. The opening operation removes small objects or spots from an image, while the closing operation fills in small holes or gaps in an image. The results of morphological operations are shown in Figure 8b.
2.3.5. Canny Edge Detection
Since filtered and binarized images alone cannot enhance the features of dental calculus, this approach does not effectively improve the accuracy of machine learning. Therefore, this study employed edge detection to identify the contours of tooth edges, enhancing the regions of interest and thereby improving the accuracy of machine learning. The canny edge-detection algorithm applies non-maximum suppression to each pixel, retaining pixels with local maximum gradient values, which can produce continuous and accurate edges while demonstrating good resistance to noise. The edge-detection results are represented in green, as shown in Figure 8c. Finally, these results are overlaid back onto the original image, as illustrated in Figure 8d.
2.4. CNN Training and Validation
CNN is a powerful deep learning model for visual data processing, and its importance in medicine is increasing [30]. It extracts key features from complex visual data and aids in model training through layers and adjustments. After refining the dental calculus image, CNN goes through training phases including database augmentation and tuning. The model is validated using untrained images of dental calculus to assess accuracy and reliability. Using CNN for dental calculus detection offers significant benefits, such as precise feature extraction and improved diagnostic accuracy. Experimental validation shows that the proposed CNN model achieves good results in determining the presence of dental calculus.
2.4.1. Dataset Augmentation
For CNN models, having an adequate amount of data is crucial to ensure effective learning and generalization performance. When the training sample size is limited, models are prone to overfitting or may fail to achieve good generalization performance. After applying the image-segmentation technique developed in this study, a total of 1340 images of individual teeth were obtained, including 428 images with dental calculus and 912 images without dental calculus. To balance the data quantity and to reduce overfitting issues, this study employed random image-flipping and mirroring techniques for data augmentation. This study set the dataset to include 670 images with dental calculus and 670 images without dental calculus. Dental calculus images were randomly selected for flipping or mirroring, while non-dental calculus images were also randomly selected to form the dataset for CNN training and validation. The detailed breakdown is presented in Table 4. A total of 80% of the image dataset was randomly chosen as the CNN training dataset. The remaining 20% of the dataset was used as the validation-image dataset. Moreover, the CNN training dataset was split into a 7:3 ratio for the training and testing datasets, and the training image as shown in Figure 9.

Table 4.
Distribution of CNN-model-image dataset.
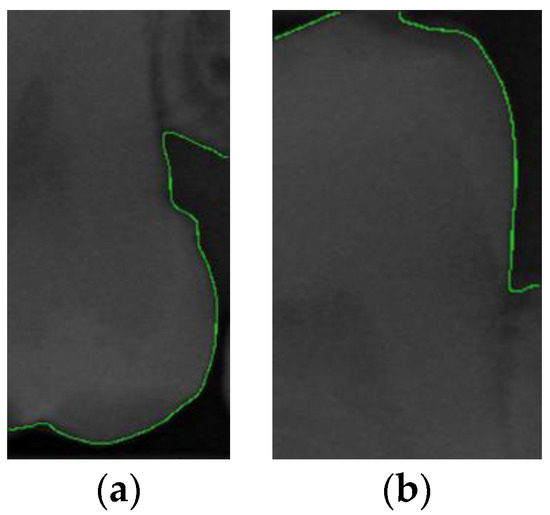
Figure 9.
Data augmentation results. (a) Dental calculus. (b) Without dental calculus.
2.4.2. Hyperparameter Tuning
During the training process of a CNN (Convolutional Neural Network), hyperparameters are manually set parameters that directly influence the model’s learning process and performance. Some common hyperparameters include the following:
- Learning rate: This controls the updated speed during training. A higher learning rate can accelerate convergence but may lead to oscillations, while a lower learning rate may result in slow convergence.
- Batch size: This represents the number of samples used to update the model parameters during each training iteration. A larger batch size can improve the training speed but increases memory requirements, whereas a smaller batch size may lead to unstable training.
- Epoch: This represents the number of times the entire training dataset is traversed during training. Increasing the number of epochs allows the model to better learn from the data but may also lead to overfitting.
Adjusting hyperparameters requires finding suitable ranges, selecting an optimization method, and testing different combinations to choose the best set. This research identifies the optimal hyperparameter mix for dental calculus recognition in Table 5. Ensuring precise tooth identification and successful training, the dental panorama X-ray unit is shown in Table 6.

Table 5.
The hyperparameter used in the CNN model training.

Table 6.
Dental panorama X-ray unit.
2.4.3. CNN Model Training
CNN offers advantages in image processing by autonomously extracting abstract features, beneficial for detecting subtle features like dental calculus. CNN has fewer parameters, reducing computational costs and memory needs and addressing overfitting. This study uses four deep learning models within the CNN framework: GoogLeNet, ShuffleNet, Xception, and Inception_v3. These models were employed for processing image data. GoogLeNet, known for its Inception architecture, utilizes multi-scale convolution kernels to enhance performance. The CNN model training acceleration in this study was achieved using an Nvidia GeForce GTX 2070 GPU. Detailed hardware performance information is provided in Table 7. MATLAB and Deep Network Designer are key software tools for creating convolution network models.

Table 7.
The hardware and software platform.
3. Results
This research utilized a YOLO and CNN model to identify symptoms of dental calculus to reduce the workload of dentists and to minimize the chances of misdiagnosis. Image-enhancement methods were employed to improve the accuracy by enhancing characteristics that might not be clearly visible in the images.
- A.
- YOLO Detects Single Teeth
YOLO is an artificial intelligence technology capable of detecting regions of interest (RoI) in images. This study used bounding boxes to locate features and extract positional information from them to extract these features. To evaluate the efficacy of AI model training, different standards are typically used for comparison. Commonly used standards in current research are shown below and were calculated based on the confusion matrix in Table 8, with the formulas illustrated in (4)–(7).

Table 8.
Confusion matrix.
- Precision: the proportion of all items detected as targets that are correctly classified as targets.
- Recall: the proportion of all targets in the data that are correctly classified as targets, also called sensitivity.
- mAP (mean average precision): the average of these average precision values across all classes, which is computed by plotting a precision–recall curve for each class and calculating the area under the curve (AUC).
- Specificity: the proportion of targets that are actually not diseases that are tested as correct.
In the validation results, this study compared image-segmentation algorithms, and the results are shown in Table 9. It can be seen that the use of a YOLO object-detection model results in a better accuracy than that of a segmentation algorithm. Table 10 demonstrates that YOLOv8 achieves the highest precision and mAP values, reaching 97.48% and 99.37%, and Table 11 demonstrates a comparison with another research study. Meanwhile, YOLOv5 exhibits the best recall performance at 97.82%. This study also compares these results with those obtained using YOLO models in references [19,31]. The YOLO models proposed in this study show an improvement of up to 19% in feature detection and segmentation.

Table 9.
Comparison of image-segmentation methods between algorithms and YOLO.

Table 10.
YOLO training results.

Table 11.
YOLO comparison with another research study.
After training the YOLO object-detection models, this study tested unlabeled, and untrained the BW images. The test results are illustrated in Figure 10. The four object models used in this study, along with the image-augmentation technique, successfully identified all the teeth of interest in the BW images. After the image-segmentation stage, the extracted regions were delineated by the red boxes in Figure 10a, and the PR curve is shown in Figure 10b. The results extracted are depicted in Figure 11, effectively capturing the individual teeth and their edges and enabling further image-enhancement and CNN training steps.
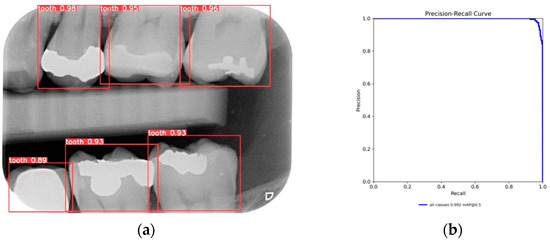
Figure 10.
YOLO validation results: (a) YOLOv8 detect results; (b) YOLOv8 validation PR curve.
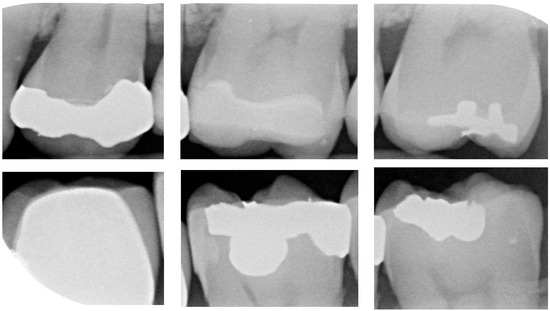
Figure 11.
The results of tooth extraction based on YOLOv8.
- B.
- Dental Calculus Classification Result
This research utilized a CNN model to identify symptoms of dental calculus to reduce the workload of dentists and to minimize the chances of misdiagnosis. Image-enhancement methods were employed to improve the accuracy by enhancing characteristics that might not be clearly visible in the images. With the CNN model-training accuracy shown in Figure 12, it can be seen that the accuracy of each model increases rapidly within the first few hundred iterations and then gradually stabilizes. The GoogLeNet model shows the most outstanding performance, achieving the highest accuracy at all iteration counts, while the other models stabilize at similar accuracy levels after approximately 1000 iterations. This indicates that GoogLeNet performs better in this binary classification task. Figure 13 shows the GoogLeNet loss function curves during training. Table 12 provides training process details of GoogLeNet. The results offer insight into the model’s training progress and effectiveness, demonstrating successful dental calculus symptom identification. Image-enhancement techniques improved the performance, as visualized through the training convergence and loss function curves, highlighting the model’s effectiveness in diagnostics and patient care.

Figure 12.
CNN training process.

Figure 13.
GoogLeNet loss process.

Table 12.
GoogLeNet training process in every 5 epochs.
This study trained four popular CNN models, and their training outcomes are presented in Table 13. It is evident that when trained on single-tooth diseases without image enhancement, the highest accuracy reached was 75%. Dental calculus characters are difficult to see in the images. This study used image-enhancement methods to improve training results, which resulted in significant improvements. For instance, using GoogLeNet as an example, its accuracy reached 96.11%, marking an approximately 20% increase compared to the original results. It is worth noting that even the ShuffleNet model, despite having lower accuracy, achieved a dental calculus detection accuracy of 91.58%.

Table 13.
CNN model-training accuracy.
This study conducted validations using 8 untrained images to validate the integrity of the training results, as shown in Table 14, and to provide the comprehensive evaluation with 200 BW images with YOLOv8 in Table 15. The validation process involved steps such as YOLO image segmentation, image enhancement, and CNN symptom classification. By comparing the results with the Ground truth obtained through discussions with multiple dentists, it was found that all eight teeth could accurately determine the presence of dental calculus, with an accuracy exceeding 90% for each. The performance improvement of GoogLeNet, compared to the latest research by [15] in symptom-detection accuracy, is also approximately 14%, which is shown in Table 16.

Table 14.
The dental calculus image-validation results.

Table 15.
Validation results with a dataset of 200 images.

Table 16.
CNN training result comparison.
4. Discussion
This study addresses the critical goal of reducing the burden on dentists and minimizing the risk of misdiagnosis in dental calculus detection. By leveraging the strengths of BW images, which excel in capturing tooth tissue and lesion characteristics [32], this study aimed to improve the identification of dental calculus, a subtle yet significant symptom that often requires careful examination. The implications of this research are far-reaching, particularly in busy clinical settings where time constraints and fatigue may contribute to an oversight of subtle dental plaque, potentially impacting patient treatment plans and oral health outcomes. In comparison to prior research utilizing traditional radiographic imaging, this study demonstrated a substantial enhancement in mAP by 19% through the adoption of a different object-detection model and preprocessing image-enhancement techniques [33]. Moreover, when compared to the direct utilization of YOLO_v5 for dental calculus detection in BW images [34], there was a minimum 15% increase in mAP. Using the YOLOv8 model and image preprocessing as the tool for detecting single teeth achieves an accuracy of 97%, highlighting the efficacy of the proposed methodology. The integration of AI models resulted in a notable accuracy improvement of 82%, effectively reducing errors in dental calculus detection compared to previous approaches [15]. Building upon these achievements, this study implemented the segmentation of dental BW images to identify single-tooth images and applied enhancements to boost diagnostic accuracy. The utilization of GoogLeNet yielded a final accuracy of 96.11%, reflecting a noteworthy 10% enhancement over previous methods [31]. The comprehensive comparison in dental calculus is shown in Table 17. However, it is essential to acknowledge the limitations of the current study. While it successfully identifies dental calculus features in BW images, issues related to potential tartar and other dental problems remain unresolved. Looking ahead, future research endeavors should focus on exploring alternative image-processing techniques, particularly in the interdental area, to effectively extract and address these additional challenges. By broadening the scope of investigation and considering diverse methodologies, researchers can continue to advance the field of dental diagnostics, contributing to improved patient care and oral health outcomes. This study did not address the detection of dental caries or other lesions, which can also impact overall oral health. Furthermore, the dataset used for training and validation may not fully represent the diversity of dental cases encountered in different populations. This limitation could affect the generalizability of this research. Lastly, this study focused on single-tooth segmentation, which, although effective, may not fully capture the complexity of dental structures in multi-tooth contexts. The comprehensive comparison in dental calculus is shown in Table 17.

Table 17.
Comprehensive comparison in dental calculus.
5. Conclusions
This research represents a significant breakthrough in the diagnosis of dental calculus symptoms. In the future, clinical practitioners can enhance their diagnostic and treatment capabilities in dental calculus by utilizing the assistance provided by this study, thereby improving the quality of healthcare. It can achieve an accuracy of more than 92% in classifying disease symptoms, and it can also achieve a 10% optimization compared with current research. In future research, we plan to analyze a large database of images and utilize Generative Adversarial Networks (GANs) for image enhancement, replacing traditional image preprocessing steps. Through GANs, the model can automatically learn and generate more medically meaningful image features, thereby reducing manual intervention in the model and improving the efficiency of image enhancements. This will help shorten the model’s decision-making time while providing more comprehensive medical diagnostic support, contributing significantly to dental healthcare services. This study proposes that future research should focus on investigating the application of advanced deep learning models to enhance diagnostic accuracy and comprehensiveness. This could lead to improvements in the detection and analysis of various dental conditions. Moreover, exploring the use of generative AI could provide significant advancements in this field. Additionally, enhancing image quality by reducing noise could lead to more detailed dental image information. These advancements may enable more precise identification and the development of more effective treatment plans.
Author Contributions
Conceptualization, T.-J.L. and Y.-T.L.; data curation, T.-J.L. and Y.-T.L.; formal analysis, T.-Y.C.; funding acquisition, T.-Y.C., S.-L.C., C.-A.C. and K.-C.L.; methodology, A.-Y.T., C.-Y.L., L.-T.L. and S.-L.C.; resources, S.-L.C.; software, Y.-J.L., A.-Y.T., C.-Y.L., L.-T.L., S.-L.C. and C.-A.C.; validation, Y.-J.L. and S.-L.C.; visualization, Y.-J.L., A.-Y.T., C.-Y.L. and L.-T.L.; writing—original draft, Y.-J.L.; writing—review and editing, T.-Y.C., C.-A.C., K.-C.L. and P.A.R.A. All authors have read and agreed to the published version of the manuscript.
Funding
This work was supported, in part, by the National Science and Technology Council, Taiwan, under grant numbers 111-2221-E-033-041, 111-2823-8-033-001, 111-2622-E-131-001, 110-2223-8-033-002, 110-2221-E-027-044-MY3, 110-2218-E-035-007, 110-2622-E-131-002, 109-2622-E-131-001-CC3, 109-2221-E-131-025, 109-2410-H-197-002-MY3, 112-2410-H-197-002-MY2, 112-2410-H-033-014, and 112-2222-E-035-004.
Institutional Review Board Statement
Chang Gung Medical Foundation Institutional Review Board; IRB number: 02002030B0; date of Approval: 1 December 2020; protocol title: A Convolutional Neural Network Approach for Dental Bite-Wing, Panoramic and Periapical Radiographs Classification; executing Institution: the Chang-Geng Medical Foundation Taoyuan Chang-Geng Memorial Hospital of Taoyuan; duration of approval: from 1 December 2020 to 30 November 2021. The IRB reviewed and determined that this is an expedited review according to case research or cases treated or diagnosed by clinical routines. However, this does not include HIV-positive cases.
Informed Consent Statement
The IRB approves the waiver of the participants’ consent.
Data Availability Statement
Based on the IRB and the agreement with Chang Gung Memorial Hospital, its database and related data cannot be disclosed.
Acknowledgments
The authors are grateful to the Applied Electrodynamics Laboratory (Department of Physics, National Taiwan University) for their support with the microwave calibration kit and microwave components.
Conflicts of Interest
The authors declare no conflicts of interest.
References
- World Health Organization, WHO. Global Oral Health Status Report: Towards Universal Health Coverage for Oral Health by 2030; Management-Screening, Diagnosis and Treatment (MND); Noncommunicable Diseases, Rehabilitation and Disability (NCD): Geneva, Switzerland, 2022; ISBN 978-92-4-006148-4. [Google Scholar]
- Chan, A.K.Y.; Chu, C.H.; Ogawa, H.; Lai, E.H.-H. Improving oral health of older adults for healthy ageing. J. Dent. Sci. 2024, 19, 1–7. [Google Scholar] [CrossRef] [PubMed]
- Spagnuolo, G.; Sorrentino, R. The Role of Digital Devices in Dentistry: Clinical Trends and Scientific Evidences. J. Clin. Med. 2020, 9, 1692. [Google Scholar] [CrossRef] [PubMed]
- Guo, Z.; Shen, Y.; Wan, S.; Shang, W.-L.; Yu, K. Hybrid Intelligence-Driven Medical Image Recognition for Remote Patient Diagnosis in Internet of Medical Things. IEEE J. Biomed. Health Inform. 2022, 26, 5817–5828. [Google Scholar] [CrossRef] [PubMed]
- Akcalı, A.; Lang, N.P. Dental calculus: The calcified biofilm and its role in disease development. Periodontol. 2000 2018, 76, 109–115. [Google Scholar] [CrossRef] [PubMed]
- Schätzle, M.; Löe, H.; Lang, N.P.; Bürgin, W.; Anerud, A.; Boysen, H. The clinical course of chronic periodontitis. J. Clin. Periodontol. 2004, 31, 1122–1127. [Google Scholar] [CrossRef] [PubMed]
- Effect of Rough Surfaces Upon Gingival Tissue—Jens Waerhaug. 1956. Available online: https://journals.sagepub.com/doi/10.1177/00220345560350022601 (accessed on 26 February 2024).
- Schroeder, H.E.; Shanley, D. Formation and Inhibition of Dental Calculus. J. Periodontol. 1969, 40, 643–646. Available online: https://aap.onlinelibrary.wiley.com/doi/10.1902/jop.1969.40.11.643 (accessed on 26 February 2024). [CrossRef] [PubMed]
- Hinrichs, J. The Role of Dental Calculus and Other Local Predisposing Factors. Carranza’s Clin. Periodontal. 2012, 1, 217–231. [Google Scholar] [CrossRef]
- Suvan, J.; Leira, Y.; Sancho, F.M.M.; Graziani, F.; Derks, J.; Tomasi, C. Subgingival instrumentation for treatment of periodontitis. A systematic review. J. Clin. Periodontol. 2020, 47 (Suppl. S22), 155–175. [Google Scholar] [CrossRef] [PubMed]
- Ridao-Sacie, C.; Segura-Egea, J.J.; Fernández-Palacín, A.; Bullón-Fernández, P.; Ríos-Santos, J.V. Radiological assessment of periapical status using the periapical index: Comparison of periapical radiography and digital panoramic radiography. Int. Endod. J. 2007, 40, 433–440. [Google Scholar] [CrossRef]
- Corbet, E.F.; Ho, D.K.; Lai, S.M. Radiographs in periodontal disease diagnosis and management. Aust. Dent. J. 2009, 54 (Suppl. S1), S27–S43. [Google Scholar] [CrossRef]
- Tugnait, A.; Clerehugh, V.; Hirschmann, P.N. The usefulness of radiographs in diagnosis and management of periodontal diseases: A review. J. Dent. 2000, 28, 219–226. [Google Scholar] [CrossRef]
- Buchanan, S.A.; Jenderseck, R.S.; Granet, M.A.; Kircos, L.T.; Chambers, D.W.; Robertson, P.B. Radiographic detection of dental calculus. J. Periodontol. 1987, 58, 747–751. [Google Scholar] [CrossRef]
- Hyer, J.C.; Deas, D.E.; Palaiologou, A.A.; Noujeim, M.E.; Mader, M.J.; Mealey, B.L. Accuracy of dental calculus detection using digital radiography and image manipulation. J. Periodontol. 2021, 92, 419–427. [Google Scholar] [CrossRef] [PubMed]
- Galal, A.; Manson-Hing, L.; Jamison, H. A comparison of combinations of clinical and radiographic examinations in evaluation of a dental clinic population. Oral Surg. Oral Med. Oral Pathol. 1985, 60, 553–561. [Google Scholar] [CrossRef] [PubMed]
- Mao, Y.-C.; Chen, T.-Y.; Chou, H.-S.; Lin, S.-Y.; Liu, S.-Y.; Chen, Y.-A.; Liu, Y.-L.; Chen, C.-A.; Huang, Y.-C.; Chen, S.-L.; et al. Caries and Restoration Detection Using Bitewing Film Based on Transfer Learning with CNNs. Sensors 2021, 21, 4613. [Google Scholar] [CrossRef] [PubMed]
- Mao, Y.-C.; Huang, Y.-C.; Chen, T.-Y.; Li, K.-C.; Lin, Y.-J.; Liu, Y.-L.; Yan, H.-R.; Yang, Y.-J.; Chen, C.-A.; Chen, S.-L.; et al. Deep Learning for Dental Diagnosis: A Novel Approach to Furcation Involvement Detection on Periapical Radiographs. Bioengineering 2023, 10, 802. [Google Scholar] [CrossRef] [PubMed]
- Chen, Y.-C.; Chen, M.-Y.; Chen, T.-Y.; Chan, M.-L.; Huang, Y.-Y.; Liu, Y.-L.; Lee, P.-T.; Lin, G.-J.; Li, T.-F.; Chen, C.-A.; et al. Improving Dental Implant Outcomes: CNN-Based System Accurately Measures Degree of Peri-Implantitis Damage on Periapical Film. Bioengineering 2023, 10, 640. [Google Scholar] [CrossRef] [PubMed]
- Chuo, Y.; Lin, W.-M.; Chen, T.-Y.; Chan, M.-L.; Chang, Y.-S.; Lin, Y.-R.; Lin, Y.-J.; Shao, Y.-H.; Chen, C.-A.; Chen, S.-L.; et al. A High-Accuracy Detection System: Based on Transfer Learning for Apical Lesions on Periapical Radiograph. Bioengineering 2022, 9, 777. [Google Scholar] [CrossRef] [PubMed]
- Chen, S.-L.; Chen, T.-Y.; Mao, Y.-C.; Lin, S.-Y.; Huang, Y.-Y.; Chen, C.-A.; Lin, Y.-J.; Hsu, Y.-M.; Li, C.-A.; Chiang, W.-Y.; et al. Automated Detection System Based on Convolution Neural Networks for Retained Root, Endodontic Treated Teeth, and Implant Recognition on Dental Panoramic Images. IEEE Sens. J. 2022, 22, 23293–23306. [Google Scholar] [CrossRef]
- Chen, S.-L.; Chen, T.-Y.; Huang, Y.-C.; Chen, C.-A.; Chou, H.-S.; Huang, Y.-Y.; Lin, W.-C.; Li, T.-C.; Yuan, J.-J.; Abu, P.A.R.; et al. Missing Teeth and Restoration Detection Using Dental Panoramic Radiography Based on Transfer Learning with CNNs. IEEE Access 2022, 10, 118654–118664. [Google Scholar] [CrossRef]
- Bouchahma, M.; Ben Hammouda, S.; Kouki, S.; Alshemaili, M.; Samara, K. An Automatic Dental Decay Treatment Prediction using a Deep Convolutional Neural Network on X-Ray Images. In Proceedings of the 2019 IEEE/ACS 16th International Conference on Computer Systems and Applications (AICCSA), Abu Dhabi, United Arab Emirates, 3–7 November 2019; pp. 1–4. [Google Scholar] [CrossRef]
- Chen, S.-L.; Chen, T.-Y.; Mao, Y.-C.; Lin, S.-Y.; Huang, Y.-Y.; Chen, C.-A.; Lin, Y.-J.; Chuang, M.-H.; Abu, P.A.R. Detection of Various Dental Conditions on Dental Panoramic Radiography Using Faster R-CNN. IEEE Access 2023, 11, 127388–127401. [Google Scholar] [CrossRef]
- Gurses, A.; Oktay, A.B. Tooth Restoration and Dental Work Detection on Panoramic Dental Images via CNN. In Proceedings of the 2020 Medical Technologies Congress (TIPTEKNO), Antalya, Turkey, 19–20 November 2020; pp. 1–4. [Google Scholar] [CrossRef]
- Reis, D.; Kupec, J.; Hong, J.; Daoudi, A. Real-Time Flying Object Detection with YOLOv8. arXiv 2023, arXiv:2305.09972. [Google Scholar]
- Min, L.; Fan, Z.; Lv, Q.; Reda, M.; Shen, L.; Wang, B. YOLO-DCTI: Small Object Detection in Remote Sensing Base on Contextual Transformer Enhancement. Remote Sens. 2023, 15, 3970. [Google Scholar] [CrossRef]
- Ahmed, T.; Maaz, A.; Mahmood, D.; Abideen, Z.U.; Arshad, U.; Ali, R.H. The YOLOv8 Edge: Harnessing Custom Datasets for Superior Real-Time Detection. In Proceedings of the 2023 18th International Conference on Emerging Technologies (ICET), Peshawar, Pakistan, 6–7 November 2023; pp. 38–43. [Google Scholar] [CrossRef]
- Erdelyi, R.-A.; Duma, V.-F.; Sinescu, C.; Dobre, G.M.; Bradu, A.; Podoleanu, A. Dental Diagnosis and Treatment Assessments: Between X-rays Radiography and Optical Coherence Tomography. Materials 2020, 13, 4825. [Google Scholar] [CrossRef] [PubMed]
- Chen, S.-L.; Chou, H.-S.; Chuo, Y.; Lin, Y.-J.; Tsai, T.-H.; Peng, C.-H.; Tseng, A.-Y.; Li, K.-C.; Chen, C.-A.; Chen, T.-Y. Classification of the Relative Position between the Third Molar and the Inferior Alveolar Nerve Using a Convolutional Neural Network Based on Transfer Learning. Electronics 2024, 13, 702. [Google Scholar] [CrossRef]
- Orhan, K.; Belgin, C.A.; Manulis, D.; Golitsyna, M.; Bayrak, S.; Aksoy, S.; Sanders, A.; Önder, M.; Ezhov, M.; Shamshiev, M.; et al. Determining the reliability of diagnosis and treatment using artificial intelligence software with panoramic radiographs. Imaging Sci. Dent. 2023, 53, 199. [Google Scholar] [CrossRef] [PubMed]
- Mayerhoefer, M.E.; Materka, A.; Langs, G.; Häggström, I.; Szczypiński, P.; Gibbs, P.; Cook, G. Introduction to Radiomics. J. Nucl. Med. 2020, 61, 488–495. [Google Scholar] [CrossRef]
- George, J.; Hemanth, T.S.; Raju, J.; Mattapallil, J.G.; Naveen, N. Dental Radiography Analysis and Diagnosis using YOLOv8. In Proceedings of the 2023 9th International Conference on Smart Computing and Communications (ICSCC), Kochi, India, 17–19 August 2023; pp. 102–107. [Google Scholar] [CrossRef]
- Büttner, M.; Schneider, L.; Krasowski, A.; Krois, J.; Feldberg, B.; Schwendicke, F. Impact of Noisy Labels on Dental Deep Learning—Calculus Detection on Bitewing Radiographs. J. Clin. Med. 2023, 12, 3058. [Google Scholar] [CrossRef]
Disclaimer/Publisher’s Note: The statements, opinions and data contained in all publications are solely those of the individual author(s) and contributor(s) and not of MDPI and/or the editor(s). MDPI and/or the editor(s) disclaim responsibility for any injury to people or property resulting from any ideas, methods, instructions or products referred to in the content. |
© 2024 by the authors. Licensee MDPI, Basel, Switzerland. This article is an open access article distributed under the terms and conditions of the Creative Commons Attribution (CC BY) license (https://creativecommons.org/licenses/by/4.0/).
