
Improving Generalizability of PET DL Algorithms: List-Mode Reconstructions Improve DOTATATE PET Hepatic Lesion Detection Performance

 ,
, 
Abstract
1. Introduction
2. Materials and Methods
2.1. Image Acquisition and Datasets
2.2. Image Segmentation and Lesion Contours
2.3. Quantification of Image Noise
2.4. Network Architecture
2.5. Statistical Analysis
3. Results
4. Discussion
5. Conclusions
Supplementary Materials
Author Contributions
Funding
Institutional Review Board Statement
Informed Consent Statement
Data Availability Statement
Conflicts of Interest
References
- Sanli, Y.; Garg, I.; Kandathil, A.; Kendi, T.; Zanetti, M.J.B.; Kuyumcu, S.; Subramaniam, R.M. Neuroendocrine tumor diagnosis and management: 68Ga-DOTATATE PET/CT. Am. J. Roentgenol. 2018, 211, 267–277. [Google Scholar] [CrossRef]
- Kayani, I.; Conry, B.G.; Groves, A.M.; Win, T.; Dickson, J.; Caplin, M.; Bomanji, J.B. A comparison of 68Ga-DOTATATE and 18F-FDG PET/CT in pulmonary neuroendocrine tumors. J. Nucl. Med. 2009, 50, 1927–1932. [Google Scholar] [CrossRef]
- Sadowski, S.M.; Neychev, V.; Millo, C.; Shih, J.; Nilubol, N.; Herscovitch, P.; Pacak, K.; Marx, S.J.; Kebebew, E. Prospective study of 68Ga-DOTATATE positron emission tomography/computed tomography for detecting gastro-entero-pancreatic neuroendocrine tumors and unknown primary sites. J. Clin. Oncol. 2016, 34, 588. [Google Scholar] [CrossRef]
- Hatt, M.; Lee, J.A.; Schmidtlein, C.R.; Naqa, I.E.; Caldwell, C.; De Bernardi, E.; Lu, W.; Das, S.; Geets, X.; Gregoire, V.; et al. Classification and evaluation strategies of auto-segmentation approaches for PET: Report of AAPM task group no. 211. Med. Phys. 2017, 44, 1–42. [Google Scholar] [CrossRef]
- Hatt, M.; Laurent, B.; Ouahabi, A.; Fayad, H.; Tan, S.; Li, L.; Lu, W.; Jaouen, V.; Tauber, C.; Czakon, J.; et al. The first MICCAI challenge on pet tumor segmentation. Med. Image Anal. 2018, 44, 177–195. [Google Scholar] [CrossRef] [PubMed]
- Sibille, L.; Seifert, R.; Avramovic, N.; Vehren, T.; Spottiswoode, B.; Zuehlsdorff, S.; Schäfers, M. 18F-FDG PET/CT uptake classification in lymphoma and lung cancer by using deep convolutional neural networks. Radiology 2020, 294, 445–452. [Google Scholar] [CrossRef] [PubMed]
- Weisman, A.J.; Kim, J.; Lee, I.; McCarten, K.M.; Kessel, S.; Schwartz, C.L.; Kelly, K.M.; Jeraj, R.; Cho, S.Y.; Bradshaw, T.J. Automated quantification of baseline imaging pet metrics on FDG PET/CT images of pediatric Hodgkin lymphoma patients. EJNMMI Phys. 2020, 7, 1–12. [Google Scholar] [CrossRef] [PubMed]
- Leung, K.H.; Rowe, S.P.; Leal, J.P.; Ashrafinia, S.; Sadaghiani, M.S.; Chung, H.W.; Dalaie, P.; Tulbah, R.; Yin, Y.; VanDenBerg, R.; et al. Deep learning and radiomics framework for psma-rads classification of prostate cancer on PSMA PET. EJNMMI Res. 2022, 12, 1–15. [Google Scholar] [CrossRef] [PubMed]
- Nickols, N.; Anand, A.; Johnsson, K.; Brynolfsson, J.; Borreli, P.; Parikh, N.; Juarez, J.; Jafari, L.; Eiber, M.; Rettig, M. Apromise: A novel automated promise platform to standardize evaluation of tumor burden in 18F-DCFPyL images of veterans with prostate cancer. J. Nucl. Med. 2022, 63, 233–239. [Google Scholar] [CrossRef]
- Johnsson, K.; Brynolfsson, J.; Sahlstedt, H.; Nickols, N.G.; Rettig, M.; Probst, S.; Morris, M.J.; Bjartell, A.; Eiber, M.; Anand, A. Analytical performance of aPROMISE: Automated anatomic contextualization, detection, and quantification of [18f] DCFPyL(PSMA) imaging for standardized reporting. Eur. J. Nucl. Med. Mol. Imaging 2022, 49, 1041–1051. [Google Scholar] [CrossRef] [PubMed]
- Zhao, Y.; Gafita, A.; Vollnberg, B.; Tetteh, G.; Haupt, F.; Afshar-Oromieh, A.; Menze, B.; Eiber, M.; Rominger, A.; Shi, K. Deep neural network for automatic characterization of lesions on 68 Ga-PSMA-11 PET/CT. Eur. J. Nucl. Med. Mol. Imaging 2020, 47, 603–613. [Google Scholar] [CrossRef]
- Wehrend, J.; Silosky, M.; Xing, F.; Chin, B.B. Automated liver lesion detection in 68Ga DOTATATE PET/CT using a deep fully convolutional neural network. EJNMMI Res. 2021, 11, 1–11. [Google Scholar] [CrossRef]
- Saha, G.B.; Saha, G.B. Performance characteristics of pet scanners. In Basics of PET Imaging: Physics, Chemistry, and Regulations; Springer: Berlin/Heidelberg, Germany, 2010; pp. 97–116. [Google Scholar]
- Silosky, M.; Xing, F.; Wehrend, J.; Litwiller, D.V.; Metzler, S.D.; Chin, B.B. Modeling contrast-to-noise ratio from list-mode reconstructions of 68Ga DOTATATE PET/CT: Predicting detectability of hepatic metastases in shorter acquisition PET reconstructions. Am. J. Nucl. Med. Mol. Imaging 2023, 13, 33. [Google Scholar] [PubMed]
- Zhang, Z.; Rose, S.; Ye, J.; Perkins, A.E.; Chen, B.; Kao, C.-M.; Sidky, E.Y.; Tung, C.-H.; Pan, X. Optimization-based image reconstruction from low-count, list-mode TOF-PET data. IEEE Trans. Biomed. Eng. 2018, 65, 936–946. [Google Scholar] [PubMed]
- Wielaard, J.; Habraken, J.; Brinks, P.; Lavalaye, J.; Boellaard, R. Optimization of injected 68 Ga-PSMA activity based on list-mode phantom data and clinical validation. EJNMMI Phys. 2020, 7, 1–12. [Google Scholar] [CrossRef] [PubMed]
- Leung, K.H.; Marashdeh, W.; Wray, R.; Ashrafinia, S.; Pomper, M.G.; Rahmim, A.; Jha, A.K. A physics-guided modular deep-learning based automated framework for tumor segmentation in PET. Phys. Med. Biol. 2020, 65, 245032. [Google Scholar] [CrossRef] [PubMed]
- He, K.; Zhang, X.; Ren, S.; Sun, J. Deep residual learning for image recognition. In Proceedings of the IEEE Conference on Computer Vision and Pattern Recognition, Las Vegas, NV, USA, 27–30 June 2016; pp. 770–778. [Google Scholar]
- Dumoulin, V.; Visin, F. A guide to convolution arithmetic for deep learning. arXiv 2016, arXiv:1603.07285. [Google Scholar]
- Chen, H.; Qi, X.; Yu, L.; Heng, P.-A. Dcan: Deep contour-aware networks for accurate gland segmentation. In Proceedings of the IEEE Conference on Computer Vision and Pattern Recognition, Las Vegas, NV, USA, 27–30 June 2016; pp. 2487–2496. [Google Scholar]
- Taghanaki, S.A.; Zheng, Y.; Zhou, S.K.; Georgescu, B.; Sharma, P.; Xu, D.; Comaniciu, D.; Hamarneh, G. Combo loss: Handling input and output imbalance in multi-organ segmentation. Comput. Med. Imaging Graph. 2019, 75, 24–33. [Google Scholar] [CrossRef] [PubMed]
- Kuhn, H.W. The hungarian method for the assignment problem. Nav. Res. Logist. Q. 1955, 2, 83–97. [Google Scholar] [CrossRef]
- Heydarheydari, S.; Birgani, M.J.T.; Rezaeijo, S.M. Auto-Segmentation of Head and Neck Tumors in Positron Emission Tomography Images Using Non-Local Means and Morphological Frameworks. Pol. J. Radiol. 2023, 88, e365–e370. [Google Scholar] [CrossRef]
- Khanfari, H.; Mehranfar, S.; Cheki, M.; Sadr, M.M.; Moniri, S.; Heydarheydari, S.; Rezaeijo, S.M. Exploring the Efficacy of Multi-Flavored Feature Extraction with Radiomics and Deep Features for Prostate Cancer Grading on Mpmri. BMC Med. Imaging 2023, 23, 195. [Google Scholar] [CrossRef] [PubMed]
- Yang, X.; Chin, B.B.; Silosky, M.; Wehrend, J.; Litwiller, D.V.; Ghosh, D.; Xing, F. Learning without Real Data Annotations to Detect Hepatic Lesions in Pet Images. IEEE Trans. Biomed. Eng. 2024, 71, 679–688. [Google Scholar] [CrossRef] [PubMed]
- Xing, F.; Silosky, M.; Ghosh, D.; Chin, B.B. Location-Aware Encoding for Lesion Detection in (68)Ga-Dotatate Positron Emission Tomography Images. IEEE Trans. Biomed. Eng. 2024, 71, 247–257. (In English) [Google Scholar] [CrossRef] [PubMed]
- Yang, X.; Chin, B.B.; Silosky, M.; Wehrend, J.; Litwiller, D.; Ghosh, D.; Xing, F. Learning with Synthesized Data for Generalizable Lesion Detection in Real Pet Images. In Proceedings of the IEEE Medical Image Computing and Computer Assisted Interventions, Vancouver, BC, Canada, 8–12 October 2023; pp. 116–126. [Google Scholar]


| Parameter | Value |
|---|---|
| Mean age (years) | 61.4 (14.09) |
| Women | 61.4 |
| Men | 61.2 |
| Sex (no. of patients) | |
| Women | 40 (48%) |
| Men | 43 (52%) |
| Tumor present in liver | |
| Yes | 41 (49%) |
| No | 42 (51%) |
| Primary tumor site | |
| Small bowel | 32 (38%) |
| Pancreas | 25 (30%) |
| Stomach | 5 (6.5%) |
| Lung | 5 (6.5%) |
| Head and neck | 5 (6.5%) |
| Large bowel | 2 (2%) |
| Adrenal | 3 (3%) |
| None (normal scan) | 6 (7.5%) |
| Ki-67 index | |
| Low/intermediate grade (20%) | 51 (62%) |
| High grade (>20%) | 1 (1%) |
| No pathology report | 31 (37%) |
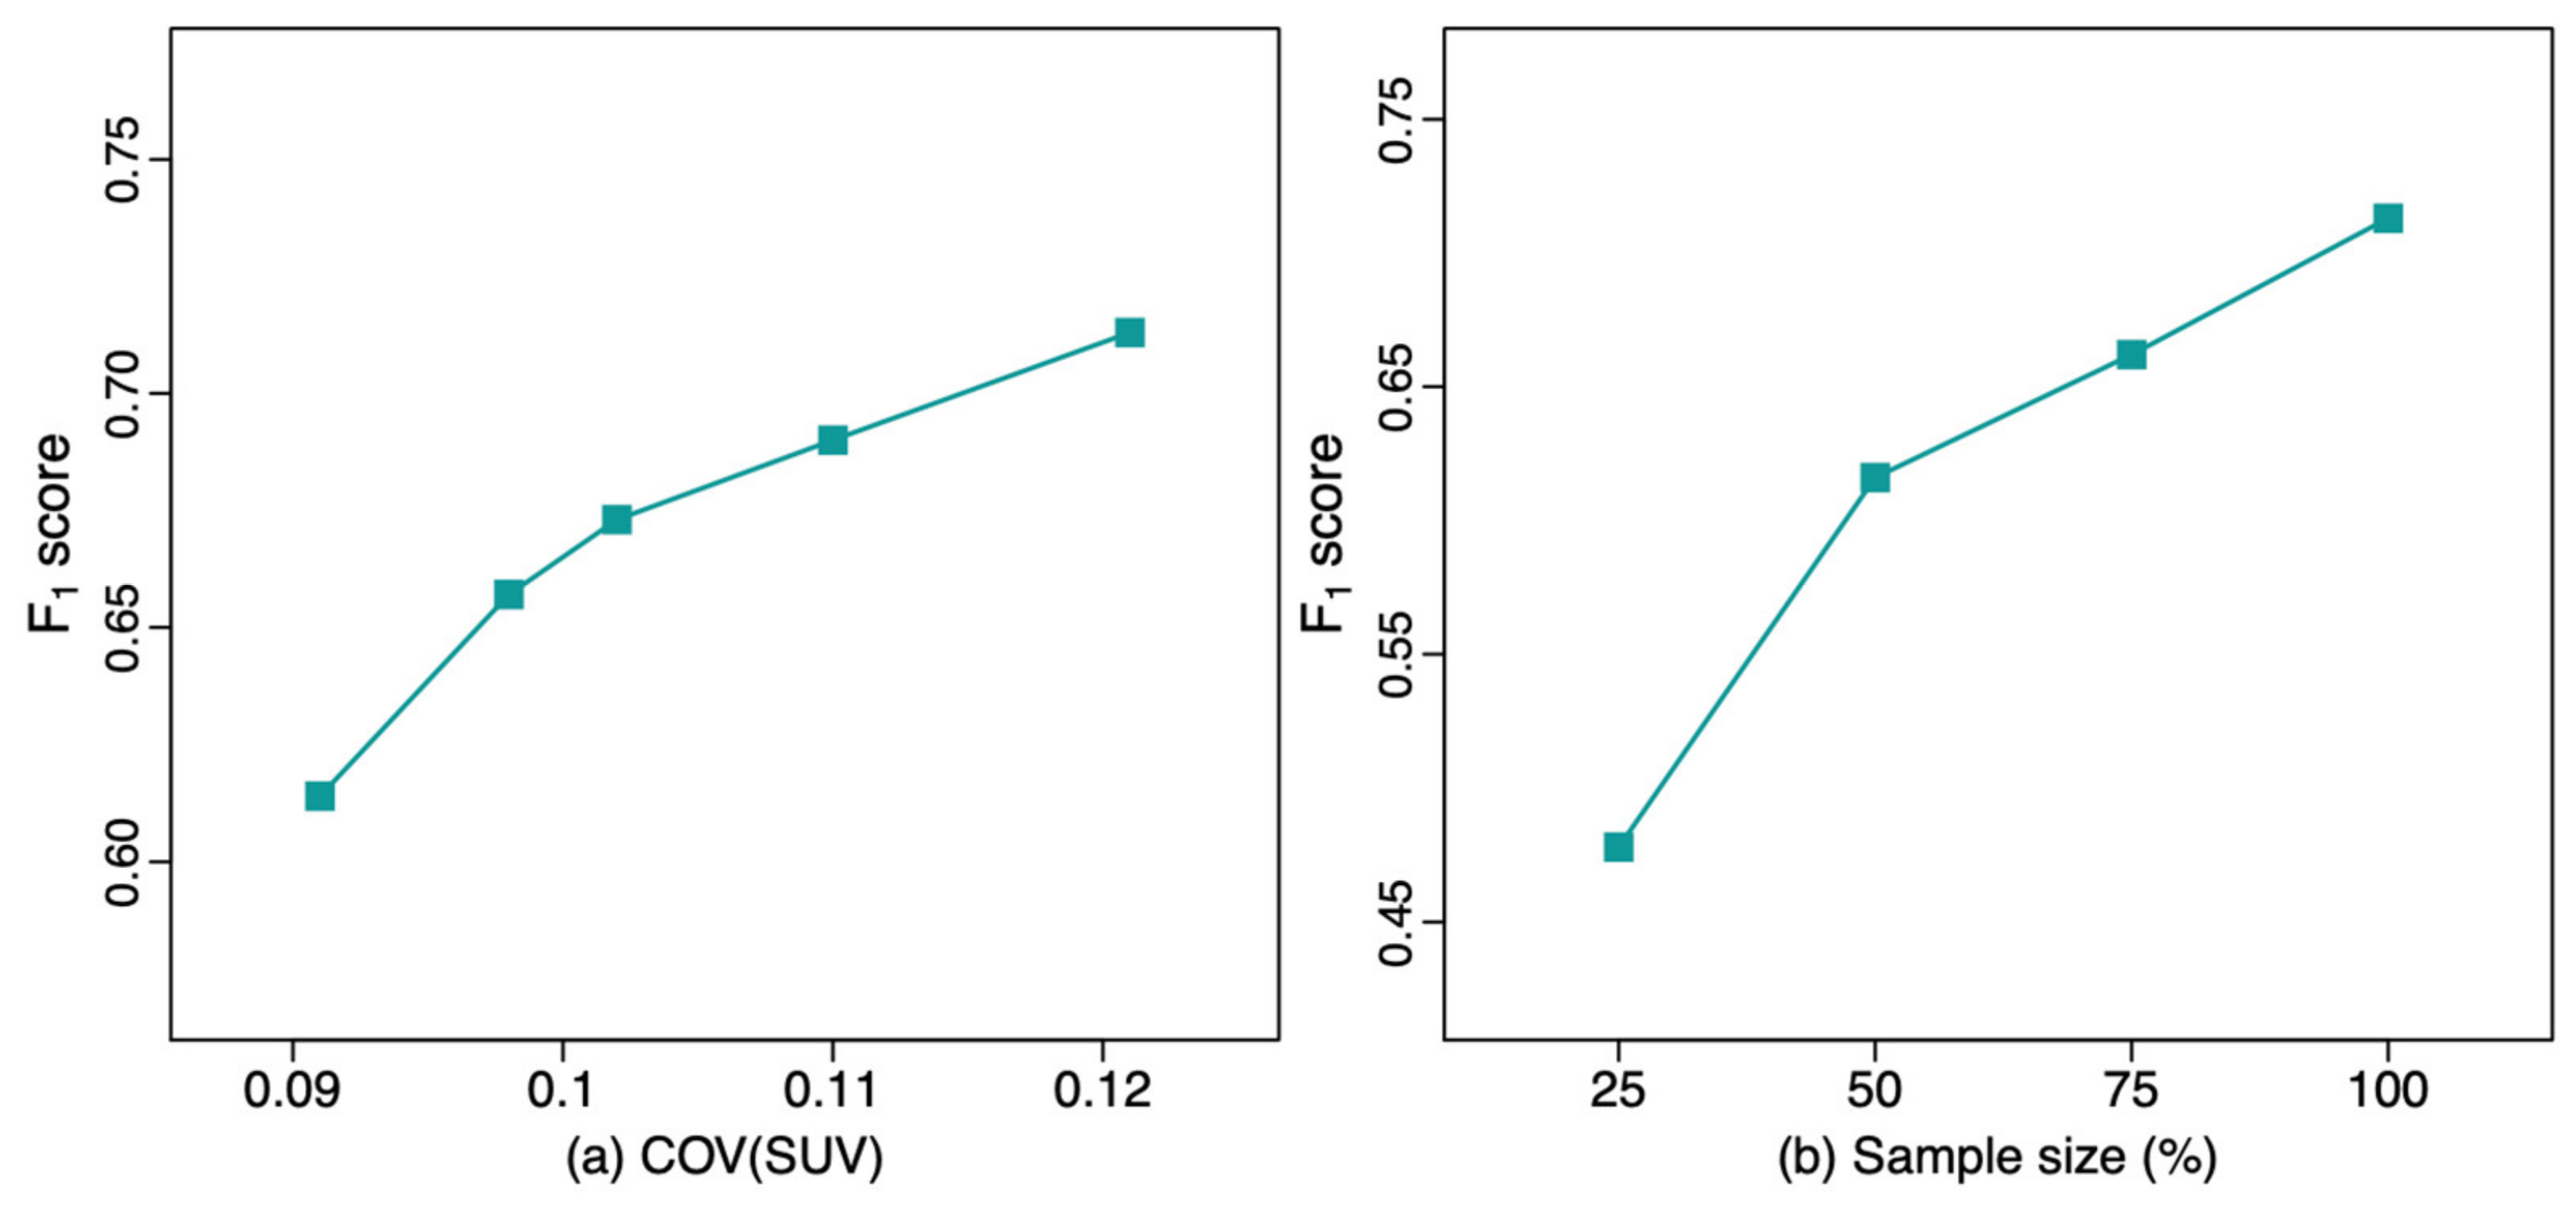
| Training Set | COV | F1 | PPV | Sensitivity |
|---|---|---|---|---|
| Set1 Q.Clear | 0.091 (0.027) | 0.614 * (0.052) | 0.706 (0.119) | 0.565 (0.111) |
| Set1 VPFXS 5 min | 0.098 (0.027) | 0.657 * (0.033) | 0.637 (0.105) | 0.695 (0.059) |
| Set1 VPFXS 4 min | 0.102 (0.027) | 0.673 * (0.027) | 0.663 (0.087) | 0.694 (0.048) |
| Set1 VPFXS 3 min | 0.110 (0.029) | 0.690 (0.034) | 0.707 (0.087) | 0.681 (0.025) |
| Set1 VPFXS 2 min | 0.121 (0.030) | 0.713 (0.028) | 0.758 (0.087) | 0.680 (0.039) |
| Set2 | 0.198 (0.040) | 0.755 (0.043) | 0.817 (0.036) | 0.706 (0.070) |
| Training Sample Size | F1 | PPV | Sensitivity |
|---|---|---|---|
| 25% Set1 VPFXS 2 min | 0.478 * (0.044) | 0.620 (0.049) | 0.392 (0.055) |
| 50% Set1 VPFXS 2 min | 0.616 * (0.046) | 0.882 (0.028) | 0.475 (0.054) |
| 75% Set1 VPFXS 2 min | 0.662 * (0.019) | 0.745 (0.051) | 0.598 (0.031) |
| 100% Set1 VPFXS 2 min | 0.713 (0.028) | 0.758 (0.087) | 0.680 (0.039) |
Disclaimer/Publisher’s Note: The statements, opinions and data contained in all publications are solely those of the individual author(s) and contributor(s) and not of MDPI and/or the editor(s). MDPI and/or the editor(s) disclaim responsibility for any injury to people or property resulting from any ideas, methods, instructions or products referred to in the content. |
© 2024 by the authors. Licensee MDPI, Basel, Switzerland. This article is an open access article distributed under the terms and conditions of the Creative Commons Attribution (CC BY) license (https://creativecommons.org/licenses/by/4.0/).
Share and Cite
Yang, X.; Silosky, M.; Wehrend, J.; Litwiller, D.V.; Nachiappan, M.; Metzler, S.D.; Ghosh, D.; Xing, F.; Chin, B.B. Improving Generalizability of PET DL Algorithms: List-Mode Reconstructions Improve DOTATATE PET Hepatic Lesion Detection Performance. Bioengineering 2024, 11, 226. https://doi.org/10.3390/bioengineering11030226
Yang X, Silosky M, Wehrend J, Litwiller DV, Nachiappan M, Metzler SD, Ghosh D, Xing F, Chin BB. Improving Generalizability of PET DL Algorithms: List-Mode Reconstructions Improve DOTATATE PET Hepatic Lesion Detection Performance. Bioengineering. 2024; 11(3):226. https://doi.org/10.3390/bioengineering11030226
Chicago/Turabian StyleYang, Xinyi, Michael Silosky, Jonathan Wehrend, Daniel V. Litwiller, Muthiah Nachiappan, Scott D. Metzler, Debashis Ghosh, Fuyong Xing, and Bennett B. Chin. 2024. "Improving Generalizability of PET DL Algorithms: List-Mode Reconstructions Improve DOTATATE PET Hepatic Lesion Detection Performance" Bioengineering 11, no. 3: 226. https://doi.org/10.3390/bioengineering11030226
APA StyleYang, X., Silosky, M., Wehrend, J., Litwiller, D. V., Nachiappan, M., Metzler, S. D., Ghosh, D., Xing, F., & Chin, B. B. (2024). Improving Generalizability of PET DL Algorithms: List-Mode Reconstructions Improve DOTATATE PET Hepatic Lesion Detection Performance. Bioengineering, 11(3), 226. https://doi.org/10.3390/bioengineering11030226