
Raman Handheld Versus Microscopic Spectroscopy for Estimating the Post-Mortem Interval of Human Bones: A Comparative Pilot Study

 ,
, 
 , ,
, ,  , ,
, ,
Abstract
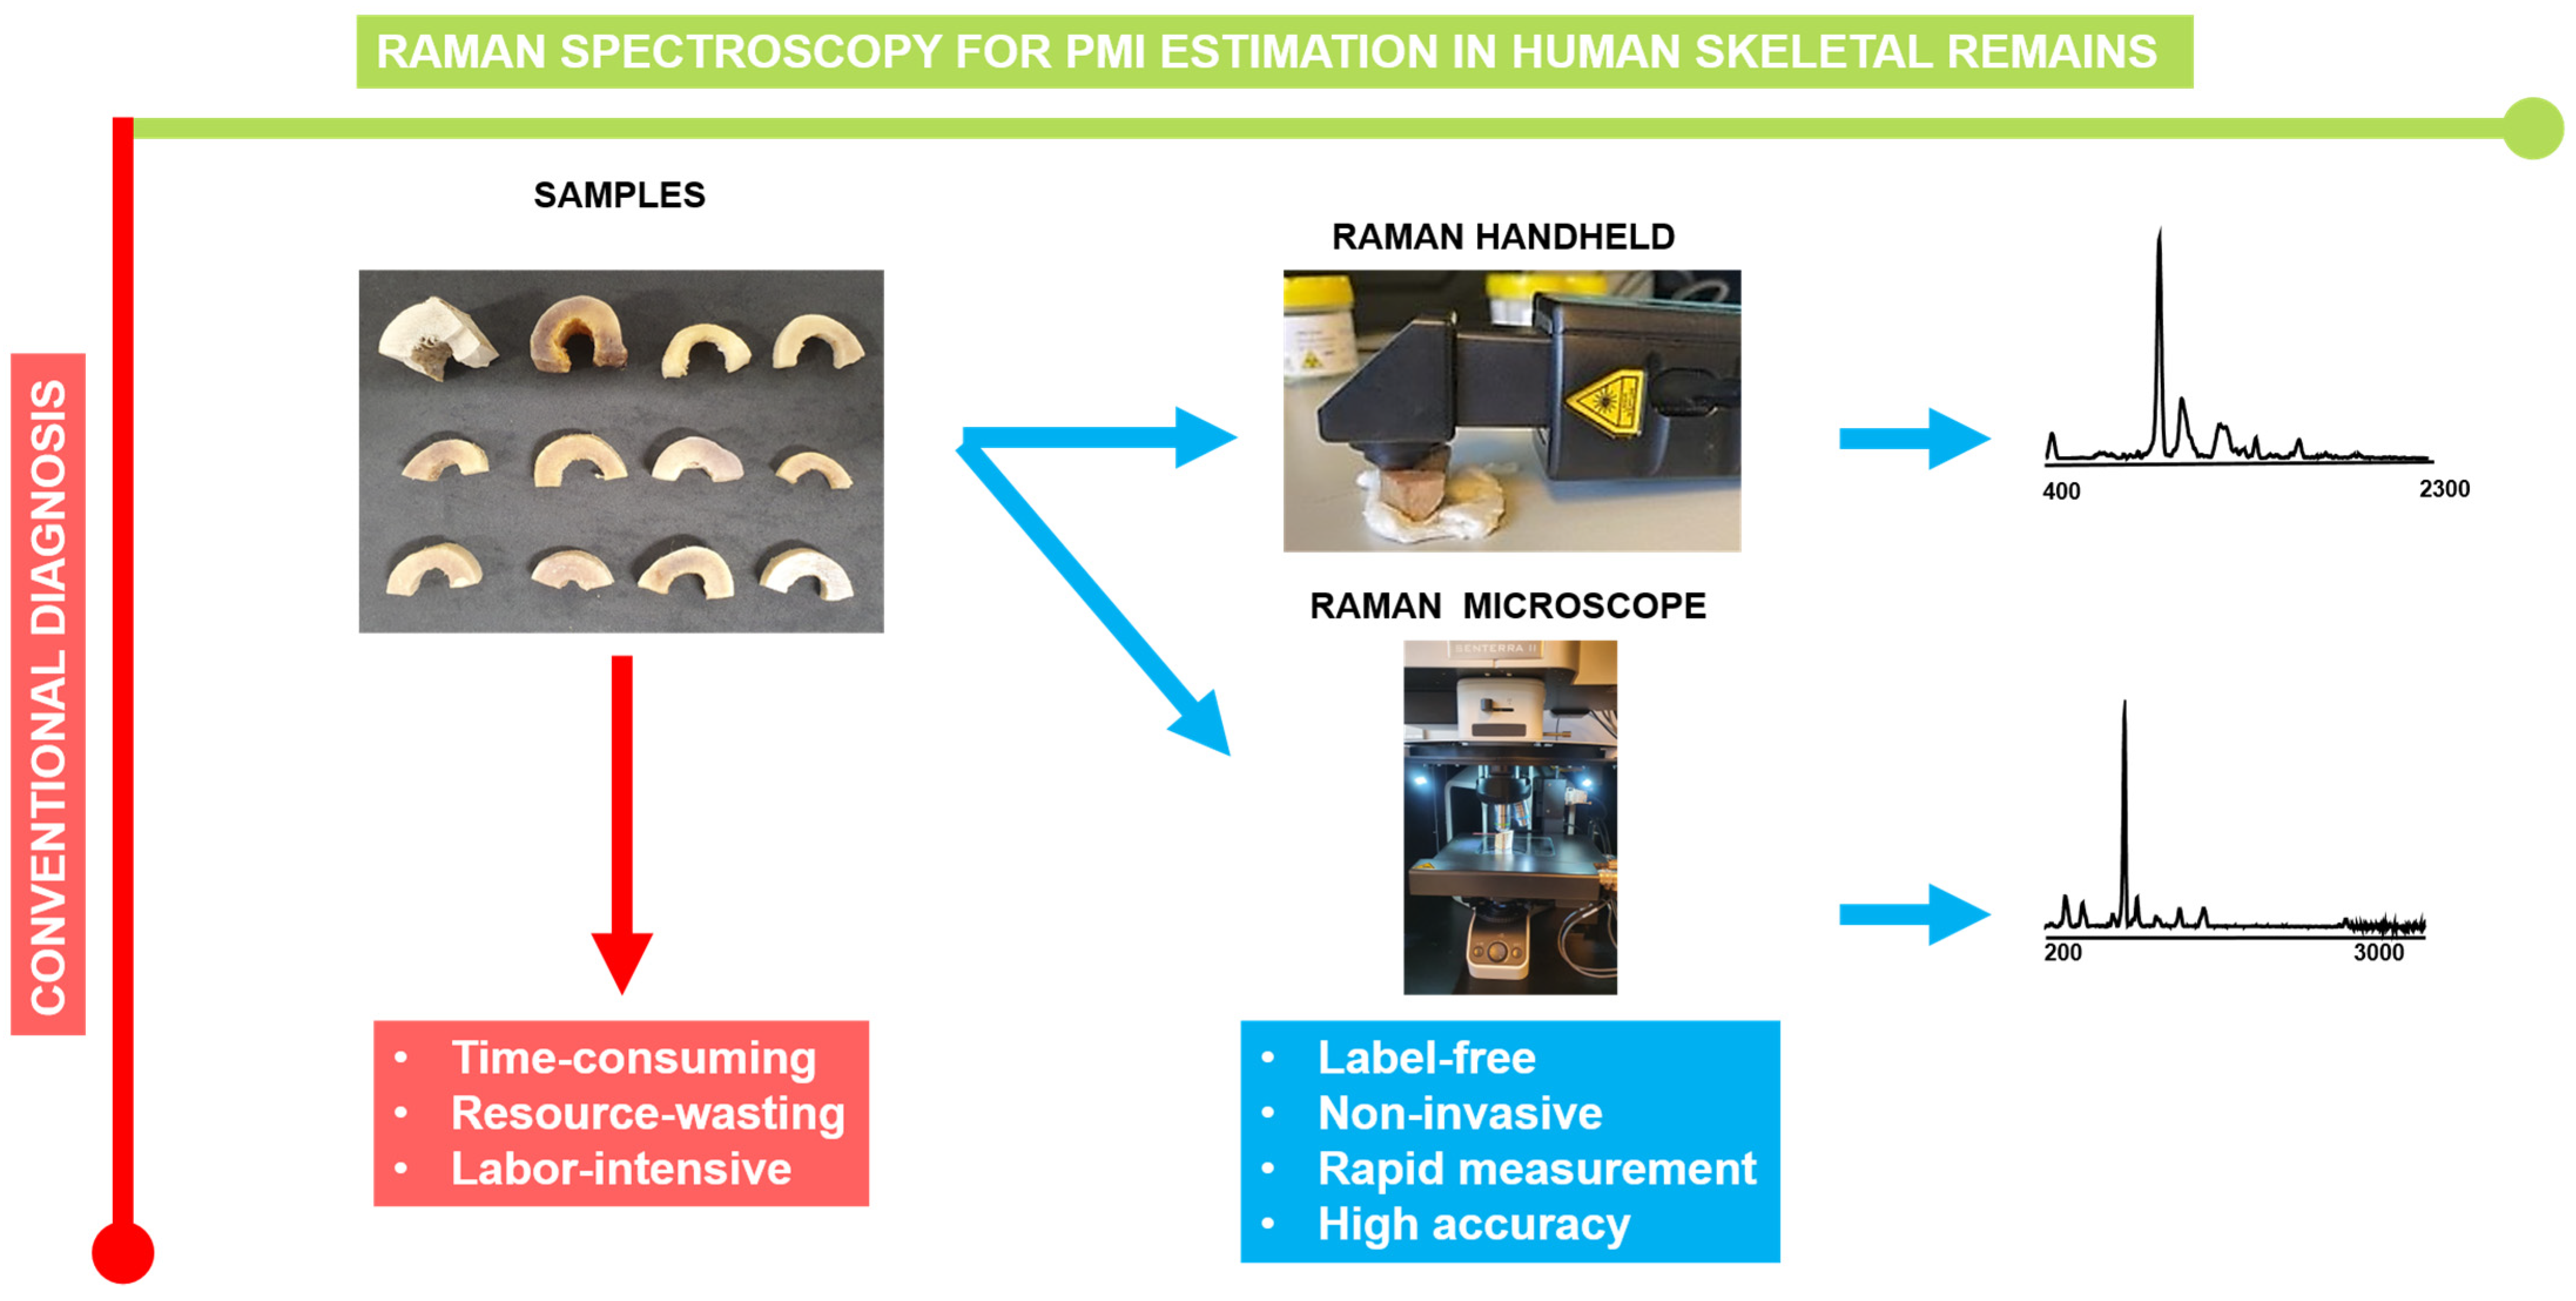
1. Introduction
2. Materials and Methods
2.1. Human Bone Samples
2.2. Handheld Measurements
2.3. Micro-Raman Spectrtoscopy
2.4. Data Processing
2.5. Principal Component Analyses: Modelling of Spectral Data
3. Results
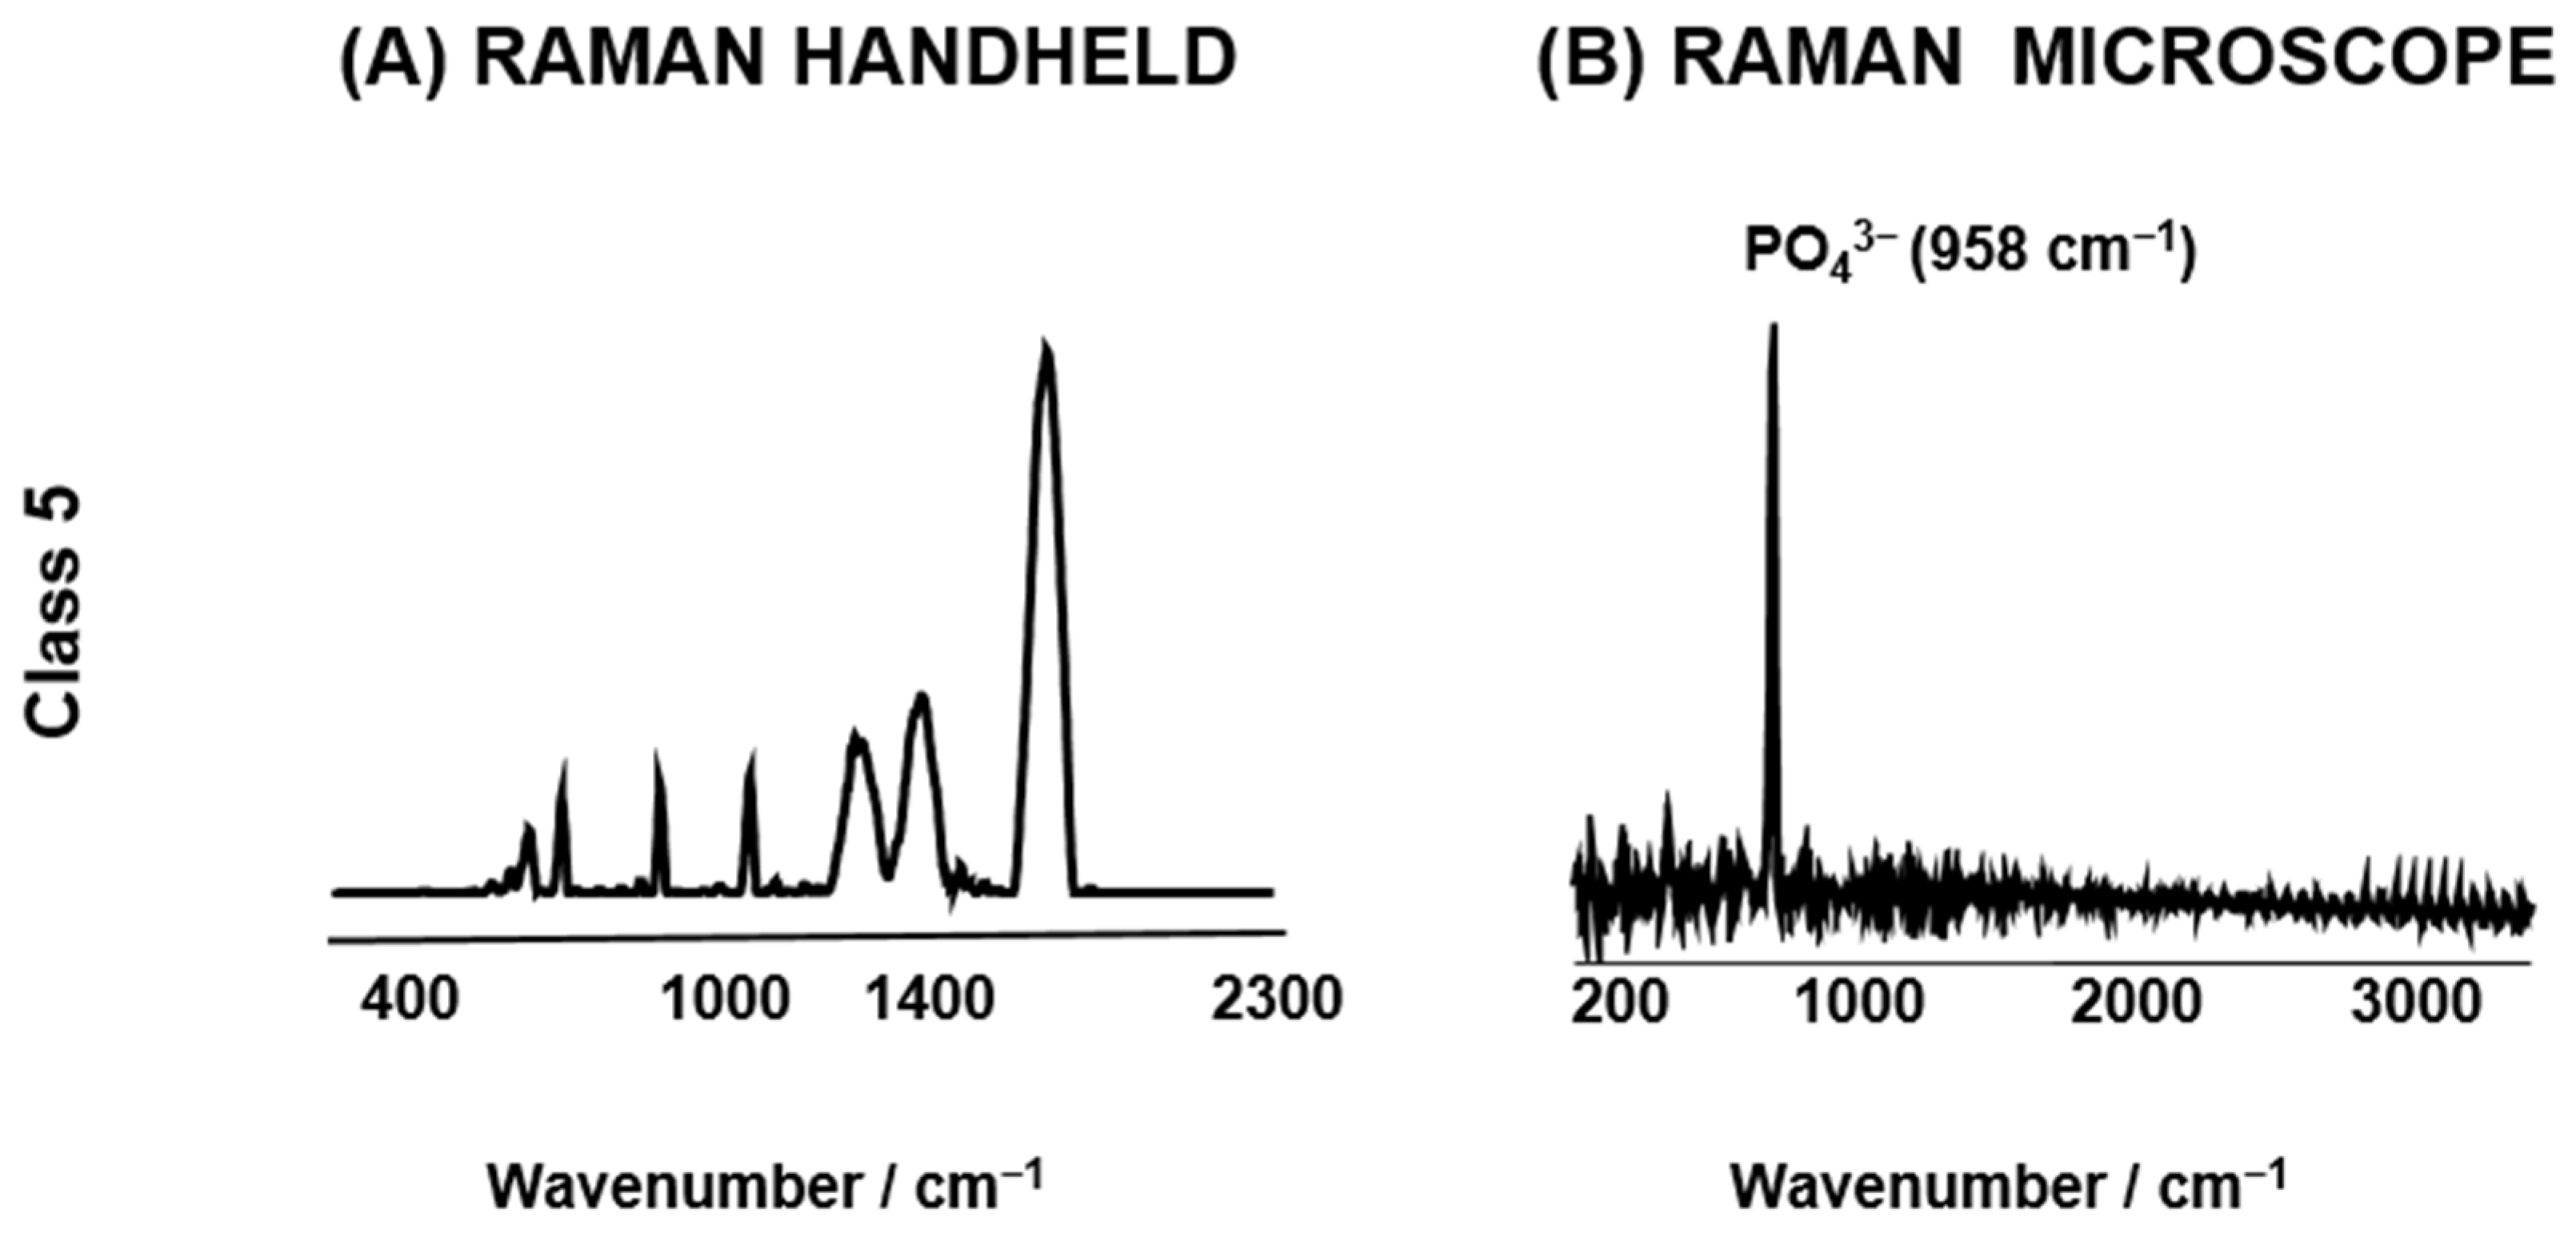
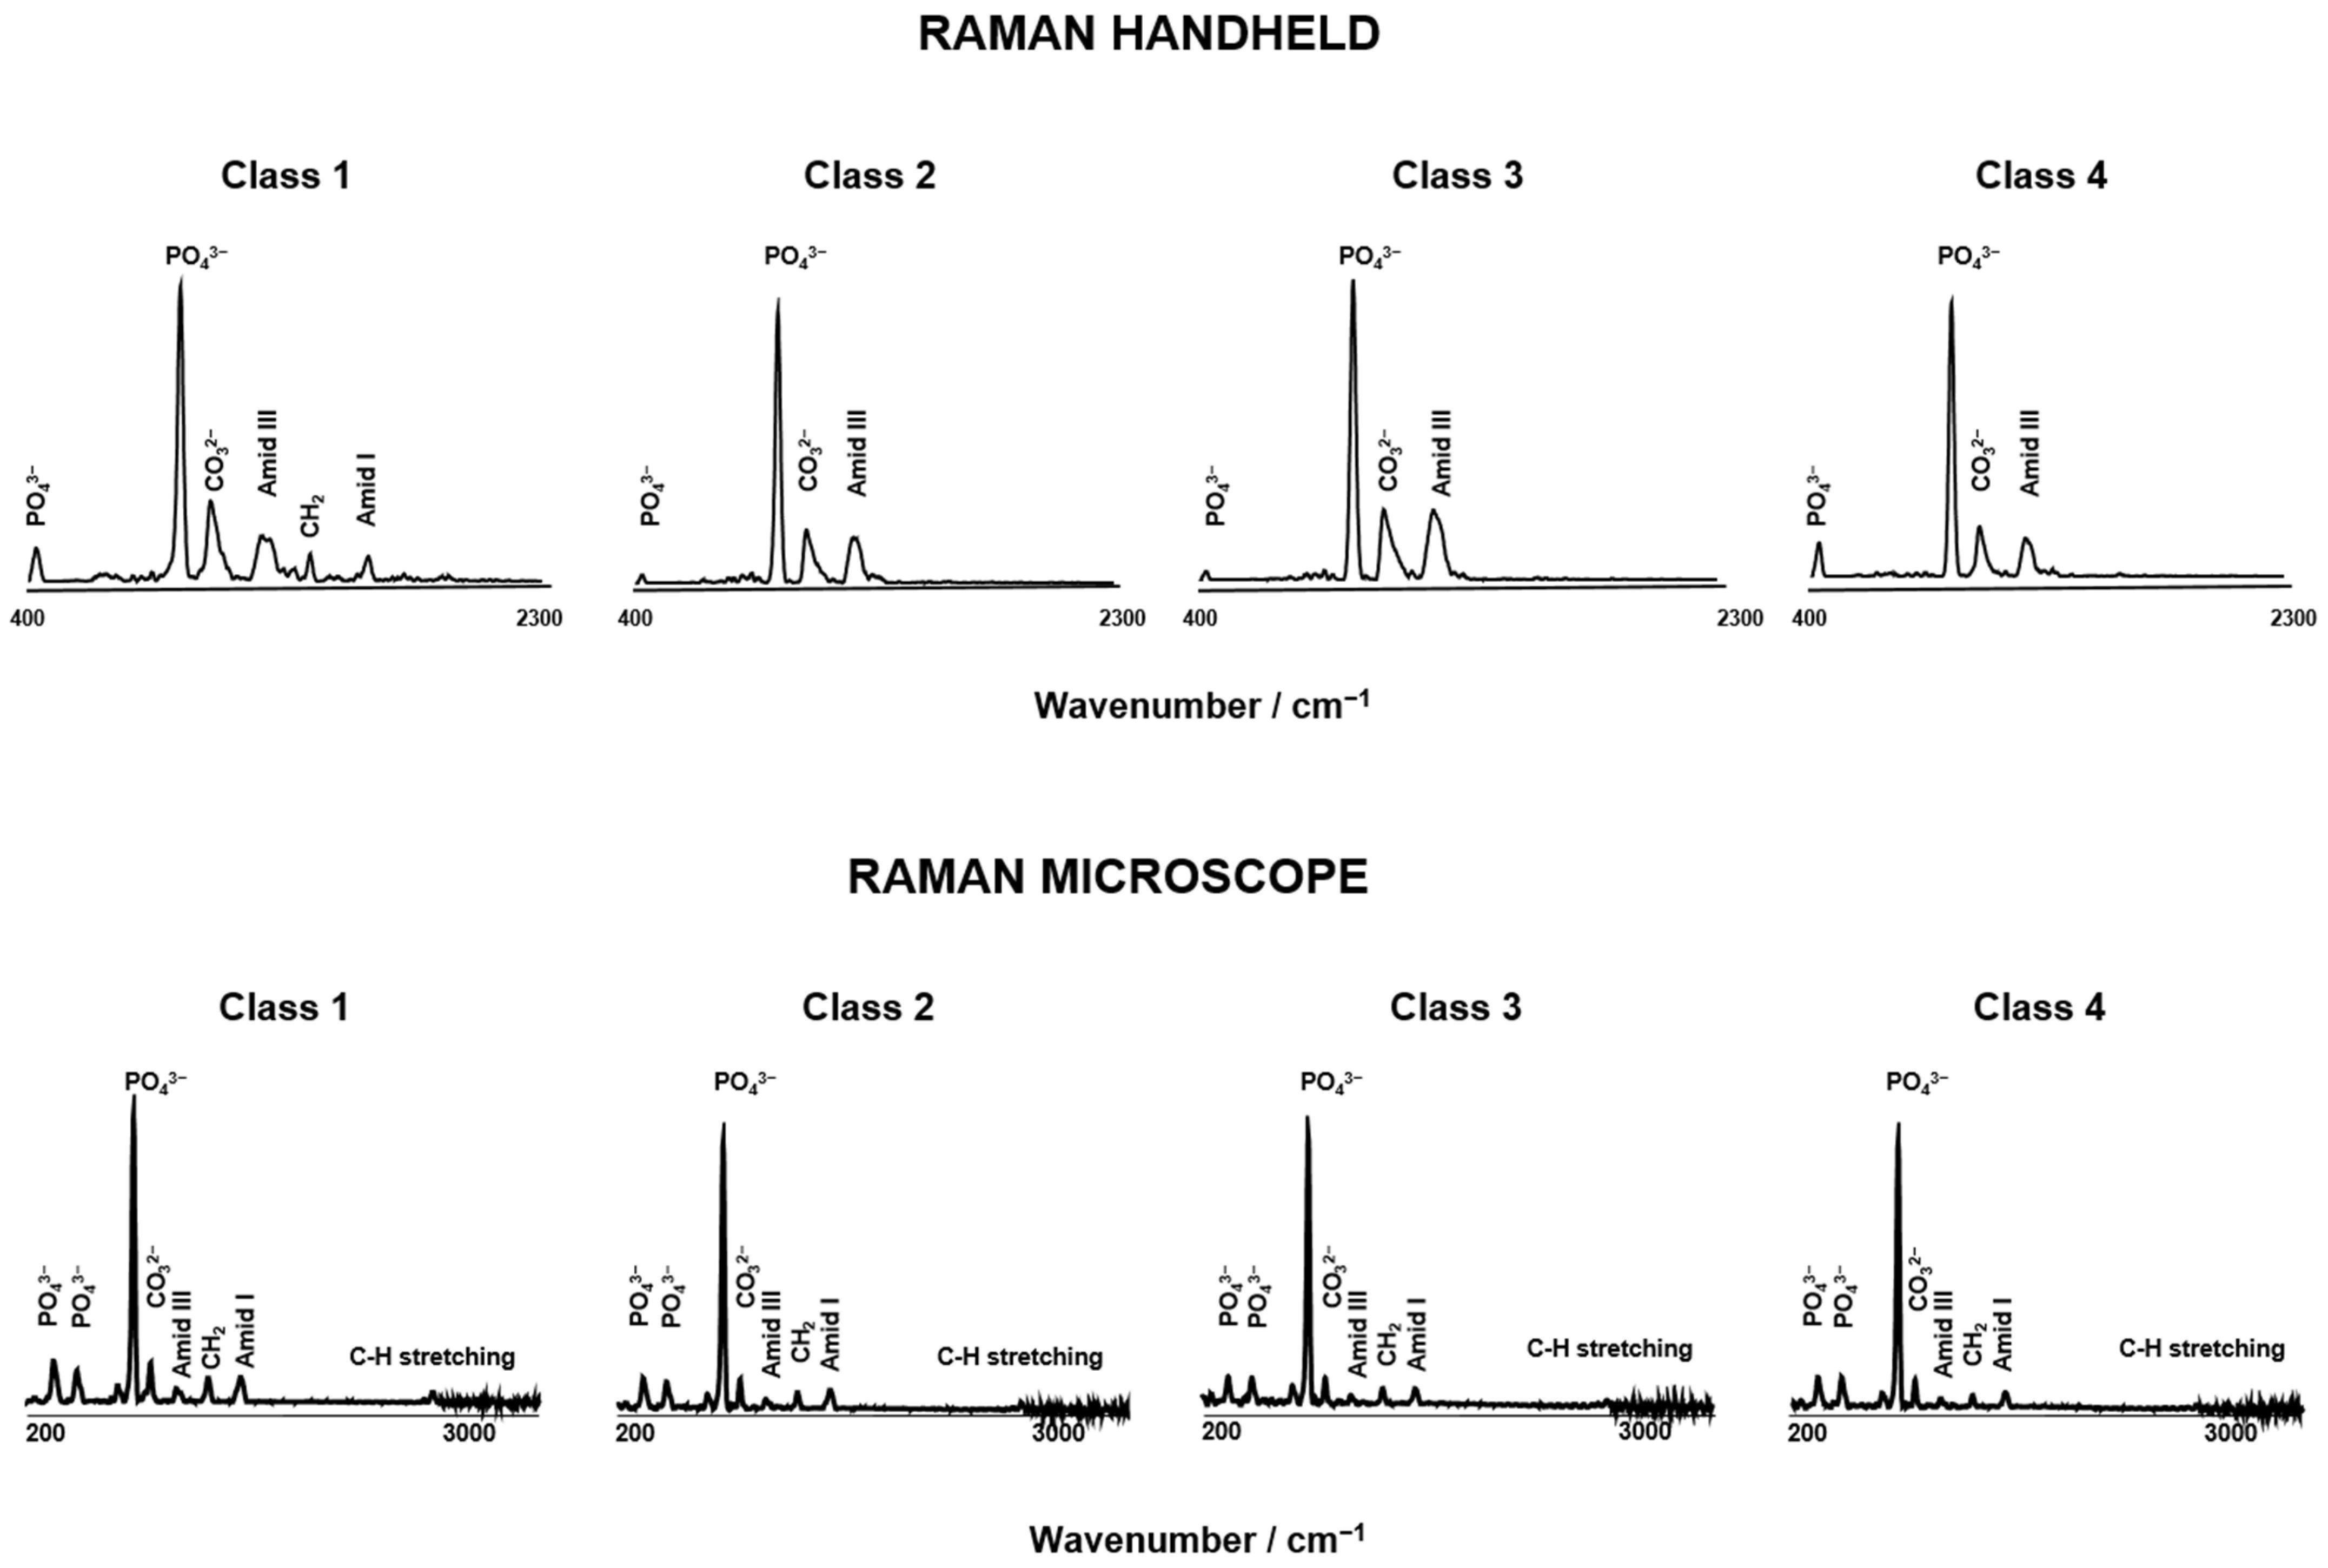
3.1. Spectroscopy Data Evaluation
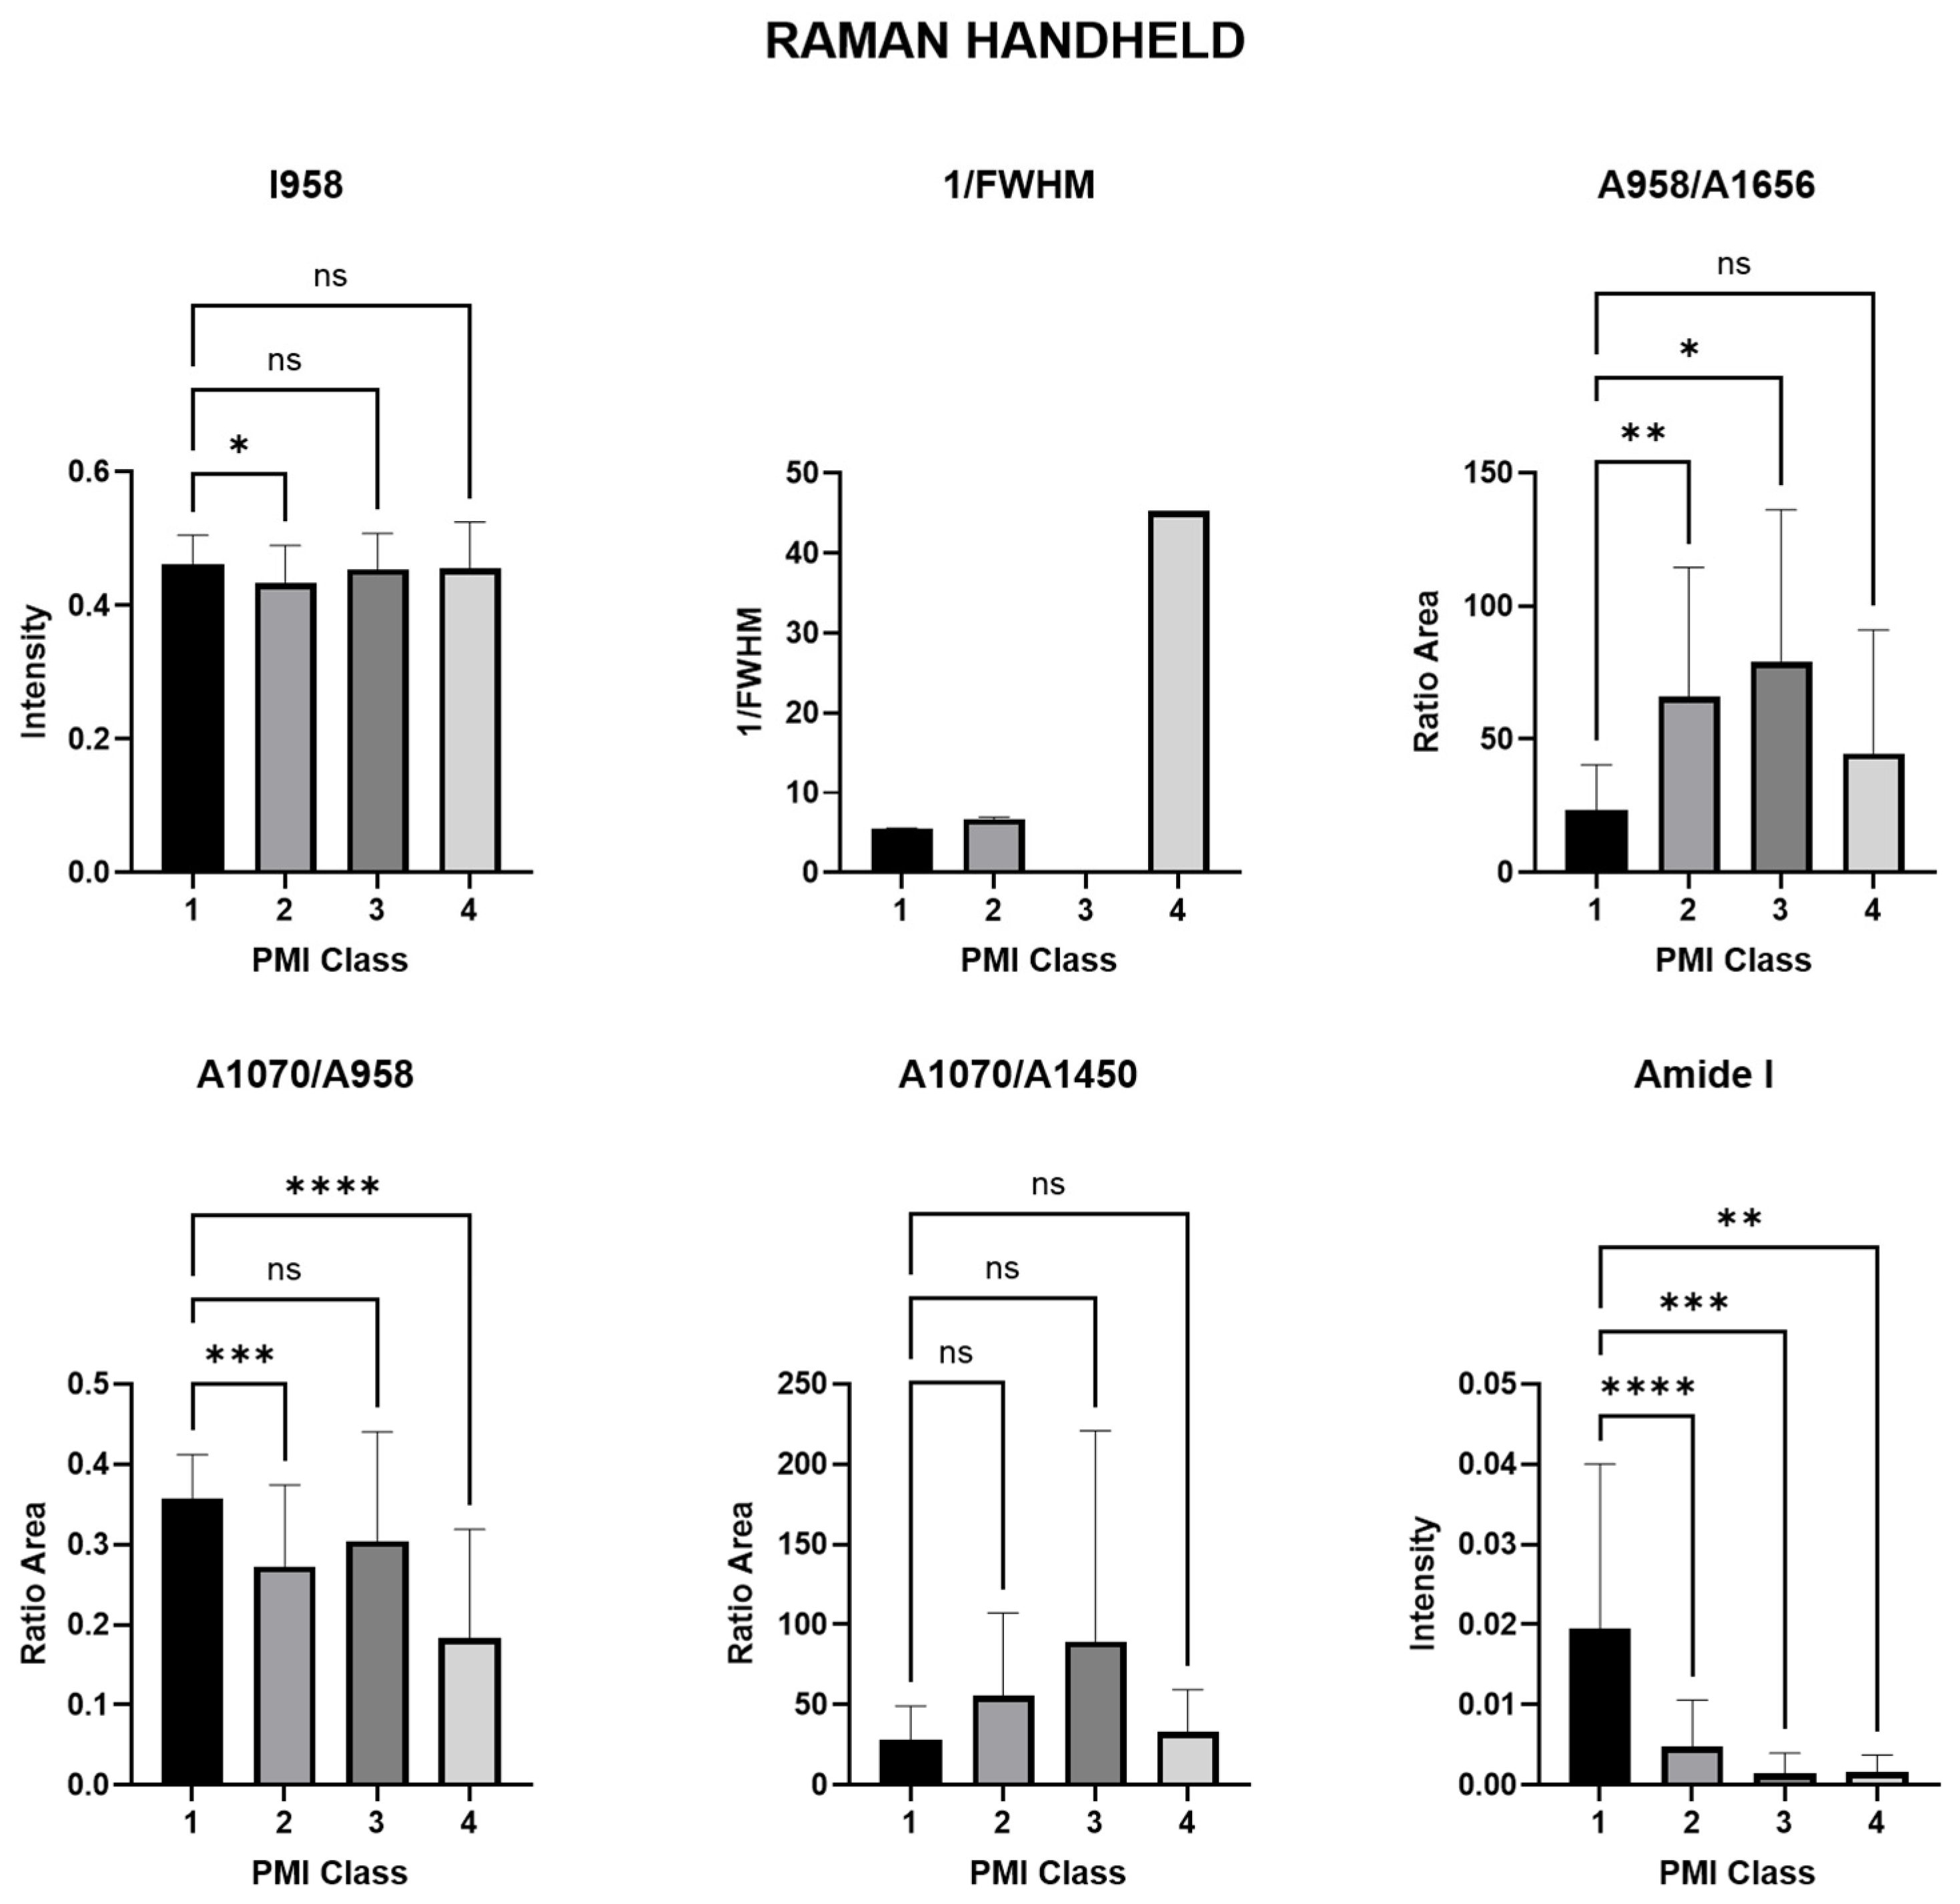
3.1.1. Raman Spectra Parameters for Raman Handheld
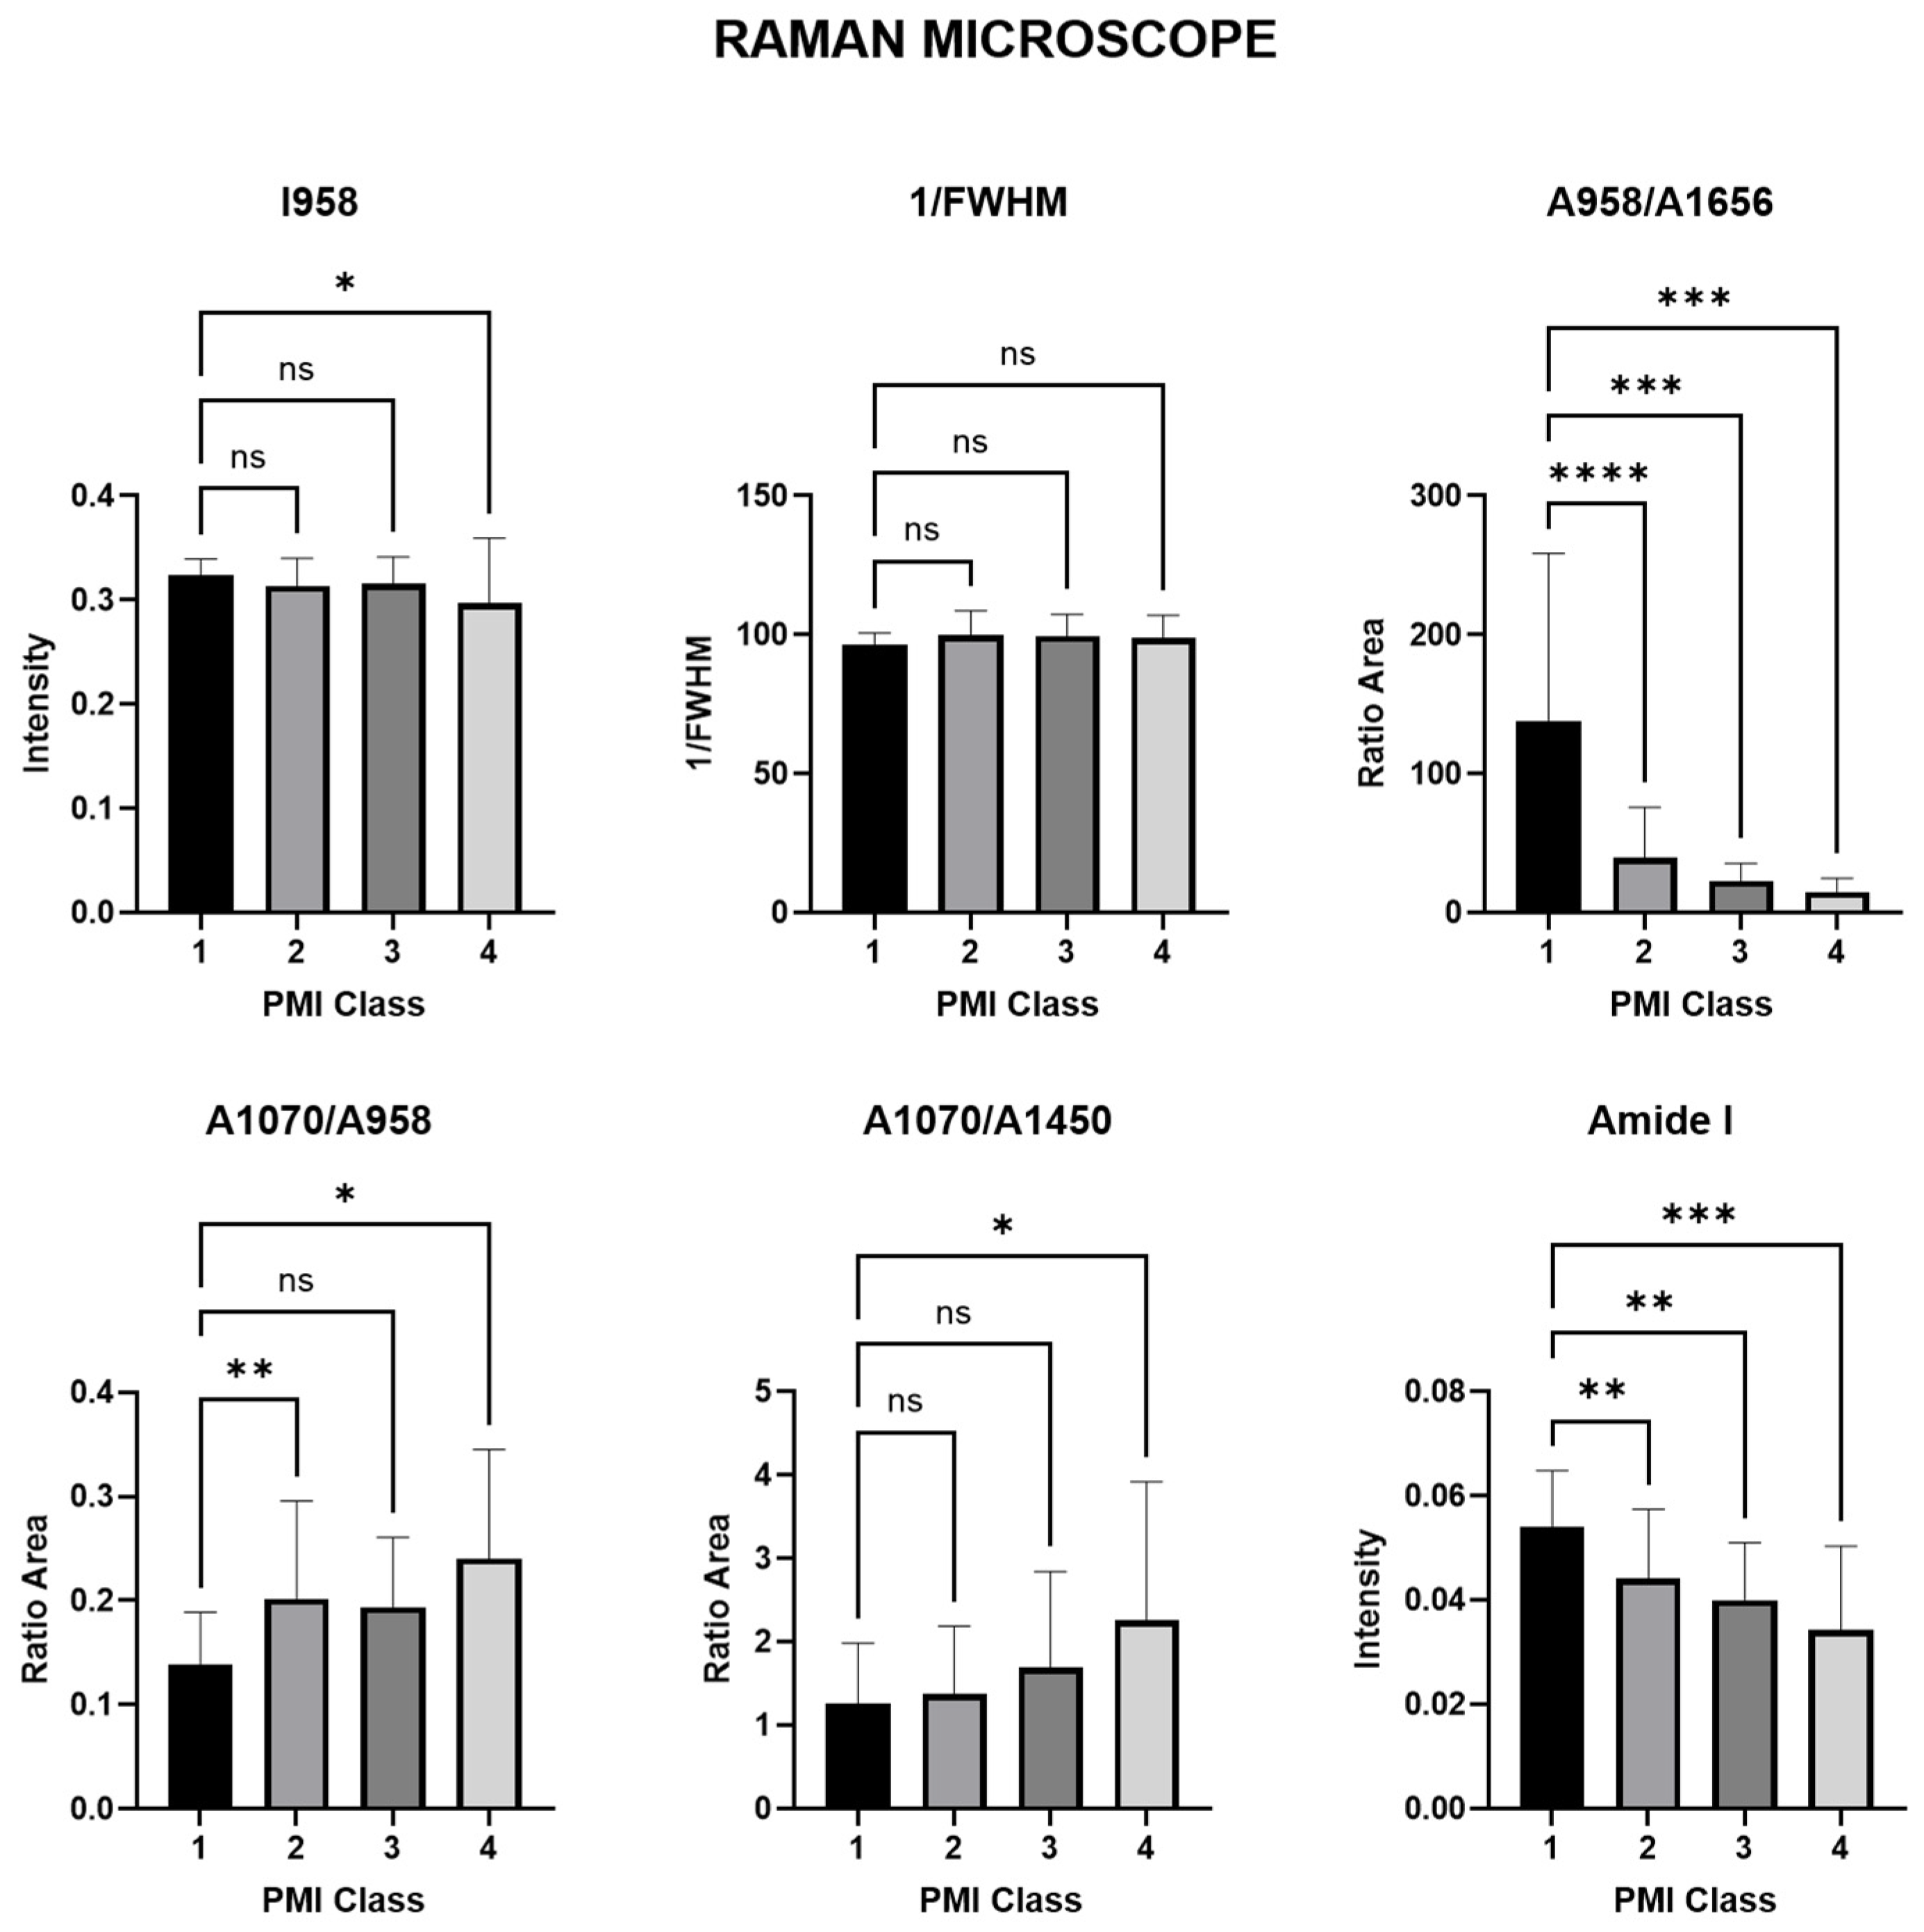
3.1.2. Raman Spectra Parameters for Raman Microscope
3.2. Diagnostic Performance PCA
4. Discussion
5. Conclusions
Author Contributions
Funding
Institutional Review Board Statement
Informed Consent Statement
Data Availability Statement
Acknowledgments
Conflicts of Interest
References
- Knight, B.; Lauder, I. Methods of dating skeletal remains. Hum. Biol. 1969, 41, 322–341. [Google Scholar] [CrossRef] [PubMed]
- Knight, B.; Lauder, I. Practical methods of dating skeletal remains: A preliminary study. Med. Sci. Law 1967, 7, 205–208. [Google Scholar] [CrossRef] [PubMed]
- Introna, F., Jr.; Di Vella, G.; Campobasso, C.P. Determination of postmortem interval from old skeletal remains by image analysis of luminol test results. J. Forensic Sci. 1999, 44, 535–538. [Google Scholar] [CrossRef] [PubMed]
- Buchan, M.J.; Anderson, G.S. Time Since Death: A Review of the Current Status of Methods used in the Later Postmortem Interval. Can. Soc. Forensic Sci. J. 2001, 34, 1–22. [Google Scholar] [CrossRef]
- Nagy, G.; Lorand, T.; Patonai, Z.; Montsko, G.; Bajnoczky, I.; Marcsik, A.; Mark, L. Analysis of pathological and non-pathological human skeletal remains by FT-IR spectroscopy. Forensic Sci. Int. 2008, 175, 55–60. [Google Scholar] [CrossRef]
- Hare, P. 12. Organic geochemistry of bone and its relation to the survival of bone in the natural environment. In Fossils in the Making: Vertebrate Taphonomy and Paleoecology; University of Chicago Press: Chicago, IL, USA, 1988; p. 208. [Google Scholar]
- Gordon, C.C.; Buikstra, J.E. Soil pH, bone preservation, and sampling bias at mortuary sites. Am. Antiq. 1981, 46, 566–571. [Google Scholar] [CrossRef]
- Piepenbrink, H. Two examples of biogenous dead bone decomposition and their consequences for taphonomic interpretation. J. Archaeol. Sci. 1986, 13, 417–430. [Google Scholar] [CrossRef]
- Boaks, A.; Siwek, D.; Mortazavi, F. The temporal degradation of bone collagen: A histochemical approach. Forensic Sci. Int. 2014, 240, 104–110. [Google Scholar] [CrossRef]
- Prieto-Castelló, M.J.; Hernández del Rincón, J.P.; Pérez-Sirvent, C.; Álvarez-Jiménez, P.; Pérez-Cárceles, M.D.; Osuna, E.; Luna, A. Application of biochemical and X-ray diffraction analyses to establish the postmortem interval. Forensic Sci. Int. 2007, 172, 112–118. [Google Scholar] [CrossRef]
- Ortiz-Herrero, L.; Uribe, B.; Armas, L.H.; Alonso, M.L.; Sarmiento, A.; Irurita, J.; Alonso, R.M.; Maguregui, M.I.; Etxeberria, F.; Bartolomé, L. Estimation of the post-mortem interval of human skeletal remains using Raman spectroscopy and chemometrics. Forensic Sci. Int. 2021, 329, 111087. [Google Scholar] [CrossRef]
- Prieto, J.L.; Magana, C.; Ubelaker, D.H. Interpretation of postmortem change in cadavers in Spain. J. Forensic Sci. 2004, 49, 918–923. [Google Scholar] [CrossRef] [PubMed]
- Willey, P.; Snyder, L.M. Canid modification of human remains: Implications for time-since-death estimations. J. Forensic Sci. 1989, 34, 894–901. [Google Scholar] [CrossRef] [PubMed]
- Cattaneo, C. Forensic anthropology: Developments of a classical discipline in the new millennium. Forensic Sci. Int. 2007, 165, 185–193. [Google Scholar] [CrossRef]
- Adlam, R.E.; Simmons, T. The effect of repeated physical disturbance on soft tissue decomposition--are taphonomic studies an accurate reflection of decomposition? J. Forensic Sci. 2007, 52, 1007–1014. [Google Scholar] [CrossRef] [PubMed]
- Aturaliya, S.; Lukasewycz, A. Experimental forensic and bioanthropological aspects of soft tissue taphonomy: 1. Factors influencing postmortem tissue desiccation rate. J. Forensic Sci. 1999, 44, 893–896. [Google Scholar] [CrossRef]
- Fitzgerald, C.M.; Oxenham, M. Modelling time-since-death in Australian temperate conditions. Aust. J. Forensic Sci. 2009, 41, 27–41. [Google Scholar] [CrossRef]
- Pakosh, C.M.; Rogers, T.L. Soft tissue decomposition of submerged, dismembered pig limbs enclosed in plastic bags. J. Forensic Sci. 2009, 54, 1223–1228. [Google Scholar] [CrossRef]
- Child, A.M. Microbial taphonomy of archaeological bone. Stud. Conserv. 1995, 40, 19–30. [Google Scholar] [CrossRef]
- Jans, M.M.E.; Kars, H.; Nielsen–Marsh, C.M.; Smith, C.I.; Nord, A.G.; Arthur, P.; Earl, N. In situ preservation of archaeological bone: A histological study within a multidisciplinary approach. Archaeometry 2002, 44, 343–352. [Google Scholar] [CrossRef]
- Nielsen-Marsh, C.M.; Hedges, R.E.M. Bone porosity and the use of mercury intrusion porosimetry in bone diagenesis studies*. Archaeometry 1999, 41, 165–174. [Google Scholar] [CrossRef]
- Nielsen-Marsh, C.M.; Hedges, R.E.M. Patterns of Diagenesis in Bone I: The Effects of Site Environments. J. Archaeol. Sci. 2000, 27, 1139–1150. [Google Scholar] [CrossRef]
- Nielsen-Marsh, C.M.; Hedges, R.E.M. Patterns of Diagenesis in Bone II: Effects of Acetic Acid Treatment and the Removal of Diagenetic CO32−. J. Archaeol. Sci. 2000, 27, 1151–1159. [Google Scholar] [CrossRef]
- Huculak, M.A.; Rogers, T.L. Reconstructing the sequence of events surrounding body disposition based on color staining of bone*. J. Forensic Sci. 2009, 54, 979–984. [Google Scholar] [CrossRef]
- Janjua, M.A.; Rogers, T.L. Bone weathering patterns of metatarsal v. femur and the postmortem interval in Southern Ontario. Forensic Sci. Int. 2008, 178, 16–23. [Google Scholar] [CrossRef]
- Ross, A.H.; Cunningham, S.L. Time-since-death and bone weathering in a tropical environment. Forensic Sci. Int. 2011, 204, 126–133. [Google Scholar] [CrossRef] [PubMed]
- Haglund, W.D.; Reay, D.T.; Swindler, D.R. Canid scavenging/disarticulation sequence of human remains in the Pacific Northwest. J. Forensic Sci. 1989, 34, 587–606. [Google Scholar] [CrossRef] [PubMed]
- Facchini, F.; Pettener, D. Chemical and physical methods in dating human skeletal remains. Am. J. Phys. Anthr. 1977, 47, 65–70. [Google Scholar] [CrossRef]
- Schwarcz, H.P.; Agur, K.; Jantz, L.M. A New Method for Determination of Postmortem Interval: Citrate Content of Bone*. J. Forensic Sci. 2010, 55, 1516–1522. [Google Scholar] [CrossRef]
- Maclaughlin-Black, S.M.; Herd, R.J.; Willson, K.; Myers, M.; West, I.E. Strontium-90 as an indicator of time since death: A pilot investigation. Forensic Sci. Int. 1992, 57, 51–56. [Google Scholar] [CrossRef]
- Taylor, R.E.; Suchey, J.M.; Payen, L.A.; Slota, P.J., Jr. The use of radiocarbon (14C) to identify human skeletal materials of forensic science interest. J. Forensic Sci. 1989, 34, 1196–1205. [Google Scholar] [CrossRef]
- Sorg, M.H.; Haglund, W.D.; Wren, J.A. Current Research in Forensic Taphonomy; Blackwell Publishing Ltd.: Hoboken, NJ, USA, 2012. [Google Scholar]
- McLaughlin, G.; Lednev, I.K. Potential application of Raman spectroscopy for determining burial duration of skeletal remains. Anal. Bioanal. Chem. 2011, 401, 2511–2518. [Google Scholar] [CrossRef] [PubMed]
- Delannoy, Y.; Colard, T.; Le Garff, E.; Mesli, V.; Aubernon, C.; Penel, G.; Hedouin, V.; Gosset, D. Effects of the environment on bone mass: A human taphonomic study. Leg. Med. 2016, 20, 61–67. [Google Scholar] [CrossRef] [PubMed]
- Creagh, D.; Cameron, A. Estimating the Post-Mortem Interval of skeletonized remains: The use of Infrared spectroscopy and Raman spectro-microscopy. Radiat. Phys. Chem. 2017, 137, 225–229. [Google Scholar] [CrossRef]
- Woess, C.; Unterberger, S.H.; Roider, C.; Ritsch-Marte, M.; Pemberger, N.; Cemper-Kiesslich, J.; Hatzer-Grubwieser, P.; Parson, W.; Pallua, J.D. Assessing various Infrared (IR) microscopic imaging techniques for post-mortem interval evaluation of human skeletal remains. PLoS ONE 2017, 12, e0174552. [Google Scholar] [CrossRef]
- Doty, K.C.; Muro, C.K.; Bueno, J.; Halámková, L.; Lednev, I.K. What can Raman spectroscopy do for criminalistics? J. Raman Spectrosc. 2016, 47, 39–50. [Google Scholar] [CrossRef]
- Chikhani, M.; Wuhrer, R.; Green, H. Optimization of Sample Preparation processes of Bone Material for Raman Spectroscopy. J. Forensic Sci. 2018, 63, 1809–1812. [Google Scholar] [CrossRef]
- Schulmerich, M.V.; Dooley, K.A.; Vanasse, T.M.; Goldstein, S.A.; Morris, M.D. Subsurface and transcutaneous Raman spectroscopy and mapping using concentric illumination rings and collection with a circular fiber-optic array. Appl. Spectrosc. 2007, 61, 671–678. [Google Scholar] [CrossRef]
- Mandair, G.S.; Morris, M.D. Contributions of Raman spectroscopy to the understanding of bone strength. Bonekey Rep. 2015, 4, 620. [Google Scholar] [CrossRef]
- Woess, C.; Huck, C.W.; Badzoka, J.; Kappacher, C.; Arora, R.; Lindtner, R.A.; Zelger, P.; Schirmer, M.; Rabl, W.; Pallua, J. Raman spectroscopy for postmortem interval estimation of human skeletal remains: A scoping review. J. Biophotonics 2023, 16, e202300189. [Google Scholar] [CrossRef]
- Books, D.G.R.L. Strafgesetzbuch von Österreich; Books on Demand: Norderstedt, Germany, 2022. [Google Scholar]
- Bass, W.M. Human Osteology: A Laboratory and Field Manual of the Human Skeleton; Missouri Archaeological Society: Springfield, MO, USA, 1971. [Google Scholar]
- Krogman, W.M.; Iscan, M.Y. The Human Skeleton in Forensic Medicine; Charles C. Thomas Springfield: Springfield, IL, USA, 1986. [Google Scholar]
- Unal, M.; Ahmed, R.; Mahadevan-Jansen, A.; Nyman, J.S. Compositional assessment of bone by Raman spectroscopy. Analyst 2021, 146, 7464–7490. [Google Scholar] [CrossRef]
- Lopes, C.d.C.A.; Limirio, P.H.J.O.; Novais, V.R.; Dechichi, P. Fourier transform infrared spectroscopy (FTIR) application chemical characterization of enamel, dentin and bone. Appl. Spectrosc. Rev. 2018, 53, 747–769. [Google Scholar] [CrossRef]
- Rubio, L.; Vargas, A.; Rivera, P.; López-Gambero, A.J.; Tovar, R.; Christians, J.K.; Martín-de-las-Heras, S.; Rodríguez de Fonseca, F.; Chowen, J.A.; Argente, J.; et al. Recombinant IGF-1 Induces Sex-Specific Changes in Bone Composition and Remodeling in Adult Mice with Pappa2 Deficiency. Int. J. Mol. Sci. 2021, 22, 4048. [Google Scholar] [CrossRef] [PubMed]
- Paschalis, E.P.; Mendelsohn, R.; Boskey, A.L. Infrared Assessment of Bone Quality: A Review. Clin. Orthop. Relat. Res. 2011, 469, 2170–2178. [Google Scholar] [CrossRef] [PubMed]
- Paschalis, E.P. Fourier Transform Infrared Imaging of Bone. In Bone Research Protocols; Idris, A.I., Ed.; Springer: New York, NY, USA, 2019; pp. 641–649. [Google Scholar]
- Taylor, E.A.; Lloyd, A.A.; Salazar-Lara, C.; Donnelly, E. Raman and Fourier Transform Infrared (FT-IR) Mineral to Matrix Ratios Correlate with Physical Chemical Properties of Model Compounds and Native Bone Tissue. Appl. Spectrosc. 2017, 71, 2404–2410. [Google Scholar] [CrossRef] [PubMed]
- Rubio, L.; Suárez, J.; Martin-de-las-Heras, S.; Zapico, S.C. Partners in Postmortem Interval Estimation: X-ray Diffraction and Fourier Transform Spectroscopy. Int. J. Mol. Sci. 2023, 24, 6793. [Google Scholar] [CrossRef]
- Vieira, A.L.; Nespeca, M.G.; Pavini, W.D.; Ferreira, E.C.; Gomes Neto, J.A. A user-friendly excel spreadsheet for dealing with spectroscopic and chromatographic data. Chemom. Intell. Lab. Syst. 2019, 194, 103816. [Google Scholar] [CrossRef]
- Brown, T.A.; Brown, K. Biomolecular Archaeology: An Introduction; John Wiley & Sons: Hoboken, NJ, USA, 2011. [Google Scholar]
- Carden, A.; Rajachar, R.M.; Morris, M.D.; Kohn, D.H. Ultrastructural changes accompanying the mechanical deformation of bone tissue: A Raman imaging study. Calcif. Tissue Int. 2003, 72, 166–175. [Google Scholar] [CrossRef]
- Gonzalez, G.; Costa-Vera, C.; Borrero, L.J.; Soto, D.; Lozada, L.; Chango, J.I.; Diaz, J.C.; Lascano, L. Effect of carbonates on hydroxyapatite self-activated photoluminescence response. J. Lumin. 2018, 195, 385–395. [Google Scholar] [CrossRef]
- Omucheni, D.L.; Kaduki, K.A.; Bulimo, W.D.; Angeyo, H.K. Application of principal component analysis to multispectral-multimodal optical image analysis for malaria diagnostics. Malar. J. 2014, 13, 485. [Google Scholar] [CrossRef]
- Walsh, M.J.; German, M.J.; Singh, M.; Pollock, H.M.; Hammiche, A.; Kyrgiou, M.; Stringfellow, H.F.; Paraskevaidis, E.; Martin-Hirsch, P.L.; Martin, F.L. IR microspectroscopy: Potential applications in cervical cancer screening. Cancer Lett. 2007, 246, 1–11. [Google Scholar] [CrossRef]
- Eikje, N.S.; Aizawa, K.; Ozaki, Y. Vibrational spectroscopy for molecular characterisation and diagnosis of benign, premalignant and malignant skin tumours. Biotechnol. Annu. Rev. 2005, 11, 191–225. [Google Scholar] [CrossRef] [PubMed]
- Kumar, S.; Desmedt, C.; Larsimont, D.; Sotiriou, C.; Goormaghtigh, E. Change in the microenvironment of breast cancer studied by FTIR imaging. Analyst 2013, 138, 4058–4065. [Google Scholar] [CrossRef] [PubMed]
- Longato, S.; Woss, C.; Hatzer-Grubwieser, P.; Bauer, C.; Parson, W.; Unterberger, S.H.; Kuhn, V.; Pemberger, N.; Pallua, A.K.; Recheis, W.; et al. Post-mortem interval estimation of human skeletal remains by micro-computed tomography, mid-infrared microscopic imaging and energy dispersive X-ray mapping. Anal. Methods 2015, 7, 2917–2927. [Google Scholar] [CrossRef] [PubMed]
- Wurm, A.; Kuhn, J.; Kugel, K.; Putzer, D.; Arora, R.; Coraca-Huber, D.C.; Zelger, P.; Badzoka, J.; Kappacher, C.; Huck, C.W.; et al. Raman microscopic spectroscopy as a diagnostic tool to detect Staphylococcus epidermidis in bone grafts. Spectrochim. Acta A Mol. Biomol. Spectrosc. 2022, 280, 121570. [Google Scholar] [CrossRef] [PubMed]
- Goswami, K.; Parvizi, J.; Maxwell Courtney, P. Current Recommendations for the Diagnosis of Acute and Chronic PJI for Hip and Knee-Cell Counts, Alpha-Defensin, Leukocyte Esterase, Next-generation Sequencing. Curr. Rev. Musculoskelet. Med. 2018, 11, 428–438. [Google Scholar] [CrossRef]
- Lindtner, R.A.; Wurm, A.; Pirchner, E.; Putzer, D.; Arora, R.; Coraça-Huber, D.C.; Schirmer, M.; Badzoka, J.; Kappacher, C.; Huck, C.W.; et al. Enhancing Bone Infection Diagnosis with Raman Handheld Spectroscopy: Pathogen Discrimination and Diagnostic Potential. Int. J. Mol. Sci. 2024, 25, 541. [Google Scholar] [CrossRef]
- Pallua, J.D.; Unterberger, S.H.; Pemberger, N.; Woess, C.; Ensinger, C.; Zelger, B.; Lass-Flörl, C.; Lackner, M. Retrospective case study on the suitability of mid-infrared microscopic imaging for the diagnosis of mucormycosis in human tissue sections. Anal. Methods 2017, 9, 4135–4142. [Google Scholar] [CrossRef]
- Anu; Srivastava, A.; Khan, M.S. Principle component analysis for nonlinear optical properties of thiophene-based metal complexes. J. Mol. Model. 2021, 27, 340. [Google Scholar] [CrossRef]
- Howes, J.M.; Stuart, B.H.; Thomas, P.S.; Raja, S.; O’Brien, C. An investigation of model forensic bone in soil environments studied using infrared spectroscopy. J. Forensic Sci. 2012, 57, 1161–1167. [Google Scholar] [CrossRef]
- Cascant, M.M.; Rubio, S.; Gallello, G.; Pastor, A.; Garrigues, S.; Guardia, M.d.l. Burned bones forensic investigations employing near infrared spectroscopy. Vib. Spectrosc. 2017, 90, 21–30. [Google Scholar] [CrossRef]


| Name | Description | Determination | p-Values Derived from a Single-Factor ANOVA | ||
|---|---|---|---|---|---|
| Class 1 vs. 2 | Class 1 vs. 3 | Class 1 vs. 4 | |||
| Phosphate | ν1PO43− Amount of phosphate | (I958) | 0.0479 * | 0.9553 ns | 0.9731 ns |
| Crystallinity (CI) | mineral quality-crystallinity index | 1/FWHM958 | 0.0154 * | 0.5954 ns | 0.5195 ns |
| Mineral/matrix (MMR) phosphate/amide I | ν1PO43−/amide I Mineral component amount to the organic one | (A958/A1656) | 0.0013 ** | 0.0458 * | 0.6382 ns |
| Mineral quality and crystallinity carbonate/phosphate | ν1CO32−/ν1PO43− Carbonate incorporation extent in the hydroxyapatite lattice | (A1070/A958) | 0.0008 *** | 0.3056 ns | <0.0001 **** |
| Mineral carbonate content (MinCarb) | ν1CO32−/(C-H) bend; CH2 wag | (A1070/A1450) | 0.1292 ns | 0.0686 ns | 0.9960 ns |
| amide I | amide I of α-helical structures Arrangement and quantity of collagen | (I1656) | <0.0001 **** | 0.0008 *** | 0.0026 ** |
| Name | Description | Determination | p-Values Derived from a Single-Factor ANOVA | ||
|---|---|---|---|---|---|
| Class 1 vs. 2 | Class 1 vs. 3 | Class 1 vs. 4 | |||
| Phosphate | ν1PO43− Amount of phosphate | (I958) | 0.2948 ns | 0.7299 ns | 0.0347 * |
| Crystallinity (CI) | mineral quality-crystallinity index | 1/FWHM958 | 0.0977 ns | 0.4968 ns | 0.7418 ns |
| Mineral/matrix (MMR) phosphate/amide I | ν1PO43−/amide I Mineral component amount to the organic one | (A958/A1656) | <0.0001 **** | 0.0003 *** | 0.0010 *** |
| Mineral quality and crystallinity carbonate/phosphate | ν1CO32−/ν1PO43− Carbonate incorporation extent in the hydroxyapatite lattice | (A1070/A958) | 0.0087 ** | 0.2425 ns | 0.0103 * |
| Mineral carbonate content (MinCarb) | ν1CO32−/(C-H) bend; CH2 wag | (A1070/A1450) | 0.9385 ns | 0.4849 ns | 0.0202 * |
| amide I | amide I of α-helical structures Arrangement and quantity of collagen | (I1656) | 0.0026 ** | 0.0060 ** | 0.0002 *** |
| Wave Number Range Number | Handheld PCA | Microscope PCA | Assignment | Spectral Region |
|---|---|---|---|---|
| I | PC-1 (91%) PC-2 (7%) | PC-1 (94%) PC-2 (3%) | ν2PO43− (450 cm−1) | 400 cm−1 to 450 cm−1 |
| II | PC-1 (79%) PC-2 (19%) | PC-1 (88%) PC-2 (10%) | ν1PO43− (958 cm−1) | 920 cm−1 to 990 cm−1 |
| III | PC-1 (84%) PC-2 (10%) | PC-1 (62%) PC-2 (19%) | amide III (1246 cm−1) | 1200 cm−1 to 1320 cm−1 |
| IV | PC-1 (79%) PC-2 (9%) | PC-1 (92%) PC-2 (7%) | CH2 Deformation (1450 cm−1) | 1410 cm−1 to 1490 cm−1 |
| V | PC-1 (93%) PC-2 (4%) | PC-1 (85%) PC-2 (3%) | amide I (1656 cm−1) | 1550 cm−1 to 1730 cm−1 |
Disclaimer/Publisher’s Note: The statements, opinions and data contained in all publications are solely those of the individual author(s) and contributor(s) and not of MDPI and/or the editor(s). MDPI and/or the editor(s) disclaim responsibility for any injury to people or property resulting from any ideas, methods, instructions or products referred to in the content. |
© 2024 by the authors. Licensee MDPI, Basel, Switzerland. This article is an open access article distributed under the terms and conditions of the Creative Commons Attribution (CC BY) license (https://creativecommons.org/licenses/by/4.0/).
Share and Cite
Pallua, J.D.; Louis, C.; Gattermair, N.; Brunner, A.; Zelger, B.; Schirmer, M.; Badzoka, J.; Kappacher, C.; Huck, C.W.; Popp, J.; et al. Raman Handheld Versus Microscopic Spectroscopy for Estimating the Post-Mortem Interval of Human Bones: A Comparative Pilot Study. Bioengineering 2024, 11, 1151. https://doi.org/10.3390/bioengineering11111151
Pallua JD, Louis C, Gattermair N, Brunner A, Zelger B, Schirmer M, Badzoka J, Kappacher C, Huck CW, Popp J, et al. Raman Handheld Versus Microscopic Spectroscopy for Estimating the Post-Mortem Interval of Human Bones: A Comparative Pilot Study. Bioengineering. 2024; 11(11):1151. https://doi.org/10.3390/bioengineering11111151
Chicago/Turabian StylePallua, Johannes Dominikus, Christina Louis, Nicole Gattermair, Andrea Brunner, Bettina Zelger, Michael Schirmer, Jovan Badzoka, Christoph Kappacher, Christian Wolfgang Huck, Jürgen Popp, and et al. 2024. "Raman Handheld Versus Microscopic Spectroscopy for Estimating the Post-Mortem Interval of Human Bones: A Comparative Pilot Study" Bioengineering 11, no. 11: 1151. https://doi.org/10.3390/bioengineering11111151
APA StylePallua, J. D., Louis, C., Gattermair, N., Brunner, A., Zelger, B., Schirmer, M., Badzoka, J., Kappacher, C., Huck, C. W., Popp, J., Rabl, W., & Wöss, C. (2024). Raman Handheld Versus Microscopic Spectroscopy for Estimating the Post-Mortem Interval of Human Bones: A Comparative Pilot Study. Bioengineering, 11(11), 1151. https://doi.org/10.3390/bioengineering11111151