
Effects of Supervised Exercise Therapy on Muscle Function During Walking in Patients with Peripheral Artery Disease

 ,
,  and
and 
Abstract
1. Introduction
2. Materials and Methods
2.1. Participants and SET Protocol
2.2. Experimental Data Collection
2.3. Musculoskeletal Modeling and Simulation
2.4. Data Processing
2.5. Statistical Analysis
3. Results
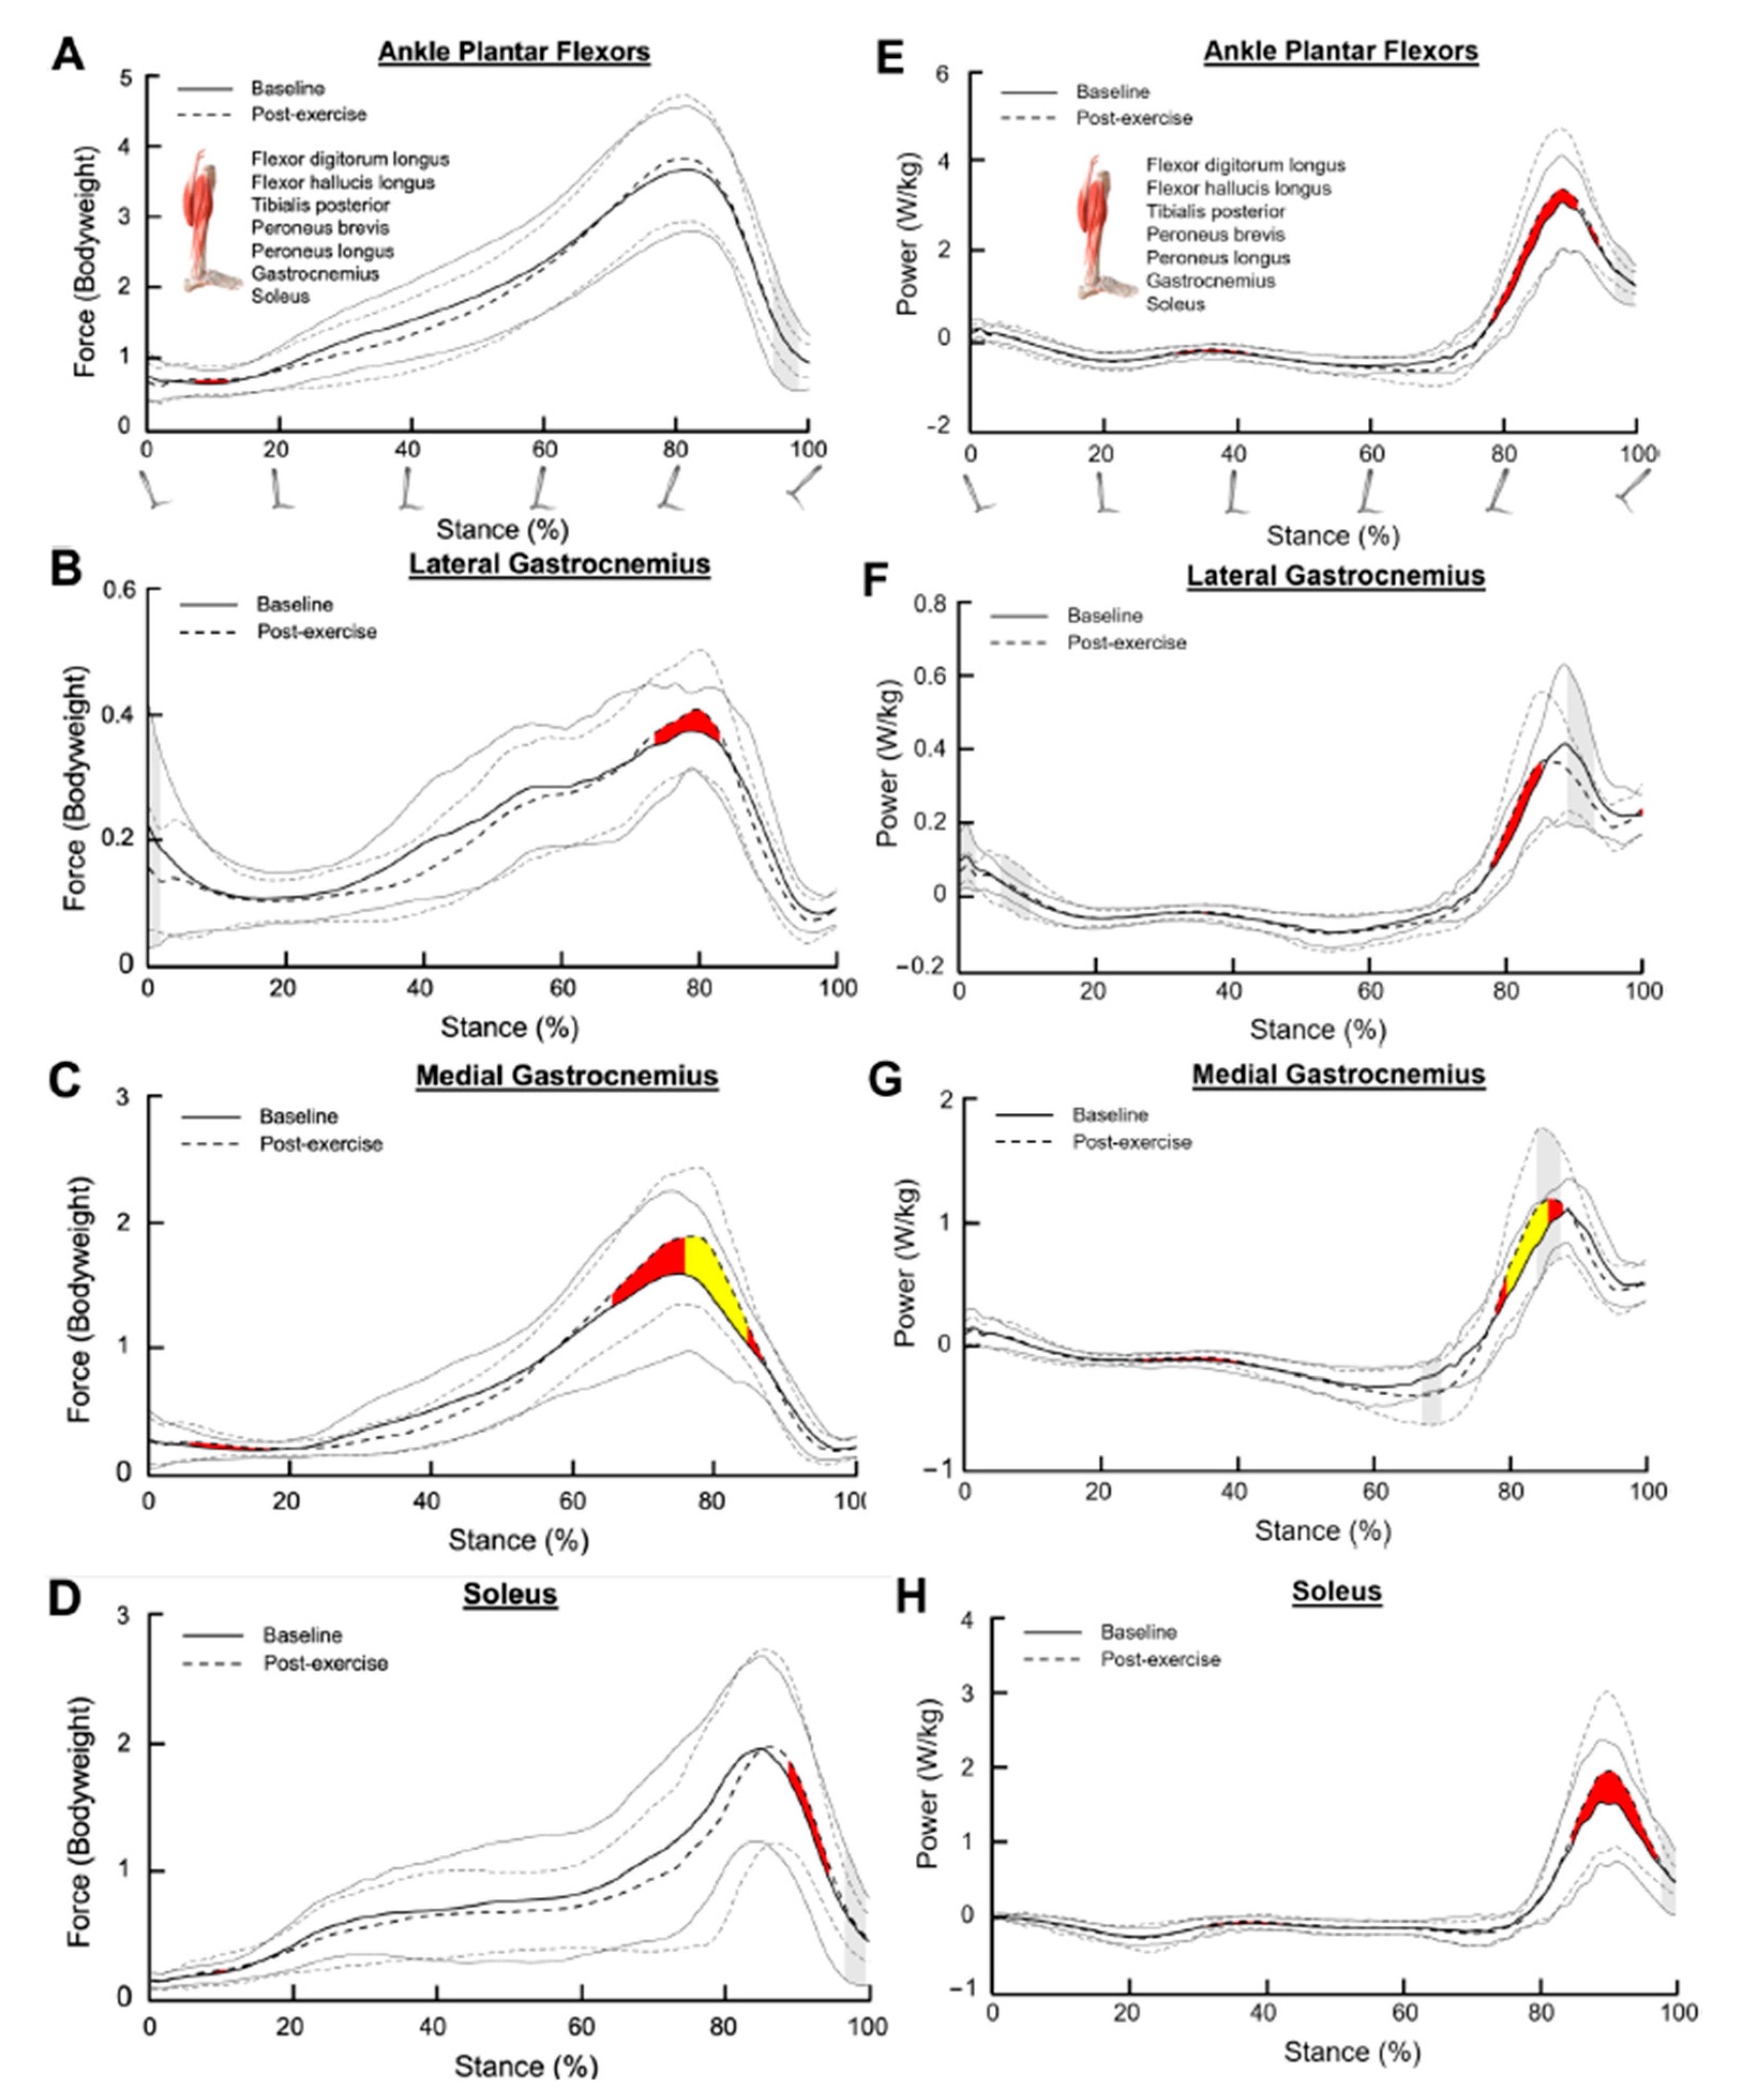
3.1. Ankle Plantar Flexors
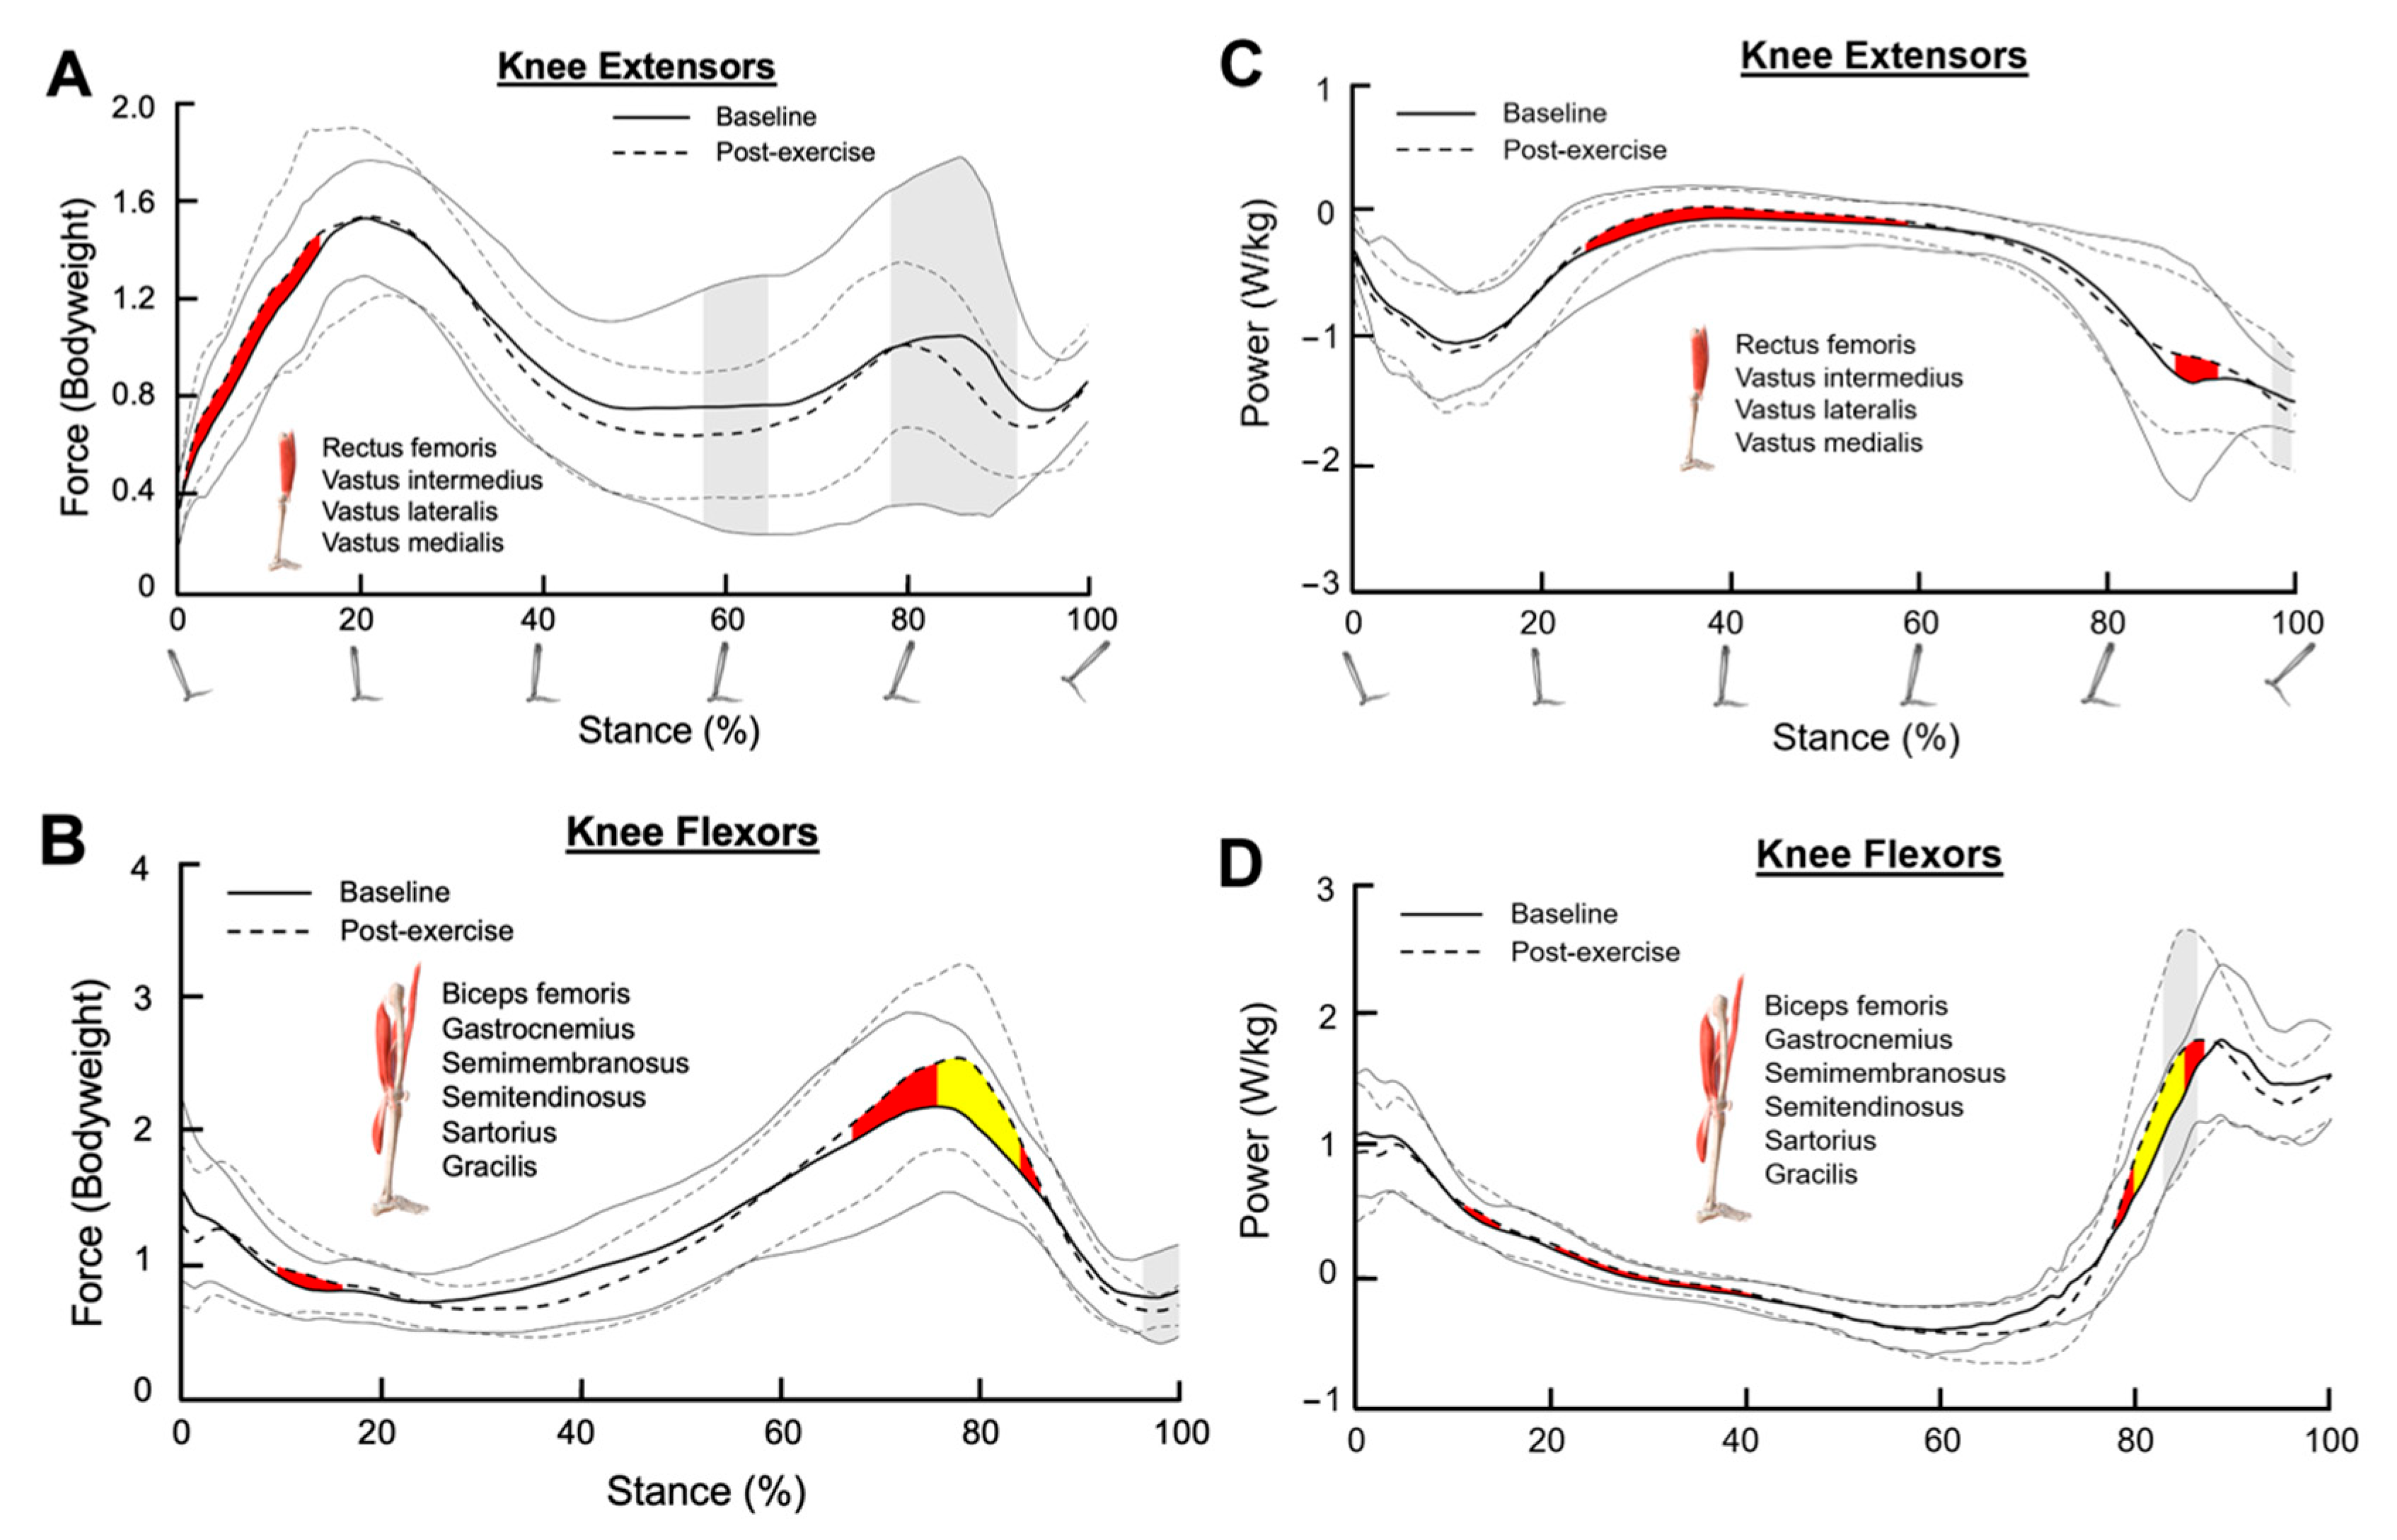
3.2. Knee Extensors
3.3. Knee Flexors
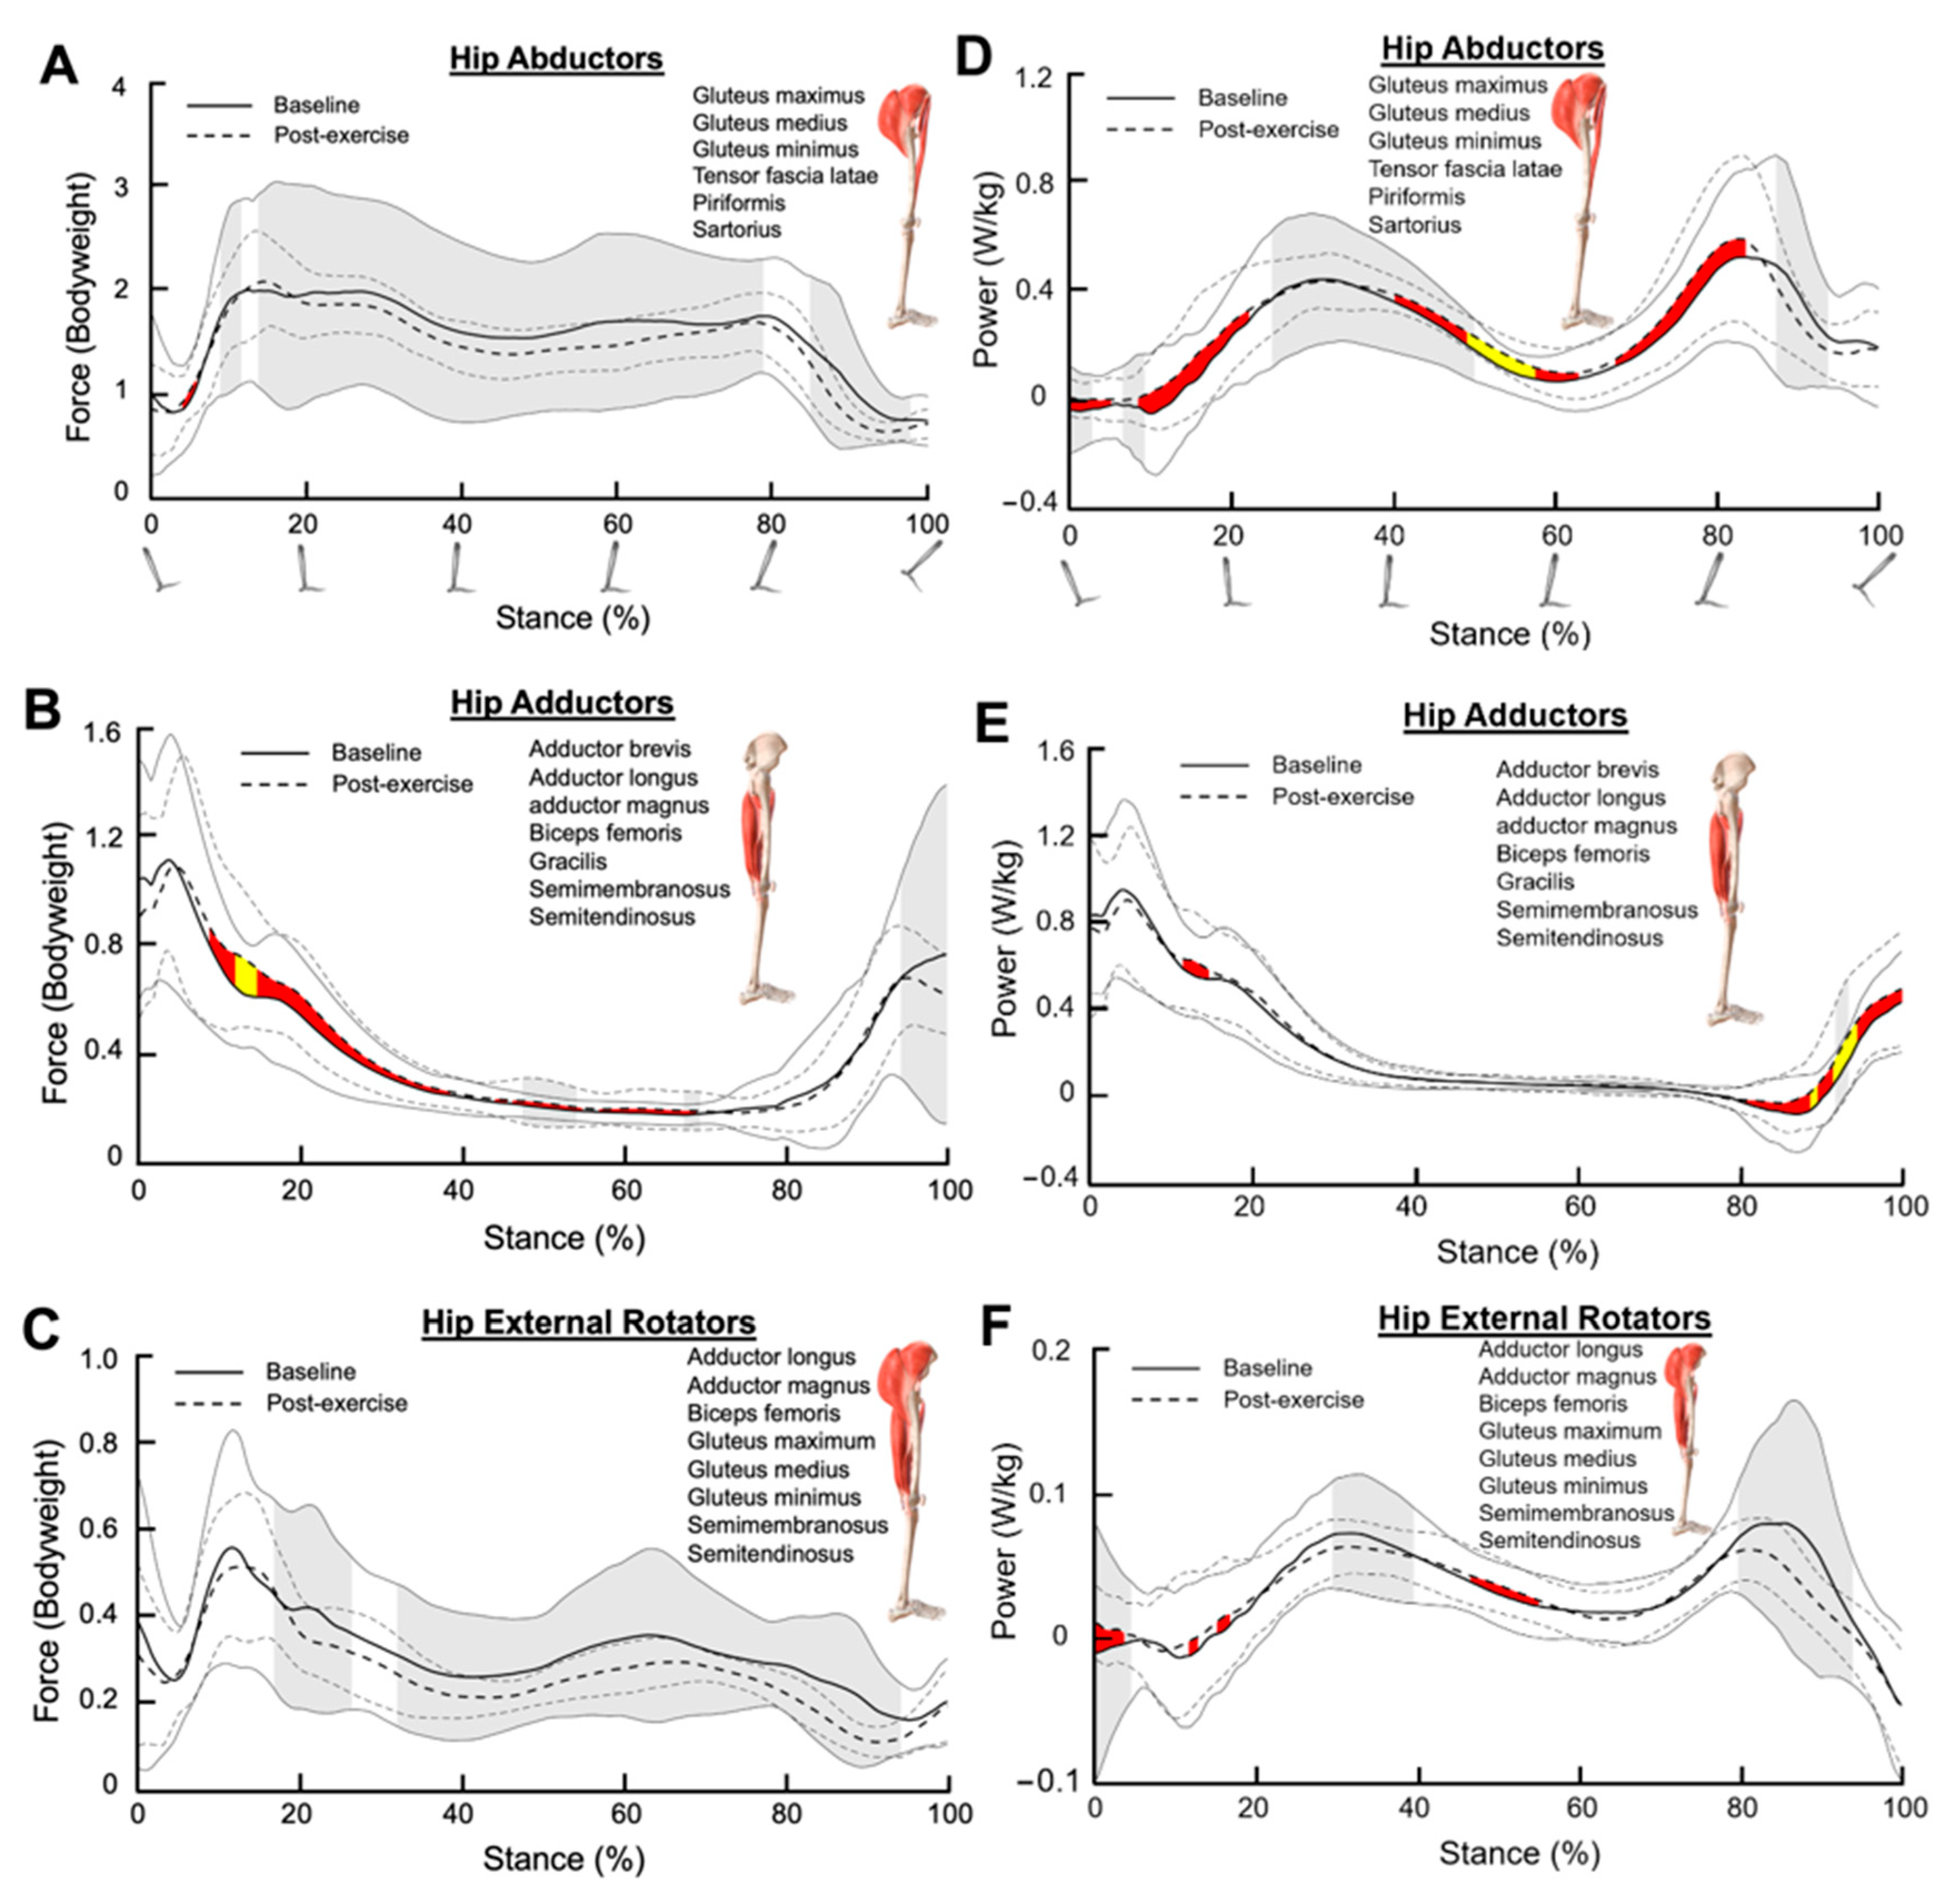
3.4. Hip Abductors
3.5. Hip Adductors
3.6. Hip External Rotators
3.7. Hip Extensors
3.8. Hip Flexors
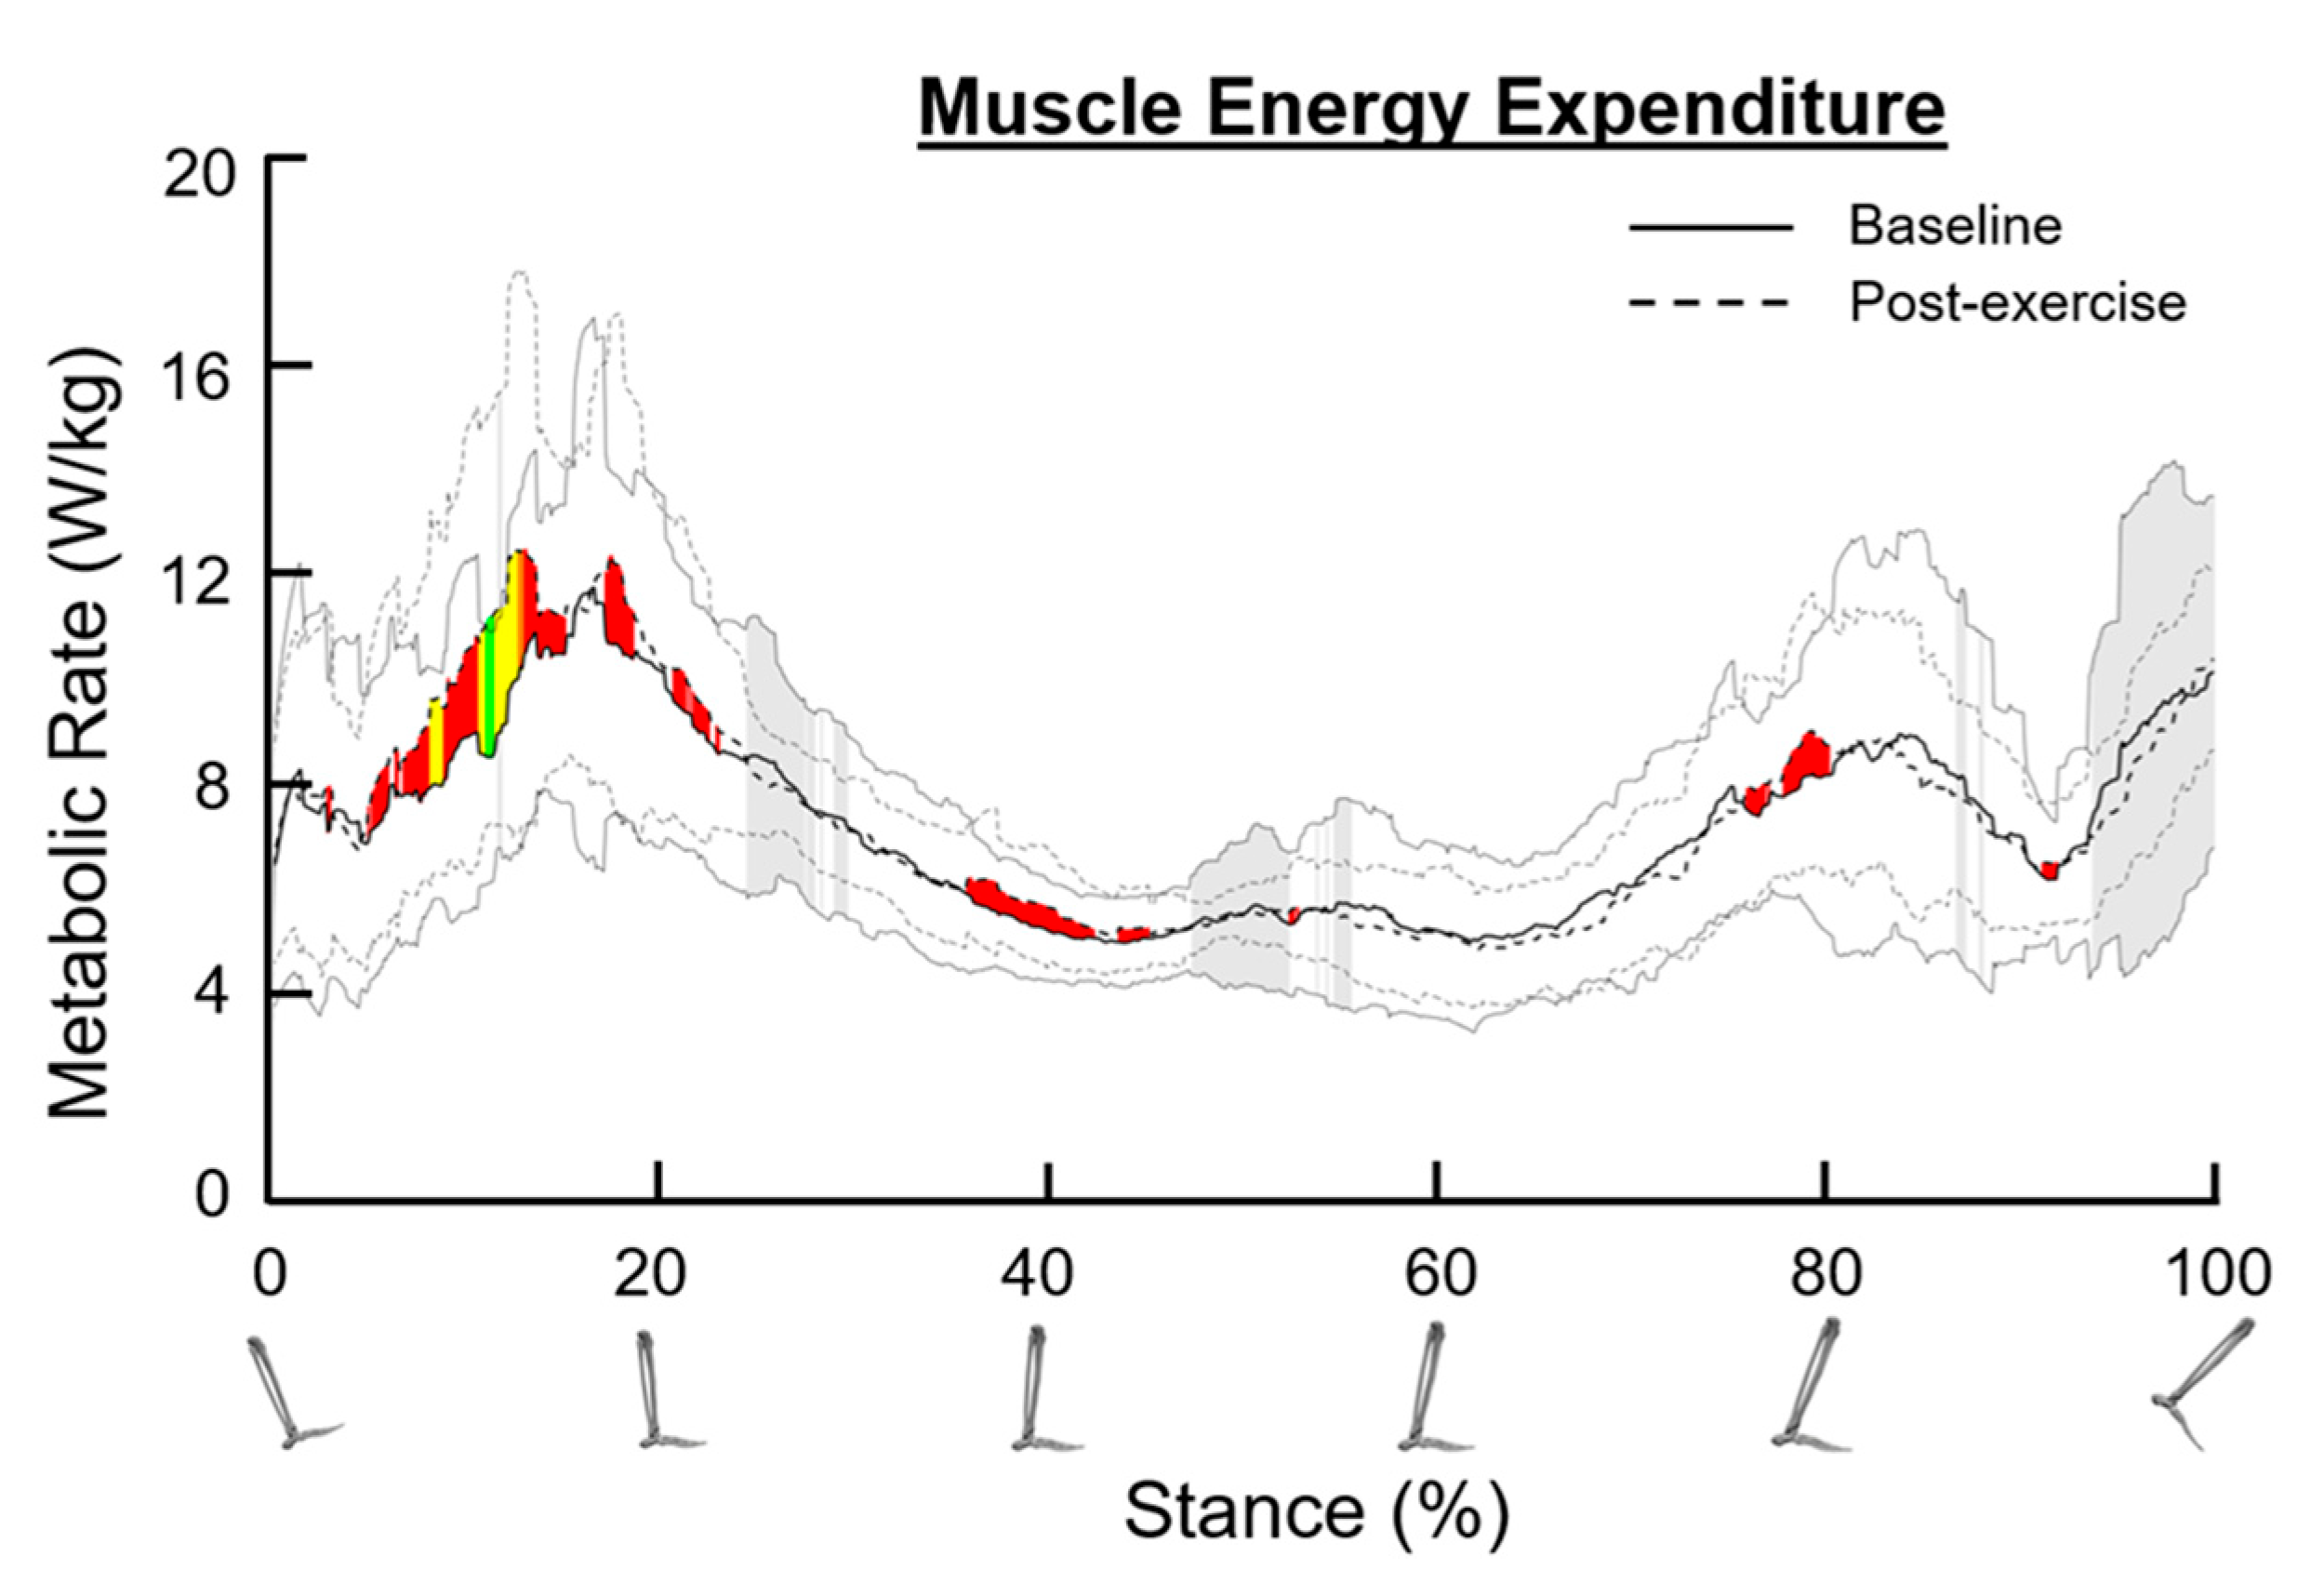
3.9. Metabolic Rate
4. Discussion
5. Conclusions
Author Contributions
Funding
Institutional Review Board Statement
Informed Consent Statement
Data Availability Statement
Conflicts of Interest
References
- Fowkes, F.G.R.; Rudan, D.; Rudan, I.; Aboyans, V.; Denenberg, J.O.; McDermott, M.M.; Norman, P.E.; Sampson, U.K.; Williams, L.J.; Mensah, G.A.; et al. Comparison of global estimates of prevalence and risk factors for peripheral artery disease in 2000 and 2010: A systematic review and analysis. Lancet 2013, 382, 1329–1340. [Google Scholar] [CrossRef]
- Selvin, E.; Erlinger, T.P. Prevalence of and risk factors for peripheral arterial disease in the United States: Results from the National Health and Nutrition Examination Survey, 1999–2000. Circulation 2004, 110, 738–743. [Google Scholar] [CrossRef]
- Allison, M.A.; Ho, E.; Denenberg, J.O.; Langer, R.D.; Newman, A.B.; Fabsitz, R.R.; Criqui, M.H. Ethnic-specific prevalence of peripheral arterial disease in the United States. Am. J. Prev. Med. 2007, 32, 328–333. [Google Scholar] [CrossRef]
- Celis, R.; Pipinos, I.I.; Scott-Pandorf, M.M.; Myers, S.A.; Stergiou, N.; Johanning, J.M. Peripheral arterial disease affects kinematics during walking. J. Vasc. Surg. 2009, 49, 127–132. [Google Scholar] [CrossRef]
- Gardner, A.W.; Montgomery, P.S. Impaired balance and higher prevalence of falls in subjects with intermittent claudication. J. Gerontol. Ser. A Biol. Sci. Med. Sci. 2001, 56, M454–M458. [Google Scholar] [CrossRef]
- Hernandez, H.; Myers, S.A.; Schieber, M.; Ha, D.M.; Baker, S.; Koutakis, P.; Kim, K.S.; Mietus, C.; Casale, G.P.; Pipinos, I.I. Quantification of Daily Physical Activity and Sedentary Behavior of Claudicating Patients. Ann. Vasc. Surg. 2019, 55, 112–121. [Google Scholar] [CrossRef]
- Koutakis, P.; Pipinos, I.I.; Myers, S.A.; Stergiou, N.; Lynch, T.G.; Johanning, J.M. Joint torques and powers are reduced during ambulation for both limbs in patients with unilateral claudication. J. Vasc. Surg. 2010, 51, 80–88. [Google Scholar] [CrossRef]
- McDermott, M.M.G. Functional Impairment in Peripheral Artery Disease and How to Improve It in 2013. Curr. Cardiol. Rep. 2013, 15, 347. [Google Scholar] [CrossRef]
- Rahman, H.; Pipinos, I.I.; Johanning, J.M.; Myers, S.A. Gait variability is affected more by peripheral artery disease than by vascular occlusion. PLoS ONE 2021, 16, e0241727. [Google Scholar] [CrossRef]
- Schieber, M.N.; Hasenkamp, R.M.; Pipinos, I.I.; Johanning, J.M.; Stergiou, N.; DeSpiegelaere, H.K.; Chien, J.H.; Myers, S.A. Muscle strength and control characteristics are altered by peripheral artery disease. J. Vasc. Surg. 2017, 66, 178–186.e12. [Google Scholar] [CrossRef]
- Sieminski, D.J.; Gardner, A.W. The relationship between free-living daily physical activity and the severity of peripheral arterial occlusive disease. Vasc. Med. 1997, 2, 286–291. [Google Scholar] [CrossRef]
- Rahman, H.; Pipinos, I.I.; Johanning, J.M.; Casale, G.; Williams, M.A.; Thompson, J.R.; O’Neill-Castro, Y.; Myers, S.A. Claudicating Patients with Peripheral Artery Disease have Meaningful Improvement in Walking Speed after Supervised Exercise Therapy. J. Vasc. Surg. 2021, 74, 1987. [Google Scholar] [CrossRef]
- Rahman, H.; Leutzinger, T.; Hassan, M.; Schieber, M.; Koutakis, P.; Fuglestad, M.A.; DeSpiegelaere, H.; Longo, G.M.; Malcolm, P.; Johanning, J.M.; et al. Peripheral artery disease causes consistent gait irregularities regardless of the location of leg claudication pain. Ann. Phys. Rehabil. Med. 2023, 67, 101793. [Google Scholar] [CrossRef]
- Leutzinger, T.J.; Koutakis, P.; Fuglestad, M.A.; Rahman, H.; Despiegelaere, H.; Hassan, M.; Schieber, M.; Johanning, J.M.; Stergiou, N.; Longo, G.M.; et al. Peripheral artery disease affects the function of the legs of claudicating patients in a diffuse manner irrespective of the segment of the arterial tree primarily involved. PLoS ONE 2022, 17, e0264598. [Google Scholar] [CrossRef]
- Scott-Pandorf, M.M.; Stergiou, N.; Johanning, J.M.; Robinson, L.; Lynch, T.G.; Pipinos, I.I. Peripheral arterial disease affects ground reaction forces during walking. J. Vasc. Surg. 2007, 46, 491–499. [Google Scholar] [CrossRef]
- Gommans, L.N.; Fokkenrood, H.J.; van Dalen, H.C.; Scheltinga, M.R.; Teijink, J.A.; Peters, R.J. Safety of supervised exercise therapy in patients with intermittent claudication. J. Vasc. Surg. 2015, 61, 512–518. [Google Scholar] [CrossRef]
- Iso, Y.; Suzuki, H. Exercise therapy for intermittent claudication in peripheral artery disease. E-J. Cardiol. Pract. 2015, 13. Available online: https://www.escardio.org/Journals/E-Journal-of-Cardiology-Practice/Volume-13/exercise-therapy-for-intermittent-claudication-in-peripheral-artery-disease (accessed on 10 September 2024).
- Fakhry, F.; Spronk, S.; van der Laan, L.; Wever, J.J.; Teijink, J.A.; Hoffmann, W.H.; Smits, T.M.; van Brussel, J.P.; Stultiens, G.N.; Derom, A.; et al. Endovascular revascularization and supervised exercise for peripheral artery disease and intermittent claudication: A randomized clinical trial. JAMA 2015, 314, 1936–1944. [Google Scholar] [CrossRef] [PubMed]
- Thangada, N.D.; Zhang, D.; Tian, L.; Zhao, L.; Rejeski, W.J.; Ho, K.J.; Ferrucci, L.; Spring, B.; Kibbe, M.R.; Polonsky, T.S.; et al. Home-based walking exercise and supervised treadmill exercise in patients with peripheral artery disease: An individual Participant data meta-analysis. JAMA Netw. Open 2023, 6, e2334590. [Google Scholar] [CrossRef]
- Schieber, M.N.; Pipinos, I.I.; Johanning, J.M.; Casale, G.P.; Williams, M.A.; DeSpiegelaere, H.K.; Senderling, B.; Myers, S.A. Supervised walking exercise therapy improves gait biomechanics in patients with peripheral artery disease. J. Vasc. Surg. 2020, 71, 575–583. [Google Scholar] [CrossRef]
- Regensteiner, J.G.; Steiner, J.F.; Hiatt, W.R. Exercise training improves functional status in patients with peripheral arterial disease. J. Vasc. Surg. 1996, 23, 104–115. [Google Scholar] [CrossRef] [PubMed]
- Patel, K.; Polonsky, T.S.; Kibbe, M.R.; Guralnik, J.M.; Tian, L.; Ferrucci, L.; Criqui, M.H.; Sufit, R.; Leeuwenburgh, C.; Zhang, D.; et al. Clinical characteristics and response to supervised exercise therapy of people with lower extremity peripheral artery disease. J. Vasc. Surg. 2021, 73, 608–625. [Google Scholar] [CrossRef]
- McDermott, M.M.; Kibbe, M.R.; Guralnik, J.M. Durability of Benefits from Supervised Treadmill Exercise in People With Peripheral Artery Disease. J. Am. Heart Assoc. 2019, 8, e009380. [Google Scholar] [CrossRef]
- McDermott, M.M. Exercise Rehabilitation for Peripheral Artery Disease: A review. J. Cardiopulm. Rehabil. Prev. 2018, 38, 63–69. [Google Scholar] [CrossRef]
- Fallahtafti, F.; Salamifar, Z.; Hassan, M.; Rahman, H.; Pipinos, I.; Myers, S.A. Joint Angle Variability Is Altered in Patients with Peripheral Artery Disease after Six Months of Exercise Intervention. Entropy 2022, 24, 1422. [Google Scholar] [CrossRef] [PubMed]
- Rahman, H.; Anderson, C.P.; Pipinos, I.I.; Johanning, J.M.; Casale, G.P.; Dong, J.; DeSpiegelaere, H.; Hassan, M.; Myers, S.A. Muscle forces and power are significantly reduced during walking in patients with peripheral artery disease. J. Biomech. 2022, 135, 111024. [Google Scholar] [CrossRef] [PubMed]
- Regensteiner, J.; Hiatt, W. Exercise in the management of peripheral artery disease. In ACSM’s Resource Manual for Guidelines for Exercise Testing and Prescription, 4th ed.; Lippincott Williams & Wilkins: Philadelphia, PA, USA, 2001. [Google Scholar]
- ACSM’s Guidelines for Exercise Testing and Prescription, 9th ed.; Lippincott Williams & Wilkins: Philadelphia, PA, USA, 2013.
- Delp, S.L.; Anderson, F.C.; Arnold, A.S.; Loan, P.; Habib, A.; John, C.T.; Guendelman, E.; Thelen, D.G. OpenSim: Open-source software to create and analyze dynamic simulations of movement. IEEE Trans. Biomed. Eng. 2007, 54, 1940–1950. [Google Scholar] [CrossRef]
- Rajagopal, A.; Dembia, C.L.; DeMers, M.S.; Delp, D.D.; Hicks, J.L.; Delp, S.L. Full-Body Musculoskeletal Model for Muscle-Driven Simulation of Human Gait. IEEE Trans. Biomed. Eng. 2016, 63, 2068–2079. [Google Scholar] [CrossRef]
- Umberger, B.R.; Gerritsen, K.G.M.; Martin, P.E. A model of human muscle energy expenditure. Comput. Methods Biomech. Biomed. Eng. 2003, 6, 99–111. [Google Scholar] [CrossRef]
- Umberger, B.R. Stance and swing phase costs in human walking. J. R. Soc. Interface 2010, 7, 1329–1340. [Google Scholar] [CrossRef]
- Uchida, T.K.; Hicks, J.L.; Dembia, C.L.; Delp, S.L. Stretching Your Energetic Budget: How Tendon Compliance Affects the Metabolic Cost of Running. PLoS ONE 2016, 11, e0150378. [Google Scholar] [CrossRef] [PubMed]
- Cohen, J. Statistical Power Analysis for the Behavioral Sciences, 2nd ed.; Routledge: New York, NY, USA, 1988. [Google Scholar]
- Koutakis, P.; Johanning, J.M.; Haynatzki, G.R.; Myers, S.A.; Stergiou, N.; Longo, G.M.; Pipinos, I.I. Abnormal Joint Powers Before and After the Onset of Claudication Symptoms. J. Vasc. Surgery 2010, 52, 340. [Google Scholar] [CrossRef] [PubMed]
- Wurdeman, S.R.; Koutakis, P.; Myers, S.A.; Johanning, J.M.; Pipinos, I.I.; Stergiou, N. Patients with peripheral arterial disease exhibit reduced joint powers compared to velocity-matched controls. Gait Posture 2012, 36, 506–509. [Google Scholar] [CrossRef] [PubMed]
- Kakihana, T.; Ito, O.; Sekiguchi, Y.; Ito, D.; Goto, H.; Akamatsu, D.; Matsumoto, Y.; Kohzuki, M. Hip flexor muscle dysfunction during walking at self-selected and fast speed in patients with aortoiliac peripheral arterial disease. J. Vasc. Surgery 2017, 66, 523–532. [Google Scholar] [CrossRef]
- Koutakis, P.; Miserlis, D.; Myers, S.A.; Kim, J.K.; Zhu, Z.; Papoutsi, E.; Swanson, S.A.; Haynatzki, G.; Ha, D.M.; Carpenter, L.A.; et al. Abnormal accumulation of desmin in gastrocnemius myofibers of patients with peripheral artery disease: Associations with altered myofiber morphology and density, mitochondrial dysfunction and impaired limb function. J. Histochem. Cytochem. 2015, 63, 256–269. [Google Scholar] [CrossRef]
- Koutakis, P.; Myers, S.A.; Cluff, K.; Ha, D.M.; Haynatzki, G.; McComb, R.D.; Uchida, K.; Miserlis, D.; Papoutsi, E.; Johanning, J.M.; et al. Abnormal myofiber morphology and limb dysfunction in claudication. J. Surg. Res. 2015, 196, 172–179. [Google Scholar] [CrossRef]
- Beckitt, T.A.; Day, J.; Morgan, M.; Lamont, P.M. Skeletal muscle adaptation in response to supervised exercise training for intermittent claudication. Eur. J. Vasc. Endovasc. Surg. 2012, 44, 313–317. [Google Scholar] [CrossRef]
- Baker, W.B.; Li, Z.; Schenkel, S.S.; Chandra, M.; Busch, D.R.; Englund, E.K.; Schmitz, K.H.; Yodh, A.G.; Floyd, T.F.; Mohler III, E.R. Effects of exercise training on calf muscle oxygen extraction and blood flow in patients with peripheral artery disease. J. Appl. Physiol. 2017, 123, 1599–1609. [Google Scholar] [CrossRef]
- McDermott, M.M.; Dayanidhi, S.; Kosmac, K.; Saini, S.; Slysz, J.; Leeuwenburgh, C.; Hartnell, L.; Sufit, R.; Ferrucci, L. Walking exercise therapy effects on lower extremity skeletal muscle in peripheral artery disease. Circ. Res. 2021, 128, 1851–1867. [Google Scholar] [CrossRef]
- Myers, S.A.; Johanning, J.M.; Stergiou, N.; Celis, R.I.; Robinson, L.; Pipinos, I.I. Gait variability is altered in patients with peripheral arterial disease. J. Vasc. Surg. 2009, 49, 924–931. [Google Scholar] [CrossRef]
- Alexander, N.; Schwameder, H. Effect of sloped walking on lower limb muscle forces. Gait Posture 2016, 47, 62–67. [Google Scholar] [CrossRef] [PubMed]
- Besier, T.F.; Fredericson, M.; Gold, G.E.; Beaupré, G.S.; Delp, S.L. Knee muscle forces during walking and running in patellofemoral pain patients and pain-free controls. J. Biomech. 2009, 42, 898–905. [Google Scholar] [CrossRef] [PubMed]
- Gomes, A.A.; Ackermann, M.; Ferreira, J.P.; Orselli, M.I.V.; Sacco, I.C.N. Muscle force distribution of the lower limbs during walking in diabetic individuals with and without polyneuropathy. J. Neuroeng. Rehabil. 2017, 14, 111. [Google Scholar] [CrossRef] [PubMed]
- Kulmala, J.P.; Korhonen, M.T.; Ruggiero, L.; Kuitunen, S.; Suominen, H.; Heinonen, A.; Mikkola, A.; Avela, J. Walking and Running Require Greater Effort from the Ankle than the Knee Extensor Muscles. Med. Sci. Sports Exerc. 2016, 48, 2181–2189. [Google Scholar] [CrossRef]
- Kulmala, J.P.; Korhonen, M.T.; Ruggiero, L.; Kuitunen, S.; Suominen, H.; Heinonen, A.; Mikkola, A.; Avela, J. Ankle and knee extensor muscle effort during locomotion in young and older athletes: Implications for understanding age-related locomotor decline. Sci. Rep. 2020, 10, 2801. [Google Scholar] [CrossRef]
- Lin, Y.C.; Dorn, T.W.; Schache, A.G.; Pandy, M.G. Comparison of different methods for estimating muscle forces in human movement. Proc. Inst. Mech. Eng. Part H J. Eng. Med. 2012, 226, 103–112. [Google Scholar] [CrossRef]

Disclaimer/Publisher’s Note: The statements, opinions and data contained in all publications are solely those of the individual author(s) and contributor(s) and not of MDPI and/or the editor(s). MDPI and/or the editor(s) disclaim responsibility for any injury to people or property resulting from any ideas, methods, instructions or products referred to in the content. |
© 2024 by the authors. Licensee MDPI, Basel, Switzerland. This article is an open access article distributed under the terms and conditions of the Creative Commons Attribution (CC BY) license (https://creativecommons.org/licenses/by/4.0/).
Share and Cite
Anderson, C.P.; Pipinos, I.I.; Johanning, J.M.; Myers, S.A.; Rahman, H. Effects of Supervised Exercise Therapy on Muscle Function During Walking in Patients with Peripheral Artery Disease. Bioengineering 2024, 11, 1103. https://doi.org/10.3390/bioengineering11111103
Anderson CP, Pipinos II, Johanning JM, Myers SA, Rahman H. Effects of Supervised Exercise Therapy on Muscle Function During Walking in Patients with Peripheral Artery Disease. Bioengineering. 2024; 11(11):1103. https://doi.org/10.3390/bioengineering11111103
Chicago/Turabian StyleAnderson, Cody P., Iraklis I. Pipinos, Jason M. Johanning, Sara A. Myers, and Hafizur Rahman. 2024. "Effects of Supervised Exercise Therapy on Muscle Function During Walking in Patients with Peripheral Artery Disease" Bioengineering 11, no. 11: 1103. https://doi.org/10.3390/bioengineering11111103
APA StyleAnderson, C. P., Pipinos, I. I., Johanning, J. M., Myers, S. A., & Rahman, H. (2024). Effects of Supervised Exercise Therapy on Muscle Function During Walking in Patients with Peripheral Artery Disease. Bioengineering, 11(11), 1103. https://doi.org/10.3390/bioengineering11111103