Importance of Flood Samples for Estimating Sediment and Nutrient Loads in Mediterranean Rivers
Abstract
:1. Introduction
2. Materials and Methods
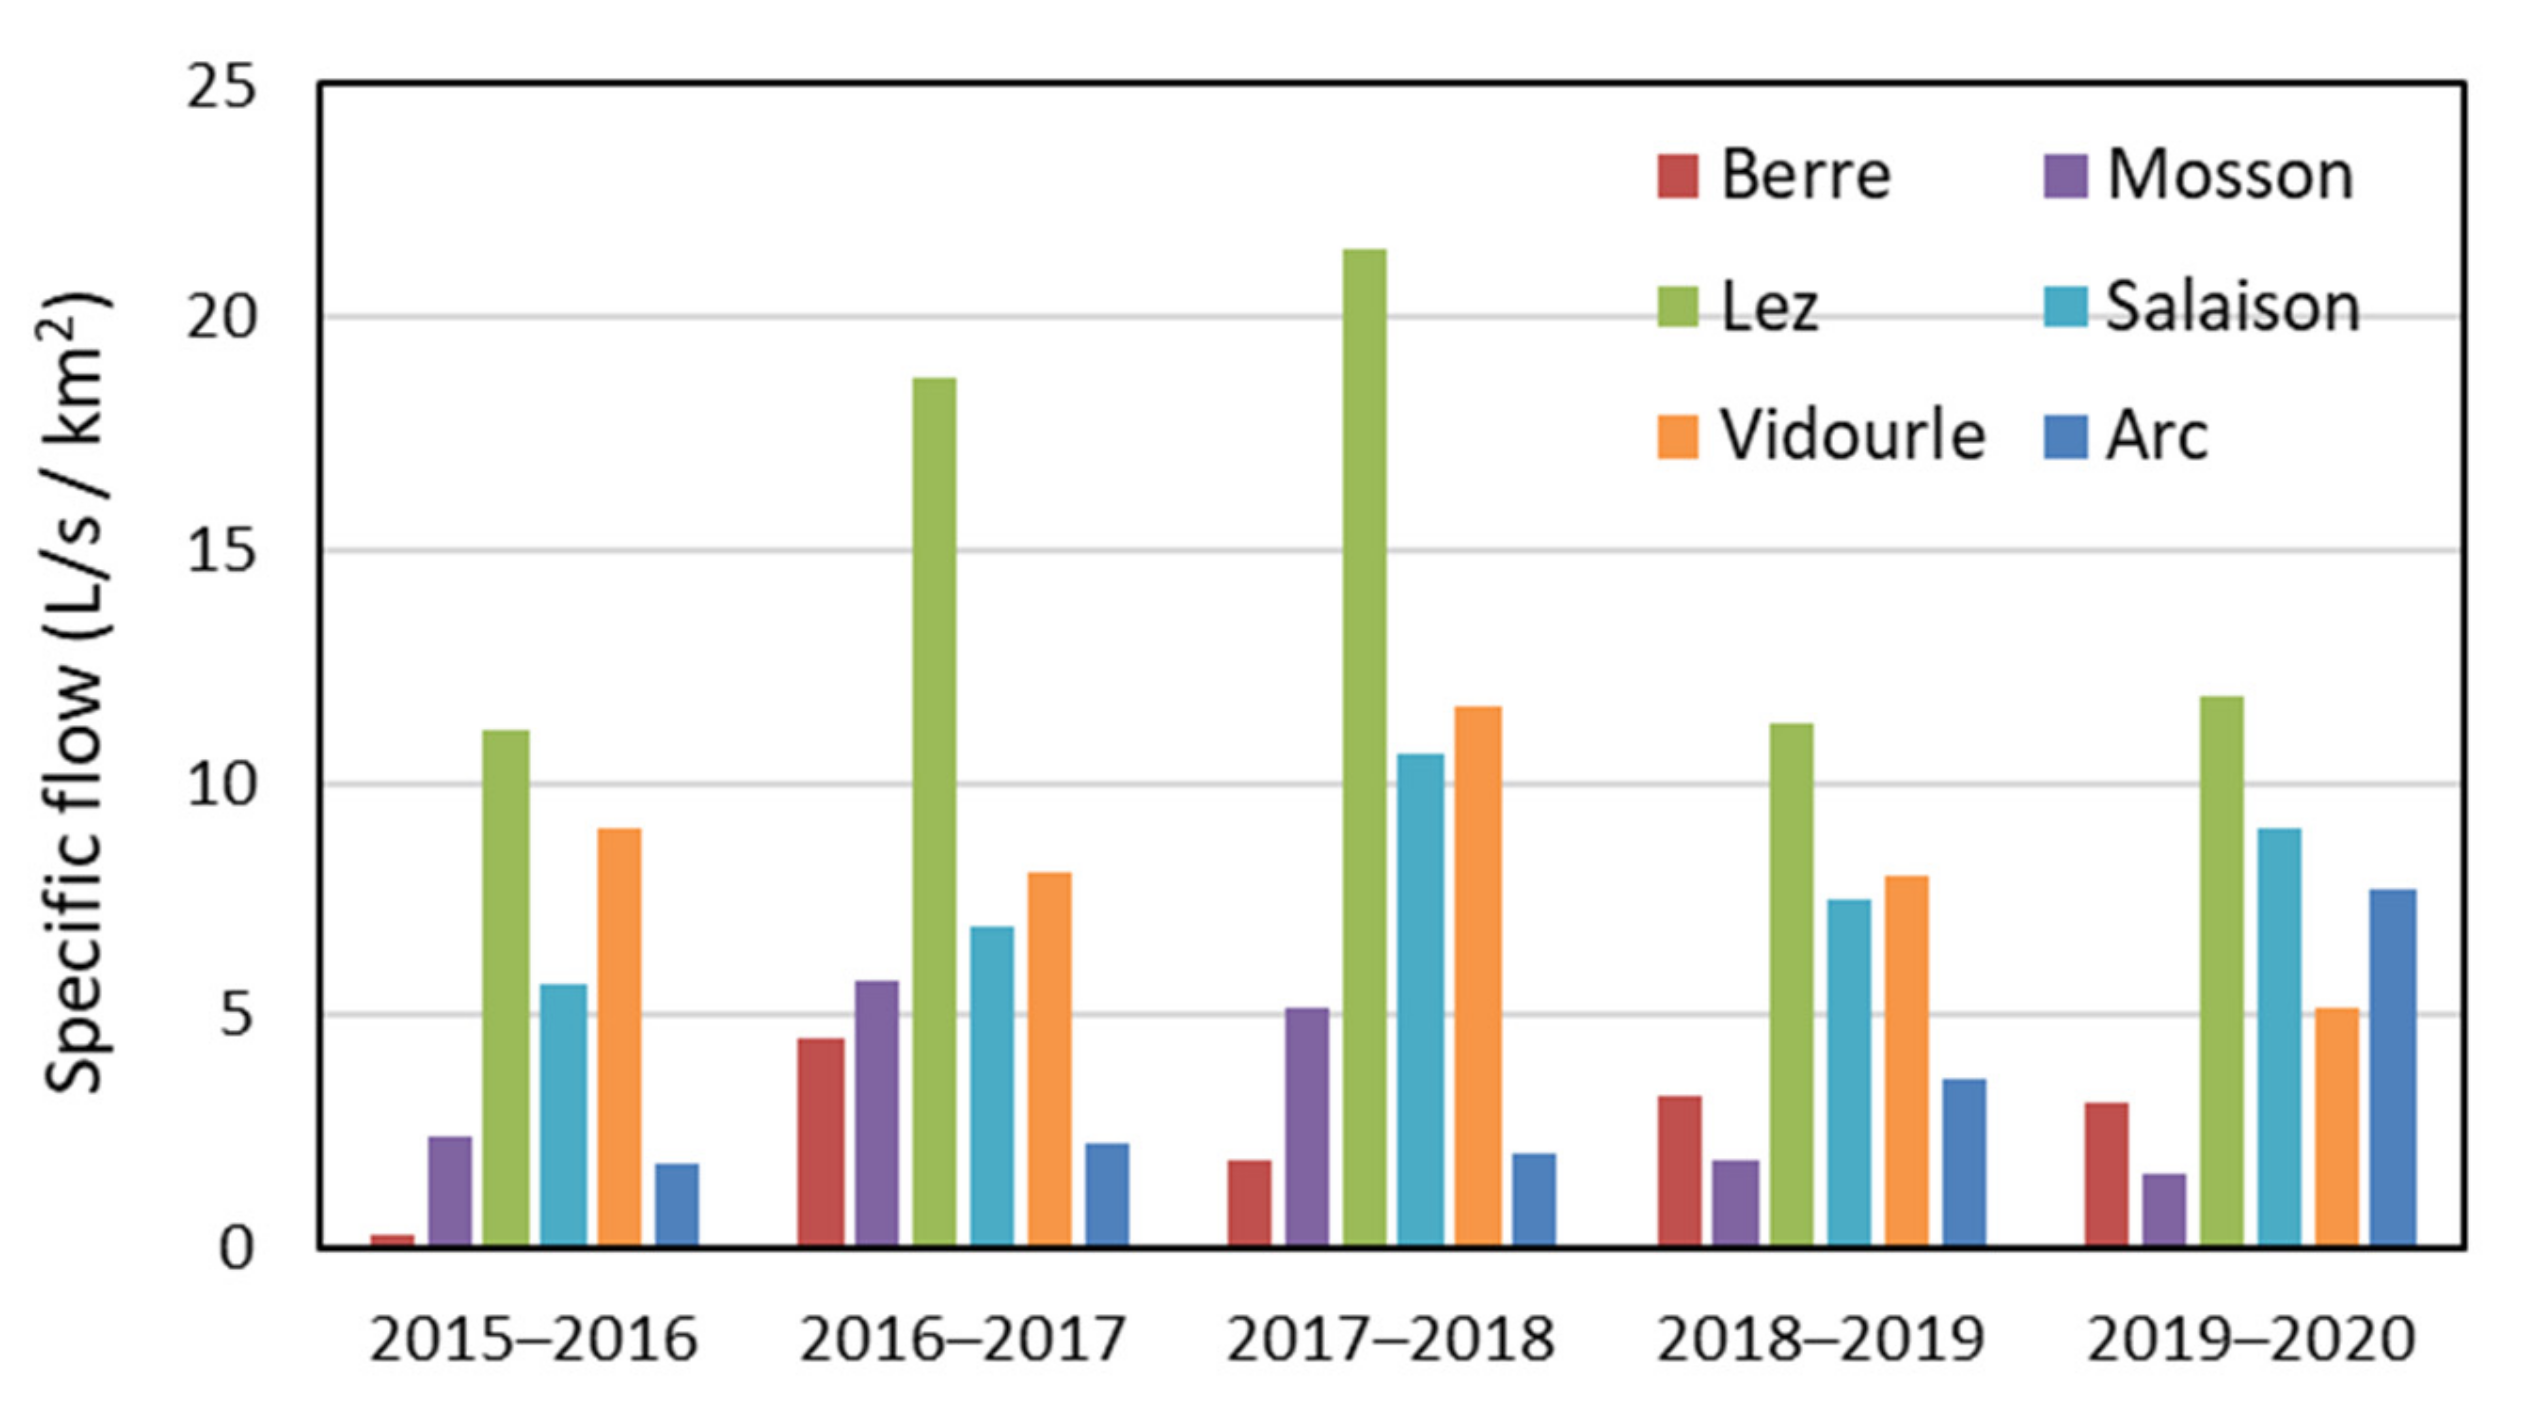
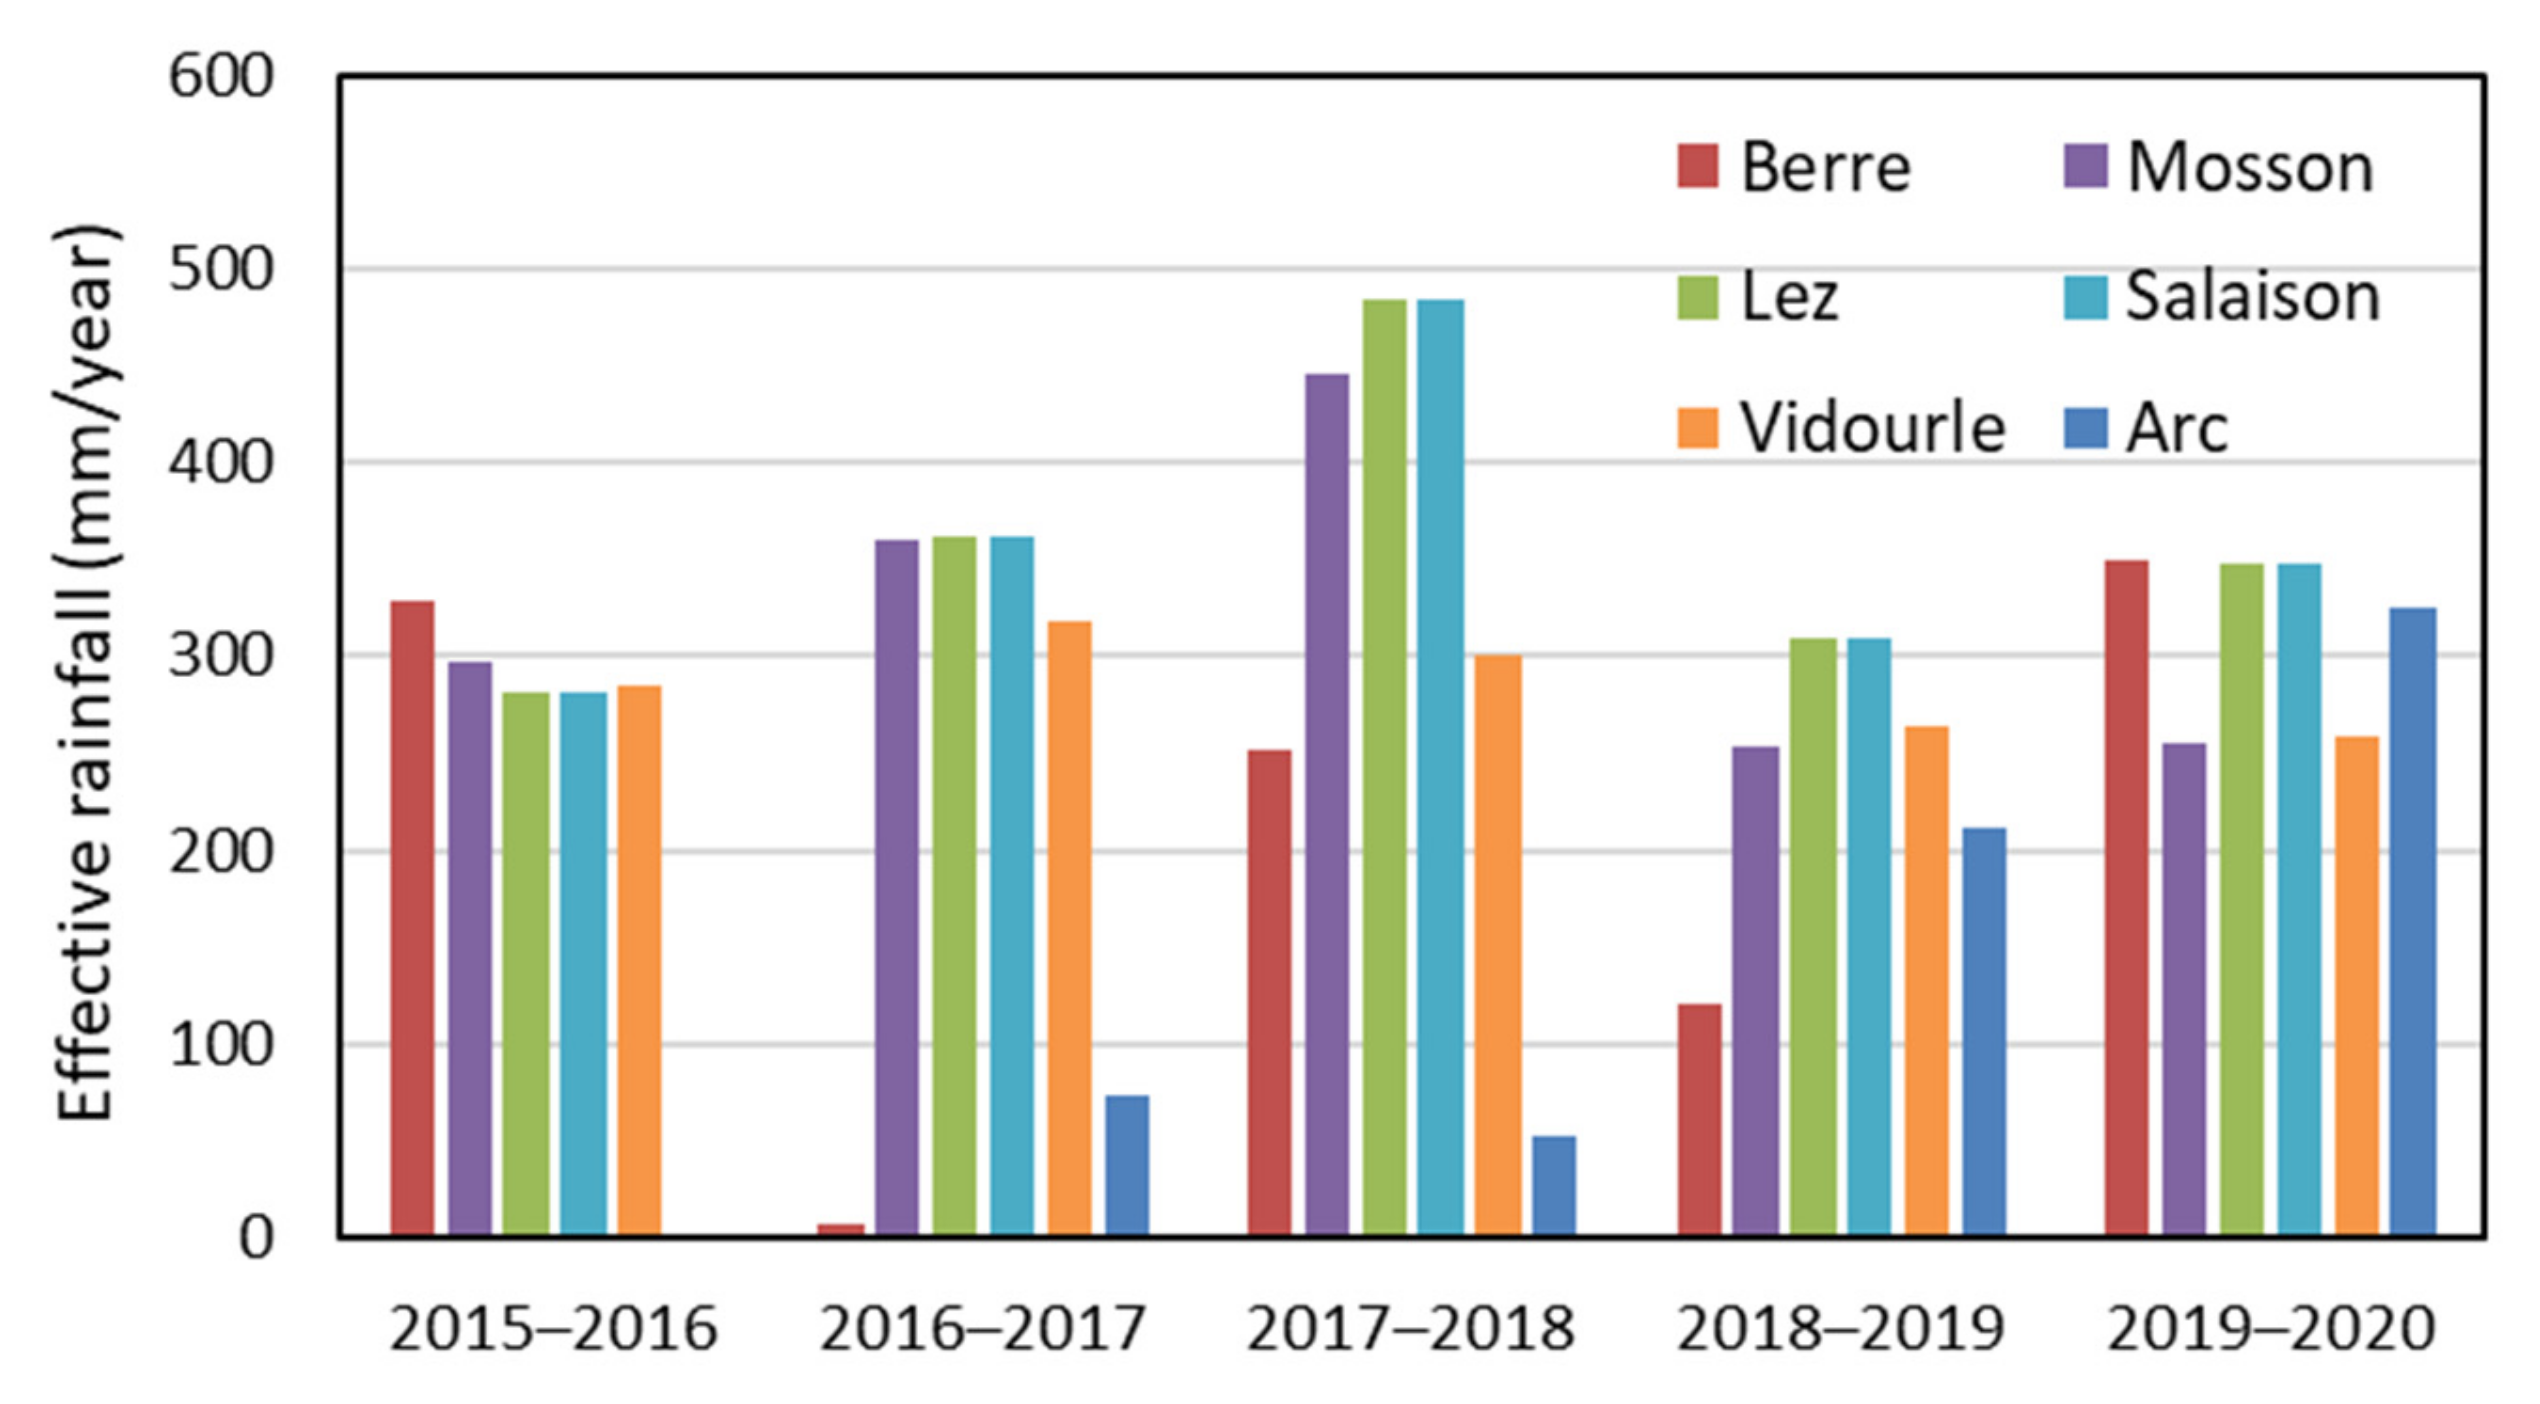
2.1. Studied Rivers
2.2. Sampling Strategy
- A flow of 249 m3/s sampled on the Berre versus a maximum instantaneous flow of 268 m3/s measured in March 2013;
- A flow of 155 m3/s sampled on the Lez versus a maximum average daily flow of 129 m3/s measured in October 2014;
- A flow of 419 m3/s sampled on the Vidourle versus a maximum average daily flow of 386 m3/s measured in September 2014.
2.3. Analytical Procedures
2.4. Load Calculation Methods
3. Results
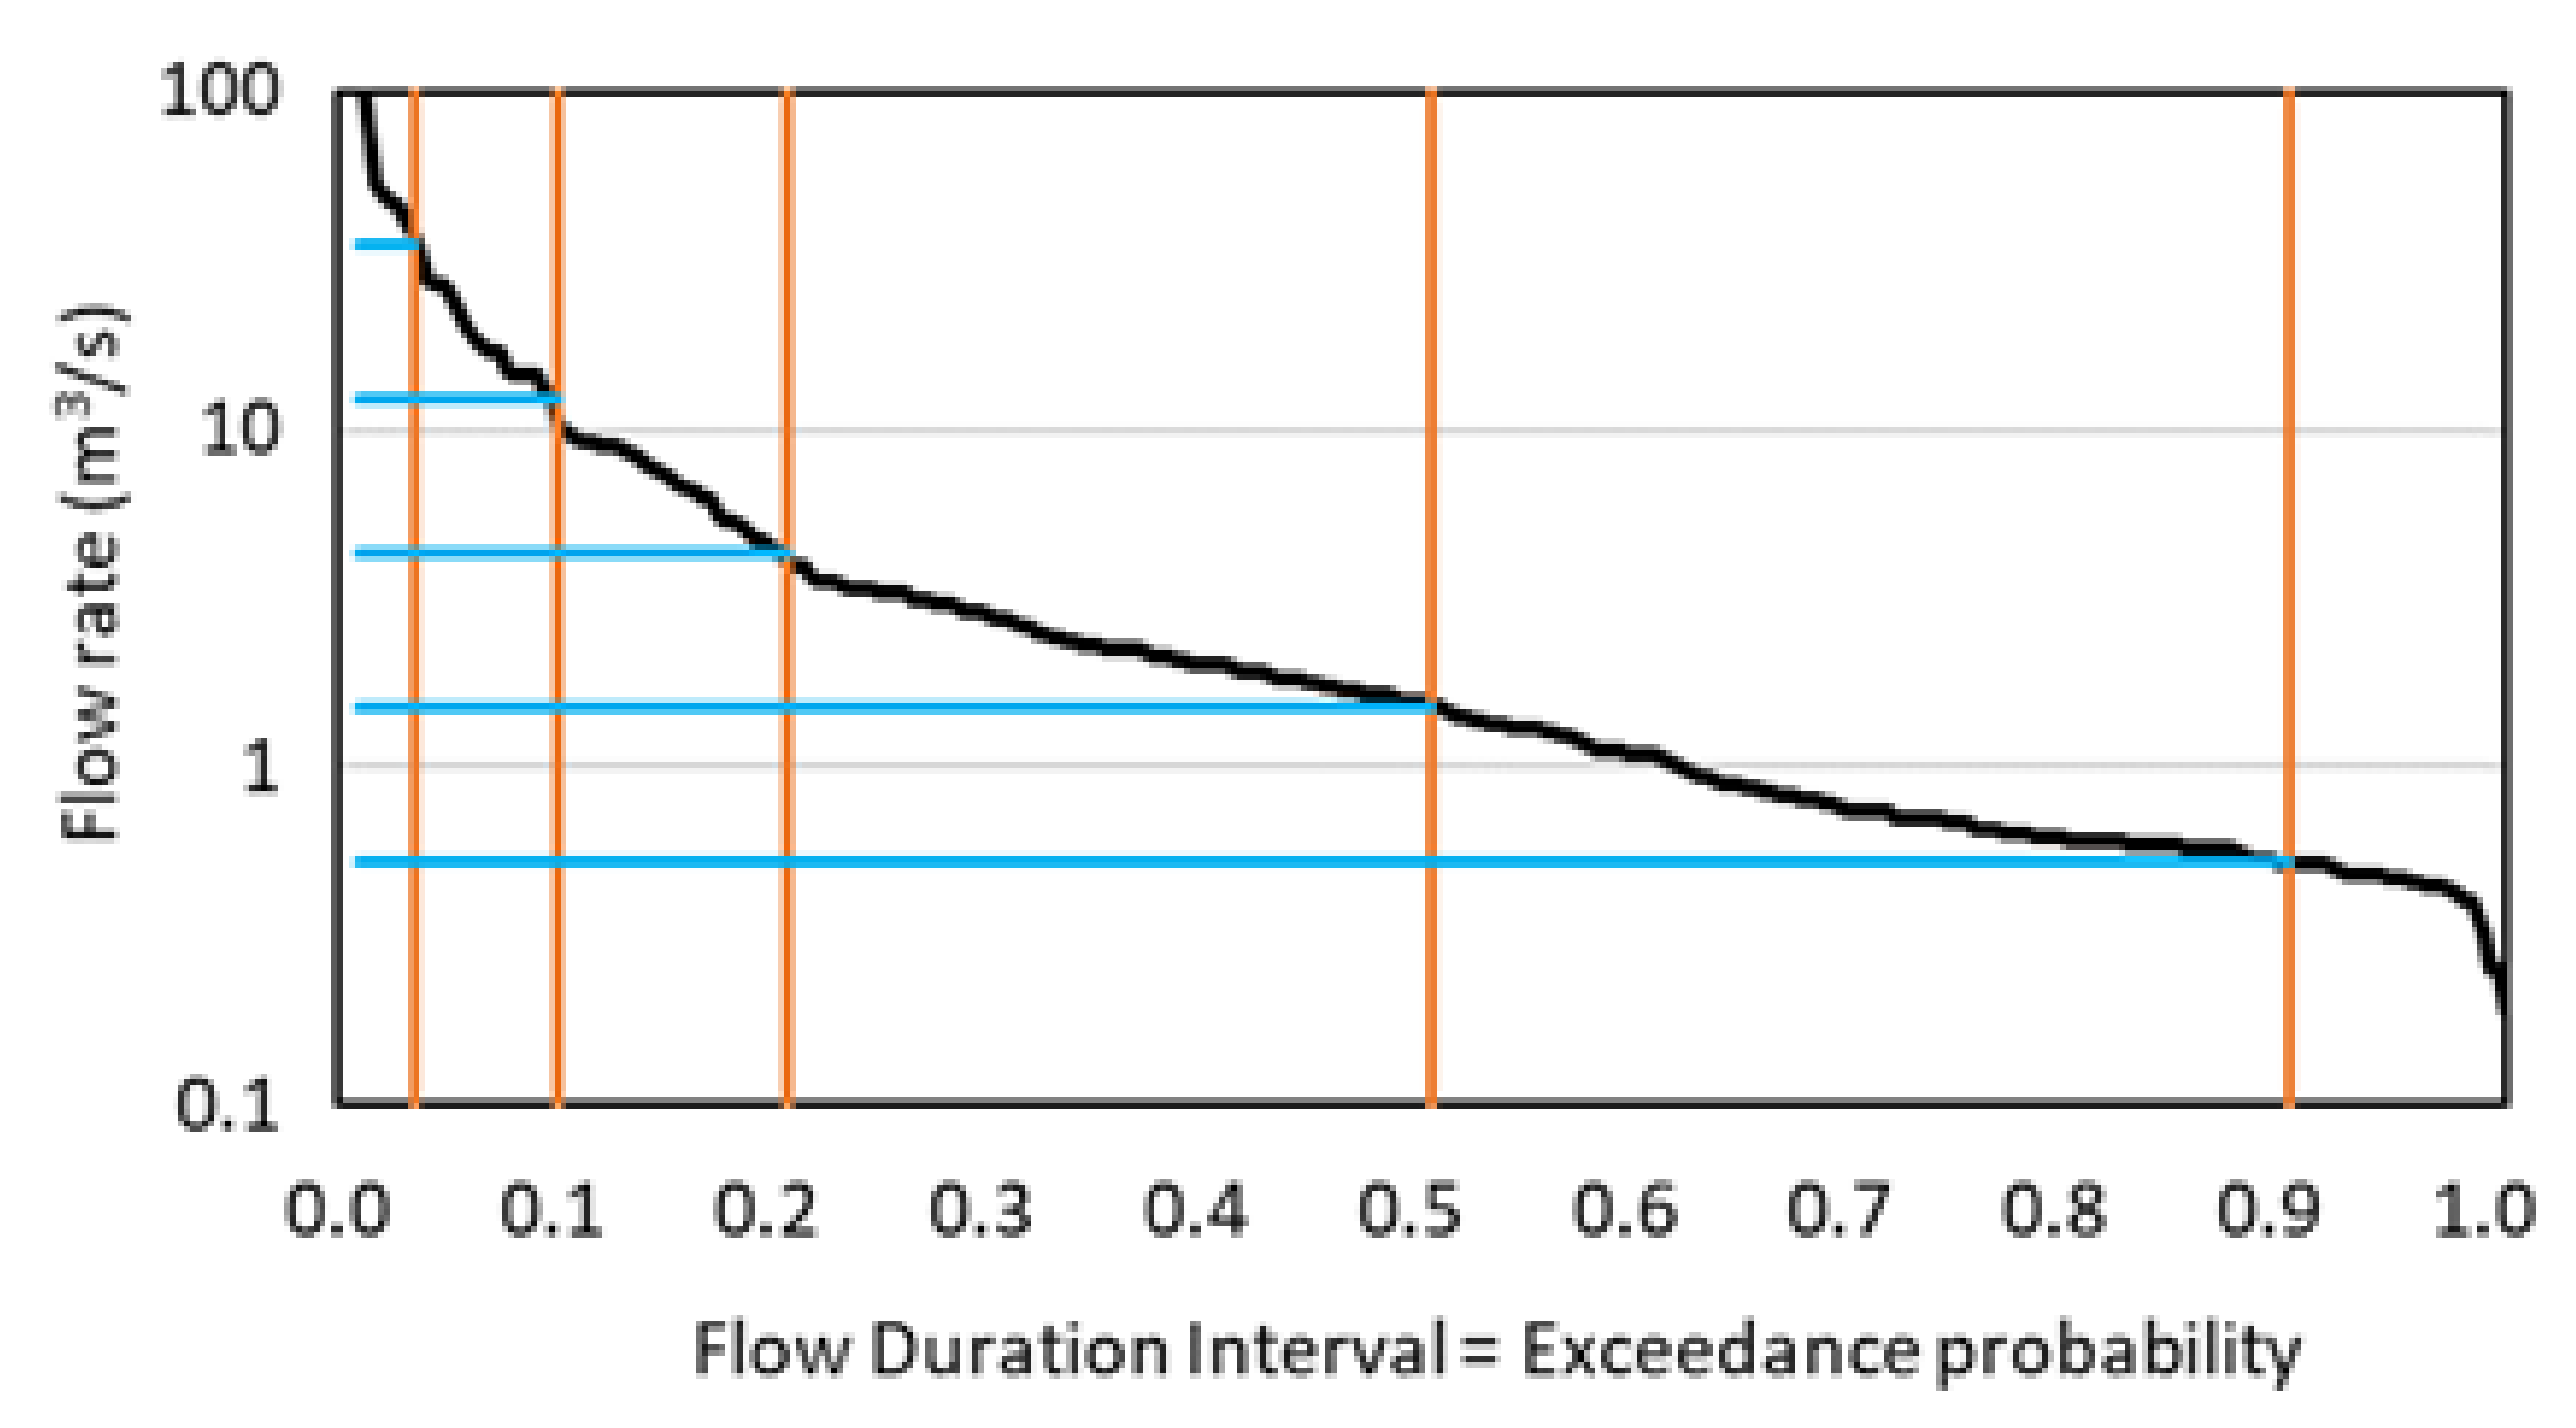
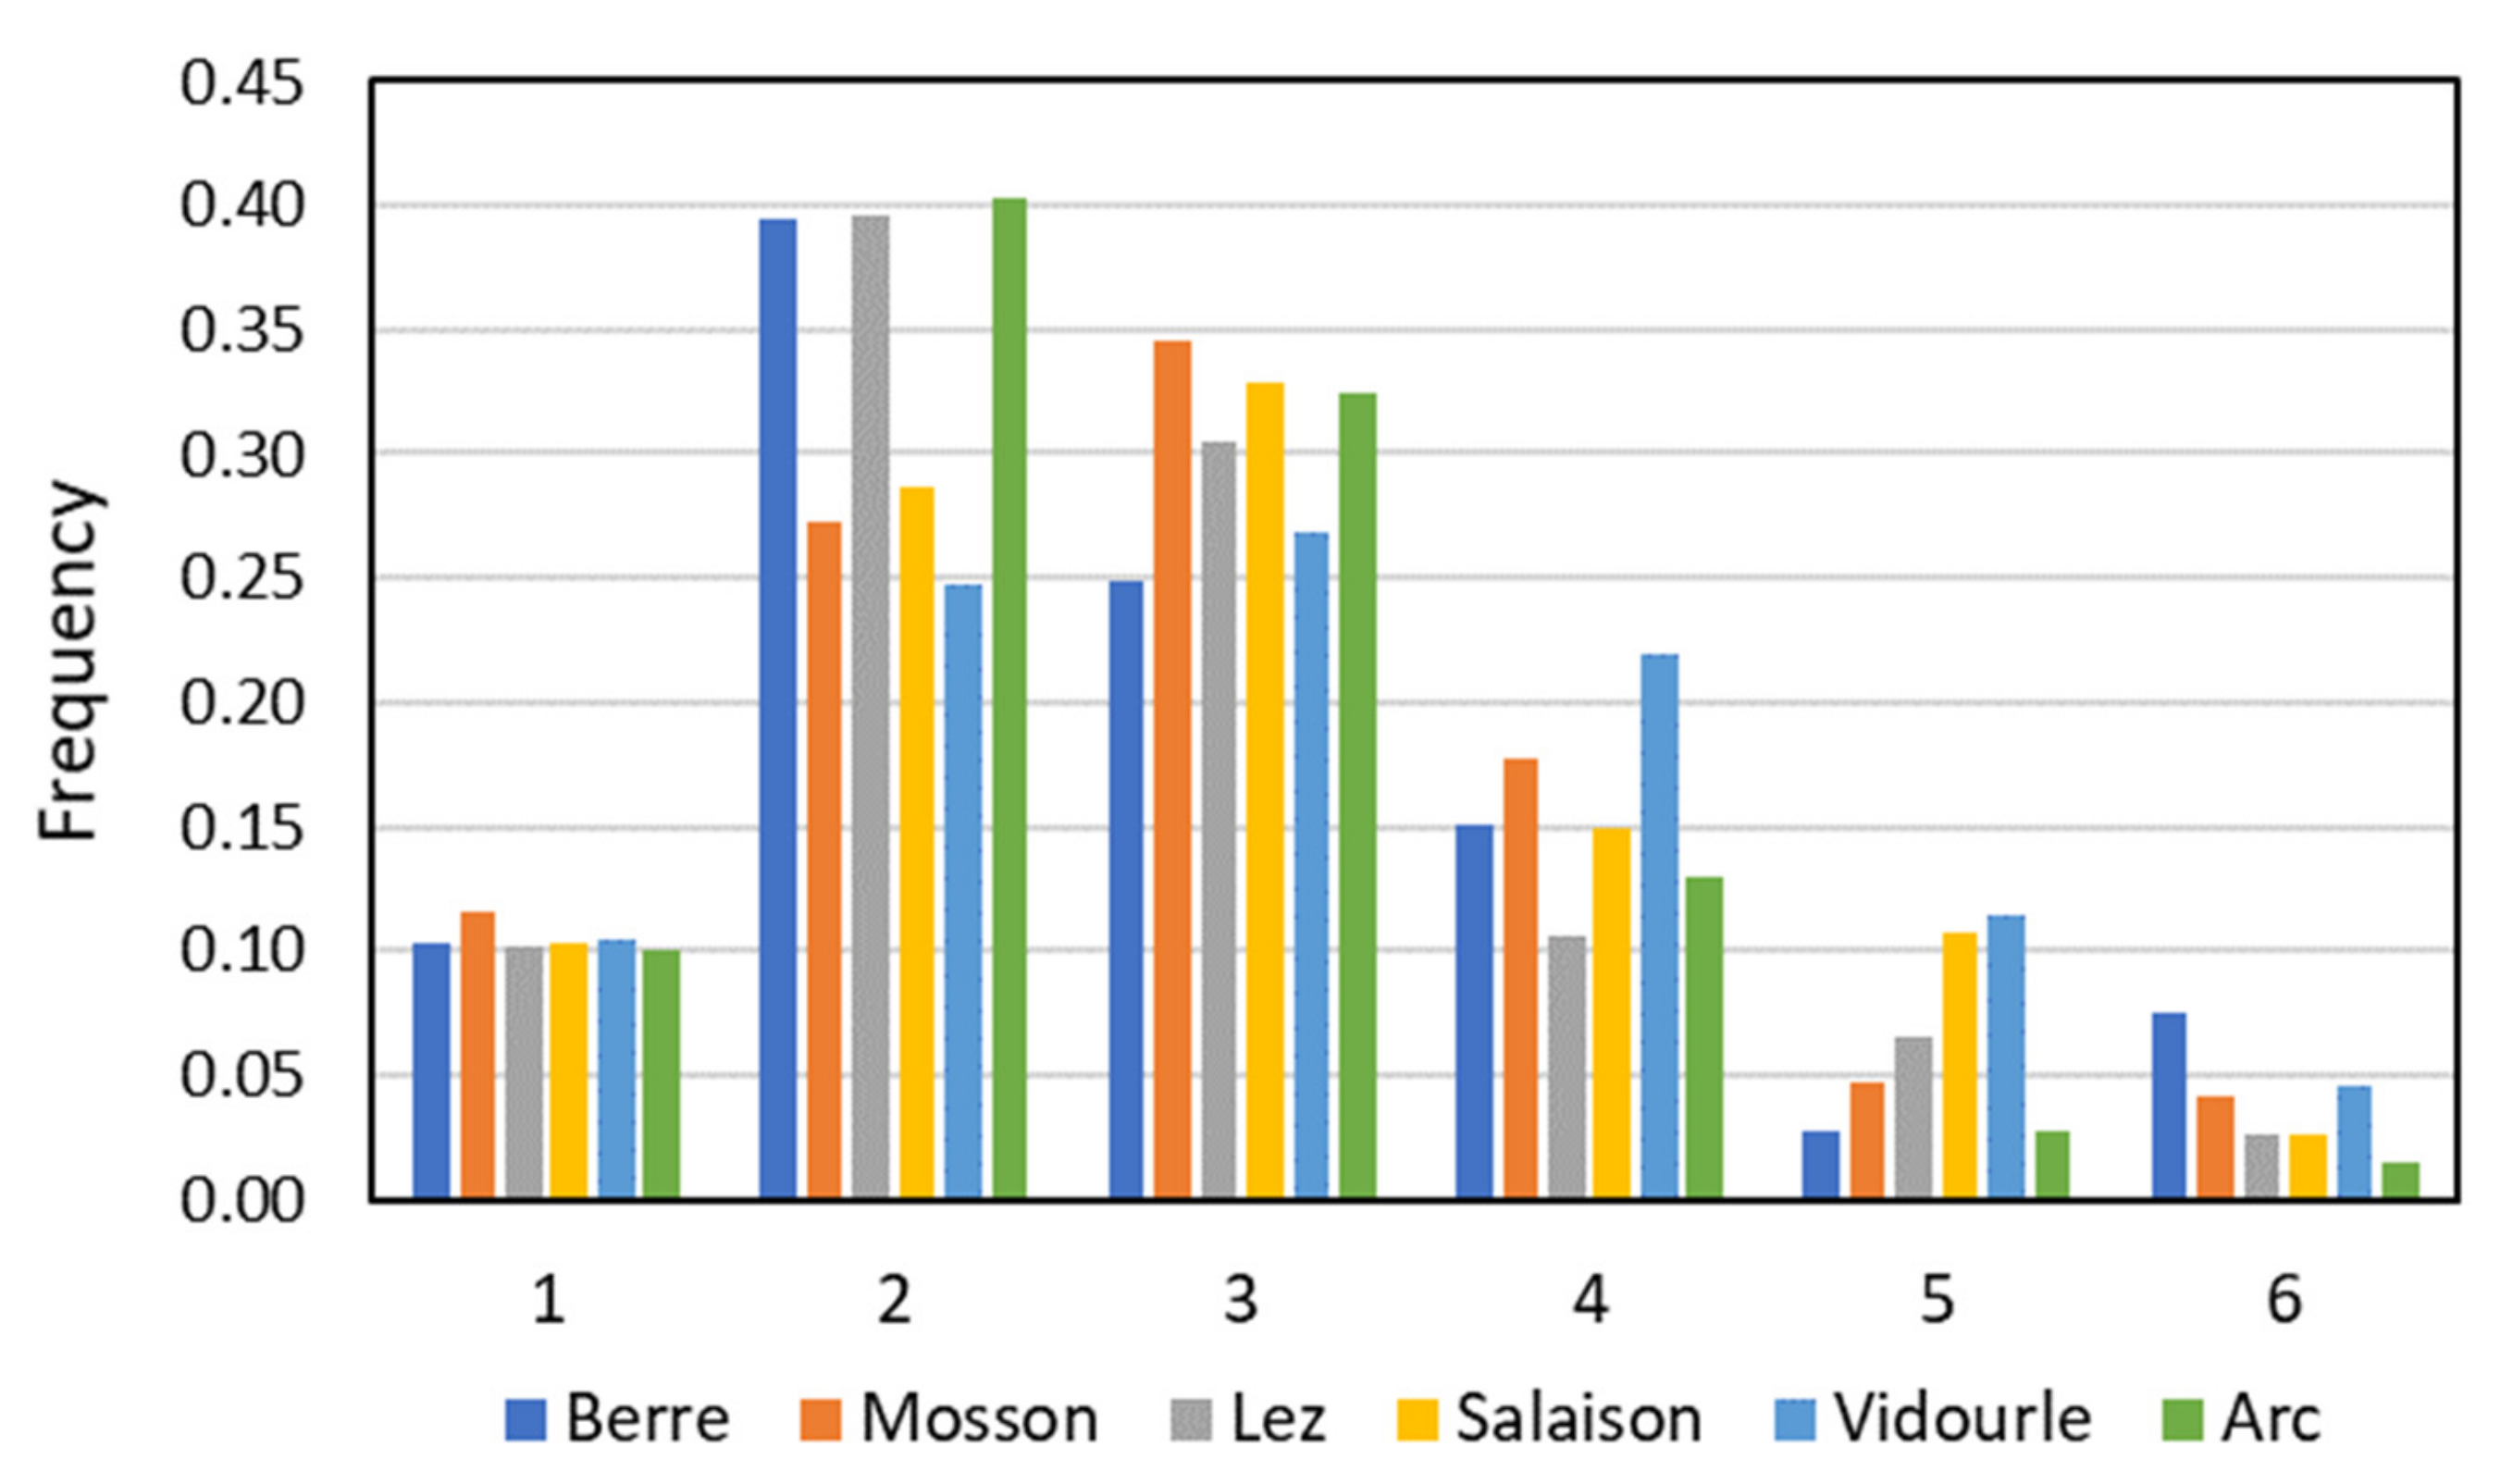
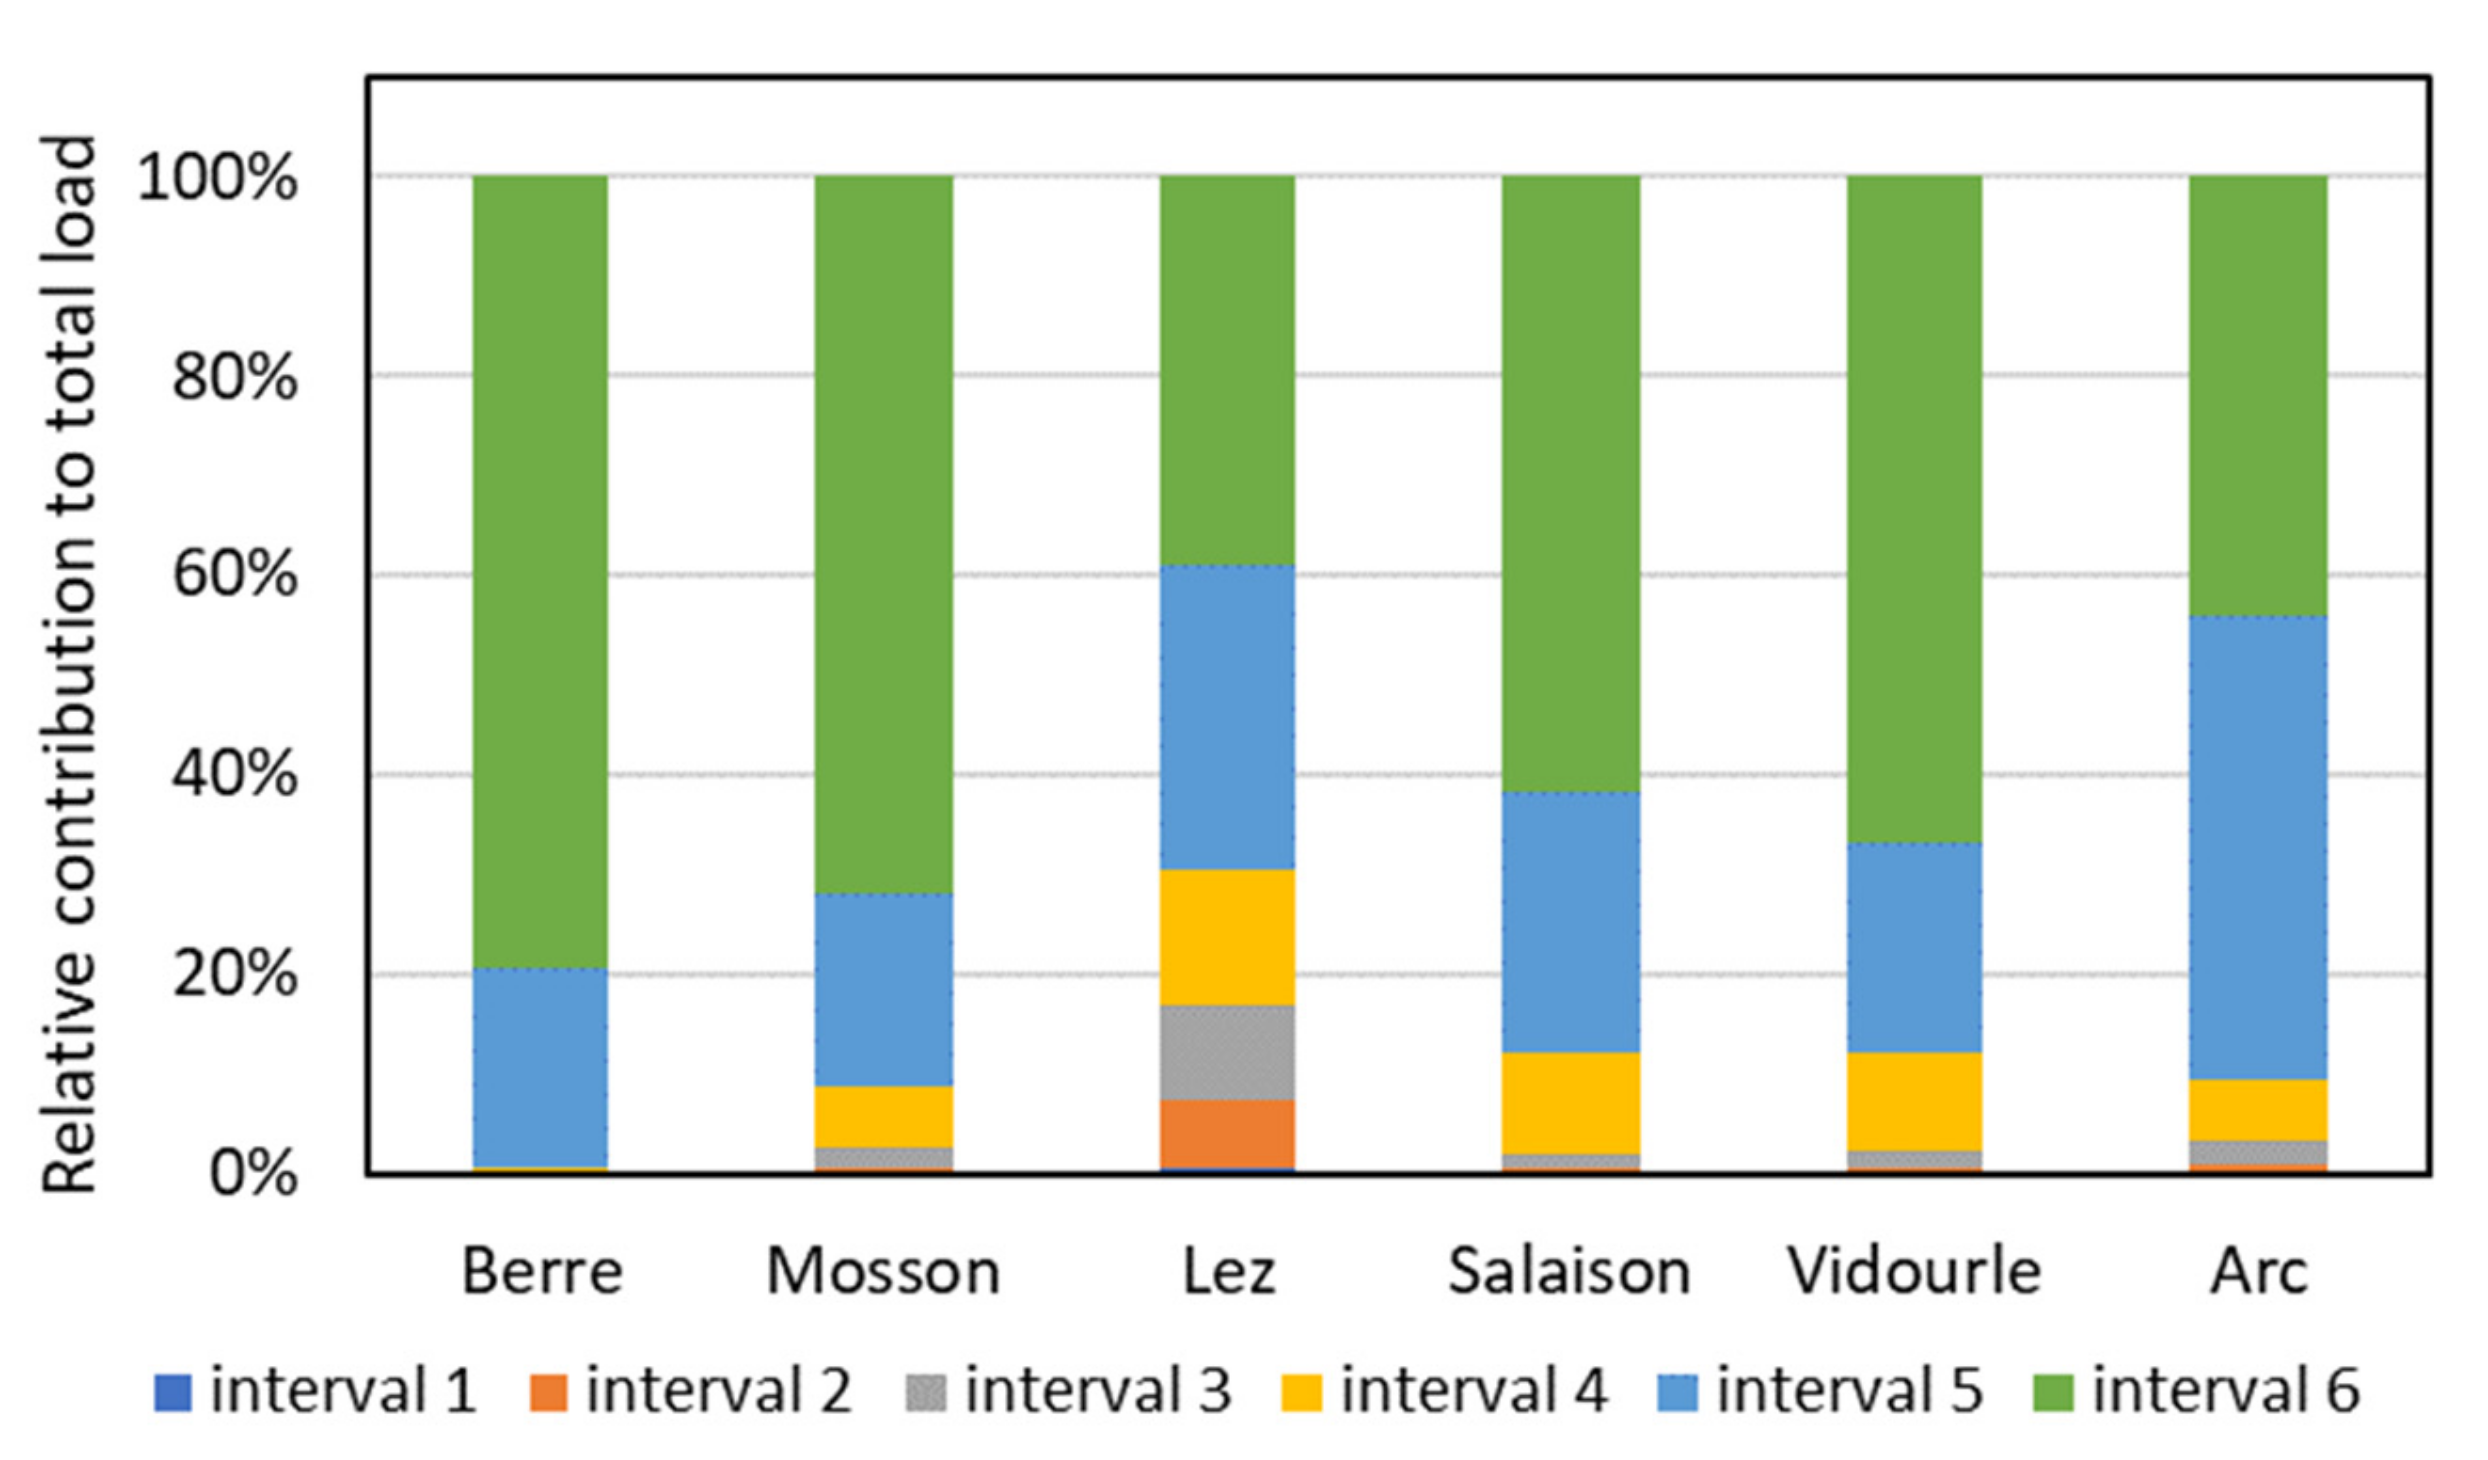
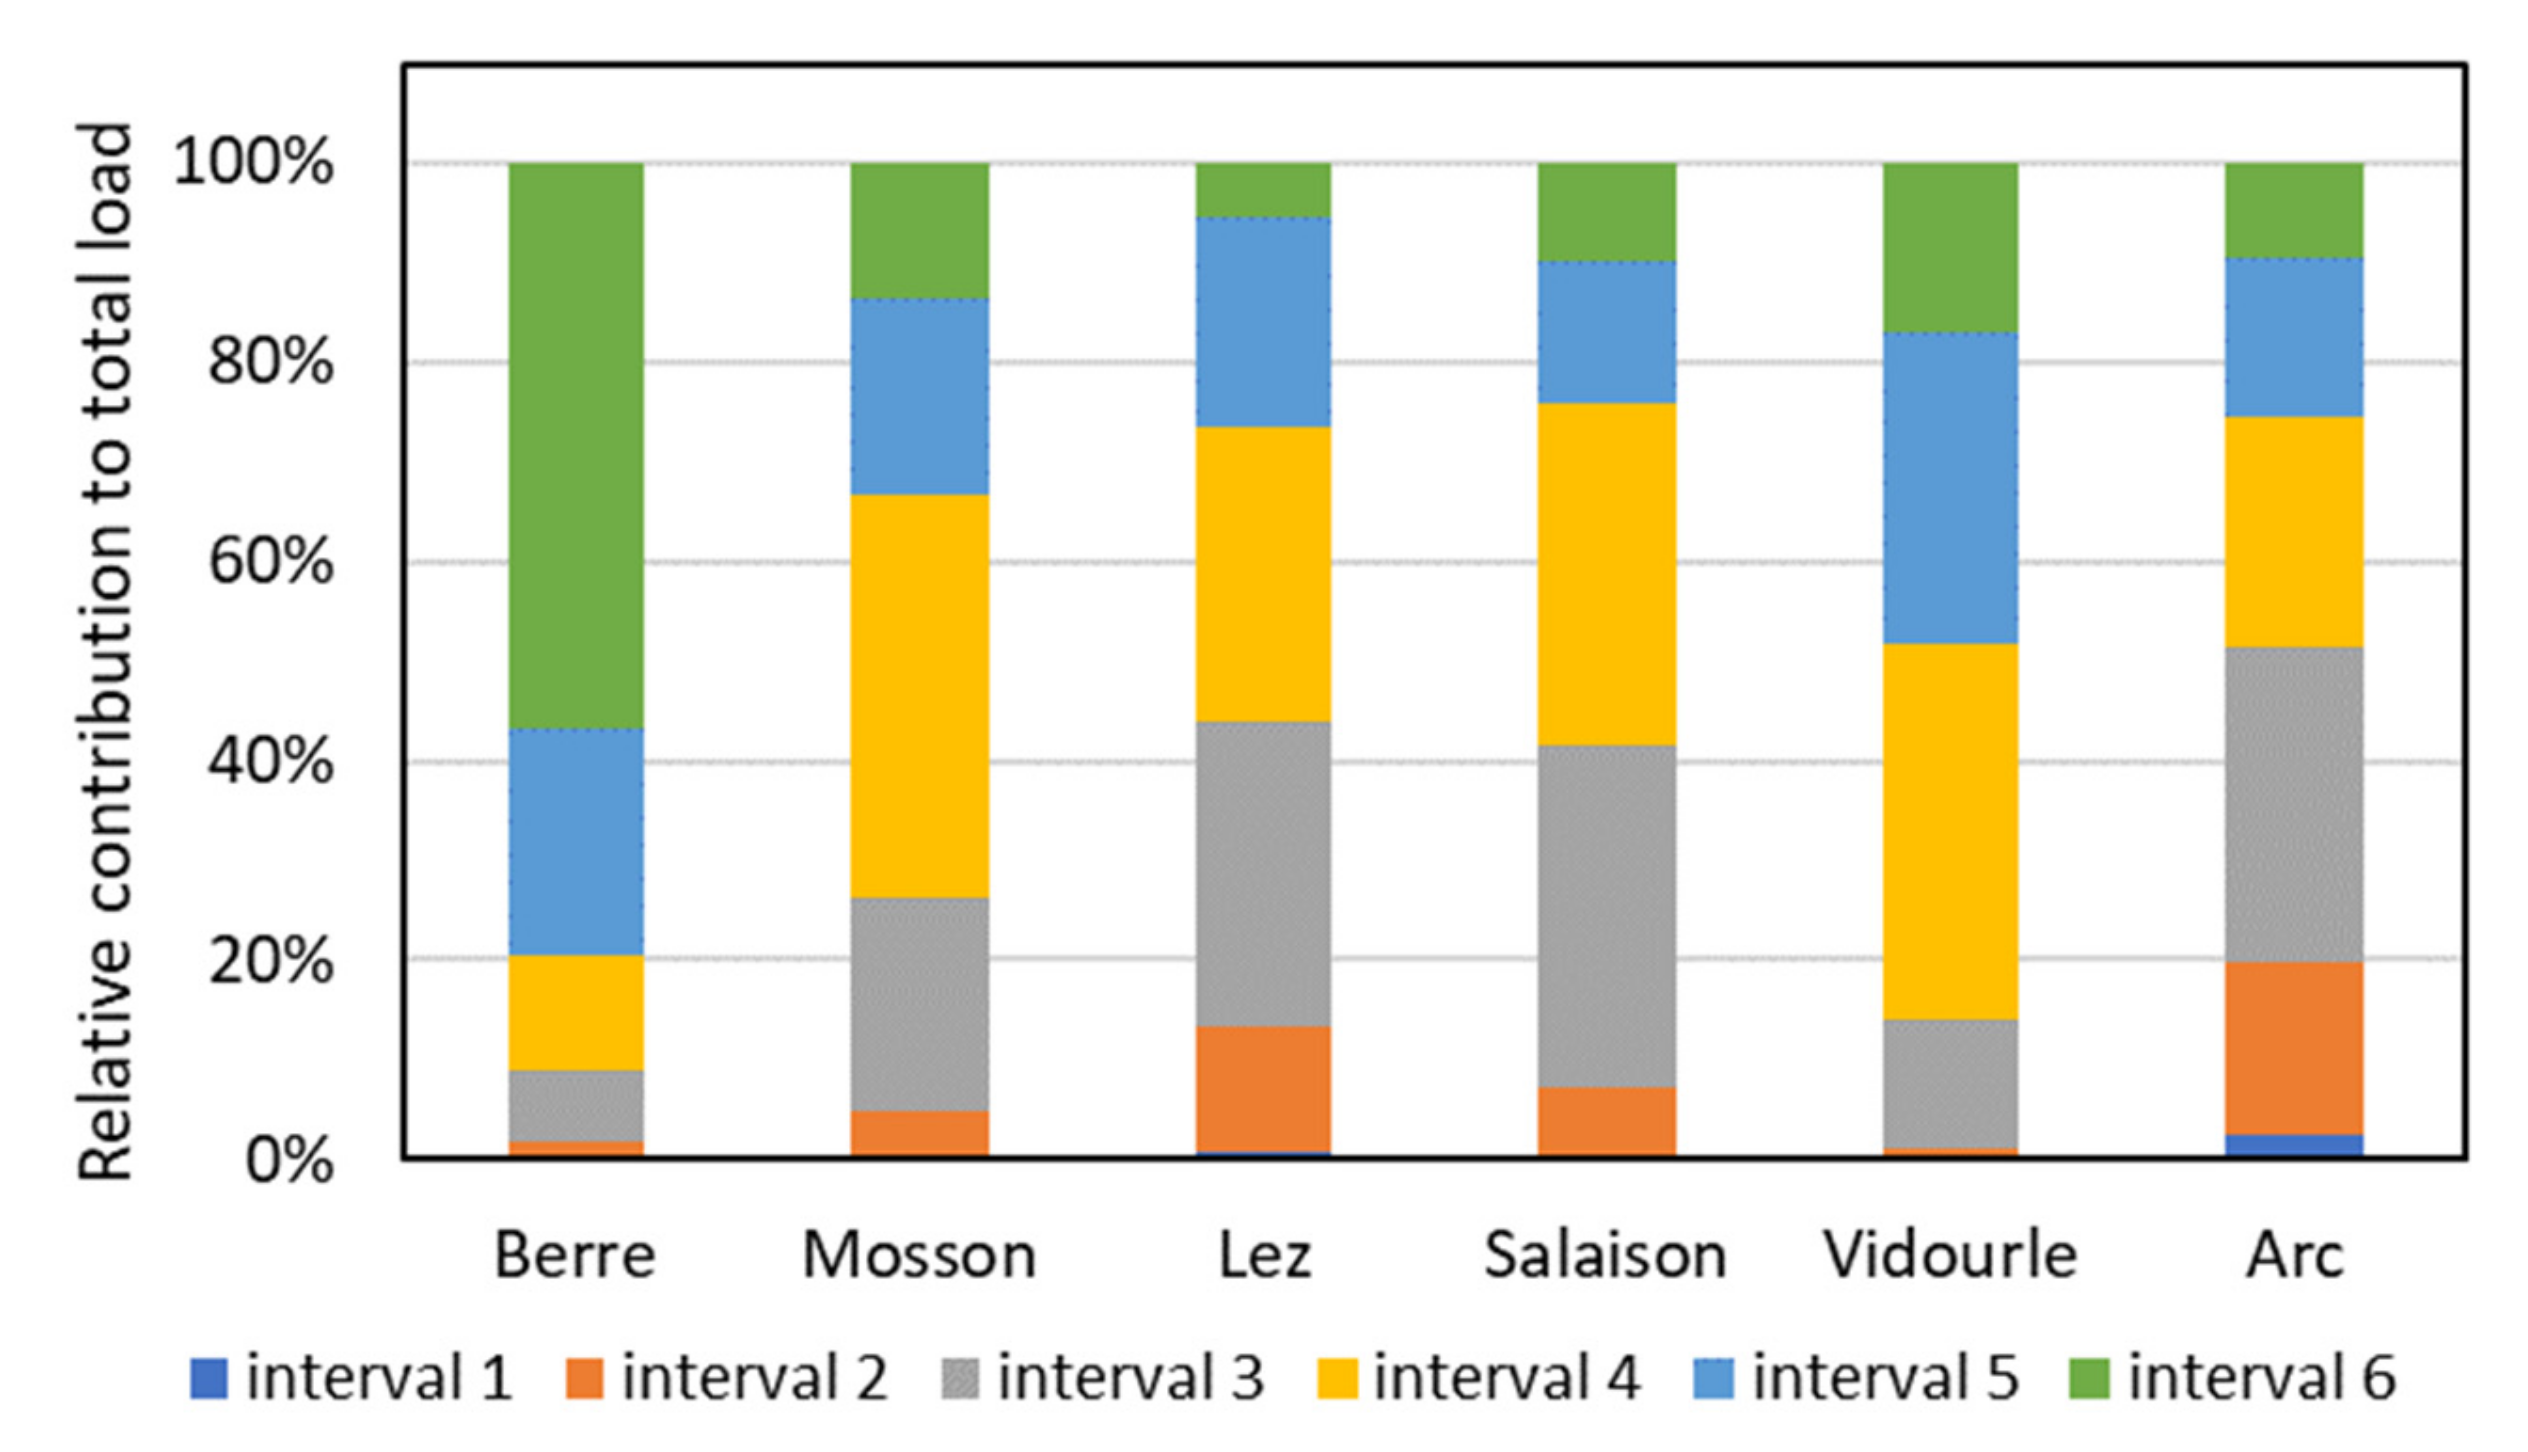
3.1. Impacts of the Flow Intervals Used in the FDRC Method
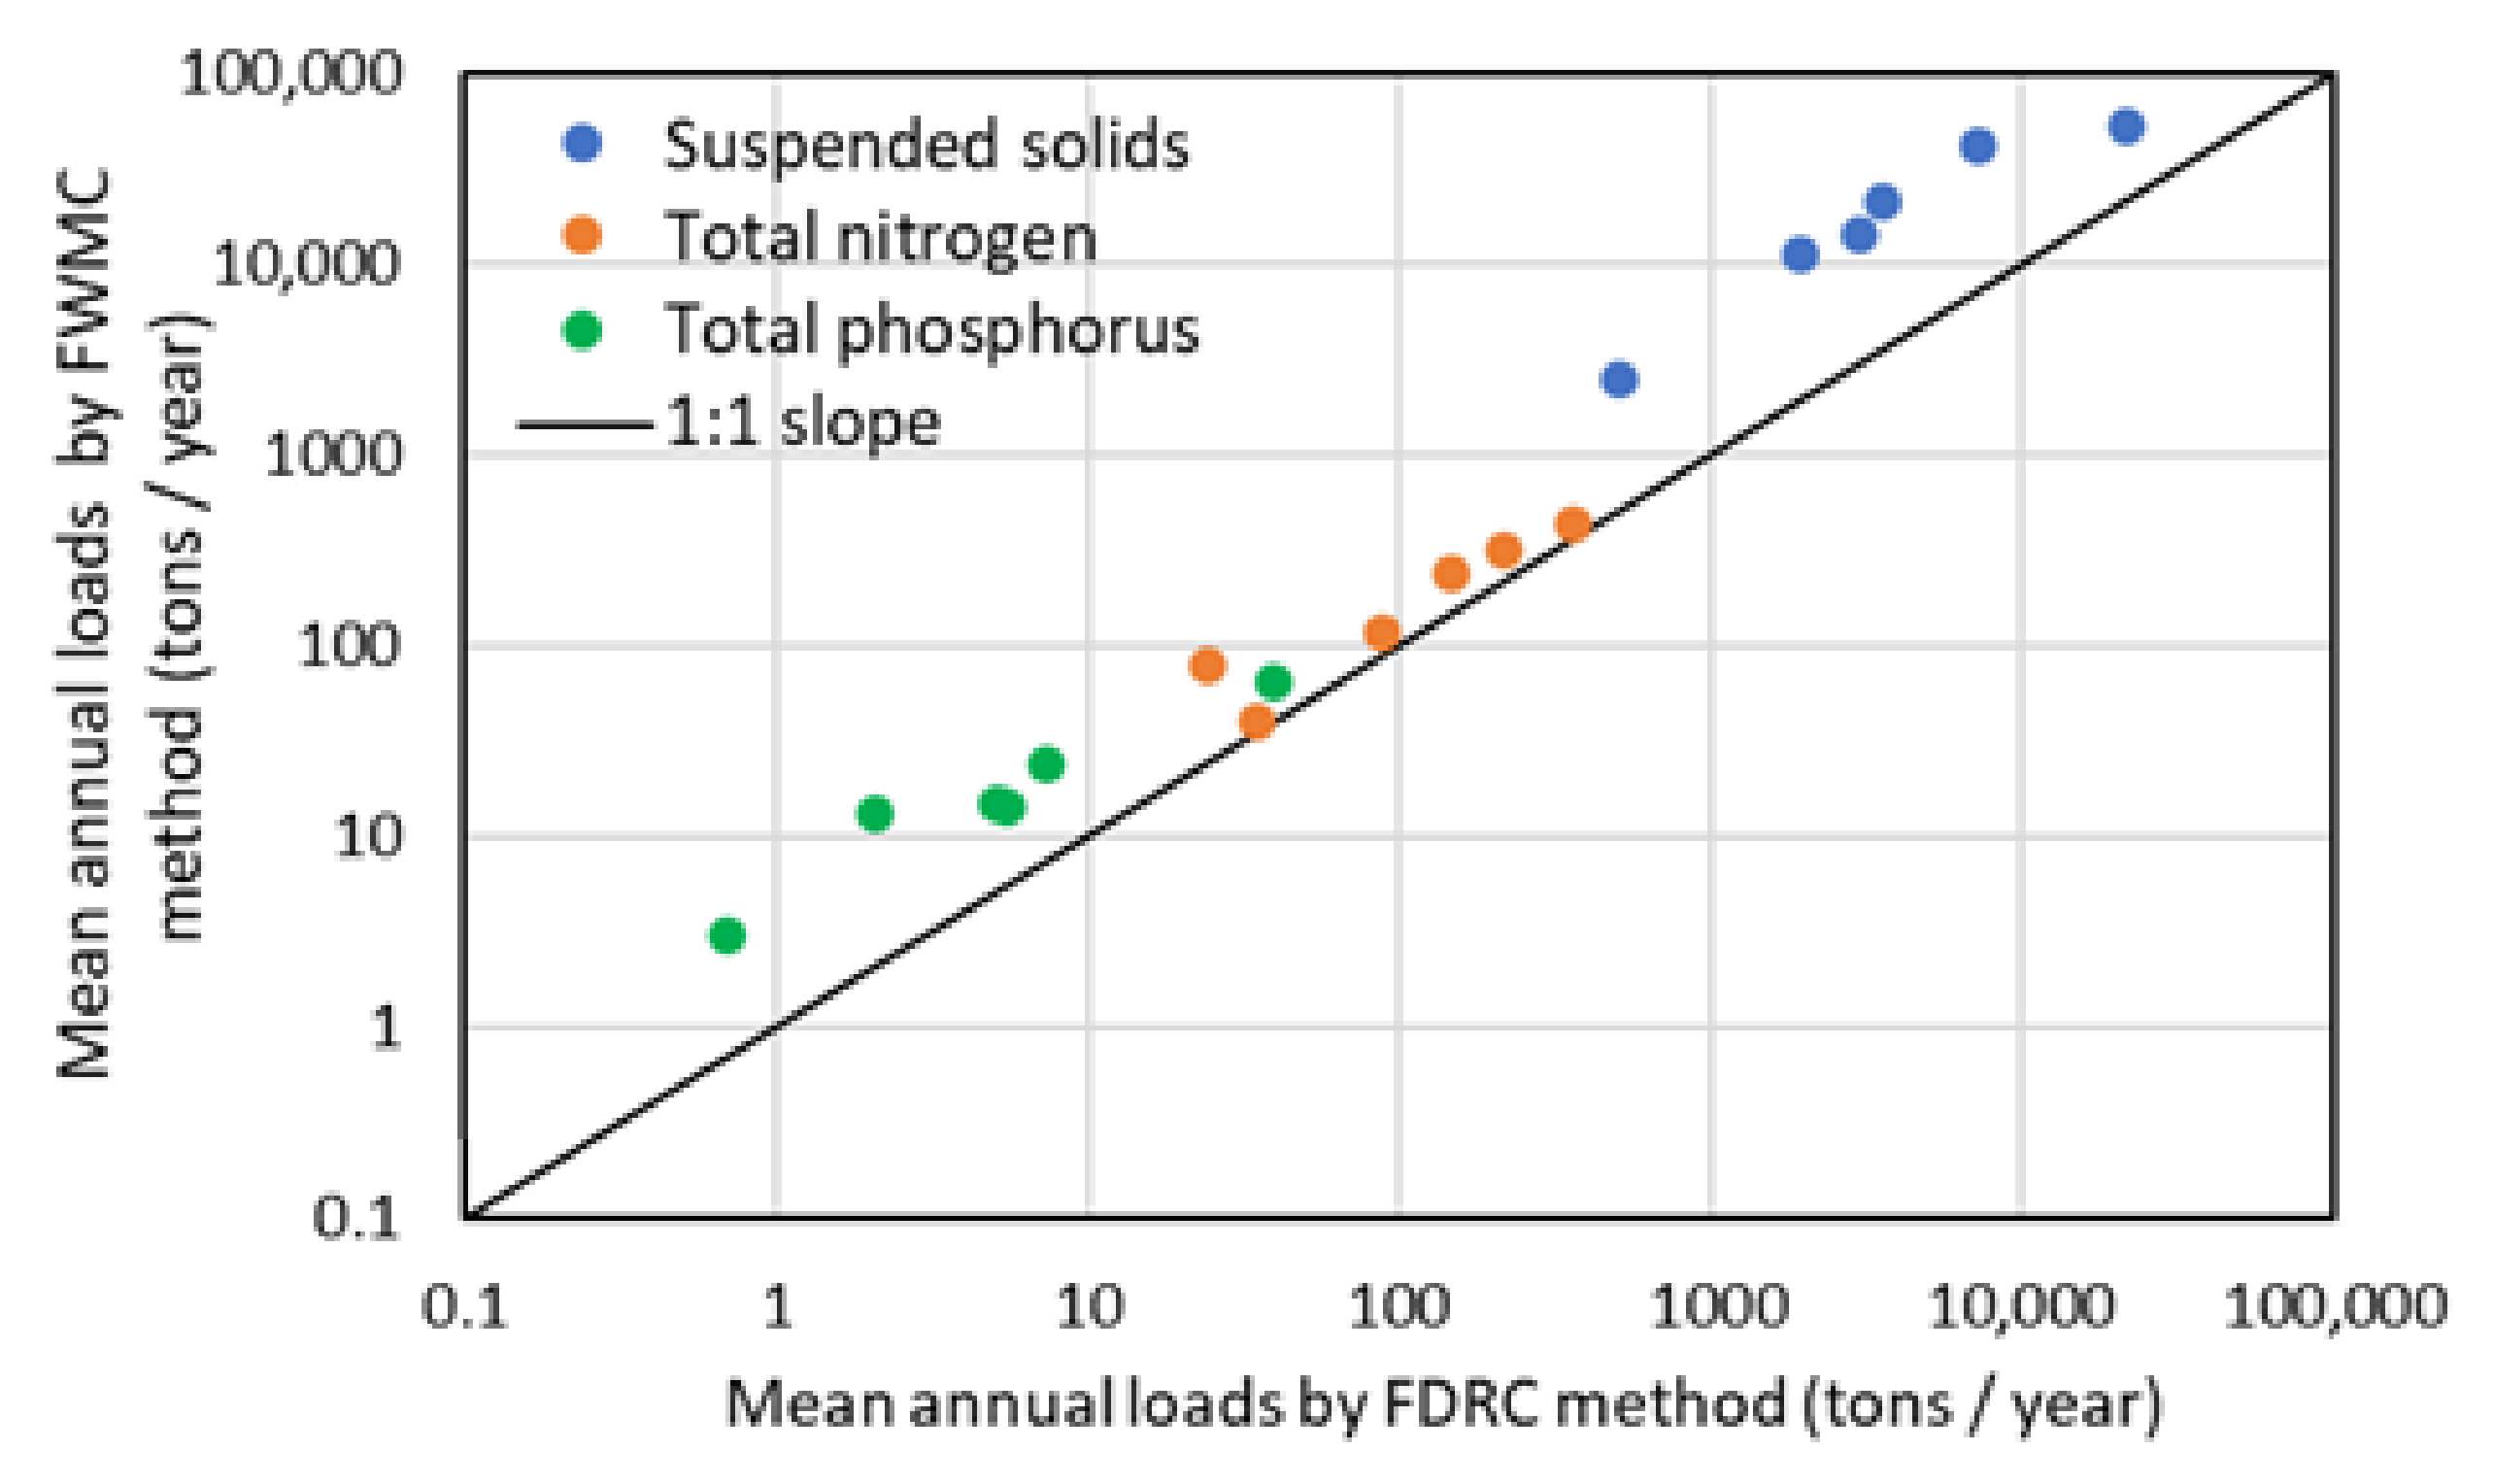
3.2. Comparison of Annual Loads Calculated by the FWMC and FDRC Methods
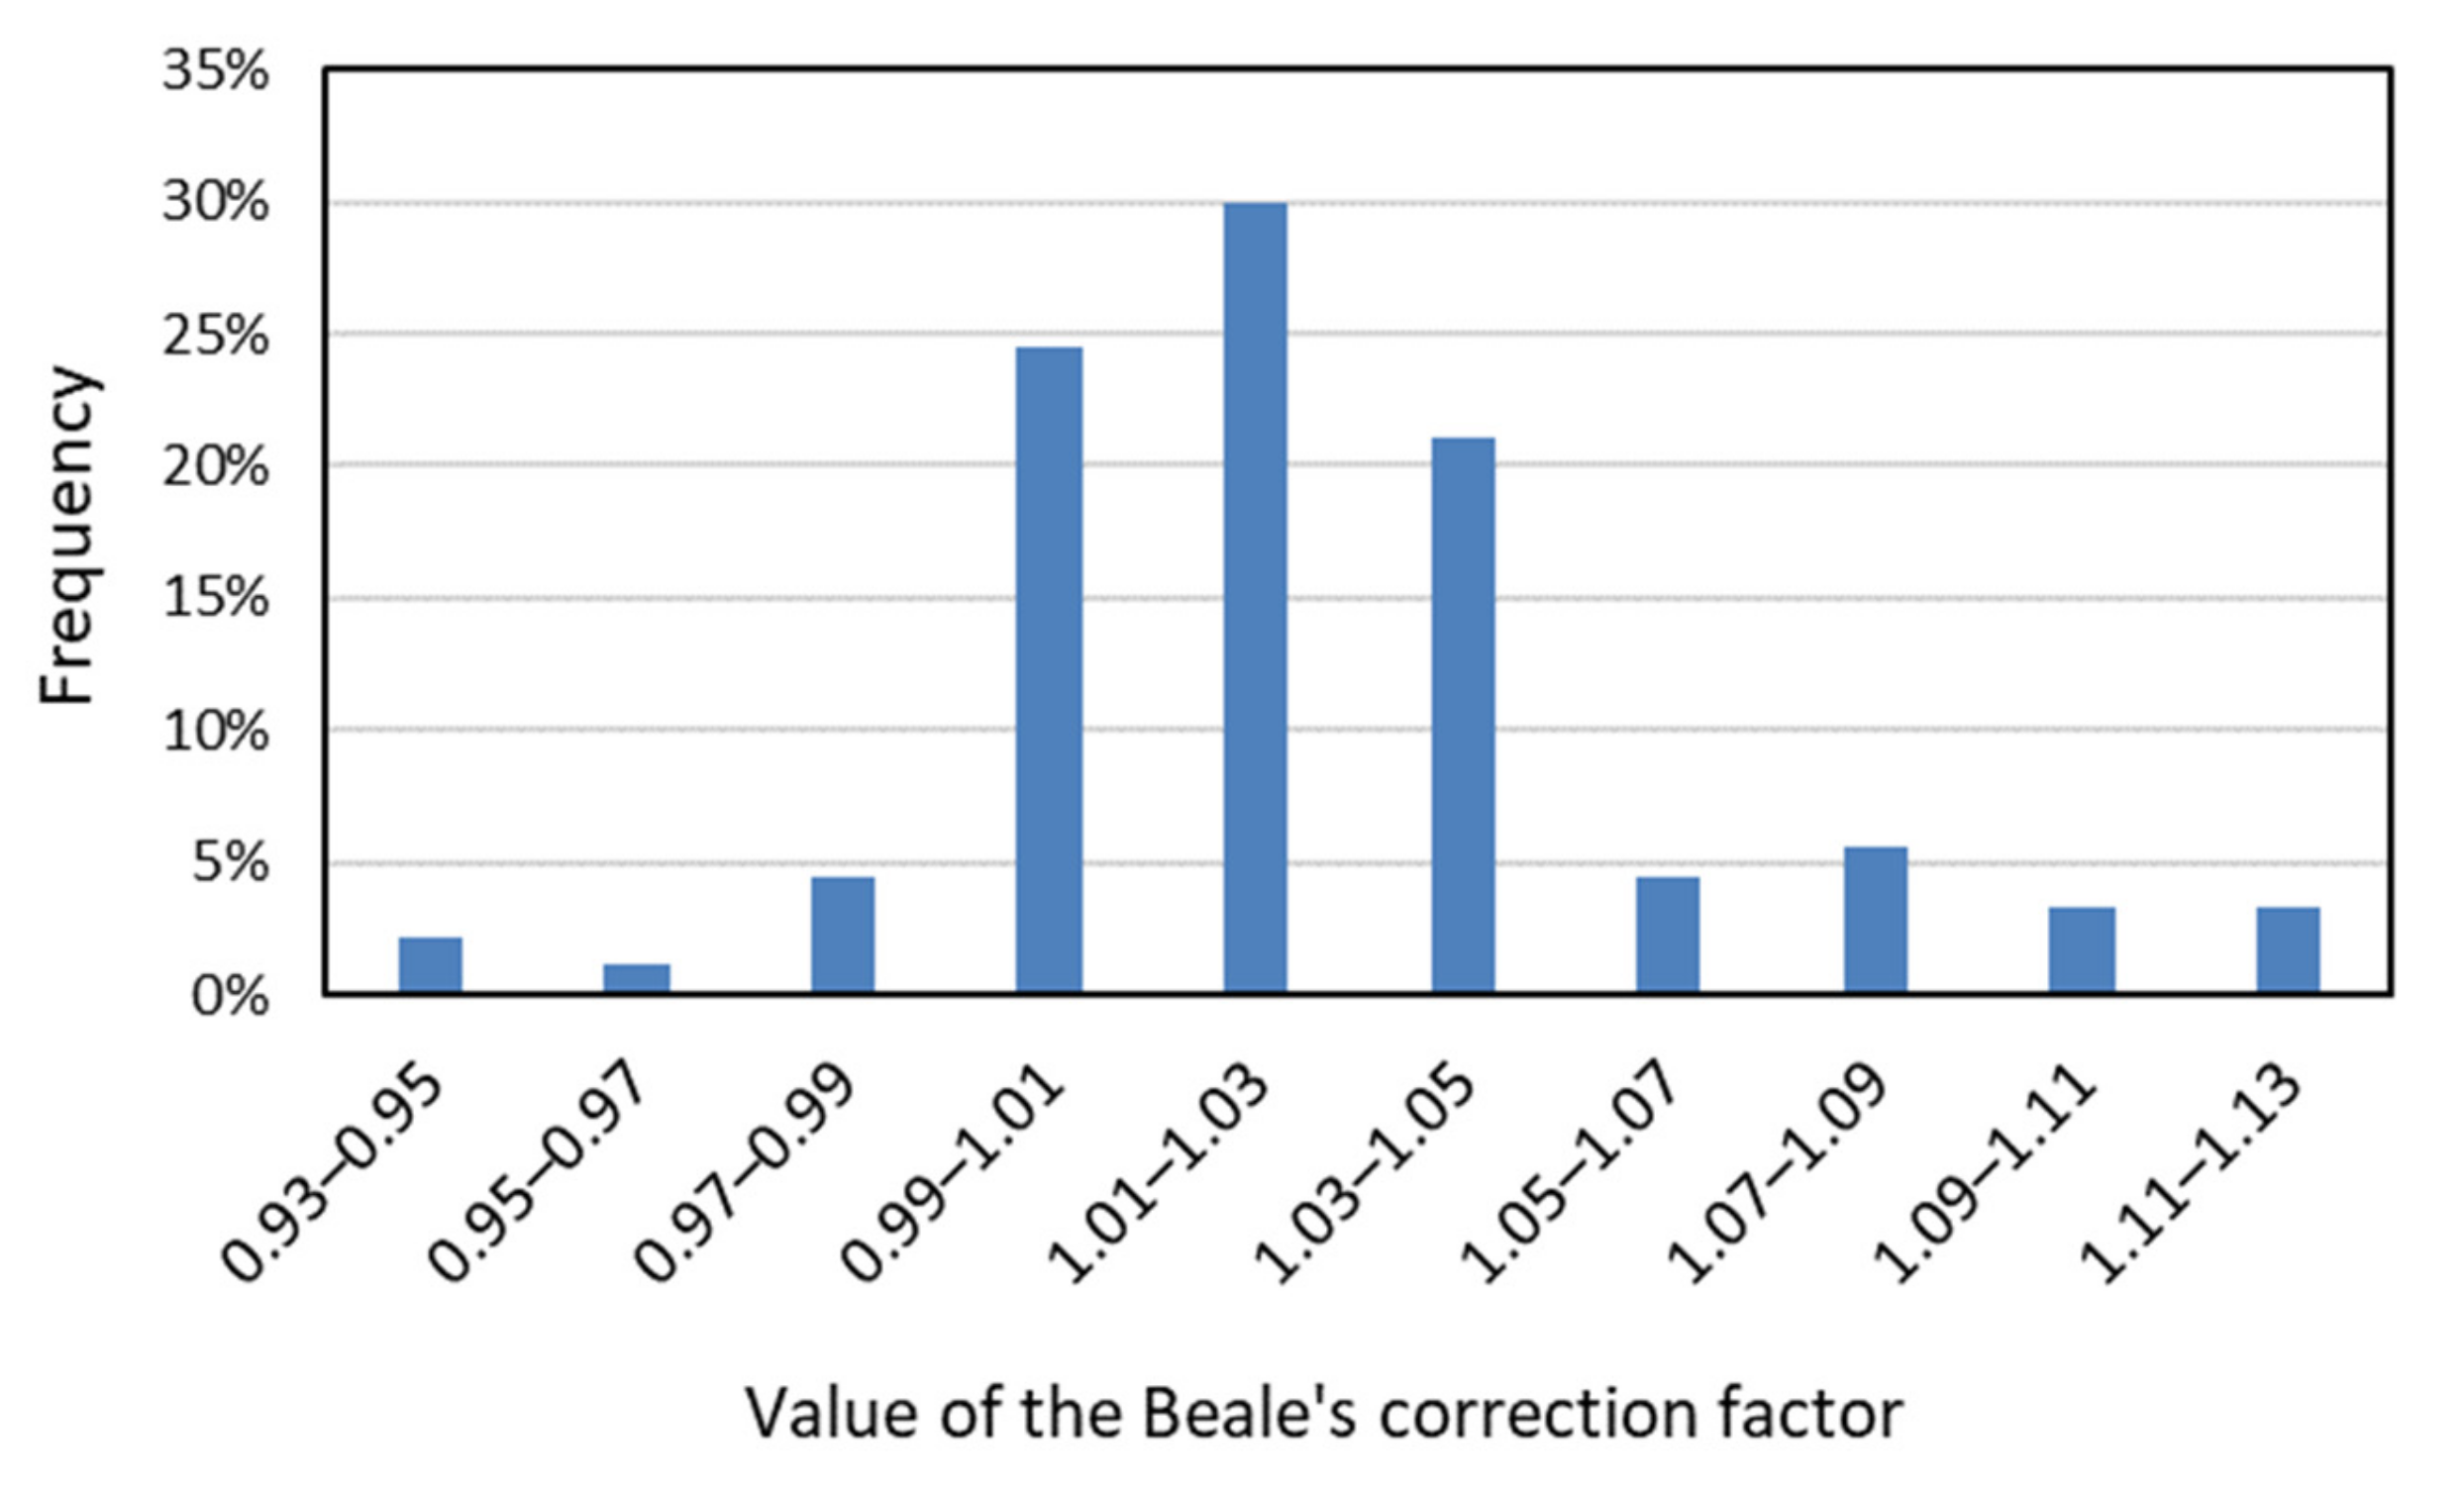
3.3. Test of the Beale’s Correction Factor in FWMC Method
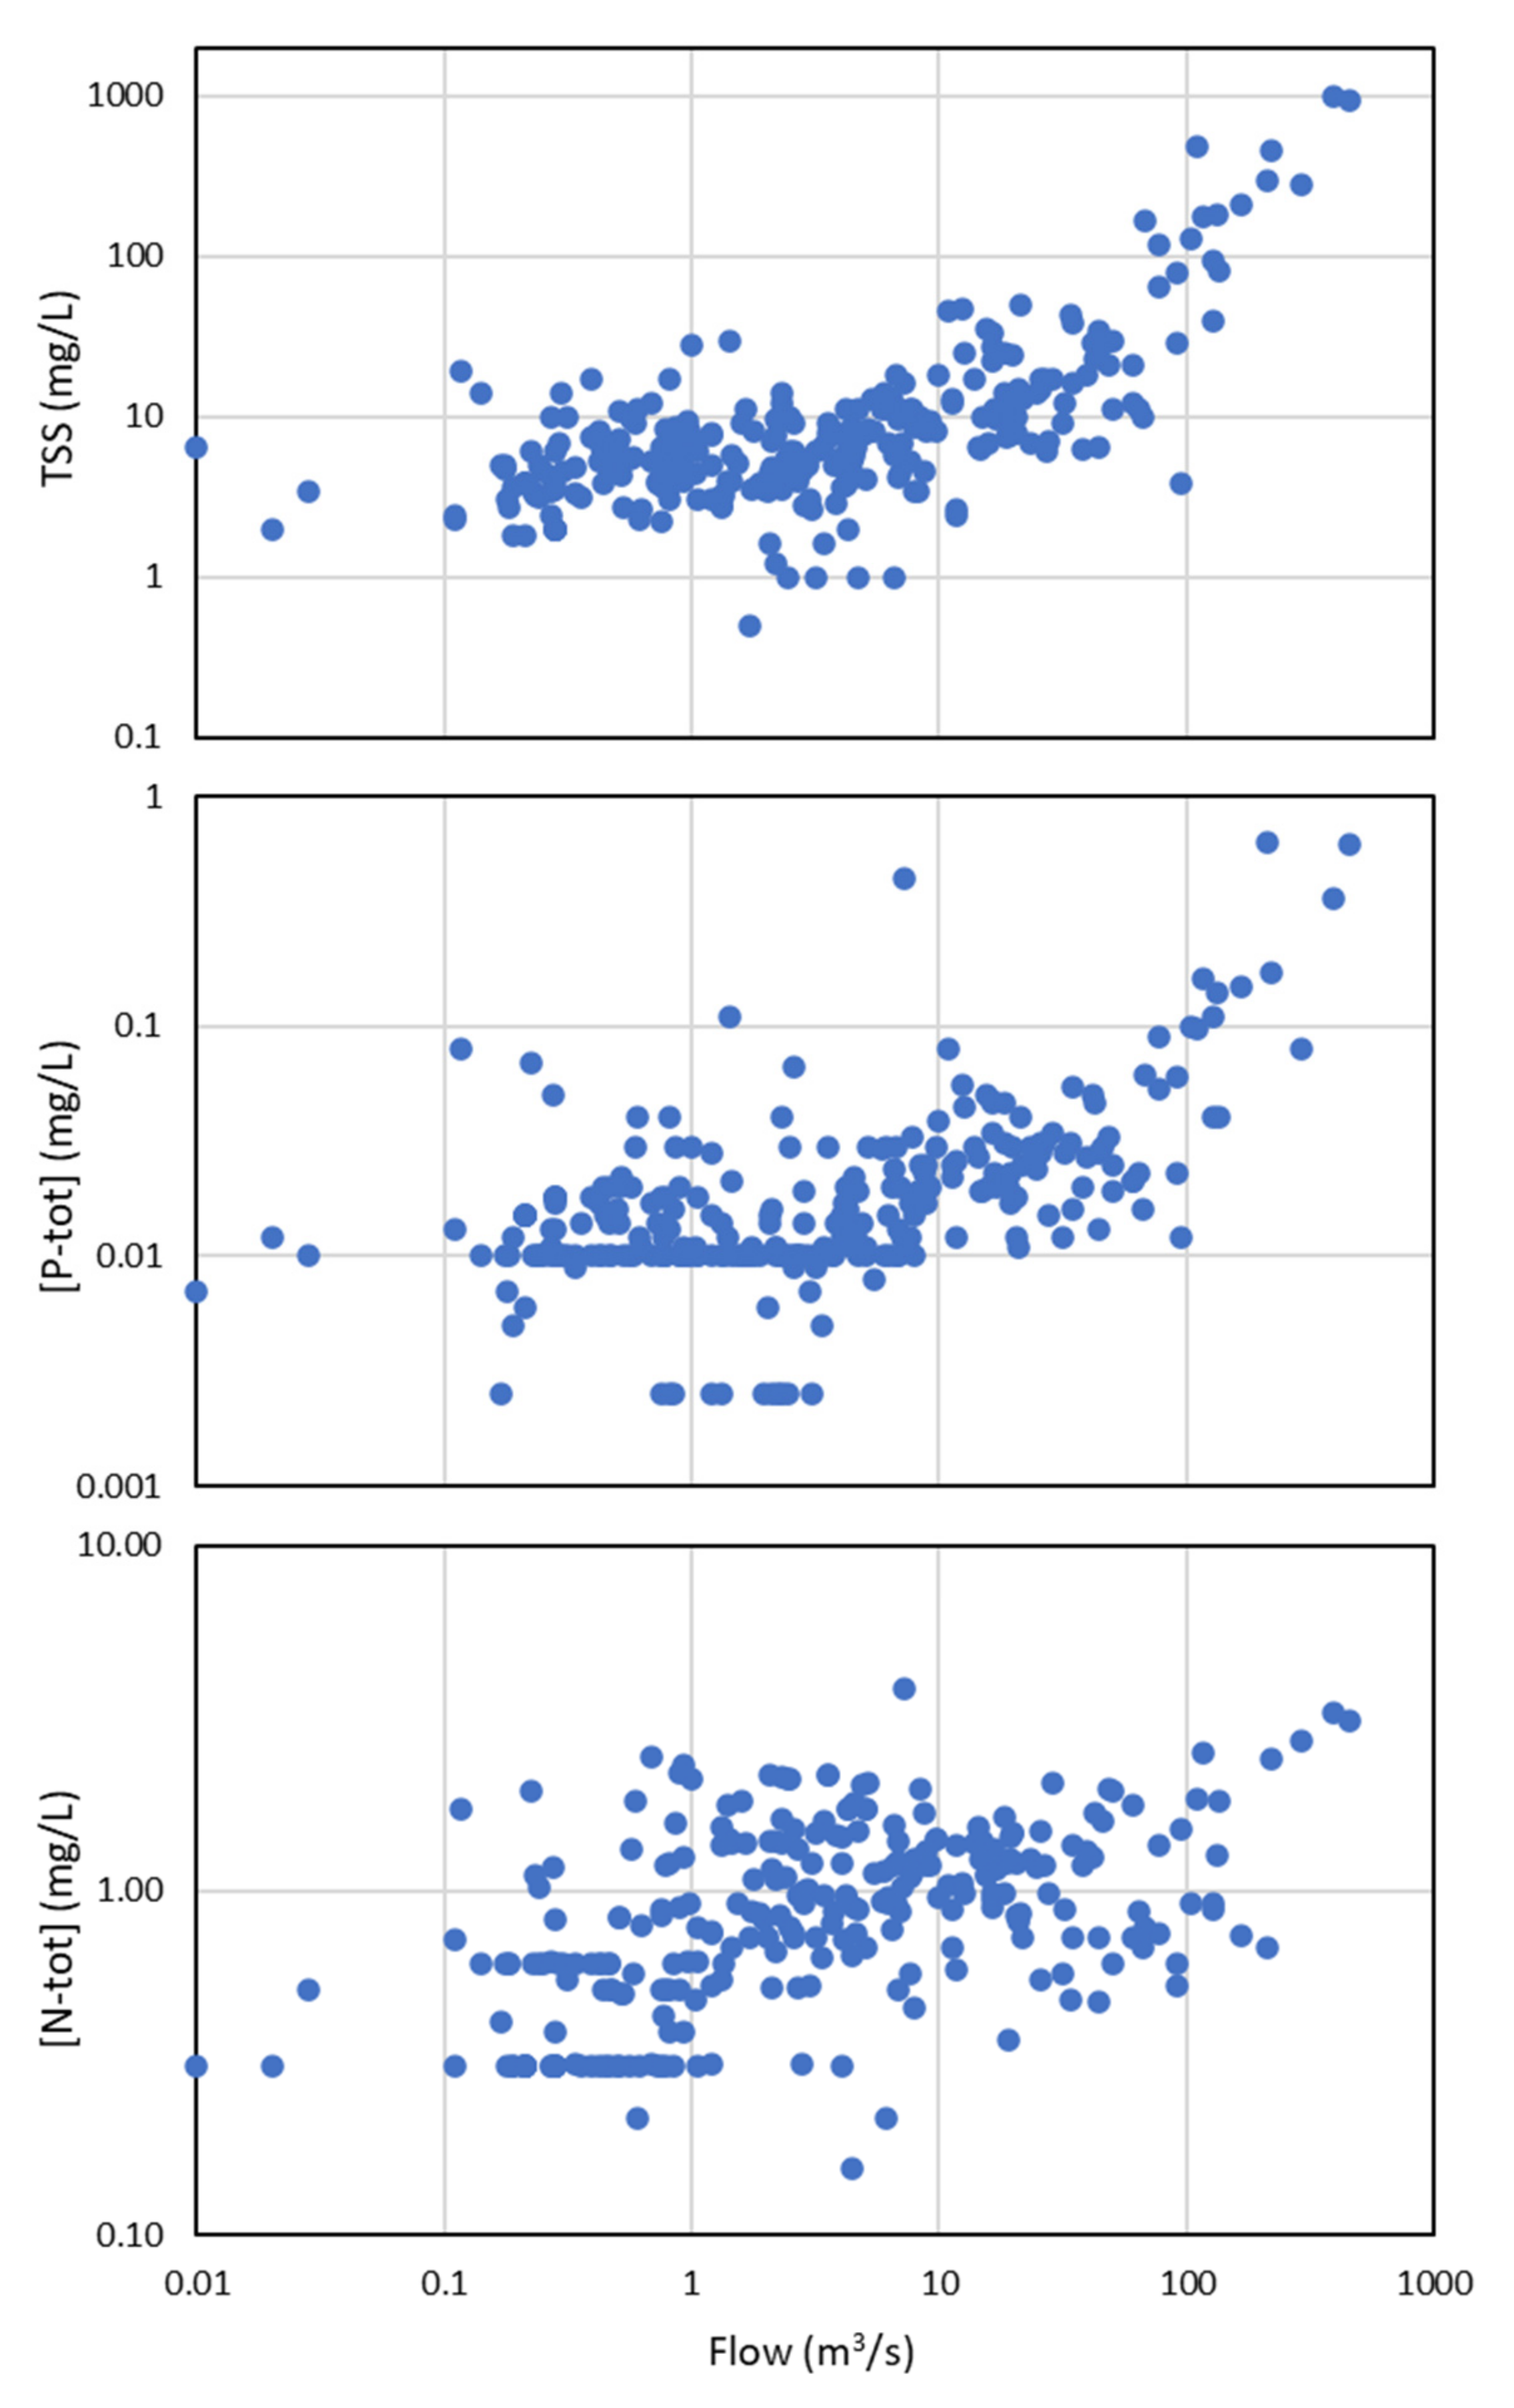
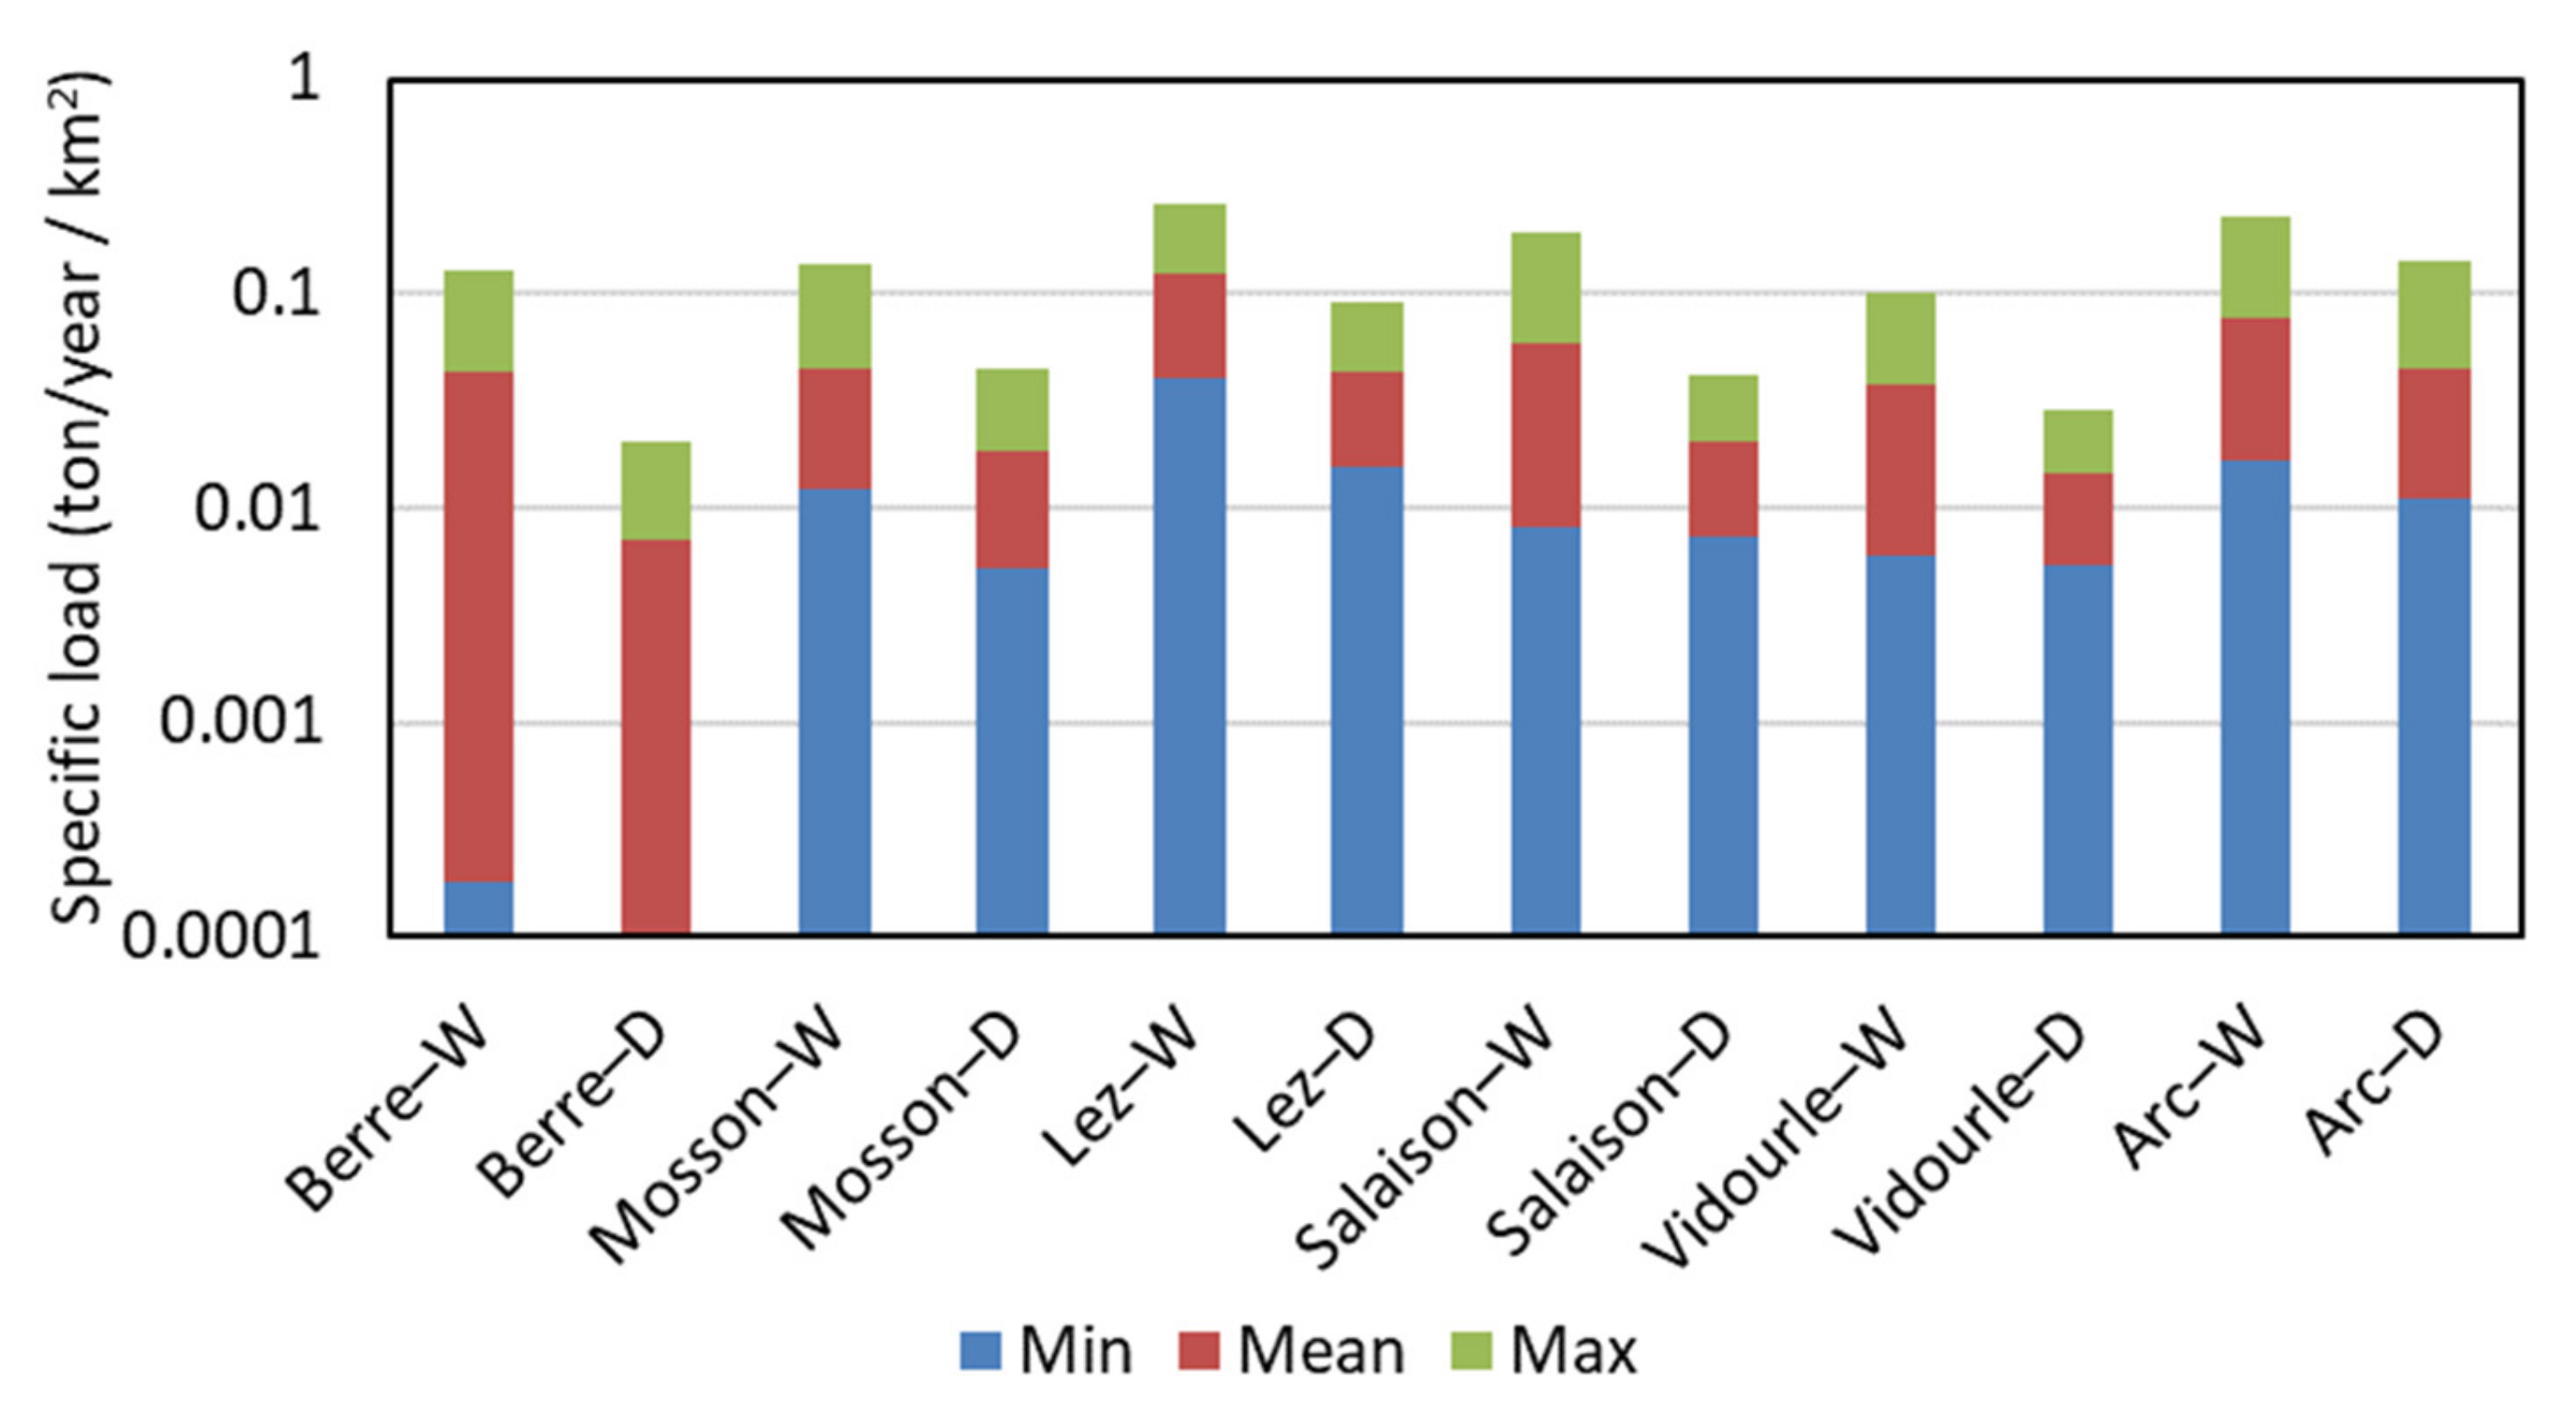
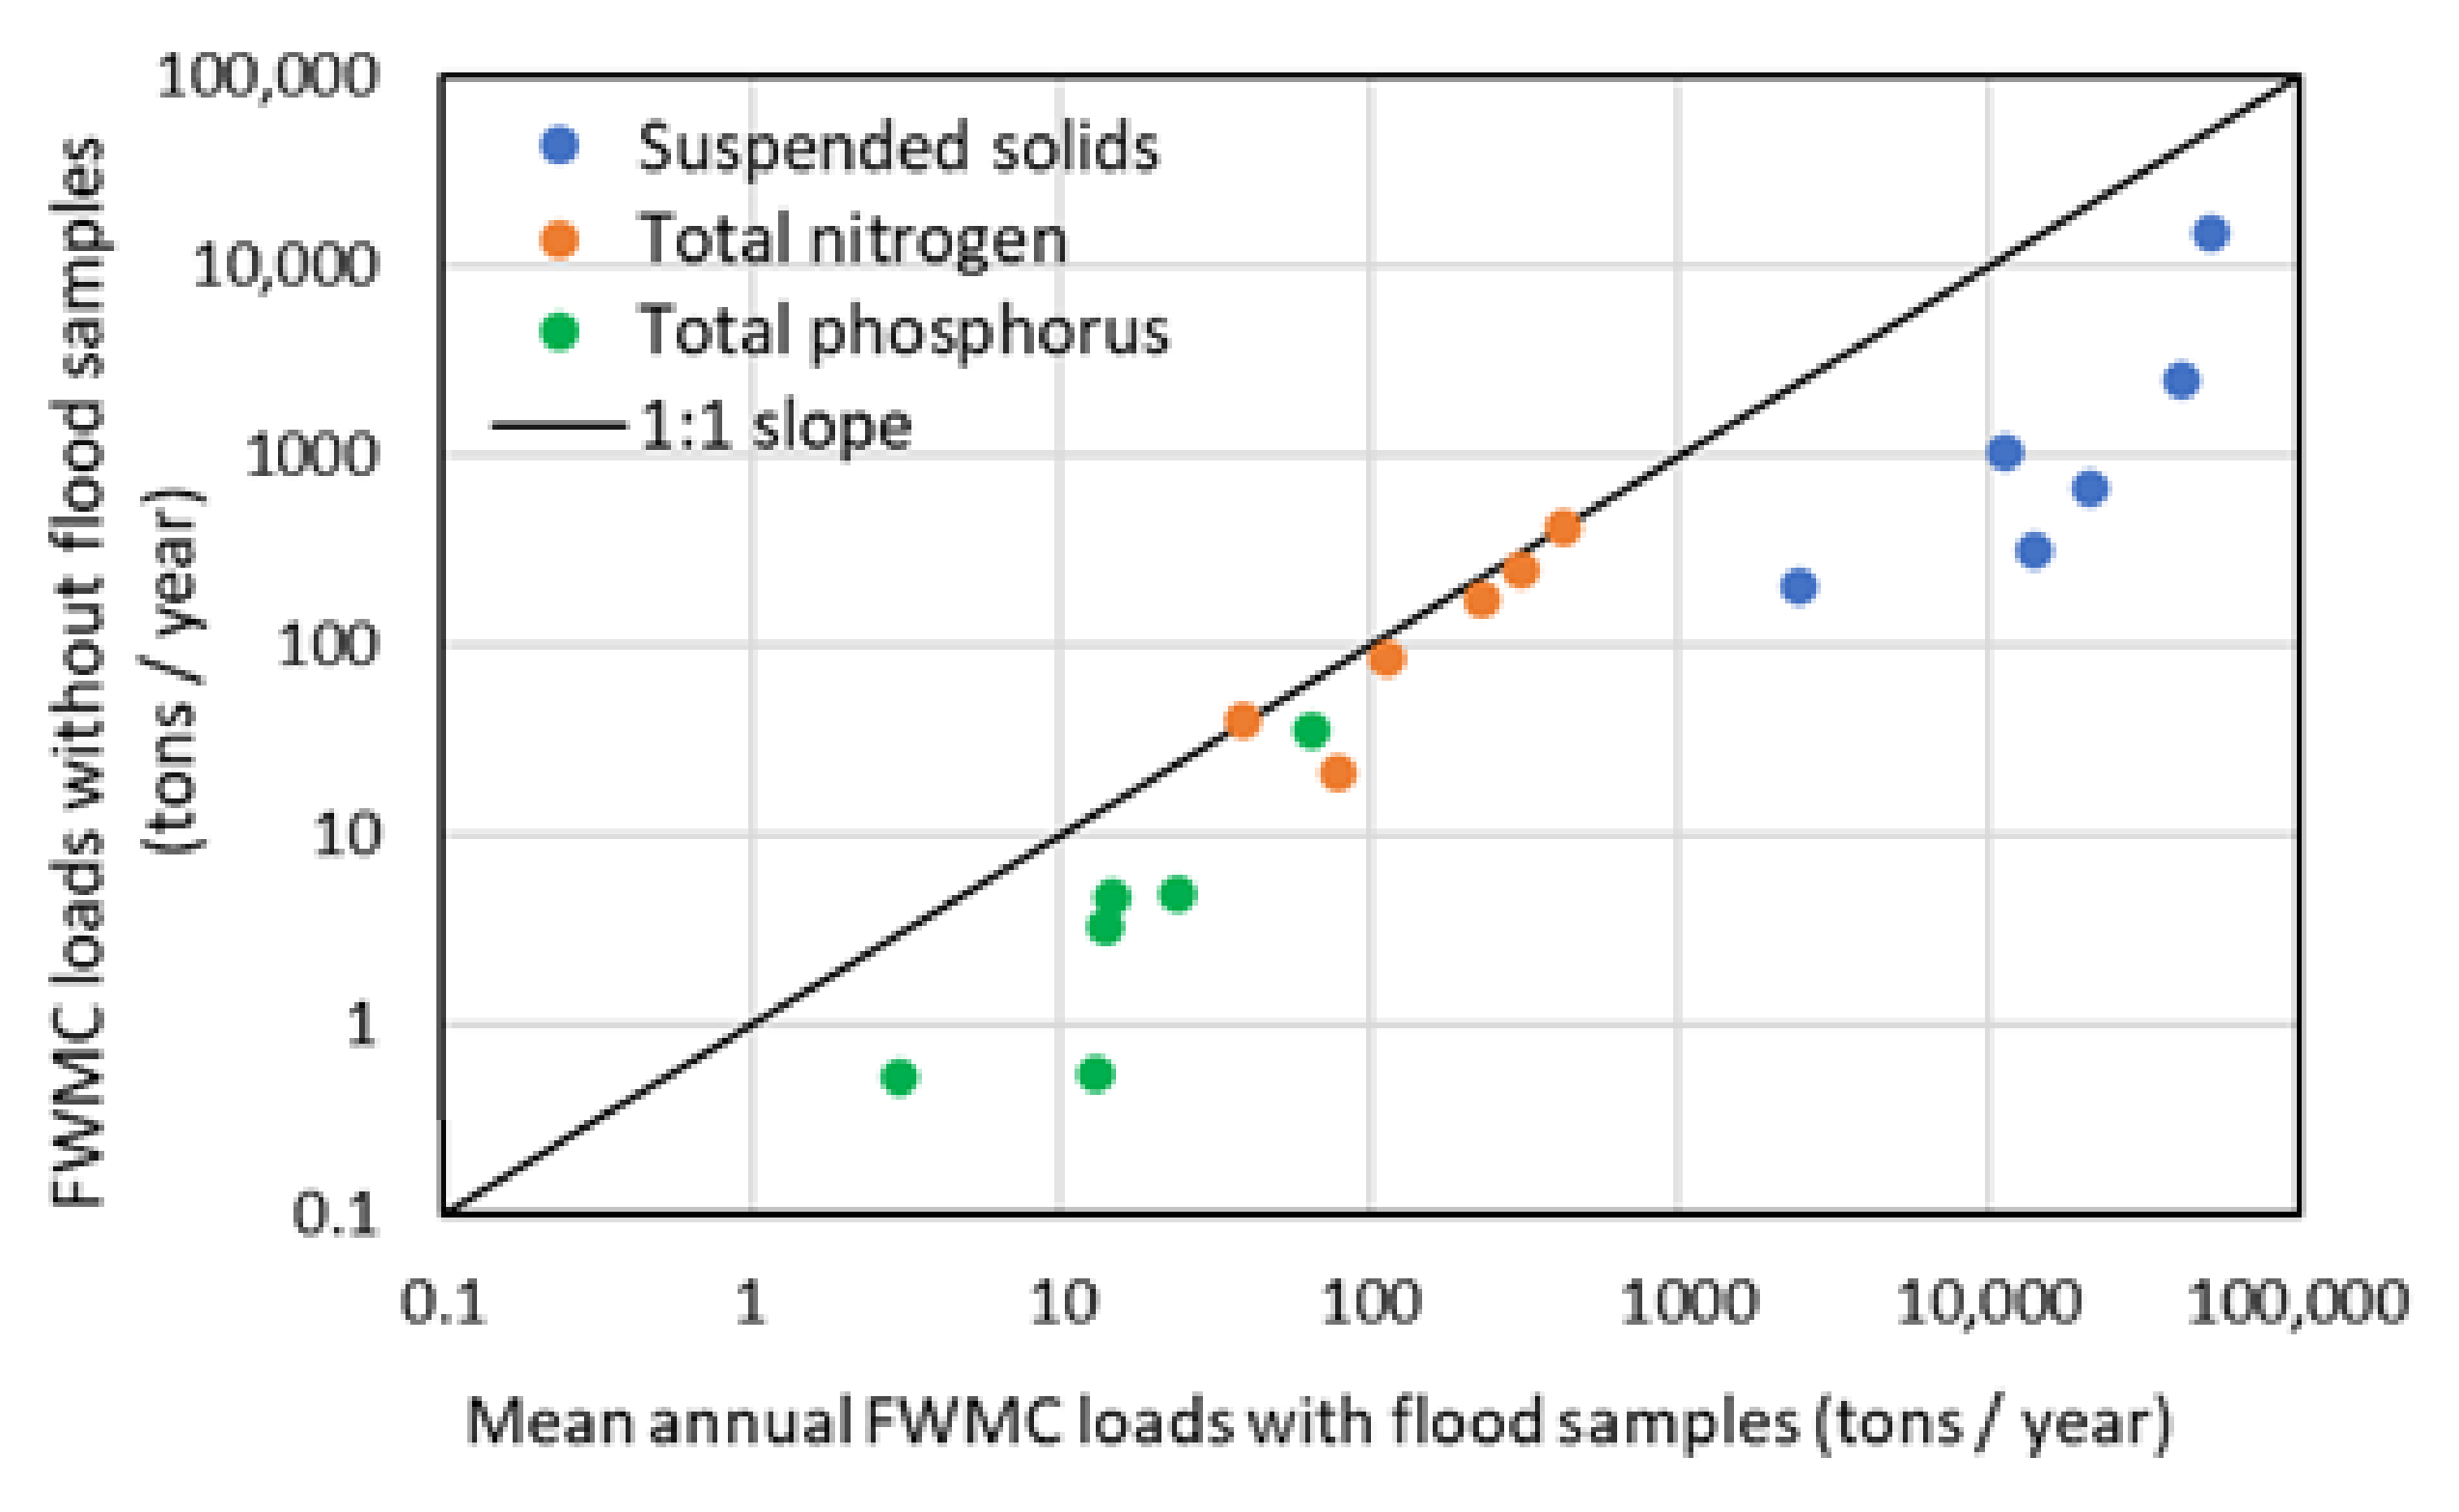
3.4. Importance of the Flood Samplings into the FWMC Method
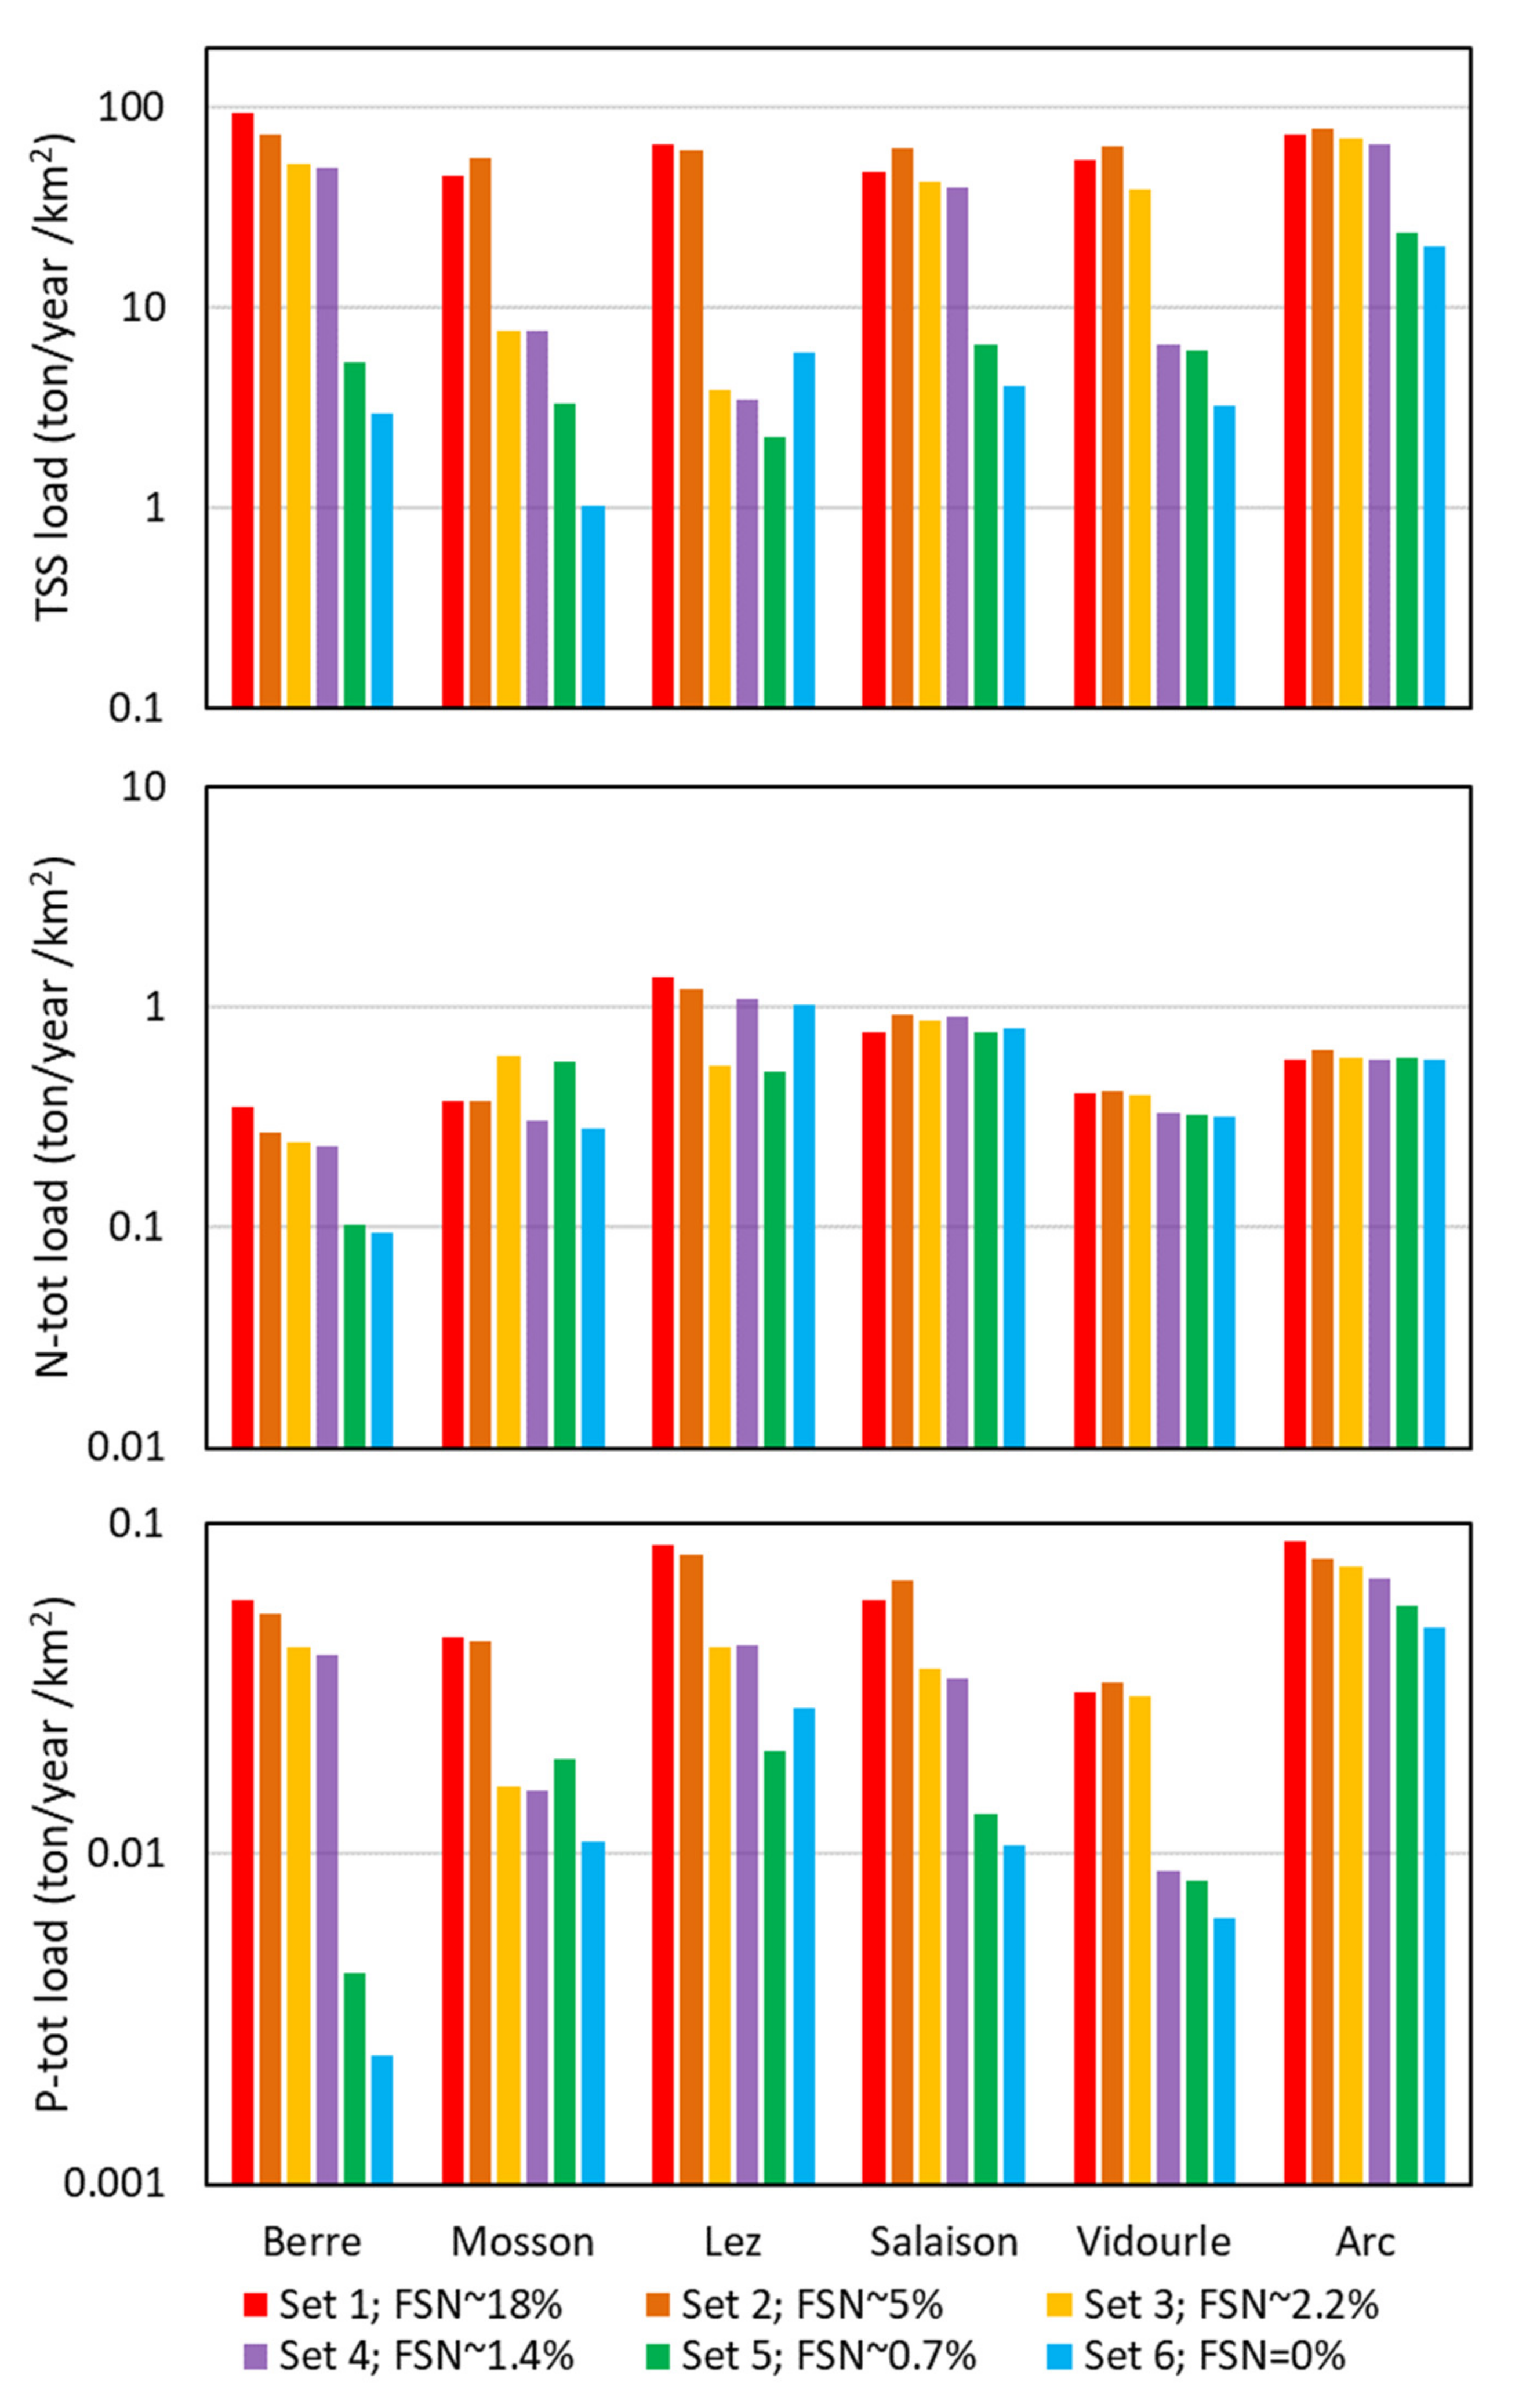
3.5. Impact of the Number of Flood Samples Used in the FWMC Method
- Set 1: total series, where samples taken during flood periods represent about 18.5% of the samples (Table 3);
- Set 2: number of samples during flood periods respecting the 5% exceedance frequency used to define flood events (flow rate > threshold);
- Set 3: number of flood samples half that respecting the threshold statistics (< 2.5% of total samples);
- Set 4: only two samples during the 5-year monitoring period (~1.4% of total samples);
- Set 5: only one sample during the 5-year monitoring period (~0.7% of total samples);
- Set 6: data series excluding flows above the threshold (0% of total samples).
4. Conclusions
Supplementary Materials
Author Contributions
Funding
Institutional Review Board Statement
Informed Consent Statement
Data Availability Statement
Conflicts of Interest
References
- Nava, V.; Patelli, P.; Rotiroti, M.; Leoni, B. An R package for estimating river compound load using different methods. Environ. Model. Softw. 2019, 117, 100–108. [Google Scholar] [CrossRef] [Green Version]
- Abolfathi, S.; Pearson, J. Application of smoothed particle hydrodynamics (SPH) in nearshore mixing: A comparison to laboratory data. Coast. Eng. Proc. 2016, 1, 16. [Google Scholar] [CrossRef]
- Borzooei, S.; Amerlinck, Y.; Abolfathi, S.; Panepinto, D.; Nopens, I.; Lorenzi, E.; Meucci, L.; Zanetti, M.C. Data scarcity in modelling and simulation of a large-scale WWTP: Stop sign or a challenge. J. Water Process Eng. 2019, 28, 10–20. [Google Scholar] [CrossRef] [Green Version]
- Preston, S.D.; Bierman, V.J.; Silliman, S.E. An evaluation of methods for the estimation of tributary mass loads. Water Resour. Res. 1989, 25, 1379–1389. [Google Scholar] [CrossRef]
- Dolan, D.M.; Yui, A.K.; Geist, R.D. Evaluation of river load estimation methods for total phosphorus. J. Great Lakes Res. 1981, 7, 207–214. [Google Scholar] [CrossRef]
- Walling, D.E. Assessing the accuracy of suspended sediment rating curves for a small basin. Water Resour. Res. 1977, 13, 531–538. [Google Scholar] [CrossRef]
- Ferguson, R.I. Accuracy and precision of methods for estimating river loads. Earth Surf. Processes Landf. 1987, 12, 95–104. [Google Scholar] [CrossRef]
- Cohn, T.A. Recent advances in statistical methods for the estimation of sediment and nutrient transport in the rivers. Rev. Geophys. 1995, 33 (Suppl. S2), 1117–1123. [Google Scholar] [CrossRef]
- Aulenbach, B.T.; Burns, D.A.; Shanley, J.B.; Yanai, R.D.; Bae, K.; Wild, A.D.; Yang, Y.; Yi, D. Approaches to stream solute load estimation for solutes with varying dynamics from five diverse small watersheds. Ecosphere 2016, 7, e01298. [Google Scholar] [CrossRef] [Green Version]
- OSPAR Commission. OSPAR Guidelines for Harmonised Quantification and Reporting Procedures for Nutrients (HARP-NUT). 2004. Available online: https://www.ospar.org/documents?d=32400 (accessed on 14 April 2022).
- Grasso, D.A.; Jakob, A. Charge de sédiments en suspension. Gas Wasser Abwasser 2003, 12, 898–905. [Google Scholar]
- PERSEUS—UNEP/MAP Report. Atlas of Riverine Inputs to the Mediterranean Sea; 2015; ISBN 978-960-9798-17-4. Available online: www.perseus-net.eu/assets/media/PDF/5567.pdf (accessed on 14 April 2022).
- Meybeck, M. Carbon, nitrogen and phosphorus transport by world rivers. Am. J. Sci. 1982, 282, 401–450. [Google Scholar] [CrossRef]
- Perennou, C.; Beltrame, C.; Guelmami, A.; Tomas Vives, P.; Caessteker, P. Existing areas and past changes of wetland extent in the Mediterranean region: An overview. Ecol. Mediterr. 2012, 38, 53–66. [Google Scholar] [CrossRef]
- European Union; Directive, H. Council Directive 92/43/EEC of 21 May 1992 on the conservation of natural habitats and of wild fauna and flora. Off. J. Eur. Union 1992, 206, 7–50. Available online: https://eur-lex.europa.eu/LexUriServ/LexUriServ.do?uri=CONSLEG:1992L0043:20070101:en:PDF (accessed on 15 April 2022).
- Soria, J.; Pérez, R.; Sòria-Pepinyà, X. Mediterranean Coastal Lagoons Review: Sites to Visit before Disappearance. J. Mar. Sci. Eng. 2022, 10, 347. [Google Scholar] [CrossRef]
- Banton, O.; St-Pierre, S.; Giraud, A.; Stroffek, S. A Rapid Method to Estimate the Different Components of the Water Balance in Mediterranean Watersheds. Water 2022, 14, 677. [Google Scholar] [CrossRef]
- Walling, D.E.; Webb, B.W. The reliability of suspended load data. In Erosion and Sediment Transport Measurement; 1981; Volume 133, pp. 177–194. Available online: https://iahs.info/uploads/dms/iahs_133_0177.pdf (accessed on 16 April 2022).
- Miller, C.R. Analysis of Flow Duration Sediment Rating Curve Method of Computing Sediment Yields; US Bureau of Reclamation Report: Denver, CO, USA, 1951; p. 55. Available online: https://catalog.hathitrust.org/Record/010846275 (accessed on 11 April 2022).
- Hembree, C.H.; Rainwater, F.H. Chemical Degradation on Opposite’ Flanks of the Wind River Range, Wyoming; United States Geological Survey Water Supply Paper. 1961; p. 1535-E. Available online: https://pubs.er.usgs.gov/publication/wsp1535E (accessed on 16 April 2022).
- Crawford, C.G. Estimation of suspended-sediment rating curves and mean suspended-sediment loads. J. Hydrol. 1991, 129, 331–348. [Google Scholar] [CrossRef]
- Kao, S.J.; Lee, T.Y.; Milliman, J.D. Calculating Highly Fluctuated Suspended Sediment Fluxes from Mountainous Rivers in Taiwan. Terr. Atmos. Ocean. Sci. 2005, 16, 653–675. [Google Scholar] [CrossRef] [Green Version]
- Gray, J.R.; Simões, F.J.M. Estimating Sediment Discharge. Appendix D. Sedimentation Engineering-Processes, Measurements, Modeling, and Practice; American Society of Civil Engineers: Reston, VA, USA, 2008. [Google Scholar] [CrossRef] [Green Version]
- Sadaoui, M.; Ludwig, W.; Bourrin, F.; Raimbault, P. Controls, budgets and variability of riverine sediment fluxes to the gulf of lions (NW Mediterranean Sea). J. Hydrol. 2016, 540, 1002–1015. [Google Scholar] [CrossRef]
- Campbell, F.B.; Bauder, H. A rating-curve method for determining silt-discharge of streams. Environmental Science. Eos Trans. Am. Geophys. Union 1940, 21, 603–607. [Google Scholar] [CrossRef]
- Glysson, G.D. Sediment-Transport Curves; Open-File Report 87–218; U.S. Geological Survey: Reston, VA, USA, 1987. [Google Scholar] [CrossRef]
- Verhoff, F.H.; Melfi, D.A.; Yaksich, S.M. River nutrient and chemical transport estimation. J. Environ. Eng. Div. 1980, 106, 591–608. [Google Scholar] [CrossRef]
- Littlewood, L.G. Estimating Constituent Loads in Rivers: A Review; Institute of Hydrology Reports, No. 117; Institute of Hydrology: Wallingford, UK, 1992; Available online: https://nora.nerc.ac.uk/id/eprint/7353/1/IH_117.pdf (accessed on 18 April 2022).
- Phillips, J.M.; Webb, B.W.; Walling, D.E.; Leeks, G.J.L. Estimating the suspended sediment loads of rivers in the LOIS study area using infrequent samples. Hydrol. Process. 1999, 13, 1035–1050. [Google Scholar] [CrossRef]
- Coynel, A.; Schafer, J.; Hurtrez, J.E.; Dumas, J.; Etcheber, H.; Blanc, G. Sampling frequency and accuracy of SPM flux estimates in two contrasted drainage basins. Sci. Total Environ. 2004, 330, 233–247. [Google Scholar] [CrossRef] [PubMed]
- Littlewood, G.; Marsh, T.J. Annual freshwater river mass loads from Great Britain, 1975–1994: Estimation algorithm, database and monitoring network issues. J. Hydrol. 2005, 304, 221–237. [Google Scholar] [CrossRef]
- Moatar, F.; Meybeck, M. Compared performances of different algorithms for estimating annual nutrient loads discharged by the eutrophic River Loire. Hydrol. Process 2005, 19, 429–444. [Google Scholar] [CrossRef]
- Quilbe, R.; Rousseau, A.N.; Duchemin, M.; Poulin, A.; Gangbazo, G.; Villeneuve, J.P. Selecting a calculation method to estimate sediment and nutrient loads in streams: Application to the Beaurivage River (Quebec, Canada). J. Hydrol. 2006, 326, 295–310. [Google Scholar] [CrossRef]
- Worrall, F.; Howden, N.J.K.; Burt, T.P. Assessment of sample frequency bias and precision in fluvial flux calculations—An improved low bias estimation method. J. Hydrol. 2013, 503, 101–110. [Google Scholar] [CrossRef] [Green Version]
- Baker, D.B.; Pavlovic, S. Sediment, Nutrient and Pesticide Transport in Selected Lower Great Lakes Tributaries; United States Environmental Protection Agency, Region 5. EPA-905/4-88-001 GLNPO Report No. 1 February 1988; Great Lake National Program Office: Chicago, IL, USA, 1998. [Google Scholar]
- Beale, E.M.L. Some uses of computers in operational research. Ind. Organ. 1962, 31, 27–28. [Google Scholar]
- Tin, M. Comparison of some ratio estimators. J. Am. Statist. Assoc. 1965, 60, 294–307. [Google Scholar] [CrossRef]
- Kendall, M.G.; Stuart, A. The Advanced Theory of Statistics, 2nd ed.; Hafner Publishing Company: New York, NY, USA, 1968; Volume 3. [Google Scholar]
- Young, T.C.; DePinto, J.V.; Heidtke, T.M. Factors Affecting the Efficiency of Some Estimators of Fluvial Total Phosphorus Load. Water Resour. Res. 1988, 24, 1535–1540. [Google Scholar] [CrossRef]
- Rekolainen, S.; Posch, M.; Kamari, J.; Ekholm, P. Evaluation of the accuracy and precision of annual phosphorus load estimates from two agricultural basins in Finland. J. Hydrol. 1991, 128, 237–255. [Google Scholar] [CrossRef]
- EPA—Environmental Protection Agency. An Approach for Using Load Duration Curves in the Development of TMDLs; EPA Report 841-B-07-006; Watershed Branch (4503T); Office of Wetlands, Oceans and Watersheds. U.S.; Environmental Protection Agency: Washington, DC, USA, 2007. Available online: http://www.epa.gov/owow/tmdl/techsupp.html (accessed on 27 April 2022).
- Panagos, P.; Van Liedekerke, M.; Jones, A.; Montanarella, L. European Soil Data Centre: Response to European policy support and public data requirements. Land Use Policy 2012, 29, 329–338. [Google Scholar] [CrossRef]
- Panagos PBallabio, C.; Poesen, J.; Lugato, E.; Scarpa, S.; Montanarella, L.; Borrelli, P. A Soil Erosion Indicator for Supporting Agricultural, Environmental and Climate Policies in the European Union. Remote Sensing 2020, 12, 1365. [Google Scholar] [CrossRef]
- Lannergård, E.E.; Ledesma, J.L.J.; Fölster, J.; Futter, M.N. An evaluation of high frequency turbidity as a proxy for riverine total phosphorus concentrations. Sci. Total Environ. 2019, 651, 103–113. [Google Scholar] [CrossRef] [PubMed]
- Rügner, H.; Schwientek, M.; Beckingham, B.; Kuch, B.; Grathwohl, P. Turbidity as a proxy for total suspended solids (TSS) and particle facilitated pollutant transport in catchments. Environ. Earth Sci. 2013, 69, 373–380. [Google Scholar] [CrossRef]







| River | Watershed Area (km2) | Watershed Mean Slope (%) | Population (×1000) | Agricultural Area (%) | Urban Area (%) |
|---|---|---|---|---|---|
| Berre | 207.3 | 19.9 | 2.4 | 29.2 | 0.5 |
| Mosson | 359.5 | 8.6 | 84.8 | 33.4 | 19.8 |
| Lez | 165.5 | 9.1 | 338.9 | 26.3 | 32.5 |
| Salaison | 63.8 | 4.5 | 32.4 | 27.8 | 12.6 |
| Vidourle | 775.3 | 10.1 | 54.9 | 48.7 | 29.5 |
| Arc | 711.1 | 11.1 | 286.3 | 44.3 | 3.8 |
| River | Non-Flood Period Samplings | Flood Event Samplings | Total Samplings | % of Flood Samplings |
|---|---|---|---|---|
| Berre | 109 | 22 | 131 | 16.7 |
| Mosson | 115 | 26 | 141 | 18.4 |
| Lez | 115 | 28 | 143 | 19.6 |
| Salaison | 114 | 26 | 140 | 18.6 |
| Vidourle | 113 | 35 | 155 | 22.6 |
| Arc | 114 | 20 | 134 | 14.9 |
| River | Average Rainfall (mm/year) | Return Period (Years) of the Maximum Flood Observed | Streamflow Threshold for 5% Exceedance (m3/s) | Numbers of Flood Events during the 5-Year Period | |
|---|---|---|---|---|---|
| 5-Year Studied Period | 10-Year Flow Series | ||||
| Berre | 634 | 3.5 | >20 | 1.96 | 15 |
| Mosson | 826 | 25 | 25 | 2.83 | 26 |
| Lez | 915 | 2 | >40 | 8.83 | 18 |
| Salaison | 911 | >40 | >40 | 1.6 | 19 |
| Vidourle | 999 | 2.5 | 7.5 | 25.3 | 22 |
| Arc | 543 | 35 | 35 | 8.91 | 23 |
| River | Limit 1/2 | Limit 2/3 | Limit 3/4 | Limit 4/5 | Limit 5/6 |
|---|---|---|---|---|---|
| Berre | 0.03 | 0.14 | 0.71 | 3.70 | 19.34 |
| Mosson | 0.07 | 0.31 | 1.34 | 5.89 | 25.79 |
| Lez | 0.52 | 1.50 | 4.31 | 12.38 | 35.53 |
| Salaison | 0.03 | 0.13 | 0.55 | 2.39 | 10.26 |
| Vidourle | 0.24 | 1.09 | 4.91 | 22.23 | 100.57 |
| Arc | 0.51 | 1.53 | 4.63 | 14.00 | 42.33 |
| Min. | Interval 1 | Interval 2 | Interval 3 | Interval 4 | Interval 5 | Interval 6 | Max. | ||
|---|---|---|---|---|---|---|---|---|---|
| Berre | TSS | 0.5 | 7.7 | 2.6 | 1.2 | 2 | 230 | 463 | 1630 |
| N_tot | 0.31 | 0.01 | 0.31 | 0.61 | 0.84 | 1.57 | 1.94 | 9.19 | |
| P_tot | 0.003 | 0.01 | 0.01 | 0.01 | 0.01 | 0.11 | 0.30 | 1.60 | |
| Mosson | TSS | 0.5 | 4.9 | 5.05 | 5.8 | 8.8 | 73 | 399.5 | 1120 |
| N_tot | 0.80 | 2.19 | 1.8 | 2.1 | 1.914 | 2.59 | 2.52 | 6.82 | |
| P_tot | 0.015 | 0.03 | 0.04 | 0.09 | 0.09 | 0.19 | 0.3 | 0.92 | |
| Lez | TSS | 0.9 | 10.4 | 7.9 | 6.6 | 9.9 | 37 | 231 | 585 |
| N_tot | 0.00 | 0.93 | 0.94 | 1.58 | 1.90 | 2.07 | 2.77 | 4.06 | |
| P_tot | 0.007 | 0.04 | 0.04 | 0.03 | 0.04 | 0.1 | 0.31 | 0.36 | |
| Salaison | TSS | 0.5 | 1.55 | 1.6 | 1.3 | 7.4 | 36 | 298 | 788 |
| N_tot | 0.57 | 2.03 | 2.79 | 3.54 | 2.29 | 1.64 | 3.14 | 6.90 | |
| P_tot | 0.003 | 0.02 | 0.02 | 0.02 | 0.03 | 0.08 | 0.22 | 0.77 | |
| Vidourle | TSS | 0.5 | 4.3 | 4.6 | 4.5 | 9.25 | 17 | 196.5 | 987 |
| N_tot | 0.00 | 0.06 | 0.12 | 0.86 | 1.00 | 0.93 | 1.55 | 3.86 | |
| P_tot | 0.003 | 0.01 | 0.01 | 0.01 | 0.02 | 0.03 | 0.12 | 0.63 | |
| Arc | TSS | 0.5 | 4.85 | 6.8 | 12 | 45 | 439 | 694 | 1750 |
| N_tot | 1.25 | 4.15 | 3.19 | 3.38 | 3.16 | 3.62 | 3.28 | 15.88 | |
| P_tot | 0.078 | 0.18 | 0.21 | 0.18 | 0.16 | 0.74 | 0.69 | 3.1 |
| Mean Loads (Tons/Year) | Method | Berre | Mosson | Lez | Salaison | Vidourle | Arc |
|---|---|---|---|---|---|---|---|
| Total suspended solids | FWMC | 21,334 | 14,038 | 11,174 | 2446 | 42,083 | 53,036 |
| FDRC | 3552 | 2981 | 1924 | 504 | 7158 | 21,875 | |
| Ratio | 6.0 | 4.7 | 5.8 | 4.9 | 5.9 | 2.4 | |
| Total Nitrogen | FWMC | 79.2 | 114.8 | 232.6 | 39.2 | 310.4 | 422.3 |
| FDRC | 24.4 | 87.8 | 148.2 | 34.5 | 215.6 | 365.3 | |
| Ratio | 3.2 | 1.3 | 1.6 | 1.1 | 1.4 | 1.2 | |
| Total Phosphorus | FWMC | 13.1 | 13.9 | 14.7 | 3.0 | 23.8 | 64.2 |
| FDRC | 2.1 | 5.5 | 5.1 | 0.7 | 7.3 | 39.8 | |
| Ratio | 6.2 | 2.5 | 2.9 | 4.3 | 3.3 | 1.6 |
| Mean Loads (Tons/Year) | Method | Berre | Mosson | Lez | Salaison | Vidourle | Arc |
|---|---|---|---|---|---|---|---|
| Total suspended solids | Loads for FWMC NF | 667 | 314 | 1023 | 205 | 2472 | 14,689 |
| FWMC all/NF | 31.98 | 44.65 | 10.92 | 11.92 | 17.02 | 3.61 | |
| FDRC/FWMC NF | 5.32 | 9.48 | 1.88 | 2.46 | 2.90 | 1.49 | |
| Total nitrogen | Loads for FWMC NF | 21.3 | 85.6 | 174.3 | 40.9 | 246.7 | 423.1 |
| FWMC all/NF | 3.72 | 1.34 | 1.33 | 0.96 | 1.26 | 1.00 | |
| FDRC/FWMC NF | 1.13 | 1.03 | 0.85 | 0.86 | 0.88 | 0.86 | |
| Total phosphorus | Loads for FWMC NF | 0.55 | 3.31 | 4.68 | 0.54 | 4.95 | 35.53 |
| FWMC all/NF | 23.89 | 4.19 | 3.14 | 5.58 | 4.81 | 1.81 | |
| FDRC/FWMC NF | 3.83 | 1.66 | 1.09 | 1.30 | 1.47 | 1.12 |
Publisher’s Note: MDPI stays neutral with regard to jurisdictional claims in published maps and institutional affiliations. |
© 2022 by the authors. Licensee MDPI, Basel, Switzerland. This article is an open access article distributed under the terms and conditions of the Creative Commons Attribution (CC BY) license (https://creativecommons.org/licenses/by/4.0/).
Share and Cite
Banton, O.; St-Pierre, S.; Giot, H.; Giraud, A. Importance of Flood Samples for Estimating Sediment and Nutrient Loads in Mediterranean Rivers. Hydrology 2022, 9, 110. https://doi.org/10.3390/hydrology9060110
Banton O, St-Pierre S, Giot H, Giraud A. Importance of Flood Samples for Estimating Sediment and Nutrient Loads in Mediterranean Rivers. Hydrology. 2022; 9(6):110. https://doi.org/10.3390/hydrology9060110
Chicago/Turabian StyleBanton, Olivier, Sylvie St-Pierre, Hélène Giot, and Anaïs Giraud. 2022. "Importance of Flood Samples for Estimating Sediment and Nutrient Loads in Mediterranean Rivers" Hydrology 9, no. 6: 110. https://doi.org/10.3390/hydrology9060110
APA StyleBanton, O., St-Pierre, S., Giot, H., & Giraud, A. (2022). Importance of Flood Samples for Estimating Sediment and Nutrient Loads in Mediterranean Rivers. Hydrology, 9(6), 110. https://doi.org/10.3390/hydrology9060110


