
Determination of Recharge Areas That Supply Decades Old Groundwater to Creeks Inhabited by the Threatened Okaloosa Darter


Abstract
:1. Introduction
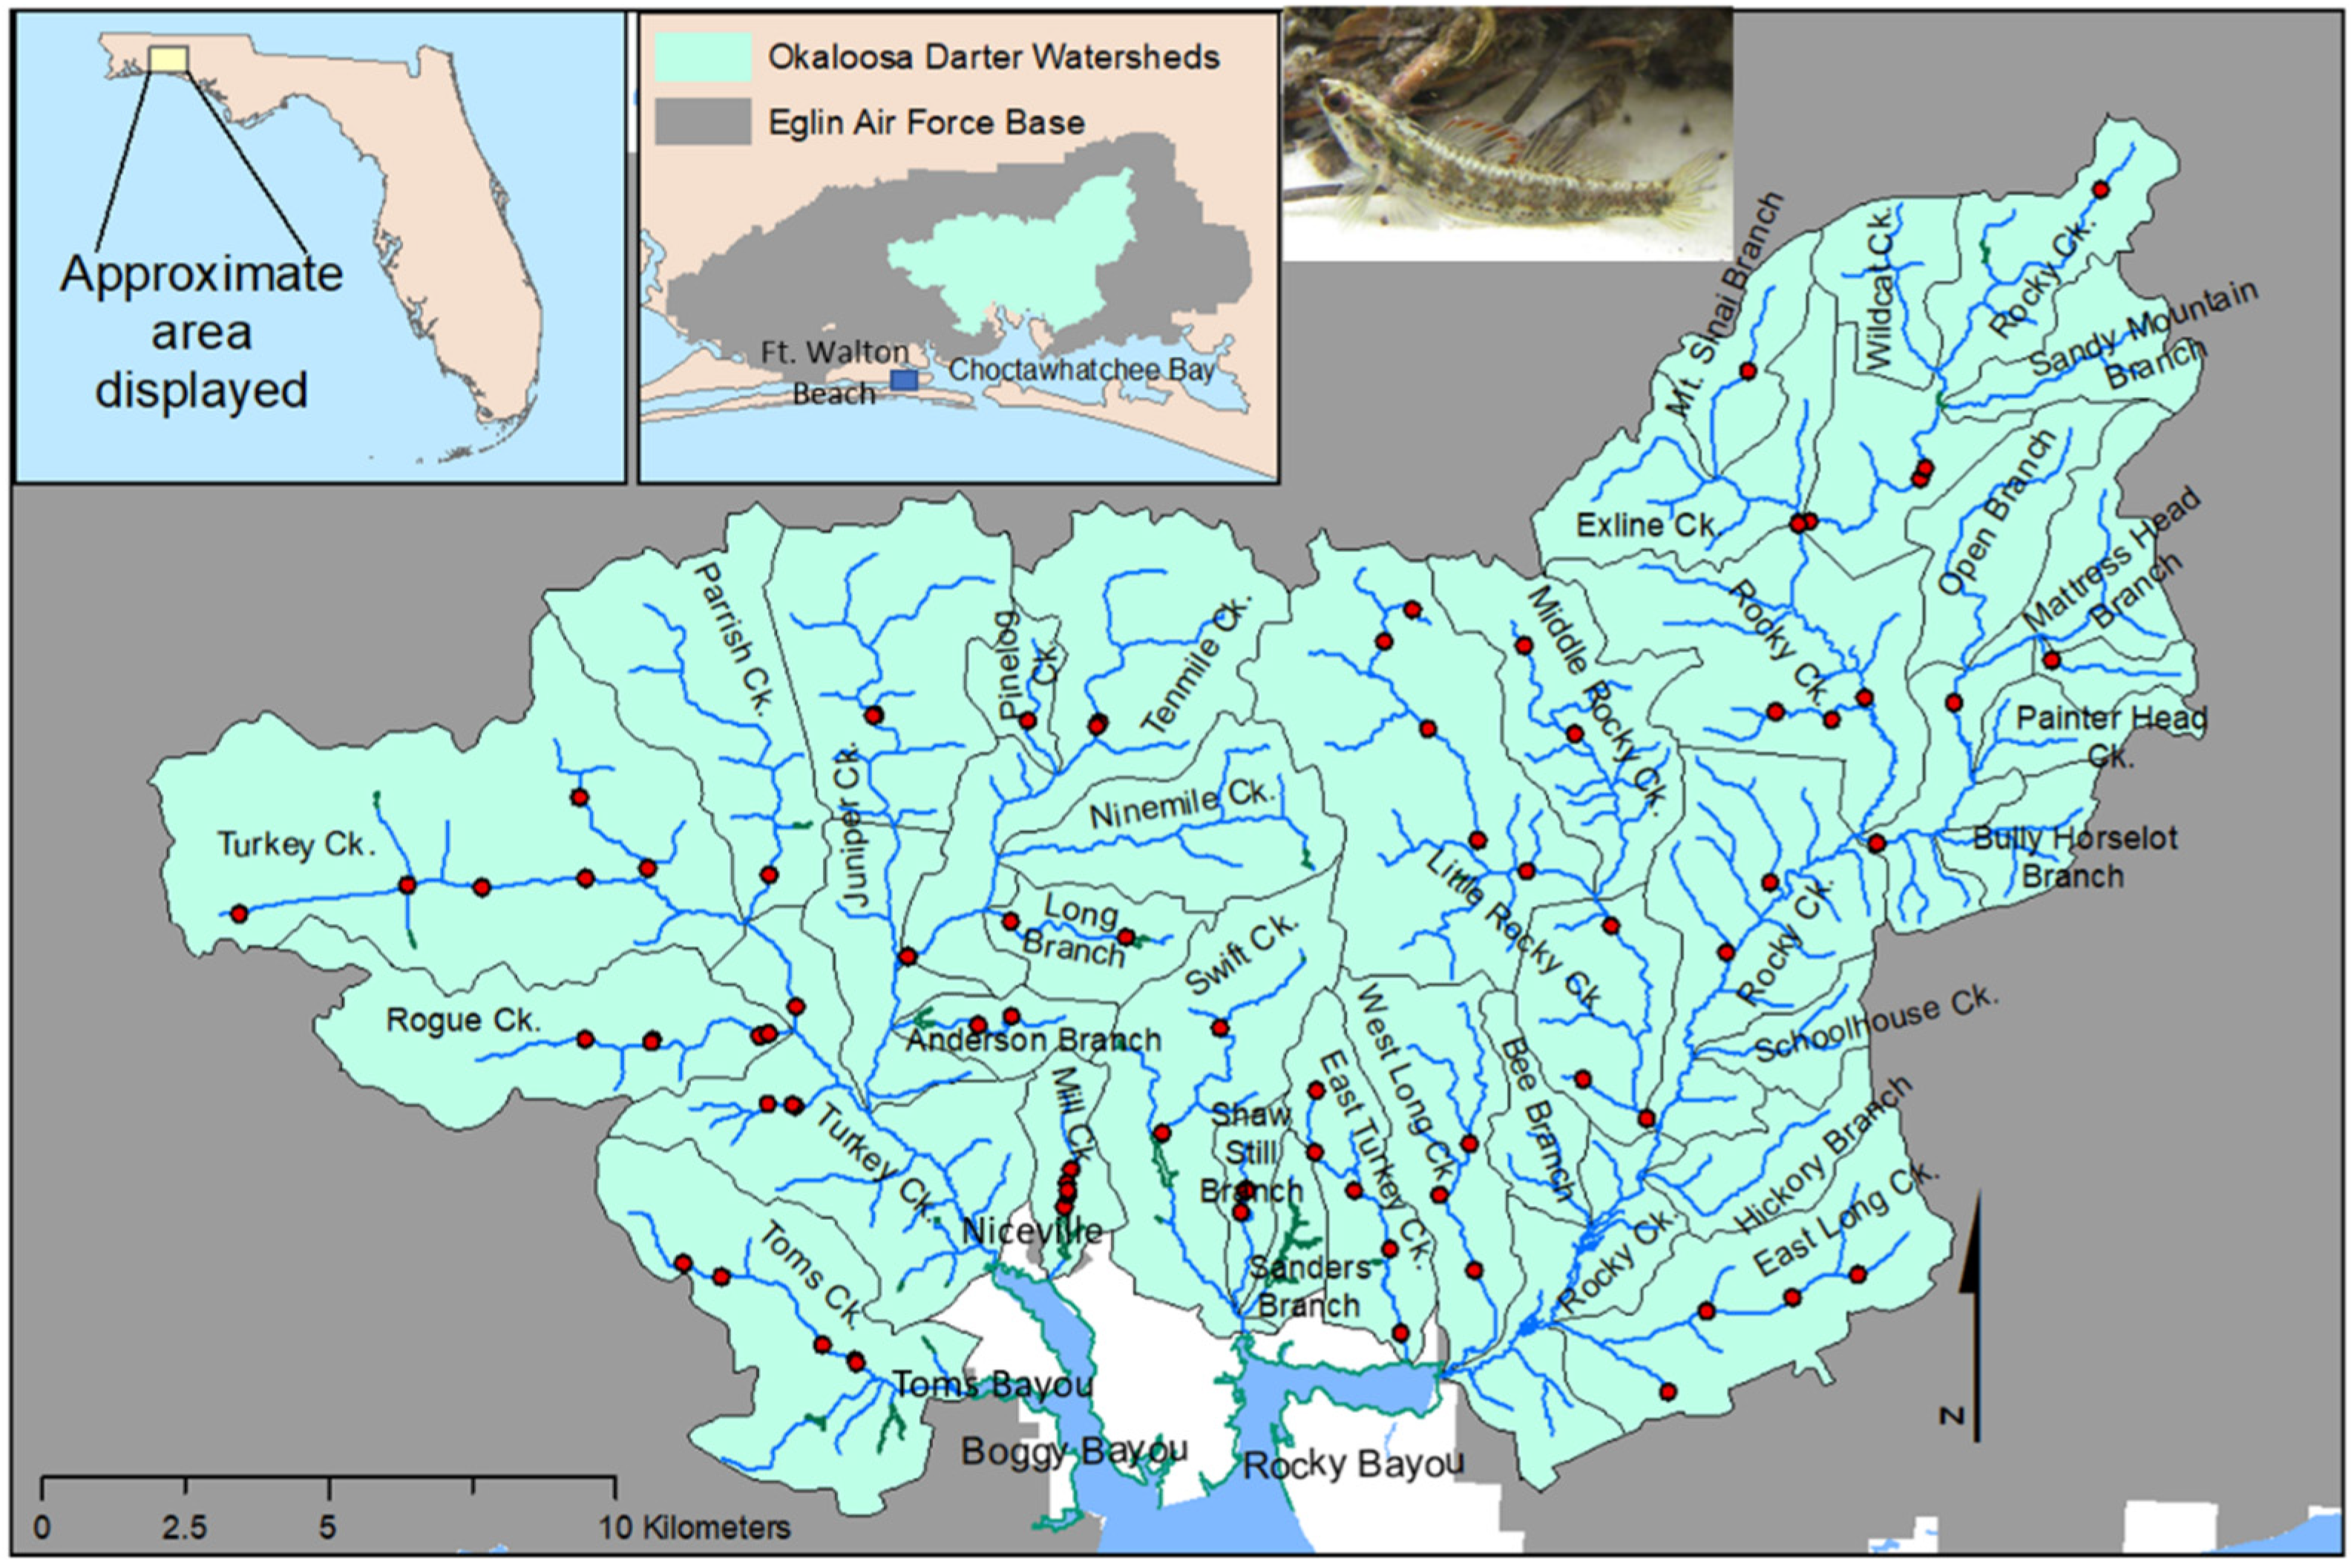
2. Study Area
2.1. Climate
2.2. Physiography
2.3. Hydrogeology
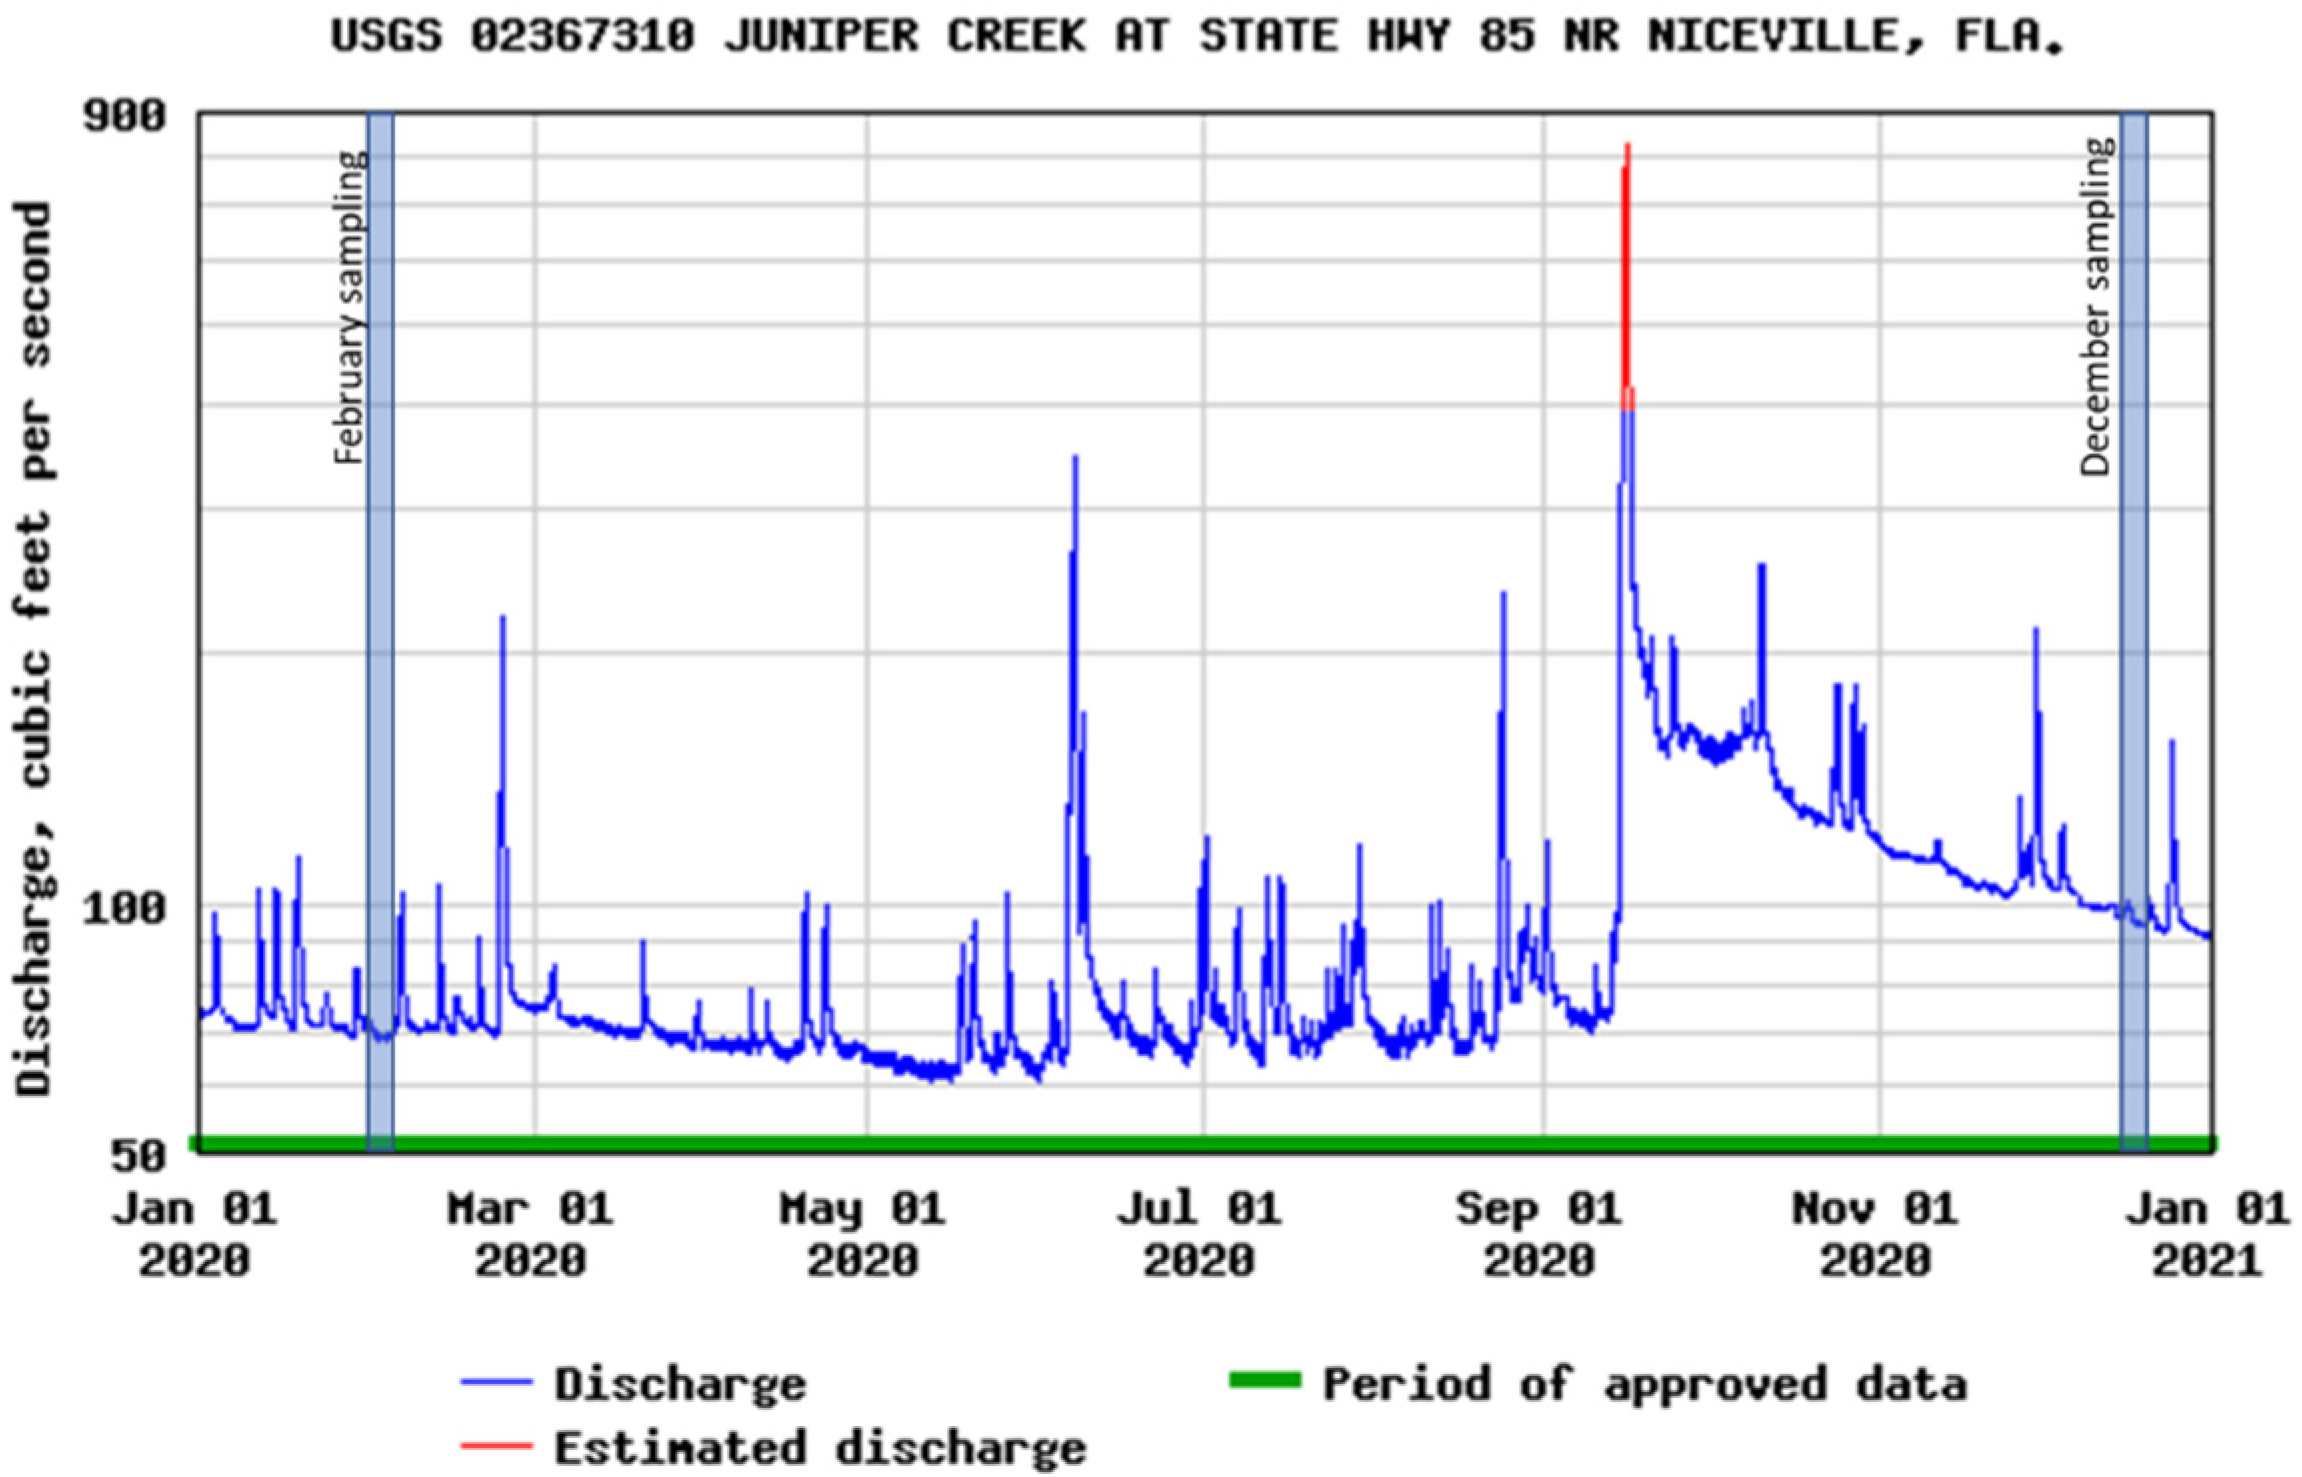
2.4. Creek Flow
3. Methods
3.1. Study Design
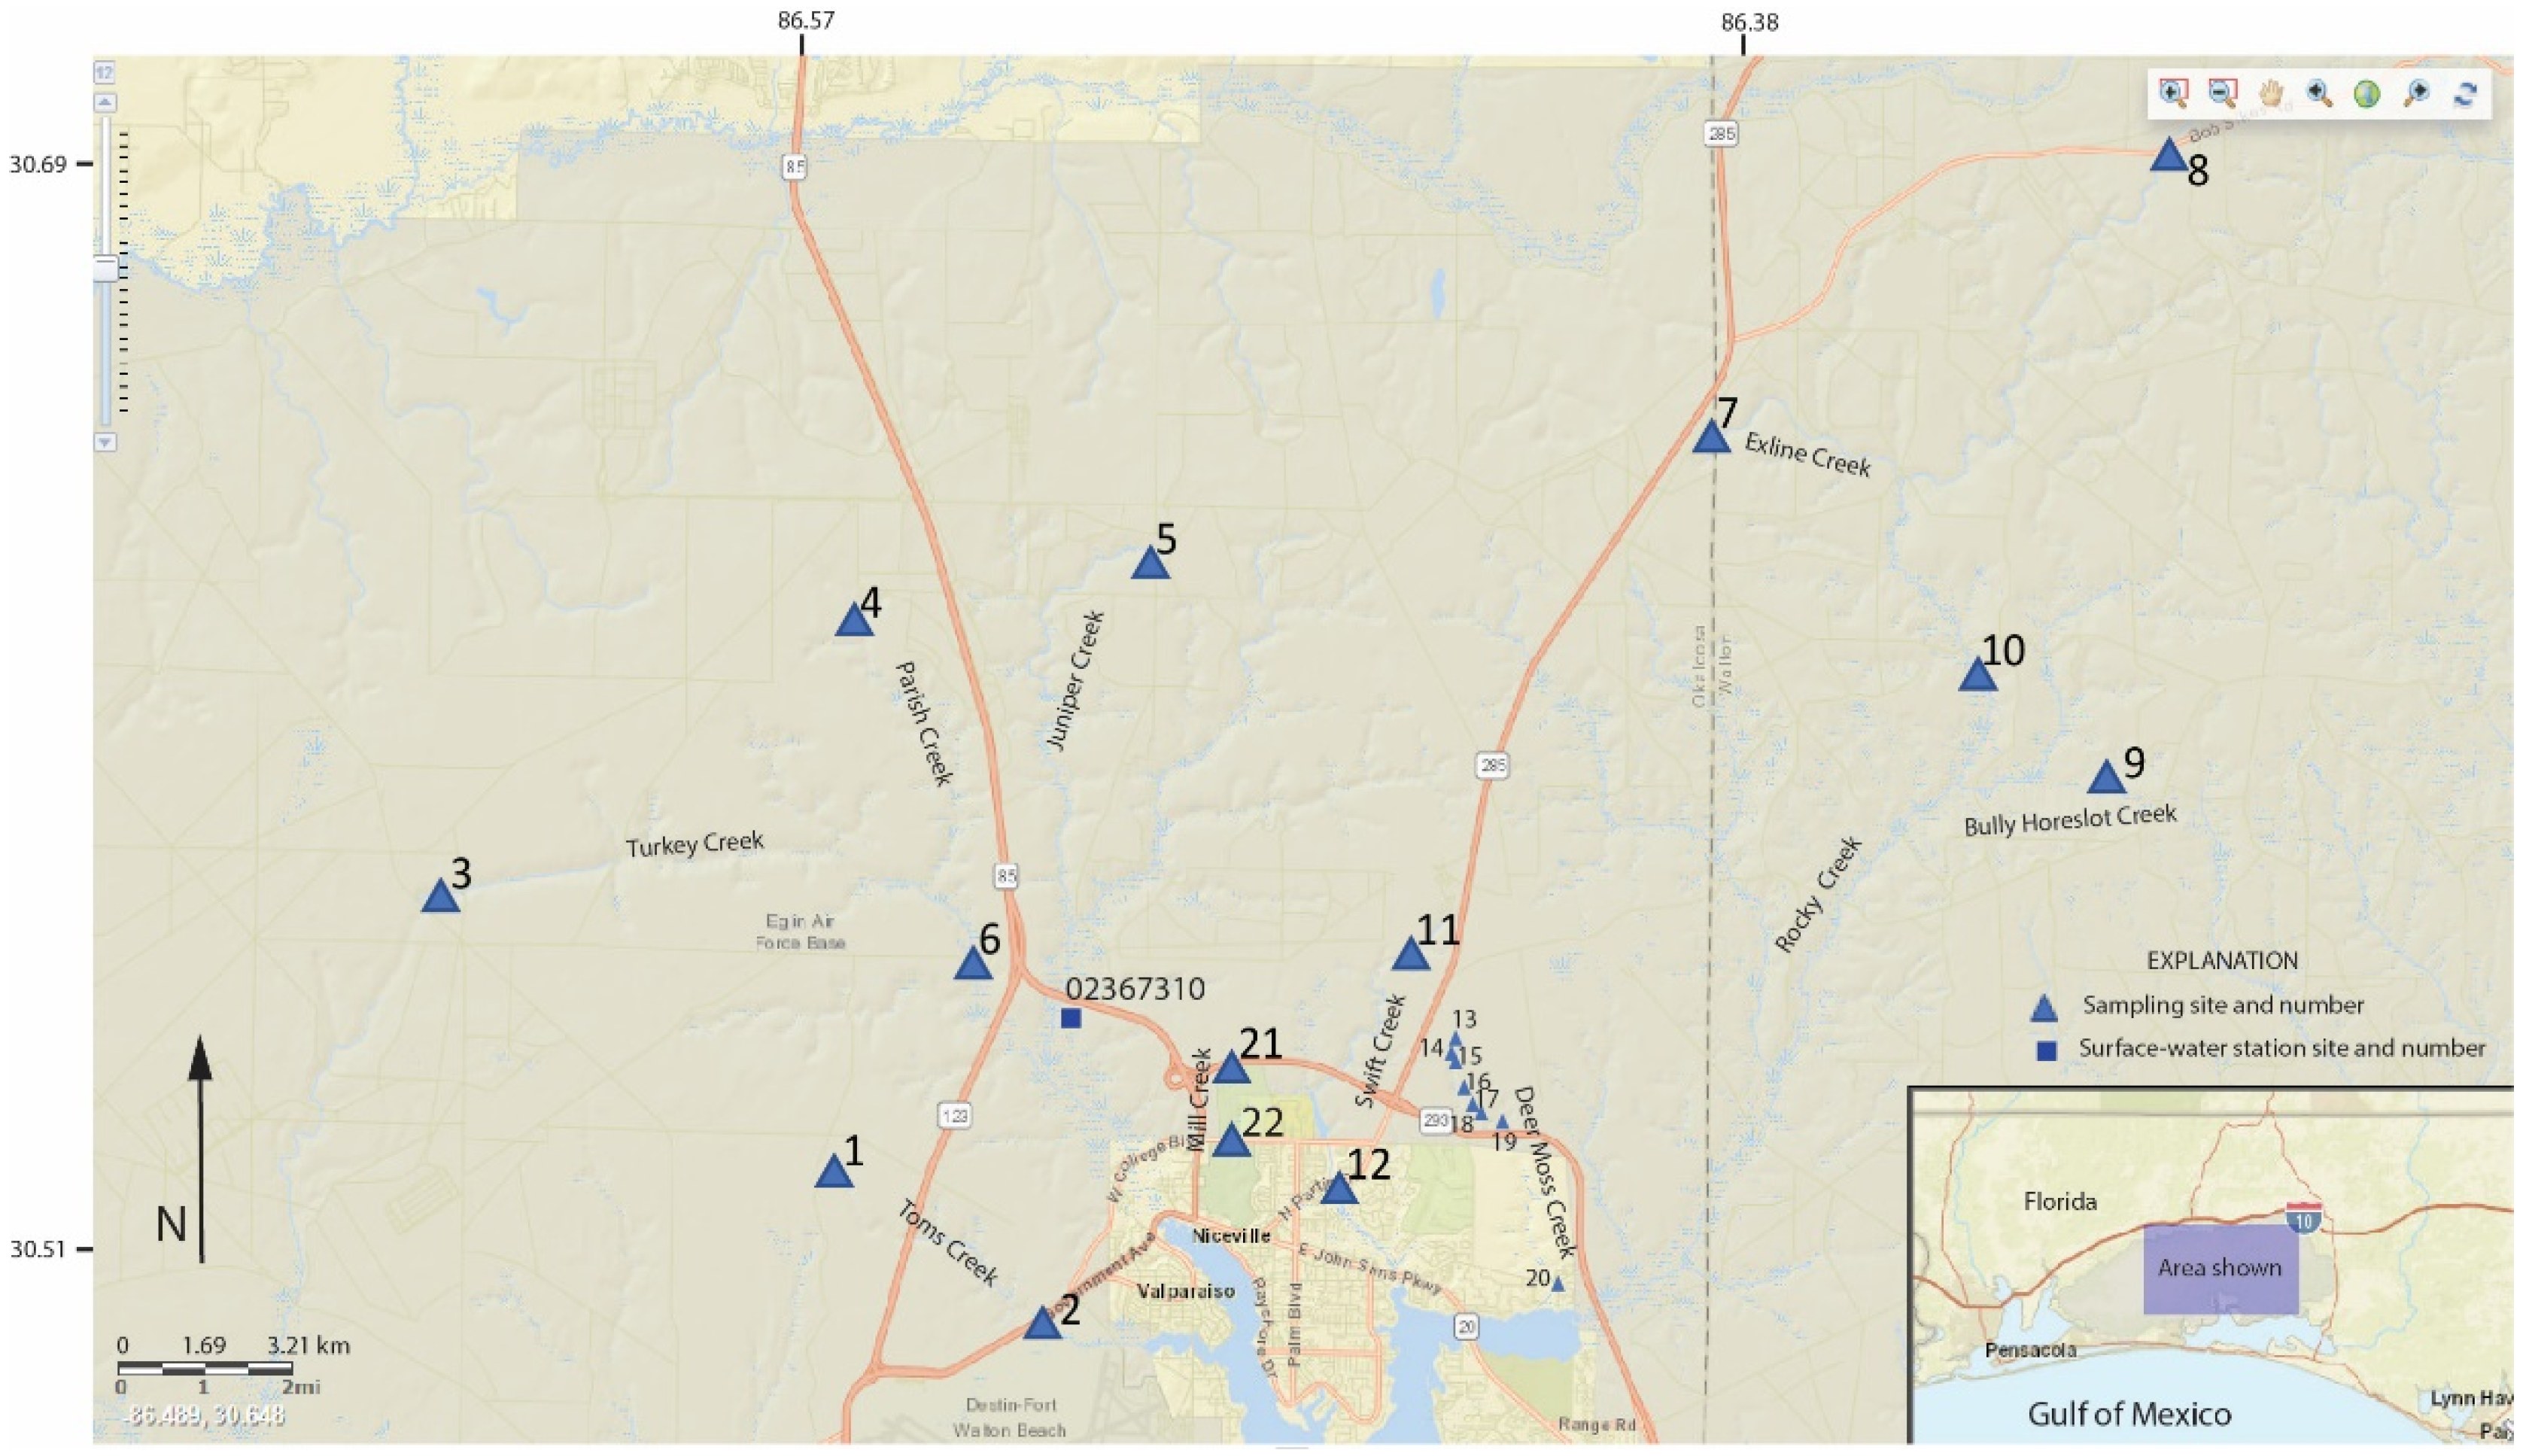
3.2. Creek Basins Studied and Sites Sampled
3.3. Groundwater Head Measurements
3.4. Groundwater and Creek Geochemistry Measurements
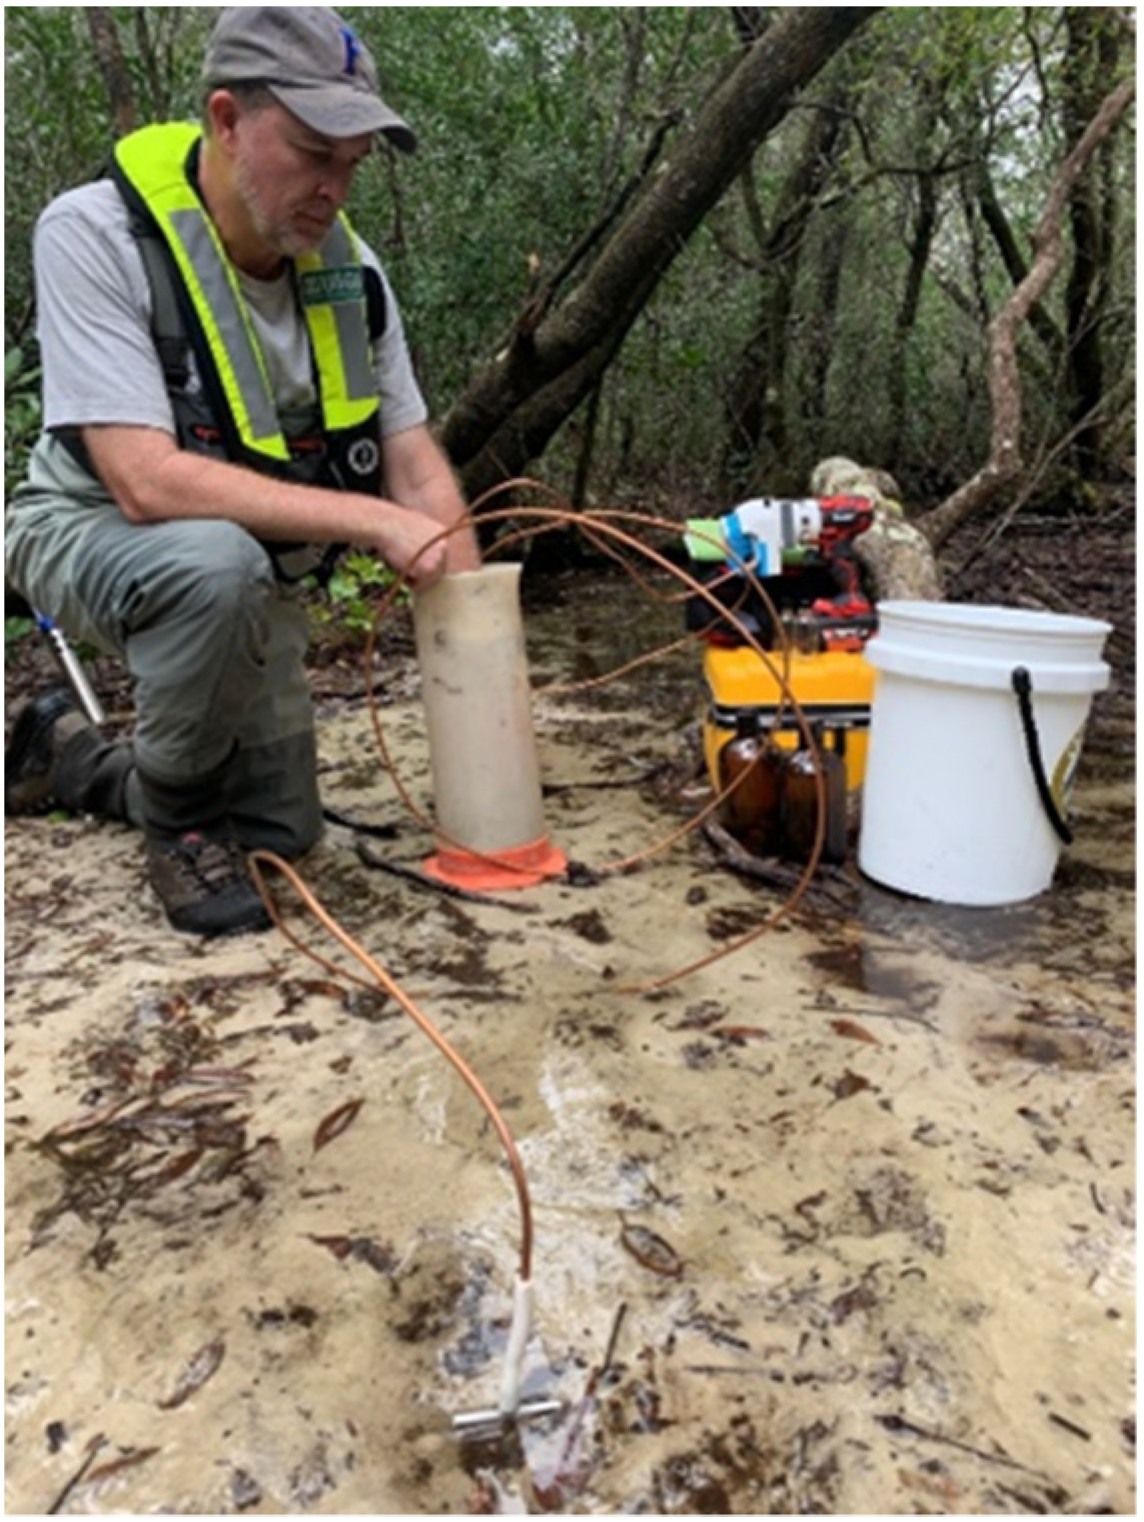
3.4.1. Field Measurements
3.4.2. Laboratory Analyses
3.5. Recharge Extent and Area Determinations
4. Results
4.1. Creek Flow
4.2. Groundwater Head Measurements

| Sample Basin and Number (Figure 3) | Sample Date | Sample Time | Altitude, Groundwater Head above Creek Water Level (cm) | Hydraulic Gradient, Vertical, Upward (Dimensionless) |
|---|---|---|---|---|
| Toms Creek Basin | ||||
| 1 | 4 February 2020 | 1130 | 8.89 | 0.08 |
| 2 | 4 February 2020 | 925 | 3.81 | 0.03 |
| Turkey Creek Basin | ||||
| 3 | 4 February 2020 | 1400 | 11.4 | 1.10 |
| 4 | 4 February 2020 | 1530 | 11.4 | 1.10 |
| 5 | 4 February 2020 | 1815 | 6.35 | 0.07 |
| 6 | 16 December 2020 | 811 | 1.27 | 0.01 |
| Rocky Creek Basin | ||||
| 7 | 5 February 2020 | 900 | 8.25 | 0.07 |
| 8 | 5 February 2020 | 1110 | 11.4 | 1.10 |
| 9 | 5 February 2020 | 1430 | 7.62 | 0.07 |
| 10 | 14 December 2020 | 1634 | 5.08 | 0.04 |
| Swift Creek Basin | ||||
| 11 | 5 February 2020 | 1630 | 24.1 | 0.22 |
| 12 | 15 December 2020 | 1446 | 8.89 | 0.08 |
| Deer Moss Creek Basin | ||||
| 13 | 6 February 2020 | 840 | 15.2 | 0.14 |
| 14 | 6 February 2020 | 1000 | 10.1 | 0.09 |
| 15 | 15 December 2020 | 1248 | 1.90 | 0.01 |
| 16 | 15 December 2020 | 1016 | 20.3 | 0.19 |
| 17 | 15 December 2020 | 1109 | 8.89 | 0.08 |
| 18 | 15 December 2020 | 1334 | 35.5 | 0.33 |
| 19 | 14 December 2020 | 1112 | 2.54 | 0.02 |
| 20 | 15 December 2020 | 840 | 12.7 | 0.11 |
| Mill Creek Basin | ||||
| 21 | 14 December 2020 | 841 | 1.27 | 0.01 |
| 22 | 15 December 2020 | 1526 | 3.81 | 0.03 |
4.3. Groundwater and Creek Geochemistry Measurements
4.3.1. Field Measurements
Dissolved Oxygen
| Sample Basin and Number (Figure 3) | Sample Date | Sample Time | GW or SW | Temperature (˚C) | Specific Conductance (µS/cm) | pH | Dissolved Oxygen (mg/L) |
|---|---|---|---|---|---|---|---|
| Toms Creek Basin | |||||||
| 1 | 4 February 2020 | 1124 | GW | 21.09 | 16.42 | 5.18 | 8.47 |
| 1130 | SW | 20.75 | 15.32 | 4.84 | 8.28 | ||
| 2 | 4 February 2020 | 925 | GW | 15.60 | 125.0 | 6.39 | 1.00 |
| 815 | SW | 14.95 | 23.00 | 5.89 | 9.03 | ||
| Turkey Creek Basin | |||||||
| 3 | 4 February 2020 | 1400 | GW | 21.02 | 12.89 | 5.03 | 8.61 |
| 1400 | SW | 21.16 | 14.80 | 5.06 | 8.59 | ||
| 4 | 4 February 2020 | 1530 | GW | 20.76 | 16.11 | 5.00 | 8.64 |
| 1533 | SW | 20.42 | 12.18 | 5.02 | 8.35 | ||
| 5 | 4 February 2020 | 1815 | GW | 20.41 | 14.72 | 4.88 | 6.60 |
| 1815 | SW | 19.60 | 11.15 | 5.01 | 8.03 | ||
| 6 | 16 December 2020 | 850 | GW | 15.29 | 69.39 | 4.07 | 0.86 |
| 811 | SW | 16.12 | 13.50 | 4.53 | 9.30 | ||
| Rocky Creek Basin | |||||||
| 7 | 5 February 2020 | 915 | GW | 21.17 | 17.36 | 5.15 | 8.71 |
| 853 | SW | 20.18 | 13.84 | 5.00 | 8.80 | ||
| 8 | 5 February 2020 | 1118 | GW | 20.17 | 16.34 | 4.81 | 2.64 |
| 1100 | SW | 19.10 | 13.88 | 4.60 | 8.39 | ||
| 9 | 5 February 2020 | 1435 | GW | 19.38 | 14.82 | 5.06 | 9.24 |
| 1415 | SW | 18.21 | 14.85 | 5.02 | 8.41 | ||
| 10 | 14 December 2020 | 1634 | GW | 17.73 | 50.95 | 5.60 | 1.97 |
| 1634 | SW | 18.46 | 10.48 | 5.73 | 8.94 | ||
| 11 | 5 February 2020 | 1630 | GW | 20.55 | 19.13 | 5.07 | 8.83 |
| 1615 | SW | 20.42 | 18.50 | 5.81 | 8.39 | ||
| 12 | 15 December 2020 | 1446 | GW | 17.13 | 55.18 | 5.53 | 2.46 |
| 1446 | SW | 17.06 | 27.50 | 6.18 | 9.18 | ||
| Deer Moss Basin | |||||||
| 13 | 6 February 2020 | 845 | GW | 20.92 | 17.61 | 4.88 | 6.73 |
| 835 | SW | 20.40 | 16.36 | 4.93 | 7.90 | ||
| 14 | 6 February 2020 | 955 | GW | 21.03 | 18.07 | 4.94 | 5.17 |
| 945 | SW | 20.54 | 16.24 | 4.94 | 8.05 | ||
| 15 | 15 December 2020 | 1248 | GW | 19.10 | 20.78 | 5.07 | 6.52 |
| 1248 | SW | 18.95 | 17.86 | 5.18 | 8.27 | ||
| 16 | 15 December 2020 | 1022 | GW | 18.93 | 468.0 | 5.56 | 7.84 |
| 1016 | SW | 17.78 | 73.23 | 5.70 | 8.69 | ||
| 17 | 15 December 2020 | 1109 | GW | 18.63 | 252.0 | 5.88 | 7.04 |
| 1111 | SW | 18.11 | 101.5 | 6.60 | 8.54 | ||
| 18 | 15 December 2020 | 1334 | GW | 19.97 | 28.64 | 5.48 | 3.38 |
| 1334 | SW | 18.87 | 21.04 | 5.73 | 8.47 | ||
| 19 | 14 December 2020 | 1146 | GW | 18.94 | 60.11 | 5.24 | 1.12 |
| 1112 | SW | 18.96 | 104.2 | 6.57 | 8.81 | ||
| 20 | 15 December 2020 | 853 | GW | 13.68 | 47.18 | 5.18 | 2.33 |
| 840 | SW | 13.10 | 80.99 | 6.66 | 9.46 | ||
| Mill Creek Basin | |||||||
| 21 | 14 December 2020 | 852 | GW | 17.82 | 18.22 | 3.94 | 1.37 |
| 841 | SW | 18.29 | 21.38 | 4.34 | 7.76 | ||
| 22 | 15 December 2020 | 1526 | GW | 18.37 | 119.5 | 5.84 | 0.97 |
| 1526 | SW | 17.30 | 39.05 | 6.18 | 8.55 |
Specific Conductance
pH
Groundwater and Surface Water Temperature
4.3.2. Laboratory Analyses
SF6 and Piston Flow Model Recharge Age
| Sample Basin and Number (Figure 3) | Sample Date | Sample Time | SF6 Concentration (fMol/L) | Piston-Type Flow Model (Recharge Year) | Piston-Type Flow Model (Recharge Age, Years before Sample Collected) |
|---|---|---|---|---|---|
| Toms Creek Basin | |||||
| 1 | 4 February 2020 | 1130 | 0.95 | 1991.5 | 28.6 |
| 2 | 4 February 2020 | 0925 | 1.97 | 2012 | 8.10 |
| Turkey Creek Basin | |||||
| 3 | 4 February 2020 | 1400 | 1.98 | 2002 | 18.1 |
| 4 | 4 February 2020 | 1530 | 1.80 | 2001 | 19.1 |
| 5 | 4 February 2020 | 1815 | 1.54 | 1996.5 | 23.6 |
| 6 | 16 December 2020 | 850 | 0.89 | 2004.5 | 16.5 |
| Rocky Creek Basin | |||||
| 7 | 5 February 2020 | 0900 | 1.22 | 1995 | 25.1 |
| 8 | 5 February 2020 | 1110 | 2.21 | 2004 | 16.1 |
| 9 | 5 February 2020 | 1430 | 1.27 | 1995.5 | 24.6 |
| 10 | 14 December 2020 | 1634 | 3.28 | 2016 | 5.00 |
| Swift Creek Basin | |||||
| 11 | 5 February 2020 | 1630 | 2.03 | 2007.5 | 12.6 |
| 12 | 15 December 2020 | 1446 | 1.53 | 1998.5 | 22.5 |
| Deer Moss Creek Basin | |||||
| 13 | 6 February 2020 | 0840 | 2.19 | 2005.5 | 14.6 |
| 15 | 6 February 2020 | 1000 | 2.15 | 2008.5 | 11.6 |
| 19 | 14 December 2020 | 1146 | 1.43 | 1998 | 23.0 |
| Mill Creek Basin | |||||
| 21 | 14 December 2020 | 852 | 2.43 | 2007.5 | 13.5 |
| 22 | 15 December 2020 | 1526 | 1.49 | 1996 | 25.0 |
Dissolved Gases
| Sample Basin and Number (Figure 3) | Sample Date | Sample Time | Recharge Altitude (m above Mean Sea Level) | CH4 (mg/L) | CO2 (mg/L) | N2 (mg/L) | O2 (mg/L) | Ar (mg/L) |
|---|---|---|---|---|---|---|---|---|
| Toms Creek Basin | ||||||||
| 1 | 4 February 2020 | 1130 | 33 | 0.00 | 12.34 | 16.48 | 8.04 | 0.59 |
| 2 | 4 February 2020 | 925 | 45 | 5.70 | 24.56 | 13.25 | 0.24 | 0.52 |
| Turkey Creek Basin | ||||||||
| 3 | 4 February 2020 | 1400 | 45 | 0.00 | 9.93 | 17.71 | 8.90 | 0.61 |
| 4 | 4 February 2020 | 1530 | 60 | 0.00 | 18.32 | 17.36 | 8.86 | 0.60 |
| 5 | 4 February 2020 | 1815 | 57 | 0.00 | 24.26 | 17.91 | 6.31 | 0.63 |
| 6 | 16 December 2020 | 850 | 54 | 12.73 | 199.13 | 9.62 | 0.09 | 0.37 |
| Rocky Creek Basin | ||||||||
| 7 | 5 February 2020 | 900 | 60 | 0.00 | 26.07 | 16.78 | 8.59 | 0.61 |
| 8 | 5 February 2020 | 1110 | 76 | 0.00 | 29.79 | 17.85 | 2.28 | 0.62 |
| 9 | 5 February 2020 | 1430 | 60 | 0.00 | 19.86 | 16.95 | 7.88 | 0.61 |
| 10 | 14 December 2020 | 1634 | 33 | 5.41 | 83.04 | 16.39 | 0.09 | 0.52 |
| Swift Creek Basin | ||||||||
| 11 | 5 February 2020 | 1630 | 45 | 0.00 | 12.78 | 15.94 | 8.51 | 0.57 |
| 12 | 15 December 2020 | 1446 | 33 | 2.14 | 88.93 | 17.10 | 0.08 | 0.61 |
| Deer Moss Creek Basin | ||||||||
| 13 | 6 February 2020 | 840 | 45 | 0.00 | 14.89 | 17.08 | 6.38 | 0.59 |
| 16 | 6 February 2020 | 1000 | 45 | 0.00 | 17.59 | 16.08 | 5.30 | 0.57 |
| 19 | 14 December 2020 | 1146 | 33 | 1.74 | 34.03 | 16.01 | 0.08 | 0.56 |
| Mill Creek Basin | ||||||||
| 21 | 14 December 2020 | 852 | 36 | 0.19 | 43.69 | 17.42 | 0.08 | 0.63 |
| 22 | 15 December 2020 | 1526 | 33 | 2.77 | 58.80 | 17.14 | 0.08 | 0.54 |
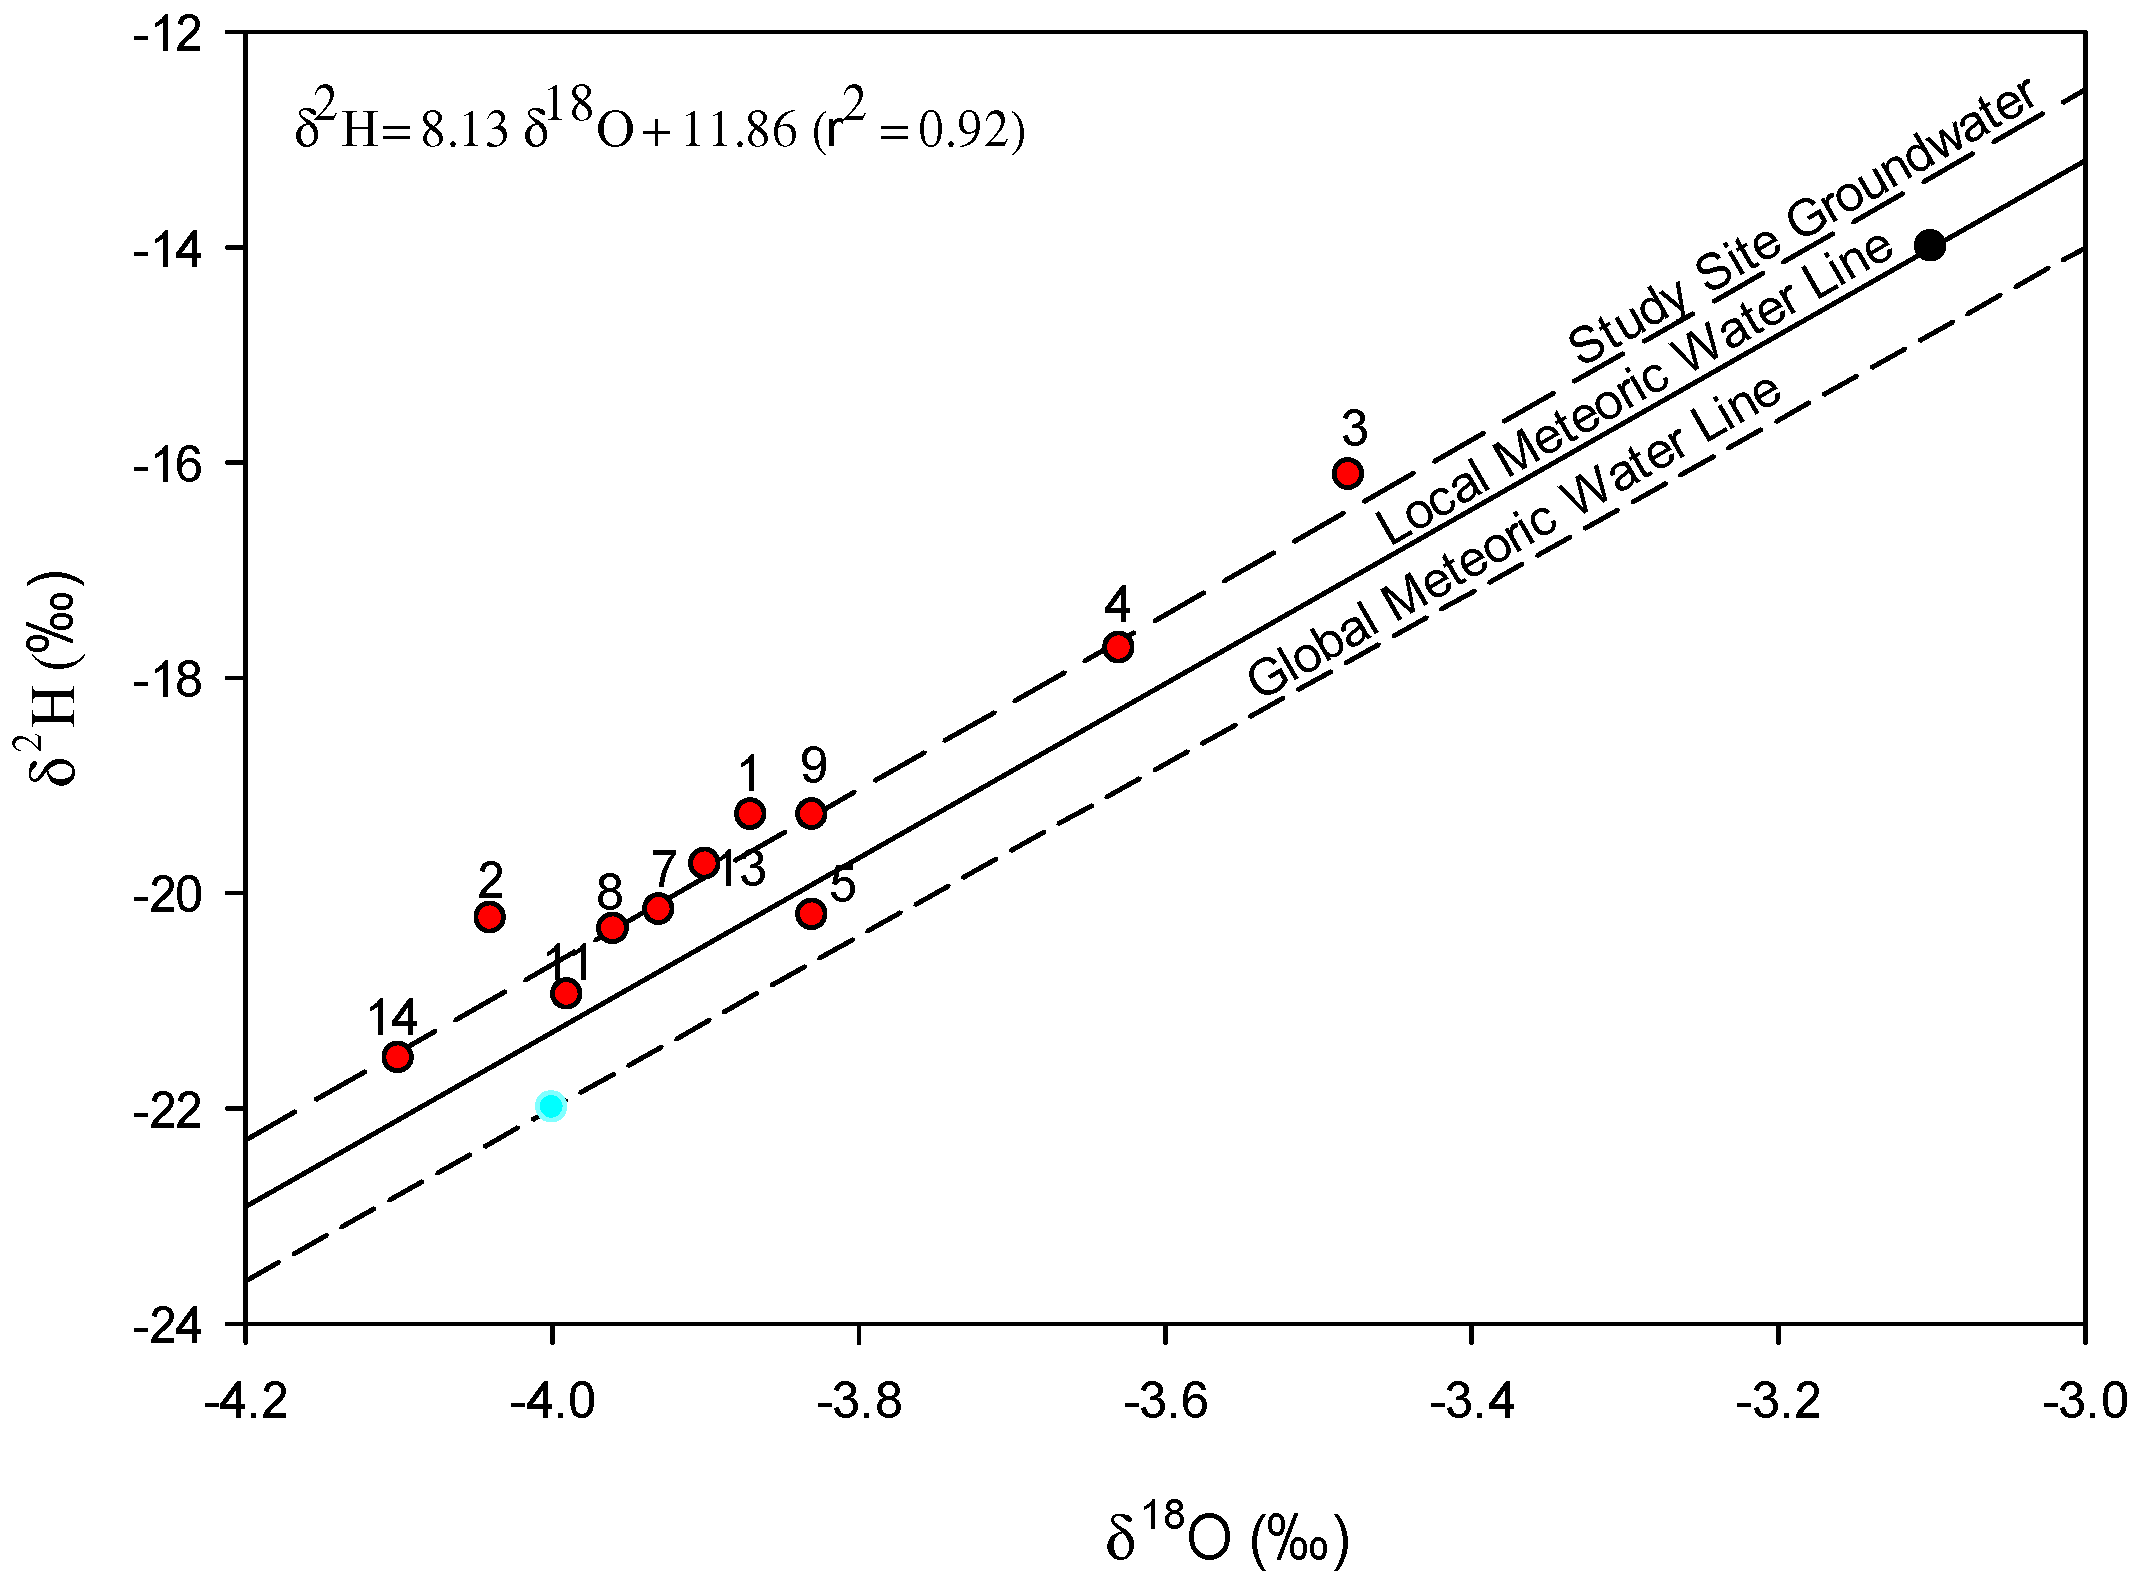
Stable Hydrogen and Oxygen Isotope Concentrations
| Sample Name and Number (Figure 3) | Sample Date | Sample Time | δ2H (‰) | δ18O (‰) |
|---|---|---|---|---|
| Toms Creek Basin | ||||
| 1 | 4 February 2020 | 1130 | −19.28 | −3.87 |
| 2 | 4 February 2020 | 925 | −20.24 | −4.04 |
| Turkey Creek Basin | ||||
| 3 | 4 February 2020 | 1400 | −16.12 | −3.48 |
| 4 | 4 February 2020 | 1530 | −17.73 | −3.63 |
| 5 | 4 February 2020 | 1815 | −20.21 | −3.83 |
| Rocky Creek Basin | ||||
| 7 | 5 February 2020 | 900 | −20.16 | −3.93 |
| 8 | 5 February 2020 | 1110 | −20.34 | −3.96 |
| 9 | 5 February 2020 | 1430 | −19.28 | −3.83 |
| Swift Creek Basin | ||||
| 11 | 5 February 2020 | 1630 | −20.95 | −3.99 |
| Deer Moss Creek Basin | ||||
| 13 | 6 February 2020 | 840 | −19.74 | −3.90 |
| 15 | 6 February 2020 | 1000 | −21.54 | −4.10 |
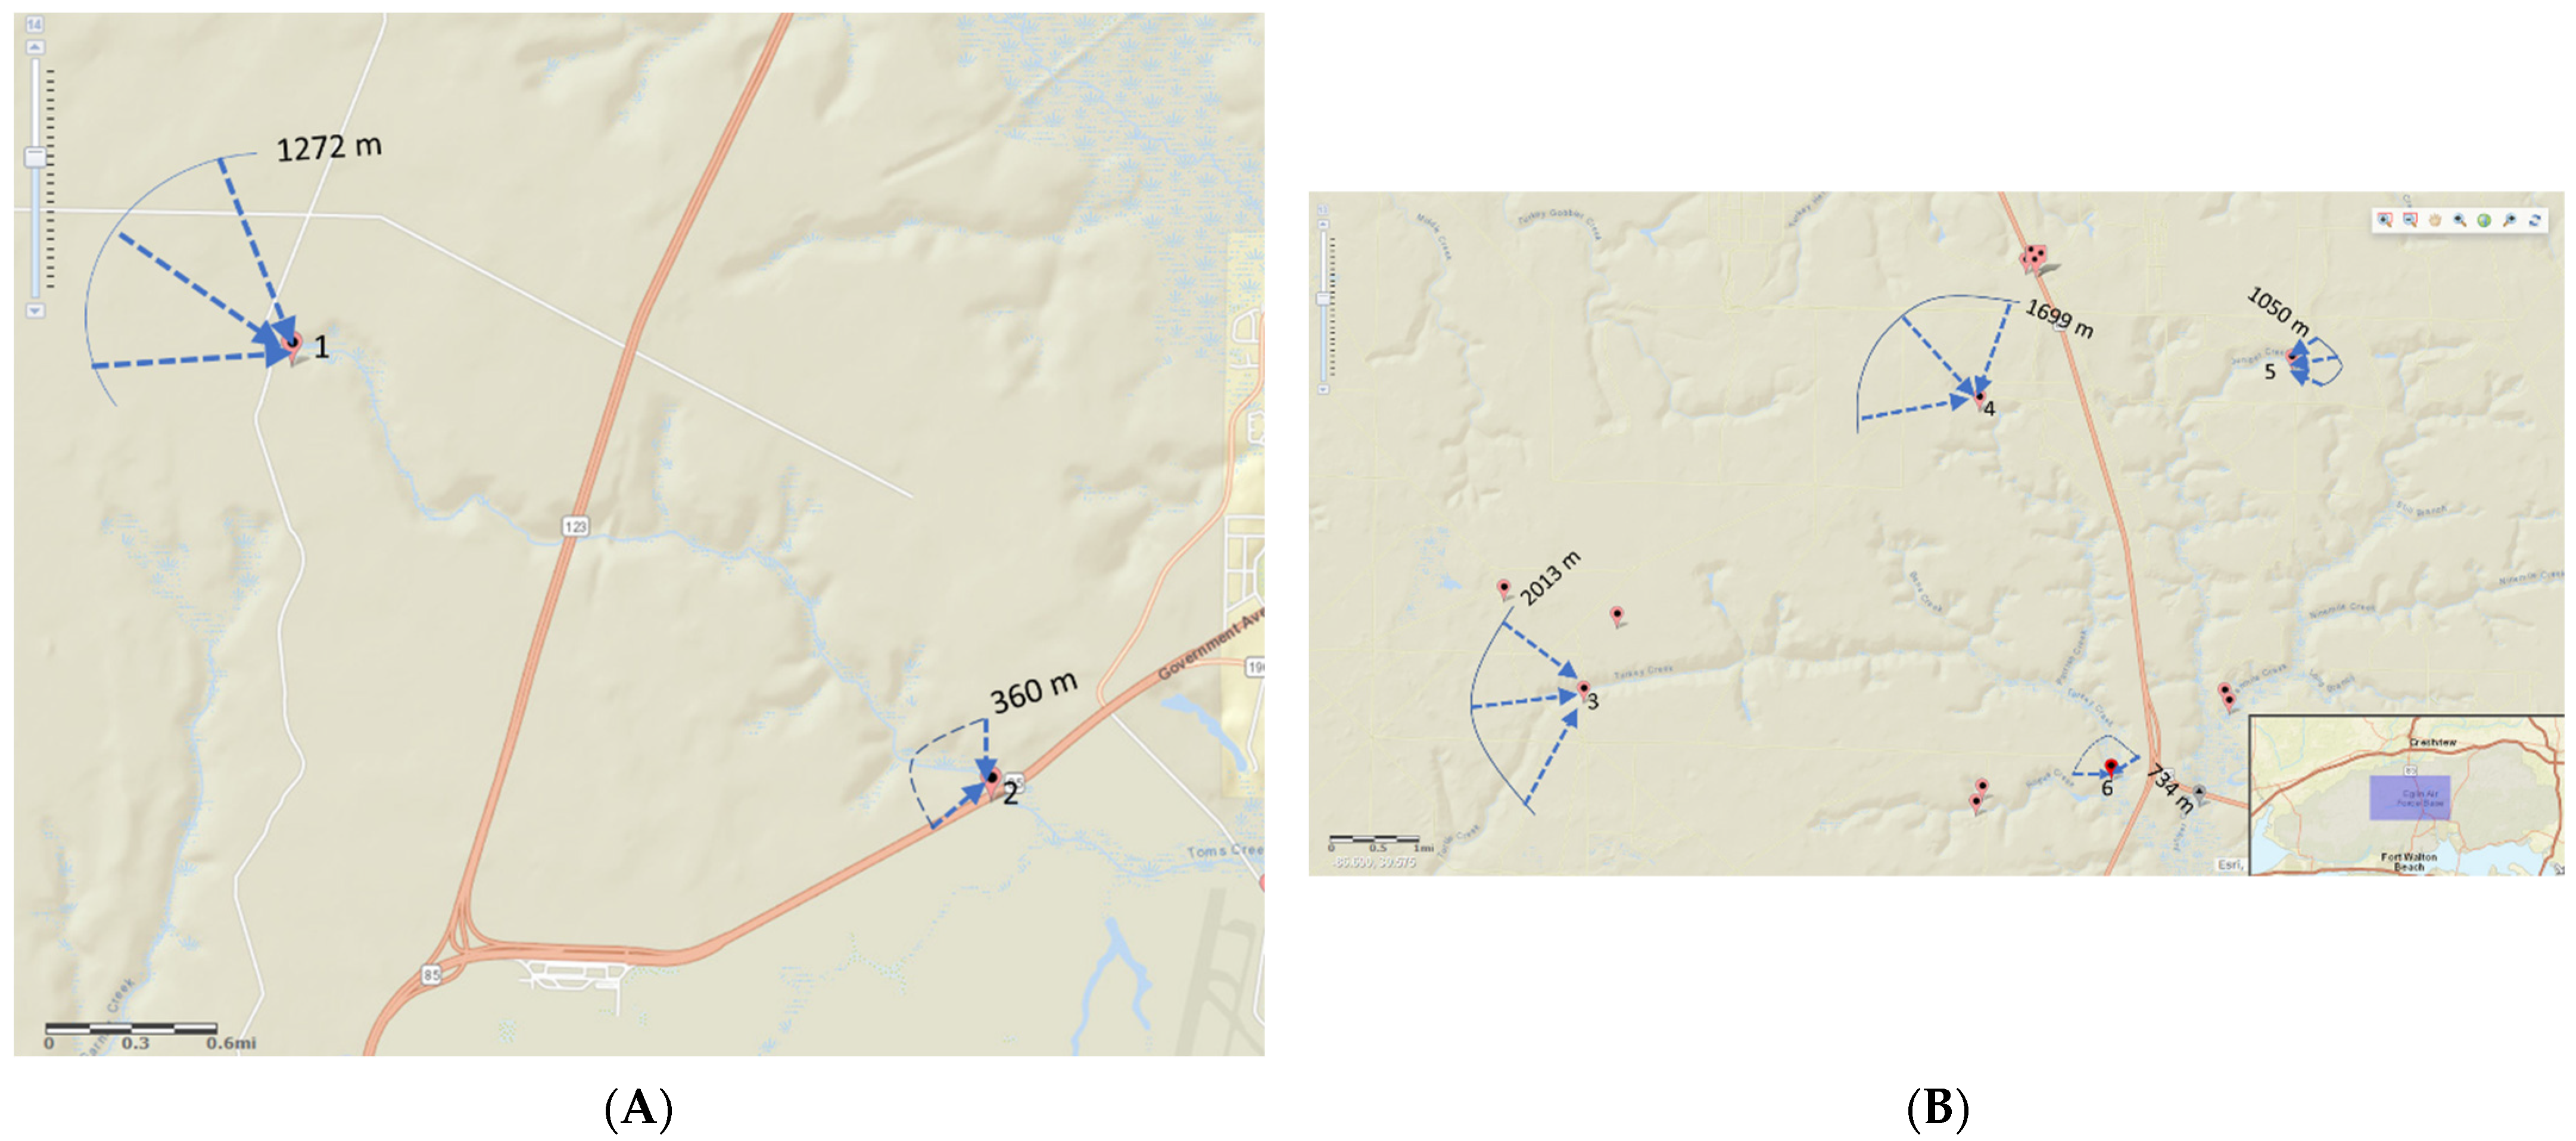
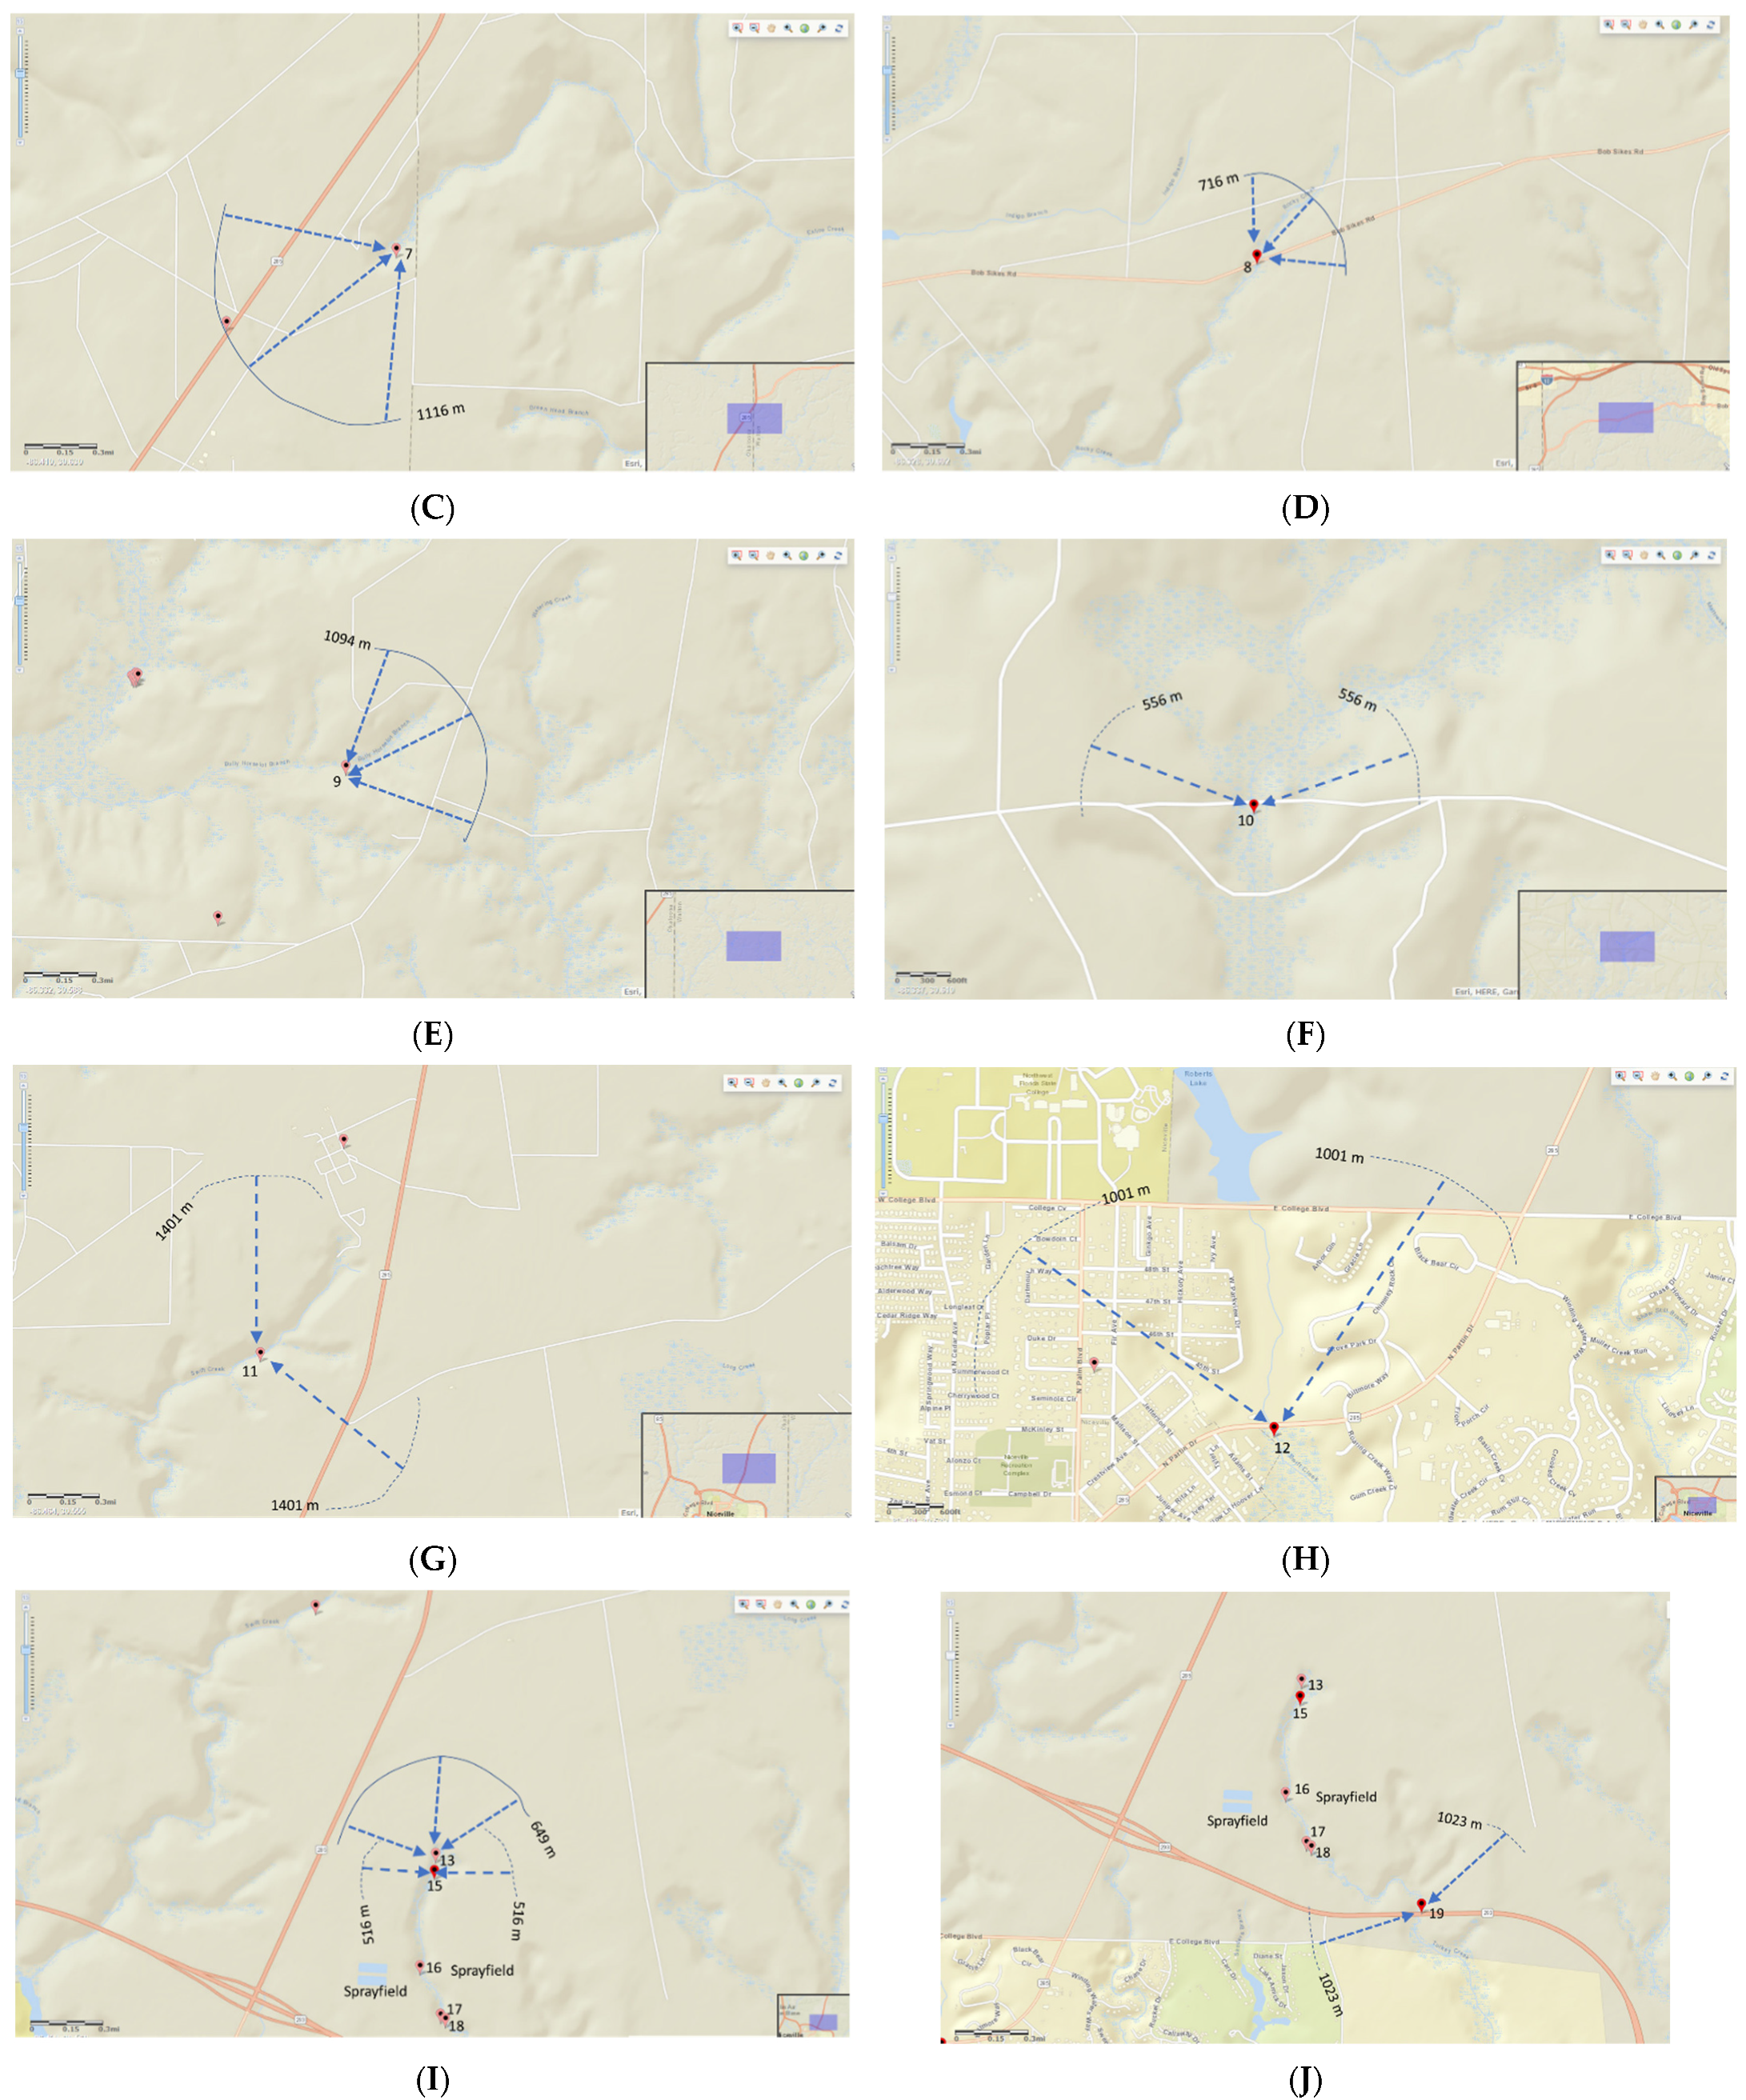
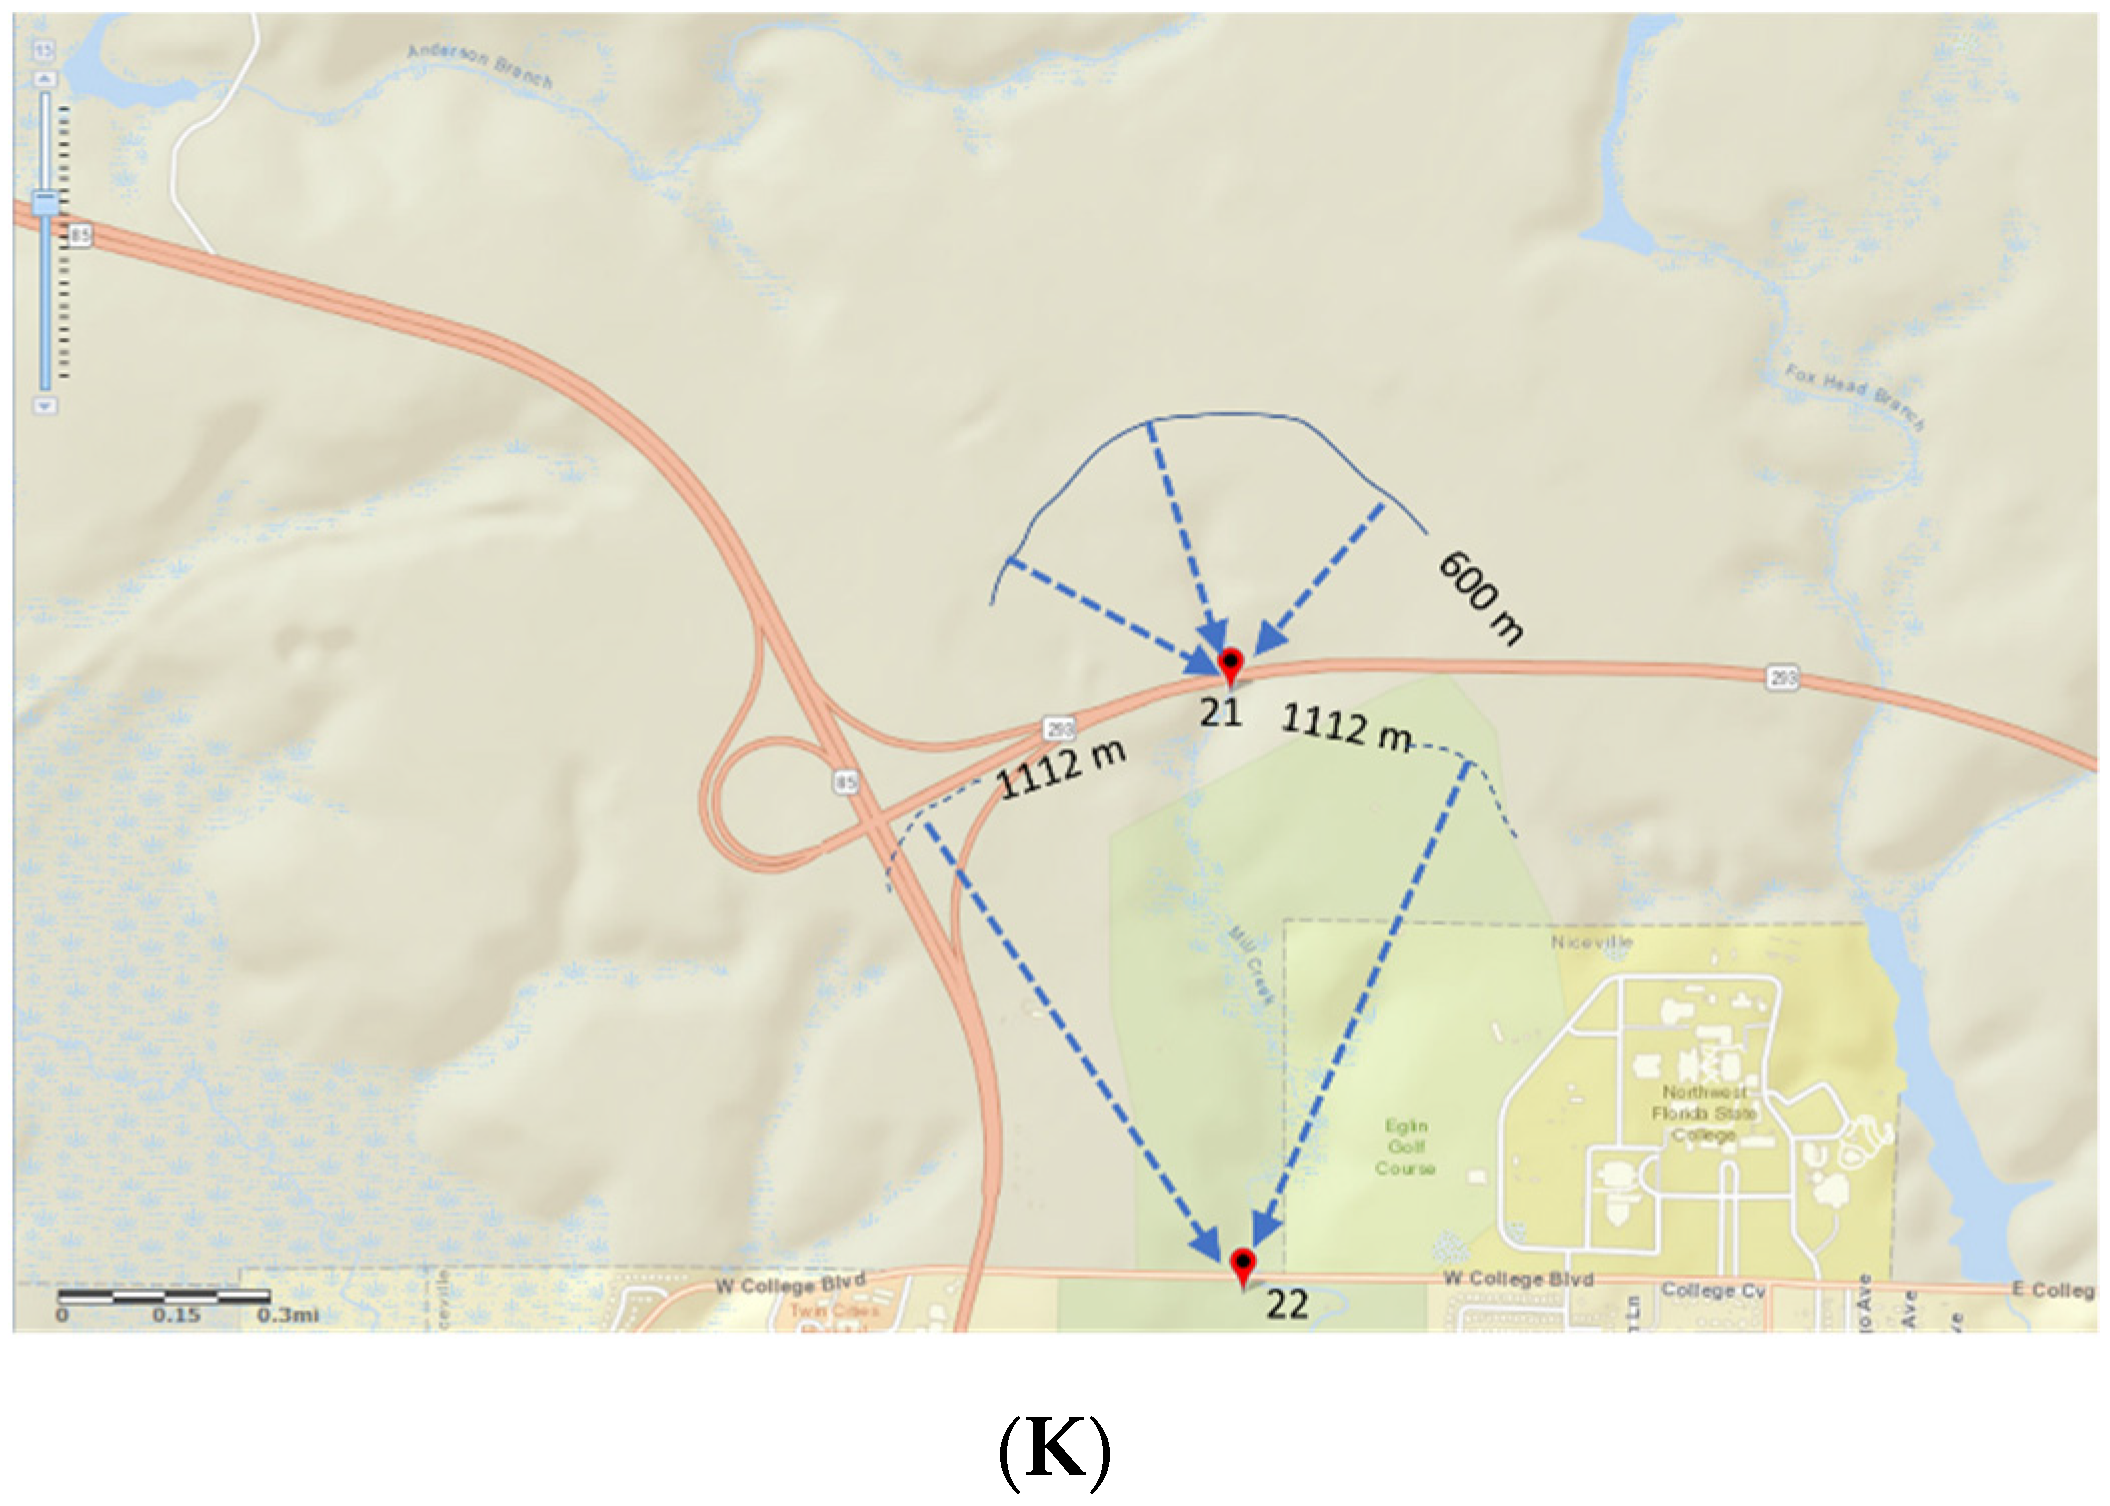
4.4. Recharge Extents
| Site Name and Number (Figure 3) | Time (Sulfur Hexafluoride (SF6)-Based Age Date) | Distance (m), Hydraulic Conductivity, K, of 15 m/d | Distance (m), Hydraulic Conductivity, K, of 30 m/d | Distance (m), Hydraulic Conductivity, K, of 38 m/d |
|---|---|---|---|---|
| Toms Creek Basin | ||||
| 1 | 28.6 | 1272 | 2545 | 3181 |
| 2 | 8.1 | 360 | 720 | 900 |
| Turkey Creek Basin | ||||
| 3 | 18.1 | 805 | 1610 | 2013 |
| 4 | 19.1 | 849 | 1699 | 2124 |
| 5 | 23.6 | 1050 | 2100 | 2625 |
| 6 | 16.5 | 734 | 1468 | 1835 |
| Rocky Creek Basin | ||||
| 7 | 25.1 | 1116 | 2233 | 2792 |
| 8 | 16.1 | 716 | 1432 | 1791 |
| 9 | 24.6 | 1094 | 2189 | 2736 |
| 10 | 5 | 222 | 445 | 556 |
| Swift Creek Basin | ||||
| 11 | 12.6 | 560 | 1121 | 1401 |
| 12 | 22.5 | 1001 | 2002 | 2503 |
| Deer Moss Basin | ||||
| 13 | 14.6 | 649 | 1299 | 1624 |
| 15 | 11.6 | 516 | 1032 | 1290 |
| 19 | 23 | 1023 | 2047 | 2558 |
| Mill Creek Basin | ||||
| 21 | 13.5 | 600 | 1201 | 1501 |
| 22 | 25 | 1112 | 2225 | 2781 |
5. Discussion
Author Contributions
Funding
Institutional Review Board Statement
Informed Consent Statement
Data Availability Statement
Acknowledgments
Conflicts of Interest
References
- Austin, J.D.; Jelks, H.L.; Tate, B.; Johnson, A.R.; Jordan, F. Population genetic structure and conservation genetics of threatened Okaloosa darters (Etheostoma okaloosae). Conserv. Genet. 2011, 12, 981–989. [Google Scholar] [CrossRef]
- Holt, D.E.; Jelks, H.L.; Jordan, F. Movement and Longevity of Imperiled Okaloosa Darters (Etheostoma okaloosae). Copeia 2013, 2013, 653–659. [Google Scholar] [CrossRef]
- Reeves, D.B.; Tate, W.B.; Jelks, H.L.; Jordan, F. Response of Imperiled Okaloosa Darters to Stream Restoration. N. Am. J. Fish. Manag. 2016, 36, 1375–1385. [Google Scholar] [CrossRef]
- Jelks, H.L.; Tate, B.; Jordan, F. Weapons testing and endangered fish coexist in Florida. In Endangered Species Bulletin; U.S. Fish & Wildlife Service: Arlington, VA, USA, 2011; Volume 36, pp. 46–48. [Google Scholar]
- U.S. Fish and Wildlife Service. Okaloosa Darter (Etheostoma Okaloosae) Recovery Plan (Revised); U.S. Fish & Wildlife Service: Arlington, VA, USA, 1998; p. 42.
- U.S. Department of Commerce. Climatological Data, Florida Annual Summaries; National Oceanic and Atmospheric Administration, Environmental Data Service: Asheville, NC, USA, 1978; Available online: https://www.ncdc.noaa.gov/wdcmet and https://statesummaries.ncics.org/chapter/fl/; (accessed on 4 November 2021).
- Schumm, S.A.; Boyd, K.F.; Wolff, C.G.; Spitz, W.J. A ground-water sapping landscape in the Florida Panhandle. Geomorphology 1995, 12, 281–297. [Google Scholar] [CrossRef]
- Landmeyer, J.E.; Wellborn, J.B. Geomorphology and groundwater origin of amphitheater-shaped gullies at Fort Gordon, Georgia, 2010–2012. In U.S. Geological Survey Open-File Report 2013–1230; U.S. Geological Survey: Reston, VA, USA, 2013; p. 19. [Google Scholar] [CrossRef] [Green Version]
- Marsh, O.T. Geology of Escambia and Santa Rosa Counties, western Florida Panhandle. In Florida Geological Survey Bulletin No. 46; Division of Geology: Baltimore, MD, USA, 1966; p. 140. [Google Scholar]
- Hayes, L.R.; Barr, D.E. Hydrology of the sand-and-gravel aquifer, southern Okaloosa and Walton Counties, Northwest Florida. In U.S. Geological Survey Water-Resources Investigations Report 82-4110; U.S. Geological Survey: Reston, VA, USA, 1982; p. 43. [Google Scholar] [CrossRef]
- Hayashi, M.; Rosenberry, D. Effects of Ground Water Exchange on the Hydrology and Ecology of Surface Water. Groundwater 2002, 40, 309–316. [Google Scholar] [CrossRef] [PubMed]
- National Integrated Drought Information System. Historical Data and Conditions. Available online: https://www.drought.gov/historical-information?state=florida&dataset=0&selectedDateUSDM=20120124&dateRangeUSDM=2012-2022 (accessed on 4 November 2021).
- U.S. Geological Survey. National Water Information System: U.S. Geological Survey Web Interface. 2020. Available online: http://dx.doi.org/10.5066/F7P55KJN (accessed on 5 June 2020).
- Landmeyer, J.E.; Bradley, P.M.; Trego, D.A.; Hale, K.G.; Haas, J.E., II. MTBE, TBA, and TAME attenuation in diverse hyporheic zones. Ground Water 2010, 48, 30–41. [Google Scholar] [CrossRef] [PubMed]
- U.S. Geological Survey. [Variously Dated]. National field manual for the collection of water-quality data. In U.S. Geological Survey Techniques of Water-Resources Investigations, Book 9, Chaps. A1–A9; U.S. Geological Survey: Reston, VA, USA. Available online: https://pubs.water.usgs.gov/twri9A (accessed on 5 June 2020).
- Busenberg, E.; Plummer, L.N. Dating young ground water with sulfur hexafluoride. Natural and anthropogenic sources of sulfur hexafluoride. Water Resour. Res. 2000, 36, 3011–3030. [Google Scholar] [CrossRef]
- Plummer, N.; Friedman, L.C. Tracing and dating young ground water. In U.S. Geological Survey Fact Sheet 134–99; U.S. Geological Survey: Reston, VA, USA, 1999; p. 4. [Google Scholar] [CrossRef]
- Jurgens, B.C.; Böhlke, J.K.; Eberts, S.M. TracerLPM (Version 1): An Excel® workbook for interpreting groundwater age dis-tributions from environmental tracer data. In U.S. Geological Survey Techniques and Methods Report 4-F3; U.S. Geological Survey: Reston, VA, USA, 2012; p. 60. Available online: https://pubs.usgs.gov/tm/4-f3/ (accessed on 2 January 2021).
- Weiss, R.F. The solubility of nitrogen, oxygen and argon in water and seawater. Deep. Sea Res. Oceanogr. Abstr. 1970, 17, 721–735. [Google Scholar] [CrossRef]
- Bugna, G.C.; Grace, J.M.; Hsieh, Y.-P. Sensitivity of using stable water isotopic tracers to study the hydrology of isolated wetlands in North Florida. J. Hydrol. 2020, 580, 124321. [Google Scholar] [CrossRef]
- Craig, H. Isotopic Variations in Meteoric Waters. Science 1961, 133, 1702–1703. [Google Scholar] [CrossRef] [PubMed]
- Heath, R.C. Basic Ground-Water Hydrology. In U.S. Geological Survey Water-Supply Paper 2220; U.S. Geological Survey: Reston, VA, USA, 1983; p. 86. Available online: https://pubs.er.usgs.gov/publication/wsp2220 (accessed on 2 January 2021).
- Trapp, H., Jr.; Pascale, C.A.; Foster, J.B. Water resources of Okaloosa County and Adjacent Areas, Florida. In U.S. Geological Survey Water Resources Investigations 77-9; U.S. Geological Survey: Reston, VA, USA, 1977; p. 86. Available online: https://pubs.er.usgs.gov/publication/wri779 (accessed on 2 January 2021).
- U.S. Geological Survey. pH of Rainfall in the USA. 2002. Available online: https://www.usgs.gov/media/images/ph-rainfall-usa-2002 (accessed on 22 March 2022).
- Alexander, M.D.; Caissie, D. Variability and Comparison of Hyporheic Water Temperatures and Seepage Fluxes in a Small Atlantic Salmon Stream. Groundwater 2003, 41, 72–82. [Google Scholar] [CrossRef] [PubMed]


| Sample Basin, Name, and Number (Figure 3) | USGS Station Name | Latitude | Longitude |
|---|---|---|---|
| Toms Creek Basin | |||
| Toms Creek Headwaters (1) | 303144086335800 | 30.528972 | 86.524167 |
| Toms Creek at Eglin Parkway (2) | 303023086312700 | 30.506444 | 86.524167 |
| Turkey Creek Basin | |||
| Turkey Creek Headwaters (3) | 303429086381400 | 30.574639 | 86.637278 |
| Parish Creek Headwaters (4) | 303722086334200 | 30.622667 | 86.561583 |
| Juniper Creek Headwaters (5) | 303745086300700 | 30.629194 | 86.501833 |
| Turkey Creek, Range Road 232 (6) | 303342086321000 | 30.561667 | 86.536111 |
| Rocky Creek Basin | |||
| Exline Creek Headwaters (7) | 303837086233500 | 30.643528 | 86.392944 |
| Rocky Creek Headwaters (8) | 304140086180600 | 30.694333 | 86.301611 |
| Bully Horselot Headwaters (9) | 303537086183200 | 30.593528 | 86.308972 |
| East Rocky Branch Creek Highway 201 (10) | 303656086193500 | 30.615500 | 86.326497 |
| Swift Creek Basin | |||
| Swift Creek South of Runway (11) | 303354086270000 | 30.565083 | 86.450083 |
| Swift Creek at Highway 285 (12) | 303141086280000 | 30.527997 | 86.466800 |
| Deer Moss Creek Basin | |||
| Deer Moss Headwaters (13) | 303300086263000 | 30.549944 | 86.441583 |
| Deer Moss Headwaters Near SWB1 a (14) | 303256086263000 | 30.548917 | 86.441667 |
| Deer Moss, at SWB1 a (15) | 303256086263000 | 30.548917 | 86.441667 |
| Deer Moss, at SWB2 a (16) | 303235086263400 | 30.587197 | 86.561300 |
| Deer Moss, at SWB3 a (17) | 303225086262800 | 30.409400 | 86.473800 |
| Deer Moss, at SWB4 a (18) | 303224086262700 | 30.539900 | 86.440900 |
| Deer Moss, at MidBay Connector (19) | 303211086260000 | 30.536400 | 86.433200 |
| Deer Moss, at Rocky Bayou Drive (20) | 303045086253100 | 30.512500 | 86.425000 |
| Mill Creek Basin | |||
| Mill Creek, headwater (21) | 303251086291100 | 30.547500 | 86.486301 |
| Mill Creek, at West College Blvd (22) | 303206086291000 | 30.535000 | 86.486000 |
Publisher’s Note: MDPI stays neutral with regard to jurisdictional claims in published maps and institutional affiliations. |
© 2022 by the authors. Licensee MDPI, Basel, Switzerland. This article is an open access article distributed under the terms and conditions of the Creative Commons Attribution (CC BY) license (https://creativecommons.org/licenses/by/4.0/).
Share and Cite
Landmeyer, J.E.; McBride, W.S.; Tate, W.B. Determination of Recharge Areas That Supply Decades Old Groundwater to Creeks Inhabited by the Threatened Okaloosa Darter. Hydrology 2022, 9, 69. https://doi.org/10.3390/hydrology9050069
Landmeyer JE, McBride WS, Tate WB. Determination of Recharge Areas That Supply Decades Old Groundwater to Creeks Inhabited by the Threatened Okaloosa Darter. Hydrology. 2022; 9(5):69. https://doi.org/10.3390/hydrology9050069
Chicago/Turabian StyleLandmeyer, James E., W. Scott McBride, and William B. Tate. 2022. "Determination of Recharge Areas That Supply Decades Old Groundwater to Creeks Inhabited by the Threatened Okaloosa Darter" Hydrology 9, no. 5: 69. https://doi.org/10.3390/hydrology9050069
APA StyleLandmeyer, J. E., McBride, W. S., & Tate, W. B. (2022). Determination of Recharge Areas That Supply Decades Old Groundwater to Creeks Inhabited by the Threatened Okaloosa Darter. Hydrology, 9(5), 69. https://doi.org/10.3390/hydrology9050069