Abstract
Concerning the media’s properties, there is always a possibility of changing groundwater flow conditions surrounding hydroelectric power plants. Causes for such events could be natural or anthropogenic, which is, in many cases, not so obvious to determine. In addition, determining a period when changes in the groundwater flow occur is a complex task. All of the above mentioned are of crucial importance due to the operational work of hydropower plants, i.e., the optimization of the inflow and outflow of the water in the turbine, regardless of the hydropower plant type. All types listed require a particular approach for solving such issues. Rescaled Adjusted Partial Sums (RAPS) is an appropriate time-series analysis method. In this specific case, observed fluctuations in the time series of the groundwater levels could lead to conclusions about possible irregularities in the shallow as well as the deep zones of the underground water. The concept was shown in this paper in the example of the hydroelectric power plant Mostar dam in Bosnia and Herzegovina. It should be noted that the defined methodology was a novel procedure for analyzing and determining the pathways of the flow of groundwater in the surrounding hydropower plant dams. In other words, such analysis could be conducted without the need for complex and expensive drilling and geophysical surveys, tracing, and all other methods.
1. Introduction
The impact of hydroelectric power plants on the environment is not negligible. Flora and fauna are subject to the influence of increased or decreased groundwater levels, flooding, evaporation, and similar occurrences. Due to this, flow conditions under dams are of significant importance. On the other hand, any water losses lead to a negative financial balance for the hydroelectric power plant and the operational functioning of the entire connected electro-energy system.
Groundwater flow is complex in itself, and when there is a need for groundwater flow analysis through karst terrain, there is an additional complex flow problem.
Figure 1 shows the disposition of hydroelectric power plant Mostar (HEPP Mostar), the last downstream object of the Middle Neretva Project, which was built for downstream Neretva watercourse flow equalization with upstream HEPP Salakovac combinational operation. A combined counter-filtration diaphragm was made among other underground objects on this HEPP. Significant groundwater level gradients lead to increased flow velocities around the diaphragm head. In the surrounding area, around the embankment and diaphragm, there are signs of filtration ground deformation and the development of dominant groundwater flow directions. This was confirmed by investigations that have been conducted at different periods.
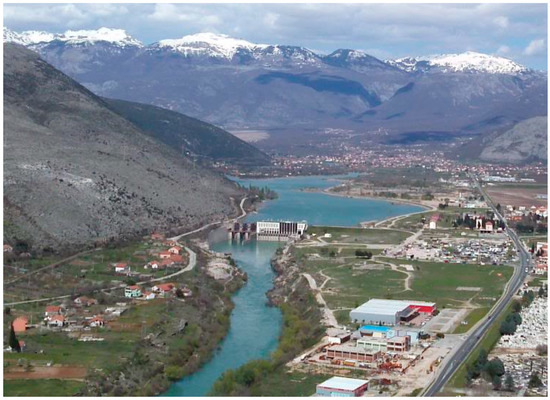
Figure 1.
Disposition—HEPP Mostar [1].
It is a complex task to determine and research groundwater flow conditions. Through field investigation, piezometers are an acceptable method for monitoring groundwater levels in karst environments.
This paper aimed to apply the Rescaled Adjusted Partial Sums (RAPS) method to analyze the groundwater level’s observed/obtained time series. Regarding the many applications of the RAPS method in hydrology, the groundwater level has the same problem as the time series of the river flow and water levels, etc., which are irregularities and fluctuations in the original time series. Such appearances inevitably exist but cannot be observed by simply analyzing the original time series. The RAPS method points to such occurrences. The method’s benefit is that it eliminates the effects of different data units and random errors on the analysis [2].
Furthermore, suppose such occurrences, i.e., a newly obtained subseries from the original subseries, exist. In that case, this indicates some problem(s), which, in general, impact the ordinary and regular continuation of some processes, which is, in this case, the flow of the groundwater. Interruptions to the flow, e.g., decreasing or increasing the water flow, the existence of new caverns or the privileged pathways of the water could be causes of the above-mentioned problems. Such was the motivation for providing the research and application of the method, which will give answers about the properties and movement of the groundwater around the HEPP Mostar dam area.
2. Literature Review
Accurate time-series analysis is essential in the study of the groundwater level. Such analysis helps the decision-makers to save time and financial resources in terms of the quality of their decisions in many sectors of hydro technics [3]. Many existing models, procedures, and methodologies for time series analysis differ regarding the required input data series, expected output, and, most importantly, the complexity of the model [4]. Since groundwater levels are stochastic values, which depend on many factors, this increases the complexity of the models. Stochastic approaches in the analysis of observed time series have been considered by many as “black box” approaches that do not help to understand the system at hand [5]. Such is the motivation for finding and applying a suitable method, which should be not complex to use and should be transparent for the comprehensive and qualitative analysis of the observed time series. The Rescaled Adjusted Partial Sums (RAPS) method is appropriate for time series analysis in hydrology [6,7,8]. In addition, it was used in this paper/research.
There are many examples of the application of the RAPS method, but for the presented research, the most attractive was its application to groundwater levels. In the study [9], water table fluctuations were analyzed to obtain a general trend and the relationship between piezometers at the immediate zone of the grout curtain of the hydropower plant in a karst area. It has been shown that such a methodology gives a better insight into flow circulation in karst terrain, a better insight into the functioning of the hydraulic barrier, and a better focus on specific zones and controlling water loss from the reservoir. Karst rivers are very often the subject of research. The authors in [10] dealt with the long-term trend and fluctuations of karst spring discharge in a Mediterranean area (central-southern Italy). Trends and fluctuations were highlighted by n-years moving average and transforming the time series by the Rescaled Adjusted Partial Sum method. The final result was obtained as the beginning of the drop in discharge of the analyzed spring. The observation could not be conducted with the usual time series analysis, which defines trends, regression, correlations, etc.
During the work on this paper, all the available documentation related to the HEPP Mostar dam was open to the authors. All of the documentation could be divided into three general groups:
- Projects, elaborates, scientific and investigation works that were conducted before putting HEPP Mostar into service (period until 1987);
- Projects, elaborates, scientific and investigation works that started in 2003 in the frame of HEPP Mostar dam revitalization;
- Scientific and research work that was conducted for the needs of different theses from 2012 until 2021.
3. Methodology
The Rescaled Adjusted Partial Sums (RAPS) method is a commonly used method for analyzing time series, especially in hydrology, regardless of their quantity and quality. The parameters used are only the researched time series’ average value and standard deviation. This method is based on visualizing a new (obtained) subseries from the original continuous data series. A graphical presentation of the sums of the calculated RAPS values gives insight into the new subseries, where the data aberrations and similar incidences occur over the time. The following equation defines the RAPS method:
where Yt is the individual value of the analyzed member of the researched time series, is the average value of all the members of the diagnosed time series, Sy is the standard deviation of all the members of the analyzed time series, k is the number of all members of the researched time series, and t = 1, 2,..., k is a counter during the summation process [6]. The final/last RAPS value must end in the zero (0) value, which is the control if the calculation has been conducted correctly. A negative RAPS values slope does not refer to a negative slope in the original time series.
The RAPS method was applied to the time series of the measured groundwater levels near the HEPP Mostar dam. There is a plan to see if a new subseries will occur after using the RAPS method. If such happens, the next step of the research is to determine if these subseries are overlapping or not. If yes, then it could be concluded that there are no problems regarding water losses, damage to underground structures, etc. If not, then the analysis and determination of the possible causes of such occurrences should be provided. The most significant challenge is the separation of natural and anthropogenic causes.
4. Case Study
HEPP Mostar is a storage object, built as the most downstream in a series of structures on the middle Neretva. Its purpose is to balance the flow in the downstream stream of the Neretva River in conjunction with the upstream HEPP Salakovac. The HEPP Mostar is located 6 km north of Mostar. The geographical position of Bosnia and Herzegovina and the city of Mostar are shown in Figure 2 and Figure 3.
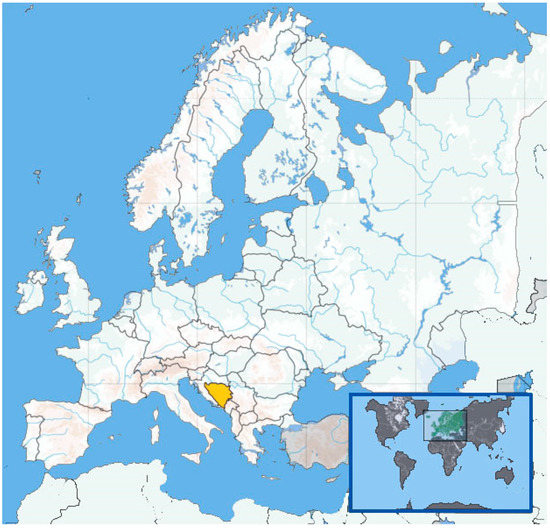
Figure 2.
Position of BiH on the map [11].
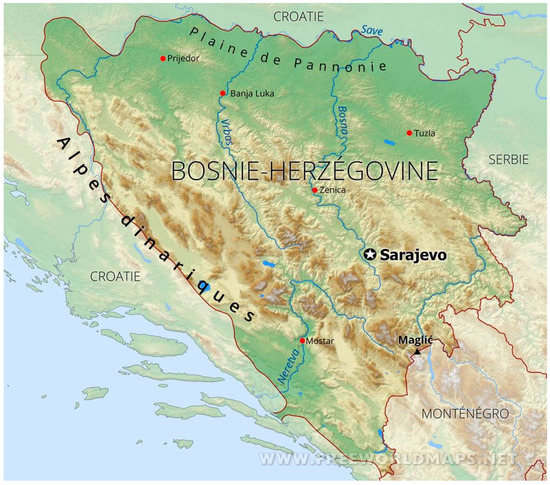
Figure 3.
Position of Mostar in BiH [12].
The storage is located in the bed of the Neretva River with a useful volume of 6.37 × 10⁶ m3 at a normal elevation of 78 m above sea level. The dam is a combined-type dam consisting of an evacuation block on the right side, a gravity dam with an engine room in the Neretva Riverbed, and an embanked part of the dam 106 m long on the left side, which turns into a defensive embankment 2500 m long. In the embanked part of the dam, a 134 m long clay–concrete diaphragm was built as a waterproof core (Figure 4). In the minor part of the left side, a waterproof injection curtain was constructed at a total length of 310 m. The engine room has three aggregates with an installed flow of 120 m3/s. The total installed power is 72 MW, while the average possible production is 310 GWh [13].
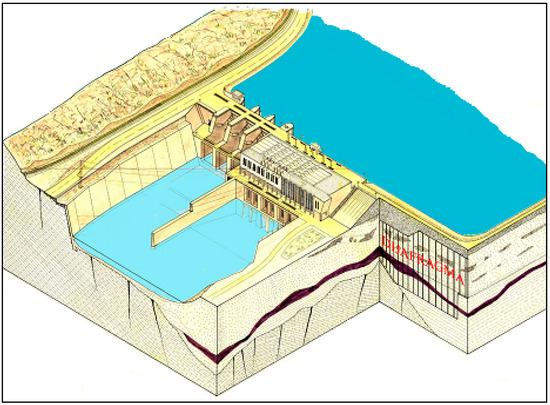
Figure 4.
The position of the diaphragm—three-dimensional view of HEPP Mostar [13].
4.1. Location
Investigation works in the area of the embanked dam on the left bank of the Neretva have shown that the narrower area of HEPP Mostar has a specific and complex geological structure. On the surface of the terrain and in the river, there are quaternary deposits that cover the entire area around the embanked dam. They represent water-permeable sediments with the function of a hydrogeological reservoir collector and conduit (Figure 5). In the deeper parts are Neogene deposits with a coal layer 10 m thick, on which the embanked dam directly lies, and Upper Cretaceous limestone is the lowest deposit. They have the role of waterproof rocks with the hydrogeological function of an absolute barrier. The left side of the HEPP Mostar reservoir rests along its entire length on fluvioglacial terrace deposits [14].

Figure 5.
Geological profile of the borehole PR2/2. Legend: 1—Neogene limestone; 2—coal; 3—clayey marl; 4—marl, fossils; 5—Neogene; 6—conglomerate [1].
The groundwater regiment has been altered by the influence of accumulated water, which has led to the rising groundwater level on the left coastal area bank. Figure 6 presents the disposition of piezometers for groundwater monitoring around the diaphragm.
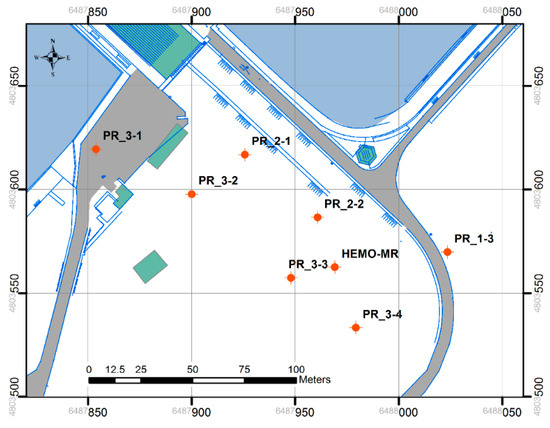
Figure 6.
Disposition of piezometers around the diaphragm of HEPP Mostar [1].
To determine the paths of water filtration and the character of the flow, tests were carried out by tracing six piezometers. The tracings showed that the water filtration from the storage was carried out around the end of the diaphragm with spilling along the left bank. The existence of two types of hydrogeological conductors in this environment was determined. The first was with well-developed deeper paths where the average marker speed was about ten cm/s. The second was a much slower filtration flow through terrace materials from 0.30 cm/s to 3 cm/s. The highest speeds of the markers were on the line from the end of the diaphragm to the weep hole on the left coastal wall. The amount of 348.40 L/s of water seeping from the banks was calculated by the volumetric measurement of the flow on the weep holes.
The basic concept of protecting the broader area of the left bank of HEPP Mostar from the elevated level of groundwater consists of “passing through” groundwater through a “shaft”, which extends from the face of the diaphragm to the rock massif on the field’s perimeter. Along with this condition, the length of the diaphragm was determined. From the hydraulic point of view, it is relatively short, so significant gradients of groundwater level were formed in its surroundings with increased flow velocities, especially around the face of the diaphragm. The diaphragm area is composed of materials of extremely heterogeneous composition (unbound terrace materials with different permeability interspersed with conglomerates lying on coals). In the surrounding area, around the embankment and the diaphragm, there were indications of soil filtration deformations (registered subsidence of the land behind the embanked dam) and the development of privileged groundwater flow directions. This was confirmed by the research on the permeability of the diaphragm and the embanked part of the HEPP Mostar dam. It is easy to assume that conditions for the progressive development of filtration deformation processes were created along the privileged directions of groundwater flow along with increased gradients and flow velocities.
4.2. An Overview of Research Data from “In Situ” Investigation
4.2.1. Geology
The area around the HEPP Mostar dam has specific and complex geological terrain characteristics. According to research results that were conducted on the site on the left coast of the Neretva River, the terrain consists of:
- Quaternary layers at the terrain surface and in the river;
- Neogene layers with coal layer and;
- Upper cretaceous limestone in the form of the lowest and the oldest part—the base.
Quaternary layers cover the whole area around the embankment. These layers consist of gravel and sand with different granulation, layers of sturdy and weak coherent conglomerate, and clay lenses. These are well-compacted incoherent rocks with variable granulometric composition and depth and horizontal direction. Quaternary layers have an intergranular type of porosity and function as hydrogeological collectors or conductors of groundwater flow.
Neogene consists of thick layers of marl with a coal layer with a thickness of up to 10 m. On the surface of the marl layer, there is a thin layer (appr. 1.0 m) of contact clay, which is extended horizontally, together with marl and spreads in the direction of the left hinterland area. Layers of marl have different compression strengths due to the existence of clay and sand components.
Tectonic activity on this terrain has influenced the forming of the so-called boundary fault, which has resulted in the dropping of quaternary and Neogene layers up to 800 m depth at the central part of the field area.
During the investigation works and the construction of the injection curtain and diaphragm, it was proved that, in the dam area, there are four hydrogeological media with different hydrogeological characteristics as follows:
I. Hydrogeological insulators represented with Neogene marl, which forms the basic rock for underground objects at the left hinterland area. A thin layer of marl along the left coast of the Neretva River is eroded, and, at the zone of the boundary fault, it is cavernous and a coal layer. Larger permeability was determined in these places related to marl and coal; considering this fact the hydrogeological functions were entirely changed.
II. At the left side of the dam and the broader left hinterland, there are quaternary-terrace layers with intergranular porosity that are covered with marl and limestone.
III. At the left side of the dam, as part of the Neogene, there is coal that is generally water-impermeable, but in the zones that are closer to the river course and close to the boundary fault, the coal is cavernous and eroded.
IV. On the right side of the dam there is limestone (basic rock) with a fractured porosity.
Figure 7 shows the disposition of boreholes around the diaphragm that were also included in the geological investigation research program as research boreholes. Figure 8 presents the schematic placement of equipotential lines due to the measurement of groundwater levels in the observed piezometers/boreholes.
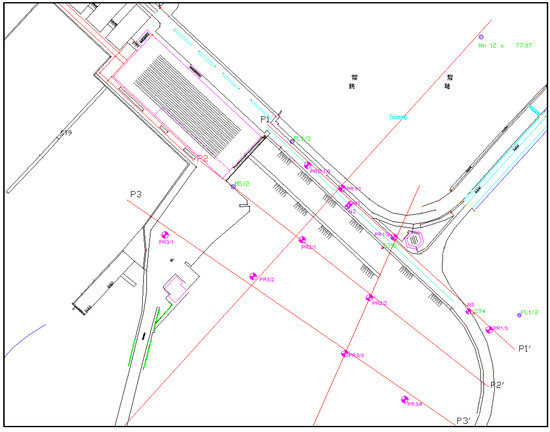
Figure 7.
Scheme of the analyzed boreholes around the HEPP Mostar dam [15].
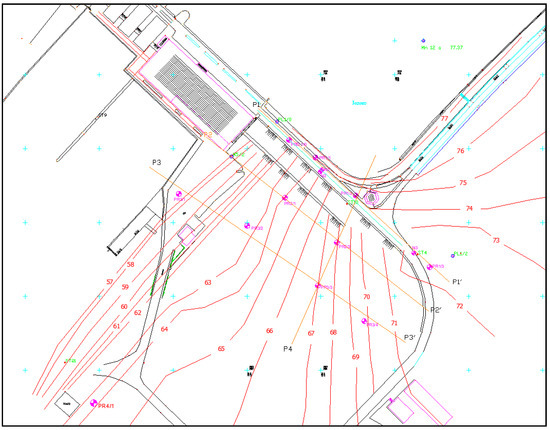
Figure 8.
Equipotential lines of the groundwater level around the HEPP Mostar dam [15].
4.2.2. Geophysics
During geophysical investigations in 2003, the goal of which was the determination of the geophysical characteristics of the observed area, the tracing method was conducted among several other geophysical methods. Figure 9 shows an example of tracing the PR1/1 piezometer with the marked direction of movement of the tracer around and through the diaphragm.
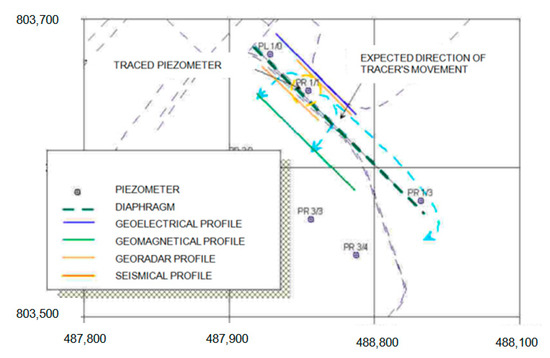
Figure 9.
Disposition during tracing monitoring—piezometer PR1/1 [13].
During the tracing of piezometer PR1/1, all the available geophysical methods were applied. It was concluded that the diaphragm had a damaged area at the part around 8 m east from PR 1/1. The dimension of the damaged area was impossible to determine because tracing filtration could be conducted on a large surface and a mechanically degraded tight zone. The average value of the tracer’s velocity until the first registration at the downstream profiles was 6.6 mm/s.
4.2.3. Video Endoscopy
From 2003–2015, all the piezometers around the diaphragm of the HEPP Mostar dam were investigated and recorded with a borehole camera to gain better knowledge about the processes in the groundwater movement in this area, Figure 10.
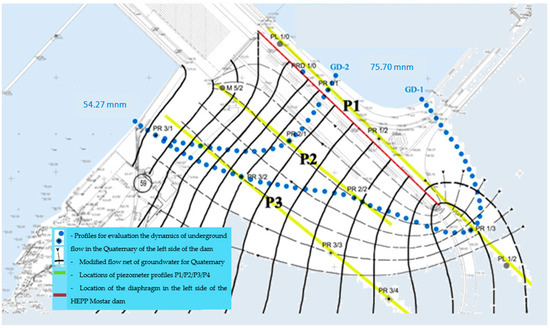
Figure 10.
Modification of streamlines around the diaphragm [16,17,18].
Some of the conclusions of these studies were that there was a proven infiltration of water from the accumulation lake through the embankment part of the Mostar dam through the finishing layer of the clay–concrete diaphragm, and it looked like this appearance was about to be progressive. It was also concluded that a general overview of the main groundwater flow directions through the quaternary layers of the left hinterland area and the Mostar dam’s embankment part indicated that only a smaller quantity of water from the accumulation lake inflows into the Neretva River downstream, and the dam flows beside the diaphragm. Another aspect of the water volume flows through the diaphragm.
The streamlines, presented in Figure 10, showed the general direction of the flow, i.e., bypassing the dam from the right side. Damage to the barrier was detected in piezometer PR1/1 (8 m eastern) surrounding the tracer investigations. Video endoscopy confirmed the same conclusion.
4.3. Input Data—Graphical Data Overview
The data used for the analysis that was conducted for the needs of this paper were the data of the groundwater level monitoring for the period from April 2015 until December 2021. In addition, the data for the headwater and tailwater at the HEPP Mostar dam for the same period were used. All of these data were obtained from P.C. Elektroprivreda HZ H-B Mostar, in order to write this scientific research paper. Data are presented in Figure 11.
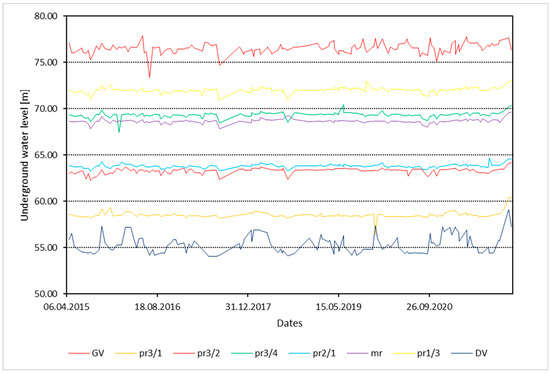
Figure 11.
Daily measured values for groundwater level in piezometers, headwater, and tailwater for the period April 2015–December 2021.
It can be concluded that the provided in situ measurements were very extensive and demanding. Therefore, there is a need for either more straightforward tests or for finding other methods that will replace ‘’in situ’’ investigations. In addition, from Figure 11, only the variability of the groundwater level could be observed. Such observations did not give any insight into the quantification and determination of the changes damaging the particular part of the dam curtain. In this way, the application of the RAPS method seemed to be justified.
5. Obtained Results and Analysis
Using Equation (1) to evaluate the time series data in Figure 11, RAPS values were obtained, as shown in Figure 12, Figure 13, Figure 14, Figure 15, Figure 16, Figure 17, Figure 18 and Figure 19. Blue vertical lines on the subseries separate the original time series (Figure 11). So, the original time series were divided by the visual rule of ‘’the lowest valley’’ or the ‘’highest hill’’.
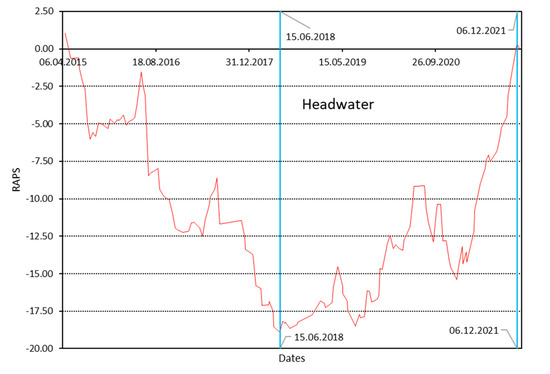
Figure 12.
RAPS values for the headwater level of the accumulation lake.
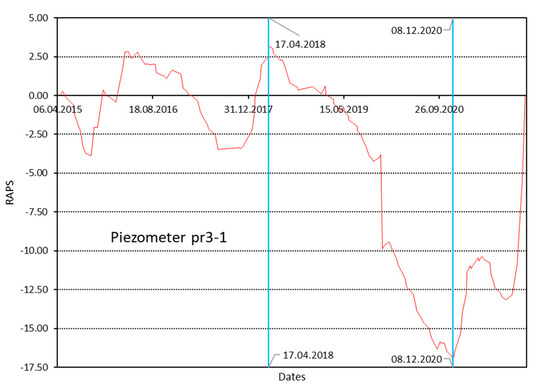
Figure 13.
RAPS values for piezometer PR3/1.
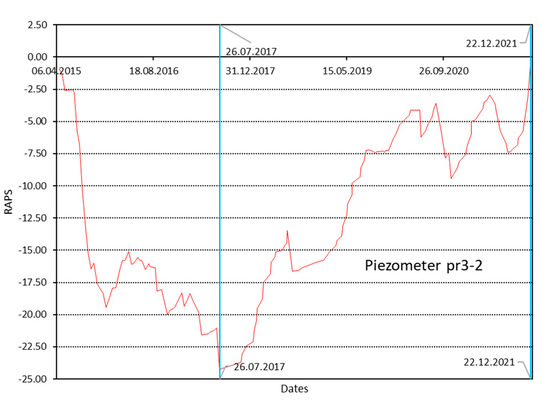
Figure 14.
RAPS values for piezometer PR3/2.
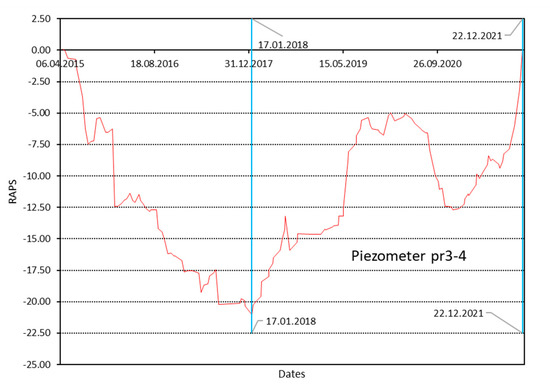
Figure 15.
RAPS values for piezometer PR3/4.
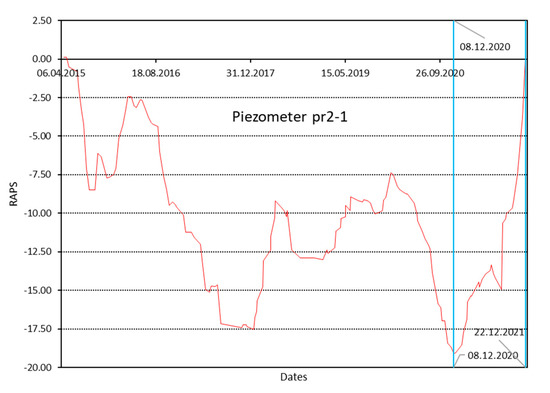
Figure 16.
RAPS values for piezometer PR2/1.
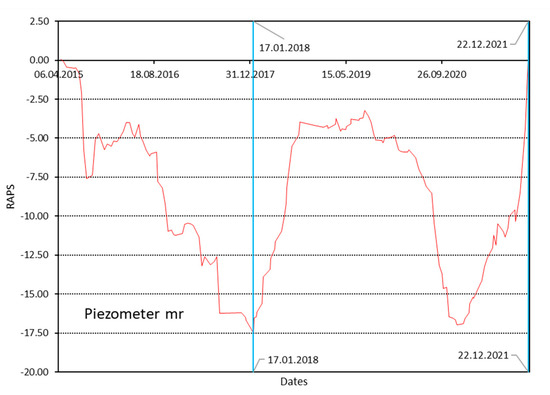
Figure 17.
RAPS values for piezometer MR.
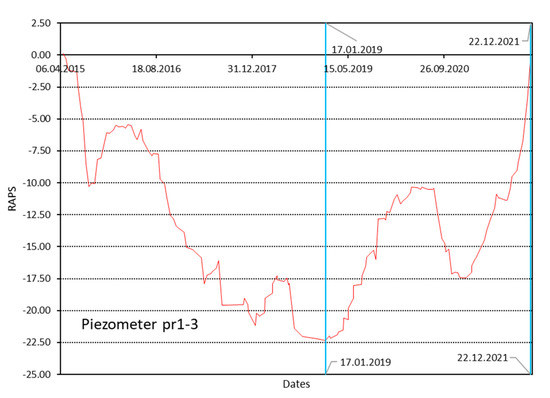
Figure 18.
RAPS values for piezometer PR1/3.
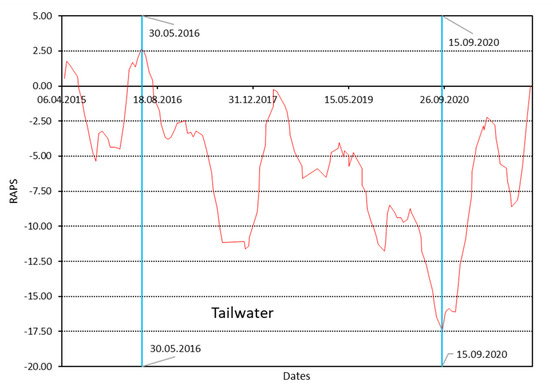
Figure 19.
RAPS values for the tailwater of HEPP Mostar.
Considering the RAPS methodology, as well as the application of the analyzed problem of the groundwater levels measured in the piezometers, if there are no irregularities, then overlapping of the patterns of the calculated RAPS values should be expected. From Figure 12, Figure 13, Figure 14, Figure 15, Figure 16, Figure 17, Figure 18 and Figure 19, such a pattern of overlapping was not detected. All the available piezometers, i.e., the measured groundwater levels for the piezometers where the measurements were provided, showed irregularities.
The analysis was conducted by following each streamline and piezometer, where the measurements were conducted, and the values were recorded/collected. Piezometers PR 1-3 and PR 3-3 were almost on the same streamline, as well as PR2-2, PR 2-1, and M 5-2. The only available data were for piezometers PR 1-3 and 3-3. From Figure 13 and Figure 18, overlapping did not exist. The reason for the irregularities, which were the cause of the non-overlapping, was the damage to the dam near piezometer P 1/1. Even though infiltration from the direction of the damaged zone was negligible, such an impact changed the water flow and velocity gridlines. The quaternary layers of the rocks at the location were generally water-permeable and, as such, enabled filtration of the water. So, from this point of view, the influence of the increased filtration because of the damage was apparent.
It should be noted that simply by looking at the RAPS values of the particular piezometers, the precise determination of the place of leakage/damage could not be provided. Such was not a task of the RAPS analysis, but the approximate location of the damage to the dam could be detected. This reduced the time and costs of finding the exact point or/and leakage area. The analyzed example lacked a more significant number of piezometer boreholes in the supposed direction of the streamline, which would lead to more accurate conclusions and verification of the results provided in the analysis.
6. Conclusions
The presented methodology, i.e., the application of the RAPS method, showed that shape, as well as the obtained subseries and their overlapping, were related to the appearance of the water path after the dam collapse/diaphragm. The provided field tests of the tracing, geophysical research, and video endoscopy showed similarities with the different patterns and subseries of the groundwater level obtained by the RAPS method. It could be concluded that the application of the RAPS method showed almost the same conclusions as the usage of field testing. Such is strong proof and a justification for applying the RAPS method for similar analysis. It was shown that the RAPS method could be used to test and verify the conducted field analysis. Moreover, RAPS could give insight into possible irregularities and breakage in the water flow under/through the dam.
Author Contributions
Conceptualization, B.Đ. and M.R.; methodology, B.Đ.; software, P.S.; validation, M.R. and P.S.; formal analysis, B.Đ.; investigation, B.Đ.; resources, M.R.; data curation, P.S.; writing—original draft preparation, B.Đ.; writing—review and editing, M.R. and P.S.; visualization, B.Đ.; supervision, M.R.; project administration, P.S.; funding acquisition, B.Đ. All authors have read and agreed to the published version of the manuscript.
Funding
This research received no external funding.
Institutional Review Board Statement
Not applicable.
Informed Consent Statement
Not applicable.
Data Availability Statement
Data is available upon a reasonable request to the authors.
Conflicts of Interest
The authors declare no conflict of interest.
References
- Raič, M. Research of Groundwater Flow in Media with Variable Conductivity. Ph. D. Thesis, Faculty of Civil Engineering University of Mostar, Mostar, Bosnia and Herzegovina, 2017. [Google Scholar]
- Zhu, S.; Nyarko, E.K.; Hadzima-Nyarko, M.; Heddam, S.; Wu, S. Assessing the performance of a suite of machine learning models for daily river water temperature prediction. PeerJ 2019, 7, e7065. [Google Scholar] [CrossRef] [PubMed]
- Diop, L.; Bodian, A.; Djaman, K.; Yaseen, Z.M.; Deo, R.C.; El-shafie, A.; Brown, L.C. The influence of climatic inputs on stream-flow pattern forecasting: Case study of upper Senegal river. Environ. Earth Sci. 2018, 77, 1–13. [Google Scholar] [CrossRef]
- Salas, J.D. Analysis and Modeling of Hydrological Time Series. In Handbook of Hydrology; Maidment, D.R., Ed.; McGraw-Hill: New York, NY, USA, 1993; Volume 19, pp. 1–72. [Google Scholar]
- Grimaldi, S.; Koutsoyiannis, D.; Piccolo, D.; Napolitano, F. Time series analysis in hydrology December. In Physics and Chemistry of the Earth Parts A/B/C; Elsevier: Amsterdam, The Netherlands, 2006; Volume 31, pp. 1097–1098. [Google Scholar] [CrossRef]
- Garbrecht, J.; Fernandez, G.P. Visualization of trends and fluctuations in climatic records. JAWRA J. Am. Water Resour. Assoc. 1994, 30, 297–306. [Google Scholar] [CrossRef]
- Todini, E. The ARNO rainfall-runoff model. J. Hydrol. 1996, 175, 339–382. [Google Scholar] [CrossRef]
- Kos, Ž.; Đurin, B.; Dogančić, D.; Kranjčić, N. Hydro-Energy Suitability of Rivers Regarding Their Hydrological and Hydrogeological Characteristics. Water 2021, 13, 1777. [Google Scholar] [CrossRef]
- Jemcov, I. Impact assessment of grout curtain on the hydraulic behavior in karst, based on the time a series analysis. Environ. Earth Sci. 2019, 78, 415. [Google Scholar] [CrossRef]
- Fiorillo, F.; Petitta, M.; Preziosi, E.; Rusi, S.; Esposito, L.; Tallini, M. Long-term trend and fluctuations of karst spring discharge in a Mediterranean area (central-southern Italy). Environ. Earth Sci 2015, 74, 153–172. [Google Scholar] [CrossRef]
- Available online: https://www.visitmycountry.net/bosnia_herzegovina/bh/index.php/geografija/27-vmc/geografija/224-geografski-polozaj-bosne-i-hercegovine (accessed on 6 July 2022).
- Available online: https://www.freeworldmaps.net/fr/bosnie/ (accessed on 6 July 2022).
- University of Mostar, Faculty of Civil Engineering. Renewal of the Technical Measurement System and Exploration of the Situation Underground the Left Hinterland and Dam of HEPP Mostar; University of Mostar: Mostar, Bosnia and Herzegovina, 2003. [Google Scholar]
- University of Mostar, Faculty of Civil Engineering. Renewal of the Technical Measurement System and Exploration of the Situation Underground the Left Hinterland and Dam of HEPP Mostar-Phase II; University of Mostar: Mostar, Bosnia and Herzegovina, 2005. [Google Scholar]
- Raič, M. Determining the Area and Intensity of Seepage in the Left Hinterland of the Mostar Hydroelectric Power Plant Dam. Master’s Thesis, Faculty of Civil Engineering, Architecture and Geodesy, University of Split, Split, Croatia, 2012. [Google Scholar]
- University of Mostar, Faculty of Civil Engineering. Report on the Investigation of Permeability of the Diaphragm and Filled Part of the Dam, and Condition and Progress of Erosional and Suffusive Processes; University of Mostar: Mostar, Bosnia and Herzegovina, 2007. [Google Scholar]
- University of Mostar, Faculty of Civil Engineering. Analysis of Groundwater Levels in Piezometers in the Left Hinterland of HEPP Mostar for the Period from May 2006 to May 2008; University of Mostar: Mostar, Bosnia and Herzegovina, 2008. [Google Scholar]
- University of Mostar, Faculty of Civil Engineering. Hydraulic Study of Groundwater Flows in the Left Hinterland of HEPP Mostar; University of Mostar: Mostar, Bosnia and Herzegovina, 2014. [Google Scholar]
Publisher’s Note: MDPI stays neutral with regard to jurisdictional claims in published maps and institutional affiliations. |
© 2022 by the authors. Licensee MDPI, Basel, Switzerland. This article is an open access article distributed under the terms and conditions of the Creative Commons Attribution (CC BY) license (https://creativecommons.org/licenses/by/4.0/).