Article

Experimental Investigation of the Effects of Porosity, Hydraulic Conductivity, Strength, and Flow Rate on Fluid Flow in Weakly Cemented Bio-Treated Sands

by
Charalampos Konstantinou
1,2,* and
Giovanna Biscontin
2
1
Department of Civil and Environmental Engineering, University of Cyprus, 1678 Nicosia, Cyprus
2
Department of Engineering, University of Cambridge, Cambridge CB2 1PZ, UK
*
Author to whom correspondence should be addressed.
Hydrology 2022, 9(11), 190; https://doi.org/10.3390/hydrology9110190
Submission received: 26 September 2022 / Revised: 23 October 2022 / Accepted: 26 October 2022 / Published: 28 October 2022

Abstract

:
Fluid injection in a porous medium is the underlying mechanism for many applications in the fields of groundwater hydraulics, hydrology and hydrogeology, and geo-environmental engineering and in the oil and gas industry. Fluid flow experiments in porous media with a viscous fluid at varying injection rates were conducted in a modified Hele-Shaw setup. The granular media were three-dimensional bio-cemented sands of various grain sizes across various cementation levels, generating a matrix of various hydraulic conductivities, porosities, and strengths. The fluid injection experiments showed that a cavity-like fracture developed, which transitioned to crack-like fractures at higher cementation levels (hence, higher strength). As the flow rate increased, less infiltration was evident and higher breakdown pressure was observed, with propagation pressure reducing to zero. It was harder to induce an opening in cemented specimens with higher hydraulic conductivity and a larger pore network despite their lower strength due to excessive infiltration dominance, which inhibited the build-up of pressure required to generate a fracture. The results of this study suggest that, when designing fluid injection programs, the combined effects of hydraulic conductivity and strength need to be carefully considered.

1. Introduction

The injection of a fluid into a porous medium is required for many applications in the fields of groundwater hydrology, hydraulics and hydrogeology, and geo-environmental engineering and in the oil and gas industry. Proposed methodologies for fluid injection into a porous medium need to ensure the safety, effectiveness of operations, and minimisation of any potential environmental impacts and of the risk of infrastructure failure. The interaction between soil or a rock matrix with the chosen fluids are critical for each application, and the relevant parameters need to be tuned accordingly. Applications in which fluid flow in porous media is the underlying mechanism include hydraulic barriers or fluid injection for the remediation of groundwater contamination and water decontamination, flow through leaching to groundwater, artificial ground freezing to contain groundwater, CO2 sequestration, groundwater drainage through the fluidisation of sands, or any other changes in groundwater level during recharge or discharge. Other examples of fluid injection events into an aquifer include disposal, managed aquifer recharge (MAR), aquifer storage and recovery (ASR), and the transportation of various fluids in the subsurface [1,2,3,4,5,6,7,8].
Typical experimental setups used to investigate these applications are Hele-Shaw-like cells, which are small in size. For example, numerical Hele-Shaw investigations and experiments have been conducted to study the hydraulics of a well pumped with a variable discharge [9], fluid drainage through fractured media [10], fingered flow through sand [3], fluid-soil interaction [11], and the characteristics of the gas-injection barrier in two-dimensional porous media to understand the unexpected inflow mechanisms of groundwater in an unwanted area [12]. The majority of experiments that examine the effects of flow at the grain scale and any potential alterations of the characteristics of the soil-groundwater system are usually conducted in small size experiments at the meso-scale [7,13,14,15,16]. Transient flow problems are usually conducted in a similar scale [5,8,17].
The characteristics of the fluid flow differ depending on the physical and engineering properties of the granular matrix and the composition and viscosity of the injected fluid. These parameters are chosen depending on the target of each application (whether the target is a fracture or uniform replacement of pore fluids, i.e., infiltration) and the depth of the operation (soil/rock/fractured rock) [18,19]. Viscous fluid injections are conducted to investigate groundwater remediation through the release of agents or environmental carriers into an aquifer (suspensions of soluble particles, slow-release compounds, emulsified oils), for disposal via the transportation of fluids, or for disposal via hydraulic fracturing to increase storage. Typically, Hele-Shaw experiments also make use of viscous fluids to investigate fundamental topics in hydrological applications, such as the ones described previously. The results are normalised with respect to the viscosity of water via dimensional analysis. Experiments with viscous fluids are also conducted to simulate and understand any unwanted flows, such as the flow of contaminants within the aquifer, and to understand the flows in fractured media, commonly found in soils that store groundwater.
When injecting fluids in rocks, fractures are created, accompanied by a leak-off when the formation is permeable. Fluids are often loaded with particles that generate a filter cake in the formation to reduce leak-off. In soils, when clean fluids are injected, significant matrix flow is observed (uniform infiltration), and instead of fractures, cavities are developed due to the dislocation of particles (cavity-like fractures) [20]. When fluids are loaded with particles, the failures are characterised as fractures; however, the underlying failure mechanisms are different from those in competent rocks (crack-like fractures) [21,22].
The listed applications take place mainly in weakly cemented porous media because of their larger pore networks, which, for example, can store oil and gas but also CO2 or H2 while it can be used for transportation of various fluids [23,24,25,26]. Weakly cemented porous media describe a wide range of materials representing a transition between soils and rocks, sharing common characteristics with both. Such materials have a very high permeability (up to 2000 mD), a larger porosity (0.2–0.4), and weaker bonds between particles compared to hard rocks, resulting in lower strength (unconfined compressive strength -UCS- up to 3 MPa) [27,28]. The quantification of such properties (pore network at multiple scales, hydraulic conductivity) that are essential to many hydrogeological problems, although studied extensively, still remains a challenge and imposes further restrictions on understanding fluid flow processes in weakly cemented porous media [29,30,31,32,33,34,35].
While competent and dense rock has been extensively studied [36,37,38,39], the behaviour of weaker, transitional materials is still not well understood since such weakly cemented materials (found in shallow to intermediate depths underground) have been rarely characterised under certain fluid injection regimes (e.g., radial-uniform flow, viscosity dominated, viscous drag-dominated, grain displacement or fracturing, non-invasive fracturing capillary dominated and viscous dominated regimes) [40,41,42].
Previous studies show a strong correlation between failure mechanisms and fluid injection regimes during the injection event and the flow rate, confining stress magnitude, fluid rheology, the anisotropy of confining stresses, and properties of the granular material [21,33,43,44,45,46,47,48,49,50]. The weak bonds across particles fail under low fluid flows, and the particle clusters tend to disaggregate at the grain scale. Therefore, cohesion (strength) plays an important role in fluid flow in porous media. Previous experimental works suggest that such poorly consolidated materials are likely to remain in compression even at the crack tip [21,47,51]. High flow rates could cause high hydraulic pressures and anisotropy in the flow regime, which in turn causes soil shearing via the dislocation of particles or tensile fracturing due to expected non-elastic deformation components [52,53].
Fracture-like patterns in such materials are described as a main conduit with multiple offshoots (i.e., small branches, often seen only on one side of the fracture), either chaotic or dendritic [21,47,48,49,50,54,55,56]. Huang et al. [55] conducted experiments on cohesionless sand with clean fluids, varying the flow rates and fluid viscosities, and identified four flow regimes, while Chang [21] used fluids with particles and described the developed ‘fractures’ as bevelled, rounded, and fingered.
The effect of permeability was found to be much stronger than that of strength contrasts in many studies [48,57]. High permeability zones affect flow dynamics, inducing excessive infiltration and causing rapid dissipation of the pressures. Hence, the fracture conductivity in weakly cemented soils is susceptible to the variations of the effective stresses [58]. Rhett and Teufel [59] argued that the maximum horizontal permeability is influenced by stress ratios and the orientation of the maximum horizontal stress. In cohesionless sands, smaller fractures, or rather openings, are created to bypass impairment, and much of the fluid injection may be under matrix (infiltration) rather than fractured conditions [48,57]. Fractures would also preferentially be induced into lower permeability formations [50]. It is important, therefore, to understand the hydraulic properties, porosity, and flow processes in such weakly cemented materials [60].
The goal of the present research was the investigation of the effects of weakly cemented porous media properties (strength, porosity, hydraulic conductivity) and of the flow rates of the fluid flow during injection experiments (fluid infiltration/fracture response), utilising a 3D modified Hele-Shaw setup. Bio-cemented granular material specimens of various cementation levels were used within an experimental program for injection at various rates with a fluid of constant viscosity. The specimens were generated via microbially induced carbonate precipitation (MICP), a bio-cementation technique in which the end-product is calcium carbonate acting as a glue between the particles. As discussed by Konstantinou et al. [28], the artificial specimens sufficiently resembled weakly cemented sandstones and could be used as a proxy in laboratory testing. These materials are representative of soils that are found in intermediate depths.

2. Materials and Methods
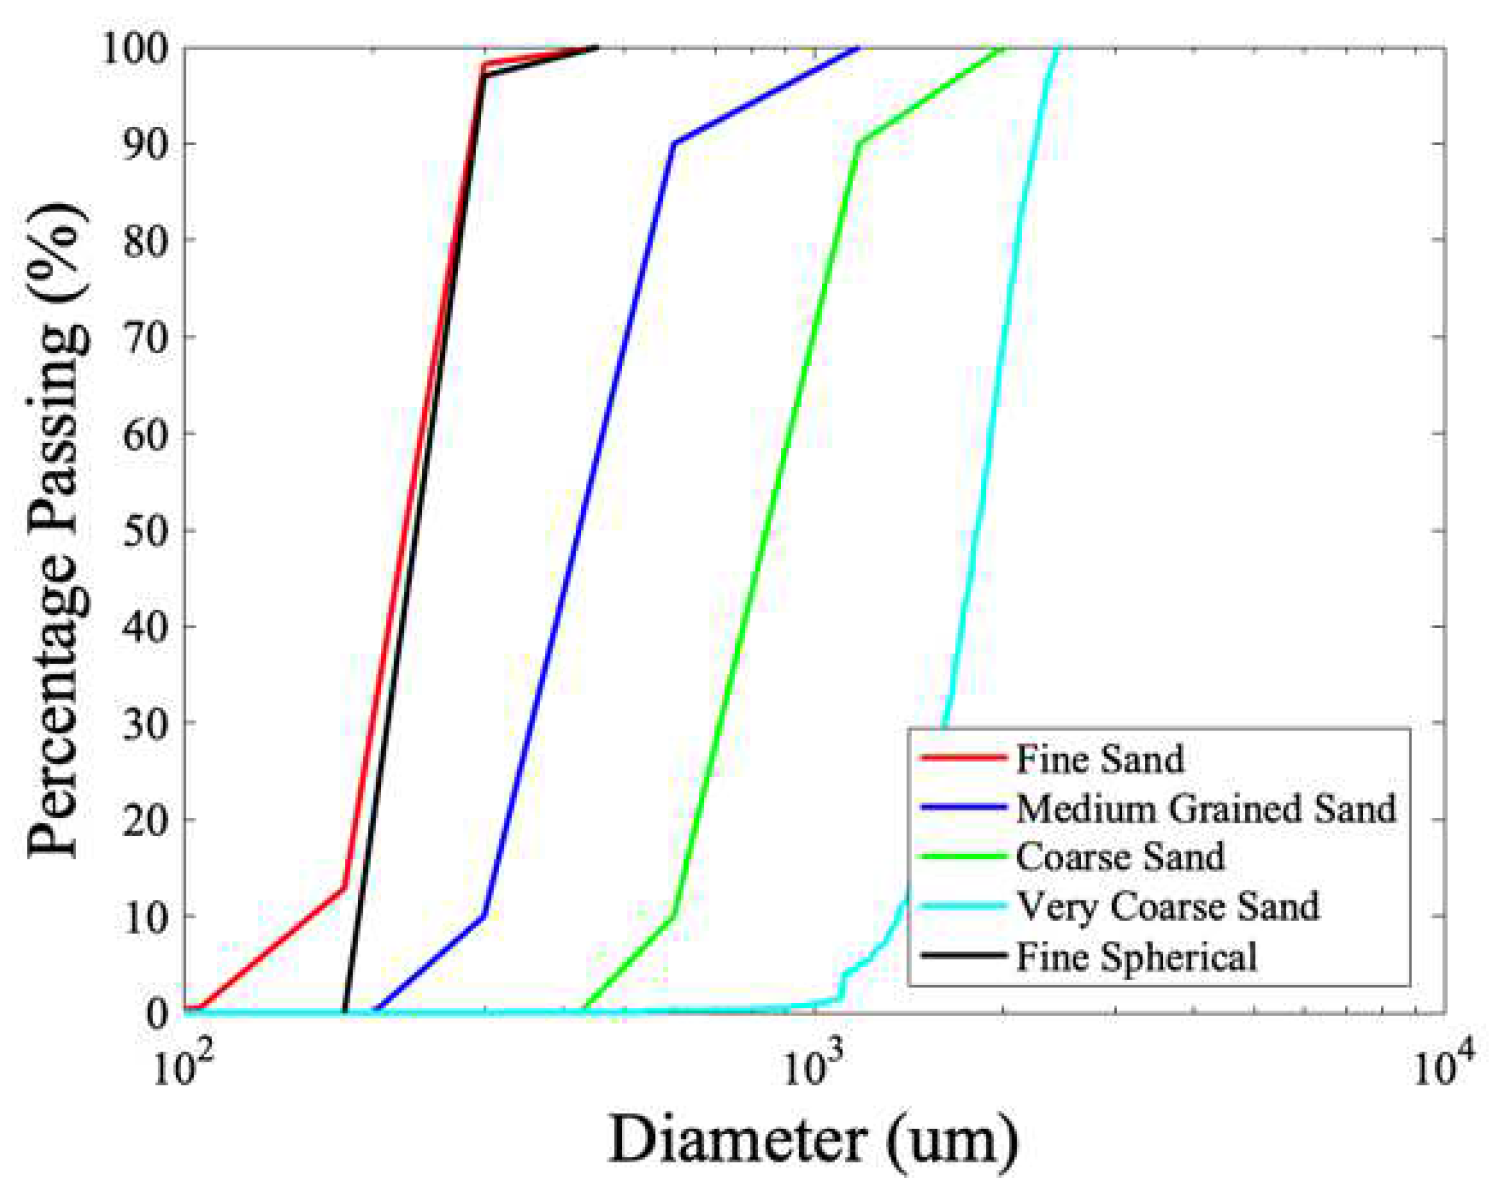
A parametric study was first conducted on artificially generated specimens to assess the strength, porosity, and hydraulic conductivity across various cementation levels and across various base materials. This study included twelve base materials; however, in this research, only the findings related to the base materials used for fluid injection experiments are presented. The diameter of the generated specimens used for the parametric study was 35.4 mm, and the height of the specimens was 71 mm. This step was necessary to relate the physical and mechanical properties of the cemented materials to their cementation level and, later on, with the infiltration and fracturing behaviour of the fluid injection experiments. The fluid injection experiments, which are the main component of this study, were conducted with specimens of 70 mm diameter and 20 mm height.

2.1. Base Materials

Various bio-cemented granular media were used across various cementation levels. These include glass beads and subrounded sands of various grain sizes (Fraction A to D). The particle size distribution (PSD) curves are shown in Figure 1. All materials were poorly sorted, as they possessed a low uniformity coefficient.
The methodology for the generation of the artificially cemented granular materials and their physical and engineering properties are presented in detail in [27,28,61,62]. The cementation level was between 3 and 10% (g of calcium carbonate/g of specimen), providing a wide range of strength, porosity, and hydraulic conductivity values and sufficiently representing the properties of weakly cemented natural sandstones as suggested by [27,28]. MICP was used to cement the cohesionless sand. This is a two-step bio-cementation technique that utilises urease, producing bacteria to build carbonate cementation around the grains. To generate the bio-treated specimens, the uncemented sand was first placed in cylindrical moulds that were 35.4 mm in diameter. Then, the bacterial solution (BS) was injected into the sand, while, in the second step, the cementation solution (CS) was added in the form of multiple injections. For example, approximately 15 injections of cementation solution were required to achieve 8% cementation.
The bacterial and cementation solution components are given in Table 1. Once grown, the bacterial strains were suspended into the BS until they reached an optical density measured at a wavelength of 600 nm, OD600, between 1.5 and 2. The average urease activity was 0.8 (mM urea/h)/OD. The injection method was from top to bottom via gravity saturating the specimen. The saturated specimen was given a 24 h retention time before proceeding to the next injection. During an injection event, the preceding solution was allowed to drain out, and a fresh solution was simultaneously injected into the specimen. Once 1.1 pore volumes of solution had accumulated at the outflow, the flow was stopped, leaving the specimen saturated with the new fluid. The only parameter allowed to vary across specimens was the number of injections, resulting in different cementation levels.

2.2. Assessment of Physical and Mechanical Properties of Bio-Cemented Sands

The assessment of the physical and mechanical properties was conducted utilising specimens with a 35.4 mm diameter and a height of 71 mm according to Konstantinou [27]. Unconfined compressive strength (UCS) was measured with displacement-controlled loading at a rate of 1.14 mm/min according to ASTM (2004) [63], and the hydraulic conductivity (HC) was measured with falling head tests in rigid wall permeameters after flushing three pore volumes of de-ionised water. It was assessed multiple times until the last three measurements agreed. The final porosity was calculated with the following equation:
n = 1 ϱ G s
An equivalent specific gravity ( G s ) was utilised that takes into account the specific gravities of the individual minerals present based on the relative volume fraction [64]:   G s = W t o t a l w 1 G s 1 + w 2 G s 2 , where W t o t a l is the total dry weight of the granular medium, w 1 and w 2 are the weight of quartz and carbonate, respectively, and G s 1 and G s 2 are the specific gravities the of quartz and calcium carbonate, equal to 2.65 and 2.71, respectively.

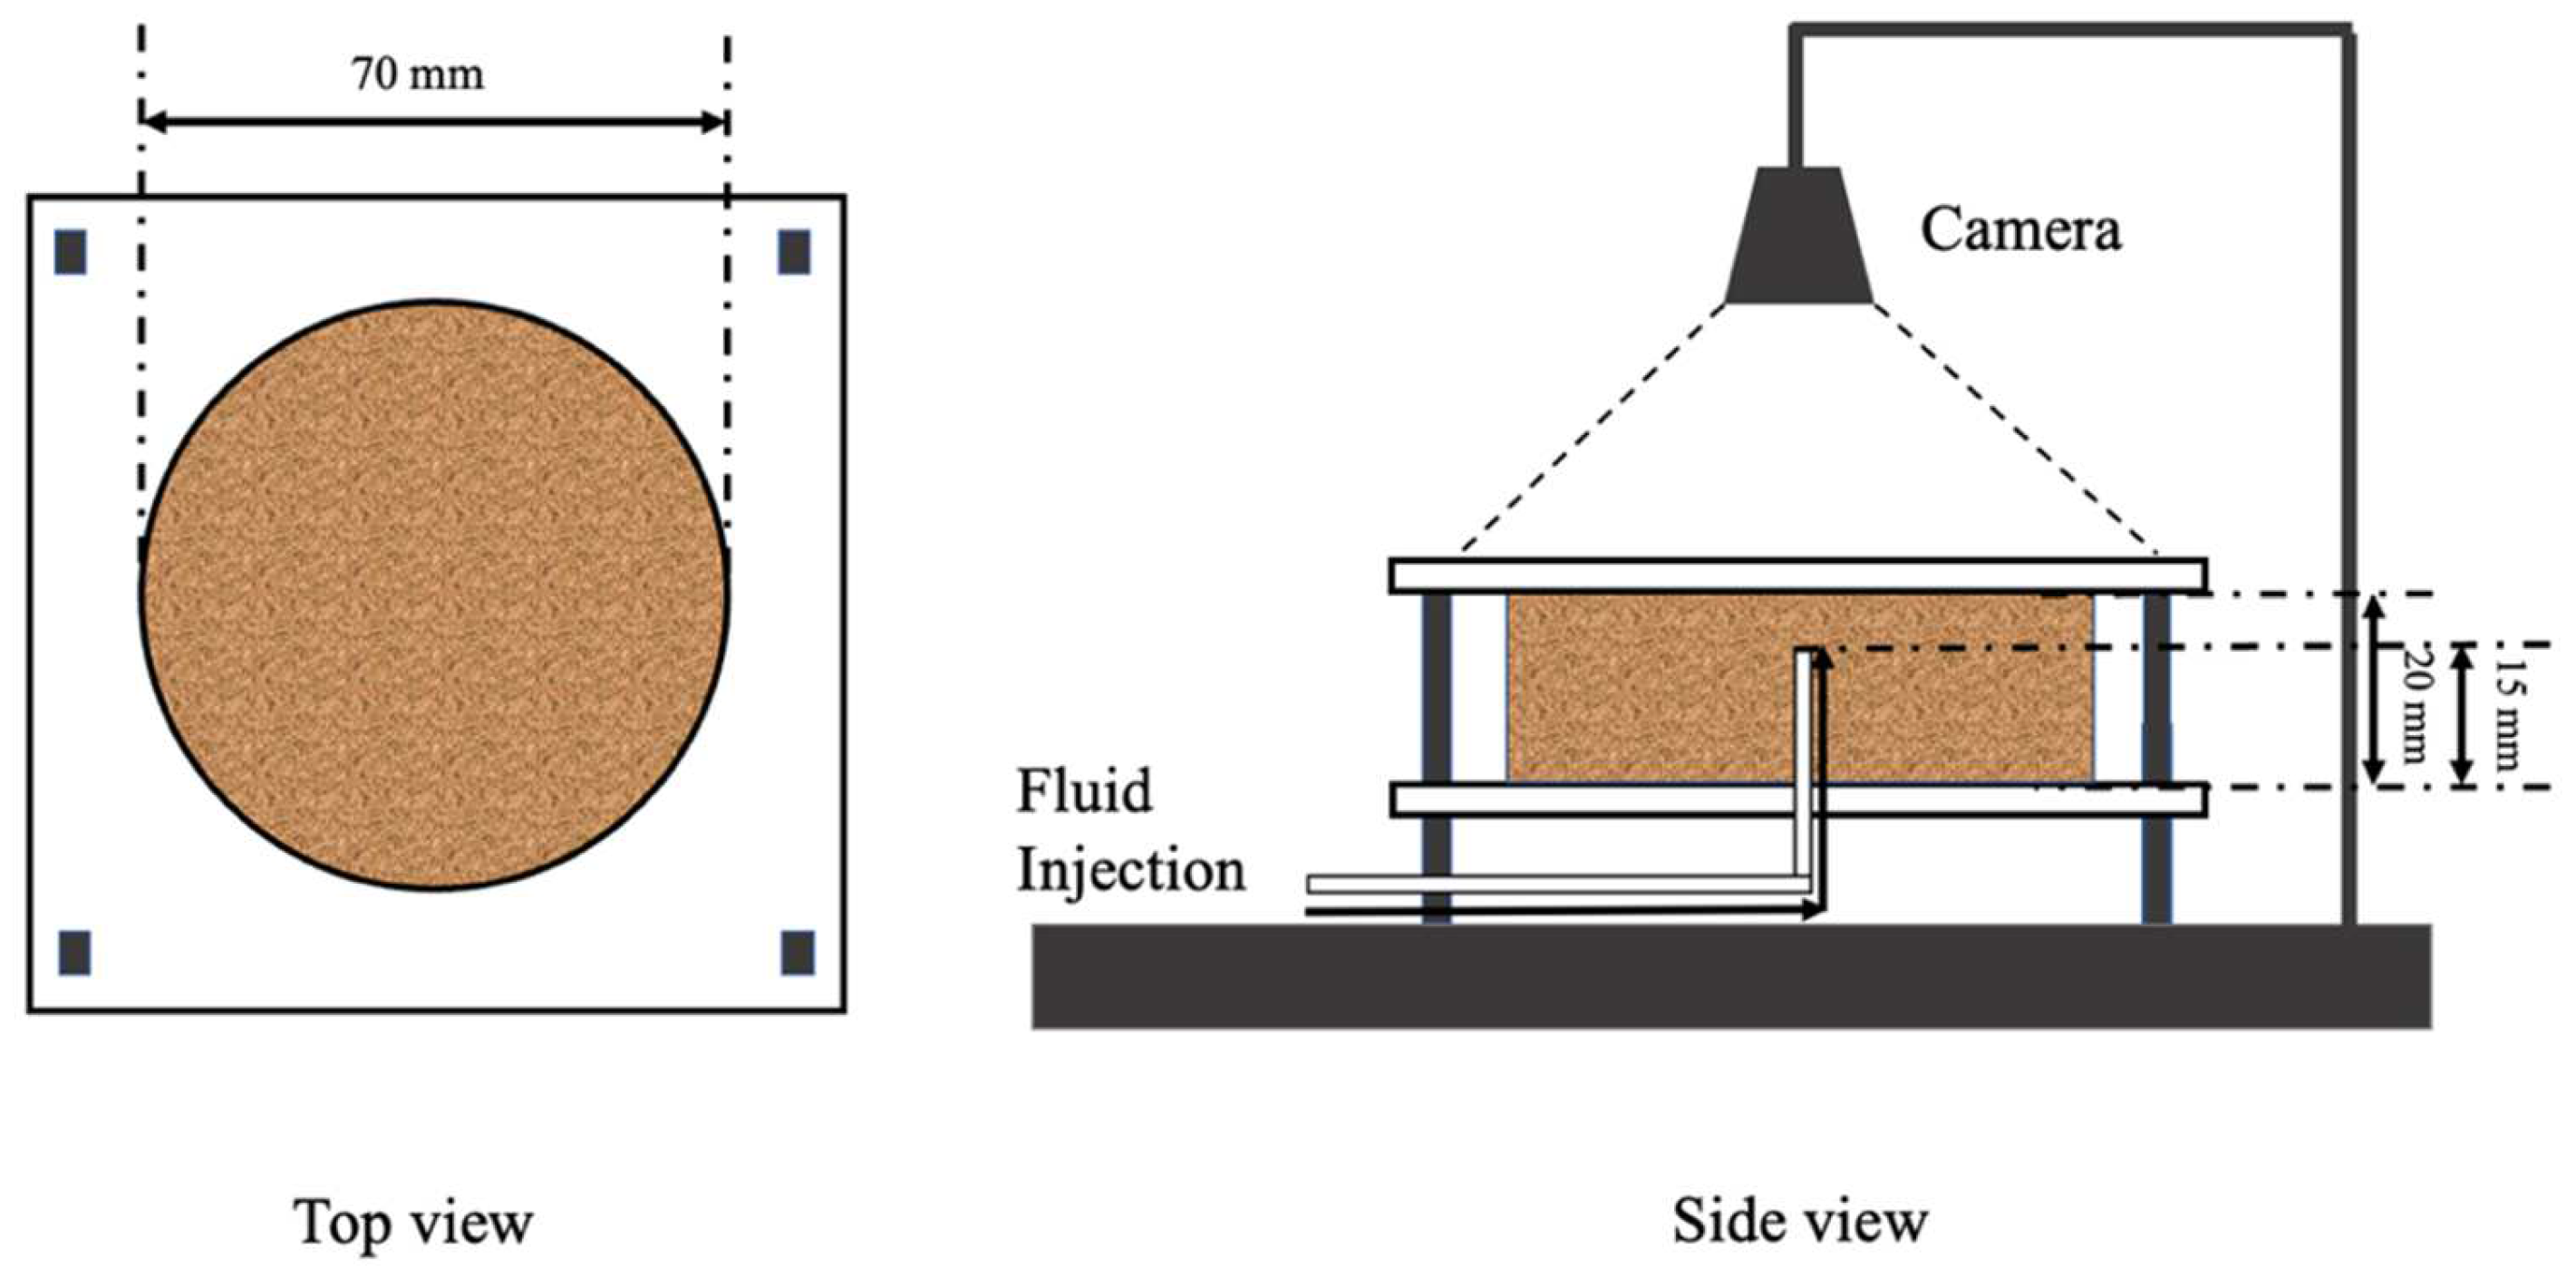
2.3. Experimental Setup of the Fluid Injection Experiments

Hele-Shaw experiments are usually conducted with viscous fluids and mainly with glycerine because of the practicalities of the process [9,10,55,65]. The viscosities are expressed as dimensionless terms through dimensionless analysis, making the findings of such experiments applicable to a range of different properties. Water and pure glycerine have similar surface tension values; therefore, the effects and mechanisms are expected to be similar across the two fluids.
The fluid injection experiments were carried out with a modified Hele-Shaw cell accommodating a dry specimen with a thickness of 2 cm and a diameter of 7 cm, representing a three-dimensional porous medium (Figure 2). The injection point was located at the centre of the cell, 1.5 cm above the bottom, generating radial flow towards the outer free flow boundary. No confinement was applied indirectly or directly on the bio-cemented granular material. Fluid viscosity remained fixed across all tests. Therefore, the infiltration, initiation, and propagation pressures were dependent on the strength of the sample, hydraulic conductivity, and flow rate.
Tests were recorded with a camera capturing 60 frames per second, placed above the specimens. A syringe pump, with a maximum capacity of 400 mL/min and a maximum allowable pressure of 4 MPa, was used to inject the fluids. The pressure profiles were recorded during each test.

2.4. Experimental Program

The experimental program of the fluid injection experiments is presented in Table 2. The fluid used in all experiments was a mixture of 90% glycerine and 10% water by volume with a viscosity of 178 mPa•s. First, fluid injection experiments were conducted on bio-cemented fine sands across various cementation levels (between 3 and 8%) at constant flow rates of 30, 100, 200, and 400 mL/min. Then, bio-cemented glass beads and medium-grained sands with various cementation levels (4% to 8%) were introduced, with the same constant flow rates as before. The fracture patterns and the pressure profiles from these experiments were investigated, and the mechanical properties of those specimens were correlated to the peak pressures at which fractures were induced. Injection experiments on bio-cemented coarse and very coarse sands followed, with variable flow rates across each test. The combinations of injection rates were also 30, 100, 200, 300, and 400 mL/min.

3. Results and Discussion

3.1. The Physical and Mechanical Properties of the Bio-Treated Specimens

A summary of the properties of interest within the range of cementation levels examined and the relation of the properties (the fits of the experimental data points) is shown in Table 3. These results are part of a larger study that was conducted with 12 types of sands, which is presented in Konstantinou 2021 [27]. In this research, only the properties of the five types of sands of interest are presented, which aids the interpretation of the fluid injection experiments, the main purpose of this study. First, the fits of the unconfined compressive strength (UCS) are shown with respect to the cementation level (Cw), then the fits obtained for UCS and porosity (n), and, finally, the hydraulic conductivity (HC) with respect to the cementation level.
As described in Konstantinou 2021 [27], medium-grained sands provided the highest strength across all cementation levels (up to 2 MPa at 8% cementation and 4 MPa at 10% cementation) followed by fine-grained sands and coarse-grained granular materials. Glass beads, although having similar grain sizes to fine sands, were much weaker with a range of strength values similar to that of very coarse sands. Glass beads provided too many contacts between the particles compared to fine sands, and, as a result, a larger portion of particle-to-particle contacts remained uncemented in the range of cementation levels studied, lowering the overall strength. Due to the different base materials utilised, various combinations of strengths and porosities were achieved.
Coarse sand provided the highest hydraulic conductivity values, followed closely by medium-grained sand. The lowest values across the range of cementation levels provided in this study were achieved in bio-cemented fine sand and glass beads, which had very similar values. Hydraulic conductivity is largely controlled by grain size, which is a contrast to strength, in which other factors are also dominant. Within the same range of achievable porosities, the hydraulic conductivity of coarse sands was the highest, while fine sands and glass beads provided similar values with porosity ranges overlapping to a great extent.

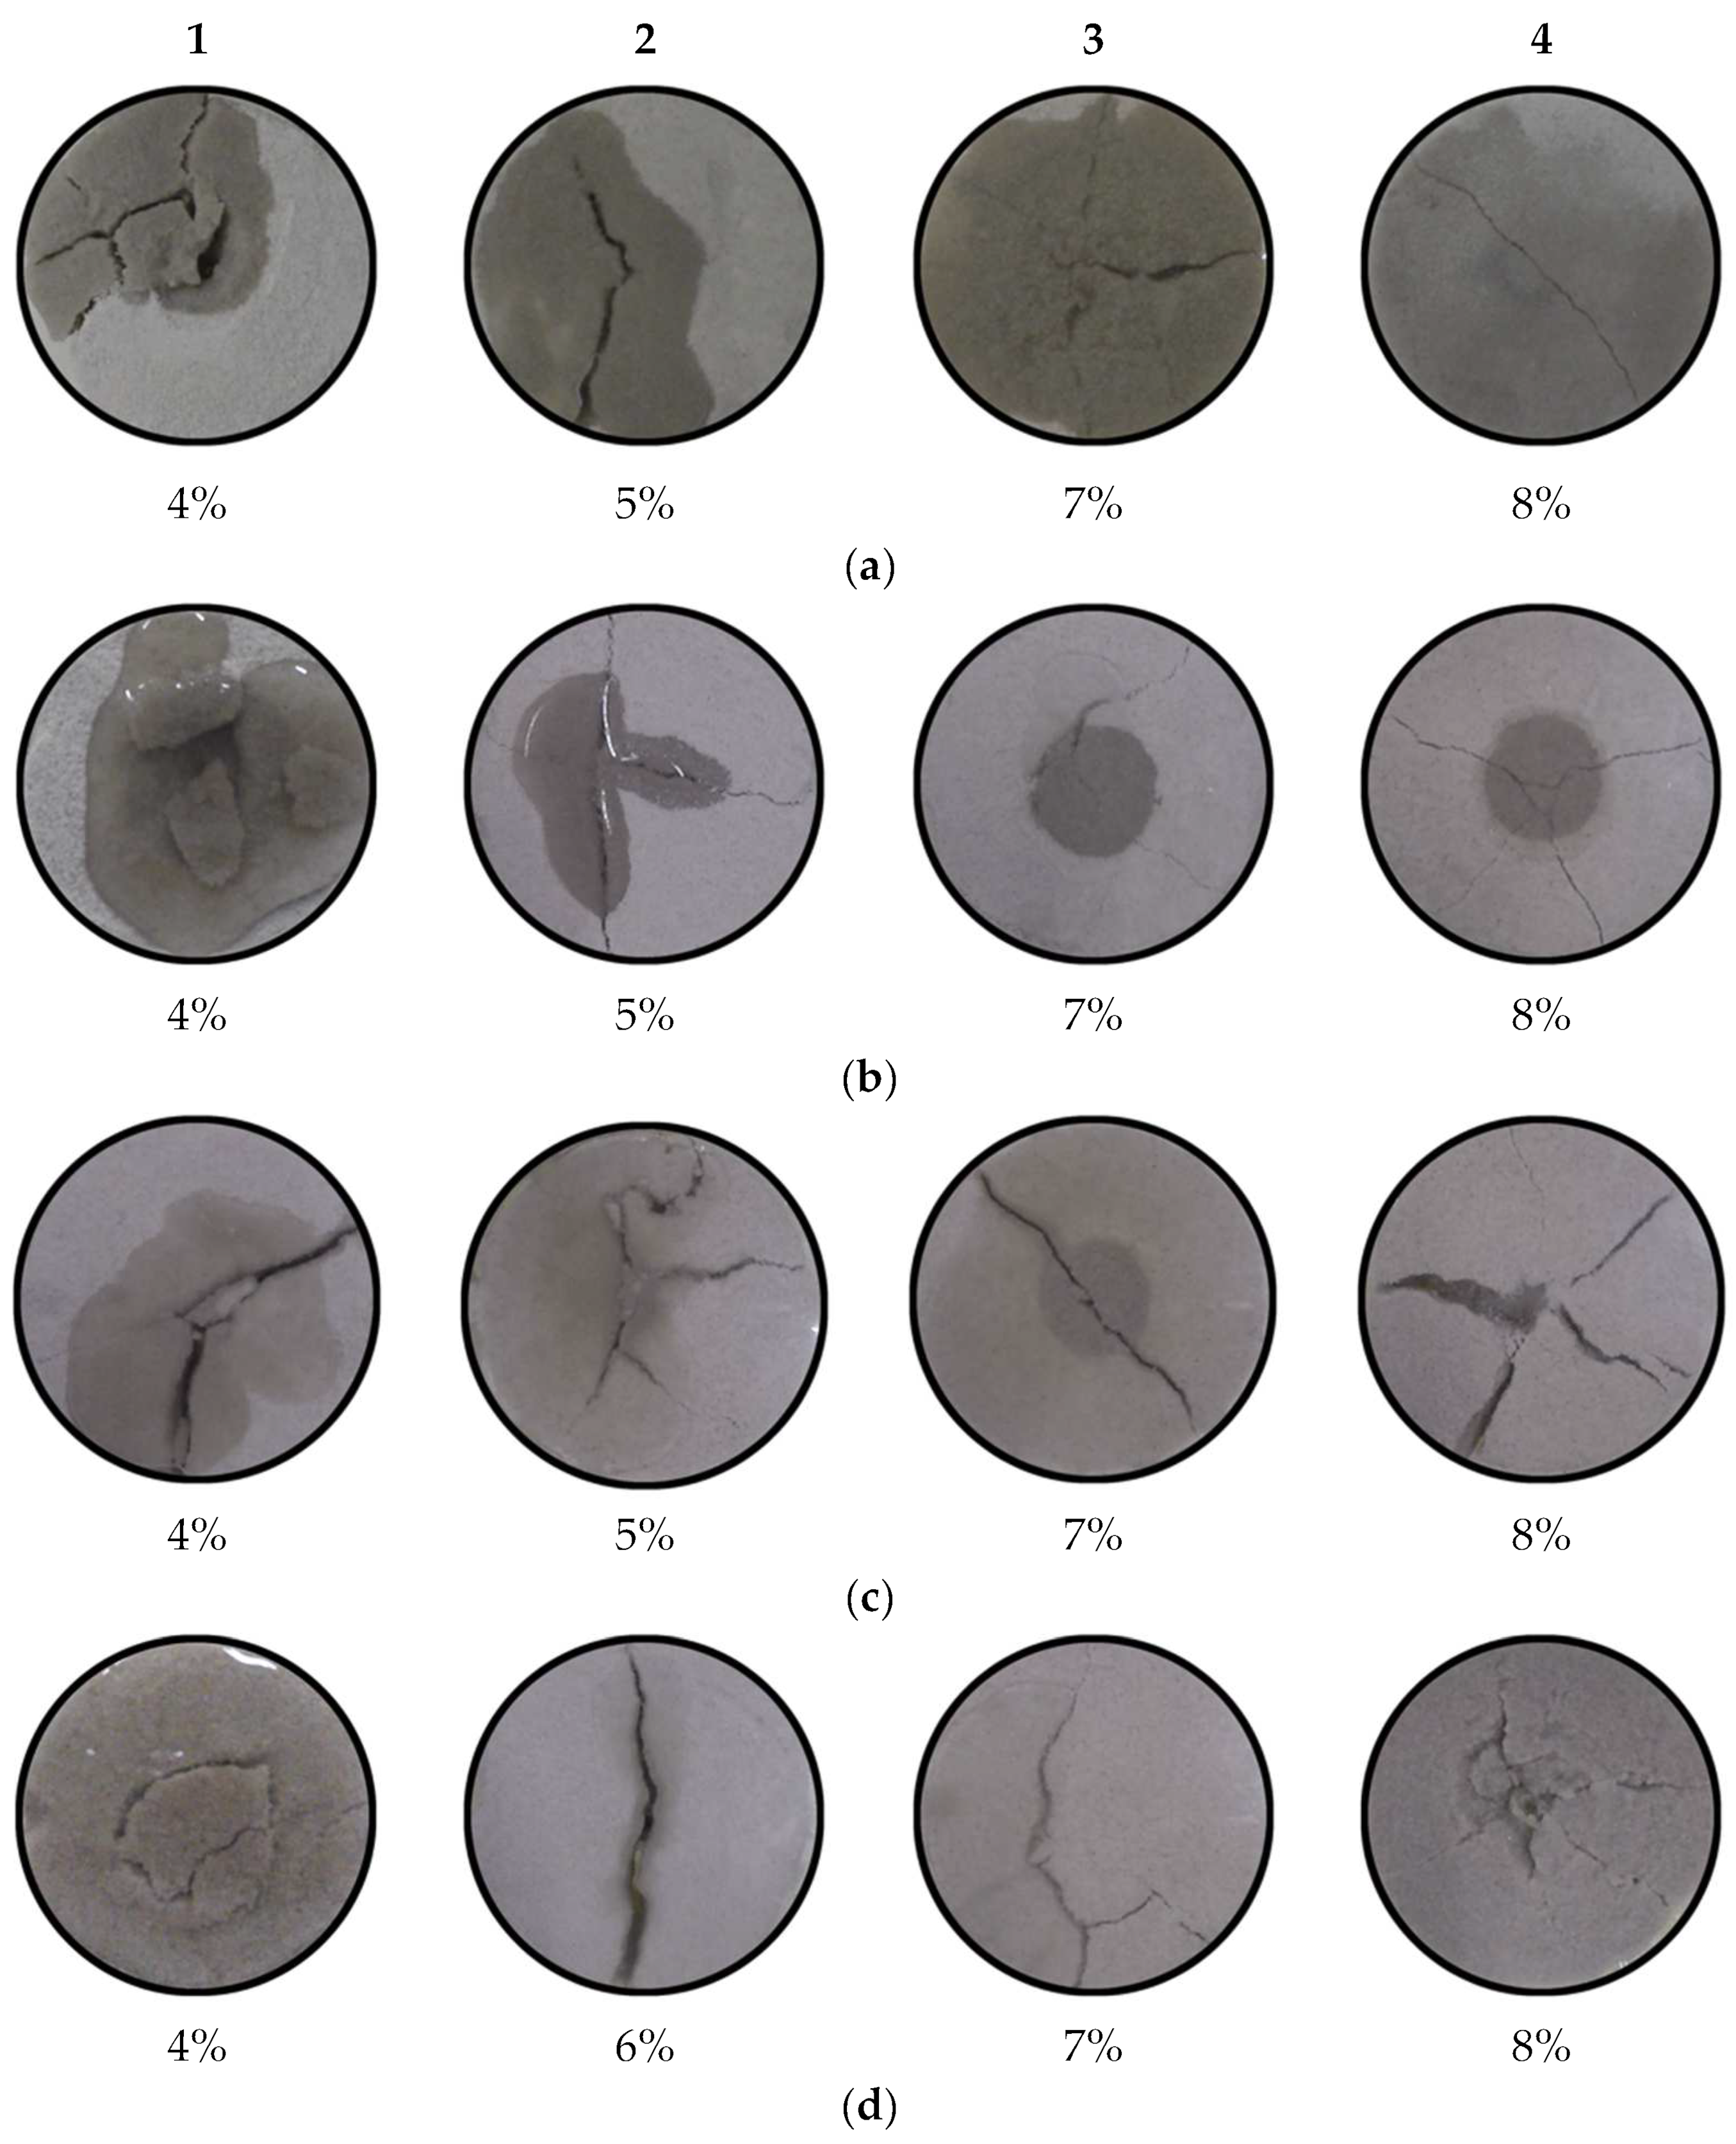
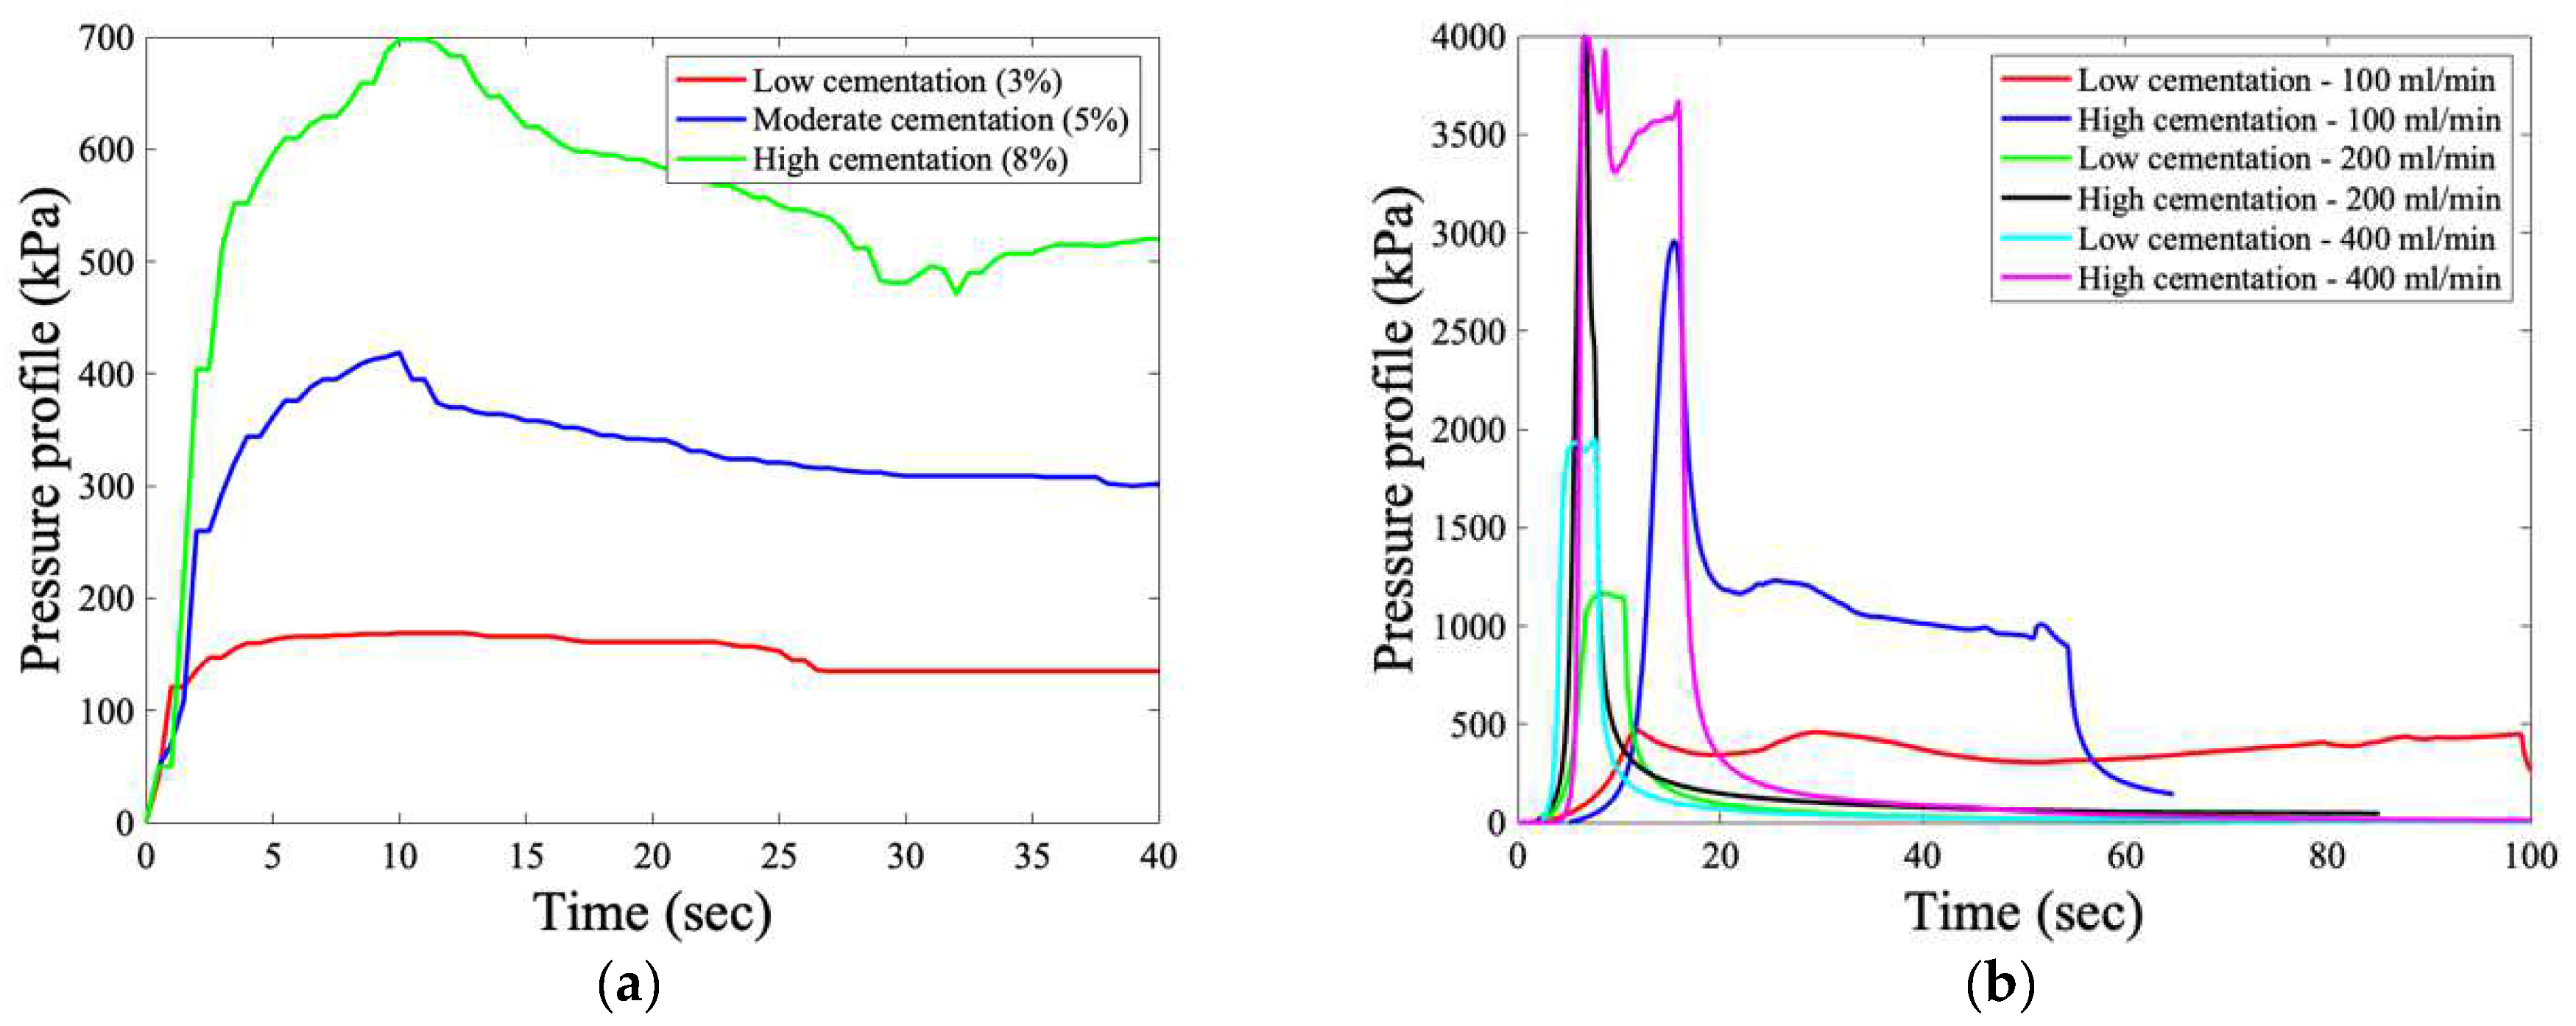
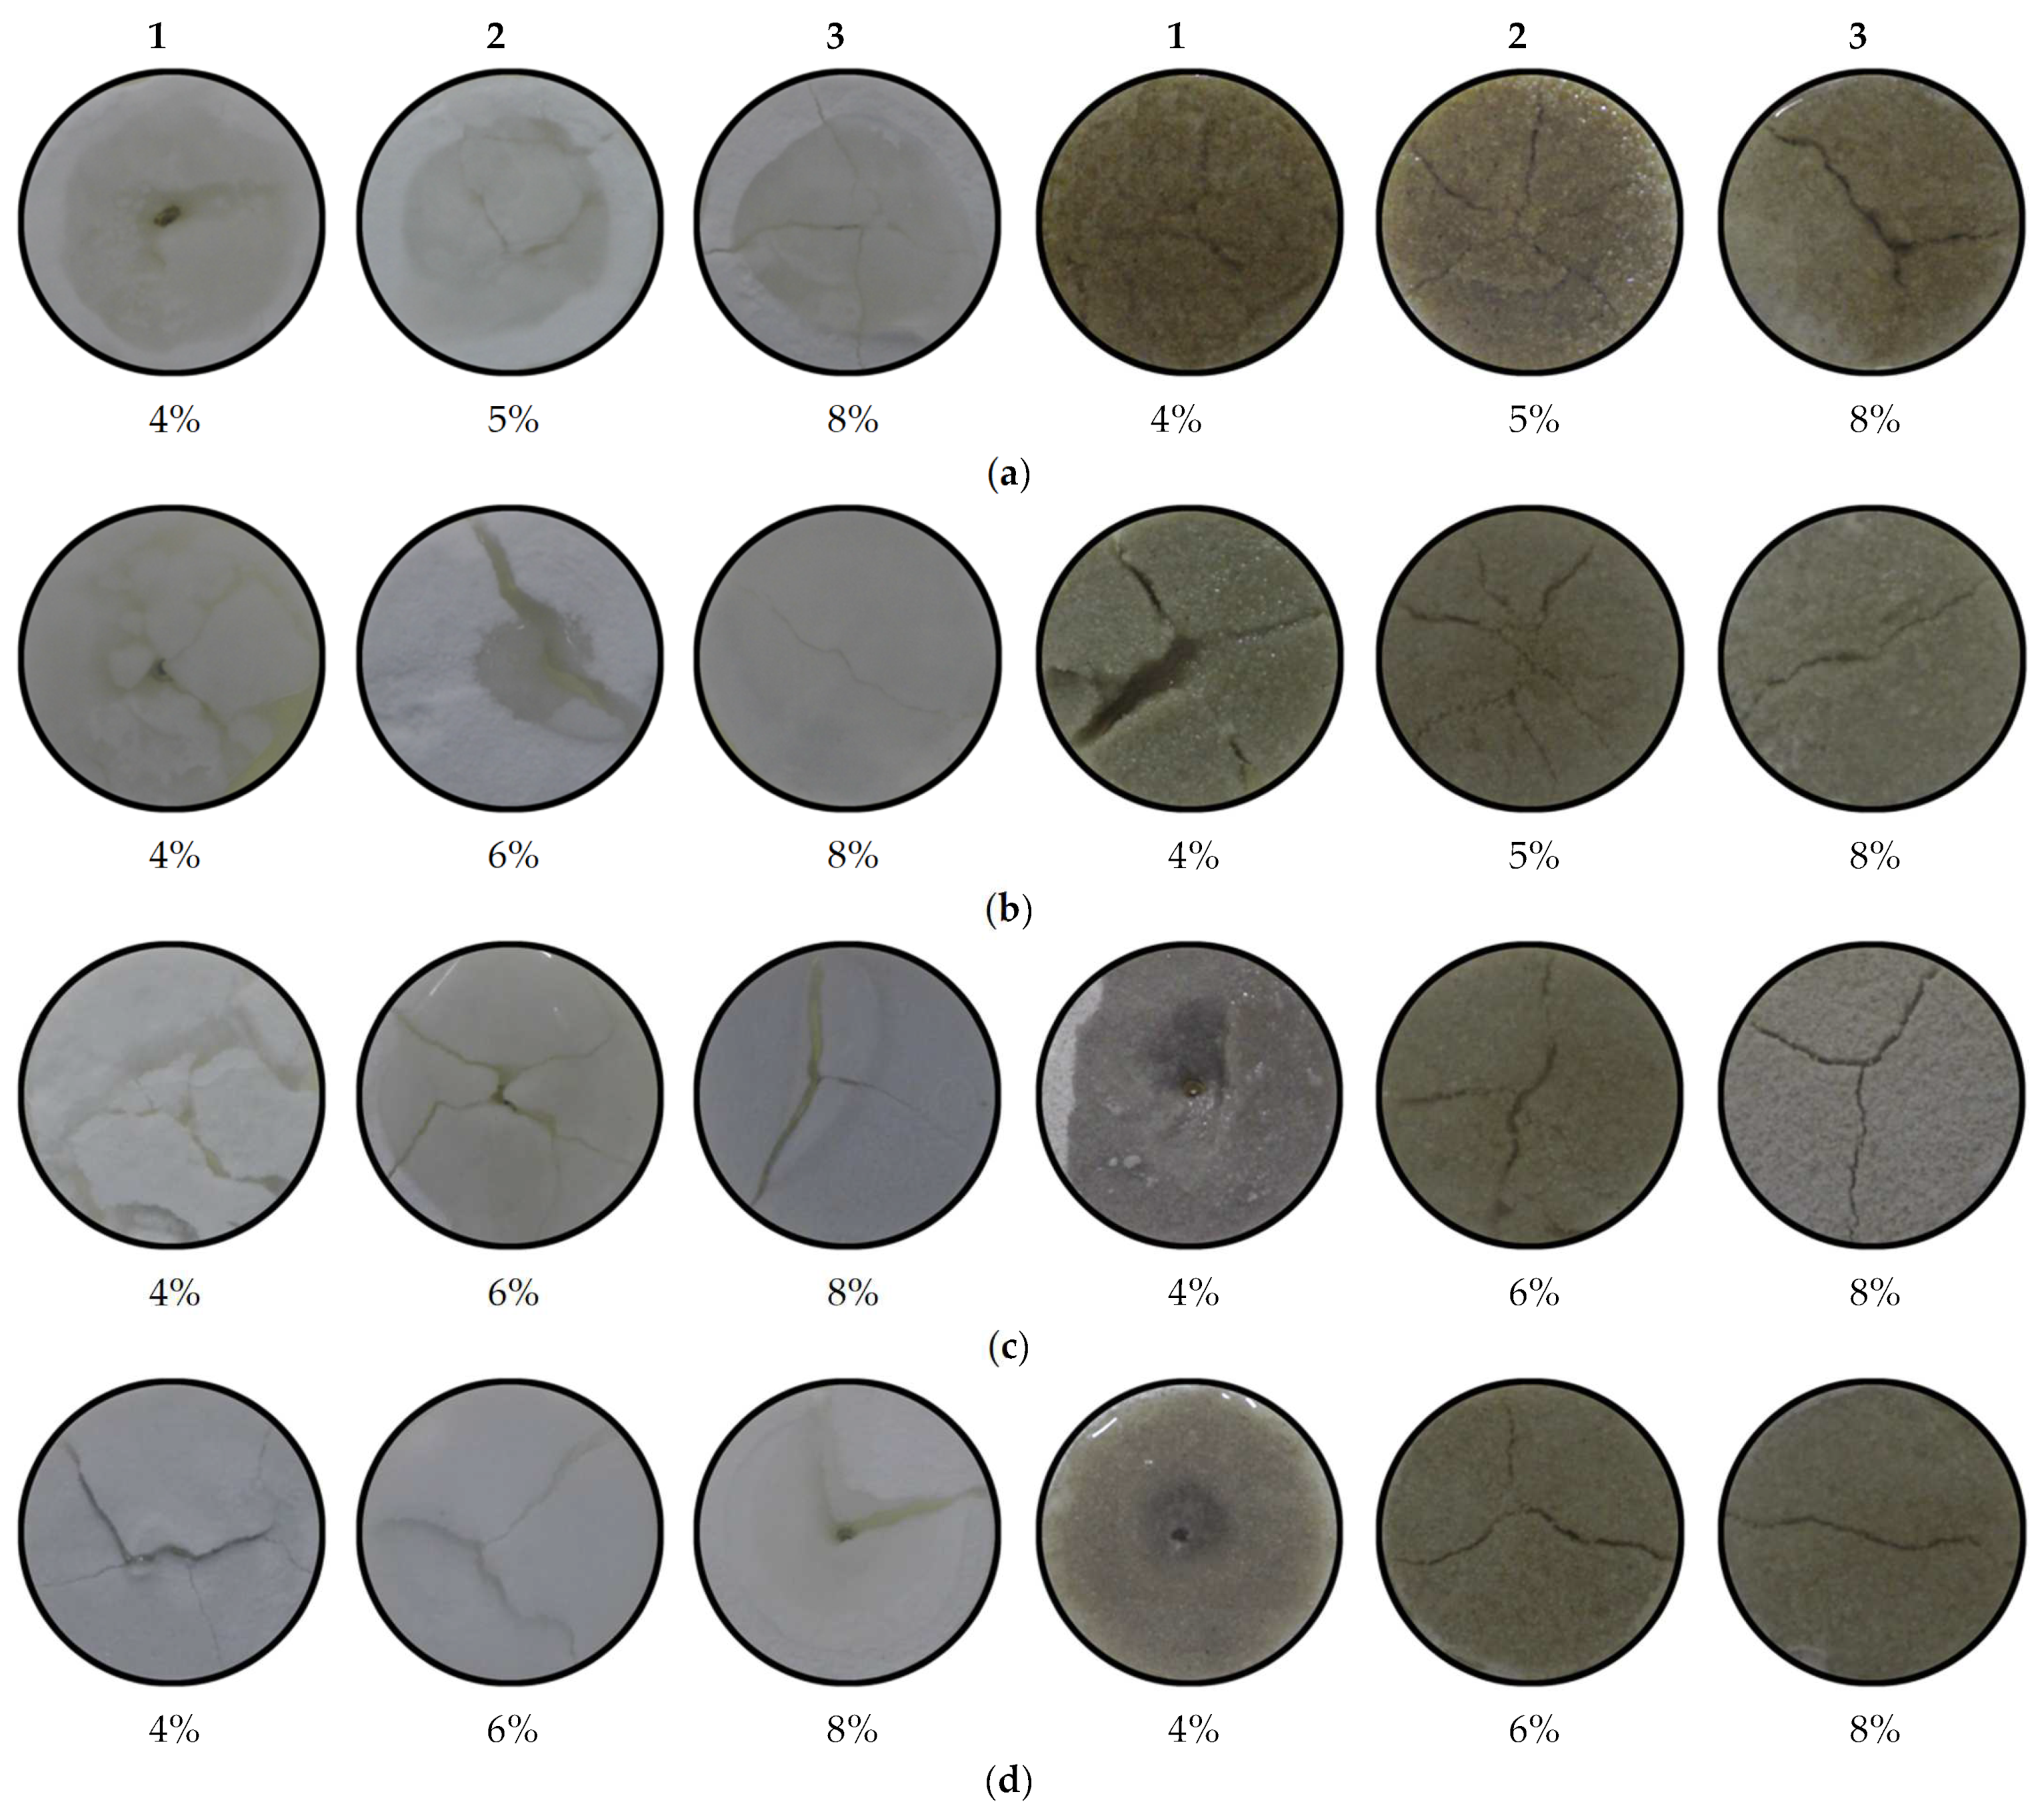
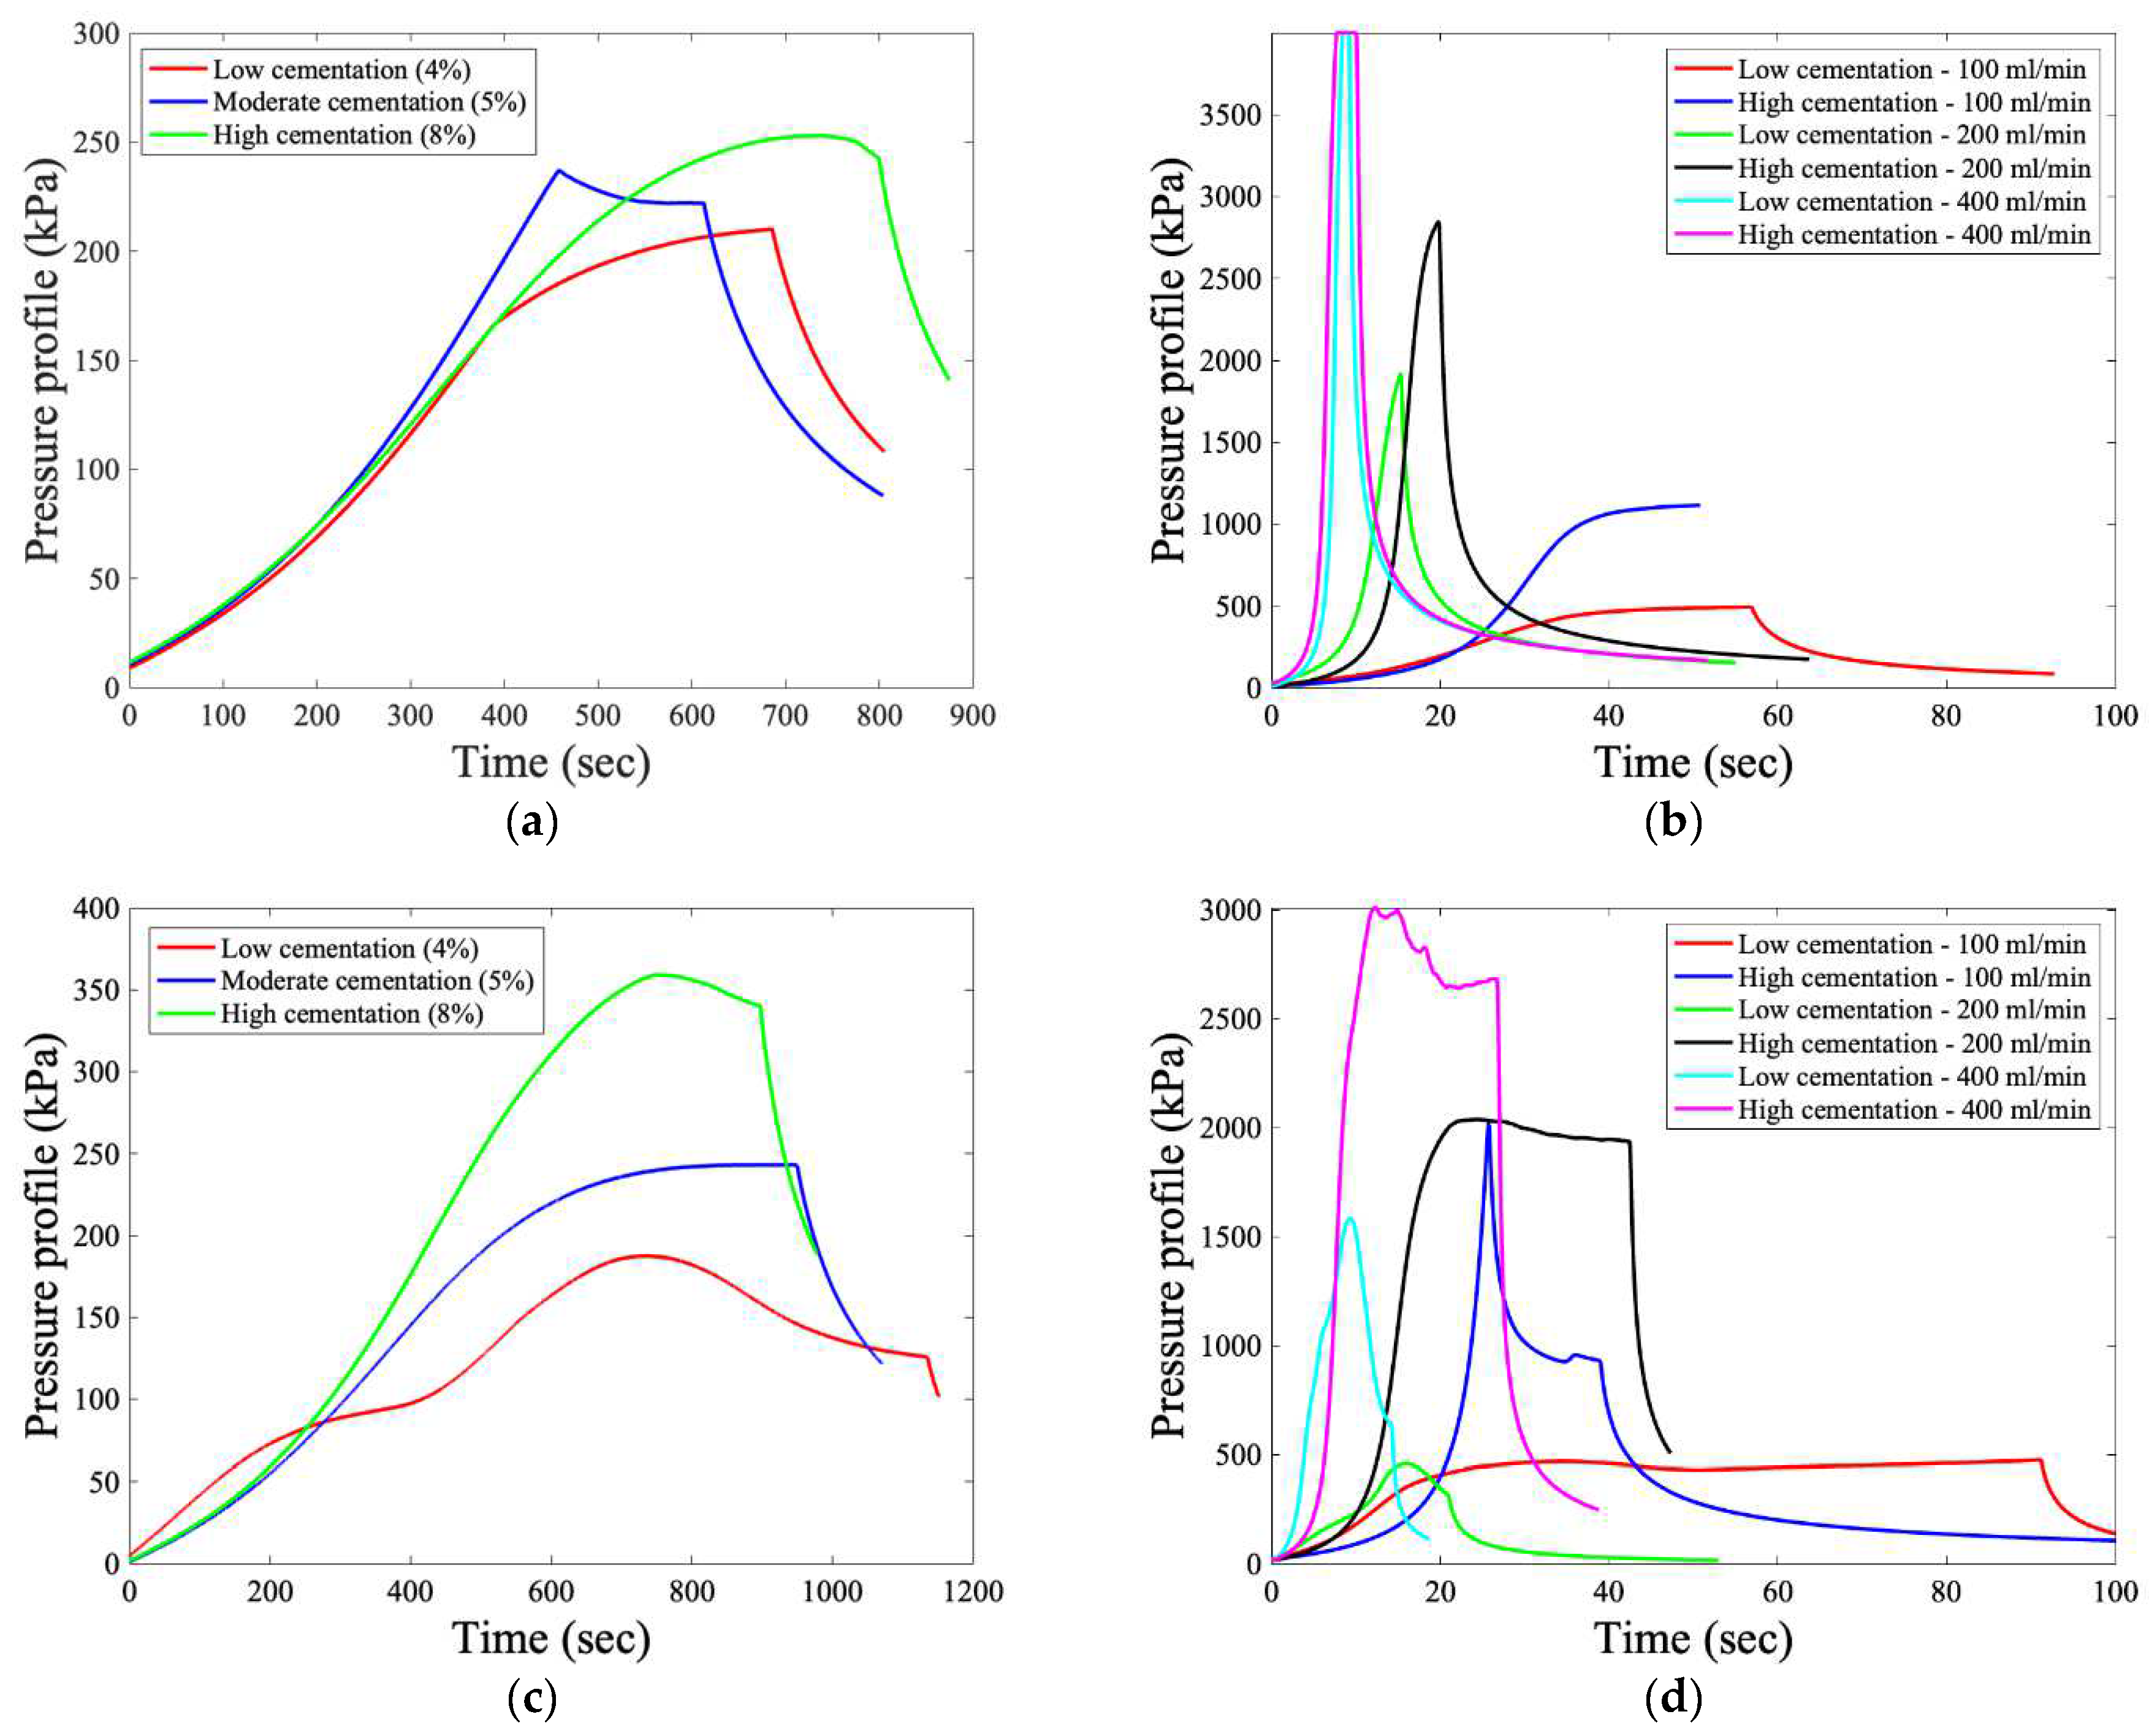
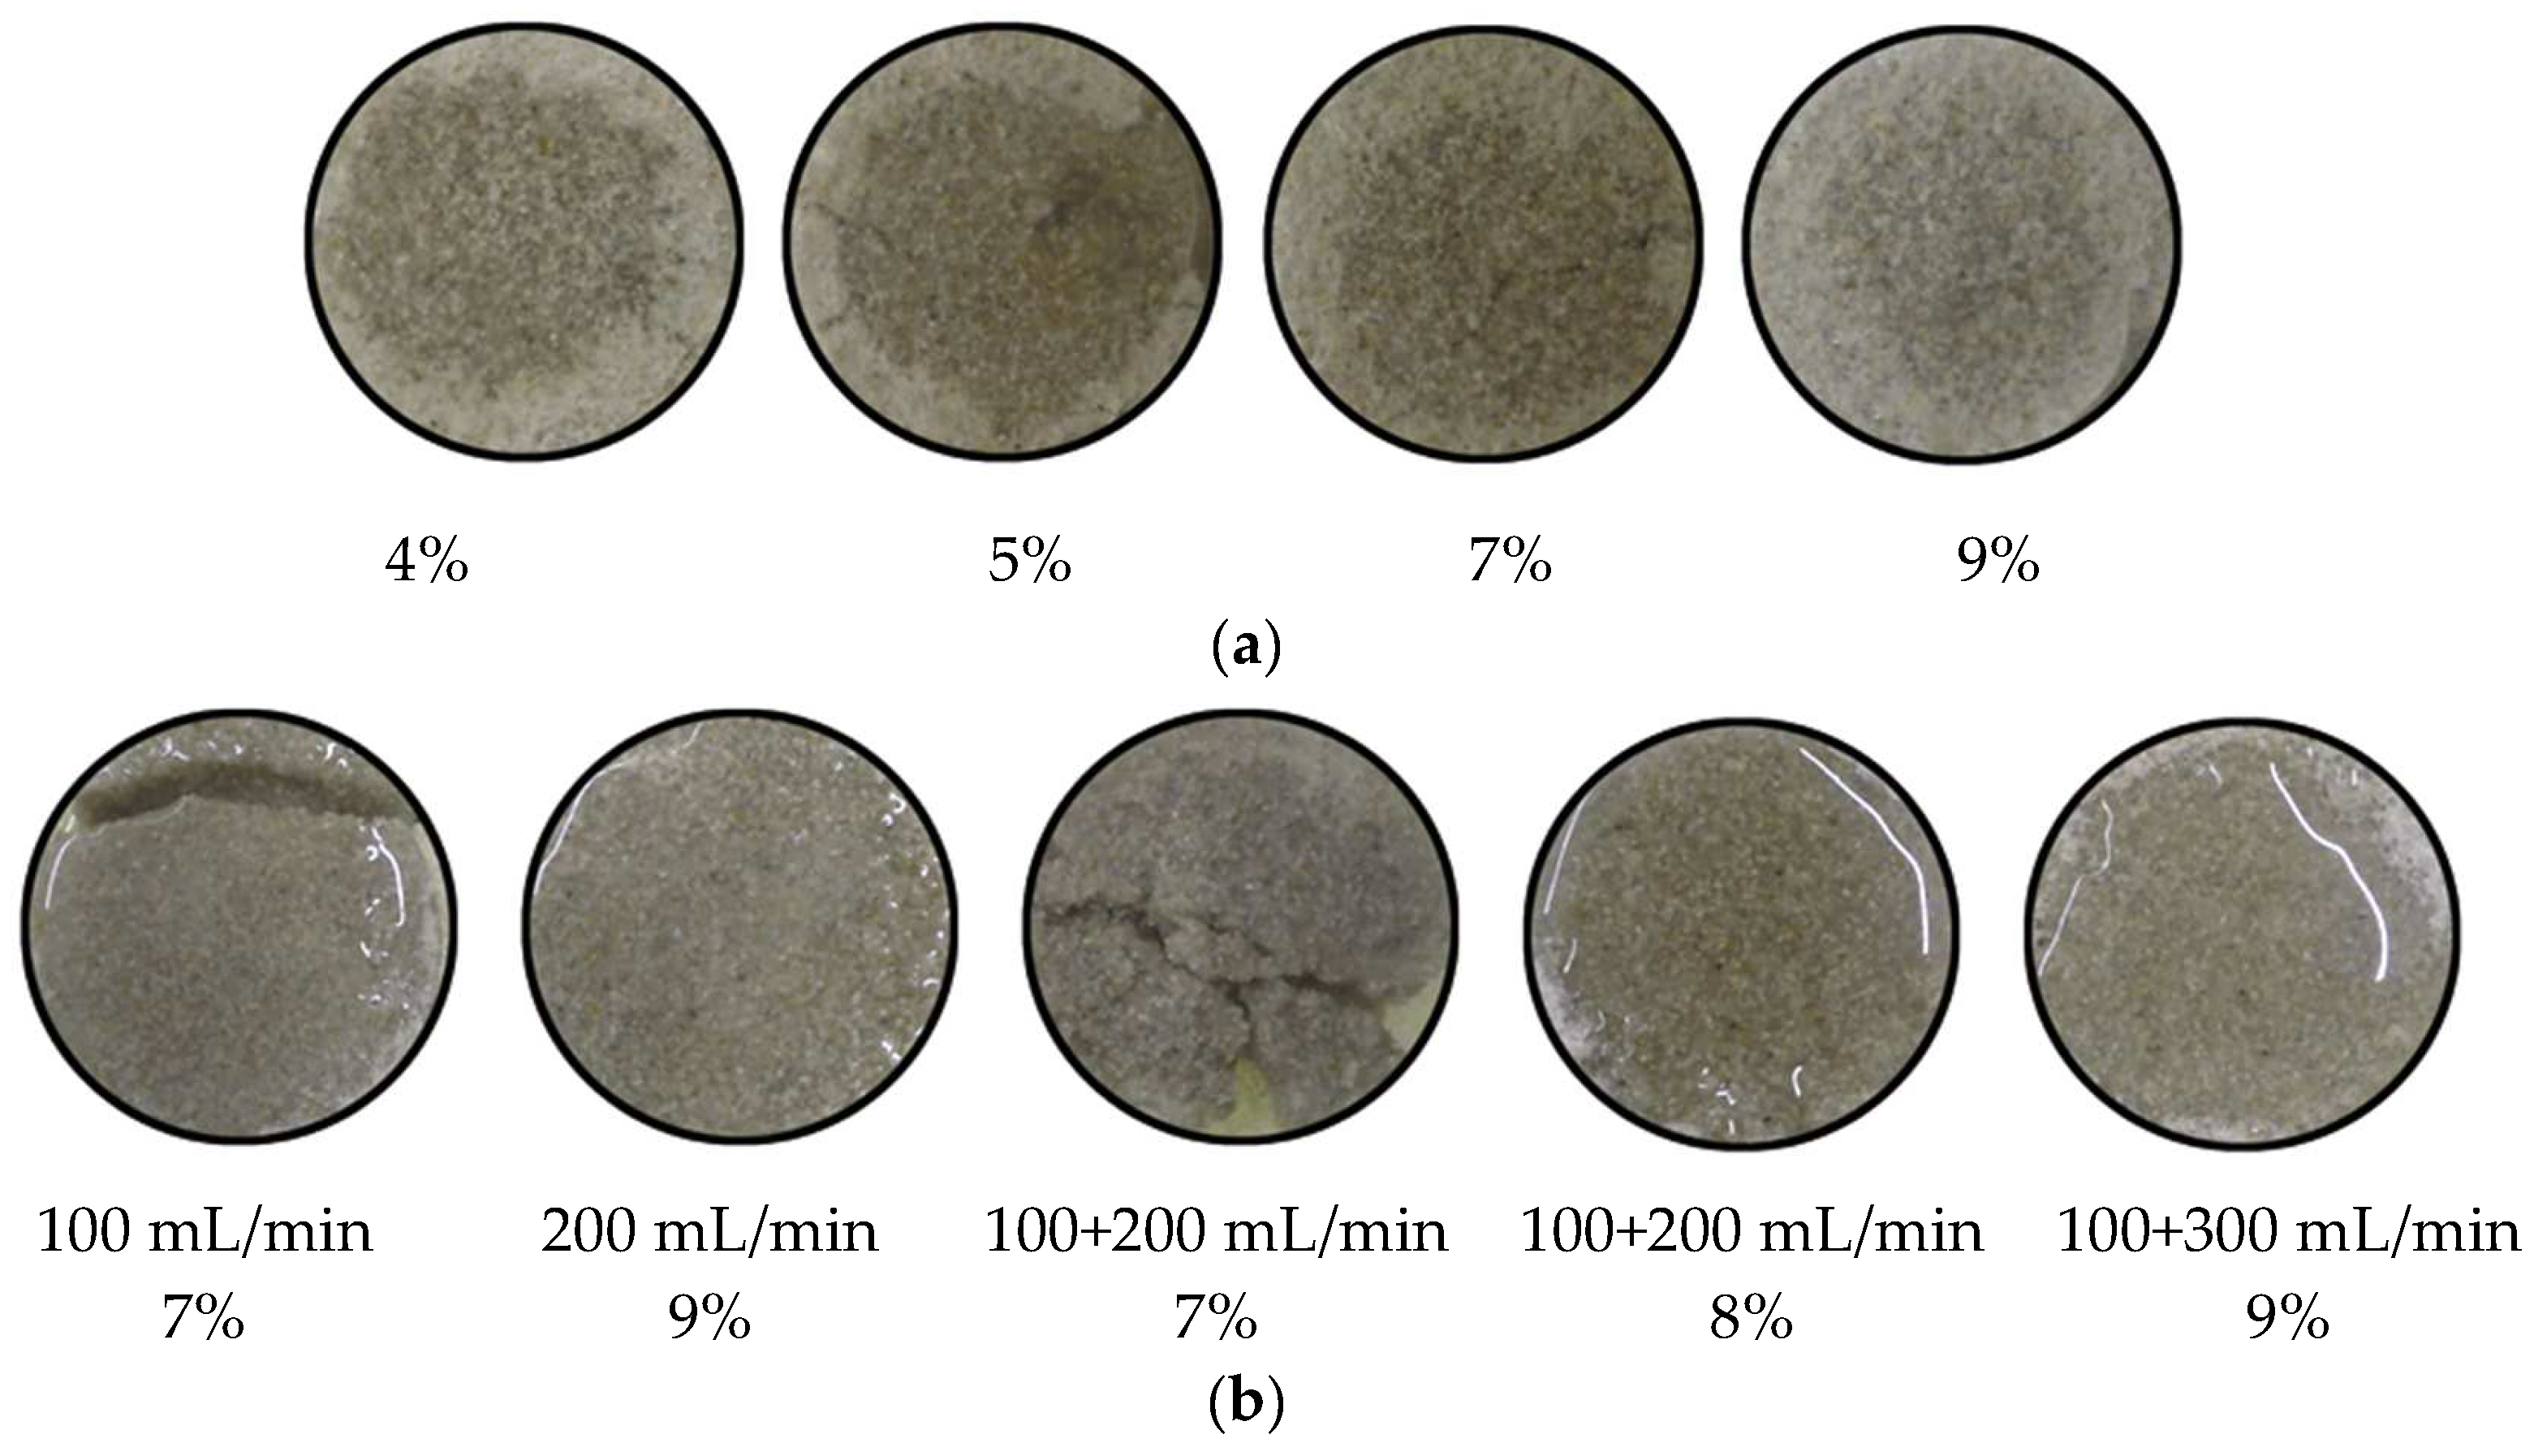
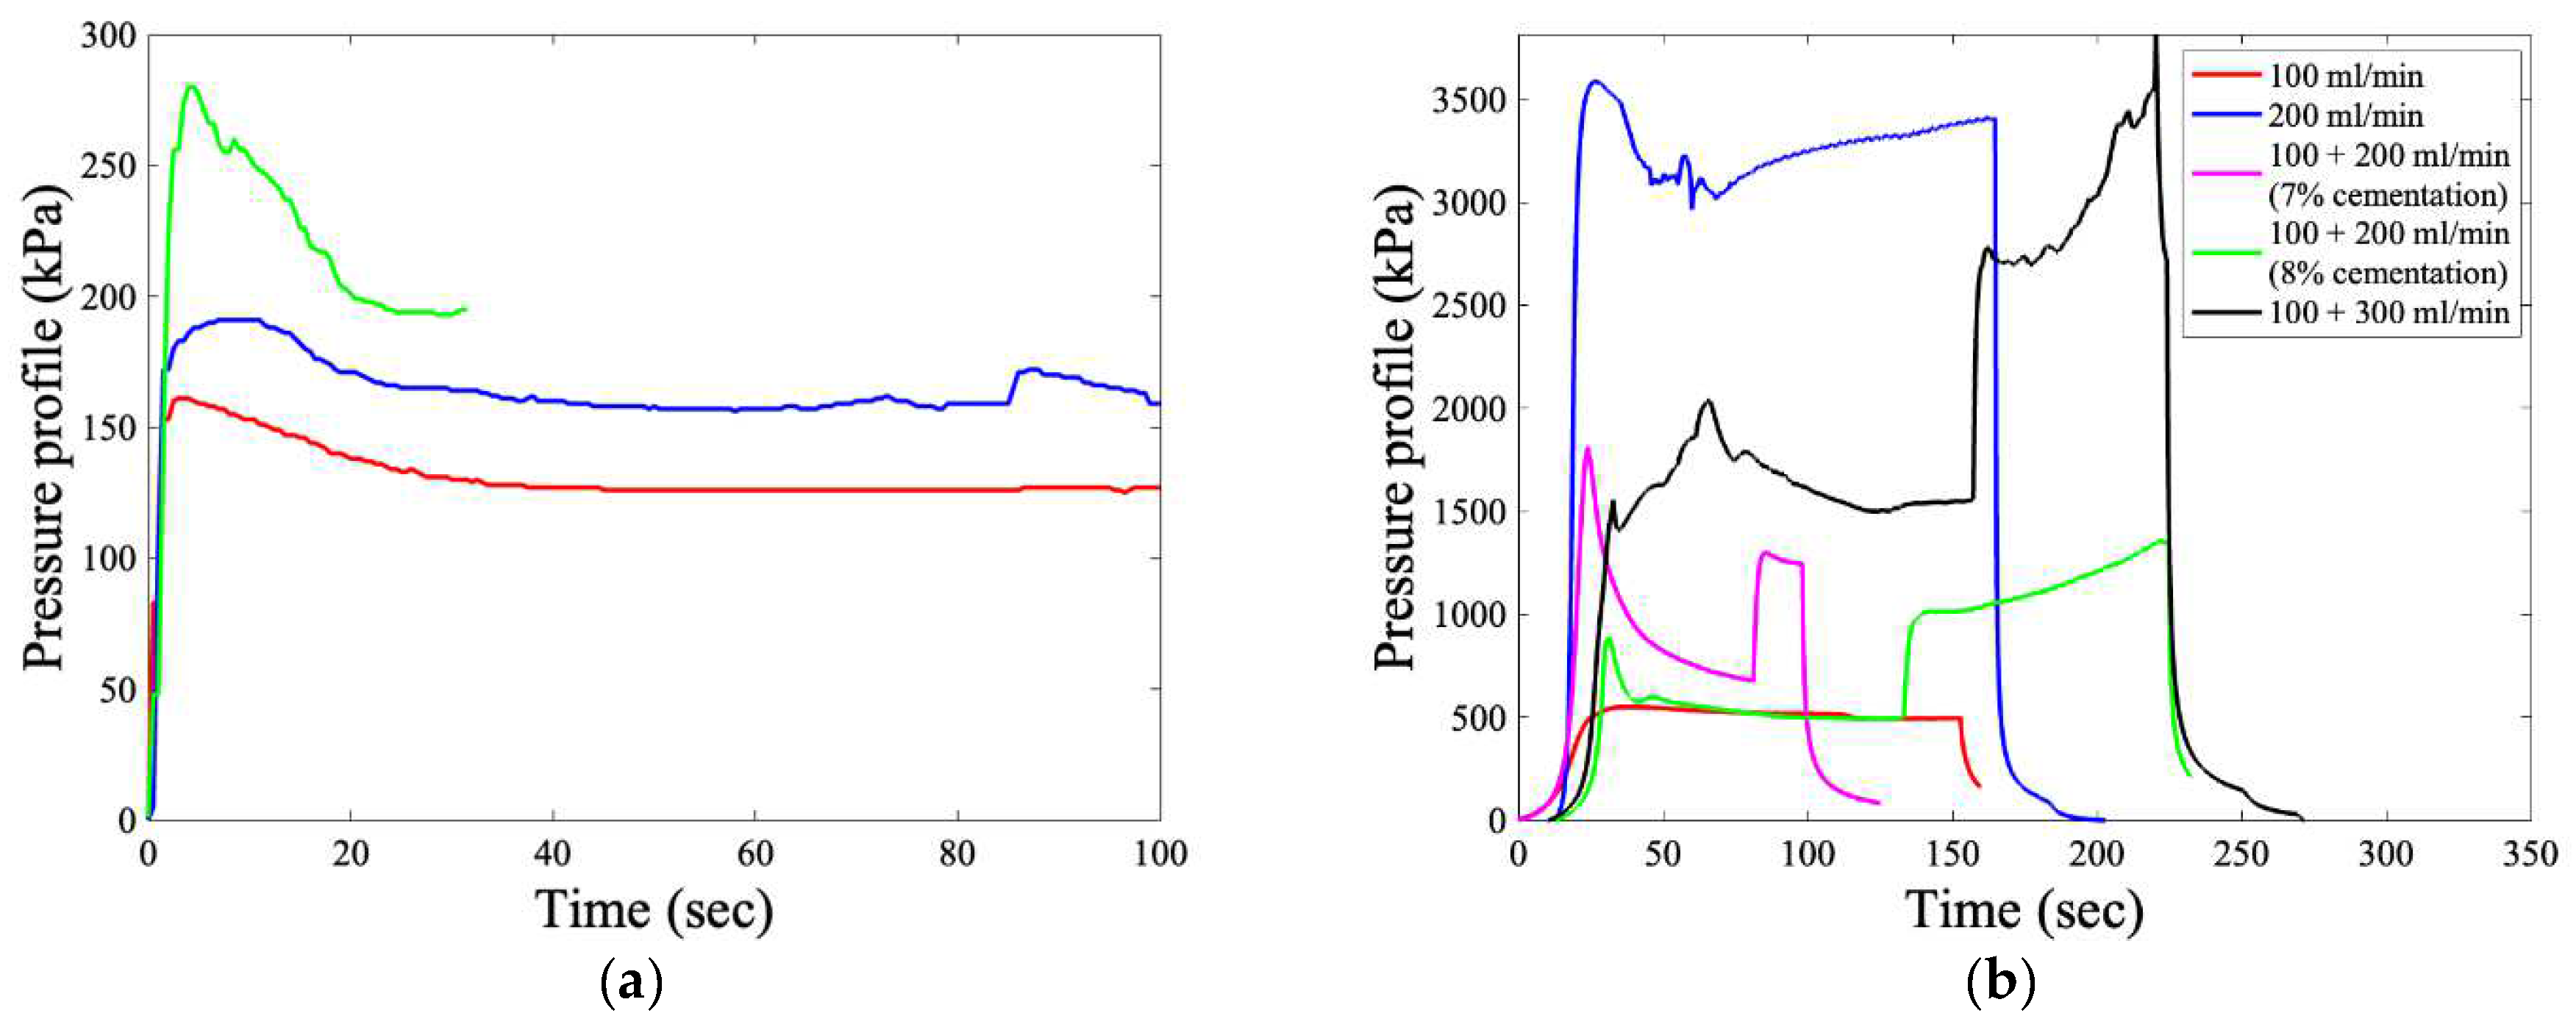
3.2. Fluid Injection Experiments

Figure 3 shows the snapshots of the fractures after the failure initiated and right before the fluid injection test was concluded in fine bio-cemented sands. The images are presented in ascending order (left to right) based on the cementation levels. The flow rate increased from 30 to 100, 200, and 400 mL/min from the top (row a) to bottom (row d). In most of the tests conducted with a flow rate of 30 mL/min (row a), the fractures were not axi-symmetric, while a circular cavity appeared at first with or without further damage, depending on the degree of cementation. At low cementations (tests a1 and a2), cavity-like fractures developed more gradually compared to the crack-like fracture responses obtained at higher cementation levels (tests a3 and a4). Specimen a1 had the lower cementation level and disaggregated the grain scale. Grains were displaced in clusters in tests a2 and a3. A clear crack-like fracture was only evident at the highest cementation level (test a4). The strength of the samples played a more important role compared to the hydraulic conductivity differences that may have occurred due to the differences in the cementation level.
Features became more pronounced as the flow rate increased, with grains moving in clusters for lower cementations in all flow rates. As the flow rate increased (moving down from row a to row d), the infiltration zone became smaller and more symmetrical and the fractures appeared to grow ahead of the infiltration zone. The breakdown pressures continued to grow once a crack or cavity appeared, and the degree of damage was of larger extent, resulting in a sudden fracture extending further away from the infiltration zone. This behaviour was not captured in any tests presented in the literature, as the infiltration zone always was interpreted as preceding the fracture. However, in most of the tests in 3D materials presented previously, the fracture was observed after the end of the test. At 400 mL/min (row d), a process zone was evident, which was around the fracture resembling the viscosity fingering-dominated regime (regime IV) of the 2D Hele-Shaw setup experiments by Huang et al. [55]. As in the study of Huang et al. [55], it may be assumed that the capillary effect is negligible in the presented experiments since the capillary number is very small: N C a = v n / γ , where ν is the velocity, n is the fluid viscosity, and γ is the surface tension. For the test with the largest flow rate (hence, the largest capillary number), the flow velocity was 26.5 mm/s, while the fluid viscosity was 178 mPa•s, and the surface tension was 0.067 N/m, giving a value of 0.07, which is very small.
Grain displacement mechanisms were less evident compared to the cohesionless sand tested in Konstantinou et al. [20]; however, cavity expansion was also present in conjunction with crack-like fractures, resembling branching. Some of the fracture patterns displayed a fingered-like appearance and were similar to the results obtained in the classic 2D Hele-Shaw setups, where cohesionless sand has been traditionally tested. These observations are a sign of the presence of mixed mode failures. These effects faded out as the cementation level increased, with a transition to a more crack-like fracture style.
Examples of three pressure profiles at low, moderate, and high cementation levels at a flow rate of 30 mL/min are depicted in Figure 4a. As the cementation level increased, the pressure profile showed a higher and clearer peak with a more pronounced difference between initiation and propagation pressure. The propagation pressure became stable as soon as the crack-like or cavity-like fracture opened, and this was the pressure required to maintain the fracture with a proportion of the injected fluid still infiltrating within the sample. The propagation pressure of the fracture is directly correlated to the strength of the sample, as higher strength always resulted in higher pressure. The pressure profile shapes are comparable to the ones obtained for cohesionless sand [20] because the pressure was maintained after the fracture opening; however, the cemented specimens’ pressure profiles presented higher peak values.
The pressure profiles of the tests conducted with fine sands at higher flow rates (100, 200, and 400 mL/min) for the lowest and highest cementation level are shown in Figure 4b. The breakdown pressures increased substantially as the flow rate increased. At such high flow rates, once damage occurred within the specimens, the pressure decreased drastically across all cementation levels. This contrasts with the 30 mL/min pressure profiles, in which the breakdown and operating pressures were of the same magnitude.
The difference between initiation pressure and propagation pressure also became more pronounced as the flow rates increased. At the same time, the propagation pressure lowered significantly when the flow rate was very high because the opening was less narrow, and fluid leaked through the fracture, lowering the pressure.
Bio-cemented glass beads of similar grain sizes as the fine sands and medium-grained sands were used to assess the effects of the properties of base materials on the transition between infiltration and fracturing behaviour. Essentially, by varying the base material, a wider range of combinations of strengths and hydraulic conductivities became accessible. The medium-grained sand specimens had generally higher strength and larger hydraulic conductivity compared to fine sand specimens in the range of cementation levels investigated. Fine glass bead specimens had lower strength but similar hydraulic conductivity compared to fine sand specimens. The testing program was similar to that of fine sands (low to high cementation levels at 30, 100, 200, and 400 mL/min).
The fracture patterns obtained across various cementation levels and for various flow rates are presented in Figure 5 for glass beads and medium-grained sands. The infiltration and fracture responses for both materials were similar to the ones obtained in fine sands. At low cementations, along with the cavity-like fractures, dislocation of the particles was also present; while, at higher cementation, the failure was purely tensile. At higher flow rates, less fluid infiltrated through the specimens.
The fracture response of glass beads even for the highly cemented specimens is similar to the patterns obtained for the moderately cemented fine sands (infiltration extent and crack-like fractures accompanied with particle movement), mainly because the latter ones possessed higher strengths. On the other hand, the fractures in moderately cemented medium-grained sands were tortuous and well-defined for moderate to higher cementation levels. Cavity (or borehole) expansion (cavity-like fracture) was evident in higher flow rates in this case. This was due to the larger grain size compared to the other types of sands. The infiltration zones of glass beads and fine sands propagated in a similar rate, while, in medium-grained sands, the infiltration volume and rate were much higher due to their higher hydraulic conductivity.
Figure 6 presents the pressure profiles of both types of materials. Figure 6a and 6c show the pressure profiles for low, medium, and high cementations at 30 mL/min for glass beads and medium-grained sands, respectively. Figure 6b and 6d present the pressure profiles of the highest and lowest cementations for the rest of the flow rates for glass beads and medium-grained sands, respectively. There are many similarities within the pressure profiles obtained for fine sands. At low cementations, the breakdown and propagation pressures had very similar values at 30 mL/min. The difference became more obvious once the cementation level increased or once the damage in the specimen was more extensive. This is induced when higher flow rates are utilised. In medium-grained sands, the decline after the peak pressure was smoother; therefore, there was no clear distinguishment between the breakdown pressure and propagation pressure. This is because the fracture did not propagate ‘stepwise’.
The pressures were higher in glass beads even though they had lower strength compared to fine sands, while the pressures obtained for medium-grained sands were generally lower compared to fine sands. The effects became more pronounced as the flow rate increased, and for lightly and heavily cemented glass beads at a flow rate of 400 mL/min, the pressure limit of the pump was reached, inducing a fracture. At 30 mL/min, the peak pressures obtained with glass beads were of similar magnitude across the whole range of cementation levels. This observation is directly linked to the differences in porosity and hydraulic conductivity that the base materials had.
Fluid injection experiments were conducted with bio-cemented sands with coarse and very coarse grains in order to further examine the effects of hydraulic conductivity and porosity variations and achieve different combinations of strength and hydraulic conductivity. Bio-cemented coarse sands had smaller strengths compared to the bio-cemented specimens generated from medium-grained sands but had similar strengths compared to bio-cemented specimens of fine sands and higher hydraulic conductivity and final porosity. The specimens generated with very coarse particles as the base material had the lowest strength across all sands examined in this study in the range of cementation levels achieved.
Figure 7a shows the tests conducted on medium-sized grains with varying cementation levels at a flow rate of 30 mL/min. The fractures were crack-like and less visible with the naked eye in this case, whilst the breakdown pressures (or initiation pressures, depending on whether a fracture was induced) fluctuated between 127 and 290 kPa. These values were lower compared to the fine sands shown previously falling in the range between 169 and 698 kPa because of the higher hydraulic conductivity of coarse-sized grain sands. A significant amount of the injected fluid was flowing through the pores rather than increasing the pressure required to generate a fracture.
The pressure profiles obtained for relatively low, moderate, and heavily cemented samples are depicted in Figure 8a for flow rates of 30 mL/min. A clear pressure peak was observed in the sample with a cementation level of 7% (270 kPa), which then reduced to about 200 kPa. The specimens with a cementation level of 5% and 7% were damaged to a greater degree compared to the specimen of lower strength. Even stronger medium grain cemented sands (cementation level of 9%) did not experience a fracture, as the pressurisation rate (i.e., increase of pressure over time) was not enough to induce a fracture since these specimens were stronger. The propagation pressures shown in the figure are analogous to the strength of the specimens and hence to the cementation level.
A test was conducted at 100 mL/min and a cementation level of 7%, which is shown in Figure 7b. The specimen broke asymmetrically as a crack-like fracture was generated at the injection point, but it appeared on the surface at a distance from the injection hole. A stronger specimen at a cementation level of 9% was injected at 200 mL/min, but no visible fracture was generated. The pressure continued to increase and reached a value of 3587 kPa before the test was stopped (Figure 8b). It is possible to identify possible initiation and propagation pressures despite the absence of visible fractures; however, the values were close. A combination of 100 and 200 mL/min flow rates was selected for two tests in bio-cemented sands of 7% and 8% cementations. A fracture was evident in one of the two specimens at 1806 kPa at a 7% cementation when the flow rate was 100 mL/min, and it propagated at 200 mL/min at a lower pressure of about 1200 kPa (see Figure 8b), whilst the other specimen (8% cementation) did not show any visible fractures. Despite the fact that this specimen was stronger, the pressures were lower compared to the specimen that was fractured (Figure 8b). At 100 mL/min there was a clear peak at around 800 kPa, which then reduced to 500 kPa. This seems to indicate that a fracture was induced, although it was not visible from the window (possibly through particle-cement bonds), which created a preferential flow path towards the boundaries of the specimen, explaining the lower pressures. The pressures at 200 mL/min in these two tests were of similar magnitude (1200 kPa); however, in the damaged specimen (7% cementation), the pressure showed a declining trend because of the generation of larger fractures. In the specimen with 8% cementation, the pressure continued to increase in a non-linear pattern without any obvious peak, showing that the existing ‘micro’ fracture was enough to increase the hydraulic conductivity of the sample; thus, the fluid infiltrated through the porous medium. However, if the tests were to continue, more pressure would build up (because of the rising trend), and the fracture in the specimen would propagate further.
The last test included flow rates of 100 and 300 mL/min utilising a strong specimen (9% cementation). No cavity-like or crack-like fractures developed; however, the pressure reached the value of 4000 kPa, and the test was stopped since this was the maximum allowable value for the pump system. The pressure profile is also shown in Figure 8b. The pressure profile was not stable, as when it reached the first local peak at 100 mL/min, it continued to increase to reach another peak at around 1900 kPa. Once it was stabilised at 1600 kPa, the flow rate was increased at 300 mL/min, causing the pressure to escalate at 2600 kPa, which then increased up to 4000 kPa, where the test was stopped.
Since it was harder to induce a fracture in coarse-grained specimens, the experimental program in very coarse sands included one test at 30 mL/min with 8% cementation, another one at 300 mL/min with 8% cementation, and three tests at a flow rate of 400 mL/min (5, 8, and 10% cementation). No fracture was induced in any of those, even for the strongest specimen. Figure 9 shows examples of snapshots of the window of coarse sand specimens once the test stopped. The strength and hydraulic conductivity combination in this case was such that the fluid preferred to flow within the granular medium and fill the pores.
The pressure in all cases reached a plateau, and the fluid infiltrated through rather than inducing a fracture (Figure 10). At a flow rate of 30 mL/min, the pressure increased up to 300 kPa approximately and then decreased linearly (Figure 10a). This would indicate a fracture; however, no evidence of this was present in the observation window. The sample with a flow rate of 300 mL/min showed a local maximum; however, the post-peak pressure increased to a higher value than the peak pressure. The post-peak pressures of the tests at 300 mL/min and 400 mL/min were parallel, increasing slowly but steadily at the same rate (Figure 10b). Generally, higher pressures and higher pressurisation rates would be required to generate a fracture, which could be achieved with higher flow rates given that the porous medium is very permeable.
Combinations of tests were conducted at 100 and 300 mL/min and 200 and 300 mL/min, utilising specimens with cementation levels of 8% showing no fracture. The first peak was around 600 kPa and 800 kPa for flow rates of 100 and 200 mL/min, respectively, and once the flow rate was increased to 300 mL/min, the pressure increased at 1400 kPa in both tests. When no fracture was induced, the building of pressure was not affected by the stepwise increase of flow rates, which comes as a contrast compared to the previous tests where a fracture was induced by the higher rates.

3.3. Correlation of the Peak Pressures with the Engineering Properties

Figure 11a shows the correlation of the initiation pressure and the unconfined compressive strength (UCS) in kPa for fine sands. As the strength of the sample increased, a higher pressure was required to generate a fracture. The relationships are all linear, and the increase of the flow rate enhances the contrast of breakdown pressure values across the different strengths of the samples. At 30 mL/min, the minimum and maximum breakdown pressures were in the range between 169 and 698 kPa, and, at 400 mL/min, the range was very different (between 1949 and 4000 kPa). The trends of peak pressures in tests with flow rates of 200 and 400 mL/min were almost identical, and this could be attributed to the transition between infiltration and cavity- or crack-like fracture responses. At such high flow rates, the fracture response dominates over the infiltration of the fluid through the medium.
The fits of the breakdown pressure and hydraulic conductivity are in a power form (Figure 11b). Very small changes in the breakdown pressures were induced when the injection rate was at 30 mL/min. As the flow rates increased, the exponential relationship between breakdown pressure and hydraulic conductivity became more distinct. The differences were also evident in the fracture patterns. Since hydraulic conductivity and porosity for the same base material are controlled by the overall amount of cementation added to the porous medium, similar conclusions were drawn for breakdown pressure and flow rates with respect to porosity.
A similar activity was followed to obtain the correlations with regards to the peak pressures and engineering properties of bio-cemented sands of medium grain size and glass beads as base materials (Figure 11c–f). As can be seen in the figure, a reasonable correlation was obtained between the properties of the specimens and the peak pressure. Similar trends were observed with those of fine sands. As the strength increased across each type of granular material, a higher pressure was required to induce a fracture, while a lower hydraulic conductivity resulted in an exponential increase in the fracturing pressure. The effects of the properties on the infiltration and fracture response mechanisms were more pronounced at higher flow rates. A hydraulic conductivity increase caused a reduction in the required pressure to induce a fracture such as that in fine bio-treated sands.
As discussed previously, in fine sands, the breakdown pressures with flow rates of 200 and 400 mL/min had similar values of 933 and 1112 kPa at 4% cementation, respectively, and nearly 4000 kPa for both cases at 8% cementation. A similar observation can be made for the peak pressures of medium-grained sands for flow rates of 100 and 200 mL/min. At 4% cementation and at 100 mL/min, the peak pressure was 475.4 kPa, and, at 200 mL/min, the difference was marginal with a peak pressure of 458 kPa. At 8% cementation, the peak pressures at 100 and 200 mL/min almost coincide with a value of around 2000 kPa. This was not observed in tests with glass beads, as the peak pressures were different at each of the flow rates. At 400 mL/min, the maximum pressure of the pump system was reached (4000 kPa), which was enough to induce a fracture. These observations show at which flow rate the infiltration behaviour transitions to fracturing behaviour for each of those materials depending on the combined effects of hydraulic conductivity and strength. Hydraulic conductivity defines the maximum velocity of a fluid that can only penetrate through the porous medium (infiltration), while both hydraulic conductivity and strength define the pressure needed to generate a fracture.
In all three materials, the slopes of the trendlines obtained for breakdown pressures with respect to UCS at 100, 200, and 400 mL/min were similar for each material (around 2 for fine sands, 1.5 for glass beads, and 1.1 for medium-gained sands). At 30 mL/min, the slope differs, and this could be attributed to the dominance of infiltration at such low flow rates even after a fracture is seen.
As the average pore size increased, lower pressure was required to generate a fracture, although the specimens of larger pore sizes (medium-grained sands) possessed larger UCS values; thus, they were of higher strength. This was because, apart from the strength of the specimens, the hydraulic conductivity and porosity of the specimens also varied significantly, and it affected the fracturing behaviour to a much greater extent. A portion of the fluid infiltrated the specimen rather than inducing a fracture; therefore, there was no concentration of pressures around the injection point. This explains why bio-cemented glass beads at a flow rate of 400 mL/min required about 4 MPa to generate a fracture, which is the maximum capacity of the available pump system.
This matrix of values between peak pressure and test parameters (flow rate, strength, porosity and hydraulic conductivity) could act as a guide for the development of fluid injection programs, with the target being either the infiltration regime or the fracturing of the formation based on the soil properties and flow rates. The combined effects are examined in the next section.

3.4. Analysis of Peak Injection Pressures

Figure 12a,b shows the breakdown pressures against hydraulic conductivity and porosity for the three base materials in which fractures were generated (fine and medium-grained sands, glass beads) across the four flow rates. The figure shows that, at low flow rates, the trend collapses well into a single fit for the three main types of sands, demonstrating that the hydraulic conductivity and porosity are dominant parameters against strength. As the flow rate increased, the fits became poorer, indicating that the strength came into play. As shown in Figure 12b, the R-squared values for breakdown pressure with respect to porosity were 0.62 for 30 mL/min, 0.57 for 100 mL/min, 0.45 for 200 mL/min, and 0.02 for 400 mL/min. Essentially, no trend was obtained in the set of tests with a flow rate of 400 mL/min with respect to porosity. When the breakdown pressure was plotted against the strength of the specimens for all three base materials, the results were very scattered and did not show any correlation. This relation was examined via dimensional analysis as suggested by Germanovich et al. [66] for cohesionless sands. The dimensional analysis takes away the effects of viscosity, which is useful for the extension of the applicability of the findings of this study to fluids that have different viscosities. As shown in Figure 12c, a reasonable fit with a simple power-law curve fitting was obtained for the two dimensionless parameters ( P p e a k μ κ 3 2 Q and U C S μ κ 3 2 Q ).
The results suggest that peak pressure is clearly dependent on the permeability and porosity of the granular medium, which interacts with the flow rate, and the transition between infiltration and damage of the formation via cracking depends on the previous factors but also on the strength of the specimen. The following two equations have been traditionally used for fluid flows in porous media: the hydraulic fracturing tensile criterion and the pressure differential derived via the Darcy radial flow equation. The former criterion underestimates the peak pressures obtained in this study, while the pressure differential gives very large values (see Supplementary Materials and Appendix A). This shows that none of these parameters can be ignored when scheduling flow injection in porous media near the ground surface. To rank the parameters with respect to their ‘importance’, a random forest model was trained on the experimental dataset following the procedure by Konstantinou and Stoianov [67]. Results suggest that the flow rate is the most important factor, followed by hydraulic conductivity and porosity (see Figure 13a). UCS is the least important factor compared to the rest of the factors. The estimated versus the actual peak pressure values based on the random forest algorithm are shown in Figure 13b with an R-squared value of 0.93.
Germanovich et al. [66] suggested a power law approximation to derive a relation between the peak pressure and several important parameters in their tests for cohesionless materials. Since the materials tested in this study are weakly cemented, the power curve fit was used to relate the flow rate, porosity, and hydraulic conductivity with the peak pressures. In contrast to the random forest algorithm model, the porosity was an insignificant factor in the power–law model; therefore, it was dropped from the model. The resulting equation was P p e a k = 3.21 Q 0.696 k 0.197 U C S 0.054 , giving an R-squared value of 0.9025. The small value of the exponent in UCS suggests that there is a weak dependence on strength compared to permeability and flow rate. The estimated versus the actual peak pressure values are shown in Figure 13b.

3.5. Comparison of the Results Obtained in Weakly Cemented Media against Cohesionless Sands

The fractures obtained in this study were crack-like or cavity-like, while the cavities obtained in the experiments with cohesionless sand were plane-like, as wide cavities were more readily developed due to the volume deformation allowance and due to the more pronounced grain displacement mechanisms evident [20]. Where disaggregation at the grain scale was evident in cemented sands, grains were displaced in clusters. These observations are a sign of the presence of mixed mode failures in contrast to the case of sand, where only shear failure was observed.
The pressure required to generate a fracture was generally higher in the case of cemented sands. However, the pressure profile shapes of the lightly cemented particles were similar to those obtained in uncemented sand. For moderately and heavily cemented sands, especially when higher flow rates were applied, the breakdown and propagation pressures deviated substantially. In the case of cohesionless sand, it was difficult to distinguish between the two pressures, as the pressure reached a plateau once an opening was created. As the material transitioned from sand to weakly cemented soil, with the addition of even a small amount of cementation, the pressure response changed significantly, demonstrating the presence of different failure modes. These findings are significant for groundwater operations as both materials are found in these depths.
The fractures obtained at higher flow rates in uncemented sand resembled the fractures in regime IV (viscous-fingering-dominated regime) obtained by Huang et al. [55] utilising the 2D Hele-Shaw cell. Despite those similarities, the setups were very different. As the authors discussed, the strength of the material and the confining stress level could change the boundaries of these regimes. This is confirmed by the experimental results obtained in this work.
The hydraulic conductivity also affected the results obtained in both experiments with sand and cemented sand. In the former case, the cavities transitioned from crack-like to plane-like as the material became more permeable [20]. When testing cemented sands, all fractures were crack-like; however, as the hydraulic conductivity increased, it became harder to induce fractures. When fractures were generated though, these were of smaller width because it was harder to move clusters of larger grains.

3.6. Applicabilty of the Findings in the Field of Hydrology

The identification of the threshold between the infiltration regime and fracture generation (or flow instability) in weakly cemented porous media is useful in designing applications where the soil/weak rock needs to be intentionally fractured or be injected while avoiding damage to the formation.
The success of in situ remediation of groundwater relies on the accurate delivery of the relevant compounds. Such compounds could be emulsified oils (various oils and oil-in-water emulsions) to treat NAPLs, aqueous colloidal silica suspensions whose viscosity increases with time, or even foams that could be used to desorb pollutants or push the pollutant to a recovery well. Attempts have been made to increase the viscosity of the soluble agents to enhance their transport properties. The injection setup takes various forms, such as pure fluid injection or recirculation through extraction-injection via a well pair with the aim to remediate contaminated groundwater [68,69]. In all these cases, the injection velocity (flow rate) and flow characteristics need to be such that no grain displacement or fracturing takes place, and the material properties such as hydraulic conductivity, porosity, and cohesion (strength) need to be considered [5]. This study identified this transition from infiltration to fracture in various weak porous media (found in shallow depths) but also gave the extent of damage (fracturing) with respect to the properties of the porous medium.
A similar principle was applied in the subsurface injection of liquid waste, in which hydraulic fracturing needs to be avoided, as this would impose risk to water resources (i.e., groundwater). Liquid radioactive solutions are usually disposed via injection, which aims to hydraulically fracture the porous medium; therefore, in such cases, the targeted formation needs to be fractured in a controlled manner. Leaching to groundwater is another application that is directly related to the fluid flow in porous media because of the aspect of the preferential flow or a fluid through the soil [2,3].
The transport of fluids within the porous medium relies on the available pore space. However, flows through fractures or fractured media also receive great research attention since any fluid found in the subsurface could migrate through the fractures instead of travelling through the pore space [4,35,60,70,71,72]. As a result, the groundwater characteristics vary based on induced fractures in the porous medium [73,74]. Usually, such media are addressed via dual porosity models in numerical studies [4,14,35]. The fluid injection experiments conducted in this study are related to these applications since, in most of the tests, the fluid travelled through both the porous medium and the induced fracture.
The applicability of the findings of this study to hydrology-related applications extends also to theoretical studies of flow equations and flow regimes that have been traditionally used in the field of hydrology (i.e., the Forcheimer equation [13], the Kirchhoff-transformed Richards equation [75], diffusion [14], transient flow equations [76], Darcy and non-Darcy flow [77,78], viscous fingering [79]) in which the particle size effects and in general the porous medium properties are of great importance, as they define porosity and permeability. This study could be used to define semi-empirical correlations, which are usually required in these types of studies.
As stated before, water and pure glycerine have similar surface tension values; therefore, the effects and mechanisms are expected to be similar across the two fluids. With the use of dimensionless analysis, the findings of this study could become applicable to fluid injection events with fluids of various viscosities, such as the managed aquifer recharge (MAR) and aquifer storage and recovery (ASR) [1]. In such weak formations, on the one hand, the dislocation of the grains could clog the formation [15], and, on the other hand, fracture might not be the target. Other examples include the effects of soil-water repellency, which was conducted by Wang et al. [80].

4. Conclusions

Fluid injection in porous weak media was carried out by utilising a modified Hele Shaw device to investigate the effects of the hydraulic conductivity, porosity, and strength of the material and flow rates on the flow regimes (infiltration and fracturing behaviour). Five types of granular media were used across various cementation levels, achieving various combinations of material properties.
Two main flow regimes have been identified in bio-cemented sands, namely the infiltration regime and the fracturing or grain displacement regime. Infiltration through the porous medium is a characteristic of soils or weak rocks because of their high porosity and permeability. In the experiments where a fracture was produced, it manifested as a cavity at low cementations, while, at higher cementation levels (hence, higher strength), this fracture transitioned to a more crack-like feature. The infiltration was smaller in high strength materials, showing that the dominant flow regime was the grain displacement regime.
Smaller flow rates favour the infiltration regime over the fracturing regime even for higher cementations, while, in specimens where a fracture was induced and at lower flow rates, the breakdown pressure increased to a lesser extent compared to the experiments with higher flow rates. At higher flow rates, the breakdown pressures were higher, and the propagation pressures were almost zero, showing that the damage was extensive, which in turn proves the dominance of the fracturing regime.
The effects of porosity and hydraulic conductivity were addressed via the generation of bio-cemented specimens from various base materials. The more the grain size increases (hence, the hydraulic conductivity increases), the more the infiltration regime becomes prevalent. In very coarse specimens, only the infiltration regime was present, showing that hydraulic conductivity plays a more important role compared to strength. This was confirmed by the analysis of the peak pressures using a power law fit and random forests.
This work provides insight on the effects of material’s properties and flow rates on the fluid flow/porous medium behaviour. A fluid injection scheme, whether the weak rock needs to be intentionally fractured or be injected with care to avoid damaging, should be carefully designed based on these properties. The findings of this work could aid such schemes (e.g., water decontamination and groundwater remediation) or could be utilised in laboratory scale studies and numerical modelling to understand fluid flow processes in the field of hydrology.

Supplementary Materials

The following supporting information can be downloaded at: https://www.mdpi.com/article/10.3390/hydrology9110190/s1, Figure S1. (a) The pressure differential and (b) the HF pressure Versus the peak pressure obtained in the experiments. Results (Figure S1a) suggest that the pressure differential provides reasonable fits to the experimental data only at low flow rates while at faster flow rates the obtained pressure differential is quite high. The hydraulic fracturing tensile criterion has been also used to relate with the peak pressures (Figure S1b). This criterion underestimates the peak pressures as expected as it does not account for the permeability and flow effects.

Author Contributions

Conceptualization, C.K.; methodology, C.K.; formal analysis, C.K. and G.B.; investigation, C.K.; writing—original draft preparation, C.K.; writing—review and editing, G.B.; visualization, C.K.; supervision, G.B.; funding acquisition, G.B. All authors have read and agreed to the published version of the manuscript.

Funding

This research was funded by bp-ICAM, grant number bp-ICAM39.

Data Availability Statement

The data presented in this study are available in the current article.

Acknowledgments

This work was carried out at the Department of Engineering at the University of Cambridge. We thank Chris Knight and Maria Potamiali for their help. The authors acknowledge the funding and technical support from bp through the bp International Centre for Advanced Materials (bp-ICAM), which made this research possible.

Conflicts of Interest

The authors declare no conflict of interest.

Appendix A

The Darcy radial flow equation was used to calculate the pressure differential, and the results are plotted against the peak pressures obtained in the tests. It accounts for the flow rate and permeability but does not for strength: Q = 2 π · k · h · Δ p μ · ln r e r w , Δ p = Q · μ · ln r e r w 2 π · k · h . The results are shown in Supplementary material.

References

  1. Gibson, M.T.; Campana, M.E.; Nazy, D. Estimating Aquifer Storage and Recovery (ASR) Regional and Local Suitability: A Case Study in Washington State, USA. Hydrology 2018, 5, 7. [Google Scholar] [CrossRef] [Green Version]
  2. de Rooij, G. Modeling fingered flow of water in soils owing to wetting front instability: A review. J. Hydrol. 2000, 231-232, 277–294. [Google Scholar] [CrossRef]
  3. Rezanezhad, F.; Vogel, H.-J.; Roth, K. Experimental study of fingered flow through initially dry sand. Hydrol. Earth Syst. Sci. Discuss 2006, 3, 2595–2620. Available online: www.hydrol-earth-syst-sci-discuss.net/3/2595/2006/ (accessed on 31 August 2022).
  4. Jerbi, C.; Fourno, A.; Noetinger, B.; Delay, F. A new estimation of equivalent matrix block sizes in fractured media with two-phase flow applications in dual porosity models. J. Hydrol. 2017, 548, 508–523. [Google Scholar] [CrossRef] [Green Version]
  5. Zhang, Y.; Wu, J.; Ye, S. Quantification of the fluid saturation of three phases of NAPL/Water/Gas in 2D porous media systems using a light transmission technique. J. Hydrol. 2020, 597, 125718. [Google Scholar] [CrossRef]
  6. Mahmoodi, M.; Rezaei, N.; Zendehboudi, S.; Heagle, D. Fluid dynamic modeling of multiphase flow in heterogeneous porous media with matrix, fracture, and skin. J. Hydrol. 2019, 583, 124510. [Google Scholar] [CrossRef]
  7. Kaczmarek, M.; Marciniak, M.; Szczucińska, A. Experimental studies and modelling of the fluidization of sands. J. Hydrol. 2019, 579, 124205. [Google Scholar] [CrossRef]
  8. Schäfer, G.; Berez, A. Quantification of the hydraulic diffusivity of a bentonite-sand mixture using the water head decrease measured upon sudden flow interruption. Hydrol. Process. 2020, 34, 1934–1948. [Google Scholar] [CrossRef]
  9. Sharma, H.C.; Chauhan, H.S.; Ram, S. Hydraulics of a Well Pumped with Linearly Decreasing Discharge. J. Hydrol. 1985, 77, 281–291. [Google Scholar] [CrossRef]
  10. Ray, S. Modeling leakage pathways in subsurface formations: Fluid drainage through multiple fractures in porous media: Insights from Hele Shaw cell experiments. J. Hydrol. 2017, 547, 489–497. [Google Scholar] [CrossRef]
  11. Gago, P.A.; Raeini, A.Q.; King, P. A spatially resolved fluid-solid interaction model for dense granular packs/soft-sand. Adv. Water Resour. 2019, 136, 103454. [Google Scholar] [CrossRef]
  12. Liu, Z.; Sun, Y.; Guo, W.; Li, Q. Experimental study of the characteristics of gas-injection barrier in two-dimensional porous media. J. Hydrol. 2020, 593, 125919. [Google Scholar] [CrossRef]
  13. Li, Z.; Wan, J.; Zhan, H.; Cheng, X.; Chang, W.; Huang, K. Particle size distribution on Forchheimer flow and transition of flow regimes in porous media. J. Hydrol. 2019, 574, 1–11. [Google Scholar] [CrossRef]
  14. Knorr, B.; Maloszewski, P.; Krämer, F.; Stumpp, C. Diffusive mass exchange of non-reactive substances in dual-porosity porous systems—Column experiments under saturated conditions. Hydrol. Process. 2015, 30, 914–926. [Google Scholar] [CrossRef]
  15. Wang, Y.; Almutairi, A.L.Z.; Bedrikovetsky, P.; Timms, W.A.; Privat, K.L.; Bhattacharyya, S.K.; Le-Hussain, F. In-situ fines migration and grains redistribution induced by mineral reactions—Implications for clogging during water injection in carbonate aquifers. J. Hydrol. 2022, 614, 128533. [Google Scholar] [CrossRef]
  16. Qiao, J.; Zeng, J.; Jiang, S.; Yang, G.; Zhang, Y.; Feng, X.; Feng, S. Investigation on the unsteady-state two-phase fluid transport in the nano-pore system of natural tight porous media. J. Hydrol. 2022, 607, 127516. [Google Scholar] [CrossRef]
  17. Lee, B.H.; Lee, S.K. Probing the water distribution in porous model sands with two immiscible fluids: A nuclear magnetic resonance micro-imaging study. J. Hydrol. 2017, 553, 637–650. [Google Scholar] [CrossRef]
  18. Zhao, J.; Jiang, Y.; Li, Y.; Zhou, X.; Wang, R. Modeling Fractures and Barriers as Interfaces for Porous Flow with Extended Finite-Element Method. J. Hydrol. Eng. 2018, 23, 1614. [Google Scholar] [CrossRef]
  19. Fang, H.; Zhu, J. New Approach for Simulating Groundwater Flow in Discrete Fracture Network. J. Hydrol. Eng. 2018, 23, 1665. [Google Scholar] [CrossRef]
  20. Konstantinou, C.; Kandasami, R.K.; Wilkes, C.; Biscontin, G. Fluid Injection Under Differential Confinement. Transp. Porous Media 2021, 139, 627–650. [Google Scholar] [CrossRef]
  21. Chang, H. Hydraulic Fracturing in Particulate Materials. PhD Thesis, Georgia Institute of Technology, Atlanta, GA, USA, 2004. [Google Scholar] [CrossRef]
  22. Khodaverdian, M.; Mcelfresh, P. Hydraulic Fracturing Stimulation in Poorly Consolidated Sand: Mechanisms and Consequences. In Proceedings of the SPE Annual Technical Conference and Exhibition, Dallas, TX, USA, 1–4 October 2000; pp. 1–13. [Google Scholar]
  23. Wang, L.; Zheng, L.; Singh, K.; Wang, T.; Liu-Zeng, J.; Xu, S.; Chen, X. The effective pore volume of multiscale heterogenous fracture-porous media systems derived from the residence time of an inert tracer. J. Hydrol. 2022, 610, 127839. [Google Scholar] [CrossRef]
  24. Zhang, A.; Aral, M.M. Characterization of CO2 Injection into Deep Saline Aquifers Using Two-Phase Darcy-Forchheimer Flow. J. Hydrol. Eng. 2015, 20, 1097. [Google Scholar] [CrossRef]
  25. Sharma, P.K.; Joshi, N.; Srivastava, R.; Ojha, C.S.P. Reactive Transport in Fractured Permeable Porous Media. J. Hydrol. Eng. 2015, 20, 1096. [Google Scholar] [CrossRef]
  26. Kumar, G.S.; Sekhar, M. Spatial Moment Analysis for Transport of Nonreactive Solutes in Fracture-Matrix System. J. Hydrol. Eng. 2005, 10, 192–199. [Google Scholar] [CrossRef]
  27. Konstantinou, C. Hydraulic Fracturing of Artificially Generated Soft Sandstones. PhD Thesis, University of Cambridge, Cambridge, UK, 2021. [Google Scholar] [CrossRef]
  28. Konstantinou, C.; Biscontin, G.; Jiang, N.-J.; Soga, K. Application of microbially induced carbonate precipitation to form bio-cemented artificial sandstone. J. Rock Mech. Geotech. Eng. 2021, 13, 579–592. [Google Scholar] [CrossRef]
  29. Liu, Q.; Hu, R.; Hu, L.; Xing, Y.; Qiu, P.; Yang, H.; Fischer, S.; Ptak, T. Investigation of hydraulic properties in fractured aquifers using cross-well travel-time based thermal tracer tomography: Numerical and field experiments. J. Hydrol. 2022, 609, 127751. [Google Scholar] [CrossRef]
  30. Zhao, H.; Luo, N.; Illman, W.A. The importance of fracture geometry and matrix data on transient hydraulic tomography in fractured rocks: Analyses of synthetic and laboratory rock block experiments. J. Hydrol. 2021, 601, 126700. [Google Scholar] [CrossRef]
  31. Rubol, S.; Tonina, D.; Vincent, L.; Sohm, J.A.; Basham, W.; Budwig, R.; Savalia, P.; Kanso, E.; Capone, D.G.; Nealson, K.H. Seeing through porous media: An experimental study for unveiling interstitial flows. Hydrol. Process. 2018, 32, 402–407. [Google Scholar] [CrossRef]
  32. Wang, M.; Kulatilake, P.H.S.W. Understanding of hydraulic properties from configurations of stochastically distributed fracture networks. Hydrol. Process. 2007, 22, 1125–1135. [Google Scholar] [CrossRef]
  33. Chen, X.; Gosselin, D.C. Numerical simulation of radial gas flow: Effects of soil anisotropy, well placement and surface seal. J. Hydrol. Eng. 1998, 3, 52–61. [Google Scholar] [CrossRef]
  34. Huang, Y.; Yu, Z.; Zhou, Z. Simulating Groundwater Inflow in the Underground Tunnel with a Coupled Fracture-Matrix Model. J. Hydrol. Eng. 2013, 18, 1557–1561. [Google Scholar] [CrossRef]
  35. Kumar, G.S. Mathematical Modeling of Groundwater Flow and Solute Transport in Saturated Fractured Rock Using a Dual-Porosity Approach. J. Hydrol. Eng. 2014, 19, 986. [Google Scholar] [CrossRef]
  36. Lecampion, B.; Bunger, A.; Zhang, X. Numerical methods for hydraulic fracture propagation: A review of recent trends. J. Nat. Gas Sci. Eng. 2017, 49, 66–83. [Google Scholar] [CrossRef] [Green Version]
  37. Fomin, S.; Hashida, T.; Shimizu, A.; Matsuki, K.; Sakaguchi, K. Fractal concept in numerical simulation of hydraulic fracturing of the hot dry rock geothermal reservoir. Hydrol. Process. 2003, 17, 2975–2989. [Google Scholar] [CrossRef]
  38. Burbey, T.J.; Brandon, R.A. Characterization of a hydraulically induced crystalline-rock fracture. Hydrol. Process. 2016, 30, 3289–3302. [Google Scholar] [CrossRef]
  39. Hajjar, A.; Scholtès, L.; Oltéan, C.; Buès, M.A. Effects of the geometry of two-dimensional fractures on their hydraulic aperture and on the validity of the local cubic law. Hydrol. Process. 2018, 32, 2510–2525. [Google Scholar] [CrossRef]
  40. Papanastasiou, P. The Effective Fracture Toughness in Hydraulic Fracturing. Int. J. Fract. 1999, 96, 258–267. [Google Scholar] [CrossRef]
  41. Sarris, E.; Papanastasiou, P. The influence of pumping parameters in fluid-driven fractures in weak porous formations. Int. J. Numer Anal. Methods Geomech. 2015, 39, 635–654. [Google Scholar] [CrossRef]
  42. Papanastasiou, P.; Papamichos, E.; Atkinson, C. On the risk of hydraulic fracturing in CO2 geological storage. Int. J. Numer Anal. Methods Geomech. 2016, 40, 1472–1484. [Google Scholar] [CrossRef]
  43. Yin, Q.; Ma, G.; Jing, H.; Wang, H.; Su, H.; Wang, Y.; Liu, R. Hydraulic properties of 3D rough-walled fractures during shearing: An experimental study. J. Hydrol. 2017, 555, 169–184. [Google Scholar] [CrossRef]
  44. Konstantinou, C.; Biscontin, G.; Papanastasiou, P. Interpretation of Fluid Injection Experiments in Poorly Consolidated Sands. In Proceedings of the 56th U.S. Rock Mechanics/Geomechanics Symposium, Santa Fe, New Mexico, USA, 26–29 June 2022. [Google Scholar] [CrossRef]
  45. Cui, X.; Zheng, Z.; Zhang, H.; Zhang, C.; Li, X.; Zhu, P.; Chen, Z. Impact of water-rock interactions on indicators of hydraulic fracturing flowback fluids produced from the Jurassic shale of Qaidam Basin, NW China. J. Hydrol. 2020, 590, 125541. [Google Scholar] [CrossRef]
  46. Leven, C.; Sauter, M.; Teutsch, G.; Dietrich, P. Investigation of the effects of fractured porous media on hydraulic tests—An experimental study at laboratory scale using single well methods. J. Hydrol. 2004, 297, 95–108. [Google Scholar] [CrossRef]
  47. Hurt, R.S.; Wu, R.; Germanovich, L.; Chang, H.; Dyke, P.V. On Mechanics of Hydraulic Fracturing in Cohesionless Materials. In Proceedings of the AGU Fall Meeting, Eos Trans, San Francisco, CA, USA, 3–9 December 2005. [Google Scholar]
  48. de Pater, C.J.; Dong, Y. Fracture Containment in Soft Sands by Permeability or Strength Contrasts. In Proceedings of the SPE Hydraulic Fracturing Technology Conference, The Woodlands, TX, USA, 19–21 January 2009; pp. 1–9. [Google Scholar]
  49. de Pater, C.J.; Dong, Y. Experimental Study of Hydraulic Fracturing in Sand as a Function of Stress and Fluid Rheology. In Proceedings of the SPE Hydraulic Fracturing Technology Conference, College Station, TX, USA, 29–31 January 2007; pp. 1–10. [Google Scholar]
  50. Khodaverdian, M. Injectivity And Fracturing In Unconsolidated Sand Reservoirs: Waterflooding Case Study, Offshore Nigeria. In Proceedings of the 44th US Rock Mechanics Symposium and 5th U.S.-Canada Rock Mechanics Symposium, Salt Lake City, UT, USA, 27–30 June 2010; pp. 1–12. Available online: http://www.onepetro.org/mslib/servlet/onepetropreview?id=ARMA-10-139 (accessed on 13 September 2022).
  51. Germanovich, L.N.; Hurt, R.S.; Huang, H. Hydraulic Fracturing in Saturated Cohesionless Materials. In Proceedings of the AGU Fall Meeting, San Francisco, CA, USA, 9–14 December 2007. [Google Scholar]
  52. Chudnovsky, A.; Fan, J.; Shulkin, Y.; Shlyapobersky, J.; Schraufnagel, R. A New Hydraulic Fracture Tip Mechanism in a Statistically. In Proceedings of the 71st Annual Technical Conference and Exhibition (ATCE) of the Society of Petroleum Engineers, Denver, Colorado, 6–9 October 1996; pp. 1–12. [Google Scholar]
  53. Cao, C.; Xu, Z.; Chai, J.; Li, Y. Radial fluid flow regime in a single fracture under high hydraulic pressure during shear process. J. Hydrol. 2019, 579, 124142. [Google Scholar] [CrossRef]
  54. Bohloli, B.; de Pater, C. Experimental study on hydraulic fracturing of soft rocks: Influence of fluid rheology and confining stress. J. Pet. Sci. Eng. 2006, 53, 1–12. [Google Scholar] [CrossRef]
  55. Huang, H.; Zhang, F.; Callahan, P.; Ayoub, J. Fluid injection experiments in two-dimensional porous media. Soc. Pet. Eng. J. vol. 2012, 17, 903–911. [Google Scholar] [CrossRef]
  56. Zhou, J.; Dong, Y.; de Pater, C.J.; Zitha, P.L.J. Experimental Study of the Impact of Shear Dilation and Fracture Behavior During Polymer Injection for Heavy Oil Recovery in Unconsolidated Reservoirs. In Proceedings of the Canadian Unconventional Resources & International Petroleum Conference, Calgary, AB, Canada, 19–21 October 2010; pp. 1–12. [Google Scholar]
  57. Dong, Y. Hydraulic Fracture Containment in Sand; Delft University of Technology: Delft, The Netherlands, 2010. [Google Scholar]
  58. Lei, G.; Liao, Q.; Patil, S. A new mechanistic model for conductivity of hydraulic fractures with proppants embedment and compaction. J. Hydrol. 2021, 601, 126606. [Google Scholar] [CrossRef]
  59. Rhett, D.W.; Teufel, L.W. Effect of Reservoir Stress Path on Compressibility and Permeability of Sandstones. In Proceedings of the SPE Annual Technical Conference and Exhibition, Washington, DC, USA, 4–7 October 1992; pp. 965–972. [Google Scholar] [CrossRef]
  60. Ren, S.; Gragg, S.; Zhang, Y.; Carr, B.J.; Yao, G. Borehole characterization of hydraulic properties and groundwater flow in a crystalline fractured aquifer of a headwater mountain watershed, Laramie Range, Wyoming. J. Hydrol. 2018, 561, 780–795. [Google Scholar] [CrossRef]
  61. Konstantinou, C.; Biscontin, G. Soil enhancement via microbially induced calcite precipitation. In Proceedings of the Tenth International Symposium on Geotechnical Aspects of Underground Construction in Soft Ground, IS-Cambridge 2022, Cambridge, UK, 27–29 June 2022; pp. 765–772. [Google Scholar] [CrossRef]
  62. Konstantinou, C.; Biscontin, G.; Logothetis, F. Tensile Strength of Artificially Cemented Sandstone Generated via Microbially Induced Carbonate Precipitation. Materials 2021, 14, 4735. [Google Scholar] [CrossRef]
  63. ASTM. Compressive Strength and Elastic Moduli of Intact Rock Core Specimens under Varying States of Stress and Temperatures; ASTM International: West Conshohocken, PA, USA, 2004. [Google Scholar]
  64. Sharwood, W.J. The specific gravity of mixtures (discussion). Econ. Geol. 1912, 7, 588–590. [Google Scholar] [CrossRef]
  65. Gago, P.A.; Konstantinou, C.; Biscontin, G.; King, P. Stress inhomogeneity effect on fluid-induced fracture behavior into weakly consolidated granular systems. Phys. Rev. E 2020, 102, 040901. [Google Scholar] [CrossRef]
  66. Germanovich, L.N.; Hurt, R.; Ayoub, J.; Siebrits, E. Experimental Study of Hydraulic Fracturing in Unconsolidated Materials. In Proceedings of the SPE International Symposium and Exhibition on Formation Damage Control, Lafayette, LA, USA, 15–17 February 2012; pp. 1–15. [Google Scholar] [CrossRef]
  67. Konstantinou, C.; Stoianov, I. A comparative study of statistical and machine learning methods to infer causes of pipe breaks in water supply networks. Urban Water J. 2020, 17, 534–548. [Google Scholar] [CrossRef]
  68. Luo, J.; Kitanidis, P.K. Fluid residence times within a recirculation zone created by an extraction–injection well pair. J. Hydrol. 2004, 295, 149–162. [Google Scholar] [CrossRef]
  69. Suk, H.; Chen, J.-S.; Park, E.; Han, W.S.; Kihm, Y.H. Numerical evaluation of the performance of injection/extraction well pair operation strategies with temporally variable injection/pumping rates. J. Hydrol. 2021, 598, 126494. [Google Scholar] [CrossRef]
  70. Naets, I.; Ahkami, M.; Huang, P.-W.; Saar, M.O.; Kong, X.-Z. Shear induced fluid flow path evolution in rough-wall fractures: A particle image velocimetry examination. J. Hydrol. 2022, 610, 127793. [Google Scholar] [CrossRef]
  71. Abbasi, M.; Sharifi, M.; Kazemi, A. Fluid flow in fractured reservoirs: Estimation of fracture intensity distribution, capillary diffusion coefficient and shape factor from saturation data. J. Hydrol. 2019, 582, 124461. [Google Scholar] [CrossRef]
  72. Afzali, S.; Rezaei, N.; Zendehboudi, S.; Chatzis, I. Computational fluid dynamic simulation of multi-phase flow in fractured porous media during water-alternating-gas injection process. J. Hydrol. 2022, 610, 127852. [Google Scholar] [CrossRef]
  73. Tawara, Y.; Hosono, T.; Fukuoka, Y.; Yoshida, T.; Shimada, J. Quantitative assessment of the changes in regional water flow systems caused by the 2016 Kumamoto Earthquake using numerical modeling. J. Hydrol. 2020, 583, 124559. [Google Scholar] [CrossRef]
  74. Saha, G.; Quinn, M. Integrated Surface Water and Groundwater Analysis under the Effects of Climate Change, Hydraulic Fracturing and its Associated Activities: A Case Study from Northwestern Alberta, Canada. Hydrology 2020, 7, 70. [Google Scholar] [CrossRef]
  75. Suk, H.; Park, E. Numerical solution of the Kirchhoff-transformed Richards equation for simulating variably saturated flow in heterogeneous layered porous media. J. Hydrol. 2019, 579, 124213. [Google Scholar] [CrossRef]
  76. Wu, Y.-S.; Pan, L. Special relative permeability functions with analytical solutions for transient flow into unsaturated rock matrix. Water Resour. Res. 2003, 39, 1495. [Google Scholar] [CrossRef] [Green Version]
  77. Wang, L.; Li, Y.; Zhao, G.; Chen, N.; Xu, Y. Experimental Investigation of Flow Characteristics in Porous Media at Low Reynolds Numbers (Re→0) under Different Constant Hydraulic Heads. Water 2019, 11, 2317. [Google Scholar] [CrossRef] [Green Version]
  78. Nelson, R.; Williams, G. Mathematical Treatment of Saturated Macroscopic Flow in Heterogeneous Porous Medium: Evaluating Darcy’s Law. Hydrology 2019, 7, 4. [Google Scholar] [CrossRef] [Green Version]
  79. Sabet, N.; Hassanzadeh, H.; Abedi, J. Dynamics of Viscous Fingering in Porous Media in the Presence of In Situ Formed Precipitates and Their Subsequent Deposition. Water Resour. Res. 2020, 56. [Google Scholar] [CrossRef]
  80. Wang, Z.; Wu, Q.; Wu, L.; Ritsema, C.; Dekker, L.; Feyen, J. Effects of soil water repellency on infiltration rate and flow instability. J. Hydrol. 2000, 231-232, 265–276. [Google Scholar] [CrossRef]
Figure 1. The particle size distributions (PSDs) of the base materials used in this study.
Hydrology 09 00190 g001
Figure 2. Schematic of the modified Hele-Shaw cell and the experimental setup.
Hydrology 09 00190 g002
Figure 3. Example snapshots of the fractures immediately after the failure appeared during glycerine injection experiments in fine bio-cemented sands across various cementation levels (3% to 8%, increasing from left to right) at (a) 30 mL/min, (b) 100 mL/min, (c) 200 mL/min, and (d) 400 mL/min.
Hydrology 09 00190 g003
Figure 4. Pressure profiles obtained during glycerine injection experiments: (a) for three specimens at low (3%), moderate (5%), and high cementation (8%) levels at 30 mL/min, and (b) for the lowest (3%) and highest (8%) cementation levels at flow rates of 100, 200, and 300 mL/min.
Hydrology 09 00190 g004
Figure 5. Example snapshots of the fractures immediately after the failure appeared during glycerine injection experiments at 30, 100, 200, and 400 mL/min in bio-cemented glass beads (first three on the left-hand side) and medium-grained bio-cemented sands (last three on the right-hand side) across various cementation levels: (a) 30 mL/min, (b) 100 mL/min, (c) 200 mL/min, (d) 400 mL/min.
Hydrology 09 00190 g005
Figure 6. The pressure profiles obtained during glycerine injection experiments for: (a) bio-cemented glass beads at three cementation levels at 30 mL/min, (b) bio-cemented glass beads at the lowest and highest cementation levels at flow rates of 100, 200, and 300 mL/min, (c) bio-cemented medium-grained sands at three cementation levels at 30 mL/min ds, and (d) bio-cemented medium-grained sands at the lowest and highest cementation levels at flow rates of 100, 200, and 300 mL/min.
Hydrology 09 00190 g006
Figure 7. Snapshots of the fractures immediately after the failure appeared during glycerine injection experiments at (a) 30 mL/min with cementation level increasing from left to right and (b) for various combinations of flow rates in coarse bio-cemented sands across various cementation levels.
Hydrology 09 00190 g007
Figure 8. The pressure profiles obtained during glycerine injection experiments in coarse sands (a) for three specimens at low, moderate, and high cementation levels at 30 mL/min and (b) for the lowest and highest cementation levels at constant flow rates of 100 and 200 mL/min (7 and 9% cementation, respectively) and at step-like injections at combinations of 100 + 200 mL/min (7 and 8% cementation) and at 100 +300 mL/min (9% cementation).
Hydrology 09 00190 g008
Figure 9. Example of snapshots of the window of coarse sand specimens once the test stopped with no fractures being induced in coarse bio-cemented sands across various cementation levels.
Hydrology 09 00190 g009
Figure 10. The pressure profiles obtained during glycerine injection experiments (a) for specimens at 30, 300, and 400 mL/min and (b) for combinations of flow rates at 100 and 300 mL/min and 200 and 300 mL/min.
Hydrology 09 00190 g010
Figure 11. Correlations of breakdown pressures obtained during fluid injection experiments in bio-cemented sands at various flow rates with respect to (a,c,e) UCS and (b,d,f) Hydraulic conductivity. (a,b) refer to fine sands, (c,d) refer to glass beads, and (e,f) refer to medium-grained sands.
Hydrology 09 00190 g011
Figure 12. Correlations of breakdown pressures obtained during glycerine injection experiments in bio-cemented sands at various flow rates with respect to (a) hydraulic conductivity (m/s) and (b) porosity; (c) dimensionless peak pressure vs. dimensionless stress (strength) for all injection tests.
Hydrology 09 00190 g012
Figure 13. (a) Input parameter importance as determined by the random forest algorithm; (b) predicted Vs. actual peak pressure for the power function fit and the random forest algorithm.
Hydrology 09 00190 g013
Table 1. The characteristics of bacterial and cementation solution injections.
Chemical ComponentConcentration
Bacterial solution (BS)Yeast extract20 g/L
Ammonium sulphate10 g/L
Tris buffer0.13 M
Cementation solution (CS)Calcium chloride0.25 M
Urea0.375 M
Nutrient broth3 g/L
Table 2. The experimental program of the fluid injection experiments.
Type of SandCementation Level RangeFlow Rate (mL/min)
Fine sand3, 4, 5, 6, 7, 830
4, 5, 7, 8100
4, 5, 7, 8200
4, 6, 7, 8400
Glass beads4, 5, 7, 830
4, 6, 8100
4, 6, 8200
4, 6, 8400
Medium-grained sand4, 5, 7, 830
4, 5, 7, 8100
4, 6, 8200
4, 6, 8400
Coarse sand4, 5, 7, 930
7100
9200
7, 8100 + 200
9100 + 300
Very coarse sand830
8300
5, 8, 10400
8100 + 300
8200 + 300
Table 3. The fits of the mechanical and physical properties of the bio-treated specimens.
Type of SandFitR-Squared
UCS = f(Cw)Fine sandUCS = 56.911exp(0.4018Cw)0.88
Glass beadsUCS = 5.8203exp(0.5835Cw)0.98
Medium-grained sandUCS = 91.073exp(0.3847Cw)0.96
Coarse sandUCS = 29.925exp(0.4801Cw)0.97
Very coarse sandUCS = 56.544exp(0.3568Cw)0.90
UCS = f(n)Fine sandUCS = 0.0888n−8.7150.67
Glass beadsUCS = 0.0077n−10.170.78
Medium-grained sandUCS = 0.0045n−11.530.98
Coarse sandUCS = 0.00078n−9.9030.88
Very coarse sandUCS = 0.0053n−9.5260.84
HC = f(Cw)Fine sandHC = 0.0006exp(−0.66Cw)0.98
Glass beadsHC = 0.0002exp(−0.715Cw)0.68
Medium-grained sandHC = 0.0067exp(−0.887Cw)0.70
Coarse sandHC = 0.0308exp(−0.883Cw)0.95
Very coarse sandHC = 7 × 10⁻⁵exp(−0.312Cw)0.64
Publisher’s Note: MDPI stays neutral with regard to jurisdictional claims in published maps and institutional affiliations.

