Article

Hydropedological Characteristics of the Cathedral Peak Research Catchments

by
Rowena Harrison
1,2,*,
Johan van Tol
2 and
Philippe Amiotte Suchet
3
1
South African Environmental Observation Network (SAEON), Grasslands, Forests, Wetlands Node, Montrose, Pietermaritzburg 3201, South Africa
2
Department of Soil, Crop and Climate Sciences, University of the Free State, Bloemfontein 9300, South Africa
3
Biogéosciences, UMR 6282 CNRS, Université Bourgogne, Franche-Comté, 6 Boulevard Gabriel, 21000 Dijon, France
*
Author to whom correspondence should be addressed.
Hydrology 2022, 9(11), 189; https://doi.org/10.3390/hydrology9110189
Submission received: 27 September 2022 / Revised: 19 October 2022 / Accepted: 20 October 2022 / Published: 25 October 2022
(This article belongs to the Topic Hydrology and Water Resources in Agriculture and Ecology)

Abstract

:
It has long been recognised that the role of soils is critical to the understanding of the way catchments store and release water. This study aimed to gain an understanding of the hydropedological characteristics and flow dynamics of the soils of three mountain catchment areas. Digital soil maps of the hydropedological characteristics of the catchments were interpreted and a conceptual response of these watersheds to precipitation was formed. This conceptual response was then tested with the use of site-specific precipitation and streamflow data. Furthermore, piezometers were installed in soils classified as the interflow hydropedological soil group as well as the saturated responsive hydropedological soil group and water table depth data for the three catchments were analysed. Climatic data indicated that there is a lag time effect in the quantity of precipitation that falls in the catchment and the corresponding rise in streamflow value. This lag time effect coupled with data obtained from the piezometers show that the various hydropedological soil groups play a pivotal role in the flow dynamics. Of importance is the unique influence of different wetland systems on the streamflow dynamics of the catchments. The drying and wetting cycles of individual wetland systems influenced both the baseflow connectivity and the overland flow during wetter periods. They are the key focus in understanding the connectivity between the hydropedological flow paths and the contribution of soil water to the stream networks of the three catchments.

1. Introduction

Understanding how catchments store and release water and the resulting ecosystem services they provide is a crucial element in improving the management of these resources [1]. It has long been recognised that the role of soils is critical to these processes. The study of hydropedology as an intertwined branch of soil science and hydrology is used at multiple scales to gain a better understanding of the variability of saturated and unsaturated surface and subsurface environments and how these influence rainfall-runoff processes [2]. Hydropedology has therefore gained popularity in establishing the role of soils in the storage, flow dynamics and connectivity between hillslopes and streams of watersheds [3,4].
Soils are three-dimensional bodies in the landscape with different arrangements of vertical horizons and lateral variability of soil properties [5]. Ref. [6] showed that the quantity and type of soil macropores are variable across short distances, but spatial patterns of preferential flow at the landscape scale are far from being completely random. They instead show a clear pattern comprised of recognizable diagnostic soil horizons, soil materials, and pedons which all display characteristic flow and transport arrangements. Soil water processes can therefore be described in terms of content (volumetric or gravitational), potential (matric, osmotic, and gravitational potentials) and movement (subsurface flows in quantity or in speed). All of these descriptions are variable in time and space, creating multiple differences in the temporal structure of how precipitation moves through a landscape and is then discharged [7].
Despite these variations in soil patterns, the range of specific soil types within a catchment is generally restricted based on location [8]. This distribution of different soil characteristics over a landscape is the key to connecting the pedon scale to the landscape scale [2,9]. These soil patterns are expressed in the different soil forms identified within a catchment area. The periodicity of water movement through a soil causes distinct processes of oxidation and reduction. For example, the vertical and lateral percolation of water through a soil profile can cause the leaching out of iron and manganese, creating a unique set of characteristics that pertain to a particular soil form. In other areas, where there is excess water, soil forms are expressed by an accumulation of organic matter and/or a reduction process within the soil horizons. These specific morphological features in the soil profile are indicators of landscape processes including percolation, lateral flow, and water storage [10]. These different types of flow paths within a catchment area may be isolated or connect the flow paths to a stream network [11]. Thus, the characteristics of a soil profile can be utilised to gain an understanding of hydrological dynamics at landscape scale. A further contributing factor is soil thickness, as this is a key factor in the storage and redistribution of rainfall within the soil profile. It therefore plays an important role in controlling the types of various runoff processes and is often a decisive factor in the processes that generate baseflow as well as overland flow [12].
In mountainous regions, changes within the landscape occur over short distances, and this creates a marked internal (i.e., subsurface) heterogeneity within soils, as well as heterogeneity in the catchment conditions. This makes it difficult to determine the direct measure of how much water is stored within particular areas of the catchment as well as the internal flow dynamics [1]. This is particularly so given the added interrelated influence of climate, geology, topography, and vegetation characteristics on the flow dynamics of these watersheds [3]. The understanding of these processes is important as mountainous headwater catchments provide key water-related services for downstream ecosystems, and the regulation of streamflow by these catchments is highly influenced by their capacity to store and release water [1]. Recent studies have shown that the way in which water is stored and transferred within catchment areas is furthermore a crucial link in generating both base flows and storm flows during precipitation events as well as influences the sediment yield [3,13].
In South Africa, the uKhahlamba-Drakensberg Mountain range is one such area in which the spatial heterogeneity of catchments allows for the study of these various processes over a relatively short distance. Utilising this area, one can gain a deeper understanding of the way in which soil landscape functions control the movement of water in these areas and influence streamflow discharge. This is an initial and important component in understanding how streamflow discharge from these areas impacts the downstream ecosystems.
The aims of this chapter are therefore to gain an understanding of the hydropedological characteristics and flow dynamics of the soils of three mountain catchments within the uKhahlamba-Drakensberg Mountain range. This is achieved through (1) interpreting hydropedological soil maps to conceptualize the hydrological functioning of the catchments in terms of dominant flow paths and storage mechanisms and how these influence the streamflow dynamics and (2) to test the conceptual understanding of the hydropedological character of the catchment areas through a series of site-specific measurements taken within the catchment areas.

2. Materials and Methods

2.1. Study Area

The Cathedral Peak experimental research catchment site forms part of the uKhahlamba-Drakensberg escarpment within the Ezemvelo KZN Wildlife Maloti-Drakensberg Park. The Park is a World Heritage Site and is situated in the northern part of the uKhahlamba-Drakensberg escarpment, KwaZulu-Natal, South Africa. The South African National Environment Observatory Network (SAEON) undertakes the monitoring of the catchment site. There are fifteen research catchments within this site, and these are situated at the head of three isolated Little Berg spurs and are underlain by basaltic lavas, which overlie Clarens Sandstone [14,15]. The catchment areas are mainly covered by mesic grasslands of the uKhahlamba Basalt Grassland vegetation type interspersed with Northern Afrotemperate Forest patches and wetlands [16,17]. The fifteen catchments range in altitude from 1820 m.a.s.l. to 2463 m.a.s.l. Topography varies from relatively flat to very steep (1–39°) with the aspect ranging from north to south facing [18].
Three catchments were selected from the fifteen for this study and are named CP-III, CP-VI, and CP-IX (Figure 1). These catchment areas have similar soil properties, but different historic and current land management practices. General details of the three catchments as well as the climatic hydrologic properties during the study period are provided in Table 1. The study period was from September 2019 to June 2021.

2.2. Climate and Hydrological Monitoring

The Cathedral Peak research catchments fall within the summer rainfall region of South Africa. The mean annual precipitation (MAP) for the area is approximately 1400 mm with a gradient of increasing rain between the south-eastern areas (which receive approximately 1300 mm) to the western areas (receive approximately 1700 mm). CP-III has a MAP of 1564 mm, CP-VI has a MAP of 1340 mm, and CP-IX has a MAP of 1257 mm [15]. Rainfall is measured with tipping bucket rain gauges installed in the mid position of each of the catchments. Half of the rainfall events in the catchments are brought about by localised thunderstorms which fall during the spring and summer months (September to March), with occasional snowfall received during winter (May to August). The clouds forming these thunderstorms come from the west of the catchment areas. Orographic rainfall produced from clouds forming in the east of the catchments also creates longer periods of softer rainfall which can fall for several days [14,15,16,17]. Mean monthly temperatures range from 17.1 °C to 10 °C with frost common in autumn and winter (April to August) [15,17,18,20].
Streamflow monitoring was initiated in the three catchment areas during the late 1940’s and 1950’s [15]. At the outlet of each catchment, a concrete weir and stilling hut with 90-degree V Notches were installed. These V Notches are 45.72 cm deep and are surmounted by 1.82 meter-wide rectangular notches of varying depth. Details of how early measurements were taken, error checked and processed are given in [15]. The water stage-height at each weir is currently monitored using an Orpheus Mini (Ott Hydromet GmbH, Kempten, Germany) at CP-VI weir and a CS451 Stainless steel SDI-12 Pressure Transducers with CR200 loggers at weirs CP-III, CP-VI, and CP-IX [15].
Catchment-specific rainfall and streamflow data were therefore utilised for this study period (September 2019 to June 2021). However, in CP-III and CP-IX accidental fires, weir silting, and equipment problems have led to periods of missing streamflow discharge data. In CP-III there is no streamflow discharge data between February and November 2020, while in CP-IX there is no streamflow discharge data in October 2019 as well as between August and November 2020. These periods of missing data were removed from the database.

2.3. Hydropedology and Soil Mapping

The development of hydropedology studies in South Africa has led to the classification of hydropedological soil types and how these are distributed down a hillslope catena [21]. A digital soil mapping exercise was undertaken for the three catchment areas utilising these hydropedological soil classifications [22]. The procedure used for the digital soil maps (DSMs) is detailed in [19] and is briefly described here. The soils of the three catchment areas were mapped and classified as per the South African classification system [23] and then regrouped into hydropedological soil types, namely shallow recharge soils, deep recharge soils, interflow soils, and saturated responsive soils. The dominant properties of these soils are provided in Table 2.
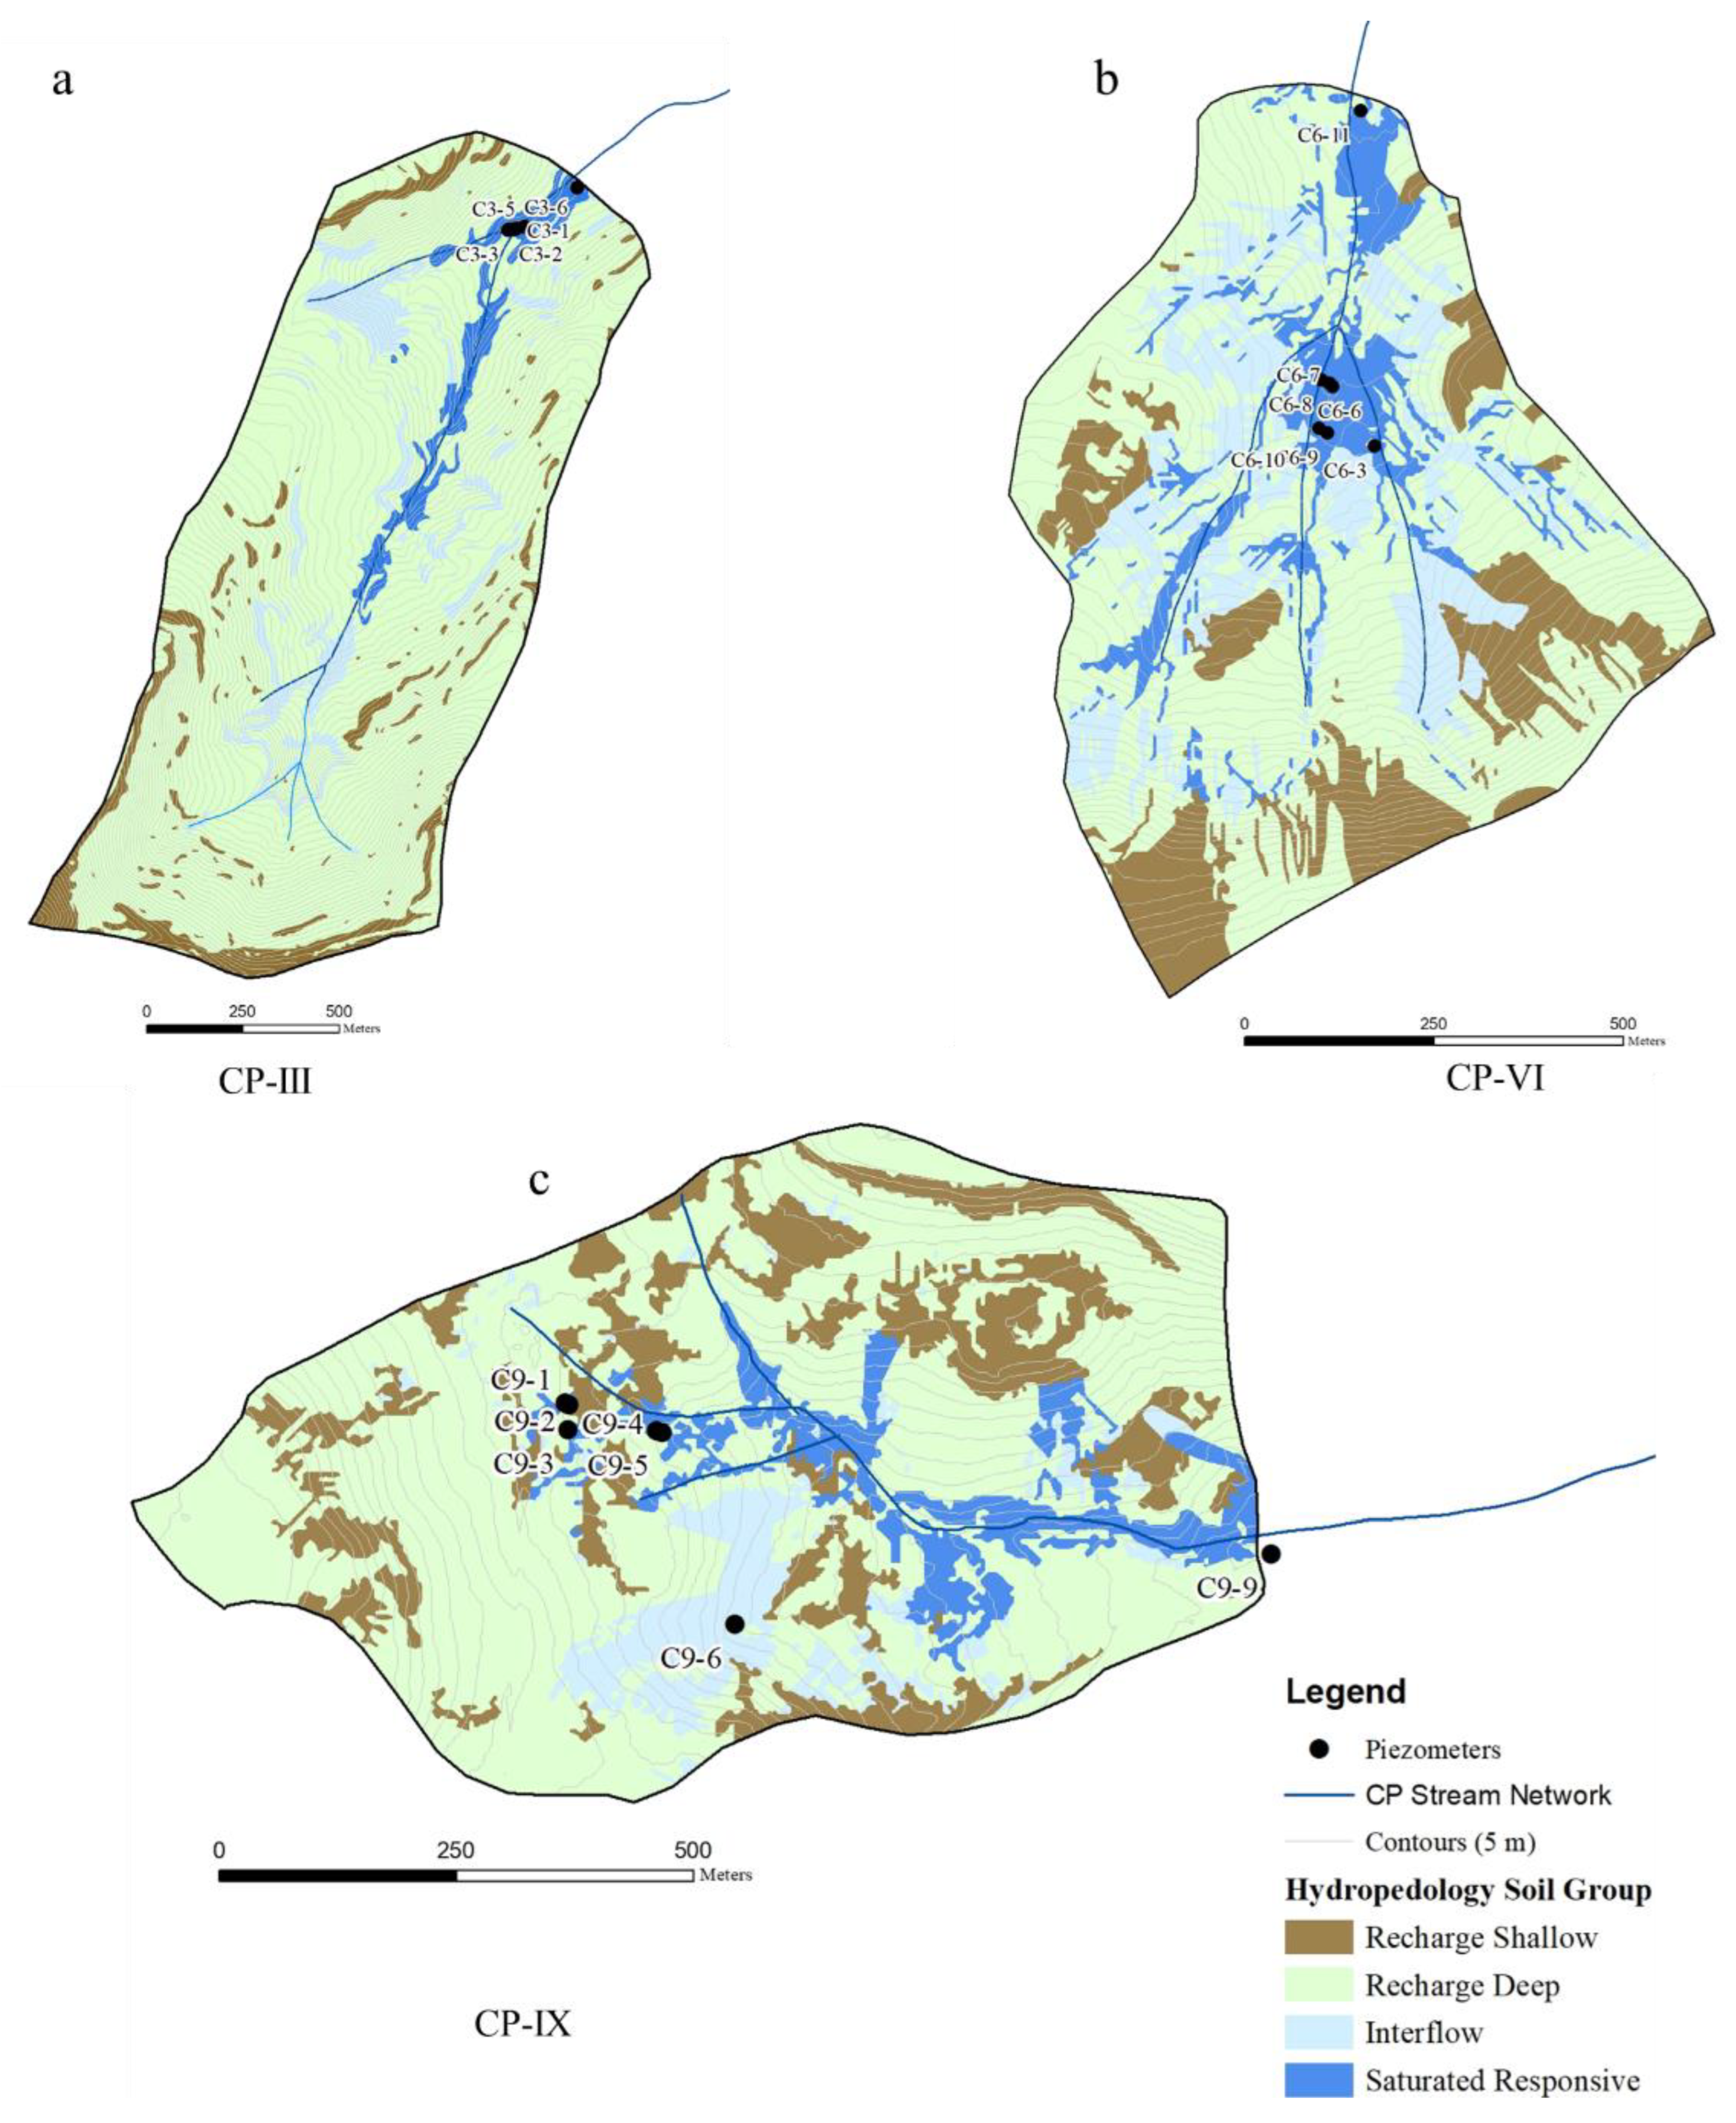
The ArcSIE (Soil Inference Engine) version 10.2.105 was used to create the DSMs. A rules-based approach was first utilised based on knowledge of the catchments as well as the outcomes of the creation of Digital Terrain Models (DTMs) with the following environmental control variables applied to the rules: wetness index, slope, elevation, and planform curvature. The rules applied were aimed at producing the optimal relationships between soil type and a particular DTM [24,25]. The initial maps created following the rules-based approach were then validated based on the information gained during soil surveys undertaken within each of the catchment areas. The maps were refined according to the validation points taken during these surveys. The final hydropedological soil group maps are displayed in Figure 2. The performance of the ArcSIE interface to create the combined hydropedological maps for each of the catchments was analysed using the Kappa coefficient of agreement. The Kappa coefficient for CP-III is 0.57, for CP-VI is 0.59, and for CP-IX is 0.74, showing that there are some discrepancies between the hydropedological soil maps created and the site-specific soils identified within the catchment areas.

2.4. Dominant Hydropedological Soil Groups of the Catchments

Comparison of the hydropedological soil group maps revealed that each catchment had a different percentage of the various hydropedological soil groups. This is based on the different topographies of the catchments as well as the various soil characteristics of each hydropedological soil group [19]. Table 3 gives an indication of the dominant hydropedological soil groups in CP-III, CP-VI, and CP-IX.
As shown in Table 3, CP-III, CP-VI, and CP-IX are dominated by the recharge deep hydropedological soil group (43.3, 38.8 and 38.4% of the catchment area, respectively), followed by the interflow soil group in CP-III (24.1%) and CP-VI (28.7%), and the recharge shallow group in CP-IX (27.6%). CP-VI has a greater area classified as responsive saturated soils (20.4%) as compared to CP-III (14.3%) and CP-IX (18.1%).
By utilising the hydropedological soil group maps as well as the dominant groups identified in each catchment, a theoretical interpretation of the various flow paths for each catchment was identified and described.

2.5. Piezometer Installations

Piezometers were installed within the three catchments: six piezometers in CP-III, twelve in CP-VI, and nine in CP-IX. The piezometers were installed in clusters of two or three within a location, with this location chosen to represent the upper, mid, and lower portions of the catchments. Furthermore, the position of the piezometers was chosen within wetland and seepage areas of the catchments. In CP-III, all piezometers were, however, installed in the lower sections of the catchment area as a result of a lack of seepage areas within the upper portions of the catchment. This is due to the shallow nature of soils within the upper reaches of this catchment.
Soil profiles were dug using an extension Dutch auger to refusal with signs of a gleyic or gley horizon noted within the profiles. These horizons display gleying and are considered indicators of the redox state of the soil. Gley horizons are recognised by low chroma grey matrix colours which may contain blue or green tints. The gleyic horizon displays low chroma, grey and light-yellow colours, with the morphology of this horizon indicating less reduction and shorter duration of water saturation compared to the gley horizon [21]. A PVC pipe with slits cut around the end of the pipe to a height of 30 cm were then installed into the auger holes. The diameter of the PVC pipe utilised ensured a close fit with the hole. The piezometers were then capped, and measurements taken once a month between January 2019 to June 2021; however, due to a drought within the region, the majority of piezometers only received water in September 2019 and thus this was chosen as the start point for comparison of water levels.
As a result of the drought conditions, some of the piezometers had to be discontinued, and thus water was sampled and water heights were recorded each month in five piezometers in CP-III, seven piezometers in CP-VI, and seven piezometers in CP-IX (Figure 2). The height of the water within the piezometer was calculated from the surface of the soil to the depth of the water table.

3. Results and Discussion

3.1. Conceptual Response Based on Hydropedological Interpretations

From the hydropedological soil maps created for each catchment coupled with the descriptions of these dominant soil groups, the principal hillslopes and flow paths could be conceptually described. These conceptual descriptions were used as a working hypothesis of the catchments’ function. The conceptual descriptions are then evaluated against site-specific measurements.
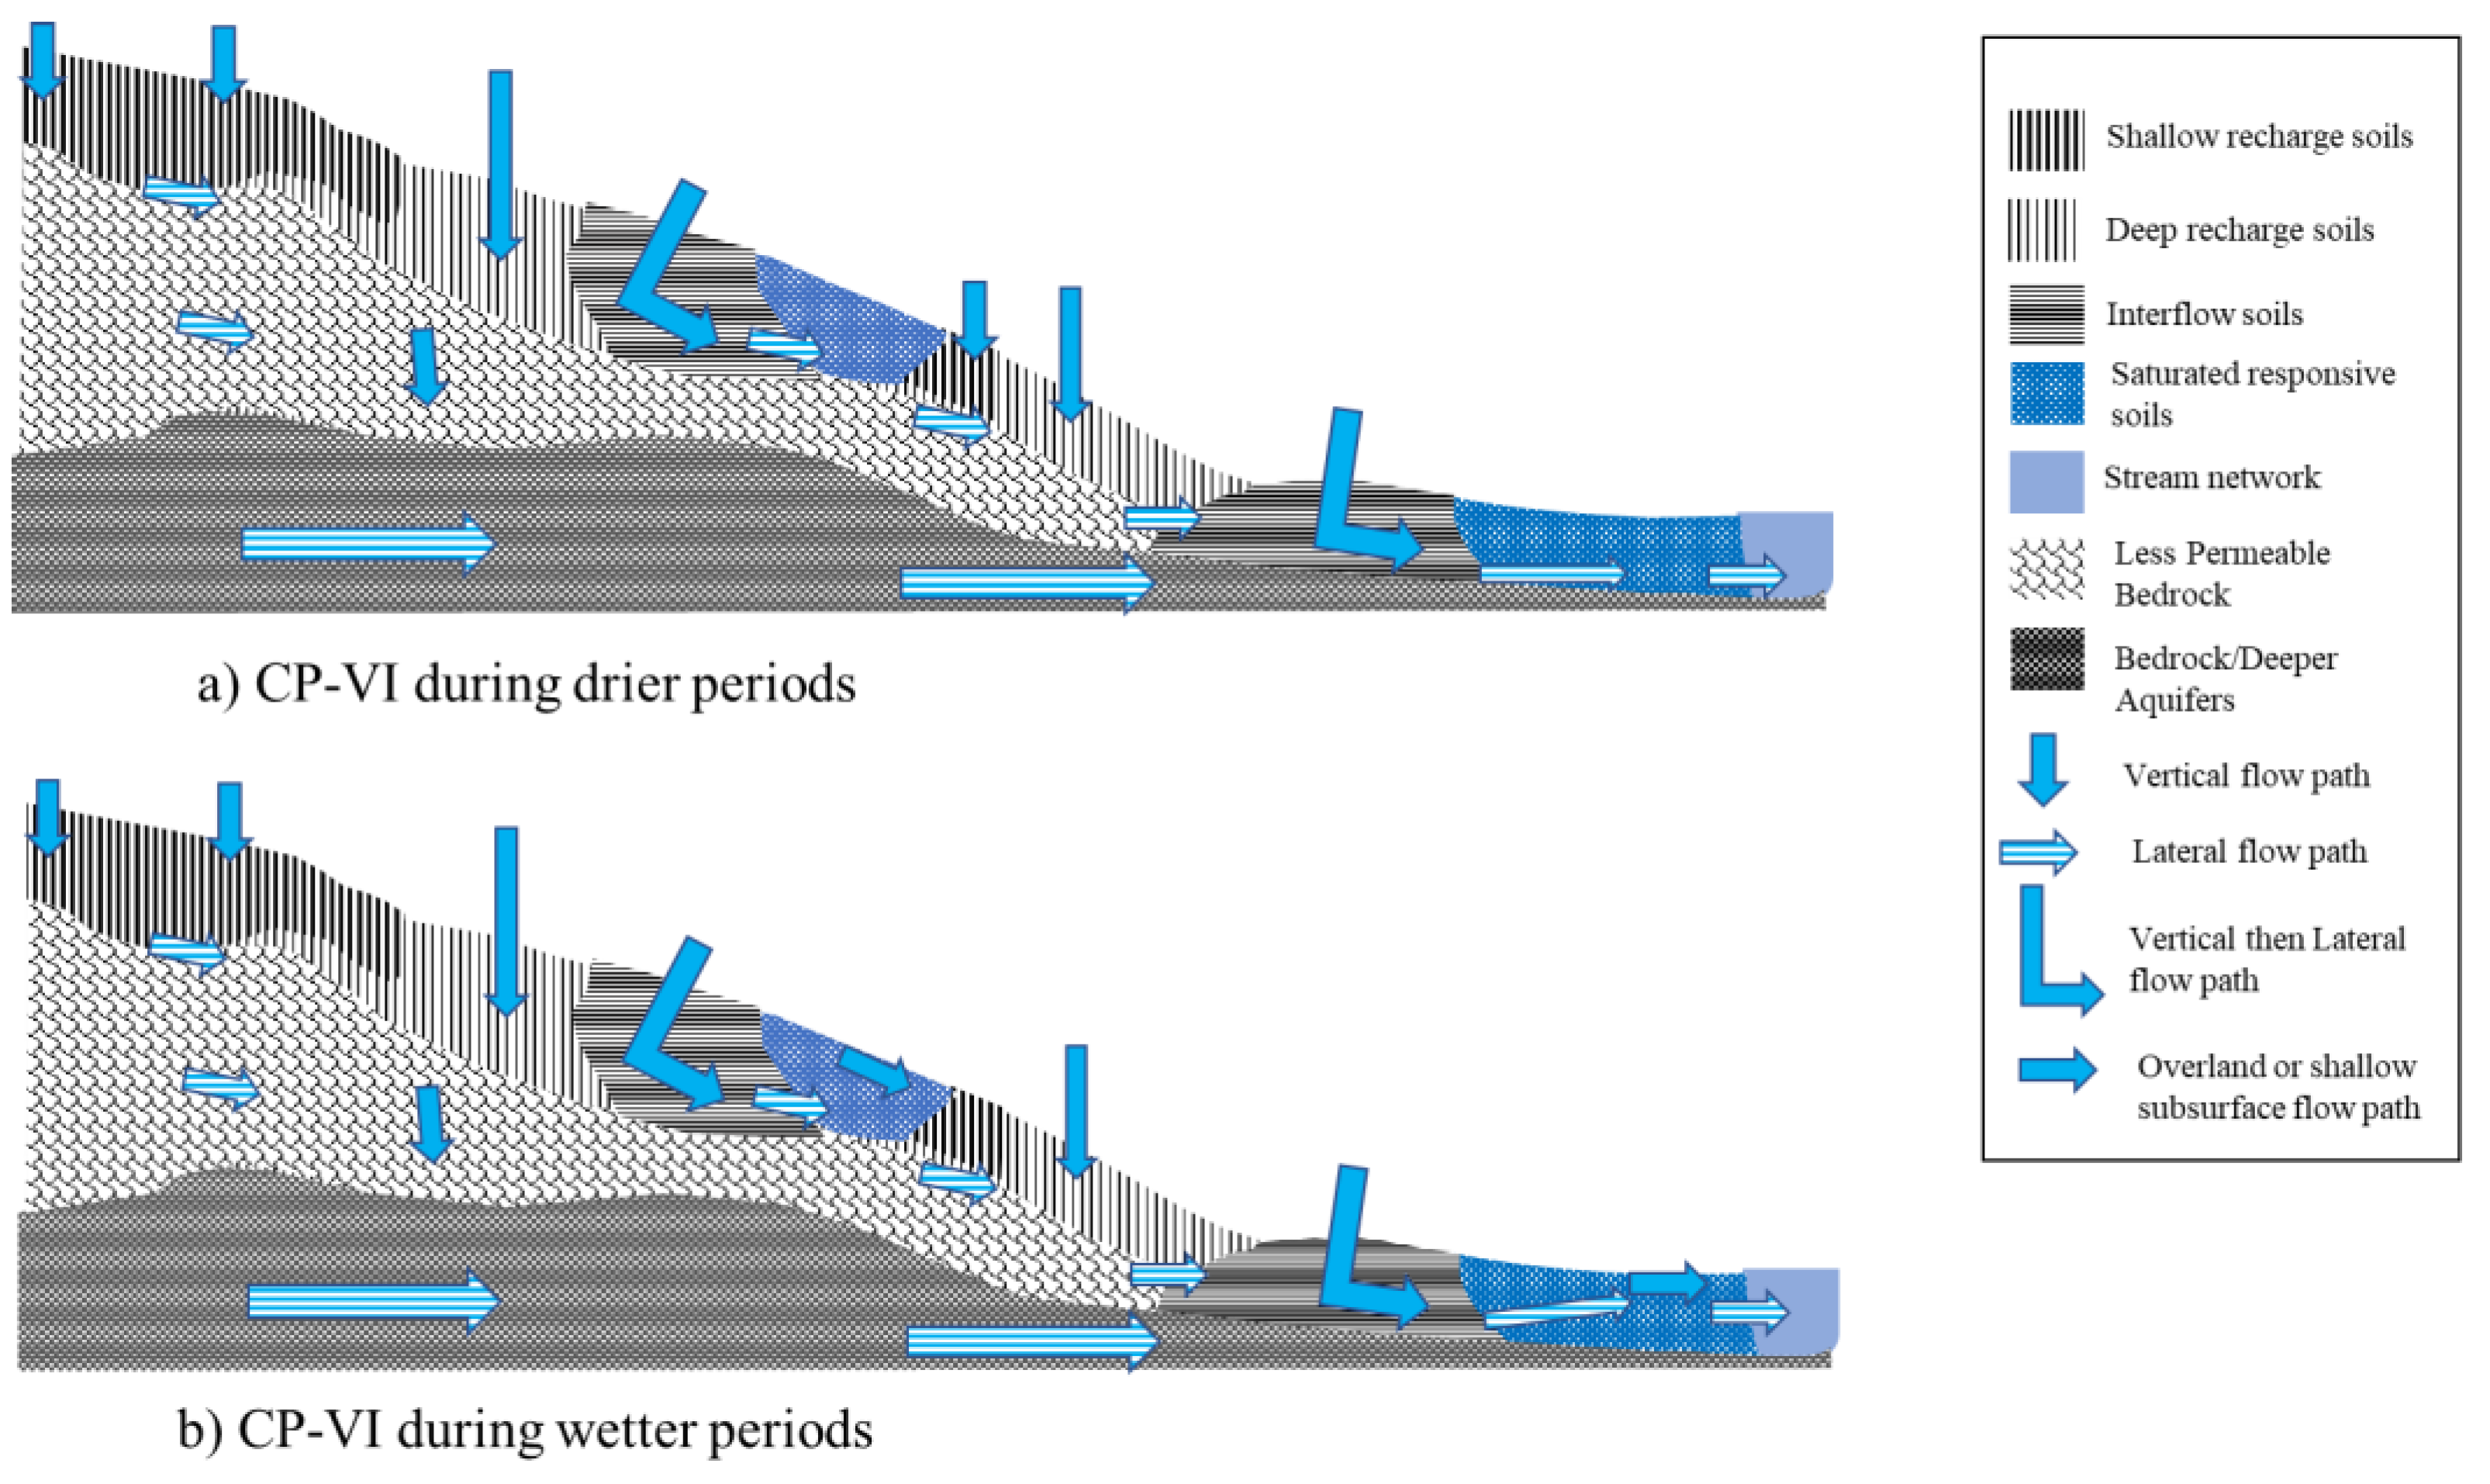
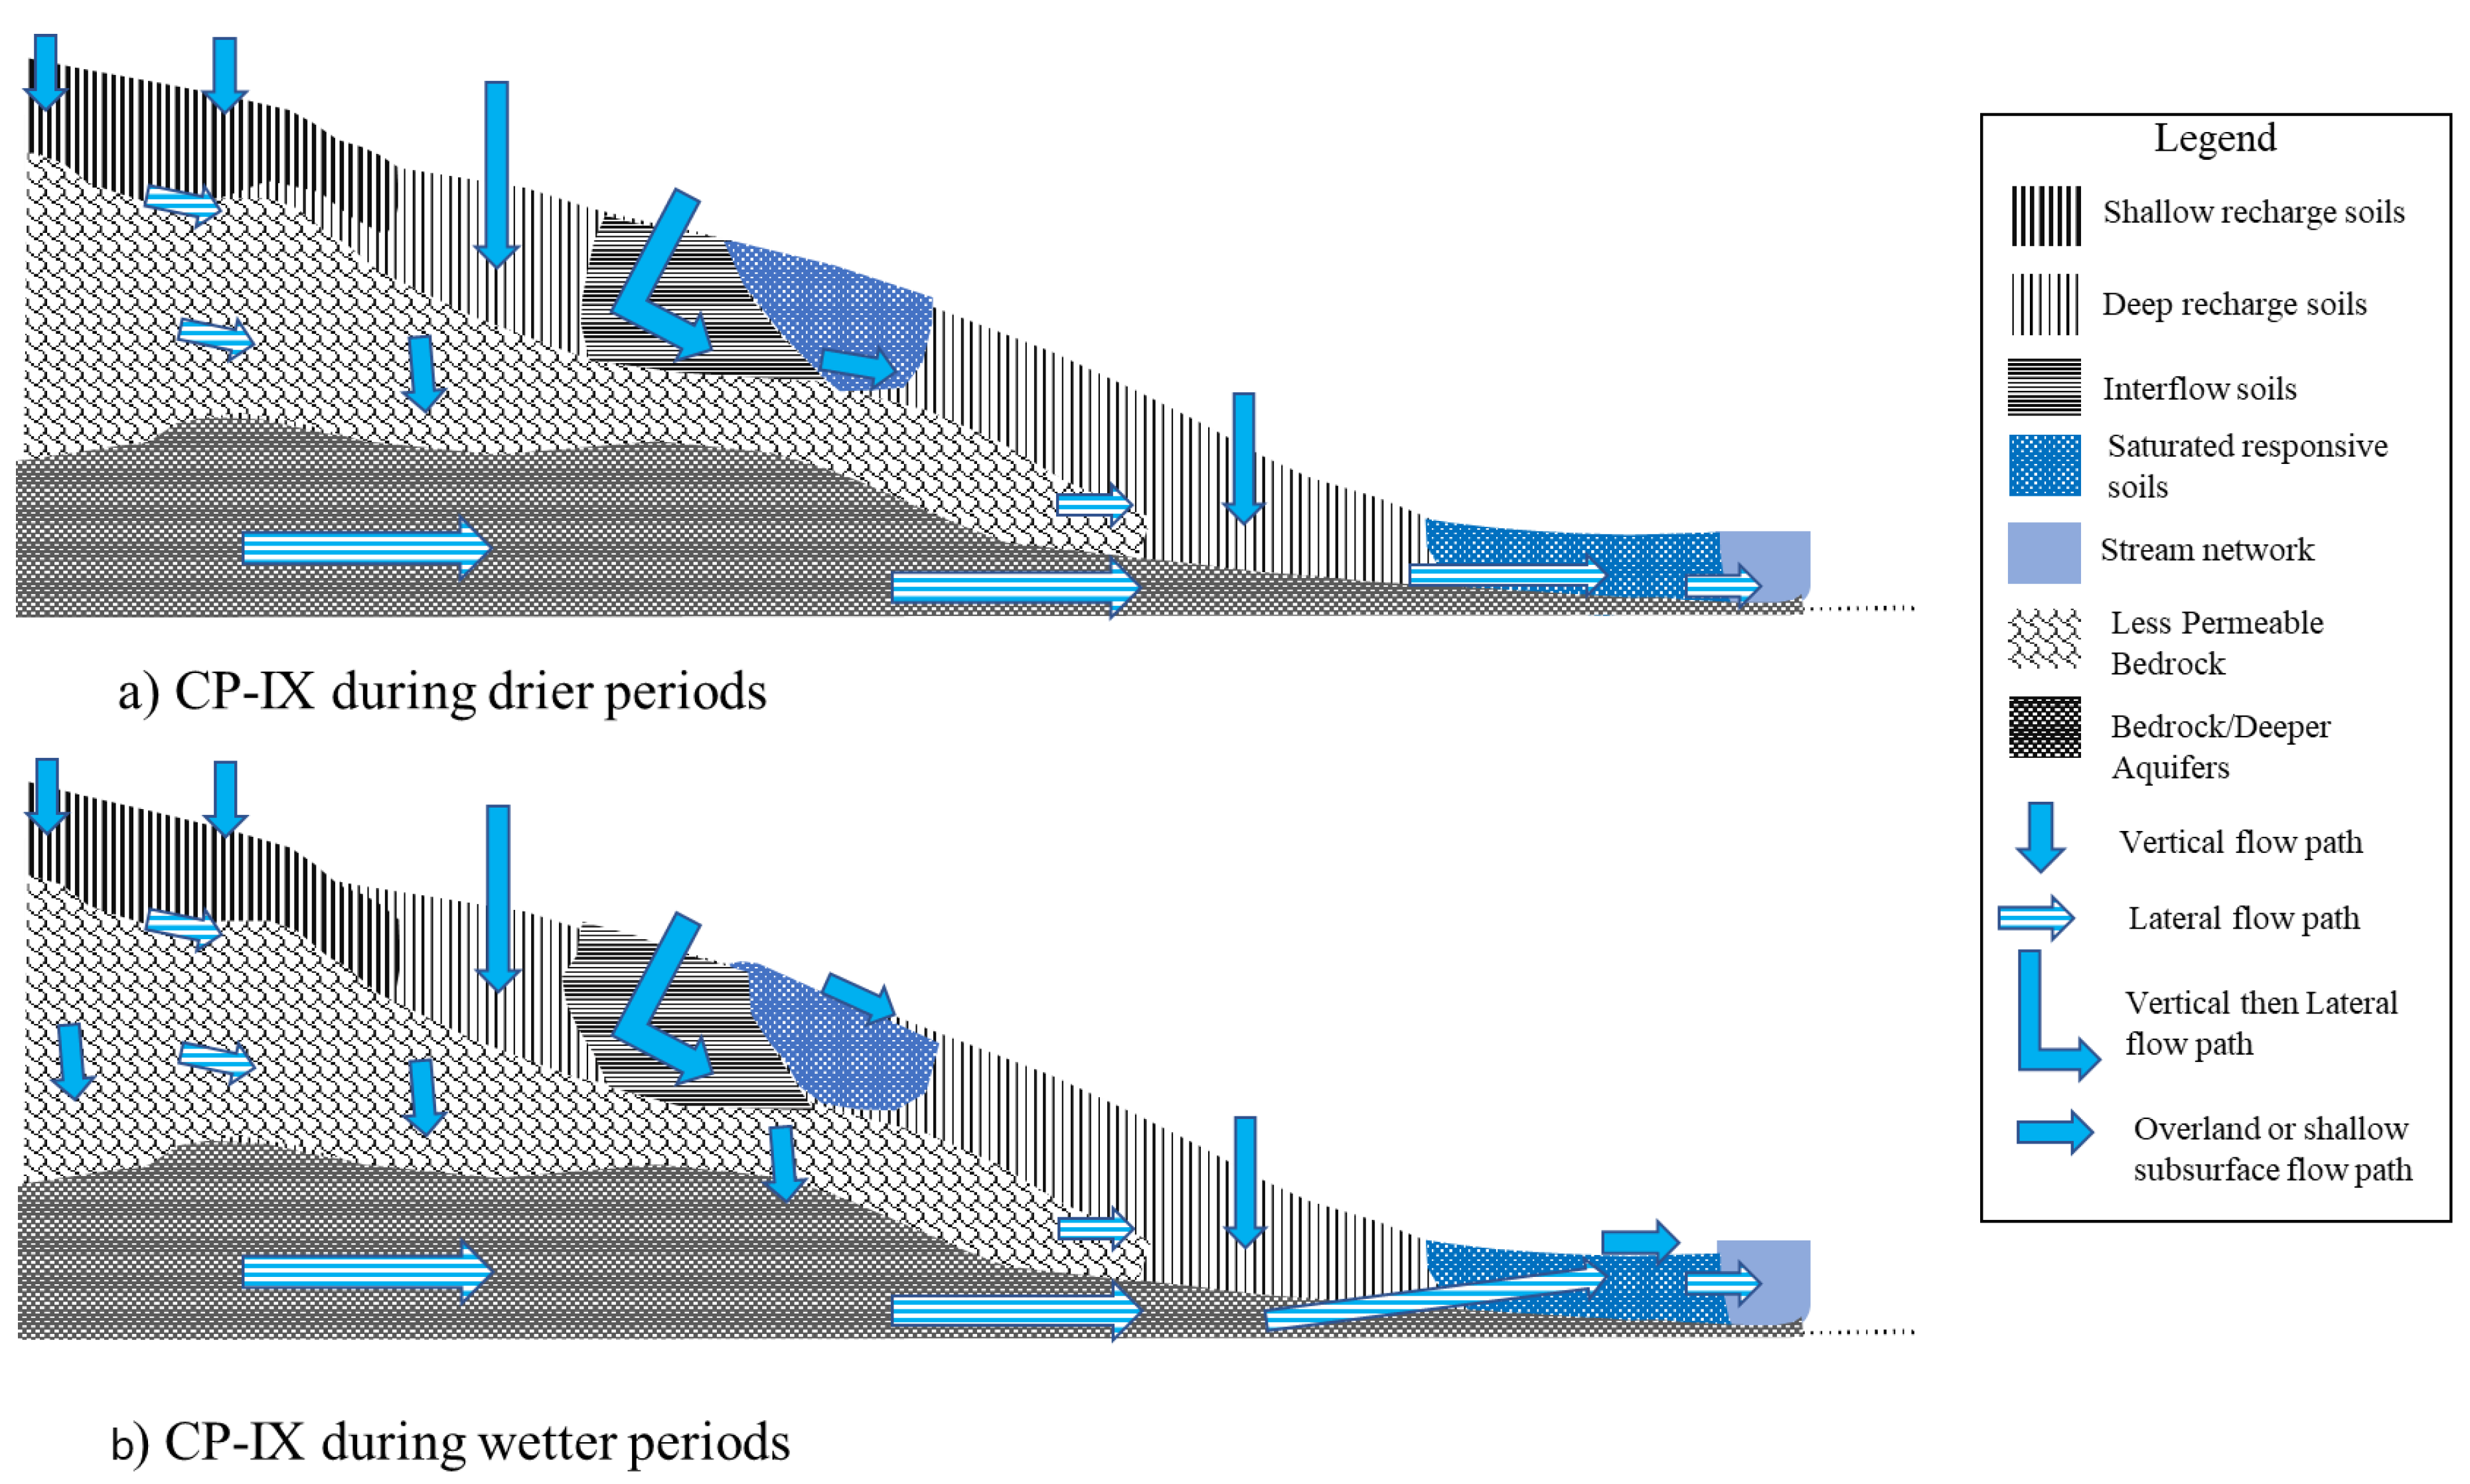
When precipitation falls in the upper reaches of the three catchment areas, it will enter the hydropedological recharge soil group. The dominant flow direction in recharge soils is the vertical flow of water through and out of the profile into the underlying bedrock. In the three catchment areas, this hydropedological soil group is separated into the recharge shallow soils and the recharge deep soils. Recharge shallow soils occur in the steeper areas of the catchments, and this forms their shallow nature (<500 mm). In this soil group, the freely drained B horizon merges with fractured rock or a lithic horizon. The recharge deep soils are similar to the recharge shallow soils, but the thickness of the profile is far greater (>500 mm). This is largely due to their position within gentler topographical areas of the catchments. Water that moves through these soils would recharge the deeper aquifers associated with the catchment areas, or if it encounters less permeable rock such as non-weathered and compacted sandstone or basaltic outcrops; it will flow laterally, and recharge shallow aquifers associated with seasonal hillslope seepage areas.
Interflow soils located downgradient of the recharge soils are associated with two dominant flow paths. Precipitation would first flow vertically through the free-draining upper profile of these soils before it encounters relatively impermeable bedrock. Hydromorphic properties have developed at this point in the soil profile, signifying periodic saturation associated with a water table. At this soil, bedrock interface water will move laterally into the stream network or downgradient.
The responsive saturated soils are located in the permanently saturated wetlands of the catchment areas. These soils show morphological evidence of long periods of saturation such as a gleyed matrix as well as mottling. They are close to saturation, particularly during the wet season, and once saturated and incapable of attenuating any more water they will generate overland flow to the stream network.

3.2. Precipitation and Streamflow Dynamics

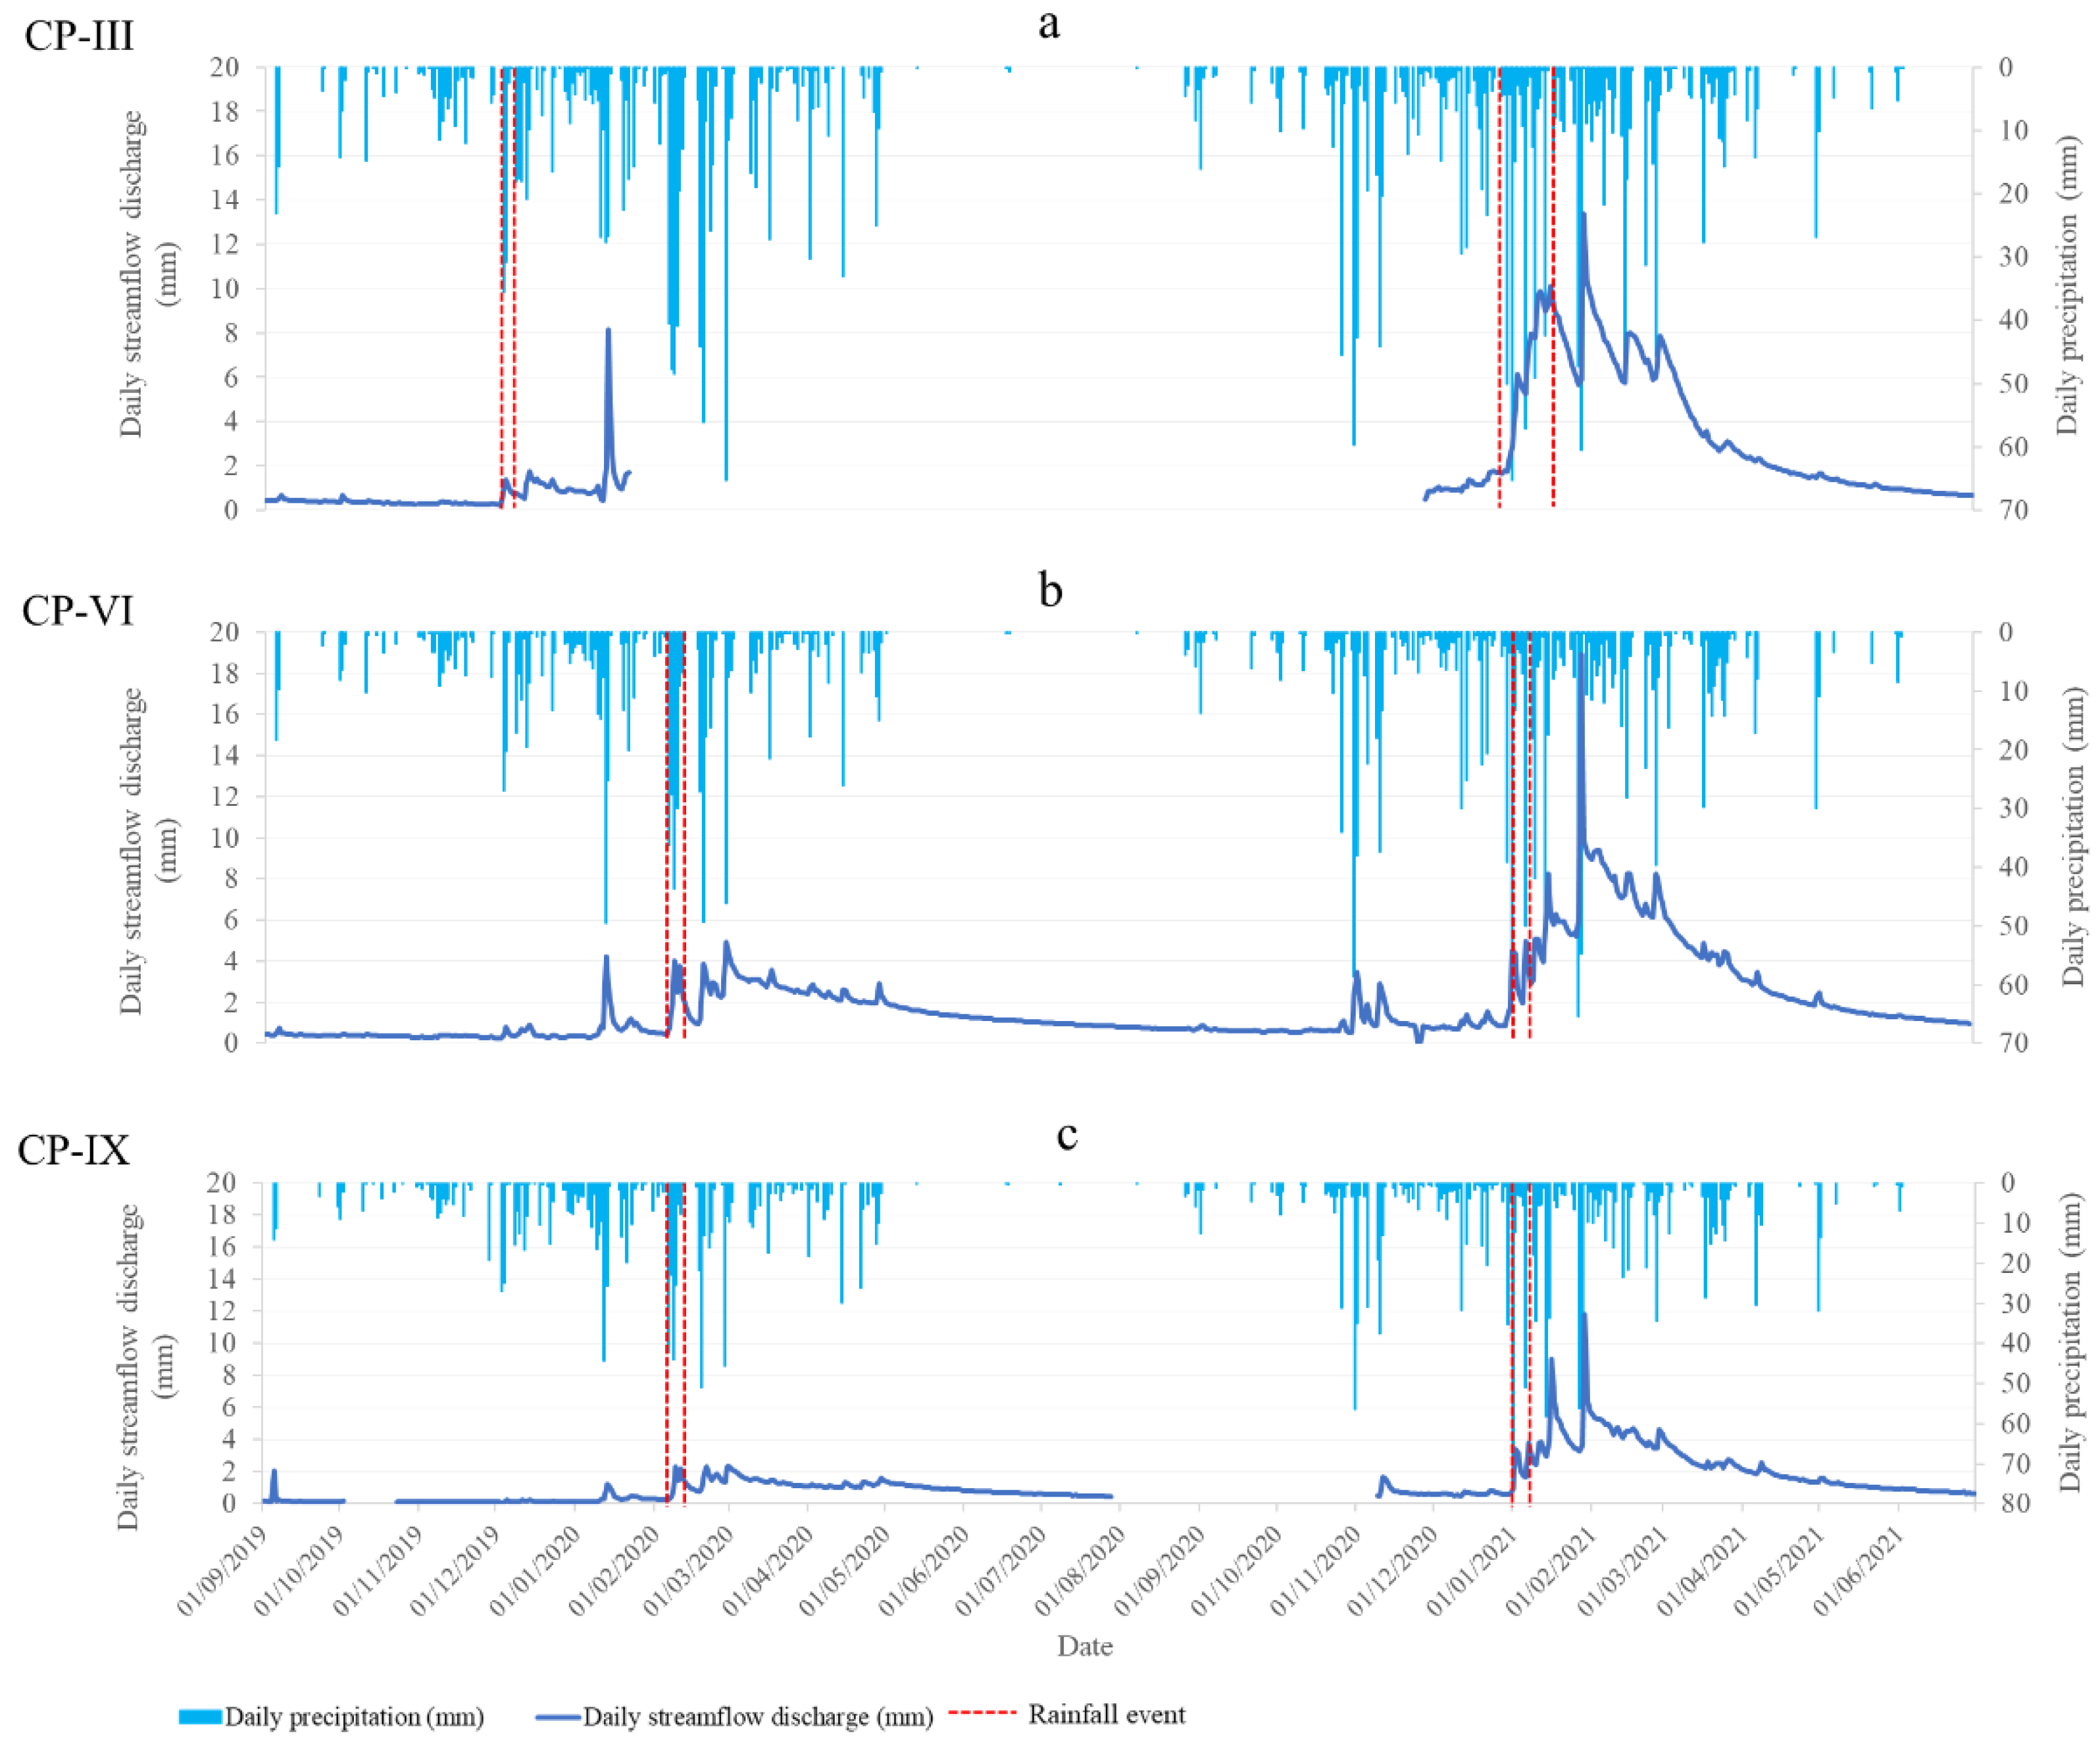
Precipitation data for CP-III, CP-VI, and CP-IX during the study period September 2019 to June 2021 showed that precipitation largely falls within the spring–summer months (September to March) with little to no rain within the autumn and winter months (April to August) (Figure 3). There is a decline in annual rainfall from CP-III to CP-VI to CP-IX. Furthermore, a greater quantity of precipitation was recorded in all three catchments for the spring–summer season of 2020–2021 (CP-III = 1492 mm, CP-VI = 1307 mm and CP-IX = 1045 mm) as compared to the same season within the preceding year (2019–2020) as a result of the drought conditions experienced in 2019 (CP-III = 1150 mm, CP-VI = 842 mm, and CP-IX = 771 mm).
Streamflow discharge values, like the precipitation values, were highest during the spring–summer months, and lowest during the autumn–winter months. Streamflow discharge for the study period also varied between catchment areas, with the greatest values obtained in CP-VI (ranged from 0.0 mm to 18.89 mm), followed by CP-III (ranged from 0.2 mm to 13.39 mm) and CP-IX (ranged from 0.0 mm to 11.81 mm).
The correlation between rainfall and streamflow values is non-linear, particularly during the drier period associated with the drought conditions in 2019 as well as the seasonal variations in the quantity of rainfall received. This is due to a lag time effect in the quantity of precipitation that falls in the catchment and the corresponding rise in streamflow value that is noticeable when comparing daily precipitation and daily streamflow discharge values within all three catchment areas over the study period. As shown in Figure 3, a lag time effect occurs in all three catchments from when a rainfall event occurs to when there is a corresponding increase in streamflow discharge. This lag time differs depending on the pre-rainfall event hydrological conditions of the catchment. For example, following the end of the drought conditions experienced in the catchment areas in 2019, the first large rainfall event took place between 06/02/2020 and 11/02/2020 in which 153.67 mm fell into the CP-VI. Given the largely desiccated conditions of the soils within CP-VI at the time, there is little effect of this rainfall event on the streamflow discharge values during the same time period (streamflow discharge has a combined value of 15.34 mm over the 5 days). No corresponding increase in streamflow discharge takes place during the time of the rainfall event as well as within the following month after the rainfall event. When a similar rainfall event took place in CP-VI but during the wetter season from 01/01/2021 to 06/01/2021, in which 138.94 mm of rain fell, there was a corresponding increase in streamflow discharge approximately 1 month after the event from 29/01/2021 to 04/02/2021 (streamflow discharge has a combined value of 65.34 mm for the time period).
In CP-IX, a similar trend was noticed. Just after the drought of 2019, the same larger rainfall event between 06/02/2020 and 11/02/2020 in which 139.45 mm fell had little effect on the streamflow discharge both at the time of the event and within the following month after the event. Again, the desiccated soils were becoming saturated before they could contribute to the streamflow. During the same rainfall event as in CP-VI, which occurred between 01/01/2021 to 06/01/2021 in which 136.91 mm of rain fell, there was a corresponding increase in the streamflow discharge approximately one month after the event where the streamflow discharge had a combined value of 45.43 mm for the time period from 29/01/2021 to 04/02/2021. Given the wetter time in which the storm event occurred, the soils in the catchment were already partially saturated, thus storm events which occurred during this time could lead to oversaturation of the wetlands and the subsequent creation of overland and shallow subsurface flow which contributed to the increase in streamflow discharge values.
Given the limited streamflow data available for CP-III, obtaining correlation examples between rainfall and streamflow discharge were not possible. However, a similar trend was noted in comparison to CP-VI and CP-IX, particularly in the time after the drought period. Following the drought period, a rainfall event occurred between 03/12/2019 and 06/12/2019 in which 69.08 mm of rain fell. Little effect on the streamflow discharge was observed during the event as well as within the following month after the event. The wetlands in this catchment were, as in CP-VI and CP-IX, becoming saturated again. However, unlike CP-VI and CP-IX, once the wetlands were saturated, the corresponding rise in streamflow discharge values following a rainfall event responded at a much quicker rate. For example, a rainfall event takes place from 28/12/2020 to 15/01/2021. There is an immediate increase in streamflow discharge values both during the event and in the following days after the event, with the streamflow values peaking (13.39 mm) on the 29/01/2021 following a 60.45 mm rainfall event the preceding day.
So, while the hydrological preconditions of the soil groups in all three catchments play a pivotal role in the storage and runoff dynamics of the catchment areas, in CP-III there is a far more immediate response in streamflow discharge following a rainfall event. This could be attributed to the topography of the catchment, the streamflow network or the shallower soils within this catchment, which have largely been created as a result of erosion brought about by the use of the catchment as a Pinus patula plantation.

3.3. Piezometer Data and Flow Paths

The water table height within the areas where piezometers were installed varied throughout the study period and was dependent on the depth of the soil profile, the location of the piezometer within the catchment (i.e., the topographical position) as well as seasonal climatic variations. Average depths to the water table showed that, following the end of the drought conditions, the saturated responsive soils became saturated and remained so throughout the study period, while the depth to the water table within the interflow soil group showed greater variation in all three catchment areas. The three catchment areas are explained in more detail in the following sections.

3.3.1. CP-III

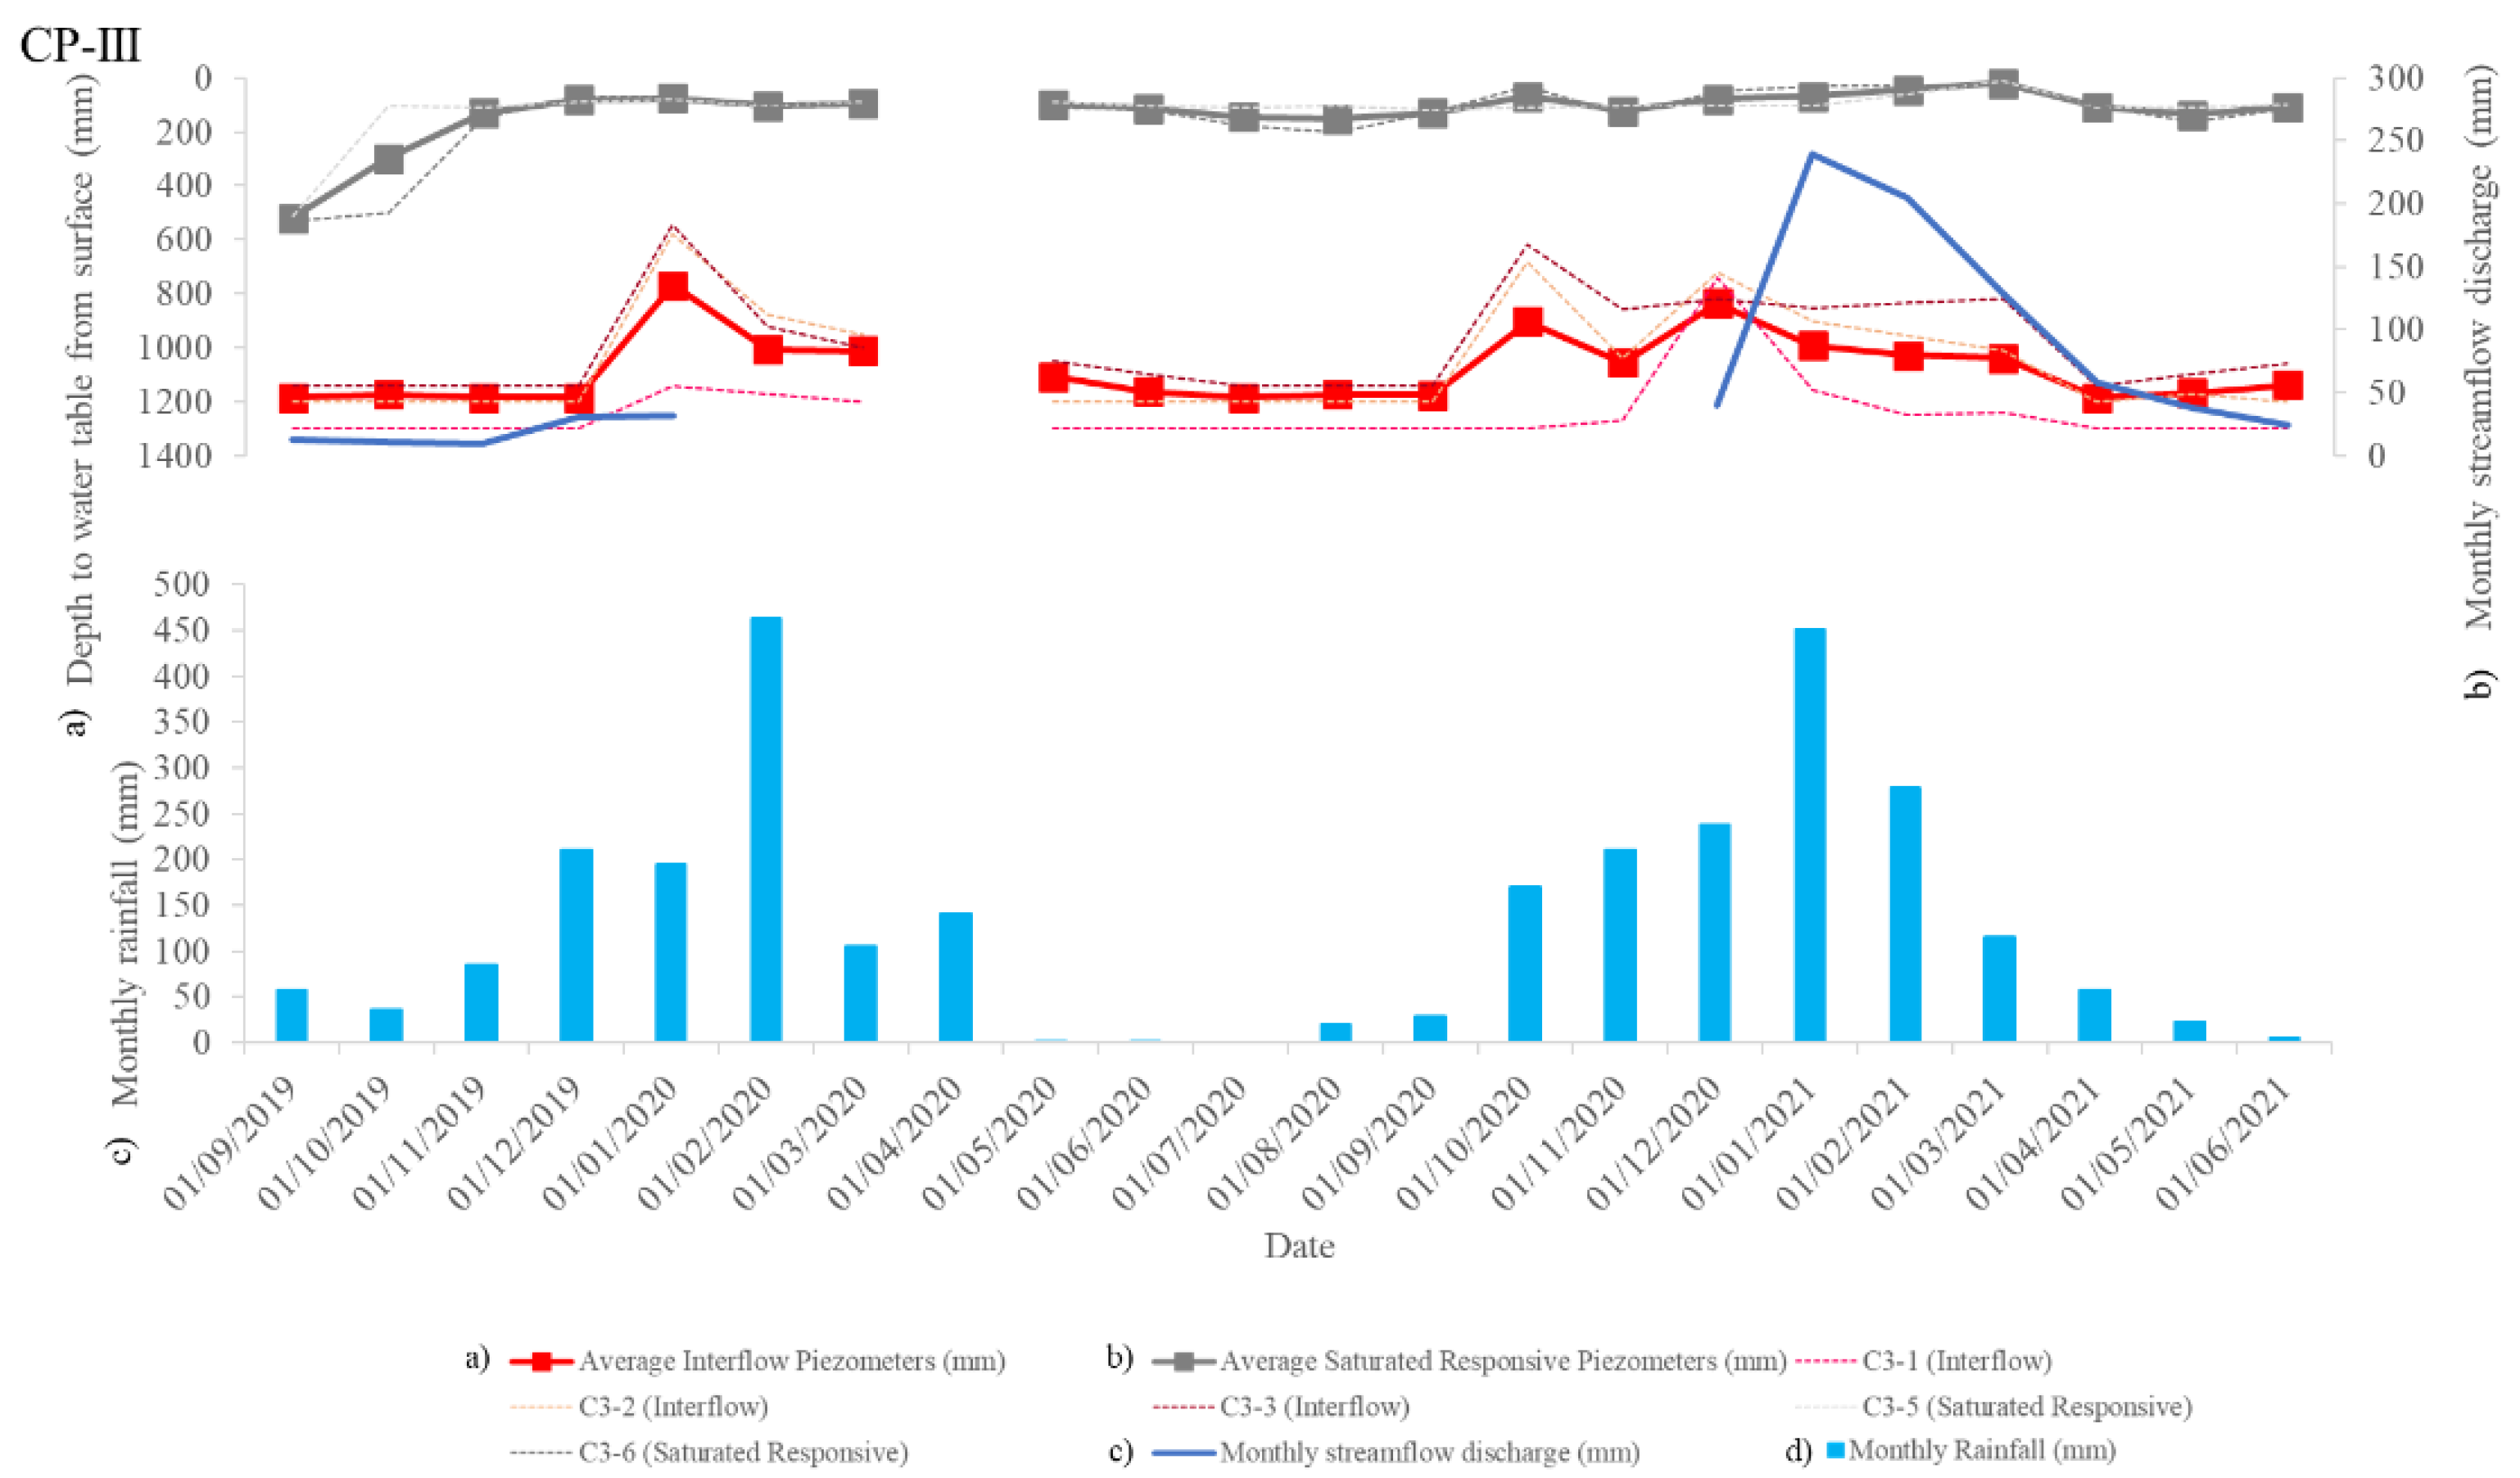
In CP-III, the average depth to the water table for the saturated responsive soil group decreased from 530 mm following the end of the drought in September 2019 to 70 mm in November 2019 and remained between 30 mm and 150 mm for the rest of the study period depending on the seasonal variations in the rainfall received. In comparison, the average depth to the water table for the interflow soil group remained at a depth of 1200 mm until January 2020 where it decreased to 768 mm and then increased again to over 1000 mm during the drier period of 2020 (March to September). Following the onset of the spring rains in October 2020, the average depth to the water table decreased to 900 mm where it fluctuated throughout the wetter summer period (between 800 mm and 1100 mm) depending on the rainfall received. With the onset of the drier autumn to winter period from April 2021, the depth to the water table increased again (1100 mm to 1200 mm) (Figure 4).
Individual piezometers followed a similar pattern to the average depth to the water table with the piezometers located in the saturated responsive soil group becoming saturated in December 2019 and remaining at or near saturation for the entire study period, depending on the seasonal rainfall received. This saturation level showed that when rainfall was received in the catchment, the wetland systems became oversaturated and contributed more to overland and shallow subsurface flow toward the stream network (Figure 4). With regards to the piezometers installed in the interflow soil group, C3-2 and C3-3 (average water depth is 1051 mm and 985 mm, respectively), which were situated higher in the catchment, received more water compared to C3-1 (average water depth of 1241 mm). C3-1 is situated in close proximity to the stream network. All three piezometer locations are associated with deep water table depths, and this could be attributed to this location contributing more to the baseflows of the stream discharge values and not to overland flow. The more water in C3-2 (average depth of 1051 mm) and C3-3 (average depth of 985 mm) compared to C3-1 (average depth of 1241 mm) shows a down gradient flow path from the upslope recharge soil group through the interflow soils where the piezometers are located, and then laterally into the stream network.
Given the quicker rate at which the streamflow discharge values responded to rainfall events, particularly once the wetland systems were saturated, and taking into account the deep-water table depths of the interflow soils as well as the small size of the wetland systems in which the saturated responsive soil piezometers were located, it is apparent that infiltration of precipitation does not occur on the recharge soils during larger rainfall events but that rather overland or shallow subsurface flow occurs and water reaches the streamflow network at a much quicker rate. This is most likely a result of erosion, particularly from the upper reaches of the catchment, and the resultant shallow nature of these recharge soils and therefore the reduced recharge properties that these soil profiles display. Figure 5 shows a diagram of these flow paths during both the drier and wetter seasons.

3.3.2. CP-VI

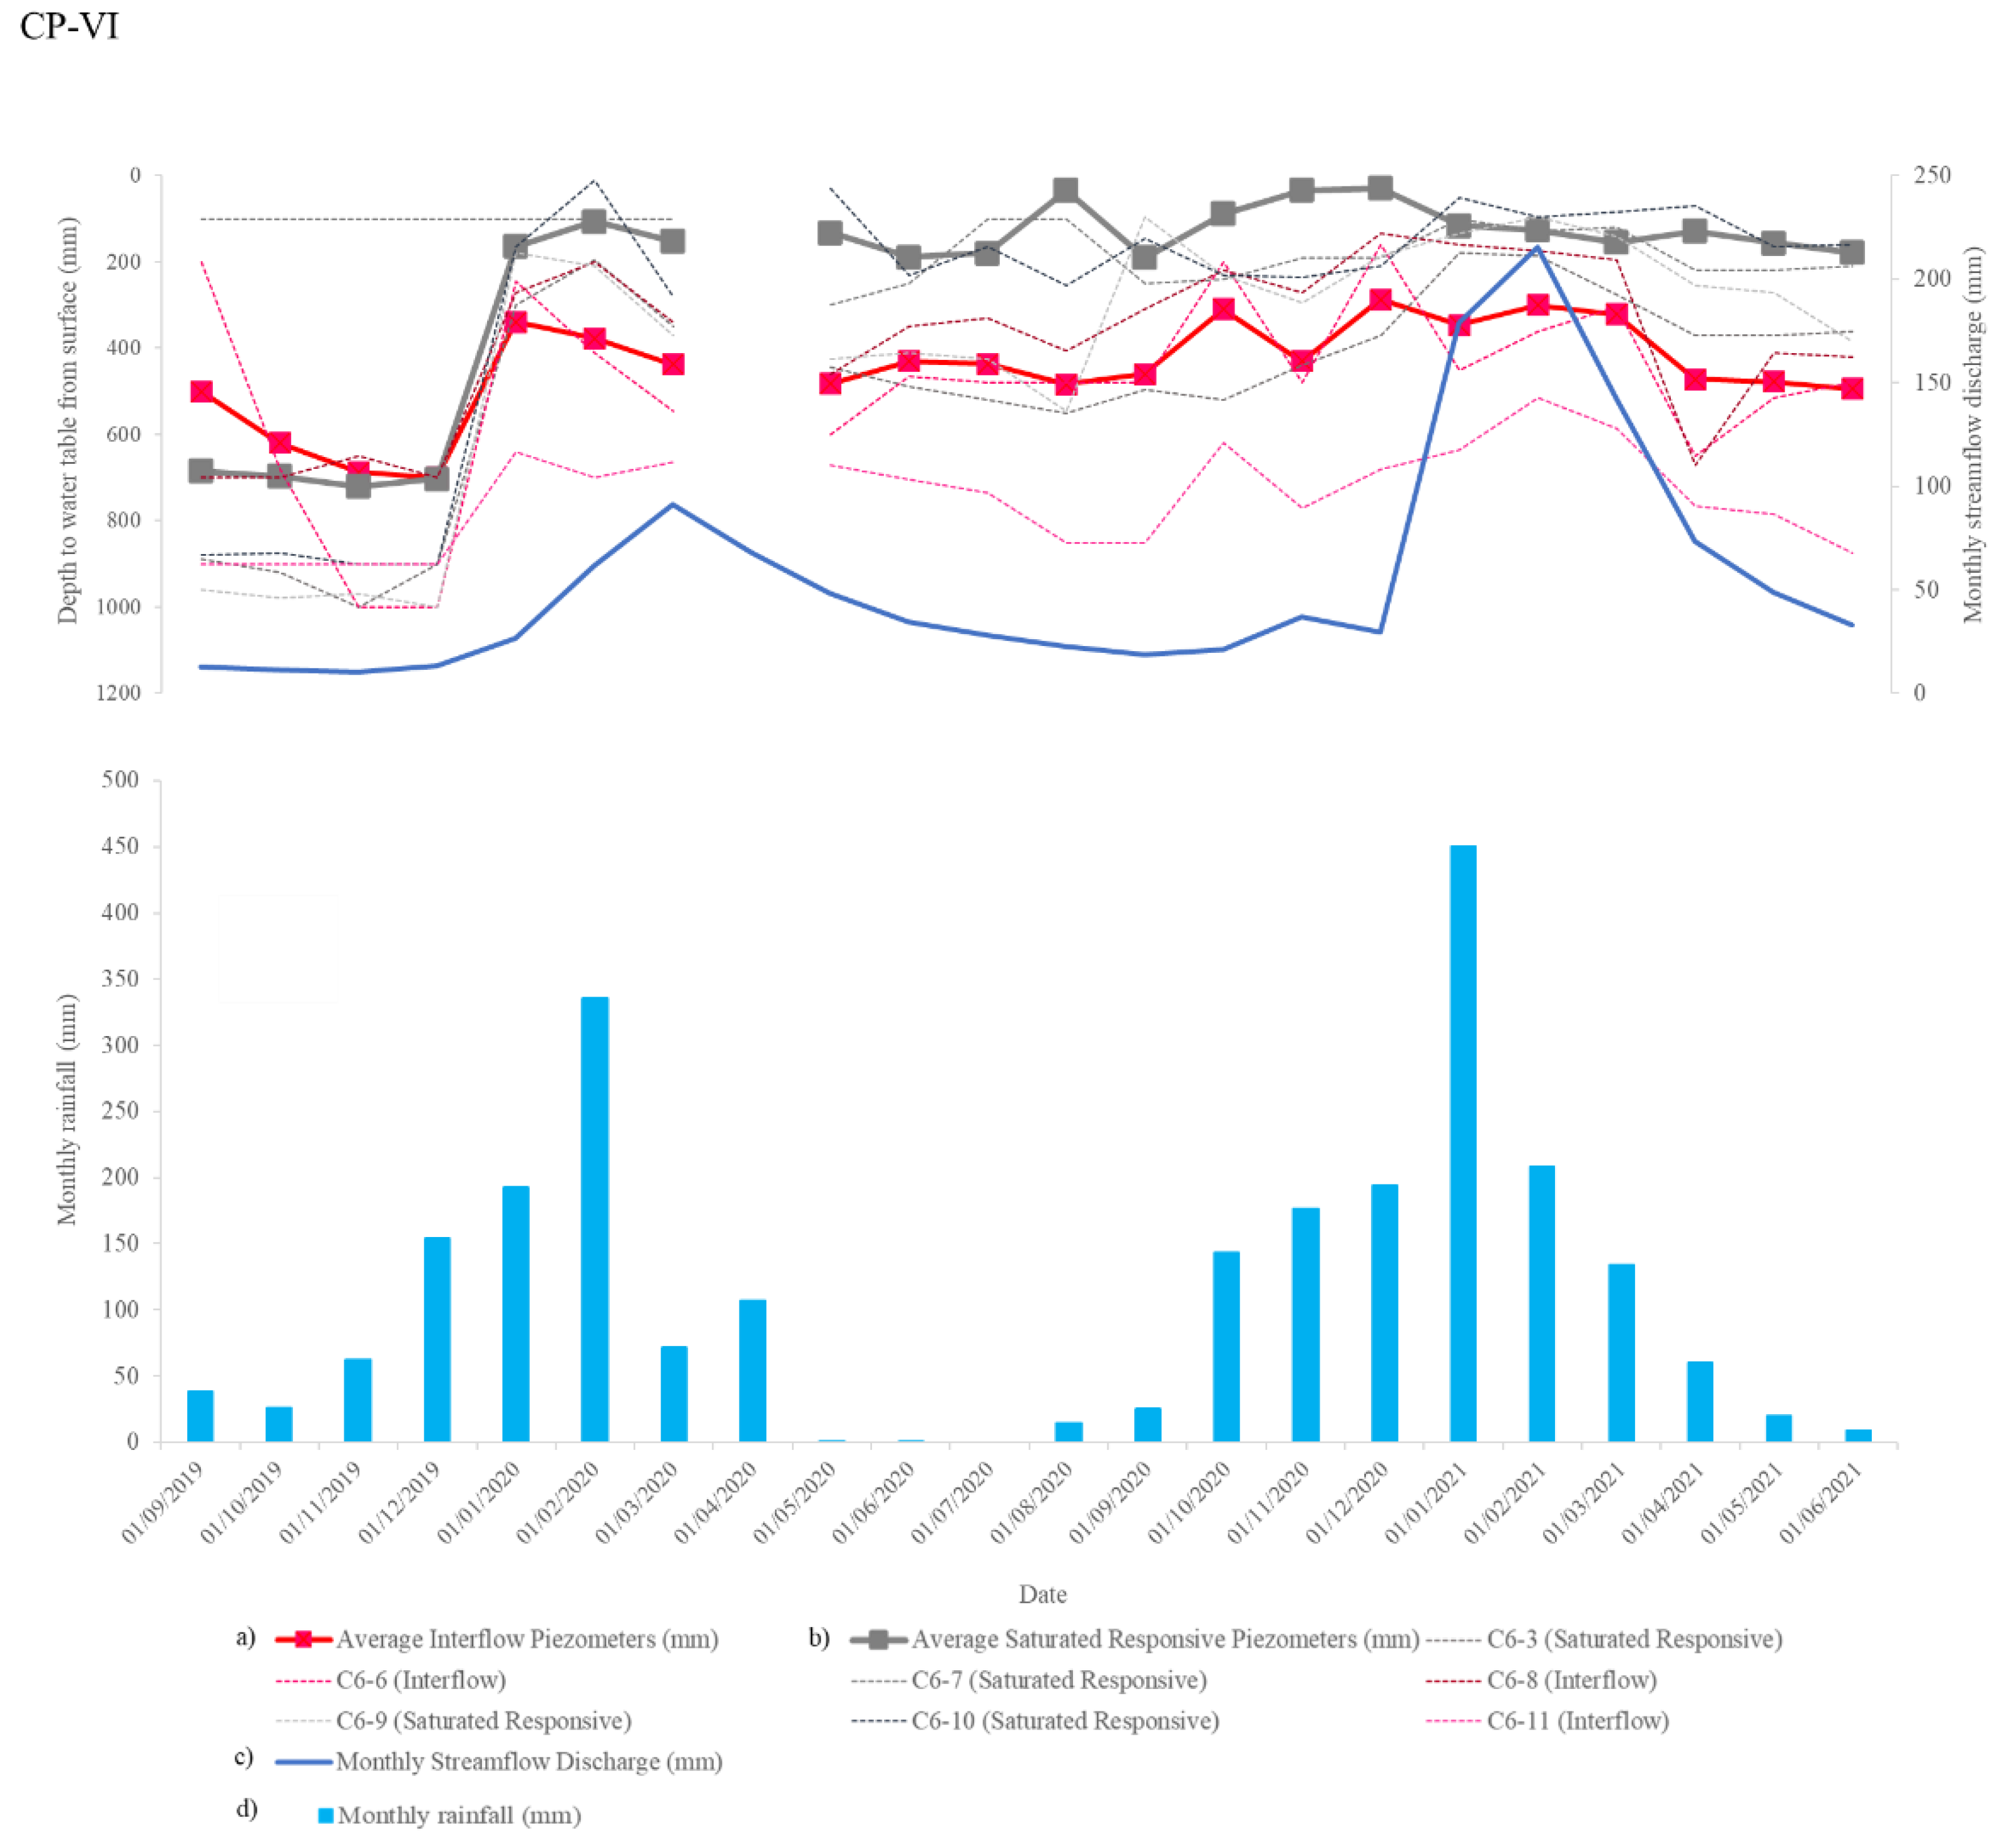
In this catchment, the average depth to the water table within the piezometers installed in the saturated responsive soils decreased from 720 mm in December 2019 following the onset of rains after the drought period and fluctuated between 200 mm and 18 mm for the remainder of the study period. The average depth to the water table for the interflow soil group fluctuated between 700 mm (December 2019) and 287 mm (December 2020). The average depth to the water table for the interflow soil group furthermore fluctuated depending on the rainfall conditions, with an increase in the depth during the drier autumn to winter months and a decrease in depth in the wetter spring to summer months (Figure 6).
As can be seen in Figure 6, each piezometer had a varied fluctuation in the depth to the water table, with some piezometers remaining more saturated compared to others. In the saturated responsive soil group, the C6-7 piezometer remained more saturated compared to the remaining piezometers in this group, particularly during the drought conditions. The C6-3, C6-9, and C6-10 piezometers which are situated higher in the catchment compared to the C6-7 piezometer became far drier during the drought conditions. With the onset of rains and the end of the drought period, these piezometers became saturated and then fluctuated slightly depending on the seasons and associated rainfall conditions. Once saturated, during rainfall events, the wetlands in which the piezometers were located would become oversaturated and contribute to overland and shallow subsurface flow (Figure 7).
Individual piezometers in the interflow soil group also responded differently. Saturation content of the piezometers decreased from C6-8 to C6-6 to C6-11, with the C6-8 piezometer consistently more saturated than the C6-6 and C6-11 piezometers. This piezometer was situated in close proximity but outside of the permanently saturated areas of the C6-7 piezometer. The C6-6 piezometer was furthermore located on the edge of the same wetland system. The C6-11 piezometer was located at the lower end of the catchment, adjacent to the weir and remained drier throughout the study period in comparison to the other interflow piezometers.
These saturation levels of the piezometers show that the interflow soils largely contribute to the baseflow of the streams following a downgradient movement of water from the higher reaches of the catchment before moving laterally into the stream network (Figure 7). During the drought, the wetland system located where the piezometers C6-6, C6-7, and C6-8 (average depth to water table from September 2019 to February 2020 was 436 mm) were installed attenuated more water compared to other wetland systems (average depth to water table from September 2019 to February 2020 was 682 mm) within the catchment. Water moved downgradient from the upper reaches of the catchment and was attenuated within this wetland before moving further downgradient toward the outlet of the catchment area. This movement of water within the drier phase of the study period contributed to the baseflow of the stream network. Once the rains began, the wetland in which the C6-6, C6-7, and C6-8 piezometers were installed became wetter (average depth to water table increased to between 50 mm and 270 mm in January 2020) at a quicker rate than other wetlands within the catchment and started contributing to overland and shallow subsurface flow. The wetlands in which C6-3, C6-9, and C6-10 piezometers were installed became saturated in January/February 2020 (average depth to the water table increased to between 10 mm and 210 mm in February 2020) and then contributed to overland and shallow subsurface flow (Figure 7).

3.3.3. CP-IX

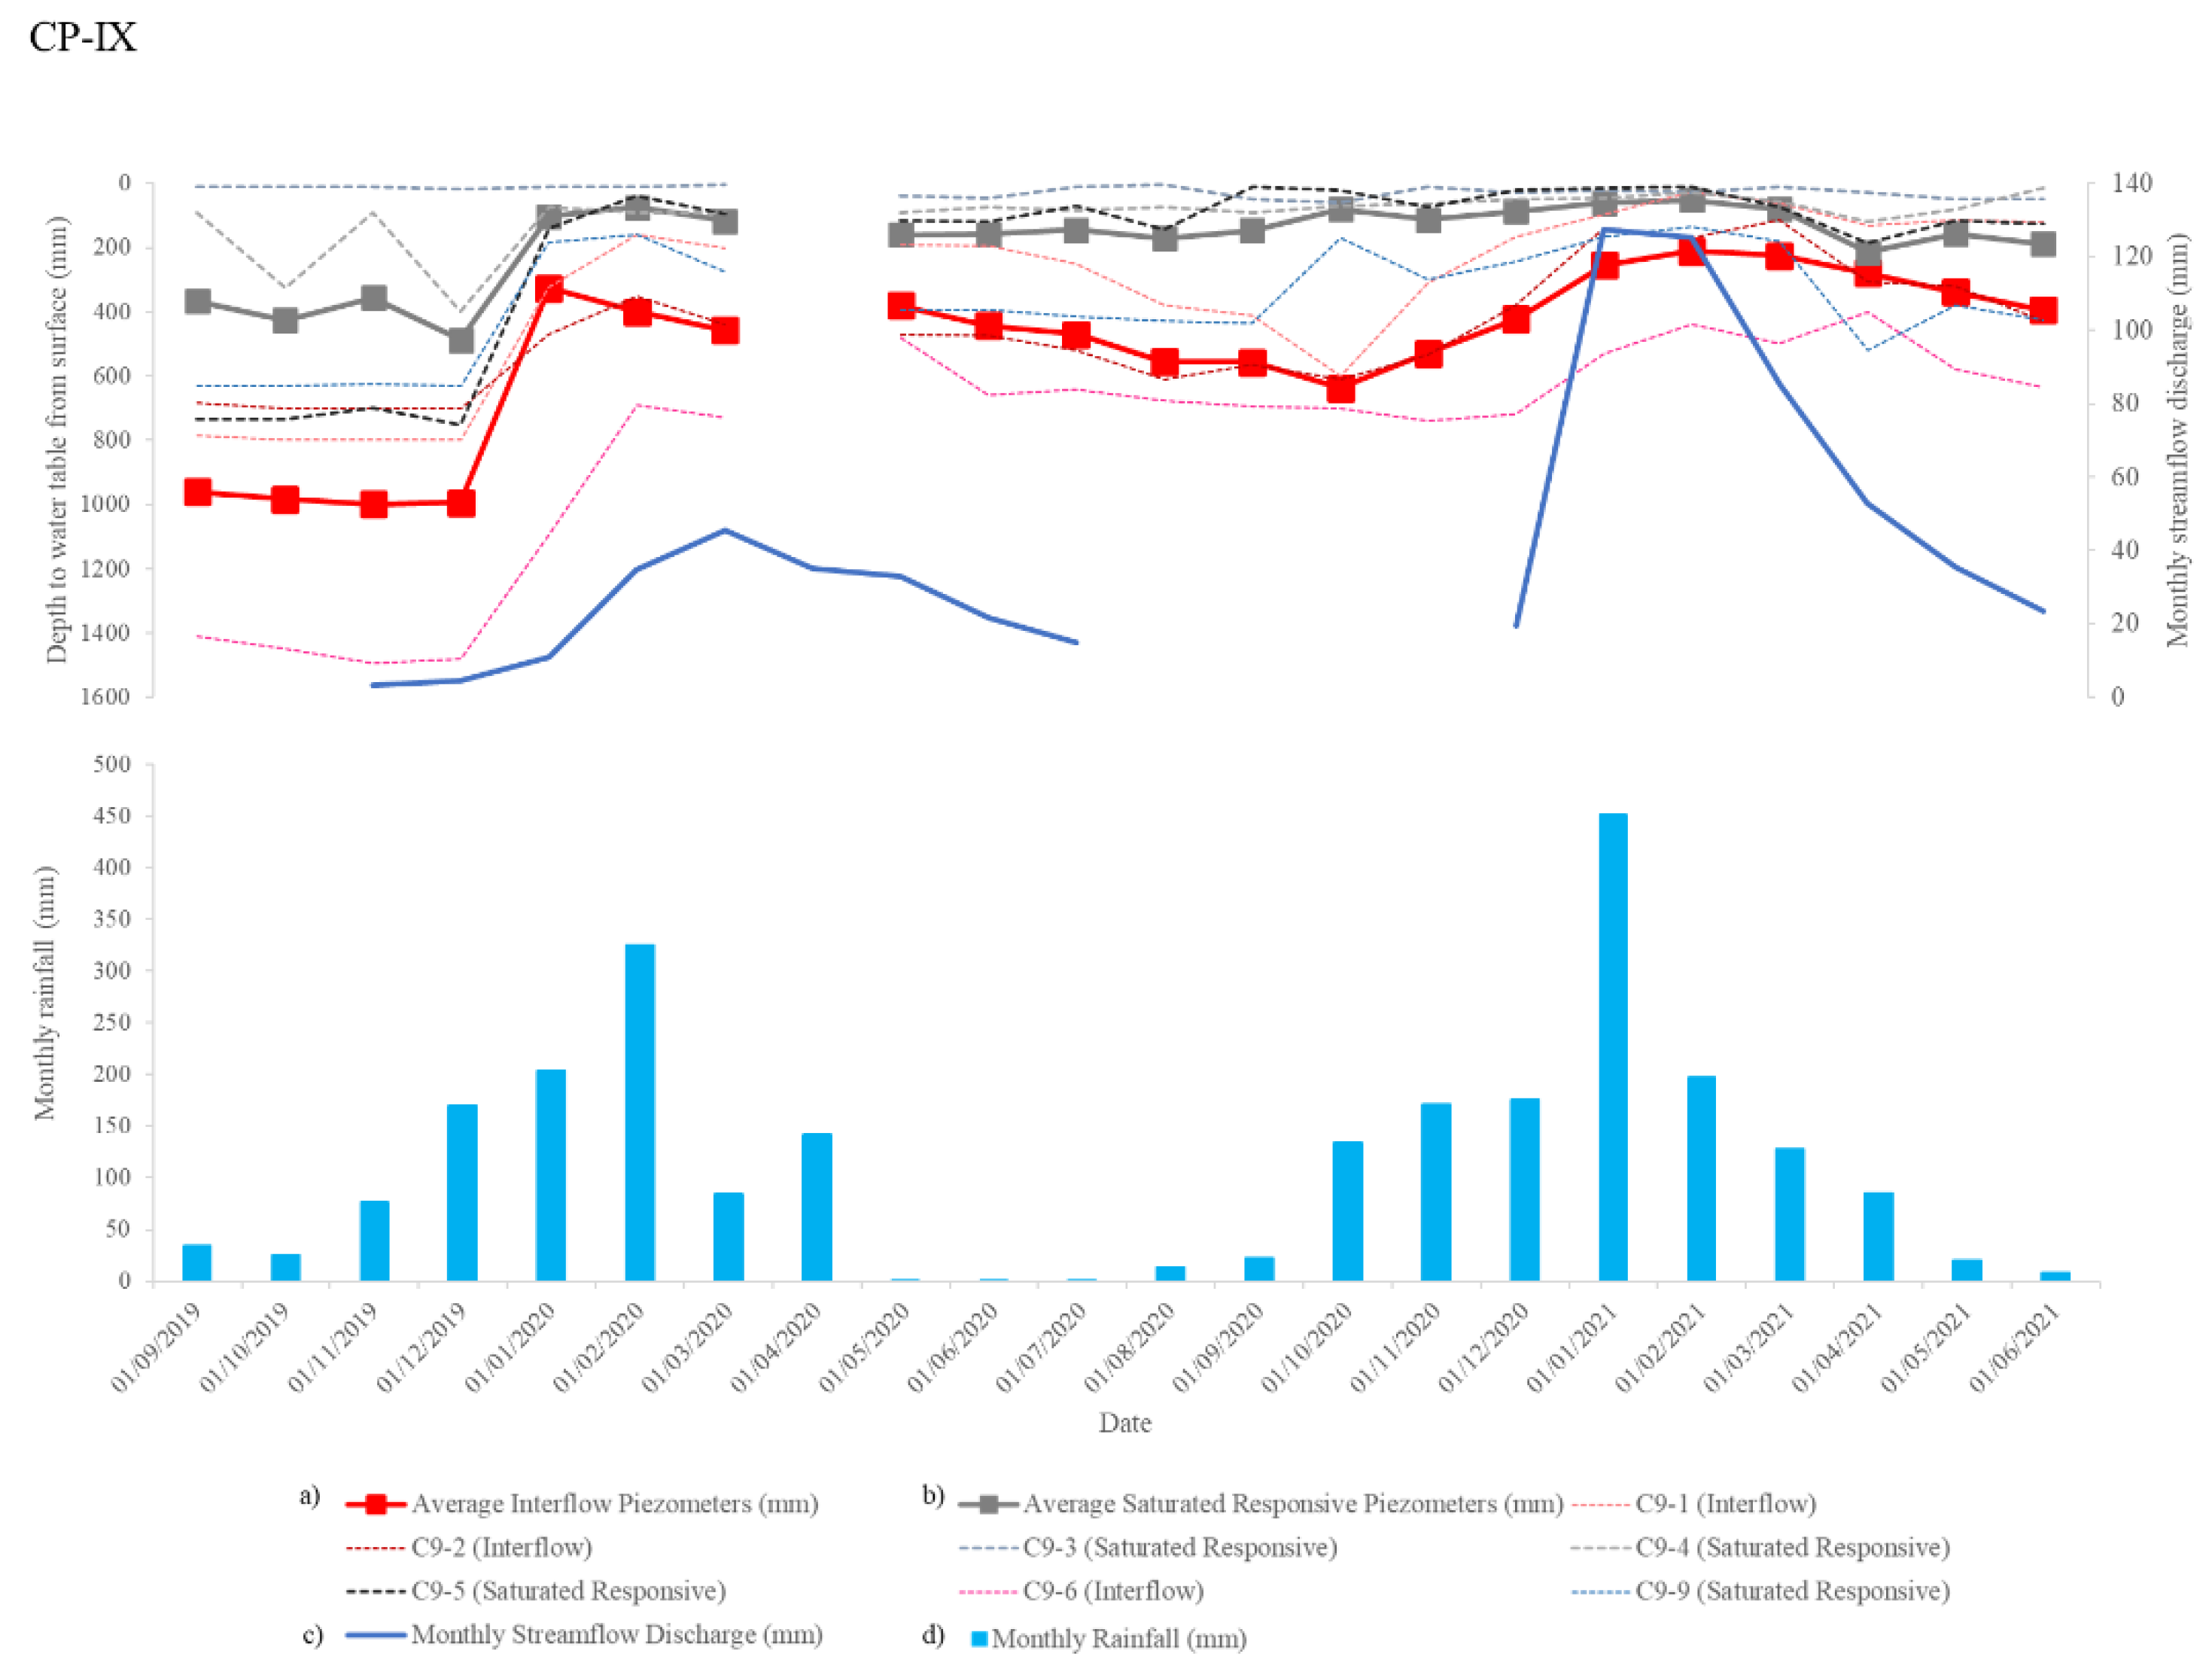
In CP-IX, the average depth to the water table for the saturated responsive soil group decreased from 487 mm to 102 mm following the onset of the rains by January 2020. The average depth to the water table then remained between 200 mm and 75 mm depending on the seasonal variation of rainfall received. The average depth to the water table for the piezometers installed in the interflow soil group also decreased following the onset of rains from 1000 mm in September 2019 to 326 mm in January 2020. The fluctuation of the average depth to the water table then also followed the seasonal variation in the rainfall received, but this variation was more pronounced in comparison to the saturated responsive soil group (depths ranged from 636 mm at the start of spring in October 2020 to 211 mm in February 2021) (Figure 8).
The depth to the water table was different in the individual piezometers. In the saturated responsive soil group, C9-3 remained more saturated even during the drought conditions compared to the other piezometers (water table depth remained at 10 mm until January 2020), followed by C9-4 (water table depth fluctuated between 400 mm and 75 mm until January 2020). C9-5 and C9-9 dried out in comparison and became saturated again in January 2020 with a decrease in water table depth from 750 mm to 140 mm in C9-5 and a decrease from 630 mm to 185 mm in C9-9 (Figure 8).
Piezometers located in the interflow soil group had a greater depth to the water table during the drought conditions, with this depth decreasing following the onset of rains until they reached a peak depth in January and February 2020. The C9-1 and C9-2 piezometers (average water table depth of 330 mm and 460 mm, respectively) which are situated higher up in the catchment remained more saturated compared to C9-6 (average water table depth of 797 mm) which is situated mid catchment.
As was the case in CP-III and CP-VI, the interflow soils contribute more to the lateral flow of water in the sub-horizons of the soil profile (average water table depth ranges from 1000 mm) and the base flow of the streams within the catchment. The saturated responsive soils, which become saturated and remain so, contribute both to the baseflow of the streams and storm flow in the form of overland and shallow subsurface flow once they become saturated. Figure 9 shows a diagram of these flow paths during both the drier and wetter seasons.

3.4. Catchment-Specific Attributes Affecting the Hydropedological Flow Paths

Data obtained from the climatic and hydrologic variables (rainfall and streamflow discharge) as well as the piezometers shows that water moves through the soils of the catchment areas before contributing to the streamflow. The various hydropedological soil groups which affect the flow rates of water before it contributes to streamflow therefore play a pivotal role in the flow dynamics of the catchment areas.
These hydropedological soil groups were mapped following a digital soil mapping process, and while this allowed us to gain a general understanding of the dominant flow paths of these catchment areas, the more detailed investigation of the climatic, hydrologic and water table depth fluctuations have shown that the hydropedological characteristics of the catchment areas are both specific to the catchment and created as a result of various interrelated factors.
The various interactions between the flow dynamics of the hydropedological soil groups of an area and how they become disconnected and reconnected to each other during drying and wetting cycles is unique to the various landscapes in which the flow paths are situated. A number of studies have been conducted in a variety of landscapes [10,26,27]. However, studies conducted in mountainous landscapes highlight the effect of the lower reaches of catchment areas continuously receiving water from the steeper surrounding hillslopes and these flow dynamics contributing to the baseflow of streams. During the wetter periods, the connectivity between the various hydropedological soil groups becomes more established and this allows for the generation of greater overland and shallow subsurface fluxes of water, particularly during larger rainfall events. These flows contribute to peaks within the streamflow hydrographs during storm events [4,28,29].
The connectivity between the hydropedological soil groups is furthermore influenced by the topography of the mountain catchments. In CP-VI for example, the wetland in which the C6-6, C6-7, and C6-8 piezometers were installed and that remained more saturated when compared to other wetland systems in the catchment is situated in an area with a gentler slope as well as a concave landform. Various studies have shown similar findings with catchment areas that have gentler terrain resulting in poorer drainage conditions and therefore the storage of higher volumes of water. Areas with steeper terrain increase the hydraulic gradients of the soils thus increasing the flow between the different hydropedological soil groups and reducing the storage capacity of these soils [1,29]. This influence of topography on the flow dynamics should be studied further within these research catchments.
A further effect on the hydropedological characteristics of the catchment areas is both the historic and current land management practices. The hydropedological dynamics of a site in a certain time is not the result of present processes and events but is related to and strongly influenced by the land use management history as well as the natural plant succession patterns [30].
In CP-III, the historic use of the area as a Pinus patula plantation and the subsequent lack of rehabilitation has led to a decrease in basal cover and erosion, particularly in the upper reaches of this catchment. This erosion has created shallower soils and therefore reduced the storage capacity and infiltration rates of the recharge hydropedological soil group. This reduced infiltration capacity has likely changed the flow dynamics of the catchment compared to what would have been historically present, and this is evident in the quicker response of the streamflow discharge values following a rainfall event during the wetter periods of this study. The impact of erosion on the hydropedological characteristics of a catchment area has been highlighted in other studies, with [31] identifying that soils with a degraded structure tend to have increased bulk density and consequently a decrease in soil porosity. This impacts the water movement in the soil profile, having knock-on effects at the landscape scale. Ref. [12] showed that rainfall infiltration into shallower soils will reach the bedrock interface quickly and flow along this interface as preferential flow. The slope runoff from these areas will therefore appear to occur as subsurface stormflow (i.e., similar to overland flow) but occurring at the shallow soil/bedrock interface. In areas of thicker soil profiles, as is the case in CP-VI and CP-IX, rainfall infiltration into the deeper recharge soils will supply the stream network largely as shallow groundwater and contribute more to the baseflow.
The erosion of the upper reaches has also led to deeper deposition areas within the lower reaches of CP-III. It is within these deposition areas that the interflow soil group piezometers were installed. When comparing the depth to the water table in all interflow soil group piezometers from the three catchment areas, CP-III has the deepest water table depths. This is due to the burying of the original soil profile by sediment which has been eroded from the top of the catchment; this has implications for the flow dynamics of this area of the catchment. Refs. [32,33] showed that in areas of deposition, soil particles have been mixed, causing changes in the pore structure of the soil matrix resulting in pore clogging and the reduction in the soil hydraulic capabilities. Thus, in these areas of CP-III, there is likely to be a slow reconnection of the subsurface flow paths following dry periods and these flow paths reconnecting to the stream network. This is demonstrated by the fact that the interflow soil group piezometers located in the depositional areas did not have a substantial increase in water table depth throughout the study period in comparison to the interflow soil group piezometers in CP-VI and CP-IX. They are thus likely to contribute slowly to the baseflow of the stream network and not to the stormflow peaks of the hydrograph of this catchment even following large rainfall events.
CP-VI is managed as a mesic grassland interspersed with wetland systems, while the fire exclusion since 1952 in CP-IX has led to this catchment becoming a woody dominated area. When comparing CP-VI and CP-IX, fluctuations in the average water table depths of the saturated responsive soil groups show that in both catchments the wetland areas dried out to an extent during the drought period, and these became re-saturated in January/February 2020 and then remained saturated throughout the study period. The wetlands in both catchments contributed to shallow sub-surface flow and at times overland flow depending on rainfall conditions. The average water table depth of the interflow soil group also followed similar patterns when comparing the two catchment areas. The effect of plant cover on the hydropedological characteristics of catchment areas has been reported in different environmental settings [11,30,34,35,36], with these studies showing that woody cover areas have greater infiltration rates compared to pasture areas and that tree canopies can reduce the interception of rainfall within catchment areas, influencing infiltration rates within soils [36]. These studies were conducted in commercial plantations, fallow pastures, and old wood forests. The results of this study suggest that the flow dynamics of each catchment area are not a product of land cover but a factor of a combination of interrelated components.
The pivotal role that the wetland systems play in the streamflow dynamics of the catchment areas has been highlighted in this study. The drying and wetting cycles of individual wetland systems as well as specific saturation zones of these wetlands influenced both the baseflow connectivity and the overland flow during wetter periods. Ref. [37] identified similar findings utilising remote sensing techniques to show how a wetland system has different internal saturation compartments and how these both differ in saturation content depending on the climatic conditions and in providing lateral flow and overland flow to downgradient environments. Ref. [29] furthermore utilised isotopes to show that baseflow within the stream network consists predominantly of pre-event water (or dryer cycles) with larger rainfall events (particularly during the wetter cycles) displacing this water within the wetland systems and moving it as overland flow to the stream networks. The contribution of wetland systems to the stream network is therefore a heterogeneous and complex interaction of the soil physical properties, the climatic conditions, and the land management of an area. This has an impact on areas within the catchments classified as saturated responsive soils as these areas do not always contribute to overland flow, but rather the timing of their contribution to both baseflow and overland flow is specific to the wetland system, its location within the catchment, and climatic variables. Future isotopic studies within the Cathedral Peak research catchments are recommended to help gain a deeper understanding of flow dynamics from the wetland systems to the stream networks.

4. Conclusions

This study has highlighted the effects of climate, hydrologic conditions, land management and soil properties on the hydropedological characteristics of three montane catchment areas. The results suggest that a number of factors which are interrelated play a key role in determining the flow paths and the connection between flow paths in these areas. These factors are dominated by antecedent soil moisture, rainfall intensity, the duration of dry and wet periods as well as the depth of soil profiles.
The conceptual interpretation of the hydropedological flow paths of each catchment area following the creation of the digital soil maps provided a general understanding of the flow paths and storage areas of these watersheds. However, utilising catchment-specific climate and streamflow data coupled with water table depth measurements as well as an understanding of how historic and current land management practices have influenced the soil properties, we were able to gain a more accurate interpretation of the response of each hydropedological soil group following a rainfall event. The dominant role of wetland systems and how these have drying and wetting cycles (the average water table depth ranged from 520 mm to 20 mm in CP-III, from 720 mm to 28 mm in CP-VI and from 487 mm to 51 mm in CP-IX) are the key focus in understanding the connectivity between the hydropedological flow paths and the contribution of soil water to the stream networks of the three catchments.
Given the importance of small mountain watersheds in maintaining water supplies to downgradient systems, the understanding of how streamflow is generated and maintained in these headwater catchments is of importance. This is particularly so in understanding the importance of the water storage capacity and water flux rate of the wetlands of the catchments in creating a buffering capacity against hydroclimatic variability which is becoming an ever-increasing reality [33]. The health of the wetland systems in storing water during droughts and their capacity to become saturated quickly and then contribute to the stream network is an important consideration in the ecological services these mountain headwater catchments provide.

Author Contributions

Conceptualization, R.H. and J.v.T.; methodology, R.H. and J.v.T.; formal analysis, R.H. and J.v.T.; funding acquisition, J.v.T.; resources, J.v.T. and P.A.S.; supervision, J.v.T. and P.A.S.; writing—original draft preparation, R.H.; writing—review and editing, R.H., J.v.T. and P.A.S.; visualization, R.H., J.v.T. and P.A.S.; validation, P.A.S. All authors have read and agreed to the published version of the manuscript.

Funding

This research was funded by the IPHAKADE EARTH STEWARDSHIP SCIENCE BURSARY PROGRAMME.

Data Availability Statement

Not applicable.

Acknowledgments

The authors wish to thank the South African Environmental Observation Network (SAEON) for all the logistical support in gathering the data for this study.

Conflicts of Interest

The authors declare no conflict of interest.

References

  1. Lazo, P.; Mosquera, G.; McDonnell, J.; Crespo, P. The role of vegetation, soils, and precipitation on water storage and hydrological services in Andean Páramo catchments. J. Hydrol. 2019, 572, 805–819. [Google Scholar] [CrossRef]
  2. Lin, H.; Brooks, E.; Mcdaniel, P.; Boll, J. Hydropedology and Surface/Subsurface Runoff Processes. In Encyclopedia of Hydrological Sciences; John Wiley & Sons, Ltd.: New York, NY, USA, 2008. [Google Scholar] [CrossRef]
  3. Geris, J.; Tetzlaff, D. Resistance and resilience to droughts: Hydropedological controls on catchment storage and run-off response. Hydrol. Process. 2015, 29, 4579–4593. [Google Scholar] [CrossRef] [Green Version]
  4. Pinto, L.; de Mello, C.; Darrell, N.; Poggere, G.; Owens, P.; Curi, N. A hydropedological approach to a mountainous Clayey Humic Dystrudept. Sci. Agric. 2018, 75, 60–69. [Google Scholar] [CrossRef] [Green Version]
  5. Lin, H. Hydropedology Synergistic Integration of Soil Science and Hydrology, 1st ed.; Academic Press: Cambridge, MA, USA, 2012. [Google Scholar]
  6. Jarvis, N.J. A review of non-equilibrium water flow and solute transport in soil macropores: Principles, controlling factors and consequences for water quality. Eur. J. Soil Sci. 2007, 58, 523–546. [Google Scholar] [CrossRef]
  7. Juez, C.; Nadal-Romero, E. Long-term time-scale bonds between discharge regime and catchment specific landscape traits in the Spanish Pyrenees. Environ. Res. 2020, 191, 110158. [Google Scholar] [CrossRef]
  8. Zhu, Q.; Castellano, M.; Yang, G. Coupling soil water processes and nitrogen cycle across spatial scales: Potentials, bottlenecks and solutions. Earth. Sci. Rev. 2018, 187, 248–258. [Google Scholar] [CrossRef] [Green Version]
  9. Lin, H. Temporal stability of soil moisture spatial pattern and subsurface preferential flow pathways in the Shale Hills Catchment. Vadose Zone J. 2006, 5, 317–340. [Google Scholar] [CrossRef]
  10. Novak, P. Soil Genetics in Hydropedological Survey in Mountain Areas. Soil Sci. Annu. 1986, 37, 215–223. [Google Scholar]
  11. Zuecco, G.; Rinderer, M.; Penna, D.; Borga, M.; van Meerveld, H.J. Quantification of subsurface hydrologic connectivity in four headwater catchments using graph theory. Sci. Total Environ. 2019, 646, 1265–1280. [Google Scholar] [CrossRef]
  12. Fu, Z.; Li, Z.; Cai, C.; Shi, Z.-H.; Xu, Q.; Wang, X. Soil thickness effect on hydrological and erosion characteristics under sloping lands: A hydropedological perspective. Geoderma 2011, 167, 41–53. [Google Scholar] [CrossRef]
  13. Juez, C.; Nadal-Romero, E.; Cammeraat, E.; Regüés, D. Spatial and temporal variability of water table dynamics in an afforested catchment of the Central Spanish Pyrenees. Hydrol. Process. 2021, 35, e14311. [Google Scholar] [CrossRef]
  14. Nanni, U.W. Forest Hydrological Research at the Cathedral Peak Research Station. J. South Afr. For. Assoc. 1956, 27, 2–35. [Google Scholar] [CrossRef]
  15. Toucher, M.L.; Clulow, A.; van Rensburg, S.; Morris, F.; Gray, B.; Majozi, S.; Everson, C.E.; Jewitt, G.P.W.; Taylor, M.A.; Mfeka, S.; et al. Establishment of a more Robust Observation Network to Improve Understanding of Global Change in the Sensitive and Critical Water Supply Area of the Drakensberg; WRC Report No. 2236/1/16; Water Research Commission: Pretoria, South Africa, 2016. [Google Scholar]
  16. Mucina, L.; Rutherford, M.C.; Powrie, L.W. Vegetation Map of South Africa, Lesotho and Swaziland, 2nd ed.; South African National Biodiversity Institute: Pretoria, South Africa, 2017. [Google Scholar]
  17. Bosch, J.M. Treatment effects on annual and dry period streamflow at Cathedral Peak. S. Afr. For. J. 1979, 108, 29–38. [Google Scholar] [CrossRef]
  18. Gordijn, P.J.; Everson, T.M.; O’Connor, T.G. Resistance of Drakensberg grasslands to compositional change depends on the influence of fire-return interval and grassland structure on richness and spatial turnover. Perspect. Plant Ecol. Evol. 2018, 34, 26–36. [Google Scholar] [CrossRef]
  19. Harrison, R.; van Tol, J. Digital Soil Mapping for Hydropedological Purposes of the Cathedral Peak Research Catchments, South Africa. In Remote Sensing of African Mountains, 1st ed.; Adelabu, S., Ramoelo, A., Olusola, A., Adagbasa, E., Eds.; Springer: Cham, Switzerland, 2022. [Google Scholar] [CrossRef]
  20. Everson, C.E.; Molefe, G.L.; Everson, T.M. Monitoring and Modelling Components of the Water Balance in a Grassland Catchment in the Summer Rainfall Area of South Africa; WRC Report No. 493/1/98.1998; Water Research Commission: Pretoria, South Africa, 1998. [Google Scholar]
  21. van Tol, J. Hydropedology in South Africa: Advances, applications and research opportunities. S. Afr. J. Plant Soil. 2020, 37, 23–33. [Google Scholar] [CrossRef]
  22. van Tol, J.J.; Roux, P.A.L. Hydropedological grouping of South African soil forms. S. Afr. J. Plant Soil. 2019, 36, 233–235. [Google Scholar] [CrossRef]
  23. Soil Classification Working Group. Soil Classification: A Natural and Anthropogenic System for South Africa; ARC-Institute for Soil, Climate and Water: Pretoria, South Africa, 2018. [Google Scholar]
  24. de Menezes, M.D.; Silva, S.H.G.; Owens, P.R.; Curi, N. Solum depth spatial prediction comparing conventional with knowledge-based digital soil mapping approaches. Sci. Agric. 2014, 71, 4. [Google Scholar] [CrossRef] [Green Version]
  25. Zhu, A.X.; Band, L.; Vertessy, R.; Dutton, B. Derivation of soil properties using a soil land inference model (SoLIM). Soil. Sci. Soc. Am. J. 1997, 61, 523–533. [Google Scholar] [CrossRef]
  26. D’Amore, D.V.; Fellman, J.B.; Edwards, R.T.; Hood, E.W.; Ping, C.L. Hydropedology of the North American coastal temperate rainforest. In Hydropedology: Synergistic Integration of Soil Science and Hydrology; Lin, H., Ed.; Academic Press: Cambridge, MA, USA, 2012. [Google Scholar]
  27. MacEwan, R.; Dahlhaus, P.; Fawcett, J. Hydropedology, Geomorphology, and Groundwater Processes in Land Degradation: Case Studies in South West Victoria, Australia. In Hydropedology: Synergistic integration of Soil Science and Hydrology; Lin, H., Ed.; Academic Press: Cambridge, MA, USA, 2012; pp. 449–481. [Google Scholar] [CrossRef]
  28. van Tol, J.J.; Le Roux, P.; Hensley, M.; Lorentz, S. Soil as indicator of hillslope hydrological behaviour in the Weatherley Catchment, Eastern Cape, South Africa. Water SA 2010, 36, 5. [Google Scholar] [CrossRef] [Green Version]
  29. Tetzlaff, D.; Birkel, C.; Dick, J.; Geris, J.; Soulsby, C. Storage dynamics in hydropedological units control hillslope connectivity, runoff generation, and the evolution of catchment transit time distributions. Water Resour. Res. 2014, 50, 969–985. [Google Scholar] [CrossRef] [Green Version]
  30. Gómez-Tagle, A. Linking hydropedology and ecosystem services: Differential controls of surface field saturated hydraulic conductivity in a volcanic setting in central Mexico. Hydrol. Earth. Syst. Sci. Discuss. 2009, 6, 2499–2536. [Google Scholar] [CrossRef] [Green Version]
  31. Pinto, L.C.; de Mello, C.R.; Owens, P.R.; Norton, L.D.; Curi, N. Role of inceptisols in the hydrology of mountainous catchments in Southeastern Brazil. J. Hydrol. Eng. 2016, 75, 60–69. [Google Scholar] [CrossRef]
  32. Dikinya, O.; Hinz, C.; Aylmore, G. Dispersion and re-deposition of fine particles and their effects on saturated hydraulic conductivity. Aust. J. Soil Res. 2006, 44, 47–56. [Google Scholar] [CrossRef]
  33. Blumstock, M.; Tetzlaff, D.; Dick, J.J.; Nuetzmann, G.; Soulsby, C. Spatial organization of groundwater dynamics and streamflow response from different hydropedological units in a montane catchment. Hydrol. Process. 2016, 30, 3735–3753. [Google Scholar] [CrossRef] [Green Version]
  34. Zimmermann, B.; Elsenbeer, H.; De Moraes, J.M. The influence of land-use changes on soil hydraulic properties: Implications for runoff generation. For. Ecol. Manag. 2006, 222, 29–38. [Google Scholar] [CrossRef]
  35. Zou, C.; Barron-Gafford, G.; Breshears, D. Effects of Topography and Woody Plant Canopy Cover on Near-Ground Solar Radiation: Relevant Energy Inputs for Ecohydrology and Hydropedology. Geophys. Res. Lett. 2007, 34, 24. [Google Scholar] [CrossRef] [Green Version]
  36. Granados, M.E.; Vilagrosa, A.; Chirino, E.; Vallejo, R. Reforestation with resprouter species to increase diversity and resilience in Mediterranean pine forests. For. Ecol. Manag. 2016, 362, 231–240. [Google Scholar] [CrossRef]
  37. Furlan, L.; Rosolen, V.; Sales, J.; Moreira, C.; Ferreira, M.; Bueno, G.; Coelho, C.; Mounier, S. Natural superficial water-storage and aquifer recharge assessment in Brazilian savanna wetland using unmanned aerial vehicle and geophysical survey. J. Unmanned Veh. Syst. 2020, 8, 224–244. [Google Scholar] [CrossRef]
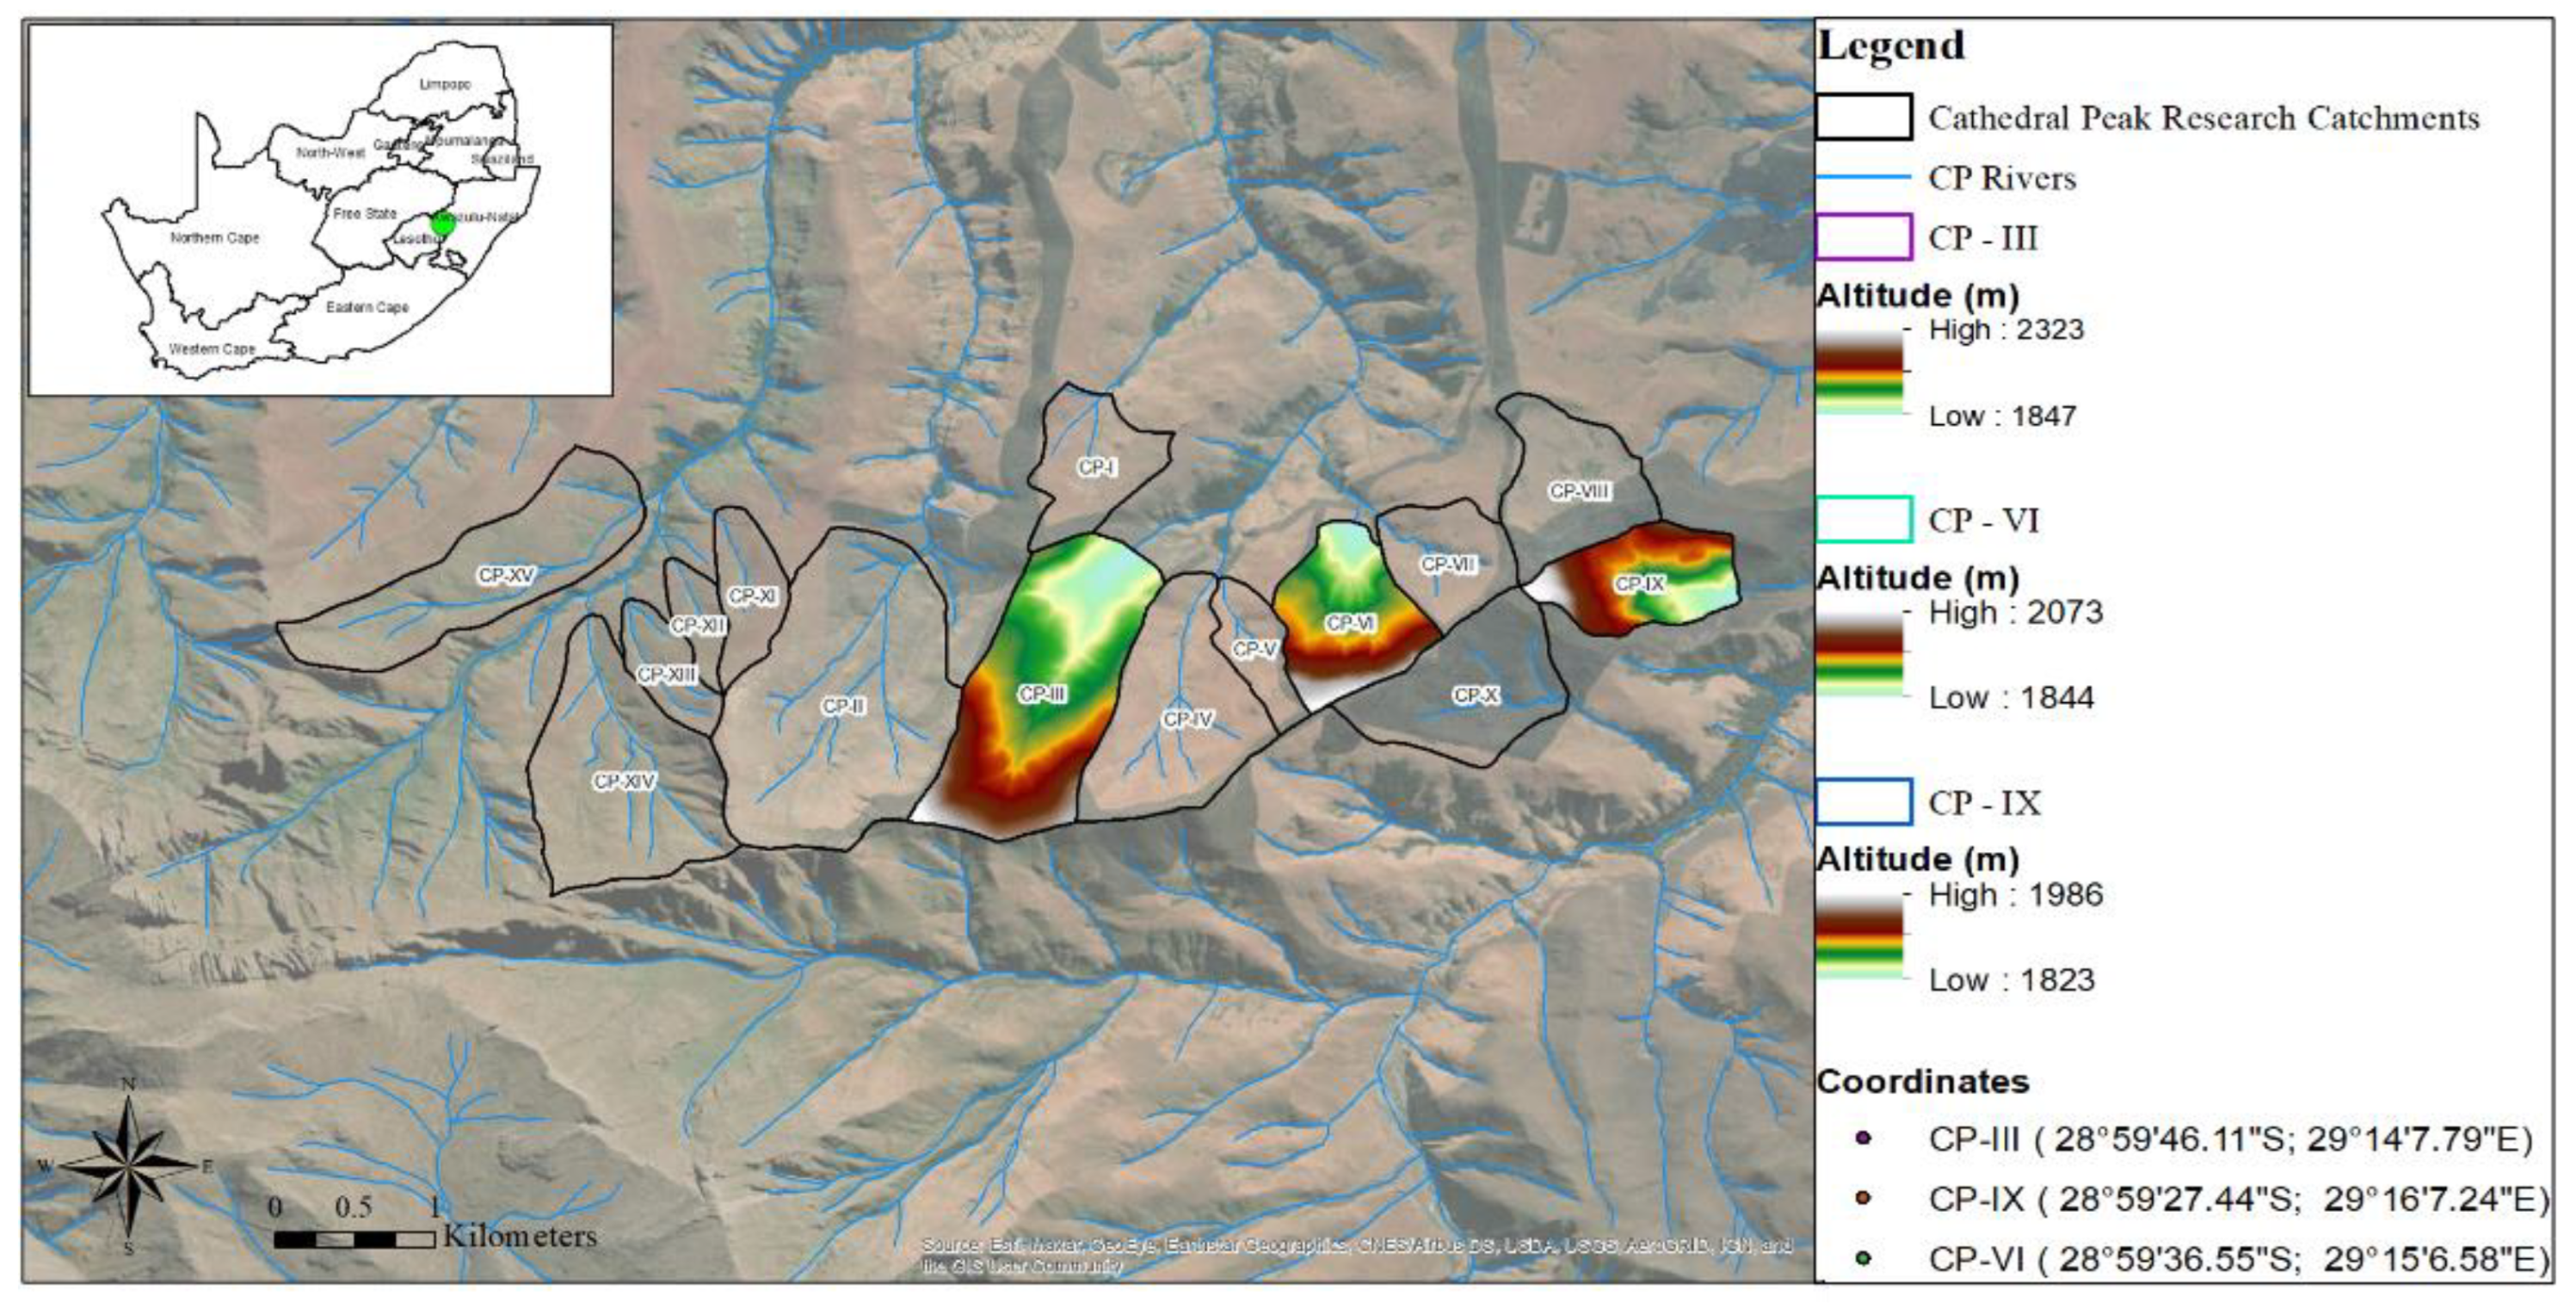
Figure 1. Locality of the catchments selected for the study.
Hydrology 09 00189 g001
Figure 2. Location of the piezometers in relation to the hydropedological soil group in (a) CP-III, (b) CP-VI, and (c) CP-IX.
Hydrology 09 00189 g002
Figure 3. Depictions of the relationship between precipitation and streamflow discharge for: (a) CP-III; (b) CP-VI; (c) CP-IX.
Hydrology 09 00189 g003
Figure 4. Comparisons of piezometer data installed in the (a) interflow soils, (b) saturated responsive soils, (c) monthly streamflow discharge and (d) monthly rainfall CP-III.
Hydrology 09 00189 g004
Figure 5. Flow path diagrams for (a) the drier periods and (b) wetter periods for CP-III.
Hydrology 09 00189 g005
Figure 6. Comparisons of piezometer data installed in the (a) interflow soils, (b) saturated responsive soils, (c) monthly streamflow discharge and (d) monthly rainfall in CP-VI.
Hydrology 09 00189 g006
Figure 7. Flow path diagrams for (a) the drier periods and (b) wetter periods for CP-VI.
Hydrology 09 00189 g007
Figure 8. Comparisons of piezometer data installed in the (a) interflow soils, (b) saturated responsive soils, (c) monthly streamflow discharge and (d) monthly rainfall in CP-IX.
Hydrology 09 00189 g008
Figure 9. Flow path diagrams for (a) the drier periods and (b) wetter periods for CP-IX.
Hydrology 09 00189 g009
Table 1. General details of the three catchment areas during the study period (adapted from [19]).
Catchment NameSize (ha)
and Altitude Range (m.a.s.l.)
Rainfall Dynamics during Study PeriodStreamflow Discharge Dynamics during Study PeriodDescription of Catchment
CP-III138.9
1847–2323
Mean (mm) 4.34
Max (mm)
65.23
Min (mm)
0.00
Annual PCP
2019—1095 mm
2020—1572 mm
2021—1664 mm
Mean (mm): 2.33
Max (mm): 13.39
Min (mm): 0.22
The catchment is degraded as a result of a forestry experiment in which Pinus patula was planted throughout the catchment in the 1950s and 1960s as well as accidental fires which led to the removal of these trees in 1981. The catchment was rehabilitated with Eragrostis curvula following the removal of the trees [15]. There is, however, erosion throughout the catchment area, with large portions of the catchment covered by Pteridium sp. (Bracken).
CP-VI67.7
1844–2073
Mean PCP (mm) 3.62
Max PCP (mm)
65.28
Min (PCP) (mm)
0.00
Annual PCP
2019—829 mm
2020—1261 mm
2021—1472 mm
Mean (mm): 1.84
Max (mm): 18.90
Min (mm): 0.00
This catchment is covered by mesic grassland of the uKhahlamba Basalt Grassland type which is burned biennially during spring. CP-VI is considered the core catchment with focused, detailed monitoring ongoing in this catchment. A full array of evaporation, soil moisture and groundwater monitoring is undertaken.
CP-IX64.5
1823–1966
Mean PCP (mm) 3.70
Max PCP (mm)
68.34
Min (PCP) (mm)
0.00
Annual PCP
2019—884.94 mm
2020—1274 mm
2021—1378 mm
Mean (mm): 1.28
Max (mm): 11.81
Min (mm): 0.09
This catchment has been completely protected from fire since 1952 but has experienced accidental burns and wildfires in some years. As a result of fire exclusion, this catchment is dominated by woody scrub (Leucasidea serica and Buddleia salvifolia).
Table 2. Dominant properties of the dominant hydropedological soil groups [19].
Hydropedological Soil GroupCharacteristics of the Soils
Recharge ShallowThese are soils that are freely drained and do not show any indication of saturation. They are typically shallow in nature (<500 mm). The freely drained B horizon merges with fractured rock or a lithic horizon. These soils typically occur on steeper convex slopes in the higher lying or steeper parts of the catchments.
Recharge DeepThese are soils that are freely drained and do not show any indication of saturation. They are typically deeper than the Recharge Shallow Soils (>500 mm). The freely drained B horizon merges into fractured rock or a lithic horizon. These soils where identified throughout the catchments on gentler convex and concave slopes and away from wetlands and watercourses.
InterflowThese soils have a freely drained upper solum which overlies relatively impermeable bedrock. Hydromorphic properties are identified at this interface and signify periodic saturation associated with a water table. They typically occur on gentler concave slopes in areas delineated as wetlands as well as adjacent to watercourses.
Responsive SaturatedThese soils display morphological indications of long-term saturation. They characteristically respond quickly to rainfall events and generate overland flow as they are typically close to saturation during the wet season and therefore any additional precipitation will flow overland due to saturation excess. These soils were identified in the valley bottom positions of the catchments, in permanently saturated wetlands. They typically occur on gentle concave slopes.
Table 3. Percentage of the catchment area covered by each hydropedological soil group.
CP-IIICP-VICP-IX
Hydropedological soil groupPercentage of catchment covered by each hydropedological soil group
Recharge Shallow18.317.127.6
Recharge Deep43.333.838.4
Interflow24.128.715.9
Responsive Saturated14.320.418.1
Publisher’s Note: MDPI stays neutral with regard to jurisdictional claims in published maps and institutional affiliations.