Abstract
Most anthropogenic pollution can be controlled, such as domestic and industrial releases, loads from agriculture, etc. However, some of them, which are associated to illegal discharges, industrial accidents, etc., are more difficult to forecast. This study was performed on the Tereos sugar industry accident that occurred during the night of 9 April 2020, when 88,000 cubic meters of effluents loaded with organic matter discharged in the Scheldt River (a 350 km long transnational river that flows through Northern France and Western Belgium). The accident had dramatic consequences on the receiving watercourse, over 120 km downstream. Fish mortalities have been observed and severe deoxygenation, reaching zero concentration in dissolved oxygen, have impacted river chemical quality. The objective was to understand and describe the dynamics of the chemical pollution and its propagation along the transboundary hydrographic network of the Scheldt. A method based on the processes of organic matter degradation in the river ecosystem was enhanced. It is demonstrated that the accident is doubtless the cause of the water column deoxygenation. This paper shows how the water quality modelling can help to understand and therefore to prevent the consequences of accidental pollution on a river network.
1. Introduction
In 2018, the European Union was the third largest producer of sugar in the world, with production of 19.5 million tons, or around 10.2% of world production. Most of the sugar comes from sugar beets, and most of it comes from Northern Europe. France in particular stands out with nearly 33% of European production in 2018, followed by Germany (22%) and Poland (12%) [1]. The sector is concentrated in seven companies, mostly cooperatives, that produce almost 85% of European sugar. In total, 15 groups process 98% of the sugar in the EU at 106 industrial sites.
Settling ponds are generally used by beet sugar industry to depollute their wastewater between January and August. This long-term method of settling is a solution to the problem of wastewater in this industrial sector, once provided sufficient settling surfaces are available [2].
Tereos is one of the biggest sugar producers in Europe, with 5,330,000 tons of sugar produced in 2017 [3].
During the night of 9 April 2020, a dike of a settling pond was broken in the Tereos sugar refinery in Escaudoeuvres. This accident resulted in the release of about 88,000 m³ of beet-washing wastewater (data from BURGEAP office: Bureau d’études en environnement, France) that is very rich in organic matter, occurring in the town of Thun Saint Martin. This washing water discharge quickly saturated the aquatic environment. Several rivers were affected (notably the Raperie, the Erclin and then the Scheldt). Severe deoxygenation and fish mortalities were observed in these rivers [4].
The first results indicated that the rivers received a very large amount of organic matter that could seriously damage aquatic life. Later on, from 20 April, significant fish mortalities were discovered in Belgium. The Walloon Region (Belgium) data reported that 50 to 70 tons of fish died (Département Nature et Forêts, SPW: Service Public de Wallonie, Belgium), and around 100 tons including French fish mortality [4].
The “Voix du Nord” published a map (Figure 1) that shows the extent of the pollution over the Transnational Scheldt and cities where fish mortalities were recorded, along with the dates of these surveys. The Transnational Scheldt Basin in Western Europe is shown in the thumbnail.
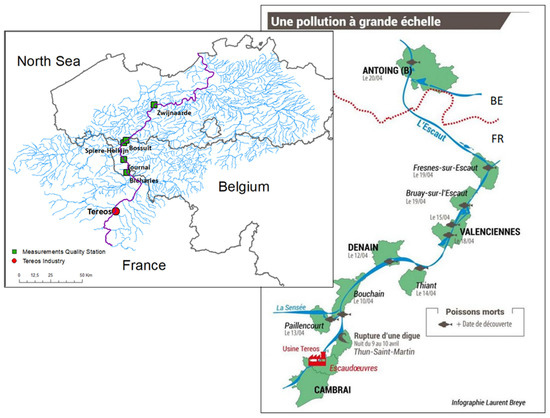
Figure 1.
Pollution cartography: The Transnational District of the Scheldt is illustrated by the thumbnail; the Scheldt River is highlighted in purple on the whole basin network (in blue). The red dot is the Tereos industry; the green squares are the quality stations where measurements were carried out. The right map is from the newspaper «La Voix du Nord».
The local issue spread to neighboring countries because of the transnational basin. This local industrial accident had an effect in several countries (France, Belgium and the Netherlands). This type of accident requires international collaboration between European member states and suitable tools to assess the impact on the aquatic ecosystem.
The main question is whether the Tereos accident could explain the severe deoxygenation observed in the Scheldt. The Pegase model [5,6,7] has former applications on the Transnational Scheldt [8,9]. It is also used solely by all the administrations implied in this study. Therefore, in order to access data feeding the model and to gain from existing expertise, this model was chosen by the Walloon Region for a scientific study. The VMM (VlaamseMilieu Maatschappij, Belgium), the DREAL (Direction Régionale de l’Environnement de l’Aménagement et du Logement, Hauts de France) and the AEAP (Agence de l’Eau Artois-Picardie, France) participated as partners to provide data and follow the study.
The aim of this study is to reproduce the accident and to describe the effects of river pollution. Result analyses may therefore lead the stakeholders to propose measures to be implemented when this type of accident occurs.
2. Materials and Methods
2.1. Data
The sugar campaign of Tereos was carried out from mid-October 2019 until the end of January 2020. The ponds of the industry were then filled with washing water accumulated during this period and slightly diluted by rainwater. During the two months preceding the accident, the suspended solids were settled on the bottom. Aerobic and anaerobic biological processes of self-purification were developed. At the time of the accident, the water should not have been released into the environment.
The BURGEAP office—commissioned by Tereos after the accident—estimated the accidental discharge to a volume of 88,000 m³ of beet-washing water that flooded an area of 240,000 m². The discharge first reached the Erclin River. It went upstream in the neighboring rivers around the Scheldt, due to very low slopes and to flush effect of very high volumes released in a short time.
Data measurements (from Tereos, transmitted by the DREAL to Walloon Region on 6 August 2020) related to the accident itself were carried out on 10 April at 10 a.m. in the remaining pond water. These measurements showed that the wastewater had concentrations in COD (Chemical Oxygen Demand) of 6330 mgO2/L, suspended solids of 342 mg/L and total nitrogen of 42.7 mgN/L. The measurements carried out on 12 May showed total phosphorus of 2.87 mgP/L and COD concentrations of 3975 mgO2/L.
The concentrations measured in the pond by the office mandated by Tereos are presented in Table 1.

Table 1.
Quality measurements carried out in the settling pond on 10 April at around 10 a.m. (from Tereos), except total phosphorus * realized on 12 May.
Campaigns for data measurements were also carried out in rivers after the accident. They showed that the release lasted 30 h. The COD concentrations in the Raperie River, which received the unexpected industrial wastewater, were 7399 mgO2/L on 10 April. Figure 2a shows the evolution of the COD river concentration during April. Figure 2b shows the dissolved oxygen concentrations during April. The dissolved oxygen collapsed to 1.23 mg/L on 10 April, preventing the survival of any aquatic organism. Note that a second discharge was observed on 14 and 15 April.
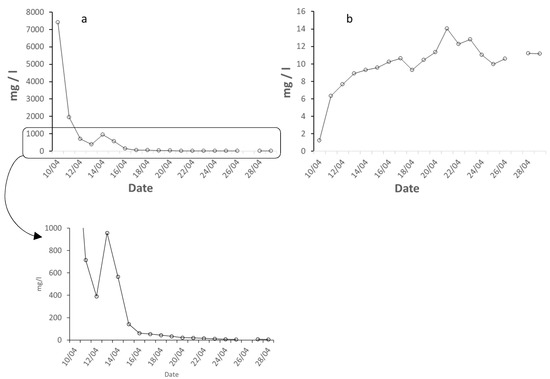
Figure 2.
COD (a) and dissolved oxygen (b) concentrations in the Raperie River between 10 April and 29 April. The amount of COD reaching the Erclin and afterwards the Scheldt is enormous: 564 tons in 30 h, which means about 4 million equivalent-inhabitants (EI), (Supplementary Material Figure S1: Non-stationary flows and cumulated release of COD discharged from the Tereos settling pond in the Erclin). The quantities of nitrogen (3805 kg of N, equal to 300,000 EI) and phosphorus (256 kg of P, equal to 200,000 EI) are significantly lower.
Before the breakage of the dike of the Tereos sugar industry in Escaudoeuvres, the volume of stored water in the settling pond was 108,000 m³. Following the breakage of the pond occurring on 9 April 2020, around 88,000 m³ of beet-washing water was discharged into the Raperie watercourse, which flows into the Erclin, near its confluence with the Scheldt. The volume was released in about thirty hours.
The flows were automatically measured (every quarter-hour) on the Scheldt at the Iwuy lock by the DREAL showed a sudden rise on 10 April at 10 a.m. as a consequence of the 88,000 m³ released in 30 h (Figure 3). The flow increased from 4.21 m³/s on 9 April at 11:45 p.m. to 6.13 m³/s on 10 April at 1 a.m. The flow at Iwuy decreased in a linear way from 10April at 1 a.m. and recovered regular values during 11 April.
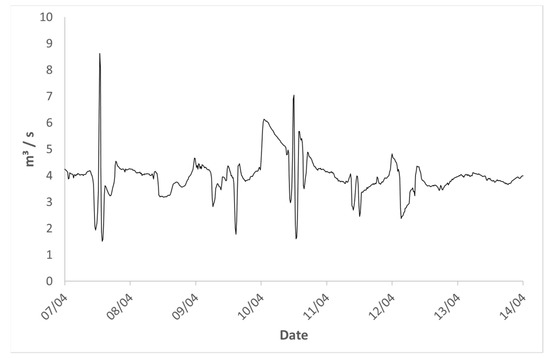
Figure 3.
Flows measured at the Iwuy lock in April 2020 on the Scheldt.
Sugar industries using beets for their sugar production have to treat their industrial wastewater before discharging it into the rivers. The objective is to minimize the impact of a massive pollutant discharge produced over a short period of time. The sugar campaign, oscillating between 80 and 100 days, starting in September, takes place at a time of the year when the rivers are still relatively close to low flows. It is therefore important to store wastewater [1]. The release into the environment can be carried out over a very long period, sometimes over the twelve months of the year. A natural improvement in the quality of wastewater occurs under self-purification. This phenomenon results in a sharp decrease in oxidizable matters.
Many authors report that water pollution increases throughout the sugar season and ends up reaching COD of 6500 mg/L [10]. Other literature describes values for sugar beet industry in COD about 3000 to 7000 mg/L [1,11], with maximum of 18,000 mg/L [12]. The settling wastewater is mainly composed of COD (slowly degradable organic carbon estimated at 60%), typical of the sugar industry [12].
A study from the Artois-Picardie Agency (studies of J.C. Noël, 1970–1971, Supplementary Material Figure S2: Settling wastewater time evolution in COD and BOD) demonstrated that, at the beginning of April, the COD concentrations in the settling ponds are still very high, close to their maximum values as the natural self-purification process in storage water has not started yet. It is only from May, with the rise of temperatures, that self-purification begins, resulting in rapid COD concentrations decrease. In August, before the next campaign, the concentrations fall to values compatible with their discharge into surface water.
Settling wastewater is mainly composed of COD, with a COD:BOD (Biological Oxygen Demand) ratio of about 65% (Supplementary Material Figure S3: Settling wastewater evolution with weeks (7 months during post-campaign) [13]. The COD concentrations are still very high 3 months after the end of the harvesting period (12th week). Dissolved oxygen is absent until the 28th week. These experiences indicate that mechanical aeration is helpful in deep pond treatment of sugar beet wastewaters, due to both oxygen addition and mixing.
2.2. Method
This paper is focused on the development and the use of a method describing the POMD method (processes of organic matter degradation). This method gets information and structured data from the operational model used by the administrations (complete river network, hydrodynamics, etc.).
2.2.1. Mathematical Representation
For the last 20 years, the development of dynamical mechanistic models of pollutant transport and water quality assessment in the drainage network river systems has been extensive [14,15,16,17]. However, most of the existing models do not meet all the requirements of the WFD (Water Framework Directive 2000/60/EC) [18].
The main processes involving organic matter in a river ecosystem are represented in the POMD method. This method is applied to the entire and spatially discretized hydrographic networks of the Scheldt District.
The following 2D advection/dispersion equation describes and resolves the fate of the concentration C(x,t) of organic matter (considering non-stationary source terms) at any point of the river:
The equation contains the following:
- -
- A term of advection describing the transportation of the pollutant along the river;
- -
- A term of longitudinal dispersion describing the “mixing” of pollutants in the river (it is constituted by “true turbulence” and the additional term of “shearing diffusion”);
- -
- A term of injection of upstream supplies and releases in discrete points;
- -
- A term describing the load brought by the upstream tributaries , and a term composed of internal production and disappearances .
where:
- -
- is the evolution of the concentration C (g/m³) in water with time (s)
- -
- is the velocity of the stream (m/s)
- -
- is the spatial evolution (m) of the concentration C (g/m³) in water
- -
- is the hydrodynamic dispersion coefficient (m²/s)
- -
- is the release (g/s) in the river
- -
- is the right section of the river (m²) at the release point
- -
- is the distance (m) from the river source
- -
- is the distance (m) from the river source of the release point
- -
- is the distance (m) from the river source of the tributary k
- -
- is the flow (m³/s) of the tributary k
- -
- is the concentration (g/m³) of the tributary k
- -
- is the right section (m²) at the confluence with the tributary k
- -
- is the productions (g.m−³.s−1)
- -
- is the disappearances (g.m−³.s−1)
The Figure 4 shows the processes of organic matter degradation as implemented in this paper. The dissolved organic matter and the fine particulate organic matter are transported downstream by the flow. They are progressively decomposed by the suspended heterotrophic bacteria and the biofilm present on the bottom. Part of the organic nitrogen is assimilated by the bacteria, and the rest of the organic nitrogen is released as ammonium (NH4+). Part of the organic phosphorus is assimilated by the bacteria, and the rest of the organic phosphorus is released as orthophosphates (PO43−). Part of the organic carbon is assimilated by bacteria, and the rest is transformed into CO2. This oxidation is accompanied by the consumption of oxygen.
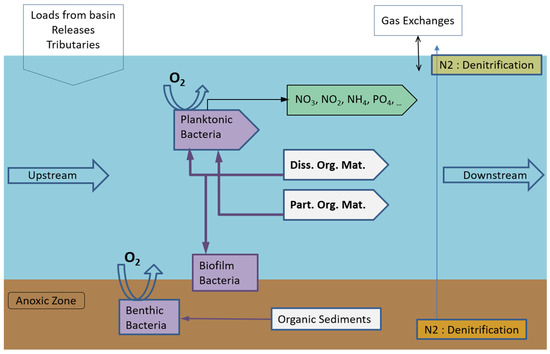
Figure 4.
Simplified representation of the processes of organic matter cycle.
The ammonium emitted by the degradation of organic matter can be transformed into nitrites (NO2−), and then into nitrates (NO3−) by autotrophic bacteria. The inorganic elements present in the discharge or released by the degradation of organic matter (NH4+, NO3−, PO43−, CO2...) can be assimilated by primary producers for their growth, ensuring at the same time oxygen production in the water column.
Anaerobic processes in the water column are considered in the organic matter cycle representation. The rate of degradation of organic matter (relative to bacterial biomass) remains constant, whether in an aerobic or anaerobic condition. If the oxygen concentration drops close to zero (anaerobic conditions), the degradation of the organic matter continues first by using nitrates as oxidants [19,20]. This has the consequence that the growth yield of bacteria decreases (and therefore their actual growth). The nitrification process stops and the nitrate concentration in the water column decreases according to the demand for oxidants to ensure the degradation of organic matter. If the nitrate concentration also drops to around zero, then the degradation process still continues using other oxidants (which are assumed to be in sufficient quantity to be not limiting). The growth yield of bacteria further decreases (to reach values around 10%). The validation of the organic matter representation is demonstrated, even in extreme environmental conditions such as in the Tereos accident.
2.2.2. Scheldt Application
The Transnational Scheldt District represents an area of 20,020 km². The simulated hydrographic network includes 858 rivers and 8702 km of river network.
At the beginning of the 2000s, the administrations (the Artois-Picardie Water Agency, the Walloon Region and the Flemish Region) used the Pegase model to challenge their own water management plans. In order to enhance information exchanges in the WFD context, and at the request of the Walloon Region, a transnational application was constructed [9].
In the scope of the present study, an update of the previous databases was carried out on the year 2020. The new updated Scheldt District application has been used to (i) simulate the industrial accident, (ii) assess the consequences of this large-scale pollution and (iii) serve as a management tool for the administrations concerned by this pollution. The transboundary modelling of the International Scheldt District has allowed for better understanding and describing the nature and the dynamics of this pollution in all watercourses.
Hydro-meteorological measurements were updated on the period of January to May 2020. As it is necessary to know the flows in the rivers (as they influence strongly the water quality), daily flows were used from several gauging stations spread over the studied watershed. The flow values used for the simulations are those on the Scheldt in Tournai (Walloon Region, data from SPW-DGO2), Spiere (Flemish Region, data from VMM), Maulde on the Scheldt and Mortagne on the Scarpe (France, data from DREAL). The river temperatures were also used from their measurements at Bléharies on the Scheldt. The insolation data used in this study were measured at Maastricht.
The release data (pollution loads) of the Scheldt application were updated in the year 2020 from the databases of the three administrations (AEAP, SPW and VMM).
The accidental release from the Tereos settling pond is simulated as a non-stationary release and described as follows:
- -
- The release started on 10 April at 12 a.m. and ended on 11 April at 6 a.m. (during 30 h);
- -
- The maximum release occurred on 10 April at midnight (discharge flow rate of 1.5–2 m³/s), decreasing linearly until 11 April at 6 a.m.. At that date and hour, the flow rate of the release fell down to zero;
- -
- The initial concentration of pollutants was considered as the one measured originally in the pond;
- -
- The punctual release of pollutants was located on the Erclin, at its confluence with the Raperie watercourse.
The release was injected as a series of constant releases over a period of 3 h. When the release stopped, the cumulated volumes were about 89,100 m³.
The simulations allow for calculating at an hourly timescale the evolution in April 2020 of the dissolved oxygen concentrations, chemical oxygen demand, biochemical oxygen demand, organic carbon and the concentrations of the different forms of nitrogen and phosphorus. These variables are calculated on the whole Scheldt basin, including the Scheldt River, from its confluence with the Erclin (place where polluted wastewater discharged in the Scheldt) to the Ghent region, i.e., about 120 km (hydrological functioning becomes much more complex from Ghent, supply of many canals from the Scheldt).
3. Results and Discussion
3.1. Accidental Release in the Scheldt
The accidental release occurred at the confluence of the Erclin in the Scheldt (at 45.8 km of the French part of the Scheldt). The simulation considers a volume of 89,100 m³ of wastewater discharged in the environment with a COD concentration of 6300 gO2/m³.
The first analysis of the results in Walloon Region shows the dissolved oxygen concentrations calculated (hourly values) and measured (continuous hourly measurements) at Bléharies (data from SPW) in Figure 5a (Walloon Region, 2 km after the border) and Spiere (data from VMM) and Figure 5b (Flemish Region, at the border between the Walloon and the Flemish Regions).
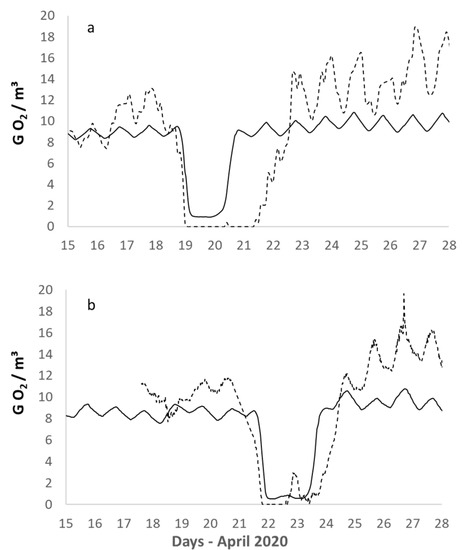
Figure 5.
Dissolved oxygen concentrations calculated (continuous line) and measured (dotted line) at Bléharies, Walloon Region (a) and at Spiere, Flemish Region (b).
The decreases of calculated oxygen concentration are correctly represented (especially at Spiere). The collapse of oxygen concentrations accompanying the pollution is well modelled, both in terms of the occurrence date and the speed of the concentrations’ decrease: 19 April around midnight in Bléharies and 21 April around noon in Spiere.
Note that the oxygen concentration variations before and after the accident are due to primary production.
We then analyze the daily concentrations of oxygen, COD and nitrates. These values are compared with non-continuous measurements carried out mainly by the Flemish Region. The Figure 6 shows the concentration curves of the Scheldt at Bossuit (33.1 km), a few kilometers downstream the boundary between the Walloon and the Flemish Regions a few kilometers downstream the boundary between the Walloon and the Flemish Regions. The Figure 6a shows a very good agreement between the measured and the calculated values of dissolved oxygen. The Figure 6b shows the calculated and measured values of nitrates (N-NO3). This graph is very interesting, because the drastic decrease of nitrate concentrations (measured and calculated) correlated with the pollution is highlighted due to the intense denitrification occurring in the water column because of the absence of oxygen. This shows that the method has correctly considered these denitrification processes.
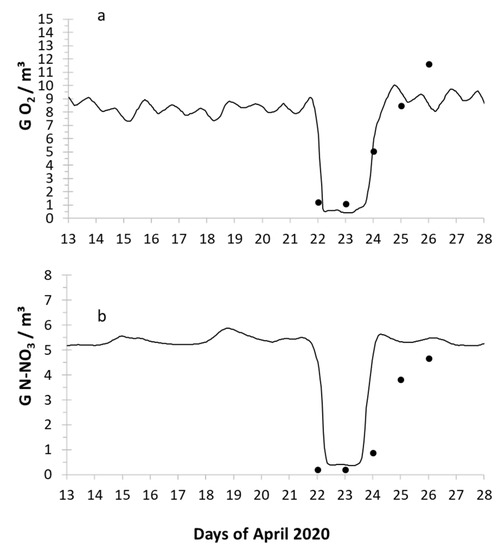
Figure 6.
Dissolved oxygen concentrations (a) and nitrate concentrations (b) calculated (curve) and measured (dots) in Bossuit, Flemish Region.
3.2. Organic Matter Loads
On the French part of the Scheldt, the simulation results show a very high organic matter load in the Scheldt water column. Figure 7a shows the COD concentration in the Scheldt at 46.4 km, about 600 m after the confluence with the Erclin. The concentration reached 1700 gO2/m³ in the early hours of 10 April.
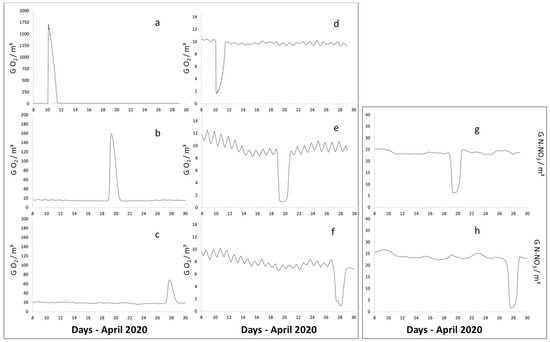
Figure 7.
Note that the Scheldt is cut in two parts (French one and Belgian one) for the modelling. Temporal evolution of the calculated concentrations on the Scheldt (French part, 46.43 km from the source, Estrun) in COD (a) and dissolved oxygen (d). Temporal evolution of the calculated concentrations on the Scheldt (Belgian part, 2.2 km from the border, Bléharies) in COD (b), dissolved oxygen (e) and nitrates (g). Temporal evolution of the calculated concentrations on the Scheldt (Belgian part, 77.51 km from the border, Zwijnaarde) in COD (c), dissolved oxygen (f) and nitrates (h).
About 8 km downstream (at 54 km), the COD concentration decreased to 1040 gO2/m³ on 11 April around 18 p.m.
3.3. Deoxygenation
The results show severe deoxygenation in the water column near the accidental release (Figure 7d). The contaminated water spread in all the rivers located upstream of the settling pond up to several hundred meters before flowing down into the Scheldt. As the discharge was mainly composed of slowly degradable matters [12], the pollution spread very far, polluting about 120 km of rivers.
At 46.4 km, the dissolved oxygen in the water column drops sharply to 1.5 gO2/m³ on 10 April at 2 a.m. The discharge ends on 11 April at 6 a.m., and the system recovered with a dissolved oxygen concentration of 9.1 gO2/m³ on 11 April at 9 a.m.
Downstream, the pollution reached 54.2 km of the French part of the Scheldt on 11 April at 1 p.m., which also caused the collapse of dissolved oxygen concentration (0.15 gO2/m³), with a 40 h lasting anoxia (dissolved oxygen concentration of 8.5 gO2/m³ on 13 April at 5 a.m.).
The pollution was transported about 7.8 km in 35 h, which corresponds to 5.3 km/day.
The pollution impacted the Belgian Scheldt between 18 and 19 April. The dissolved oxygen concentration decreased at the Bléharies station (2.2 km of the Belgian part of the Scheldt) from 19 April at midnight until 20 April at 11 a.m. The dissolved oxygen concentration dropped to 1 gO2/m³ (Figure 7e). These anoxic conditions lasted until 20 April in the early afternoon.
The pollution plume reached Zwijnaarde (77.5 km of the Belgian part of the Scheldt) on 27 April at 3 a.m., and the dissolved oxygen concentration was about 0.85 gO2/m³ around 28 April at 3 a.m. (Figure 7f).
3.4. Nitrates
The results (Figure 7g,h) show a drop in nitrates when the pollution reached the Belgian border from 18 April (when the first fish mortalities were observed).
When the pollution reached the border, there was still oxygen in the water column available, especially for heterotrophic bacteria. At this time, the degradation rate was at the maximum. When all the oxygen was consumed, bacteria used nitrates as oxidants, with a lower growth yield, resulting in lowering balance concentration of bacteria. The nitrification process stopped and the nitrate concentration in the water column decreased according to the demand for oxidants to ensure the degradation of organic matter.
The nitrates were almost completely consumed at Zwijnaarde during the 27 April (concentrations of 1 gN-NO3/m³).
3.5. Describing the Transborder Pollution
These graphs represent the overlapping of the dissolved oxygen, COD and nitrate concentrations calculated on the Scheldt (French and Belgian parts). They allow for tracking the pollution that progressed along the river. Successively, the pollution reached stations and cities on the Scheldt River and generated anoxia for many hours.
The Figure 8a–c and Figure 9a–c show the longitudinal profiles of COD, dissolved oxygen and nitrate concentrations over the French Scheldt and the Belgian Scheldt at four different dates. The 12, 14, 16 and 18 April 2020 at 11:30 a.m. on the French Scheldt and the 20, 22, 24 and 26 April 2020 at 11:30 a.m. on the Belgian Scheldt.
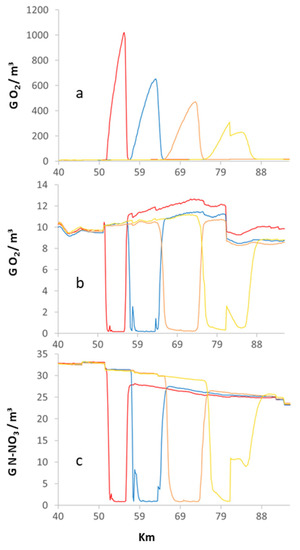
Figure 8.
Longitudinal evolution of concentrations calculated on the French part of the Scheldt on 12, 14, 16 and 18 April at 11:30 a.m.: COD (a), dissolved oxygen (b) and nitrates (c).
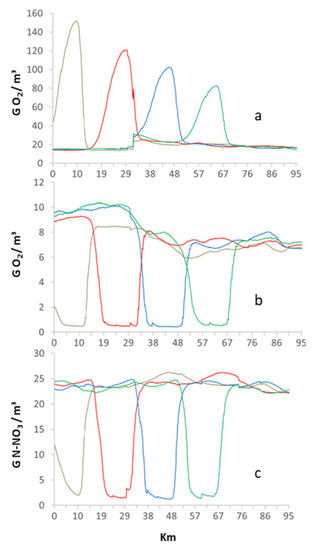
Figure 9.
Longitudinal evolution of concentrations calculated on the Belgian part of the Scheldt on 20, 22, 24 and 26 April at 11:30 a.m.: COD (a), dissolved oxygen (b) and nitrates (c).
The pollution plume progressed regularly (around 5 km/day in the French Scheldt, and 10 km/day in the Belgian Scheldt). The “COD peak” decreased gradually, due to (i) the degradation of organic matter, (ii) the dilution by tributaries and (iii) the longitudinal dispersion. The plume gradually spread out, due to the longitudinal dispersion.
Figure 8a shows the maximum COD concentrations calculated on 12 April around 1000 gO2/m³, which is absolutely compatible with the concentrations of 1300 gO2/m³ measured by Tereos at the confluence between the Scheldt and the Erclin on 10 April.
3.6. Preliminary Conclusions
The representation of organic matter processes (including transport) helps to better understand the behavior of the ecosystem, in particular when an industrial accident occurs.
The POMD method calculates, among others, the anoxia in the Scheldt River following the accident. It shows also the duration of the anoxia and its propagation throughout the river network. It permits to assess the time transfer of water flows. It allowed for tracking the pollution of organic matters.
The POMD method confirms that the release of organic matter at Escaudoeuvres correctly explains and describes the impacts observed and measured in the rivers. The dissolved oxygen concentrations calculated in the Scheldt are validated by the measurements from the Walloon and Flemish Regions.
4. Conclusions
The agro-alimentary sector, including sugar industries, is the largest industrial sector in France. The sugar industries use water to wash beets and consequently generate a large amount of wastewater characterized by very high concentrations of organic matters. These wastewaters are stored in settling ponds for months to reduce the level of organic carbon according to biological processes.
The Tereos accident happened at the worst time of the year, two months after the beet harvest. In spring, the self-purification has not yet started, and the COD concentrations in the settling ponds were therefore maximum. Moreover, the Scheldt flow was already very low in early April due to very low rains since 15 March 2020. The accident (the dike breakage) induced the release of 88,000 m³ of wastewater loaded with organic carbon. The consumption of dissolved oxygen in order to degrade organic matter in the aquatic environment led to a rapid reduction of the amount of available oxygen. The anoxic situation that was developed in the Scheldt lasted a few hours (up to 40 h, varying by location), and spread over more than 120 km. This anoxia did not occur homogeneously and simultaneously throughout the disaster area of the Scheldt. The pollution was transported downstream following the river flows, collapsing the aquatic ecosystem. The scale of this ecological disaster has rarely been recorded (by monitoring network) in Western Europe, as a direct consequence of an industrial accident. The physico-chemical recovery of the aquatic ecosystem followed the same shape of wave front evolution downstream of the river. The dissolved oxygen concentrations re-increased and returned to acceptable values for life in a few hours.
We can conclude that this accidental pollution is an ecological calamity. The consequences on the ecosystem are dramatic and extensive. The organic loads released in a short time in the Scheldt have broken off the functioning of the ecosystem by consuming all the oxygen. The present study simulates how the aquatic ecosystem behaved during this accidental pollution. The POMD method can numerically reproduce this accident and calculate the impact on the environment.
This study emphasizes the interest of using a descriptive method to better consider accidental releases that provide useful additional widespread information in all basins (local, national and transnational) to the stakeholders.
After the accident, Tereos industry carried out measurements of the water quality discharged into the river network, as well as an estimation of the quantity of water discharged into the environment. This information would have been very useful 1 or 2 days after the accident to enable authorities to carry out simulations earlier. This would have made it possible to predict deoxygenation in the downstream part of the Scheldt, and therefore set up preventive measures (reoxygenation, fish transfers, etc.) as were partially implemented, but later on, in Flanders.
The modelling-based method constitutes an alert tool adapted to specific circumstances of releases with the objective to inform neighboring regions or countries of a water pollution and basin management agencies, international commissions or other administrative stakeholders to prevent or try to reduce catastrophic consequences.
Supplementary Materials
The following are available online at https://www.mdpi.com/article/10.3390/hydrology8040175/s1. Figure S1 Non-stationary flows and cumulated release of COD discharged from the Tereos settling pond in the Erclin; Figure S2: Settling wastewater time evolution in COD and BOD; Figure S3: Settling wastewater evolution with weeks (7 months during post-campaign).
Author Contributions
Investigation, A.G. and E.E.; Validation, A.G. and E.E.; Writing—Original Draft: A.G.; Project administration, J.-F.D.; Supervision, J.-F.D.; Conceptualization, J.-F.D. and E.E.; Methodology, J.-F.D., E.E. and P.M.; Writing—Review and Editing, J.-F.D.; Formal analysis, E.E.; Software, P.M. All authors have read and agreed to the published version of the manuscript.
Funding
This research received no external funding.
Institutional Review Board Statement
Not applicable.
Informed Consent Statement
Not applicable.
Data Availability Statement
Flemish Environment Agency (VMM), Belgium (https://www.vmm.be/; accessed on 1 September 2020); Artois-Picardie Water Agency (AEAP), France (http://www.eau-artois-picardie.fr/, accessed on 1 September 2020); DREAL (Direction Régionale de l’Environnement de l’Aménagement et du Logement) Hauts de France, who provided data.
Acknowledgments
The authors wish to express their thanks to the administrations that made this study possible: the Operational Directorate General for Agriculture, Natural Resources and the Environment, Walloon Public Service, Belgium (SPW-DGARNE-DGO3) (http://spw.wallonie.be/?q=dgo3, accessed on 1 September 2020), who supported the study.
Conflicts of Interest
The authors declare no conflict of interest.
References
- Eurostat Data (2018). Available online: https://www.agriculture-strategies.eu/en/2019/07/the-european-sugar-policy-a-policy-to-rebuild (accessed on 4 September 2020).
- Sanquer, J. Le traitement et le recyclage de l’eau dans les industries agro-alimentaires. La Houille Blanche 1975, 5–6, 379–386. [Google Scholar] [CrossRef][Green Version]
- CGB Report 2018. Available online: http://www.cgb-france.fr/wp-content/uploads/2019/01/ra2018-livre-bd-v2-1.pdf (accessed on 4 July 2020).
- «La voix du Nord», Élodie Armand, 23/04/2020. Available online: https://www.lavoixdunord.fr/741925/article/2020-04-16/poissons-morts-dans-le-valenciennois-et-le-cambresis-tereos-mise-en-cause-dans (accessed on 16 July 2020).
- Everbecq, E.; Grard, A.; Magermans, P.; Deliège, J.F. Water Framework Directive and modelling using PEGOPERA simulation software. J. Model. Optim. 2019, 11, 36–50. [Google Scholar] [CrossRef]
- Deliège, J.F.; Everbecq, E.; Magermans, P.; Grard, A.; Bourouag, M.; Blockx, C. PEGASE, a software dedicated to Surface Water Quality Assessment and to European database reporting. In Proceedings of the European conference of the Czech Presidency of the Council of the EU Towards Environment, Opportunities of SEIS and SIZE: Integrating Environmental Knowledge in Europe, Masaryk University, Brno, Czech Republic, 26 March 2009; pp. 24–32. [Google Scholar]
- Deliège, J.F. Méthode d’intégration de Modèles adaptée aux Systèmes Hydrologiques Multicompartimentés. Ph.D. Thesis, Sciences de l’ingénieur, Université de Liège, Liège, Belgium, 2013. [Google Scholar]
- Interreg IIIB ENO Scaldit Project. Analyse Transnationale de l’état des Lieux du District Hydrographique International de l’Escaut: Projet Pilote Pour le Test Des Documents Guides Européens. Report, Décembre 2004. Available online: http://environnement.wallonie.be/rapports/de/2004/eau2004.pdf (accessed on 20 July 2020).
- Grard, A.; Everbecq, E.; Bourouag, M.; Lange, S.; Deliège, J.F.; Smitz, J. Modélisation Transnationale de la Qualité de l’eau de Surface du Bassin de l’Escaut dans la Perspective de la Coordination DCE: Situation de référence (Année 2000/2002) et Scénario Prospectif 2015-Mesures de Base; Service Public de Wallonie: Namur, Belgium, 2006; 54p. [Google Scholar]
- Manivasakam, N. Industrial Effluents Origin, Characteristics, Effects, Analysis and Treatment; Chemical Publishing Company, 2016; 592p. [Google Scholar]
- Simpson, D.E.; Hemens, J.; Cox, S.M.H. Aerobic Treatment of Sugar Mill Effluent with the Addition of Nutrients. In Proceedings of the South African Sugar Technologists’ Association, June 1972; Available online: http://citeseerx.ist.psu.edu/viewdoc/versions?doi=10.1.1.381.5735 (accessed on 20 July 2020).
- Simpson, D.E.; Hemens, J. Activated sludge treatment of sugar mill/wattle bark mill effluents at Dalton, Natal. In Proceedings of the South African Sugar Technologists’ Association, June 1978; Available online: https://www.researchgate.net/publication/242528498_ACTIVATED_SLUDGE_TREATMENT_OF_SUGAR_MILWAlTLE_BARK_MILL_EFFLUENTS_AT_DALTON_NATAL (accessed on 20 July 2020).
- Fischer, J.H. Biological Treatment of Concentrated Sugar Beet Wastes; Office of Research and Development, U.S. Environmental Protection Agency: Washington, DC, USA, 1974; 98p. [Google Scholar]
- Loucks, D.P.; Van Beek, E. Water Resources Systems Planning and Management: An Introduction to Methods, Models and Applications; UNESCO: Paris, France, 2005; p. 698. [Google Scholar]
- Tsakiris, G.; Alexakis, D. Water quality models: An overview. Eur. Water 2012, 37, 33–46. [Google Scholar]
- Sharma, D.; Kansal, A. Assessment of river quality models: A review. Rev. Environ. Sci. Biotechnol. 2013, 12, 285–311. [Google Scholar] [CrossRef]
- Wang, Q.; Li, S.; Jia, P.; Qi, C.; Ding, F. A review of surface water quality models. Sci. World J. 2013, 2013, 231768. [Google Scholar] [CrossRef] [PubMed]
- Directive 2000/60/EC of the European Parliament and of the Council of 23 October 2000 Establishing a Framework for Community Action in the Field of Water Policy. Official Journal of the European Communities L 327. p. 72. Available online: https://eur-lex.europa.eu/legal-content/EN/TXT/PDF/?uri=OJ:L:2000:327:FULL&from=EN (accessed on 30 August 2020).
- Billen, G.; Garnier, J. Nitrogen transfer through the Seine drainage network: A budget based on the application of the ‘Riverstrahler’ model. Hydrobiologia 2000, 410, 139–150. [Google Scholar] [CrossRef]
- Garnier, J.; Billen, G.; Sanchez, N.; Leporcq, B. Ecological functioning of the Marne reservoir (upper Seine basin, France). Regul. Rivers Res. Mgmt. 2000, 16, 51–71. [Google Scholar] [CrossRef]


Publisher’s Note: MDPI stays neutral with regard to jurisdictional claims in published maps and institutional affiliations. |
© 2021 by the authors. Licensee MDPI, Basel, Switzerland. This article is an open access article distributed under the terms and conditions of the Creative Commons Attribution (CC BY) license (https://creativecommons.org/licenses/by/4.0/).