
A Multidisciplinary Approach to Evaluate the Effectiveness of Natural Attenuation at a Contaminated Site


Abstract
:1. Introduction
2. Materials and Methods
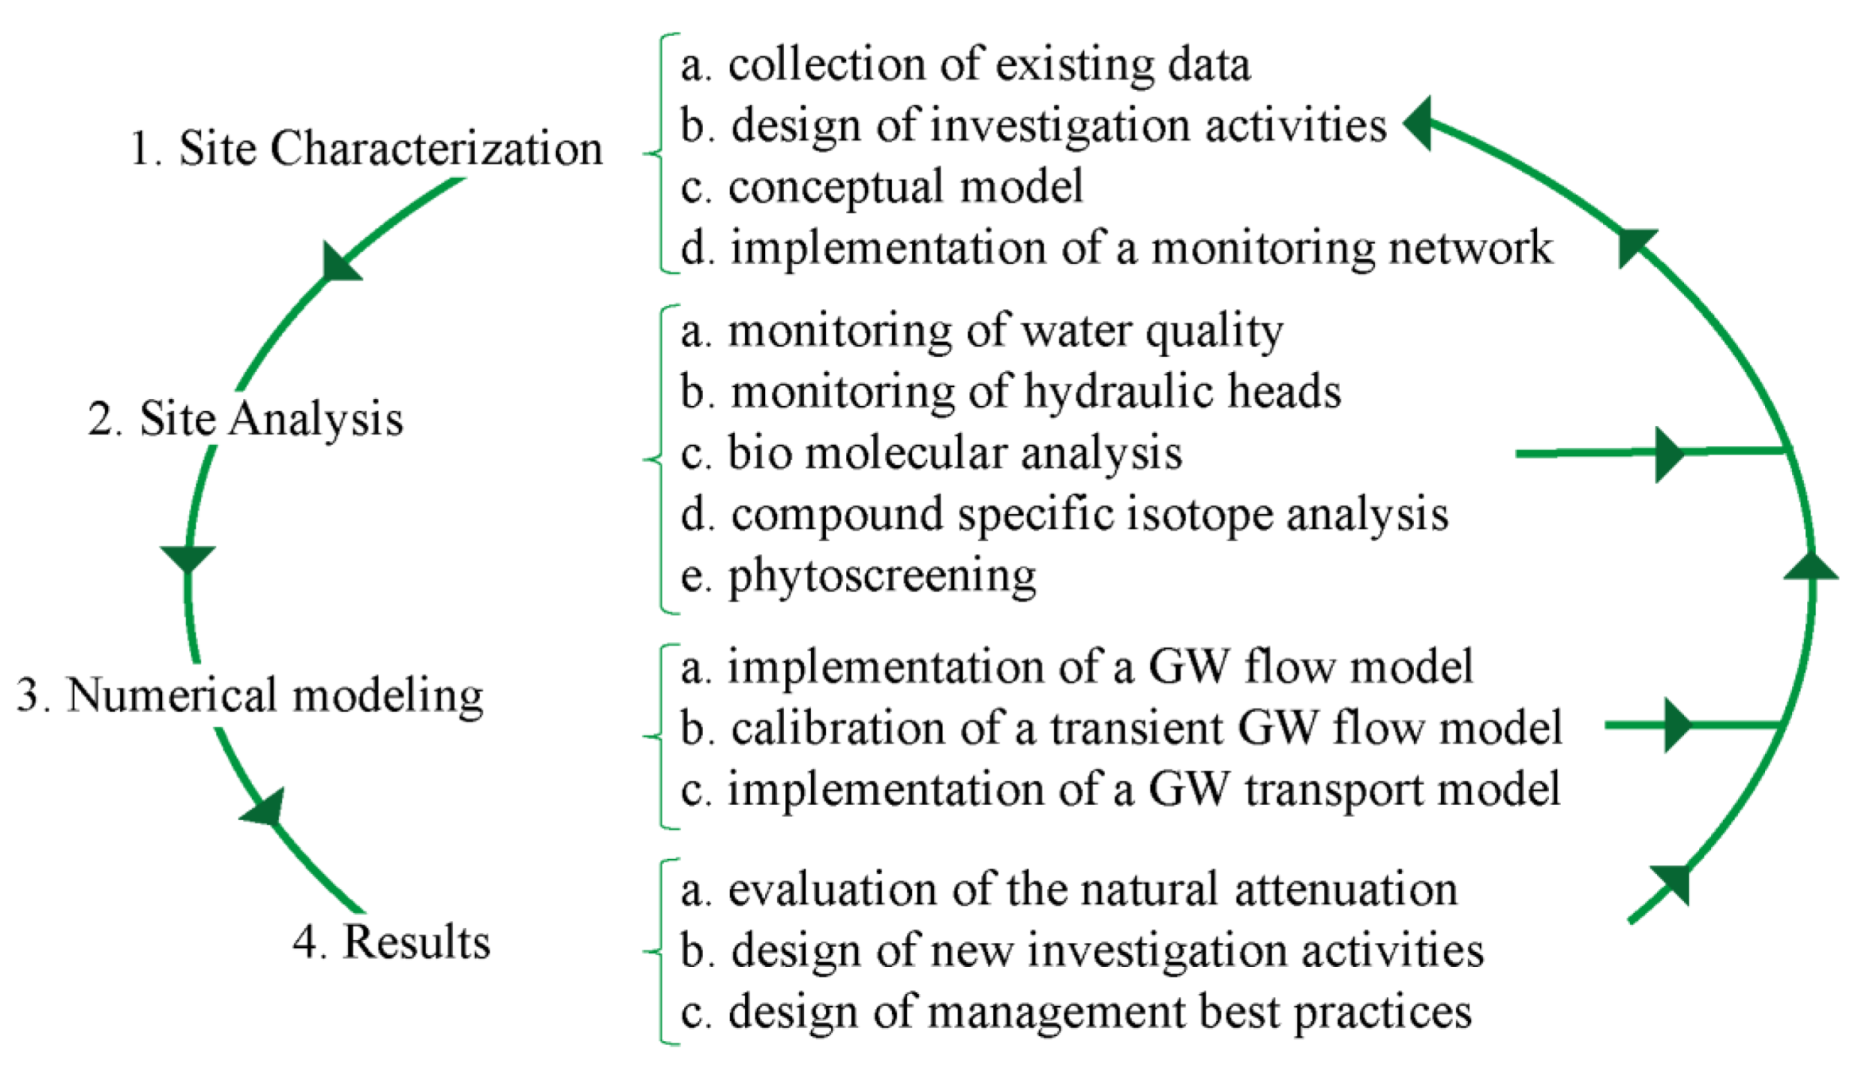
2.1. Integrated Multi Step Circular Approach
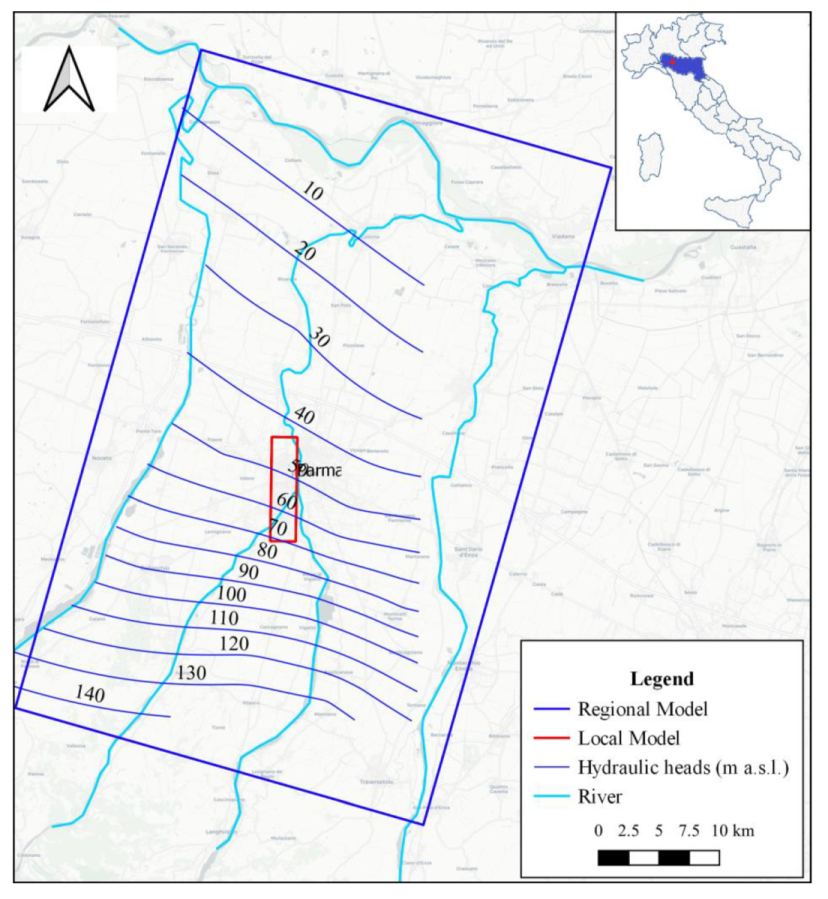
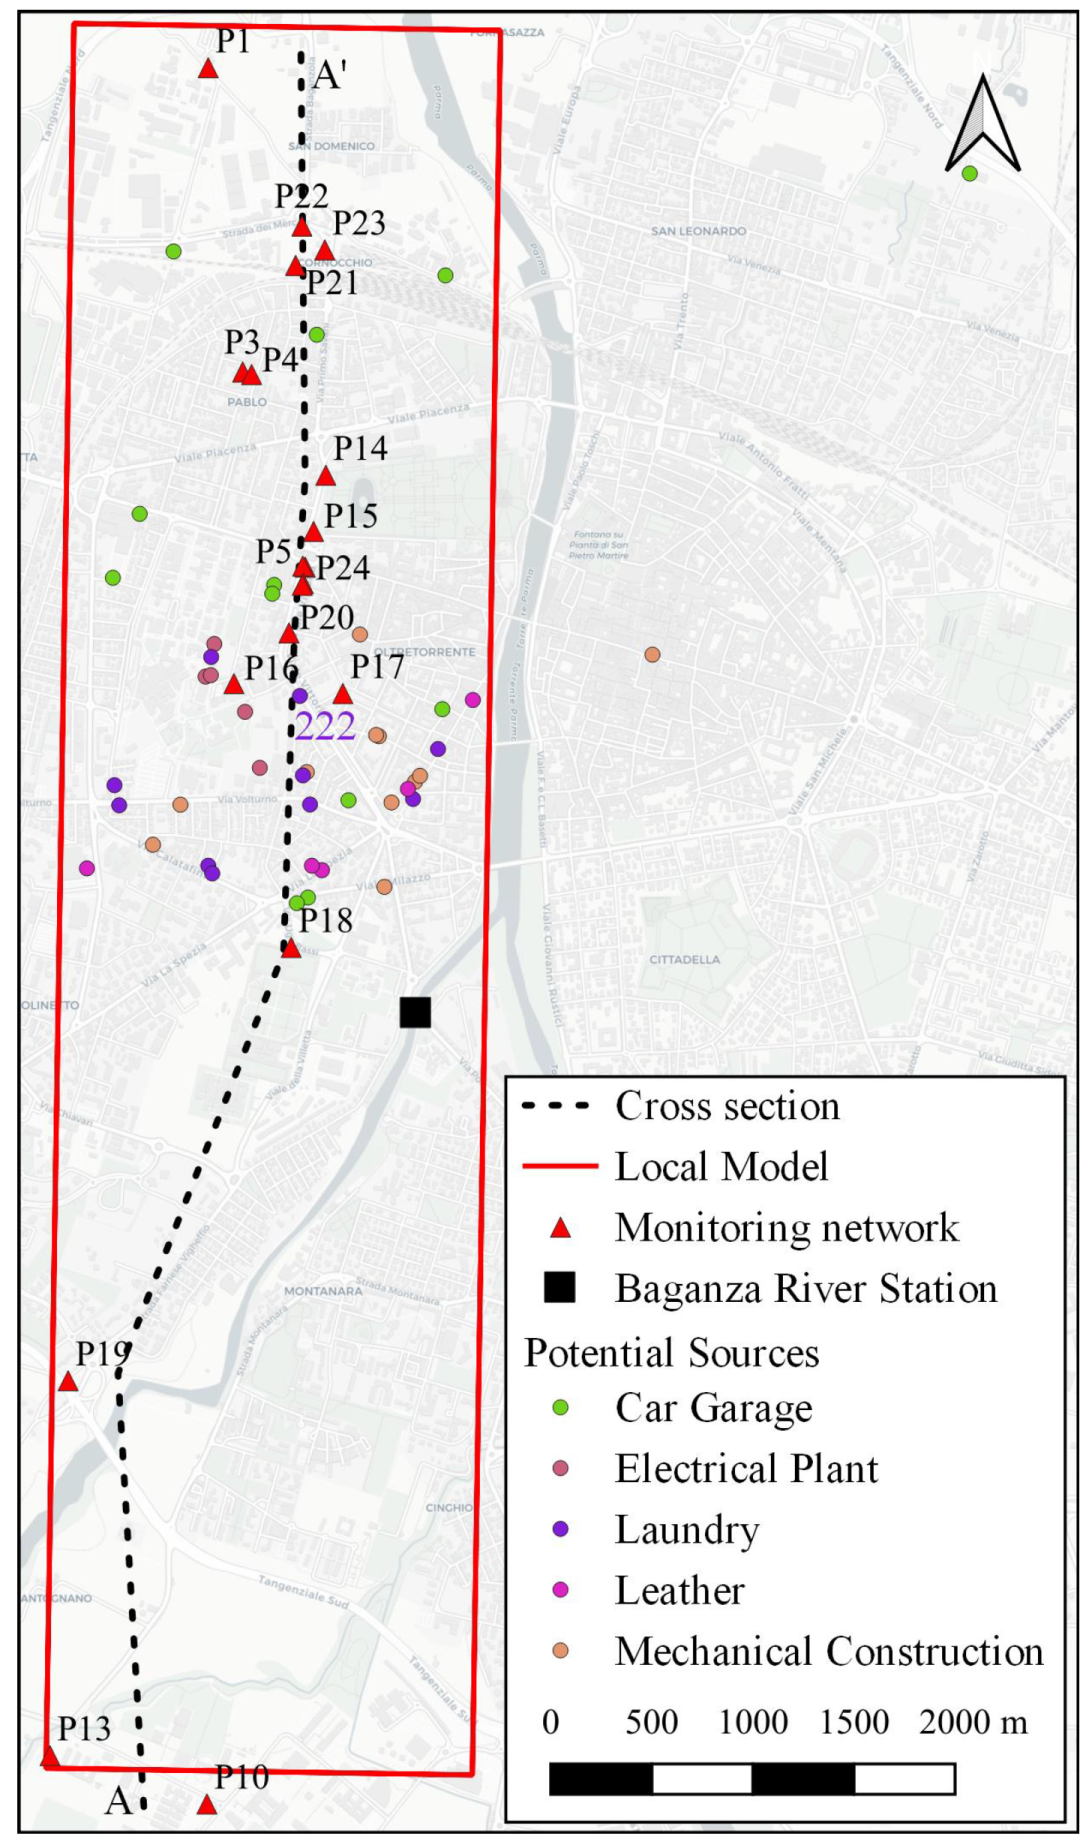
2.2. Study Area
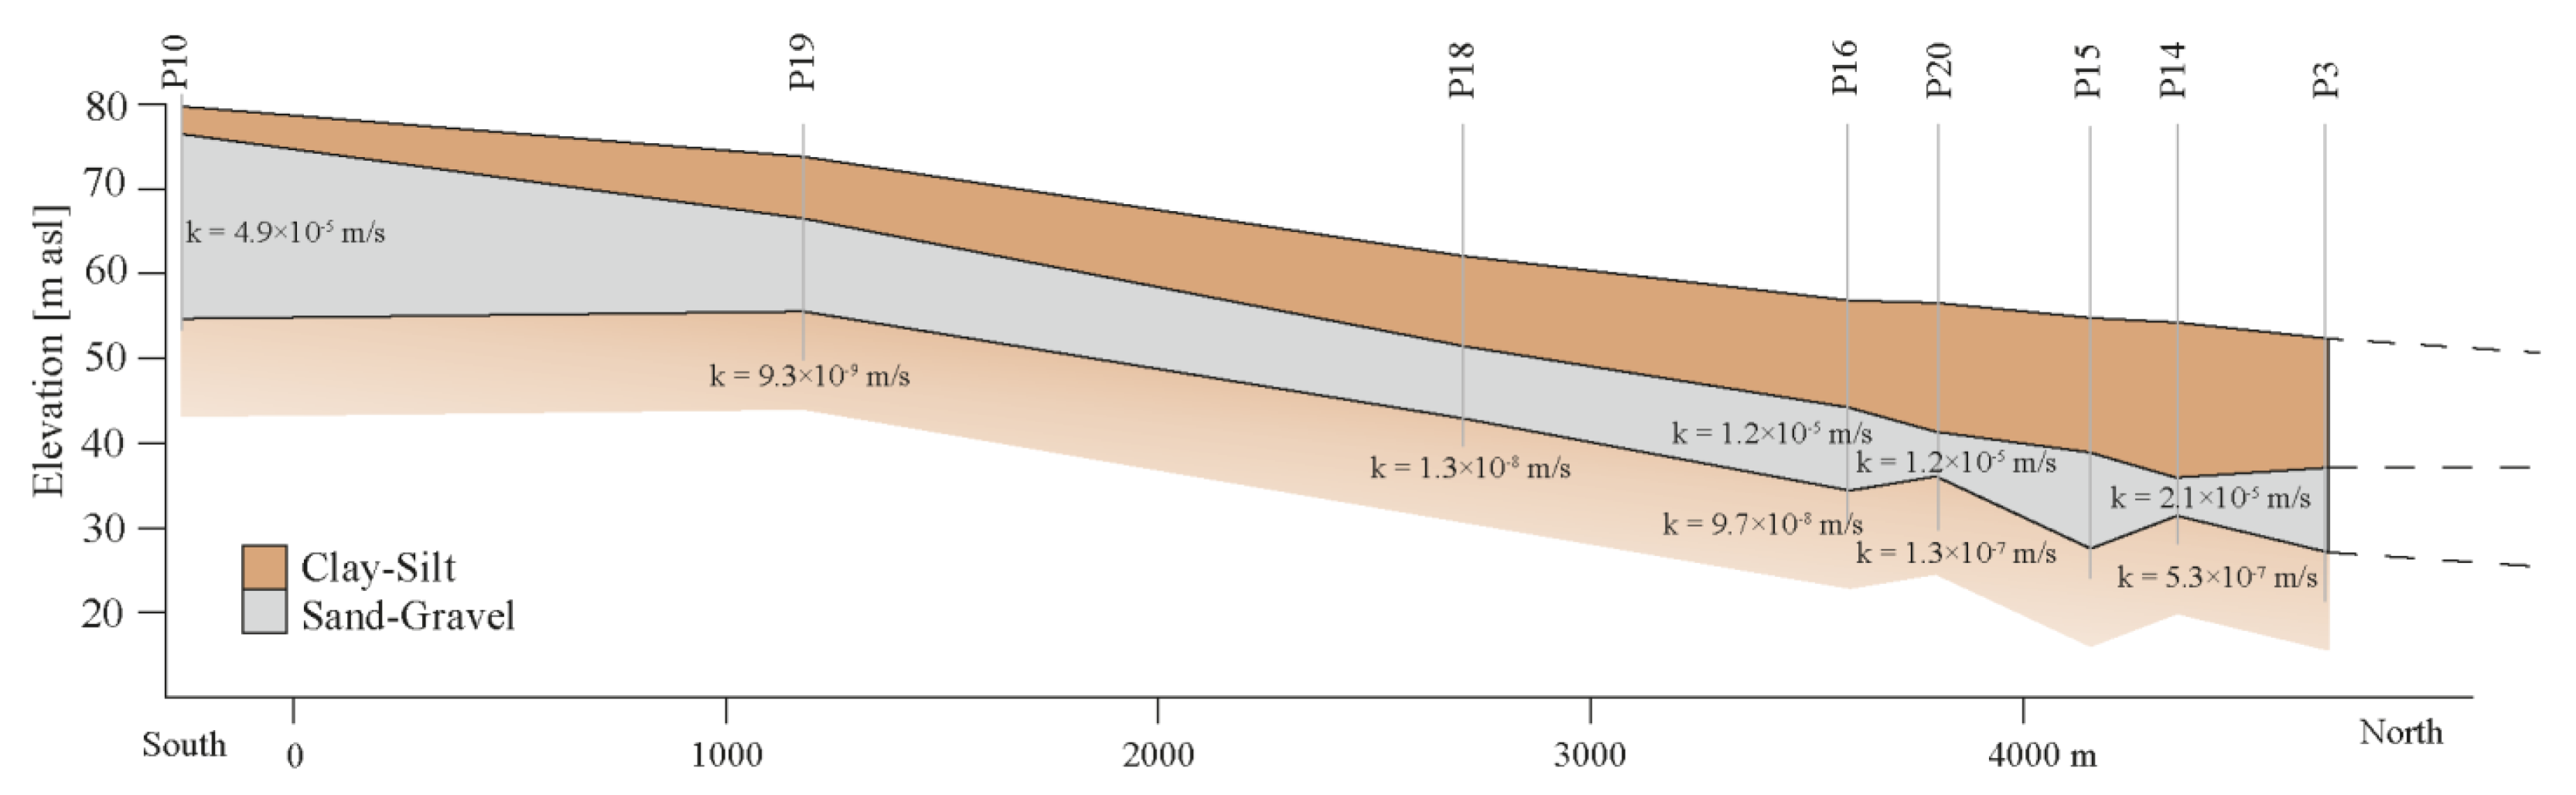
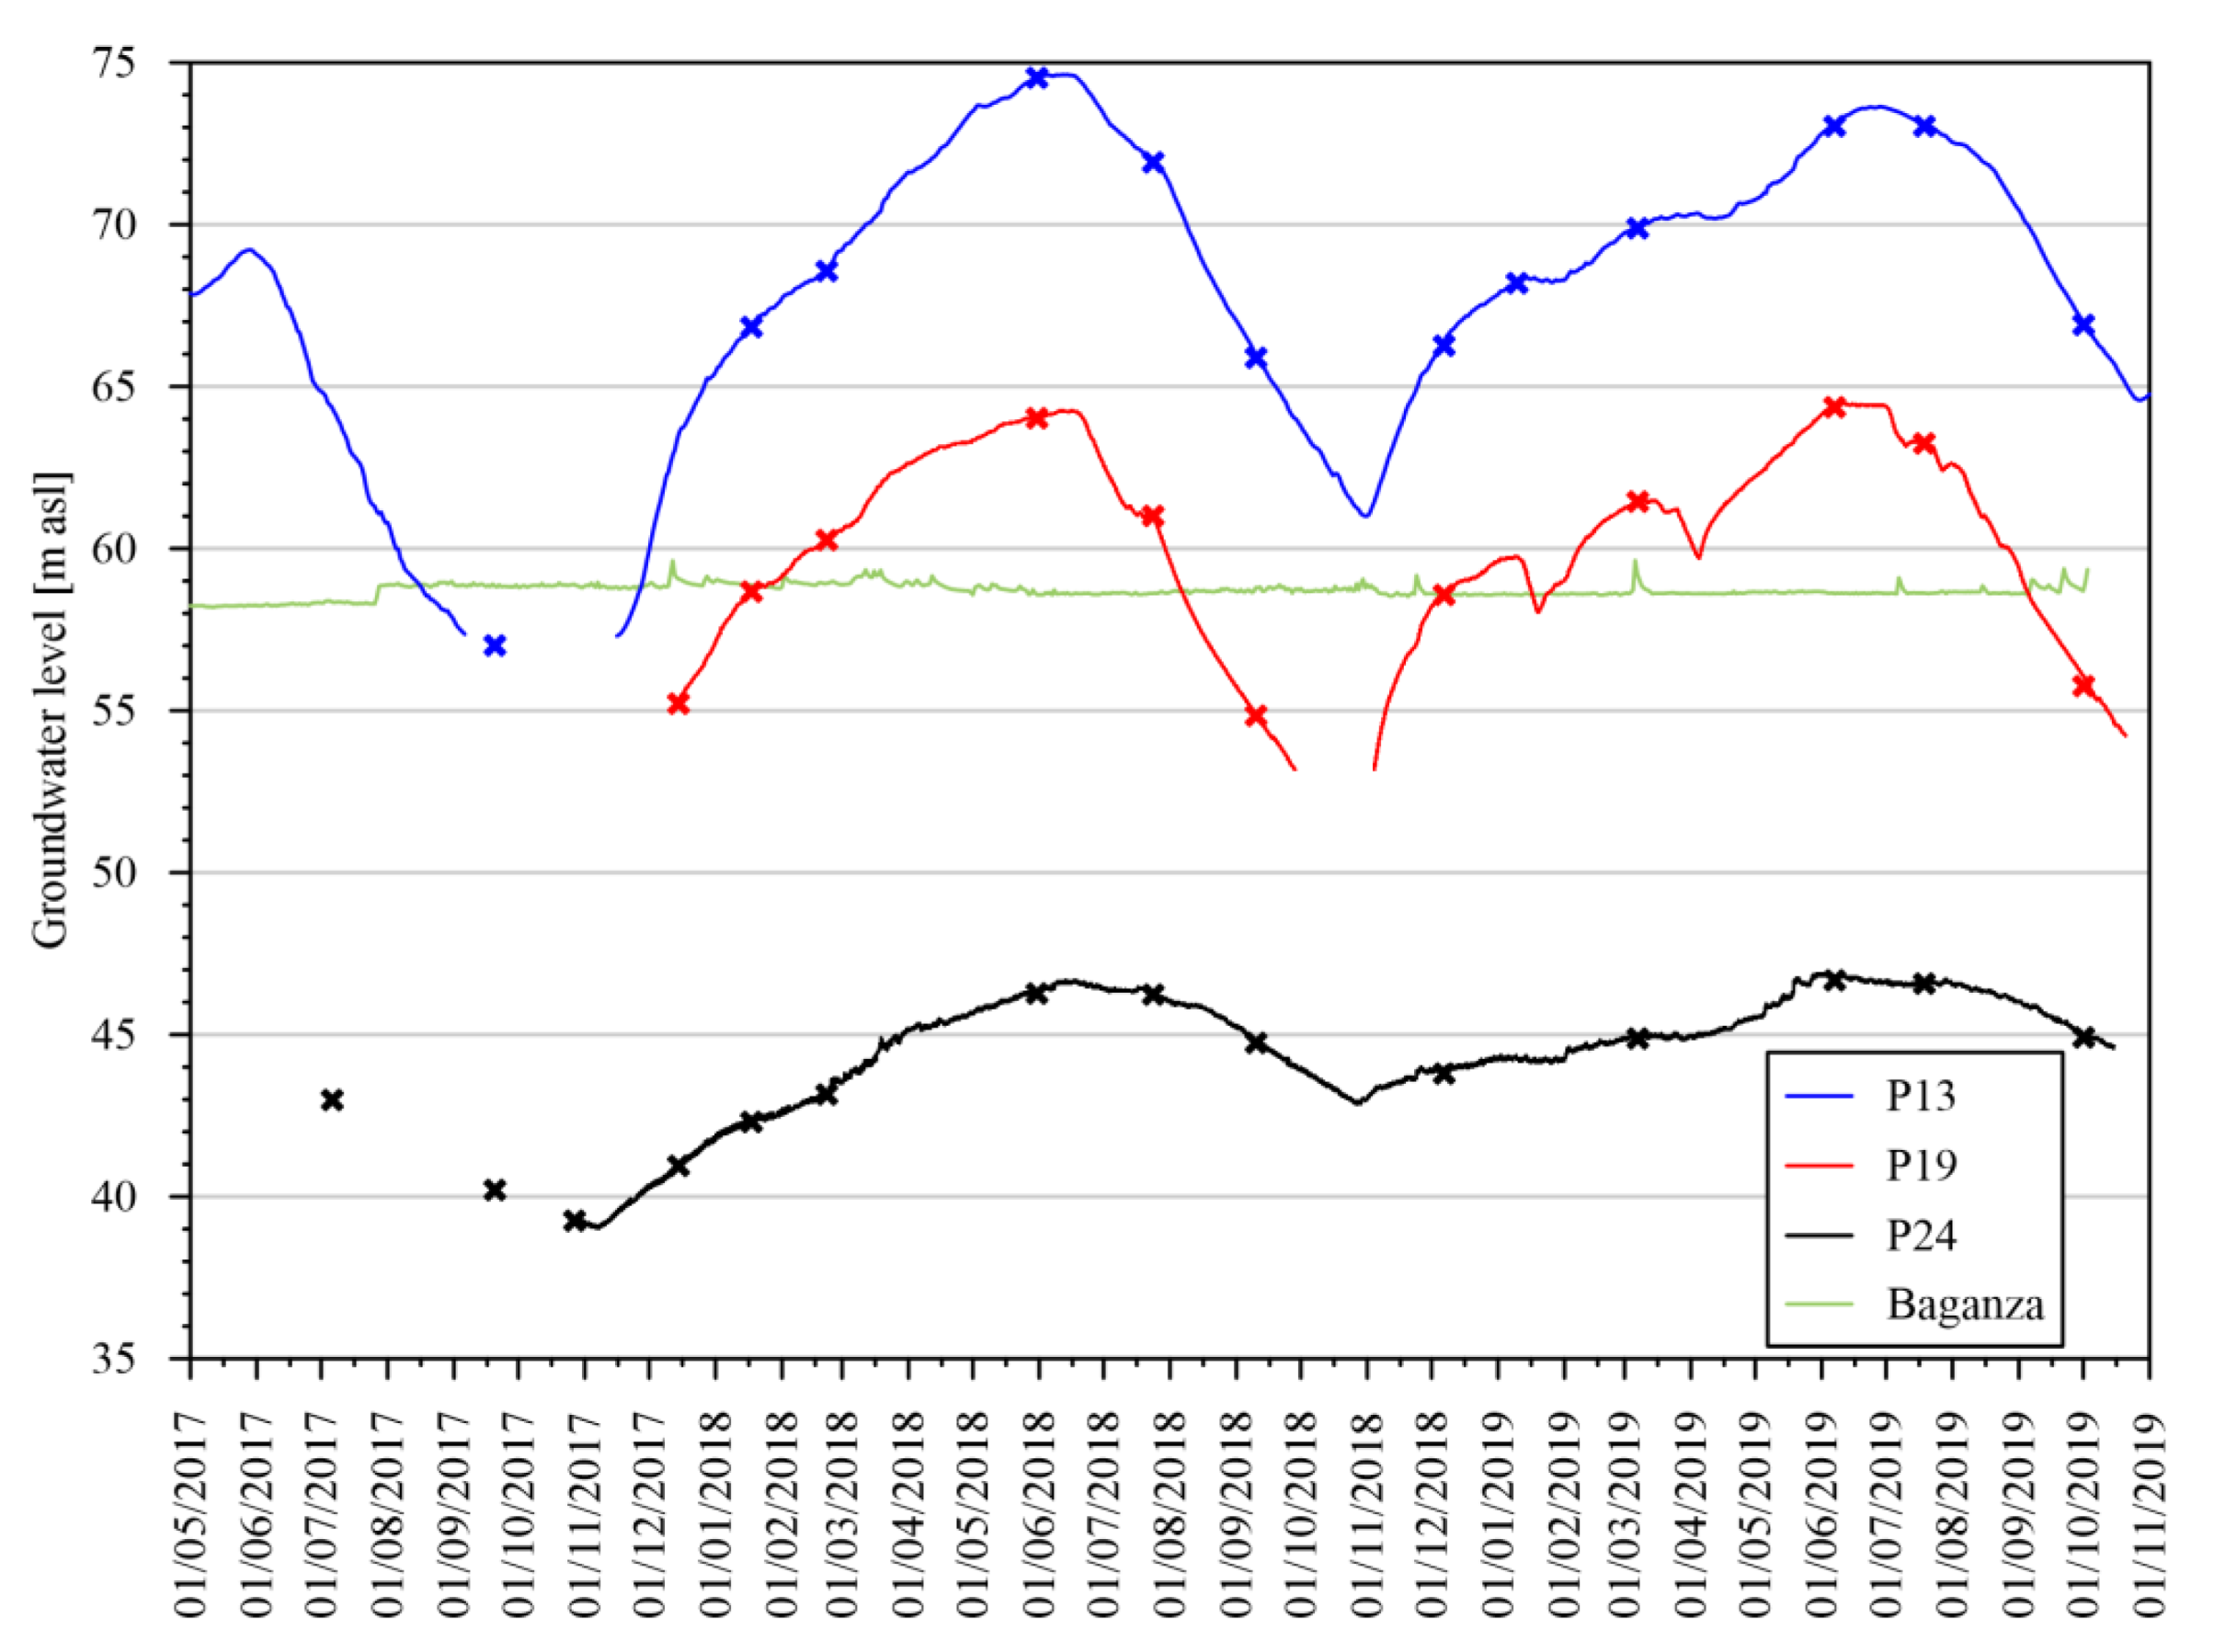
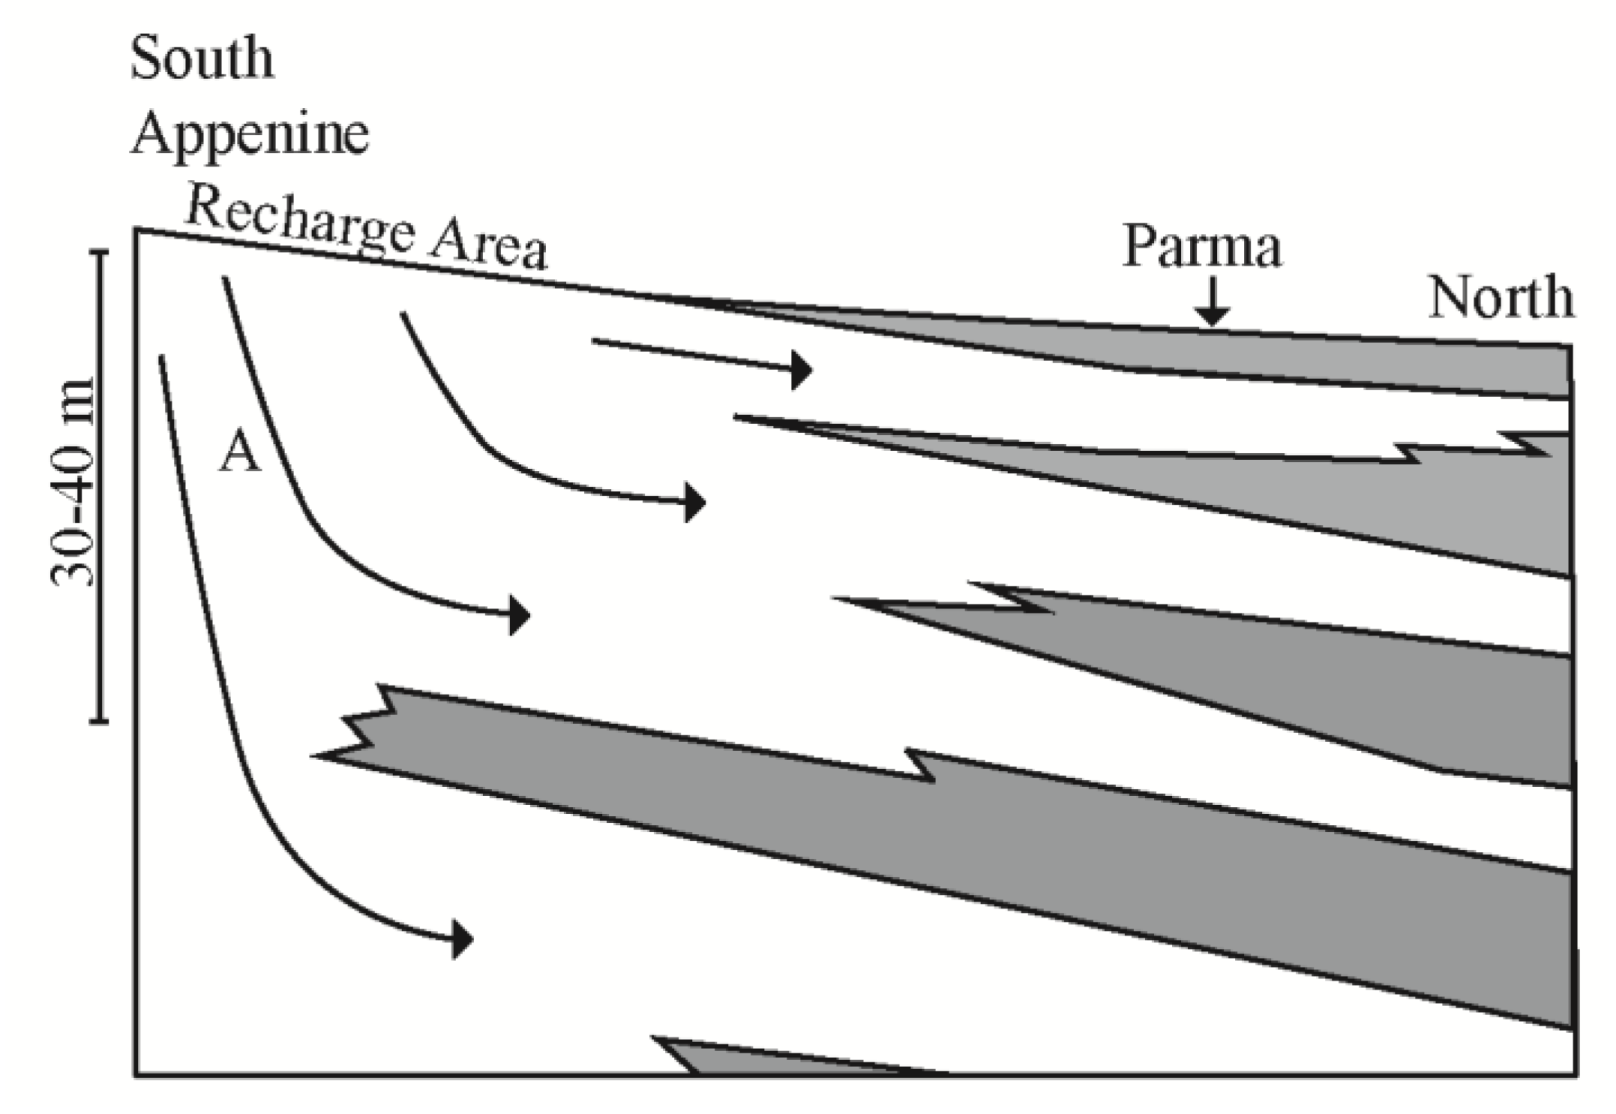
2.3. Hydrogeology
3. Results and Discussion
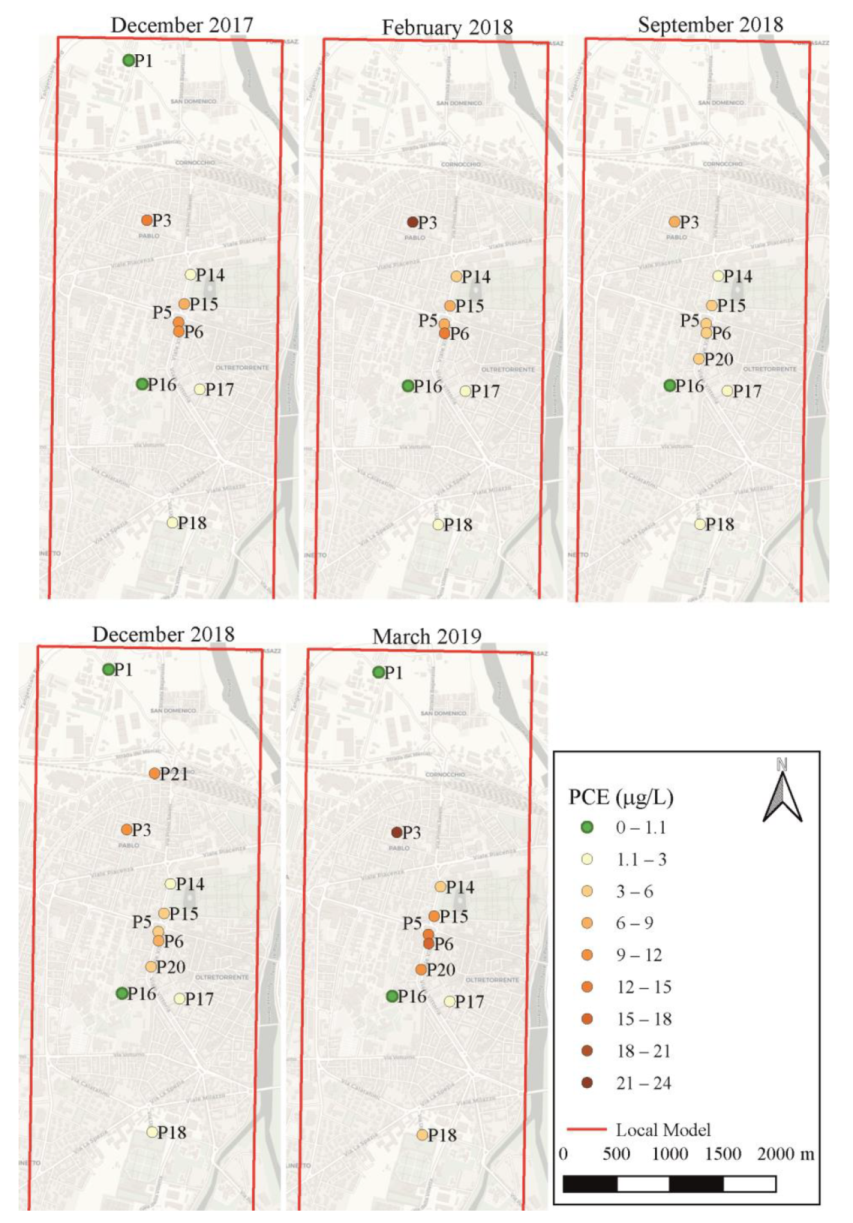
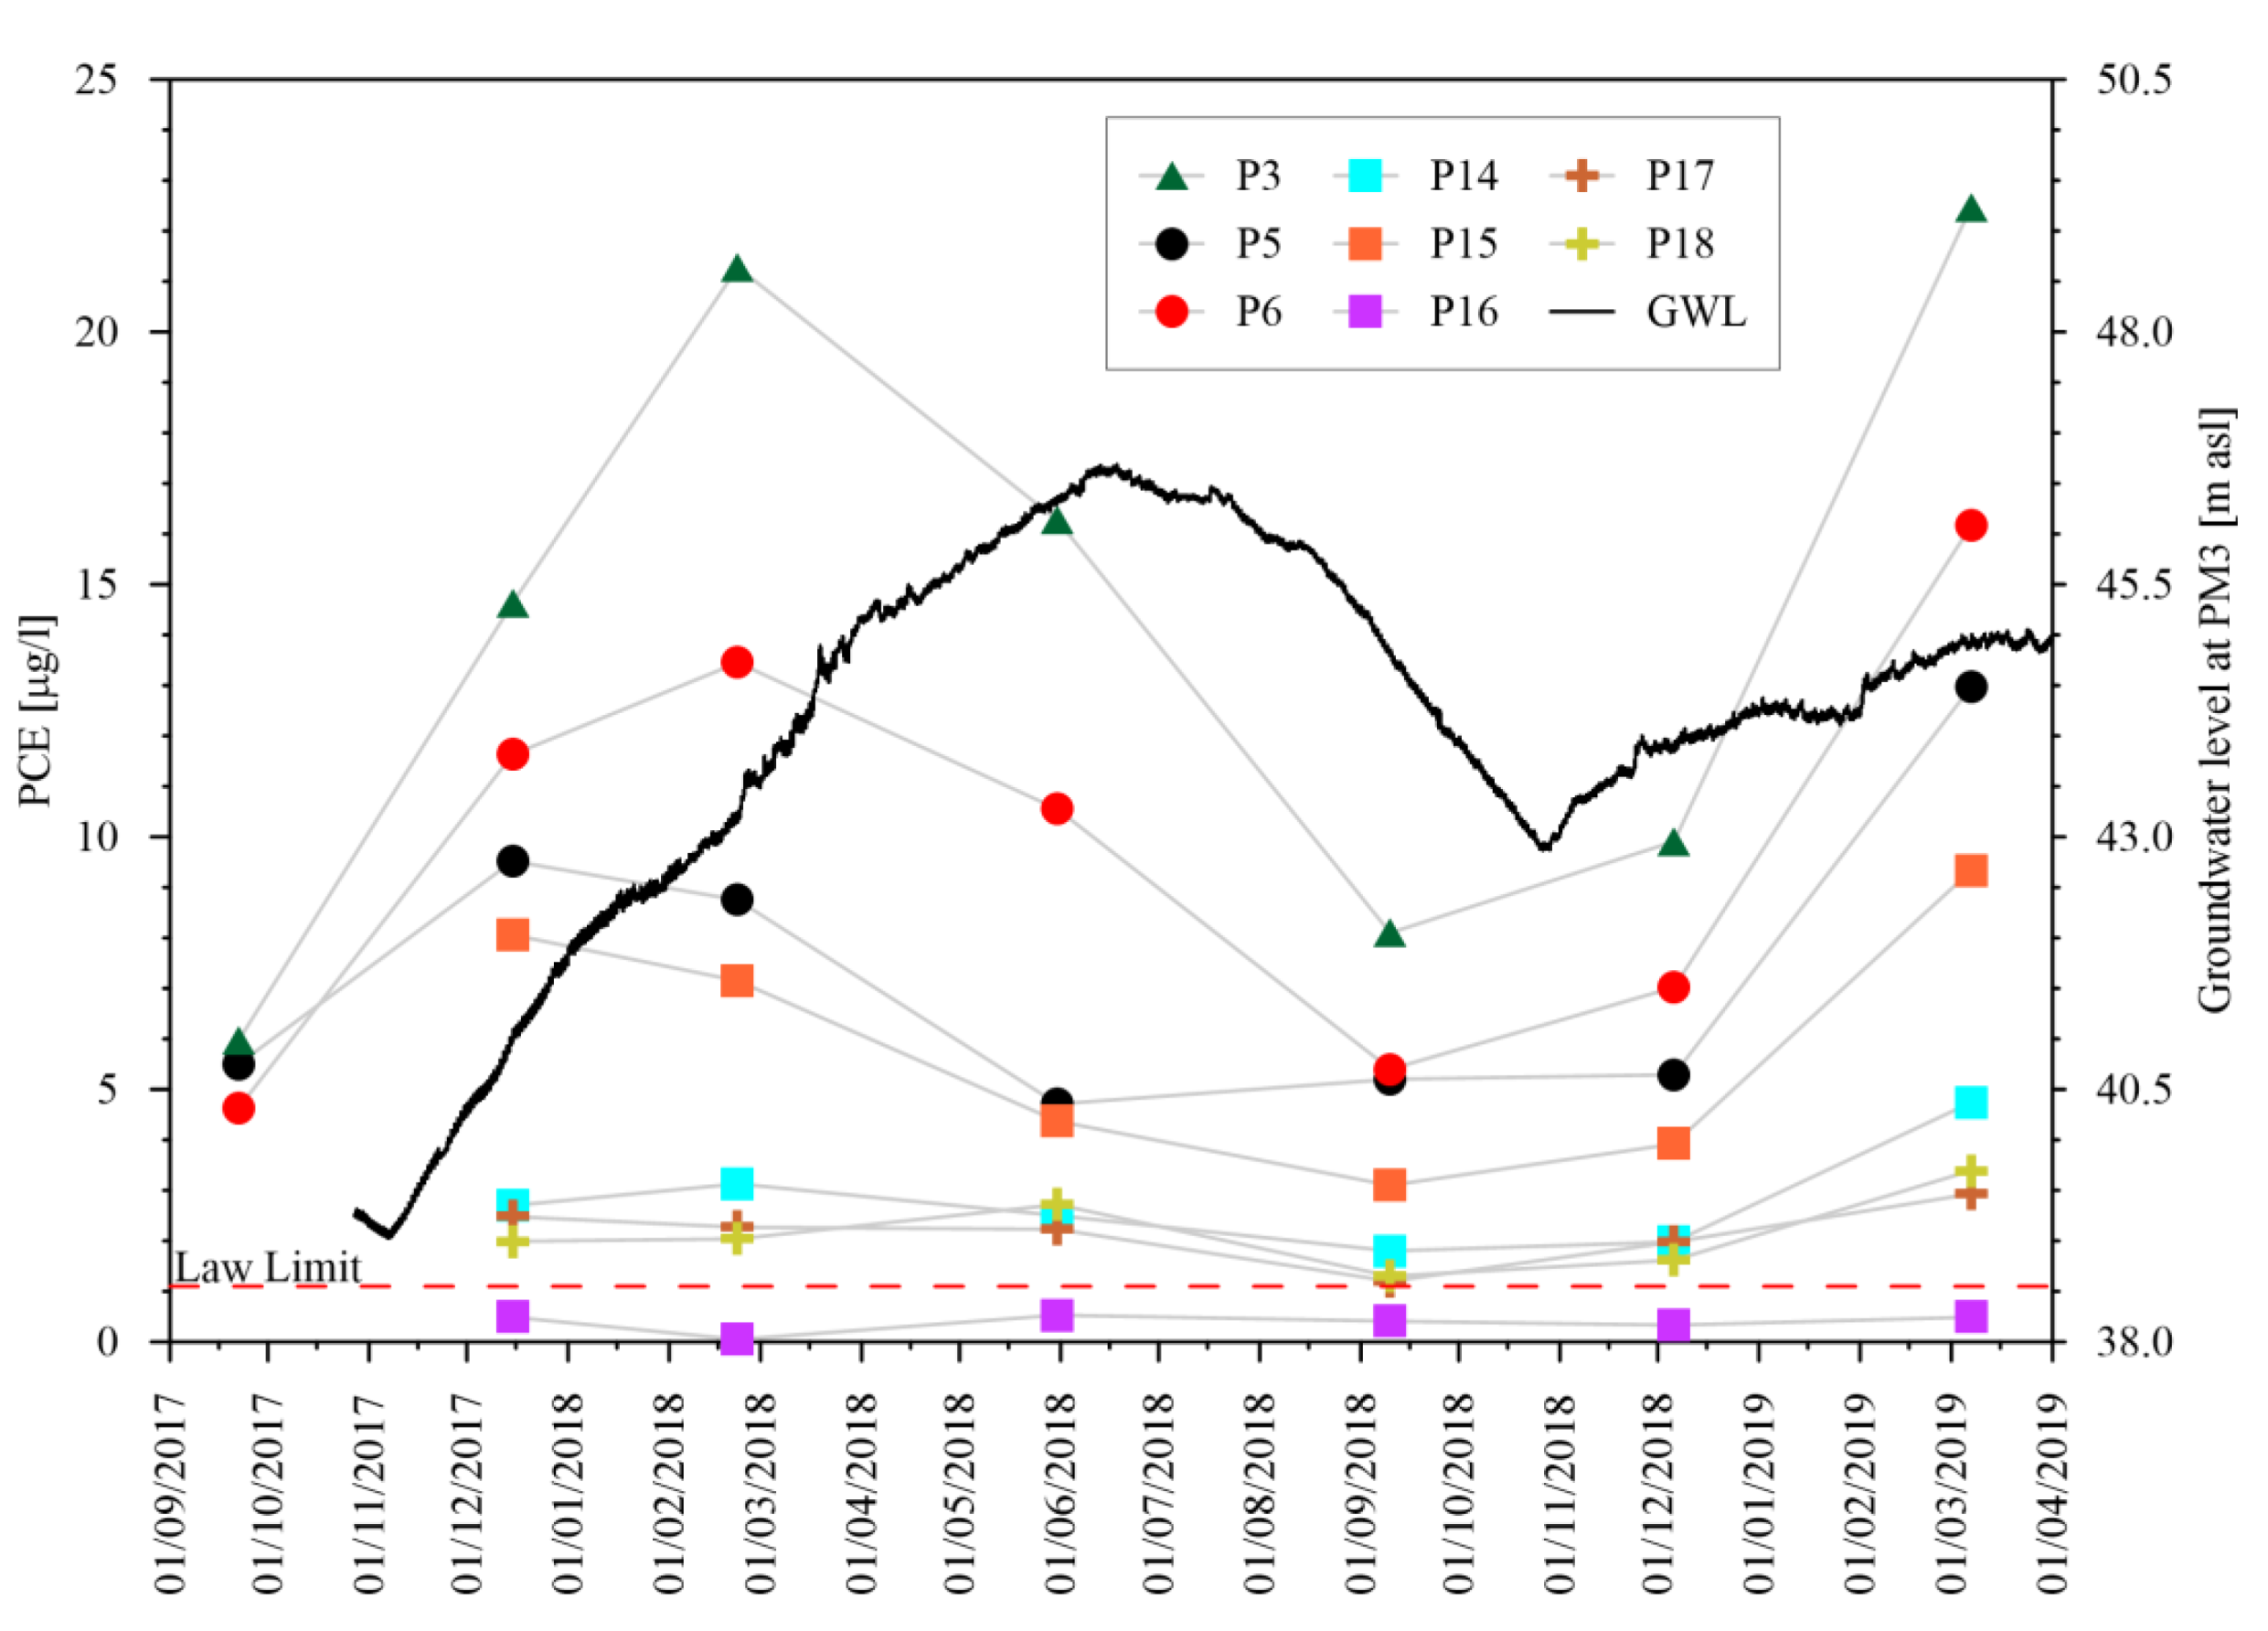
3.1. Contamination
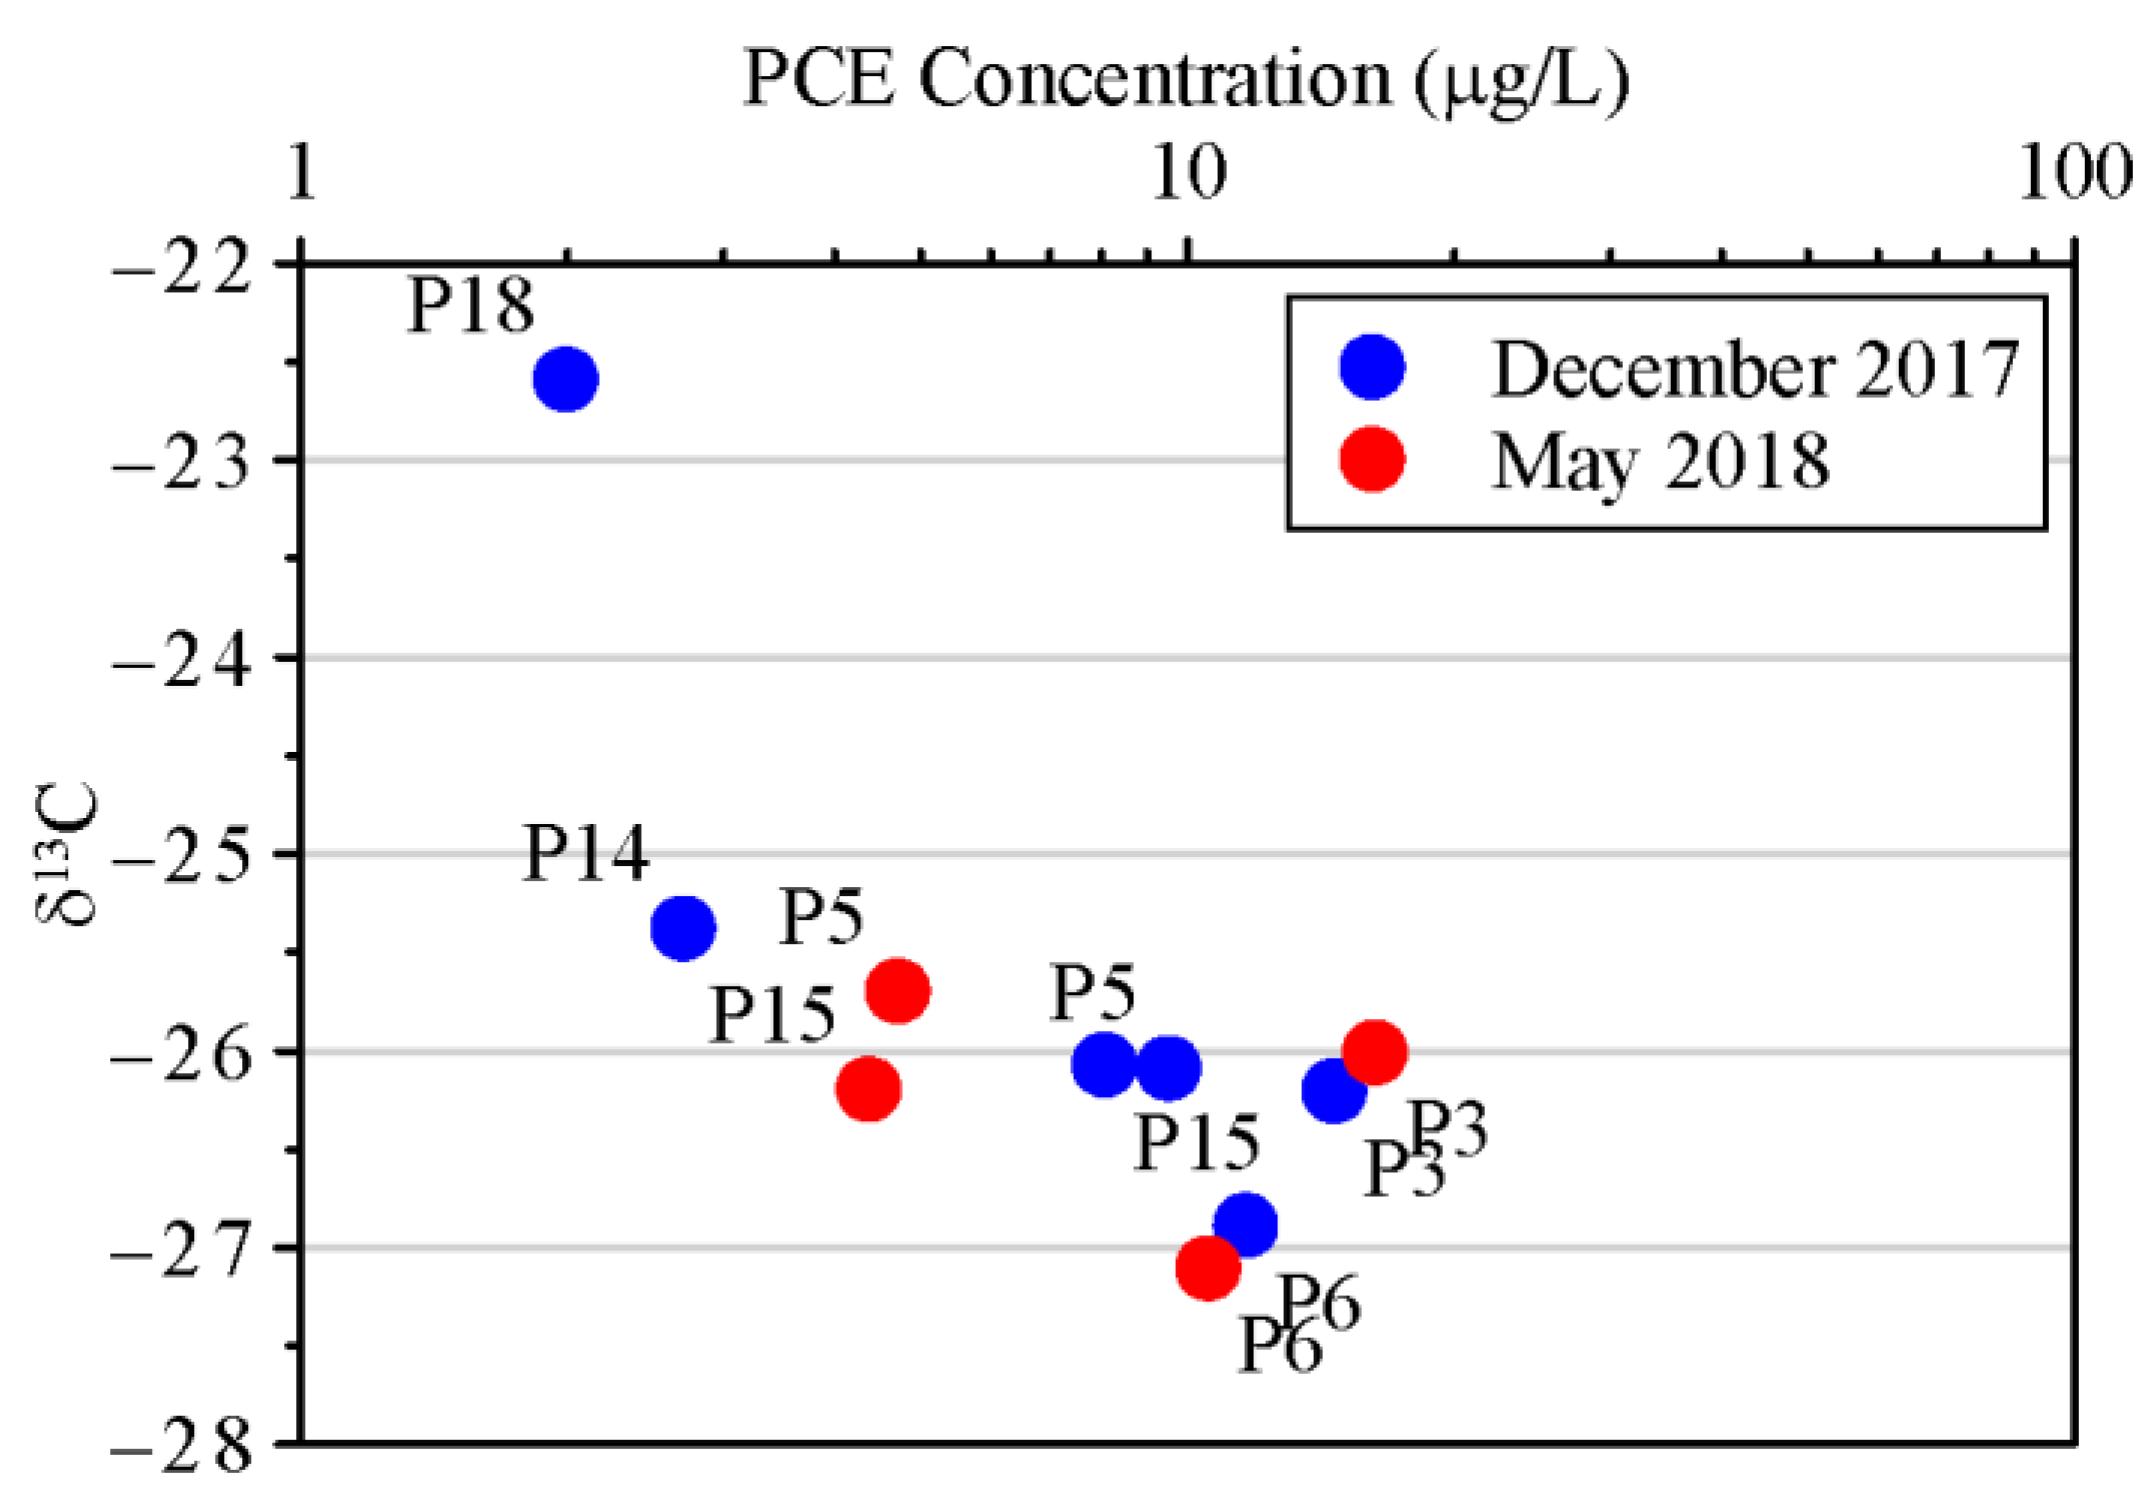
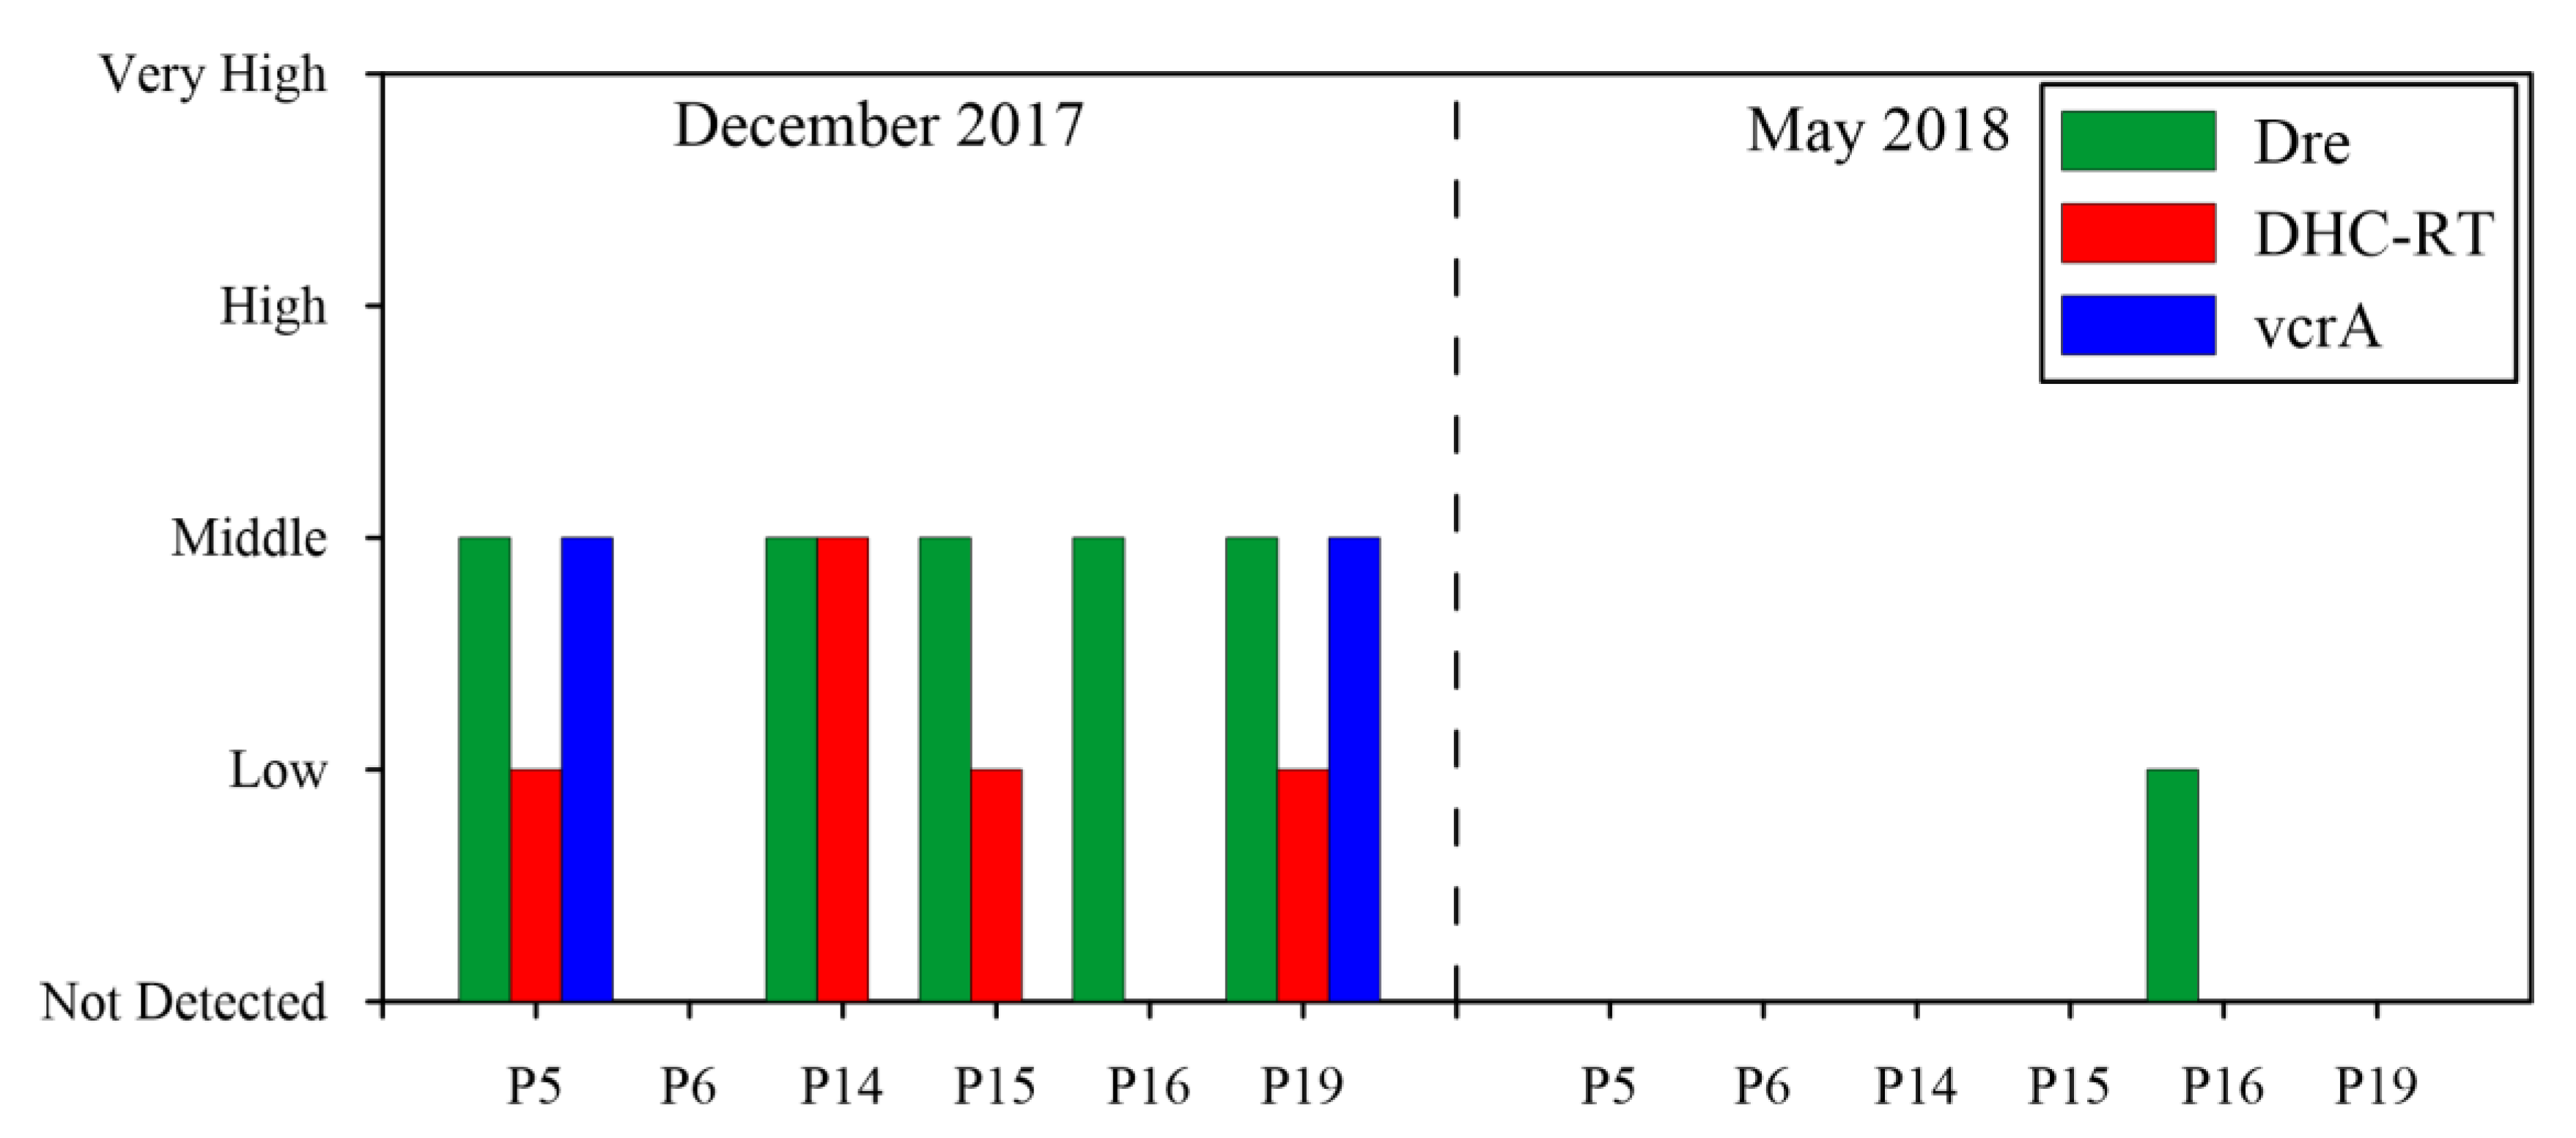
3.2. Evaluation of Biodegradation
3.3. Groundwater Flow Model
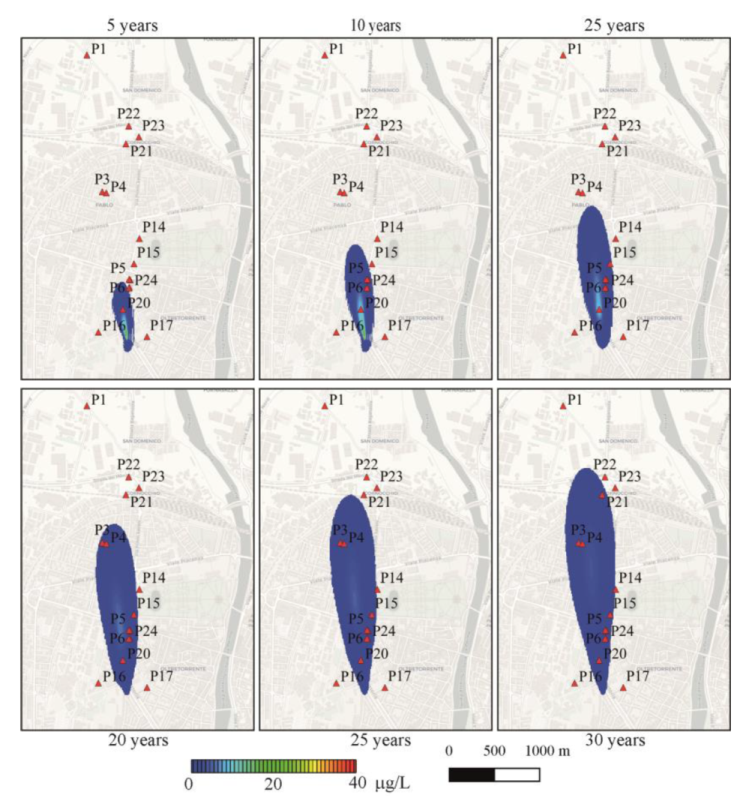
3.4. Groundwater Transport Model
3.5. Phytoscreening Results
3.6. Evaluation of MNA
4. Conclusions
Author Contributions
Funding
Data Availability Statement
Acknowledgments
Conflicts of Interest
References
- AMIIGA. Integrated Approach to Management of Groundwater Quality in Functional Urban Areas. Available online: https://www.interreg-central.eu/Content.Node/AMIIGA.html (accessed on 8 June 2021).
- Interreg Europe. Available online: https://www.interregeurope.eu/ (accessed on 21 June 2021).
- Vasin, S.; Carle, A.; Lang, U.; Kirchholtes, H.J. A groundwater management plan for Stuttgart. Sci. Total Environ. 2016, 563, 704–712. [Google Scholar] [CrossRef]
- Azzellino, A.; Colombo, L.; Lombi, S.; Marchesi, V.; Piana, A.; Andrea, M.; Alberti, L. Groundwater diffuse pollution in functional urban areas: The need to define anthropogenic diffuse pollution background levels. Sci. Total Environ. 2019, 656, 1207–1222. [Google Scholar] [CrossRef]
- Pedretti, D.; Masetti, M.; Beretta, G.P. Stochastic analysis of the efficiency of coupled hydraulic-physical barriers to contain solute plumes in highly heterogeneous aquifers. J. Hydrol. 2017, 553, 805–815. [Google Scholar] [CrossRef]
- Domenico, P.A.; Schwartz, F.W. Physical and Chemical Hydrogeology, 2nd ed.; Wiley: New York, NY, USA, 1997; ISBN 978-0-471-59762-9. [Google Scholar]
- Bayer, P.; Finkel, M.; Teutsch, G. Combining Pump-and-Treat and Physical Barriers for Contaminant Plume Control. Ground Water 2004, 42, 856–867. [Google Scholar] [CrossRef] [PubMed]
- Bayer, P.; Finkel, M.; Teutsch, G. Cost-optimal contaminant plume management with a combination of pump-and-treat and physical barrier systems. Ground Water Monit. Remediat. 2005, 25, 96–106. [Google Scholar] [CrossRef]
- Chelli, A.; Zanini, A.; Petrella, E.; Feo, A.; Celico, F. A multidisciplinary procedure to evaluate and optimize the efficacy of hydraulic barriers in contaminated sites: A case study in Northern Italy. Environ. Earth Sci. 2018, 77, 246. [Google Scholar] [CrossRef]
- Tatti, F.; Papini, M.P.; Torretta, V.; Mancini, G.; Boni, M.R.; Viotti, P. Experimental and numerical evaluation of Groundwater Circulation Wells as a remediation technology for persistent, low permeability contaminant source zones. J. Contam. Hydrol. 2019, 222, 89–100. [Google Scholar] [CrossRef]
- Antelmi, M.; Renoldi, F.; Alberti, L. Analytical and Numerical Methods for a Preliminary Assessment of the Remediation Time of Pump and Treat Systems. Water 2020, 12, 2850. [Google Scholar] [CrossRef]
- Beck, P.; Mann, B. A Technical Guide for Demonstrating Monitored Natural Attenuation of Petroleum Hydrocarbons in Groundwater. In CRC CARE Technical Report No. 15; CRC for Contamination Assesment and Remediation of the Environment: Adelaide, Australia, 2010; ISBN 978-1-921431-25-8. [Google Scholar]
- Hellal, J.; Joulian, C.; Urien, C.; Ferreira, S.; Denonfoux, J.; Hermon, L.; Vuilleumier, S.; Imfeld, G. Chlorinated ethene biodegradation and associated bacterial taxa in multi-polluted groundwater: Insights from biomolecular markers and stable isotope analysis. Sci. Total Environ. 2021, 763, 142950. [Google Scholar] [CrossRef]
- Kawabe, Y.; Komai, T. A Case Study of Natural Attenuation of Chlorinated Solvents under Unstable Groundwater Conditions in Takahata, Japan. Bull. Environ. Contam. Toxicol. 2019, 102, 280–286. [Google Scholar] [CrossRef]
- Naidu, R.; Nandy, S.; Megharaj, M.; Kumar, R.P.; Chadalavada, S.; Chen, Z.; Bowman, M. Monitored natural attenuation of a long-term petroleum hydrocarbon contaminated sites: A case study. Biodegradation 2012, 23, 881–895. [Google Scholar] [CrossRef]
- Yergeau, E.; Sanschagrin, S.; Beaumier, D.; Greer, C.W. Metagenomic Analysis of the Bioremediation of Diesel-Contaminated Canadian High Arctic Soils. PLoS ONE 2012, 7, e30058. [Google Scholar] [CrossRef]
- Bucci, A.; Petrella, E.; Celico, F.; Naclerio, G. Use of molecular approaches in hydrogeological studies: The case of carbonate aquifers in southern Italy. Hydrogeol. J. 2017, 25, 1017–1031. [Google Scholar] [CrossRef]
- Rizzo, P.; Bucci, A.; Sanangelantoni, A.M.; Iacumin, P.; Celico, F. Coupled Microbiological–Isotopic Approach for Studying Hydrodynamics in Deep Reservoirs: The Case of the Val d’Agri Oilfield (Southern Italy). Water 2020, 12, 1483. [Google Scholar] [CrossRef]
- Mattes, T.E.; Alexander, A.; Coleman, N.V. Aerobic biodegradation of the chloroethenes: Pathways, enzymes, ecology, and evolution. FEMS Microbiol. Rev. 2010, 34, 445–475. [Google Scholar] [CrossRef] [PubMed] [Green Version]
- Dolinová, I.; Czinnerová, M.; Dvořák, L.; Stejskal, V.; Ševců, A.; Černík, M. Dynamics of organohalide-respiring bacteria and their genes following in-situ chemical oxidation of chlorinated ethenes and biostimulation. Chemosphere 2016, 157, 276–285. [Google Scholar] [CrossRef]
- Němeček, J.; Dolinová, I.; Macháčková, J.; Špánek, R.; Ševců, A.; Lederer, T.; Černík, M. Stratification of chlorinated ethenes natural attenuation in an alluvial aquifer assessed by hydrochemical and biomolecular tools. Chemosphere 2017, 184, 1157–1167. [Google Scholar] [CrossRef] [PubMed]
- Löffler, F.E.; Ritalahti, K.M.; Zinder, S.H. Dehalococcoides and Reductive Dechlorination of Chlorinated Solvents. In Bioaugmentation for Groundwater Remediation; Springer: New York, NY, USA, 2013; pp. 39–88. [Google Scholar]
- Rizzo, P.; Malerba, M.; Bucci, A.; Sanangelantoni, A.M.; Remelli, S.; Celico, F. Potential Enhancement of the In-Situ Bioremediation of Contaminated Sites through the Isolation and Screening of Bacterial Strains in Natural Hydrocarbon Springs. Water 2020, 12, 2090. [Google Scholar] [CrossRef]
- AMIIGA. Final Version of the Guidelines-WP T1. Available online: https://www.interreg-central.eu/Content.Node/D.T1.4.3-final-version-guidelines---ENG-1.pdf (accessed on 20 April 2021).
- Meckenstock, R.U.; Morasch, B.; Warthmann, R.; Schink, B.; Annweiler, E.; Michaelis, W.; Richnow, H.H. 13C/12C isotope fractionation of aromatic hydrocarbons during microbial degradation. Environ. Microbiol. 1999, 1, 409–414. [Google Scholar] [CrossRef]
- Lollar, B.S.; Slater, G.; Ahad, J.; Sleep, B.; Spivack, J.; Brennan, M.; MacKenzie, P. Contrasting carbon isotope fractionation during biodegradation of trichloroethylene and toluene: Implications for intrinsic bioremediation. Org. Geochem. 1999, 30, 813–820. [Google Scholar] [CrossRef]
- Drenzek, N.J.; Tarr, C.H.; Eglinton, T.I.; Heraty, L.J.; Sturchio, N.; Shiner, V.J.; Reddy, C.M. Stable chlorine and carbon isotopic compositions of selected semi-volatile organochlorine compounds. Org. Geochem. 2002, 33, 437–444. [Google Scholar] [CrossRef]
- Yanik, P.J.; O’Donnell, T.H.; Macko, S.A.; Qian, Y.; Kennicutt, M.C. Source apportionment of polychlorinated biphenyls using compound specific isotope analysis. Org. Geochem. 2003, 34, 239–251. [Google Scholar] [CrossRef]
- Shouakar-Stash, O.; Frape, S.K.; Drimmie, R.J. Stable hydrogen, carbon and chlorine isotope measurements of selected chlorinated organic solvents. J. Contam. Hydrol. 2003, 60, 211–228. [Google Scholar] [CrossRef]
- Hunkeler, D.; Van Breukelen, B.M.; Elsner, M. Modeling Chlorine Isotope Trends during Sequential Transformation of Chlorinated Ethenes. Environ. Sci. Technol. 2009, 43, 6750–6756. [Google Scholar] [CrossRef] [Green Version]
- Carpani, G.; Marchesi, M.; Pietrini, I.; Alberti, L.; Zaninetta, L.; Shouakar-Stash, O.; de Ferra, F. 1,2-DCA Natural Attenuation Evaluation in Groundwater: Insight by Dual Isotope 13C/37Cl and Molecular Analysis Approach. Water 2021, 13, 728. [Google Scholar] [CrossRef]
- Dempster, H.S.; Lollar, B.S.; Feenstra, S. Tracing Organic Contaminants in Groundwater: A New Methodology Using Compound-Specific Isotopic Analysis. Environ. Sci. Technol. 1997, 31, 3193–3197. [Google Scholar] [CrossRef]
- Smallwood, B.; Philp, R.P.; Burgoyne, T.; Allen, J. The Use of Stable Isotopes to Differentiate Specific Source Markers for MTBE. Environ. Forensics 2001, 2, 215–221. [Google Scholar] [CrossRef]
- Palau, J.; Marchesi, M.; Chambon, J.C.; Aravena, R.; Canals, À.; Binning, P.J.; Bjerg, P.L.; Otero, N.; Soler, A.; Gil, A.S. Multi-isotope (carbon and chlorine) analysis for fingerprinting and site characterization at a fractured bedrock aquifer contaminated by chlorinated ethenes. Sci. Total Environ. 2014, 475, 61–70. [Google Scholar] [CrossRef]
- Alberti, L.; Marchesi, M.; Trefiletti, P.; Aravena, R. Compound-Specific Isotope Analysis (CSIA) Application for Source Apportionment and Natural Attenuation Assessment of Chlorinated Benzenes. Water 2017, 9, 872. [Google Scholar] [CrossRef] [Green Version]
- Marchesi, M.; Alberti, L.; Shouakar-Stash, O.; Pietrini, I.; de Ferra, F.; Carpani, G.; Aravena, R.; Franzetti, A.; Stella, T. 37Cl-compound specific isotope analysis and assessment of functional genes for monitoring monochlorobenzene (MCB) biodegradation under aerobic conditions. Sci. Total Environ. 2018, 619, 784–793. [Google Scholar] [CrossRef]
- Sorek, A.; Atzmon, N.; Dahan, O.; Gerstl, Z.; Kushisin, L.; Laor, Y.; Mingelgrin, U.; Nasser, A.; Ronen, D.; Tsechansky, L.; et al. “Phytoscreening”: The Use of Trees for Discovering Subsurface Contamination by VOCs. Environ. Sci. Technol. 2008, 42, 536–542. [Google Scholar] [CrossRef]
- Wilson, J.L.; Samaranayake, V.A.; Limmer, M.A.; Burken, J.G. Phytoforensics: Trees as bioindicators of potential indoor exposure via vapor intrusion. PLoS ONE 2018, 13, e0193247. [Google Scholar] [CrossRef] [Green Version]
- Limmer, M.A.; Balouet, J.-C.; Karg, F.; Vroblesky, N.A.; Burken, J.G. Phytoscreening for Chlorinated Solvents Using Rapid in Vitro SPME Sampling: Application to Urban Plume in Verl, Germany. Environ. Sci. Technol. 2011, 45, 8276–8282. [Google Scholar] [CrossRef] [PubMed]
- U.S. Environmental Protection Agency. “Method 5035A (SW-846): Closed-System Purge-and-Trap and Extraction for Volatile Organics in Soil and Waste Samples”, Draft Revision 1; U.S. Environmental Protection Agency: Washington, DC, USA, 2002.
- U.S. Environmental Protection Agency. “Method 8260D (SW-846): Volatile Organic Compounds by Gas Chromatography/Mass Spectrometry (GC/MS)”, Revision 3; U.S. Environmental Protection Agency: Washington, DC, USA, 2006.
- Luchetti, L.; Diligenti, A. Protocollo Tecnico per Le Attivitaà Di Phytoscreening; ARTA Abruzzo: Teramo, Italy, 2018. [Google Scholar]
- Jarsjö, J.; Bayer-Raich, M.; Ptak, T. Monitoring groundwater contamination and delineating source zones at industrial sites: Uncertainty analyses using integral pumping tests. J. Contam. Hydrol. 2005, 79, 107–134. [Google Scholar] [CrossRef] [PubMed]
- Alberti, L.; Lombi, S.; Zanini, A. Identifying sources of chlorinated aliphatic hydrocarbons in a residential area in Italy using the integral pumping test method. Hydrogeol. J. 2011, 19, 1253–1267. [Google Scholar] [CrossRef]
- Gzyl, G.; Zanini, A.; Frączek, R.; Kura, K. Contaminant source and release history identification in groundwater: A multi-step approach. J. Contam. Hydrol. 2014, 157, 59–72. [Google Scholar] [CrossRef] [PubMed]
- Servizio Geologico, Sismico e dei Suoli Regione, Emilia-Romagna. Riserve Idriche Sotterranee Della Regione Emilia-Romagna; Archivio Cartografico: Bologna, Italy, 1998; p. 120. [Google Scholar]
- Regione, E.-R. Nuova Carta Regionale Della Vulnerabilità–Aspetti Metodologici. Direzione Generale Ambiente e Difesa del Suolo e della Costa della Regione Emilia Romagna. 2002. Available online: https://bur.regione.emilia-romagna.it/dettaglio-inserzione?i=76087b3afdd84d7ca014bd49424e62e0 (accessed on 8 June 2021).
- Di Dio, G.M.; Lasagna, S.; Martini, A.; Zanzucchi, G. Note Illustrative Della Carta Geologica d’Italia 1:50.000 Foglio 199-Parma Sud; S.EL.CA.: Firenze, Italy, 2005. [Google Scholar]
- Teatini, P.; Ferronato, M.; Gambolati, G.; Gonella, M. Groundwater pumping and land subsidence in the Emilia-Romagna coastland, Italy: Modeling the past occurrence and the future trend. Water Resour. Res. 2006, 42. [Google Scholar] [CrossRef]
- Iacumin, P.; Venturelli, G.; Selmo, E. Isotopic features of rivers and groundwater of the Parma Province (Northern Italy) and their relationships with precipitation. J. Geochem. Explor. 2009, 102, 56–62. [Google Scholar] [CrossRef]
- Zanini, A.; Petrella, E.; Sanangelantoni, A.M.; Angelo, L.; Ventosi, B.; Viani, L.; Rizzo, P.; Remelli, S.; Bartoli, M.; Bolpagni, R.; et al. Groundwater characterization from an ecological and human perspective: An interdisciplinary approach in the Functional Urban Area of Parma, Italy. Rend. Lincei Sci. Fis. Nat. 2019, 30, 93–108. [Google Scholar] [CrossRef]
- Marco, D.; Andrea, Z.; Fausto, C. Oscillatory Pumping Test to Estimate Aquifer Hydraulic Parameters in a Bayesian Geostatistical Framework. Math. Geol. 2017, 50, 169–186. [Google Scholar] [CrossRef]
- D’Oria, M.; Zanini, A. Characterization of Hydraulic Heterogeneity of Alluvial Aquifer Using Natural Stimuli: A Field Experience of Northern Italy. Water 2019, 11, 176. [Google Scholar] [CrossRef] [Green Version]
- Fraga, D.; Meulia, T.; Fenster, S. Real-Time PCR. In Current Protocols Essential Laboratory Techniques; John Wiley & Sons, Inc.: Hoboken, NJ, USA, 2008; pp. 10.3.1–10.3.40. [Google Scholar]
- Pabinger, S.; Rödiger, S.; Kriegner, A.; Vierlinger, K.; Weinhäusel, A. A survey of tools for the analysis of quantitative PCR (qPCR) data. Biomol. Detect. Quantif. 2014, 1, 23–33. [Google Scholar] [CrossRef] [Green Version]
- Harbaugh, A.W. MODFLOW-2005, the U.S. Geological Survey Modular Ground-Water Model—The Ground-Water Flow Process; U.S. Geological Survey Techniques and Methods: 6-A16; U.S. Geological Survey: Reston, VA, USA, 2005.
- De Filippis, G.; Foglia, L.; Giudici, M.; Mehl, S.; Margiotta, S.; Negri, S.L. Effects of different boundary conditions on the simulation of groundwater flow in a multi-layered coastal aquifer system (Taranto Gulf, southern Italy). Hydrogeol. J. 2017, 25, 2123–2138. [Google Scholar] [CrossRef]
- Doherty, J. PEST, Model-Independent Parameter Estimation—User Manual, 5th ed.; Watermark Numerical Computing: Brisbane, Australia, 2010. [Google Scholar]
- Anderson, M.P.; Woessner, W.W. Applied Groundwater Modeling: Simulation of Flow and Advective Transport; Academic Press: San Diego, CA, USA, 1992; ISBN 0-12-059485-4. [Google Scholar]
- ASTM-Standard D5880 Standard Guide for Subsurface Flow and Transport Modeling; American Society of Testing Material Standards: West Conshohocken, PA, USA, 2006.
- Pollock, D.W. User Guide for MODPATH Version 7—A Particle-Tracking Model for MODFLOW: U.S. Geological Survey Open-File Report 2016-1086; U.S. Geological Survey: Reston, VA, USA, 2016.
- Comune di Parma. Piazzale Santa Croce—Ricostruzione Storica; Comune di Parma: Parma, Italy, 2013. [Google Scholar]
- Zheng, C.; Wang, P.P. MT3DMS: A Modular Three-Dimensional Multispecies Transport Model for Simulation of Advection, Dispersion, and Chemical Reactions of Contaminants in Groundwater Systems; Contract Report No. SERDP-99-1; U.S. Army Engineer Research and Development Center: Vicksburg, MS, USA, 1999. [Google Scholar]
- Bear, J.; Verruijt, A. Modeling Groundwater Flow and Pollution; Springer: Dordrecht, The Netherland, 1987; ISBN 9781556080142. [Google Scholar]
- Bear, J. Dynamics of Fluids in Porous Media; American Elsevier Pub. Co.: New York, NY, USA, 1972; ISBN 044400114X. [Google Scholar]
- Towards Clean Groundwater: From Strategy to Action. Available online: https://www.interreg-central.eu/Content.Node/Management-Strategy-Final.pdf (accessed on 8 June 2021).


Publisher’s Note: MDPI stays neutral with regard to jurisdictional claims in published maps and institutional affiliations. |
© 2021 by the authors. Licensee MDPI, Basel, Switzerland. This article is an open access article distributed under the terms and conditions of the Creative Commons Attribution (CC BY) license (https://creativecommons.org/licenses/by/4.0/).
Share and Cite
Zanini, A.; Ghirardi, M.; Emiliani, R. A Multidisciplinary Approach to Evaluate the Effectiveness of Natural Attenuation at a Contaminated Site. Hydrology 2021, 8, 101. https://doi.org/10.3390/hydrology8030101
Zanini A, Ghirardi M, Emiliani R. A Multidisciplinary Approach to Evaluate the Effectiveness of Natural Attenuation at a Contaminated Site. Hydrology. 2021; 8(3):101. https://doi.org/10.3390/hydrology8030101
Chicago/Turabian StyleZanini, Andrea, Marco Ghirardi, and Renata Emiliani. 2021. "A Multidisciplinary Approach to Evaluate the Effectiveness of Natural Attenuation at a Contaminated Site" Hydrology 8, no. 3: 101. https://doi.org/10.3390/hydrology8030101
APA StyleZanini, A., Ghirardi, M., & Emiliani, R. (2021). A Multidisciplinary Approach to Evaluate the Effectiveness of Natural Attenuation at a Contaminated Site. Hydrology, 8(3), 101. https://doi.org/10.3390/hydrology8030101