Abstract
Overall health of a stream is one of the powerful indicators for planning mitigation strategies. Currently, available methods to estimate stream health do not look at all the different components of stream health. Based on the statistical parameters obtained from daily streamflow data, water quality data, and index of biotic integrity (IBI), this study evaluated the impacts on all the elements of stream health, such as aquatic species, riparian vegetation, benthic macro-invertebrates, and channel degradation for the Plum Creek watershed in Texas, USA. The method involved the (1) collection of flow data at the watershed outlet; (2) identification of hydrologic change in the streamflow; (3) estimation of hydrologic indicators using NATional Hydrologic Assessment Tool (NATHAT) before alteration and after alteration periods; (4) identification of the most relevant indicators affecting stream health in the watershed based on stream type; (5) preliminary estimation of the existence of stream health using flow duration curves (FDCs); (6) the use of stream health-relevant hydrologic indices with the scoring system of the Dundee Hydrologic Regime Assessment Method (DHRAM). The FDCs plotted together for before and after the alteration periods indicated the likely presence of a stream health problem in the Plum Creek. The NATHAT–DHRAM method showed a likely moderate impact on the health of Plum Creek. The biological assessments carried out, the water quality data monitored, and the land cover during pre- and post-alteration periods documented in a publicly available federal document support the stream health results obtained from this study.
1. Introduction
Flowing water, the channel that supports the water flow, the riparian vegetation on the banks, macroinvertebrates that are a part of the aquatic food chain, the fish and other aquatic species living in the stream, other wildlife that depends on the stream are all parts of the stream ecosystem. If any of the components are stressed or out of balance, the stream is probably impaired. The impairment to streams can come from both natural causes (e.g., wildfire) and anthropogenic activities (e.g., dam construction). About 53% of streams analyzed in the United States are impaired. It amounts to a whopping 985,000 km length (588,000 stream miles) of streams. About 44% of the streams surveyed showed impairment for fish, shellfish, and wildlife support and propagation. Pathogens, sediments, and nutrients are identified as the leading causes of impairment in the US [1]. However, habitat alterations, flow alterations are also recognized as one the causes of stream impairment for a large number of streams [1]. Streams in Texas are not an exception to these types of impairments.
Ecosystem health is multidimensional, involving physical (e.g., channel dimensions), chemical (e.g., water quality parameters), and biological (e.g., the richness of aquatic species, presence of pathogens), and, therefore, maintaining healthy streams is challenging.
Although well-designed periodic data collection could bring more insights into the problem and design of mitigation strategies, monitoring stream health for each stream section will be prohibitively expensive and time-consuming. Therefore, the intention was to use alternative approaches to estimating stream health using available data.
A variety of methods exist to estimate stream health. They can be broadly classified into hydraulic, hydrologic, habitat-based, and holistic methods. The strengths and weaknesses of each method are described in Table 1. The holistic method should be the first choice. However, the complexity of use and resource intensiveness could prevent its use. Habitat or hydraulic methods focus on specific aspects of stream health, whereas hydrologic methods rely solely on indices generated by flow data.

Table 1.
Type of tools available for estimating stream health (Source: [2]).
Some recent studies highlight the close relationship between the health of the stream biota and the surrounding hydrologic environment at the watershed scale [3,4,5]. The direct relationship between the wetted perimeter of a stream channel in a riffle and fish habitat in streams is pointed out by [6,7]. The wetted perimeter is the total length (or width) of the streambank and streambed in contact with water. Ideally, any stream health estimation should be based on hydrologic data in combination with chemical, physical, and biological drivers influencing the stream health alterations. Usually, such detailed information will not be available for most of the streams. In such circumstances, it may be justifiable to use the hydrological data alone to develop stream health estimates. The assumption here is that the stream health and the functioning of freshwater ecosystems are corelated to the natural flow regime of the stream. Because of the cost-effectiveness and ease of operation, hydrologic tools were chosen, leaving behind hydraulic, holistic, and habitat-based tools (Table 1).
A variety of statistical parameters (or hydrologic indicators) can be estimated using monitored streamflow data. The use of hydrologic indicators is one of the conventional approaches to estimate stream health [8]. Software tools, such as Indices of Hydrologic Alteration (IHA) [9,10] and National Hydrologic Assessment Tool (NATHAT) [11] are available to estimate various hydrologic indicators using monitored streamflow observations. Other tools, such as the Tennant method [12,13] and Range of Variability Analysis (RVA) [14,15], are also available. A comparison of the strengths and weaknesses of different hydrologic approaches is presented in Table 2. Some guidelines to estimate stream health using flow data are available from some recent studies [16]. In this study, the NATional Hydrologic Assessment Tool (NATHAT) developed by the United States Geological Survey (USGS), and the scoring framework of the Dundee Hydrologic Regime Assessment Method (DHRAM) [17] are used to assess the full picture of stream health. From the hydrologic tools, NATHAT was chosen because of the opportunity to estimate different components of stream health based on a few non-redundant indicators exclusively identified for each stream type (Table 2).

Table 2.
Some hydrologic tools available for estimating stream health.
The goal of the study is to estimate the stream health in aggregate for the Plum Creek, including likely changes in various components, such as the riparian vegetation alteration, change in the abundance of aquatic species, increases in channel degradation, etc., as opposed to focused estimates on individual components of stream health alone. The objectives are (1) Use the statistics derived from the monitored streamflow observations to represent the different components of stream health. (2) Follow established guidelines to estimate stream health using hydrologic methods. (3) Support the estimated stream health estimation with water quality and biological data collected for the stream.
The study area is the Plum Creek watershed in Texas, USA (Figure 1). Although there are plenty of watersheds in Texas, this was chosen for this study because stream health in the creek appears to be altered by human activities, such as high effluent discharge, land use, and land cover changes/urbanization, as documented in the Plum Creek Watershed Protection Plan [21]. Another reason for choosing this watershed is the availability of many years of flow data for the analysis.
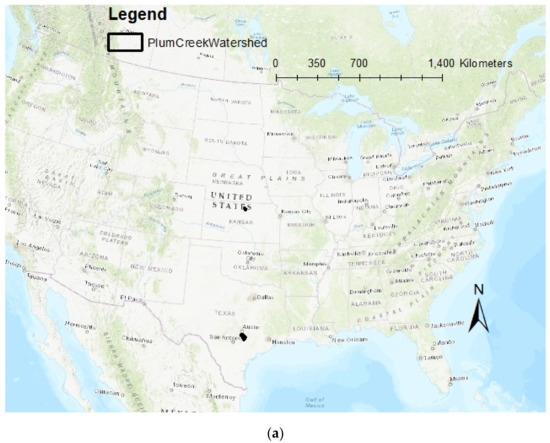
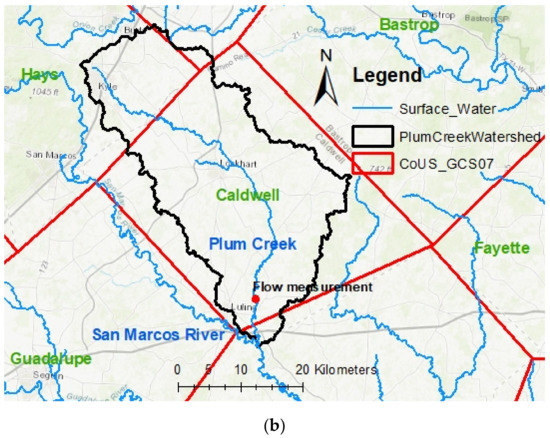
Figure 1.
(a) Location of Plum Creek Watershed in TX, USA (b) Detailed location of the watershed, streams, counties and cities (Red line shows county boundary).
2. Materials and Methods
This study uses hydrologic indicators to estimate stream health using two stepwise approaches: (1) using the eco-deficit and eco-surplus concept based on flow duration curves (FDCs) [22] to analyze the existence of a stream health problem, and (2) using hydrologic indices estimated by NATHAT to analyze the overall stream health. The concept of the study is demonstrated with the detailed estimation of stream health for the Plum Creek watershed using a previously established clear and systematic approach [16]. The approach for estimating stream health using observed/modeled streamflow follows a seven-step process, as outlined in Kannan et al. (2018) [16] is described clearly in this section.
2.1. Study Area Identification
The Plum Creek Watershed (PCW) of central Texas, USA, covers portions of Hays and Caldwell counties (Figure 1). Plum Creek is a tributary of the San Marcos River in Texas, USA. The watershed area is 1028 km2 (397 mi2). The climate in the watershed is semi-humid subtropical. The landcover of the PCW is typical of Texas Blackland Prairies and East Central Texas Plains (Figure 2). The Carrizo–Wilcox formation is a major local aquifer, with the Edwards Aquifer underlying the northern parts of the watershed. The majority of the land cover is forest and cultivated area, although urbanization is noticeable in recent years (Figure 2).
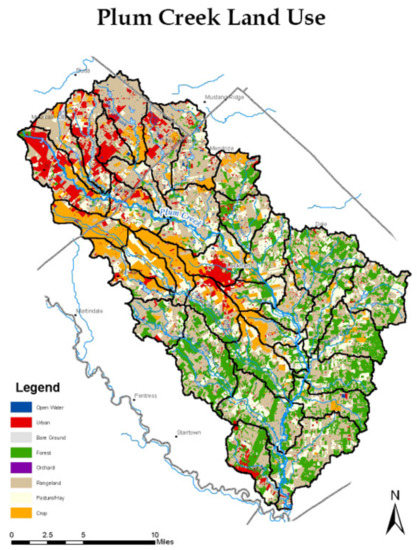
Figure 2.
Land cover map of the Plum Creek watershed (Based on 2004–2005 National Agricultural Inventory Program aerial photography; Sub-watershed boundaries shown as black polygons, Source of data: Plum Creek Watershed Partnership 2018 [21]).
The Texas Commission on Environmental Quality (TCEQ) has designated the watershed for aquatic life, contact recreation, and fish consumption. Historically, the Plum Creek was a shallow and intermittent stream, running dry in drought but flowing after heavy rainfall. Before urban development, the creek above Lockhart ran dry almost every summer, as that portion of the stream was fed by rainfall and runoff. Below Lockhart, the small springs that exist today flow throughout the year and drive the Plum Creek. Due to the water released from wastewater treatment plants, the creek now flows year-round over most of its length. Habitat analysis and landowner observations in the Plum Creek watershed indicate feral hogs have the potential to contribute to water pollution by increasing the levels of sediment, nutrients, and bacteria.
2.2. Organization of Streamflow
Monitored daily streamflow observations from 1931 to 1992 were used in this study for the stream health analysis, along with observed daily precipitation data for the corresponding period. The flow data were obtained from the gauging station (USGS station ID: 08173000) located at the watershed outlet near Luling, TX (Figure 1). It should be noted that the study described in this manuscript was completed in the year 2010. In addition, there was a flow data gap from October 1993 to July 2001. Therefore, the most recent flow and precipitation data were not used in this study. Although another USGS gauging station (ID: 08172400) at Lockhart, TX (Figure 1) had flow observations, the gauge near Luling was preferred because of the following reasons: (a) At the time of the analysis, Luling had ten more years of data (than Lockhart) in length; (b) Flow data availability in the pre-development period (Data availability started from 1931 for Luling vs. 1959 for Lockhart), and (c) Ability to cover the entire watershed.
2.3. Division of Flow Data Into Pre and Postalteration Periods
The time series of mean daily flow values were comprehensively analyzed using multiple statistical approaches. As the first item, the non-parametric Mann–Kendall [23,24] test was performed on the time series to identify any trends in the streamflow data. As the next step, the Pettitt [25] test was performed to identify the single change point in the flow data. To analyze further and identify the existence of any multiple change points in the time series, a simple procedure (similar to the CUmulative SUM (CUSUM) [26]) was carried out (details provided in Appendix A) to identify change points and select the most appropriate one. Finally, the time series of daily streamflow values of Plum Creek was decomposed to substantiate the division of flow data into two parts belonging to pre- and post-alteration periods. For all the time series analysis (except the simple procedure to identify multiple change points), the trend package available in the programming language “R” was used throughout.
2.4. Appropriate Tools to Generate Stream Health Relevant Hydrologic Indices
In this study, the NATional Hydrologic Assessment Tool (NATHAT) [11] developed by the United States Geological Survey (USGS) was used to generate hydrologic indices using daily streamflow data. NATHAT can estimate many hydrologic indices that adequately characterize magnitude, duration, timing, frequency, and rate of change in streamflow. It computes 171 hydro-ecological indices for the flow data. The tool requires daily streamflow data for the computation of hydro-ecological indices. With the inclusion of daily peak streamflow (optional), eight additional indices could also be calculated. The NATHAT program is freely available from the science base website available at https://www.sciencebase.gov/catalog/item/5387735ee4b0aa26cd7b5461 [27].
2.5. Development of Flow Duration Curves (FDCs) and Estimation of Indices of Hydrologic Alteration (IHA)
Flow duration curves during pre- and post-alteration periods were used to identify the existence of a stream health problem. An FDC illustrates the probability (or proportion of the time) that the streamflow will equal or exceed a specified value. Flow duration intervals of zero and 100 correspond to the highest (i.e., flood situation) and the lowest (i.e., no flow/drought conditions). In this study, observed streamflow data (as described in Section 2.2) are used to develop FDCs.
NATHAT, along with daily streamflow data, was used to generate the 171 hydro-ecological indices. Apart from flow data, the other parameters required to generate the indices were drainage area lower and upper limits for the index as percentiles (confidence limits). The confidence limits of 25 % and 75 % were used. However, any other limits can also be used. The indices were generated separately for the periods of before and after alteration. The indices were named with unique codes to reflect the category to which they belong. Magnitude, frequency, duration, rate of change and timing, were coded as parameters starting with M, F, D, R, and T, respectively. The sub-categories of flow, such as low flow, high flow, and average, were coded as L, H, and A, respectively. Usually, the sub-category codes appeared as the second letter in the parameter code, e.g., MA is the magnitude of an average flow event.
2.6. Identification of Ecologically Relevant Hydrologic Indicators
NATHAT software generates 171 hydrologic indicators. Although all the parameters describe human-made alterations to stream health clearly, many parameters convey overlapping information. To adequately estimate stream health, without using the redundant and overwhelming list of indices, the most appropriate indicators that are necessary need to be selected. The purpose of the selection is to have a few non-redundant indices. Similar indices were used in other studies to analyze either entire or parts of the stream health [28,29,30,31]. The selection of appropriate indicators was based on the guidelines established by Olden and Poff (2003) [20]. However, the guidelines require the user to identify the stream type as a pre-requisite. The stream type was estimated based on the stepwise procedure outlined by Olden and Poff (2003) [20]. The procedure identifies 11 different types of streams based on various characteristics. There are four levels of screening to identify major stream types, such as an intermittent stream, snowmelt stream, groundwater stream, and perennial stream. The four levels of screening are based on a few indices. Note that not all the parameters are needed for the estimation of stream type. Depending on how the stream type estimation goes, the number of parameters could be limited (e.g., an intermittent runoff stream could be identified by estimating just four parameters viz. ZERODAY, DAYCV, FLDFREQ, and LOWFREE).
2.7. Stream Health Estimation
Two sequential methods were used in this study for stream health assessment: (1) eco-deficit and eco-surplus concept using FDCs to identify the existence of a stream health issue, and (2) a combination of the NATHAT-DHRAM tools to estimate the details of stream health.
2.7.1. Identification of the Presence/Absence of Stream Health Problem Using the Eco-Deficit and Eco-Surplus Method Facilitated by the FDCs
To identify the presence or absence of a stream health problem, FDCs were plotted together for pre-alteration and post-alteration conditions. The difference between the two FDCs was marked and identified as eco-deficit/eco-surplus based on the reference table developed by Kannan et al., 2018 [16].
2.7.2. Detailed Stream Health Estimation Using the NATHAT-DHRAM Approach
To quantify the level of the stream health problem, the DHRAM [17] was used as a scoring framework. Black et al. [17] outlined that the DHRAM method can be used with ecologically relevant hydrologic indicators. In this approach, the hydrologic indices can be connected to the stream health impact through the concept of risk. The underlying assumption is that the stream health risk is directly proportional to the total alteration made to the hydrologic regime (or flow pattern and magnitude). The result is a stream health categorization between one indicating no impact and five suggesting severe impact.
The foremost step in the NATHAT–DHRAM method is the computation of the difference (%) between before and after the alteration. It is estimated as:
(Source: Kannan et al., 2018 [16])
The percentage differences for coefficients of variation (CVs) and means were estimated and presented for each group. They provided estimates of the impact points that were used to analyze the stream health status. After that, the impact points were given scores for each group based on the Black et al. [17] study. A stream will have 10 different categories (five groups with two categories under each group) with three impact points for each of the 10 categories. Therefore, the total impact points cannot exceed 30. Any stream can be classified into any of the five stream health classes [17] based on cumulative impact points received from all the groups. The stream health category can be downgraded by one level if the human-made changes could have altered the sub-daily streamflow by 25% for the flow magnitude, which has a frequency of occurrence of 95%, or the stream drying out because of the changes in the watershed. Class five is the lowest possible categorization for a stream.
2.8. Validation of Stream Health Estimates
The stream health estimates were validated by available water quality data and index of biological integrity (IBI). Nekton IBI (for organisms that can swim) and Benthic IBI (organisms that live at the bottom of water bodies) scores available for the period 2004–2018 were used to validate the stream health findings from this study. Water quality observations available for the Plum Creek from 2008 to 2017 were analyzed to validate the deterioration of stream health, as estimated by this study. It should be noted that the observations on pre-development were not available for the stream. The State of Texas in the US publishes the Texas integrated report of surface water quality (TIRSWQ) once every two years [32]. The report uses current data as well as the previous seven years to analyze historic water quality impairments.
3. Results and Discussion
3.1. Division of Flow Data into Pre- and Post-Alteration Periods
The Mann–Kendall test (τ = 0.0738, two-sided p value = ) and seasonally-adjusted Mann–Kendall test (τ = 0.0823, two-sided p value = ) pointed out the existence of a trend in the mean daily streamflow at the 95% confidence level (or at the 0.05 significance). The Pettitt test identified the change point corresponding to the date 20 September 1967. The p-value of the Pettitt test was . The simple procedure employed identified multiple change points with the most deviation of daily flow from the mean corresponding to the date identified by the Pettitt method (Figure 3). However, the first noticeable major change in flow occurred during the end of 1955, which was also identified by the mass curve analysis of cumulative streamflow and cumulative precipitation (Figure A1 and Figure A2 in Appendix A). Therefore, the flow data from 1931–1955 was designated as the pre-alteration period and the remaining as the post alteration period. The decomposed time series of daily streamflow values of Plum Creek (Figure A3 in Appendix A) (existence of different trends during pre- and post-alteration periods) and the runoff to precipitation ratio during pre-alteration (0.12) and post-alteration (0.15) substantiate the division of flow data into two parts belonging to pre- and post-alteration periods for this study. Similar hydrologic alterations in the 1950s and 1960s were observed for many Texas Rivers [33,34].
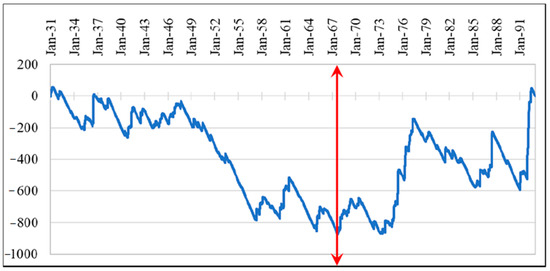
Figure 3.
Hydrologic alteration for the Plum Creek watershed indicated by the change points. The maximum deviation of daily streamflow from the mean is shown by the red line with arrows corresponding to 20 September 1967. The first noticeable major change in flow occurred during the end of 1955. The flow data was monitored at Luling, Texas (United States Geological Survey (USGS) Gaging Station No. 08173000).
There was an increase in precipitation (by 10%) during the post-alteration period (annual average value 907 mm) than pre-alteration (822 mm). The increases in precipitation during post alteration was not consistent throughout the year. Instead, specific months (May, June, and September) exhibited noticeable increases in precipitation (Figure 4). However, precipitation in July during post alteration showed declines (Figure 4). Therefore, changes in precipitation magnitude (mostly increases) and changes in precipitation pattern (increases in May, June, and September and declines in July) in post-alteration when compared to pre-alteration period is one of the reasons for the hydrologic change in Plum Creek. However, there are other reasons, such as the land cover change, that could have played a significant role in the hydrologic alteration, eventually, of the stream health. The Hays county (The upper North Western portion of the watershed where most of the present urbanization is seen (Figure 1 and Figure 2)) until the 1950s (specifically 1846–1955) was mostly rural with ranches raising cattle, sheep, and deer relying primarily on the Blackland prairies. Later they identified the land as suitable for cultivating cotton. Some other crops were added to their list as the years went by. The land cover in the 19th century and the first half of the twentieth century in Hays county was documented in the National Register of Historic Places, 2004 [35]. Significant urbanization that occurred in the upper northwestern and central parts of the watershed during the latter part of the 20th century is the probable reason for the increased value of hydrologic indicators affecting stream health in the watershed. The streamflow to precipitation ratio during post alteration (0.15) was higher than the pre-alteration period (0.12), which indicates that most of the changes in flow during post-alteration are resulting from factors other than changes in precipitation. Figure 5 showing a comparison of streamflow values from cultivated land, forest, and urban area substantiates the fact that increased streamflow in the Plum Creek was mostly due to changes in land cover (mainly urbanization), although some increases in streamflow were attributed to the increased precipitation during post-alteration period.
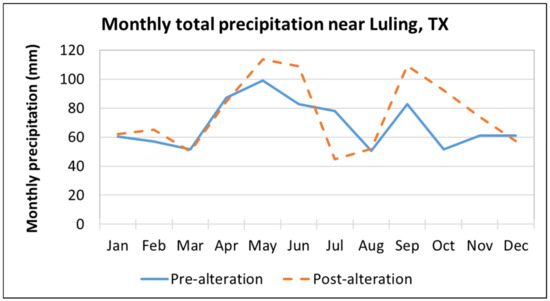
Figure 4.
Monthly precipitation in the Plum Creek watershed.
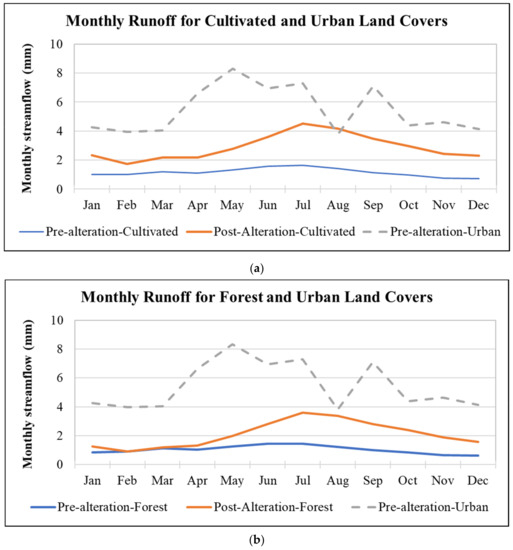
Figure 5.
(a) Uncalibrated approximate streamflow from cultivated and urban land covers from a computer model for the Plum Creek watershed (The difference between the thin blue line and thick orange line indicates the changes in streamflow resulting from changes in precipitation for the same land cover (cultivated). The difference between the thin blue line and dotted grey line indicates the changes in streamflow resulting from land cover change (from cultivated to urban). The purpose of this figure is to prove that the urbanization (during post-alteration) in the watershed altered the flows more than those brought by changes in precipitation (between pre- and post-alteration periods)). (b) Uncalibrated approximate streamflow from forest and urban land covers from a computer model for the Plum Creek watershed (The difference between the thin blue line and thick orange line indicates the changes in streamflow resulting from changes in precipitation for the same land cover [forest]. The difference between the thin blue line and dotted grey line indicates the changes in streamflow resulting from land cover change (from forest to urban). The purpose of this figure is to prove that the urbanization (during post-alteration) in the watershed altered the flows more than those brought by changes in precipitation (between pre- and post-alteration periods)).
3.2. Preliminary Estimation of Existence/Absence of Stream Health Problem in the Study Area
Continuous time-series of monitored daily streamflow observations and daily precipitation from 1931 to 1992 were used in this study for the stream health analysis. A considerable hydrologic change was observed in the runoff plot (Figure 3), and it corresponded to the year 1955 for the Plum Creek watershed. Therefore, the data until 1955 (1931–1955) were identified as the period before alteration, and after 1955 (1956–1992) was classified as after alteration.
A simple method for investigating the presence/absence of a stream health problem using the FDC-based eco-deficit or eco-surplus method [22] was used in this study. Whether higher (surplus) or lower (deficit), any significant change in streamflow impairs stream health status in relation to the duration, timing, magnitude, rate of change, and frequency [36]. The FDCs for the pre- and post-alteration periods for the Plum Creek watershed (Figure 6) indicated the existence of large eco-surplus in both high and low flows, which correspond to the minimum to moderate severity of stream health issues.
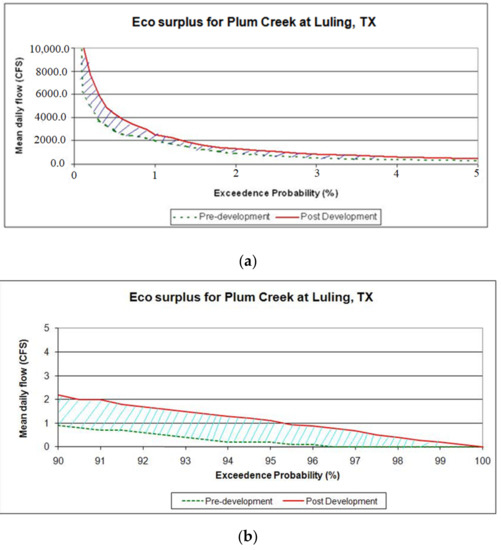
Figure 6.
Eco surplus indicated by the flow duration curves (FDCs) in the Plum Creek watershed (a) high-flow period (FDC) (b) low-flow period.
3.3. Identification of the Stream Type and Analysis of the Hydrologic Indices Affecting Stream Health
Based on the analysis of relevant hydrologic indices [20], Plum Creek was identified as a perennial runoff stream ruling out the other possibilities for stream type. Therefore, only the model parameters relevant to a perennial stream type during pre- and post-alteration periods were considered for the Plum Creek. The most pertinent hydro-ecological indicators affecting stream health are presented in Table 3 by stream health parameter type (benthic organisms, riparian vegetation, aquatic species, and channel degradation) and categories of flow parameter type (duration, magnitude, timing, and frequency).

Table 3.
Calculated NATional Hydrologic Assessment Tool (NATHAT) Indices and Parametric Statics.
The ecologically relevant NATHAT parameters calculated for the period before alteration (1931–1955) and the period after alteration (1956–1992) are shown in Table 3. The mean daily flows for the pre- and post-alteration periods were 1.7 m3/sec (84.6 ft3/sec) and 3.7 m3/sec (129.7 ft3/sec), respectively. The maximum daily flows were not more than 425 m3/sec (15,000 ft3/sec (except one outlier of 1240.3 m3/sec (43,800 ft3/sec)) and 544 m3/sec (19,200 ft3/sec) for the pre-alteration and post-alteration periods. The CV of daily flow was estimated at 9.0 and 5.2 for the pre- and post-alteration period, respectively. These statistics indicate some changes in the watershed could have increased flow volume significantly both in high and low flow periods. (Figure 7).
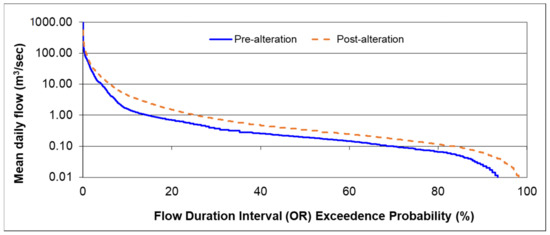
Figure 7.
Impact of land cover change in the watershed on the streamflow at the watershed outlet.
An analysis of the NATHAT indices (in Table 3) indicates the post-alteration period witnessed declines in High Flow Duration Parameters (especially DH13, and DH16) and Flow Frequency Parameters (FH6, and FH7). However, the high flood pulse counts (FH5) were increasing in the post-alteration when compared to the pre-alteration. These hydrologic changes are likely to affect benthic organisms [37,38].
Changes in high flow frequency parameters (as described in the previous paragraph) coupled with increases in extreme high flow (Q10) and flood plain inundation (Q2) and high flow magnitude parameters (MH8, and MH23) with declines in median annual maximum flow (MH14), and baseflow index (ML17) could have affected the riparian vegetation part of stream health in Plum Creek [39,40]. In addition to the parameters responsible for changes in riparian vegetation, declines in the timing of seasonal flow parameters (especially TA3 and TH3) could have affected the aquatic species in the Plum Creek [41].
Channel erosion potential in the post alteration period had increased when compared to the pre-alteration period (Table 3). It is justified by the increases in shear stress factor (SSF), which is a function of the 50-year flood (Q50), which in turn is a function of channel depth. The increases in channel depth could be the result of possible downcutting in Plum Creek, which could have come from increased streamflow in the post-alteration period [42,43].
Some changes in precipitation between pre- and post-alteration periods and land cover changes (mainly urbanization) in the post-alteration period (as described in the latter part of Section 3.1) likely explain the difference in the hydrologic indices during pre- and post-alteration periods shown in Table 3 above.
3.4. Estimation of Overall Stream Health
The DHRAM analysis (Table 4) using the hydrologic indicators suggest the stream health analyzed at the Plum Creek watershed outlet comes under Class 3, indicating a moderate risk of stream health impact. Group 1 indicators that are related to the magnitude of monthly streamflow received the maximum impact points. The probable ecosystem consequences resulting from Group 1 indicators include the availability of (a) habitat for aquatic organisms; (b) soil moisture for plants; (c) water for the stream dependent animals; (d) food and cover for the mammals; (e) predators to nesting sites, and (g) oxygen and photosynthesis influences and water temperature in the water column.

Table 4.
(a) Computation of Average % Alteration and Impact Points; (b) Estimation of Stream Health for Plum Creek Watershed.
The impact points were aggregated for individual categories of stream health, such as aquatic species, riparian vegetation, macro-invertebrates, and channel degradation, and are presented in Table 4b after rescaling them to a common scale of 30. All the stream health categories point out moderate impairment of Plum Creek, although the impact points received by each category vary slightly. An increase in flow magnitude and probable decrease in fish species diversity was documented for the Plum Creek watershed in a previous study [43]. Looking at the changes in water quality data and monitored information on aquatic species for the watersheds during pre- and post-alteration were thought as additional materials to substantiate our findings on the stream health for the study area.
3.5. Validation of the Estimated Stream Health Status
The stream health deterioration during post alteration estimated by this study is supported by the Index of Biotic Integrity (IBI) scores observed during 2004–2018 in the watershed (Figure 8). Figure 8 shows both the Nekton IBI (for organisms that can swim) and Benthic IBI (organisms that live at the bottom of water bodies) scores. Based on a commonly agreed scale in the ecological community (Table 5), the Nekton IBI scores (Figure 8a) point out 20% of the time for limited aquatic use and 40% of the time for intermediate aquatic use of the stream. On the other hand, the benthic IBI scores (Figure 8b) point out 13% of the time for limited aquatic use and 40% of the time for intermediate aquatic use. In summary, the observed IBI scores point out the stream health impairment of Plum Creek as estimated by this study.
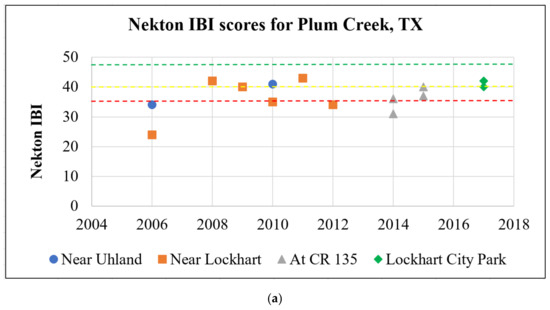
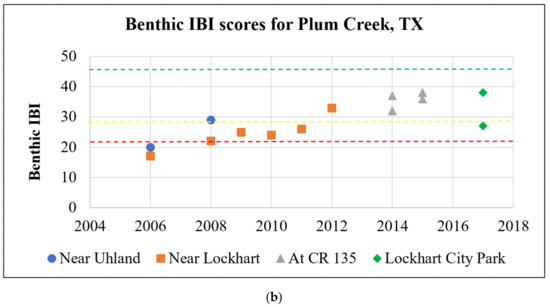
Figure 8.
(a) Nekton Index of Biotic Integrity (IBI) scores for the Plum Creek watershed observed in different locations (Stream classification categories for aquatic species: Below the red line: Limited, Between red and yellow lines: Intermediate, Between yellow and green: High, Above green: Exceptional); (b) Benthic Index of Biotic Integrity (IBI) scores for the Plum Creek watershed observed in different locations (Stream classification categories for aquatic species: Below the red line: Limited, Between red and yellow lines: Intermediate, Between yellow and green: High, Above green: Exceptional).

Table 5.
Index of Biotic Integrity (IBI)-based Stream Classification for Aquatic Use.
For Plum Creek, the TIRSWQ report pointed out consistent stream impairment concerns from 2002 to 2020 for bacteria in all three stream segments. In addition, there were concerns about nitrate and total phosphorus in different segments in several years with occasional dissolved oxygen impairment. The probable sources of bacteria include the septic systems and pets from residential areas, livestock operations from agricultural land, and wildlife, especially the feral hogs that underwent a control operation [21]. Apart from the agricultural non-point source pollution of land-applied fertilizer and manure, the same sources outlined before could also be attributed to the elevated nutrient levels.
Chloride concentration during post-development (relatively higher urbanization) was noticeably and consistently higher during a few days (Figure 9), suggesting chronic exposure problems for aquatic species, although high, infrequent concentrations are not going to trigger acute exposure [44]. The anthropogenic sources of excess chloride could have come from water and wastewater treatment in urban areas, the drainage of swimming pools, and the diffuse source transfer of deicing salts that are used in urban areas (not frequent in Plum Creek) during winter and chlorides used for dust control, fertilizer use in rural areas, and landfills [45]. Literature has shown that the excess chlorides from urban areas are correlated to the population and imperviousness [46]. The excess chlorides observed in the stream could also have come from natural sources, such as the atmospheric deposition, evaporative concentration of precipitation, and chemical weathering [45].
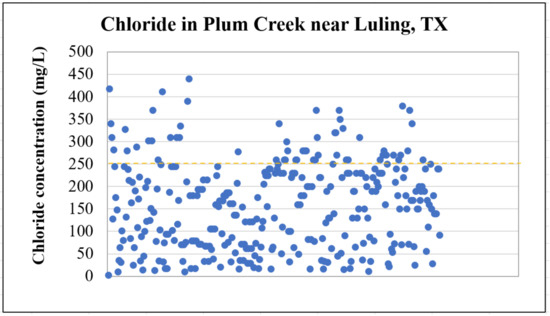
Figure 9.
Chloride concentration in Plum Creek observed near Luling, TX, from 1961 to 1986. (250 mg/L (shown as the orange line) is the drinking water standard and the chronic exposure levels for aquatic species).
The land cover changes documented in the National Register of Historic Places [35] support our estimated stream health for Plum Creek. Lack of extensive validation of results is a limitation of the present study.
4. Summary and Conclusions
In this study, the status of different components of the stream health, such as aquatic species, riparian vegetation, channel degradation, and benthic organisms, were estimated for the Plum Creek Watershed (PCW) in Texas, USA, based on the previously established guidelines.
The possible presence of the stream health problem was identified based on eco surplus obtained in both the low flow and high flow zones of the FDCs. Out of a total of 30 impact points, 8, 7.5, 5, and 10 impact points were obtained for the aquatic species, riparian vegetation, macro-invertebrates, and channel degradation, respectively. Based on the above impact points, the stream health of Plum Creek was potentially classified as moderately impacted. Physicochemical water quality parameters on nitrogen, phosphorus, and bacteria, and the monitored information on aquatic species available support the stream health impact identified for Plum Creek. Furthermore, land cover changes in the watershed before and after 1955 documented in the National Register of Historic Places in the USA, and the present land cover map support the stream health finding of this study. However, a 10% increase in annual precipitation during the post alteration period (than pre-alteration) and changes in the pattern of monthly precipitation were also likely responsible for the stream health issues in the watershed.
Author Contributions
N.K. conceived the idea, designed and carried out the entire study. Author has read and agreed to the published version of the manuscript.
Funding
“This research was funded by USEPA Region VI” and “The APC was funded by the author’s discount vouchers”.
Acknowledgments
Thanks to the United States-Environmental Protection Agency (USEPA) Region VI for funding this work. Thanks to all the federal agencies that provided the data required for the project. Thanks to the reviewers who helped to improve the quality of the manuscript. Thanks to Kartik Venkataraman of Tarleton State University for some of his suggestions on the time series analysis part.
Conflicts of Interest
The author declares no conflict of interest. The funding sponsors did not play any role in the design of the study, in the data collection, and analyses.
Appendix A. Details on Identification of Change Point
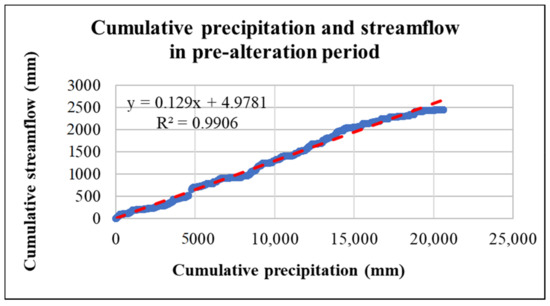
Figure A1.
Mass curve of cumulative streamflow and cumulative precipitation during the pre-alteration period (1931–1955).
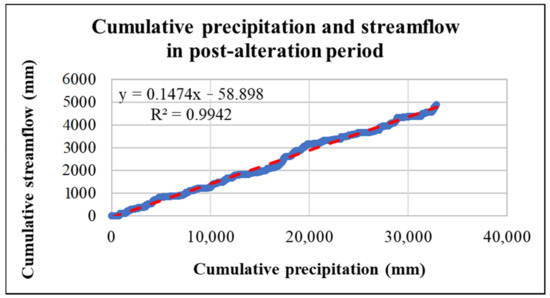
Figure A2.
Mass curve of cumulative streamflow and cumulative precipitation during the post-alteration period (1956–1992).
Procedure to estimate the change point in the time series of mean daily flow.
- (1)
- Computation of average of the entire time series of mean daily flows;
- (2)
- Estimation of deviation of individual flow values from the average (estimated above);
- (3)
- Cumulative total of quantities estimated in step 2;
- (4)
- Plotting of the quantities obtained in step 3;
- (5)
- Identification of change point showing the maximum deviation of daily average flow from the mean.
Any time series is composed of three components: (1) trend, (2) seasonal factors, and (3) random/irregular component. The goal of the time series decomposition is to separate the time series and identify all the three different components, which offer some useful insights into the data. The trend package available in the programming language "R" was used in this study to automatically decompose the average daily streamflow time series and identify the different components.
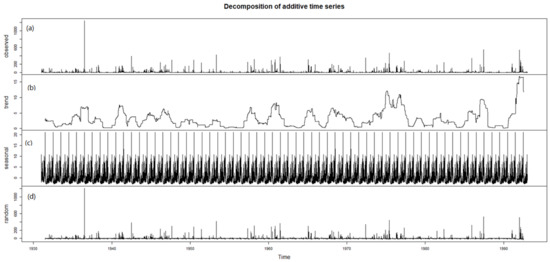
Figure A3.
Decomposed time series of average daily streamflow values for Plum Creek showing: (a) The observations of mean daily streamflow; (b) trend in the time series; (c) seasonality in the time series, and (d) random component.
References
- USEPA. Available online: https://ofmpub.epa.gov/waters10/attains_nation_cy.control#STREAM/CREEK/RIVER (accessed on 4 June 2020).
- Hersh, E.S.; Maidment, D.R. Assessment of Hydrologic Alteration Software; A Report Submitted to Texas Water Development Board; Center for Research in Water Resources, University of Texas at Austin: Austin, TX, USA, 2006. [Google Scholar]
- Wang, L.Z.; Lyons, J.; Kanehl, P. Impacts of urbanization on stream habitat and fish across multiple spatial scales. Environ. Manag. 2001, 28, 255–266. [Google Scholar] [CrossRef] [PubMed]
- Nagy, R.C.; Lockaby, G.; Helms, B.; Kalin, L.; Stoeckel, D. Water Resources and Land Use and Cover in a Humid Region: The Southeastern United States. J. Environ. Qual. 2011, 40, 867–878. [Google Scholar] [CrossRef] [PubMed]
- Schoonover, J.E.; Lockaby, B.G.; Helms, B.S. Impacts of Land Cover on Stream Hydrology in the West Georgia Piedmont, USA. J. Environ. Qual. 2006, 35, 2123–2131. [Google Scholar] [CrossRef] [PubMed]
- Annear, T.C.; Conder, A.L. Relative bias of several fisheries instream flow methods. N. Am. J. Fish. Manag. 1884, 4, 531–876. [Google Scholar] [CrossRef]
- Lohr, S.C. Wetted Stream Channel, Fish Food Organisms, and Trout Relative to the Wetted Perimeter Inflection Method. Ph.D. Thesis, Montana State University, Bozeman, MT, USA, 1993. [Google Scholar]
- Harmsworth, G.; Young, R.; Walker, D.; Clapcott, J.; James, T. Linkages between cultural and scientific indicators of river and stream health. N. Z. J. Mar. Freshw. Res. 2011, 45, 423–436. [Google Scholar] [CrossRef]
- The Nature Conservancy. Indicators of Hydrologic Alteration—Version 7 User’s Manual; The Nature Conservancy: Arlington, VA, USA, 2007. [Google Scholar]
- IHA Software Download. Available online: https://www.conservationgateway.org/ConservationPractices/Freshwater/EnvironmentalFlows/MethodsandTools/IndicatorsofHydrologicAlteration/Pages/IHA-Software-Download.aspx (accessed on 4 June 2020).
- Cade, B.S. National Hydrologic Assessment Tool (NATHAT); U.S. Geological Survey: Reston, VA, USA, 2006.
- Tennant Donald, L. Instrem Flow Regimens for Fish, Wildlife, Recreation, and Related Environmental Resources; US Fish and Wildlife Service: Billings, MT, USA, 1975; p. 35.
- Tennant, D.L. Instream Flow Regimens for Fish, Wildlife, Recreation and Related Environmental Resources. Fisheries 1976, 1, 6–10. [Google Scholar] [CrossRef]
- Richter, B.D.; Baumgartner, J.V.; Wigington, R.; Braun, D.P. How much water does a river need? Freshw. Biol. 1997, 37, 231–249. [Google Scholar] [CrossRef]
- Richter, B.D.; Baumgartner, J.V.; Braun, D.P.; Powell, J. A spatial assessment of hydrologic alteration within a river network. Regul. Rivers Res. Manag. 1998, 14, 329–340. [Google Scholar] [CrossRef]
- Kannan, N.; Anandhi, A.; Jeong, J. Estimation of stream health using flow-based indices. Hydrology 2018, 5, 20. [Google Scholar] [CrossRef]
- Black, A.R.; Rowan, J.S.; Duck, R.W.; Bragg, O.M. DHRAM: A method for classifying river flow regime alterations for the EC Water Framework Directive. Aquat. Conserv. Mar. Freshw. Ecosyst. 2005, 15, 427–446. [Google Scholar] [CrossRef]
- Richter, B.D.; Baumgartner, J.V.; Powell, J.; Braun, D.P. A method for assessing hydrologic alteration within ecosystems. Conserv. Biol. 1996, 10, 1163–1174. [Google Scholar] [CrossRef]
- Poff, N.L. A hydrogeography of unregulated streams in the United States and an examination of scale-dependence in some hydrologic descriptiors. Freshw. Biol. 1996, 36, 71–79. [Google Scholar] [CrossRef]
- Olden, J.D.; Poff, N.L. Redundancy and the choice of hydrologic indices for characterizing streamflow regimes. River Res. Appl. 2003, 19, 101–121. [Google Scholar] [CrossRef]
- Plum Creek Watershed Partnership, 2018 Update to the Plum Creek Watershed Protection Plan, the Plum Creek Watershed Partnership. Available online: http://plumcreek.tamu.edu (accessed on 4 June 2020).
- Gao, Y.; Vogel, R.M.; Kroll, C.N.; Poff, N.L.; Olden, J.D. Development of representative indicators of hydrologic alteration. J. Hydrol. 2009, 374, 136–147. [Google Scholar] [CrossRef]
- Mann, H.B. Nonparametric tests against trend. Econometrica 1945, 13, 245–259. [Google Scholar] [CrossRef]
- Kendall, M.G. Rank Correlation Methods; Oxford University Press: New York, NY, USA, 1975. [Google Scholar]
- Pettitt, A.N. A non-parametric approach to the change-point problem. Appl. Stat. 1979, 28, 126–135. [Google Scholar] [CrossRef]
- Page, E.S. Continuous Inspection Scheme. Biometrika 1954, 41, 100–115. [Google Scholar] [CrossRef]
- Available online: https://www.sciencebase.gov/catalog/item/5387735ee4b0aa26cd7b5461 (accessed on 4 June 2020).
- Puckridge, J.T.; Sheldon, F.; Walker, K.F.; Boulton, A.J. Flow variability and the ecology of large rivers. Mar. Freshw. Res. 1998, 49, 55–72. [Google Scholar] [CrossRef]
- Du, K.; Xua, L.; Wu, H.; Tu, B.; Zheng, B. Ecophysiological and morphological adaption to soil flooding of two poplar clones differing in flood-tolerance. Flora 2012, 207, 96–106. [Google Scholar] [CrossRef]
- Arias, M.E.; Cochrane, T.A.; Norton, D.; Killeen, T.J.; Khon, P. The Flood Pulse as the Underlying Driver of Vegetation in the Largest Wetland and Fishery of the Mekong Basin. Ambio 2013, 42, 864–876. [Google Scholar] [CrossRef]
- Alford, J.B.; Walker, M.R. Managing the flood pulse for optimal fisheries production in the Atchafalaya River basin, Lousiana, USA. River Res. Appl. 2011, 29, 279–296. [Google Scholar] [CrossRef]
- Available online: https://www.tceq.texas.gov/waterquality/assessment (accessed on 19 January 2021).
- Wurbs, R. Monthly river flows in Texas for natural and developed conditions. Water Cycle 2021, 2, 1–14. [Google Scholar] [CrossRef]
- Anderson, A.A.; Hubbs, C.; Winemiller, K.O.; Edwards, R.J. Texas freshwater fish assemblages following three decades of environmental change. Southwest. Nat. 1995, 40, 314–321. [Google Scholar]
- National Register of Historic Places; United States Department of Interior, National Park Service: Washington, DC, USA, 2004.
- Poff, N.L.; Zimmerman, J.K.H. Ecological responses to altered flow regimes: A literature review to inform the science and management of environmental flows. Freshw. Biol. 2010, 55, 194–207. [Google Scholar] [CrossRef]
- Konrad, C.P.; Brasher, A.M.D.; May, J.T. Assessing streamflow characteristics as limiting factors on benthic invertebrate assemblages in streams across the western United States. Freshw. Biol. 2008, 53, 1983–1998. [Google Scholar] [CrossRef]
- Herbst, D.B.; Cooper, S.D.; Medhurst, R.B.; Wiseman, S.W.; Hunsaker, C.T. Drought ecohydrology alters the structure and function of benthic invertebrate communities in mountain streams. Freshw. Biol. 2019, 64, 886–902. [Google Scholar] [CrossRef]
- Elderd, B.D. The impact of changing flow regimes on riparian vegetation and the riparian species mimulus guttatus. Ecol. Appl. 2003, 13, 1610–1625. [Google Scholar] [CrossRef]
- NASEM. Riparian Areas: Functions and Strategies for Management, National Academy of Sciences, Engineering, and Mathematics; National Academic Press: Washington, DC, USA, 2002. [Google Scholar]
- The Shape of Healthy Streams, Department of Natural Resources, Minnesota. 2006. Available online: https://files.dnr.state.mn.us/publications/ecological_services/healthy_rivers_color_background.pdf (accessed on 4 June 2020).
- Mažeika, S.; Sullivan, P.; Watzin, M.C.; Hession, W.C. Understanding stream geomorphic state in relation to ecological integrity: Evidence using habitat assessments and macroinvertebrates. Environ. Manag. 2004, 34, 669–683. [Google Scholar] [CrossRef]
- Hunt, M.; Herron, E.; Green, L. Chlorides in Fresh Water; The University of Rhode Island Watershed Watch, Cooperative Extension, College of Environment and Life Sciences, University of Rhode Island, Kingston, URIWW 4. 2012. Available online: http://cels.uri.edu/docslink/ww/water-quality-factsheets/Chlorides.pdf (accessed on 4 June 2020).
- Granato, G.E.; DeSimone, L.A.; Barbaro, J.R.; Jeznach, L.C. Methods for Evaluating Potential Sources of Chloride in Surface Waters and Groundwaters of the Conterminous United States; Open File Report 2015-1080; United States Geological Survey: Reston, VA, USA, 2015.
- Coles, J.F.; Cuffney, T.F.; McMahon Gerard Beaulieu, K.M. The Effects of Urbanization on the Biological, Physical, and Chemical Characteristics of Coastal New England Streams; U.S. Geological Survey Professional Paper 1695; USGS: Reston, VA, USA, 2004; p. 47.
- Granato, G.E. Methods for Development of Planning-Level Estimates of Stormflow at Unmonitored Sites in the Conterminous United States; Federal Highway Administration FHWA–HEP–09–005; Federal Highway Administration: Washington, DC, USA, 2010; p. 90.
Publisher’s Note: MDPI stays neutral with regard to jurisdictional claims in published maps and institutional affiliations. |
© 2021 by the author. Licensee MDPI, Basel, Switzerland. This article is an open access article distributed under the terms and conditions of the Creative Commons Attribution (CC BY) license (http://creativecommons.org/licenses/by/4.0/).