Article

Hydrochemical Characterization and Suitability Assessment of Groundwater Quality in the Saboba and Chereponi Districts, Ghana

by
Larry Pax Chegbeleh
1,*,
Delali Kwasi Aklika
1 and
Bismark Awinbire Akurugu
1,2
1
Department of Earth Science, University of Ghana, Legon, P.O. Box LG 58, Accra, Ghana
2
Council for Scientific and Industrial Research-Water Research Institute, P.O. Box M 32, Accra, Ghana
*
Author to whom correspondence should be addressed.
Hydrology 2020, 7(3), 53; https://doi.org/10.3390/hydrology7030053
Submission received: 20 June 2020 / Revised: 21 July 2020 / Accepted: 21 July 2020 / Published: 6 August 2020

Abstract

:
Hydrochemical data of groundwater samples obtained from the mudstones, sandstones, and siltstones aquifer units that underlie the study area have been characterized. The aim of this study was to assess the suitability of groundwater for drinking, domestic, and agricultural purposes. The physico-chemical parameters were initially compared with the World Health Organization (WHO) standards for potable water. They were further subjected to various hydrochemical techniques to assess the overall water quality for drinking purposes. Conventional methods of assessing irrigation water suitability were also adopted. The results indicate that, with the exception of HCO3 characterized as unsuitable for drinking water, most of the parameters are within the WHO permissible limits and are thus characterized as suitable for drinking water. A few samples however show slight deviation. The results also show that the abundance of major cations in groundwater is in the order: Na+ > Ca2+ > Mg2+ > K+. However, the abundance of the major anions is in the order: HCO3 > Cl > SO42. Na-HCO3 is thus inferred as the dominant water type in the area. Analyses of the overall Water Quality Index (WQI) and irrigation water assessment indices suggest that groundwater in the area is generally suitable for drinking, domestic, and irrigation purposes.

1. Introduction

The global economy, as reported by numerous studies [1,2,3], depends on water resources. According to the 2016 edition of the United Nations World Water Development Report (WWDR) dubbed “Water and Jobs”, as reported by the World Water Assessment Programme (WWAP) [2], an estimated three out of four jobs (75%) that make up the global workforce are either heavily or moderately dependent on water. The UN report also notes that, half of the world’s workers (1.5 billion people) are employed in eight water and natural resource-dependent industries. It is thus suggestive to say that the socio-economic development of any nation is tired to the availability of water resources. The portion of water resources used worldwide for drinking, domestic, industrial, and agricultural purposes is freshwater. Information on global water budget as contained on a webpage of the National Groundwater Association (NGWA), Westerville, United States, indicates that groundwater is the biggest reservoir of useable freshwater, accounting for about 98% of freshwater on earth [4]. Groundwater is therefore a very important water supply source all over the world. It is an essential natural resource and serves as an important water source for drinking, domestic and industrial purposes in most countries [5]. Its demand has arguably increased across the globe due to its suitability for domestic and agricultural purposes and the relatively less rigorous treatment requirement prior to usage. It is the primary source of drinking water for human consumption and estimated to supply about 50% of potable water for human consumption globally [6]. The situation is even more pronounced in Ghana as a whole and rural Ghana in particular, where groundwater supplies about 70% and 90% of drinking water to the respective populations [7]. Traditionally, rural communities in Ghana have depended on available surface water resources, such as rivers, streams, and in some cases dugouts, for their domestic and rural enterprise water requirements. However, rapid population growth coupled with climate variability/change and prolonged dry seasons has led to increasing demands for water and the depletion and pollution of surface water sources in some of these rural areas. This makes it very difficult to ensure sustainable supply of potable water for various uses. This has resulted in the need for alternative water sources of which groundwater is the prime option.
Groundwater has the integrity of being potable and has long been regarded as mostly a safe source of water for domestic, industrial, and agricultural purposes as compared to surface water sources. Nonetheless, due to its interaction for extended period of time with geological materials and the environment as a whole, groundwater has a wide range of variation in composition as compared to surface water [8]. The quality of some sources of groundwater has been found unacceptable due to the introduction of a range of pollutants such as nitrate, sulphate, toxic organic compounds, and pesticides into aquifers, especially in regions that are developed for industrial and agricultural purposes [9,10,11]. This has negative health implications stemming from geogenic and/or anthropogenic factors and can adversely affect the health of consumers [12,13]. Research shows that parts of northern Ghana, such as Bongo, Bolgatanga, Pwalugu, etc. have reported groundwater pollution problems [14]. Most of these studies identified rock weathering and anthropogenic activities as the causes of some of these pollution problems.
Saboba and Chereponi Districts are predominantly agrarian settlements. Most of the inhabitants depend on groundwater for drinking and domestic purposes, and to some extent for agricultural uses. In the wake of population growth with its attendant high demands for water, and the need to supply safe drinking water, it is important to evaluate and monitor the quality of the only source of potable water in communities within the study area. Therefore, the overall aim of this study was to assess the quality of groundwater in the area for domestic, drinking, and agricultural purposes. The following specific objectives were set for the achievement of the broad objective: (i) to characterize the physico-chemical parameters of groundwater through comparison with the World Health Organization (WHO) guidelines for potable use, (ii) to understand and identify the dominant ionic constituents and water types, and (iii) to analyse the overall Water Quality Index (WQI) and irrigation water assessment indices to assess the suitability of groundwater quality for drinking, domestic and agricultural purposes. The study is intended to provide relevant information which may serve as a decision support tool for the effective monitoring and management of groundwater quality for sustainable development.

2. Materials and Methods

2.1. Location, Vegetation and Climate

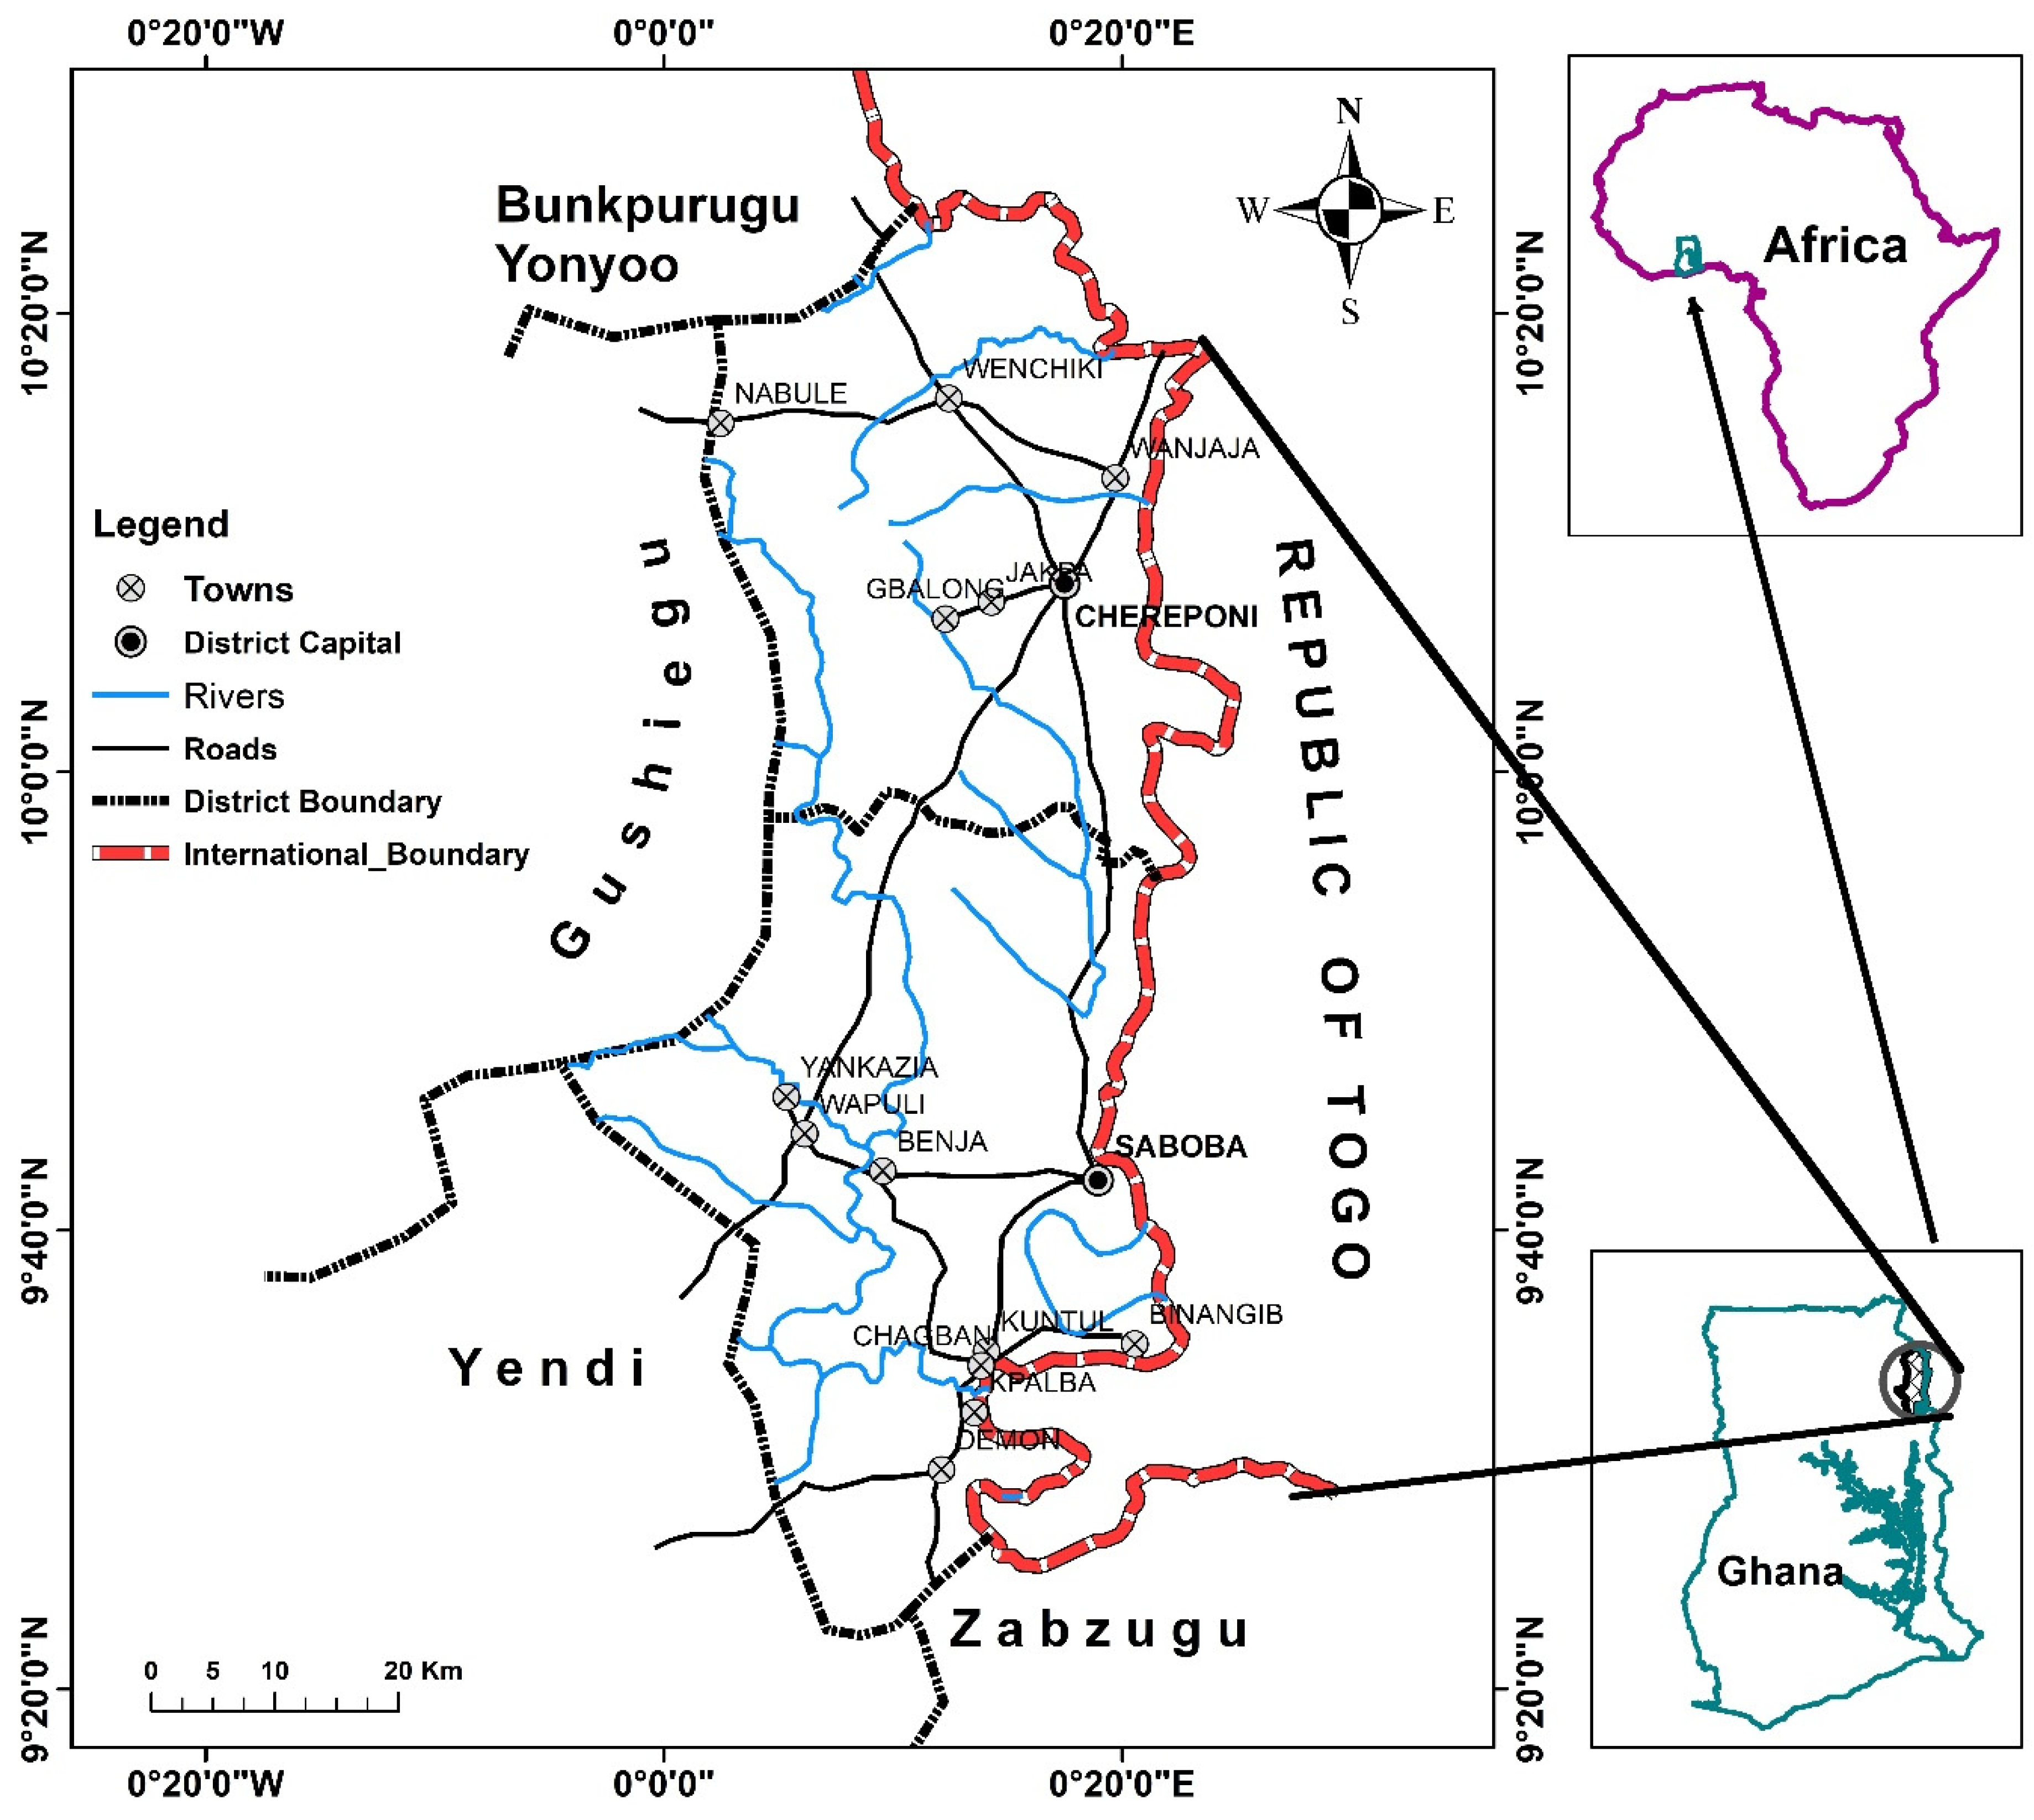
The study area is located in Saboba and Chereponi Districts (Figure 1), in the Northern and North East Regions of Ghana respectively. It falls between longitudes 0°10′ W and 0°28′ E and latitudes 9°20′ N and 10°28′ N and bordered by several other districts (Figure 1). It covers an area of about 2810 km2 [15].
The vegetation pattern in the area is that of the savannah grassland interspersed with clusters of shrubs, drought-resistant trees and short trees many of which are destroyed by anthropogenic activities such as construction, bush burning and farming [16].
On the basis of Köppen-Geiger climate classification [17], the study area is classified as a tropical savannah climate. Precipitation varies throughout the year characterized by two major seasons: the wet season which occurs between May and October with a mean annual precipitation of about 750 to 1050 mm. The wet season is followed by a prolonged dry season spanning from November to April. Temperatures are generally high all year round varying between 14 °C at night and 40 °C during the day. The dry season is characterized by dry northeast trade winds or Harmattan from November to February and high sunshine from March to May [18].

2.2. Geological and Hydrogeological Settings

On a regional scale, the Saboba and Chereponi Districts are underlain by rocks of the Voltaian Super Group [19]. The Voltaian Super Group encompasses partially metamorphosed sedimentary rocks which overly unconformably the West African Craton, precisely, the Man-Leo Shield [20]. Rocks of the Voltaian Super Group form the western margin of the Dahomeyide Pan-African belt which extend from parts of Ghana through Togo, Burkina Faso to Niger [19]. Almost one third of the total land area of Ghana (103,600 km2) is covered by the Voltaian Super Group and is made up of gently dipping sediments that rest on a dominant Precambrian unconformity [21]. The Voltaian rocks are made up of three main groups. The Kwahu-Bombouaka Group is the oldest and forms the base of the Voltaian Super Group. This is followed by the Oti-Pendjari Group unconformably overlying the Voltaian. The youngest and uppermost group is the Obosum Group [22].
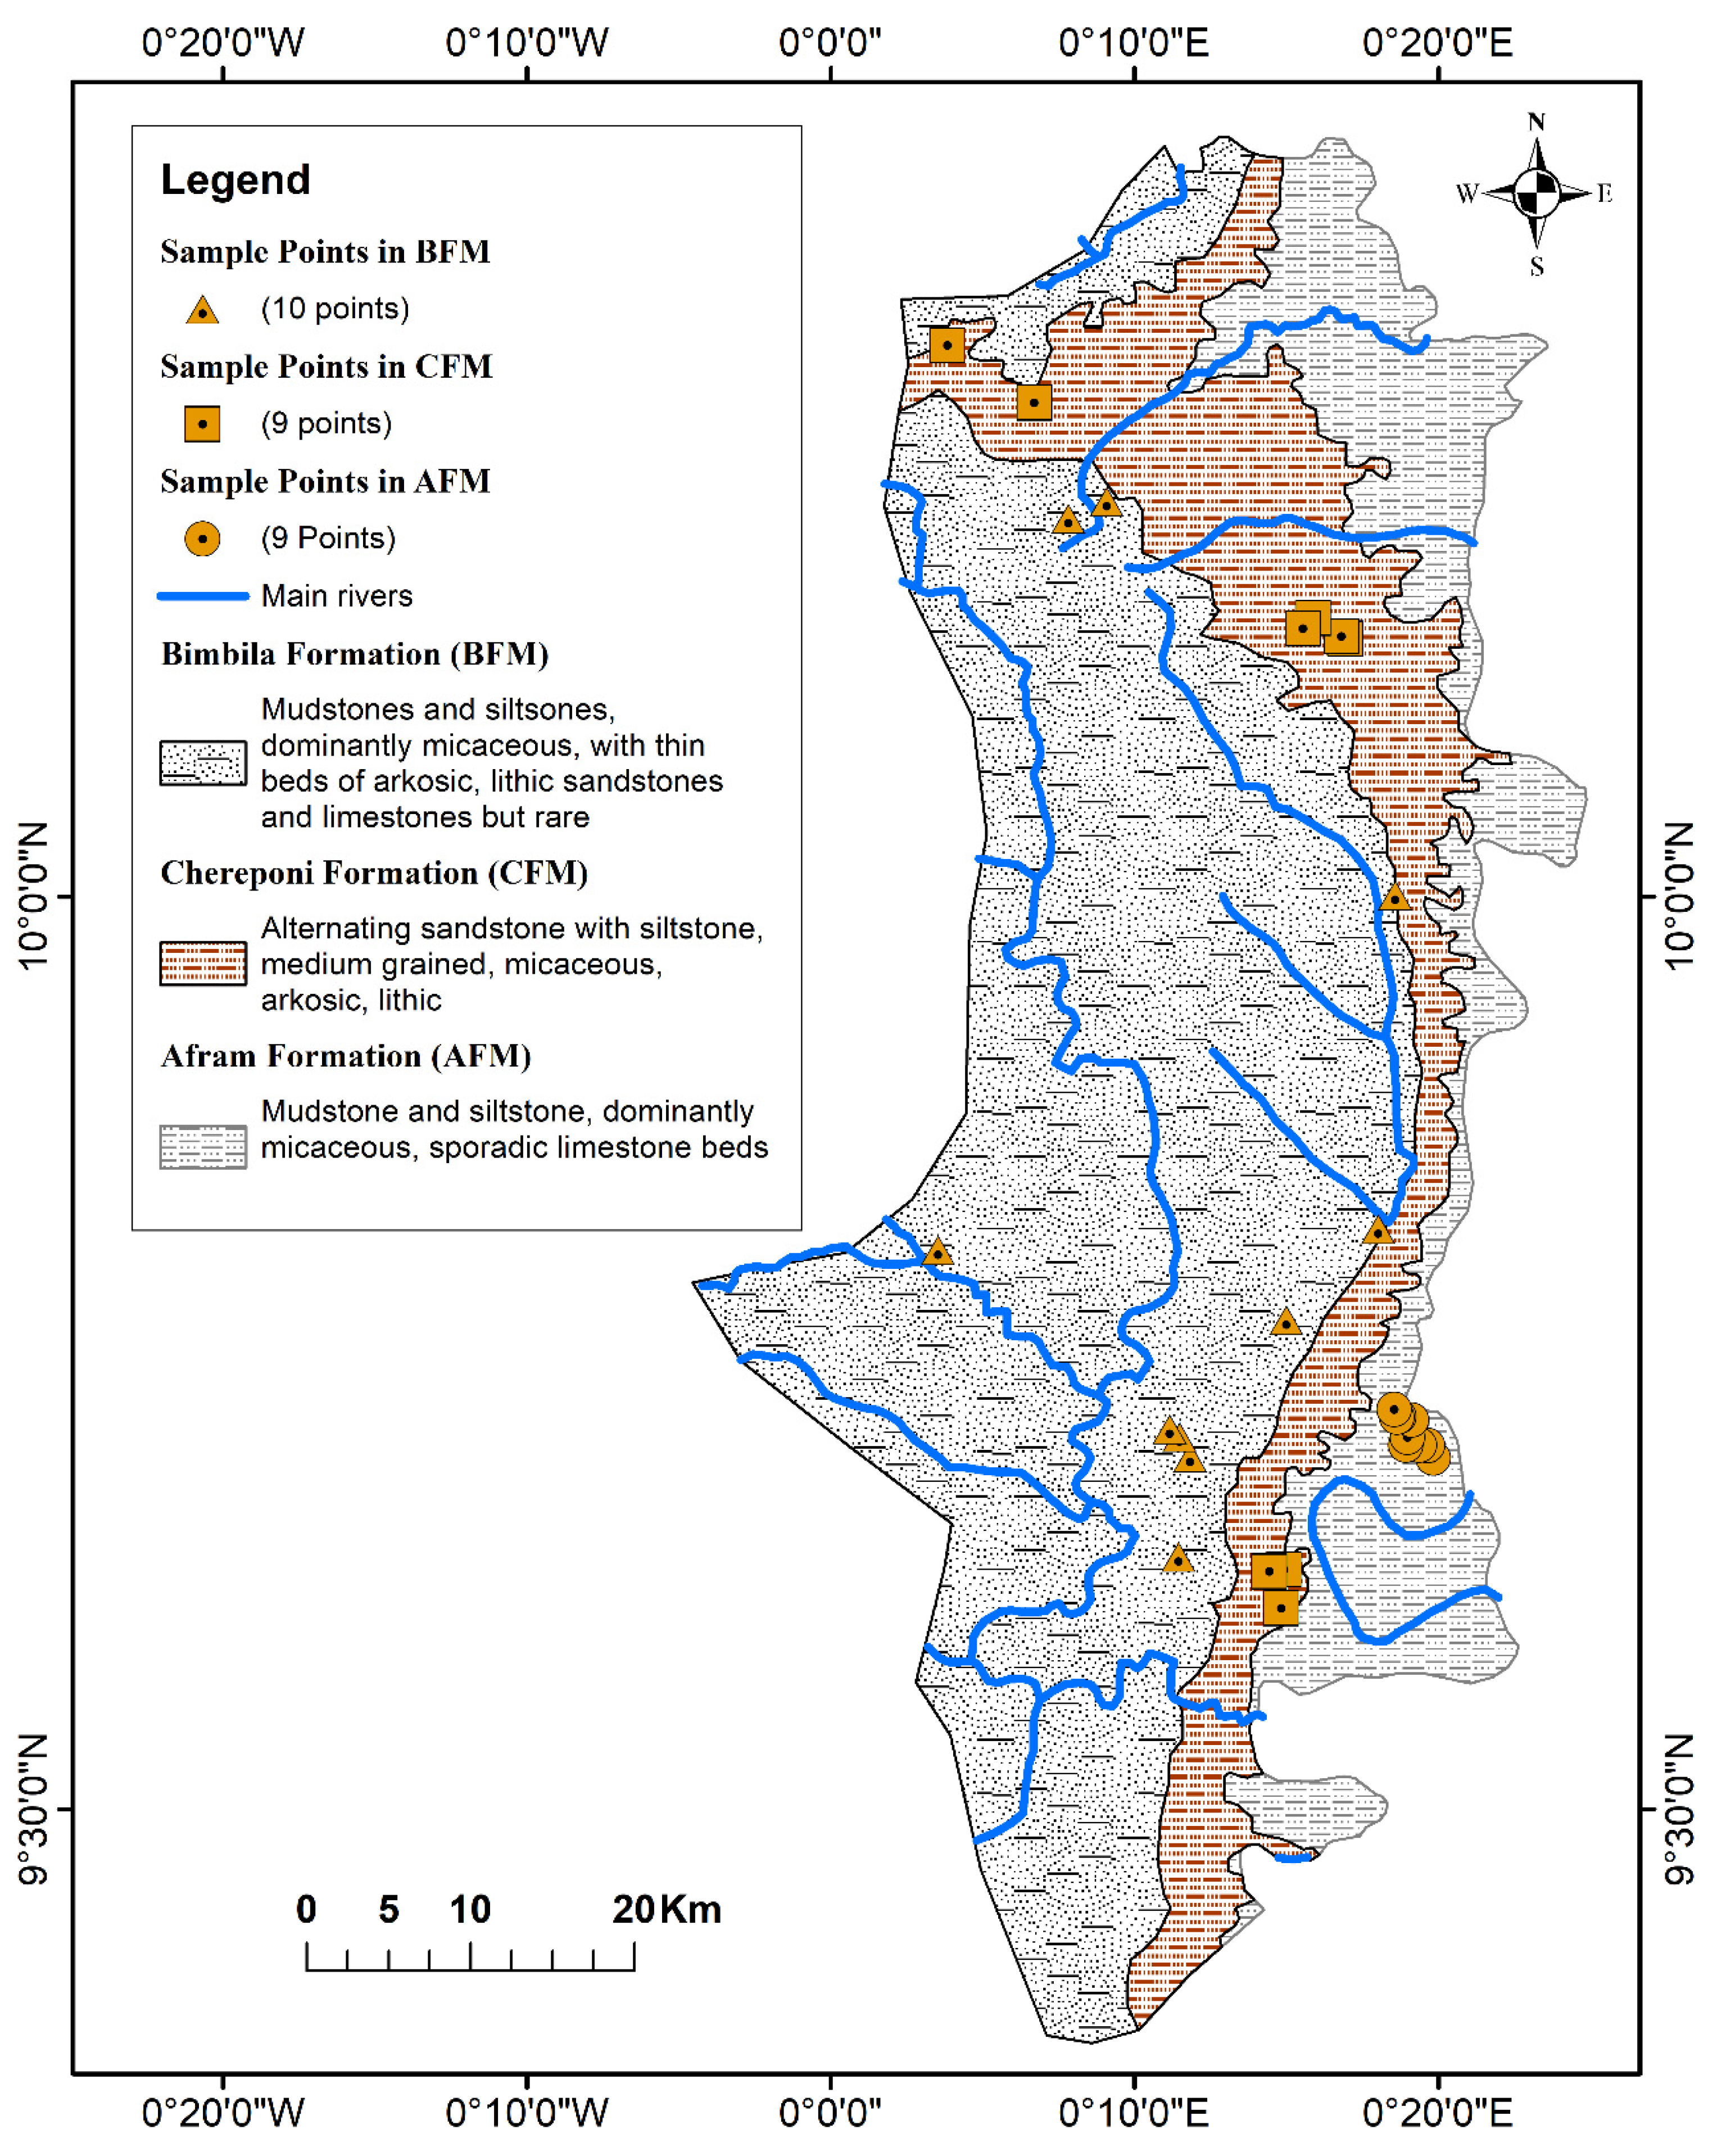
The local geology indicates that, the study area is underlain by rocks of the Oti-Pendjari Group of the Voltaian Super Group. The Oti-Pendjari Group is mainly well consolidated and closely compacted basal sandstone. It also includes shales and tillite-dolomite limestone. The Oti-Pendjari group constitutes the following rock formations: the Bunya sandstone (which is dominantly feldspathic sandstone), Chereponi sandstone (consists of alternating sandstones and stiltstones) members, and the Bimbila and Afram formations (these are dominantly micaceous mudstones and siltstones with rare limestones and sandstones) [23]. However, the entire study area is underlain by the Bimbila, Chereponi, and the Afram formations which trend north–south (Figure 2). The main rock types underlying the study area are thus mudstones, sandstones, and siltstones.
Hydrogeologically, the Voltaian Supergroup is characterized mainly by little or no primary porosity. Groundwater occurrences are thus, associated with the existence of secondary porosities caused by fracturing, faulting, jointing and weathering [25]. The study area is part of the White Volta River Basin. Two distinct types of aquifers have been identified in the White Volta River Basin as a result: the weathered zone aquifers and the fractured zone aquifers [25]. The weathered zone aquifers occur at the base of the thick weathered layer and are either semi-confined to confined aquifers depending on the degree of permeability of the upper weathered layer. The fractured zone aquifers are more localized in nature. Thus, groundwater occurrence is structurally controlled with borehole yields determined by the extent and degree of fracturing. The success rate for drilling boreholes within the Oti-Pendjari Group is about 56% with yields ranging between 0.41 m3/h and 9 m3/h and a mean yield of about 6.2 m3/h [25]. Recharge to the aquifer systems is generally by direct infiltration of precipitation while some amount of recharge may also occur through seepage from ephemeral streams channels during rainy seasons [26]. The recharge rate computed in the Voltaian ranges between 2.07 × 10⁻⁵ m/day and 2.85 × 10⁻⁴ m/day which is about 0.3% to 4.1% of the annual precipitation in the area. Water quality issues in the various rock units within the Oti-Pendjari group indicate that groundwater from the sandstone units is often less mineralized as compared to groundwater from the mudstone and siltsone units. However, as reported by Obuobie et al. [23], there is evidence that fluoride is more common in the sandstone units than in the mudstones or the siltstones.

2.3. Data Acquisition

The hydrochemical data were acquired from Community Water and Sanitation Agency (CWSA), Soboba, of the erstwhile Saboba-Chereponi District of Ghana. The dataset was generated from groundwater samples that were collected from 28 drilled boreholes at different locations in the study area (Table A1). The distribution of boreholes in each geologic unit of the study area indicates: Ten boreholes (36% of total boreholes) in the Bimbila formation, nine boreholes (32% of total boreholes) in Chereponi sandstones and nine boreholes (32% of total boreholes) in the Afram formation as shown in Figure 2 above. Observations during data acquisition suggest that, two sets of samples were collected from each borehole in low-density polyethylene bottles: one set for major cations analysis and the other set for major anions analysis. It was also observed that, standard protocols as contained in the American Public Health Association (APHA) [27] and the United States Salinity Laboratory (USSL), RiverSide, United States [28], were observed during the groundwater sampling and analysis.

2.4. Data Processing and Analyses

From the hydrochemical data acquired, a total of thirteen physico-chemical parameters comprising pH, electrical conductivity (EC), total hardness (TH), calcium (Ca2+), magnesium (Mg2+), sodium (Na+), potassium (K+), bicarbonate (HCO3), sulphate (SO42−), chloride (Cl), nitrate (NO3), phosphate (PO43−), and fluoride (F) were considered for the assessment of groundwater quality in the area. Electrical conductivity (EC) and potential for hydrogen ions (pH) were the only in-situ measured parameters using Hach HQ40d. Total hardness (TH) was estimated from calcium and magnesium concentrations. Information gathered on the hydrochemical data acquired suggests that, analyses of the various parameters were carried out using the standard methods for water analyses as suggested by APHA [27]. The results were then used to characterize the groundwater by comparing values of the physico-chemical parameters with their respective World Health Organization (WHO) [13] standards.
There are several groundwater quality assessment methods available in the literature [8,29,30,31,32,33,34,35,36]. These methods are dependent on the physico-chemical parameters and are used in various ways to assess the quality of groundwater for drinking purpose. Many studies have adopted the Water Quality Index (WQI) method and successfully assessed the suitability of water for drinking purpose [37,38]. This current study adopted same, using the weighted arithmetic index approach [39] in conjunction with other conventional graphical methods such as the Piper, Durov, and Stiff diagrams in characterizing the chemistry of groundwater in the study area. The WHO [13] guidelines for drinking water were used as a yardstick for the computation of WQIs. Computation of the WQI to assess the suitability of groundwater for drinking purposes is a four-step approach:
The first step involves assigning weight (wi) to each of the twelve parameters considered (pH, TH, Ca2+, Mg2+, Na+, K+, HCO3, SO42−, Cl, NO3, PO43−, F) for the computation of WQI based on their relative importance to the overall quality of groundwater. Parameters, such as pH, NO3, and F, were assigned a maximum weight of 5 due to their significant role in water quality assessment, while weights between 1 and 5 were assigned to the remaining parameters on the basis of their relative significant role in the water quality assessment.
Step 2 involves the computation of the relative weight (Wi) of each parameter (Equation (1))
W i = w i i = 1 n w i  
where Wi is the relative weight, wi is the weight of each parameter and n is the number of parameters.
The third step is based on computation of the quality rating scale (qi) for each parameter (Equation (2)).
q i = C i S i × 100  
where qi is the quality rating, Ci is the concentration of each parameter in mg/L, and Si is the WHO [13] standard for each parameter in mg/L.
The fourth step is the determination of the sub-index (SI) for each parameter. This is then used to calculate the WQI (Equation (3)).
SI = W i × q i  
The overall WQI was then computed by summing up all the sub-index values for each sample as per the following equation:
WQI = i = 1 n SI  
The computed WQIs were then classified using Sahu and Sikdar [40] classification model (Table 1). For the other assessment indices mentioned earlier, the trilinear Piper diagram [41] is used in most cases to display groundwater chemical association and water type. The Durov [42] diagram is another popular graphical representation of hydrochemical data for classifying natural waters and for the identification of their composition. It has additional advantage as compared to the Piper diagram due to its ability to further reveal the hydrochemical processes that affect the groundwater as asserted by Lloyd and Heathcoat [43]. With the use of Stiff diagram, a distinctive shape is defined for waters of similar quality. Therefore, the data obtained from the analysis of the hydrochemical data were processed and interpreted using WQI, Piper, Durov, and Stiff plots to characterize groundwater chemistry in the study area.
The quality of groundwater for irrigation purposes was determined using several assessment indices. These include the United States Salinity Laboratory (USSL) [28] diagram and the Wilcox [44] diagram together with EC values and other agricultural indices estimation methods such as SAR, TH, MR and %Na. Table 2 contains the estimation methods adopted in this study for the computation of irrigation water suitability. These indices are considered an effective approach to assess the suitability of water for irrigation purposes [34]. The corresponding classification of water types according to the USSL [28] is presented in Table 3.

3. Results and Discussion

3.1. Hydrochemical Characterization

A summary of basic statistical analysis of the various hydrochemical parameters for the three distinct geologic units of the study area is presented in Table 4. Table 4 also includes contributions of these units to the levels of hydrochemical parameters together with the WHO [13] guidelines for comparative studies. Discussions of the characterization of the hydrochemical parameters are based on the categorization of samples with respect to the existing geological units.
For the determination of suitability of water for various purposes, pH plays a very significant role. The pH values in the samples from the various units range from 6.91 to 7.80, 6.83 to 7.25, and 6.83 to 7.81 for the Afram formation (AFM), Bimbila formation (BFM), and Chereponi formation (CFM) respectively. The respective mean values are 7.17, 7.05 and 7.01 (Table 4). All the samples from the three regions have pH values falling within the acceptable WHO [13] guidelines for drinking water and domestic purposes. It therefore suggests that, out of the 28 boreholes for the entire study area, contributions to the pH levels from the various geologic units are: Nine (n = 9) from AFM, ten (n = 10) from BFM and nine (n = 9) from CFM. The pH values are almost homogenous in the entire study area suggesting similar geochemical processes. However, nearly all the samples from the CFM (7 samples) are slightly acidic and majority from AFM (7 samples) and BFM (7 samples) are slightly alkaline. Generally, the pH in the entire area can be characterized as slightly acidic to slightly alkaline.
The EC of water is indicative of the water’s purity. The purer the water, the lower the EC, as exemplified by distilled water which is almost an insulator due to very low EC, but seawater is a very efficient electrical conductor. In this study, the EC values are in the range of 576–1456 μS/cm for AFM, 863–1398 μS/cm for BFM, and 746–2180 μS/cm for CFM (Table 4). All the samples from the three units have EC values within the WHO limits for drinking water with contributions from the various geologic units indicated in Table 4. Groundwater in the area is thus characterized as suitable for drinking in terms of EC levels.
Consumption of hard water is generally safe. It has no known adverse health effect, having health benefits including the fulfilment of dietary needs of essential minerals such as calcium and magnesium [49,50,51]. The total hardness (TH) values in the study area range from 40.7 to 204.89 mg/L for AFM, 55 to 175.84 mg/L for BHF, and 82.03 to 310.3 mg/L for CFM with mean values of 108.7 mg/L, 118.63 mg/L and 159.47 mg/L respectively (Table 4). This range of values in TH is an indication of moderate contents of calcium and magnesium in groundwater of the area since TH is represented by the co-participation of both cations [52]. Majority of the total samples (89%) are within the WHO [13] acceptable limits for drinking water. Out of the 11% of the samples falling outside the WHO limits, 67% and 33% of this number are contributions from CFM and AFM respectively. This indicates that, all the samples from BFM are within the WHO limits. However, the dominance of the higher TH values from CFM could be coming from the sandstones of the Chereponi formation. Generally, the TH can be characterized as good for drinking and domestic purposes.
Calcium is identified as one of the most abundant substances in water. Water described as “hard” contains high levels of dissolved minerals, specifically calcium and magnesium. Even though hard drinking water is not a health hazard, as it generally contributes to human dietary needs of calcium and magnesium, high levels of these substances in water contribute to inefficient and expensive operation of water-using appliances. Calcium and magnesium contents in groundwater of the area studied indicate the following range of values: AFM (7.9 to 47.8 mg/L Calcium and 5.1 to 25.8 mg/L Magnesium), BFM (7.8 to 38.8 mg/L Calcium and 5.3 to 23.8 mg/L Magnesium), and CFM (13 to 102.9 mg/L Calcium and 11.2 to 35.1 mg/L Magnesium). All the water samples have concentrations of calcium and magnesium falling within the WHO acceptable limits. The respective contributions to the contents of calcium and magnesium from the various geologic units are as indicated in Table 4. From Table 4, generally, the calcium concentrations appear to be enriched more than the magnesium concentrations. This may be due to partial dissolution of carbonate minerals in rocks of the study area [53]. These substances are thus characterized as suitable for drinking and domestic uses.
High sodium levels can be associated with the dissolution of soluble salts such as halite, or ion exchange [54]. High intake of sodium has been reported to cause problems of blood pressure and arteriosclerosis, and very low intakes may also cause dehydration and general numbness [55]. The concentrations of sodium in the groundwater samples of the study area show values in the range of 88.2 to 250 mg/L for AFM, 96.2 to 266.7 mg/L for BFM, and 76.7 to 413.8 mg/L for CFM. Though sodium is characterized as good for drinking as majority of the samples (64%) have concentrations of sodium falling within the WHO acceptable limits for drinking water, 36% of the samples have concentration of sodium higher than the acceptable limit. Contribution to the values of sodium outside the WHO limits indicates the AFM recording the highest number of samples (18%) followed by BFM and CFM contributing 11% and 7% respectively.
The values of potassium in water samples from AFM, BFM, and CFM are 1–5.2 mg/L, 0.8–6.3 mg/L, and 1.3–5.4 mg/L respectively (Table 4). All the values are within the acceptable limits for drinking water. This signifies that, contributions from all the geologic formations are within the WHO acceptable limits. The water is said to be good for drinking with respect to potassium levels. Generally, levels of potassium in drinking water are not much of health concerns. Though may cause some health effects in susceptible individuals, intake of potassium from drinking water is mostly well below the level that may cause adverse effect [56].
Bicarbonate is present in all body fluids and organs and plays a very significant role in the acid-base balances in the human body. Groundwater in the study area has bicarbonate values ranging from 251 to 623.6 mg/L for AFM, 401 to 495 mg/L for BFM and 345 to 831 mg/L for CFM with respective mean values of 453.09 mg/L, 455.21 mg/L, and 487.7 mg/L (Table 4). All the samples have values exceeding the WHO threshold value. This implies the water is not suitable for drinking in terms of bicarbonate concentration. The possible sources of bicarbonate could be the presence of organic matter in the aquifer. This is oxidized to produce carbon dioxide which promotes dissolution of minerals [57]. The bicarbonate concentration may also result from the interaction of precipitation with rocks in the area. Atmospheric reaction of precipitation and carbon dioxide forming weak carbonic acid is introduced into the soil system as the precipitated water infiltrates through the weathered material. Carbonic acid contributes to the dissolution of feldspar particularly in the sandstones of the geologic formations resulting in the release of HCO3 into groundwater [53].
Some of the main physiological effects resulting from the consumption of considerable amounts of sulphate include dehydration and gastrointestinal irritation [58]. Sulphate may also be a contributory factor to the corrosion of water distribution systems [59]. The sulphate values in groundwater within the three units (AFM, BFM, and CFM) range from 5.8 to 180.1 mg/L, 4.71 to 190 mg/L, and 7.1 to 62 mg/L respectively. All the samples are within the WHO standard limits for drinking and domestic purposes. Contributions to the concentrations of sulphate from the various geologic units are as indicated below (Table 4). The water is suitable for drinking and domestic purposes in terms of sulphate concentration in groundwater of the study area.
The respective chloride concentration in the three geologic environments: AFM, BFM and CFM range from 4.8 to 226 mg/L, 7.9 to 120 mg/L and 5 to 792 mg/L. Twenty-seven of the total samples are within the WHO limits for drinking water. The lone sample with chloride level beyond the WHO limit might have resulted from the influence of poor insanitary conditions or runoff of chemical fertilizers from farmlands.
On the other hand, nitrate concentration ranges from 0.01 to 23.23 mg/L for AFM, 0.01 to 10.1 mg/L for BFM and 0.01 to 16.86 mg/L for CFM. All the samples have NO3 values within the permissible limit. Generally, nitrates occur in trace contents in surface water but may occur in high levels in groundwater. Groundwater in the area can be characterized as good for drinking in terms of NO3 levels.
Twenty-seven of the total samples (representing 96%) have marginal phosphate levels falling within the range of 0 to 0.008 mg/L with only one sample (4%) having phosphate level of 0.94 mg/L, from the BFM beyond the WHO threshold value (Table 4). The high value could be a local influence of anthropogenic activities such as the use of detergent for washing of clothes and utensils.
Generally, fluoride concentrations in groundwater vary with the type of rock water interacts with during its flow, and usually do not exceed 10 mg/L. Elevated levels of fluoride are associated with dental and skeletal fluorosis with fluoride deficiency leading to dental caries. The fluoride concentrations in the study area range from 0.2 to 2.51 mg/L, 0.2 to 4.2 mg/L, and 0.5 to 4.2 mg/L, respectively, for AFM, BFM, and CFM (Table 4). A majority of the groundwater samples (67.86%) are within the WHO limits for drinking water. The remaining 32.14% of the samples have fluoride values beyond the WHO threshold limit with the BFM contributing the greatest portion (Table 4). It is possible that the fluoride might have been released from the sandstones of the Oti-Pendjari group as evidenced by the fact that fluoride is more common in the sandstone units than in the mudstones or the siltstones [23].

3.2. Hydrochemical Facies

In order to understand and identify the dominant ionic constituents and water types in the aquifer of the study area, the hydrochemical data were subjected to various conventional graphical plots. The idea of plotting data in various diagrams as corroborated by Tadesse et al. [8] is to confirm the effectiveness of the data for drinking and irrigation waters quality assessment.
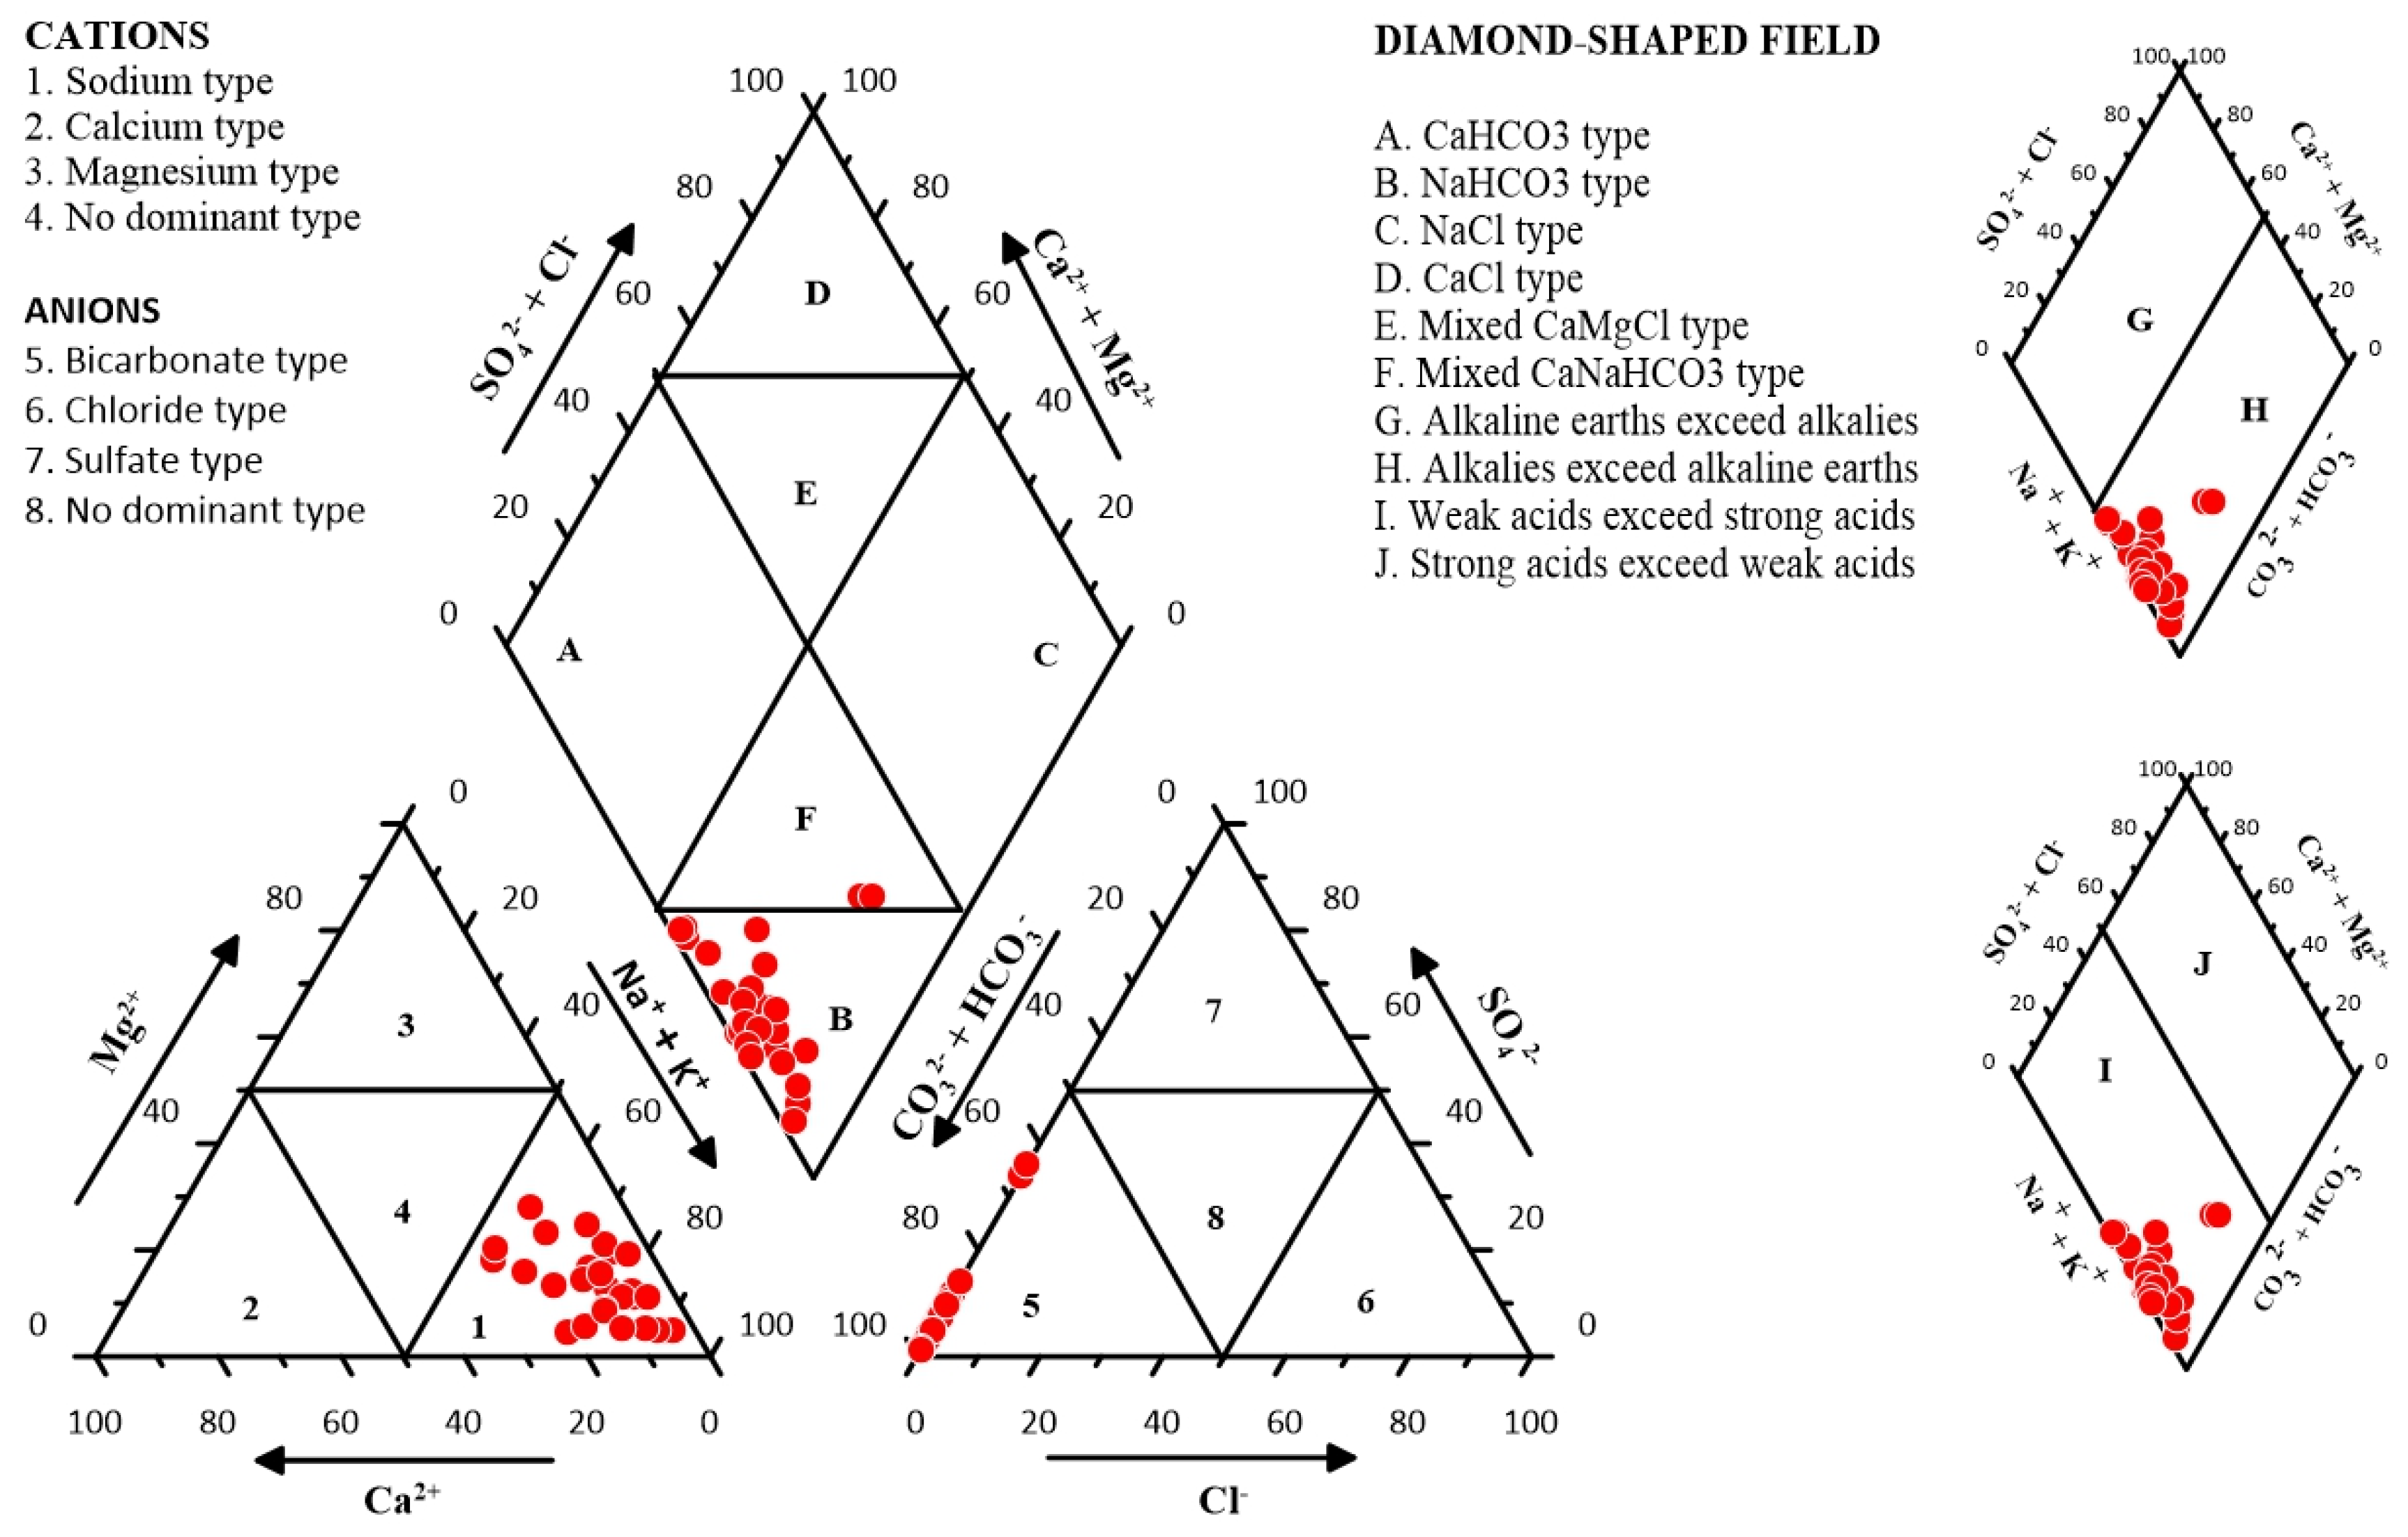
A convenient and widely used method to classify water types on the basis of ionic constituents has been proposed by Piper [41]. By plotting the hydrochemical data on a trilinear diagram, the relative abundance of chemical constituents and water types can be identified. Figure 3 shows all the 28 samples falling in zone 1 indicating sodium dominance for the cations, and bicarbonate dominance in zone 5 for the anions. Two types of water can be identified, Na-HCO3 type with 26 samples falling in Zone B and a mixed Ca-Na-HCO3 type in Zone F with only 2 samples. It can be determined from the graph that alkalies exceed alkaline earths. Na and K are common constituents of minerals such as bentonite, biotite, muscovite and illite which form the bedrock of the area under study. The samples also demonstrate that weak acids exceed strong acids in the groundwater of the study area.
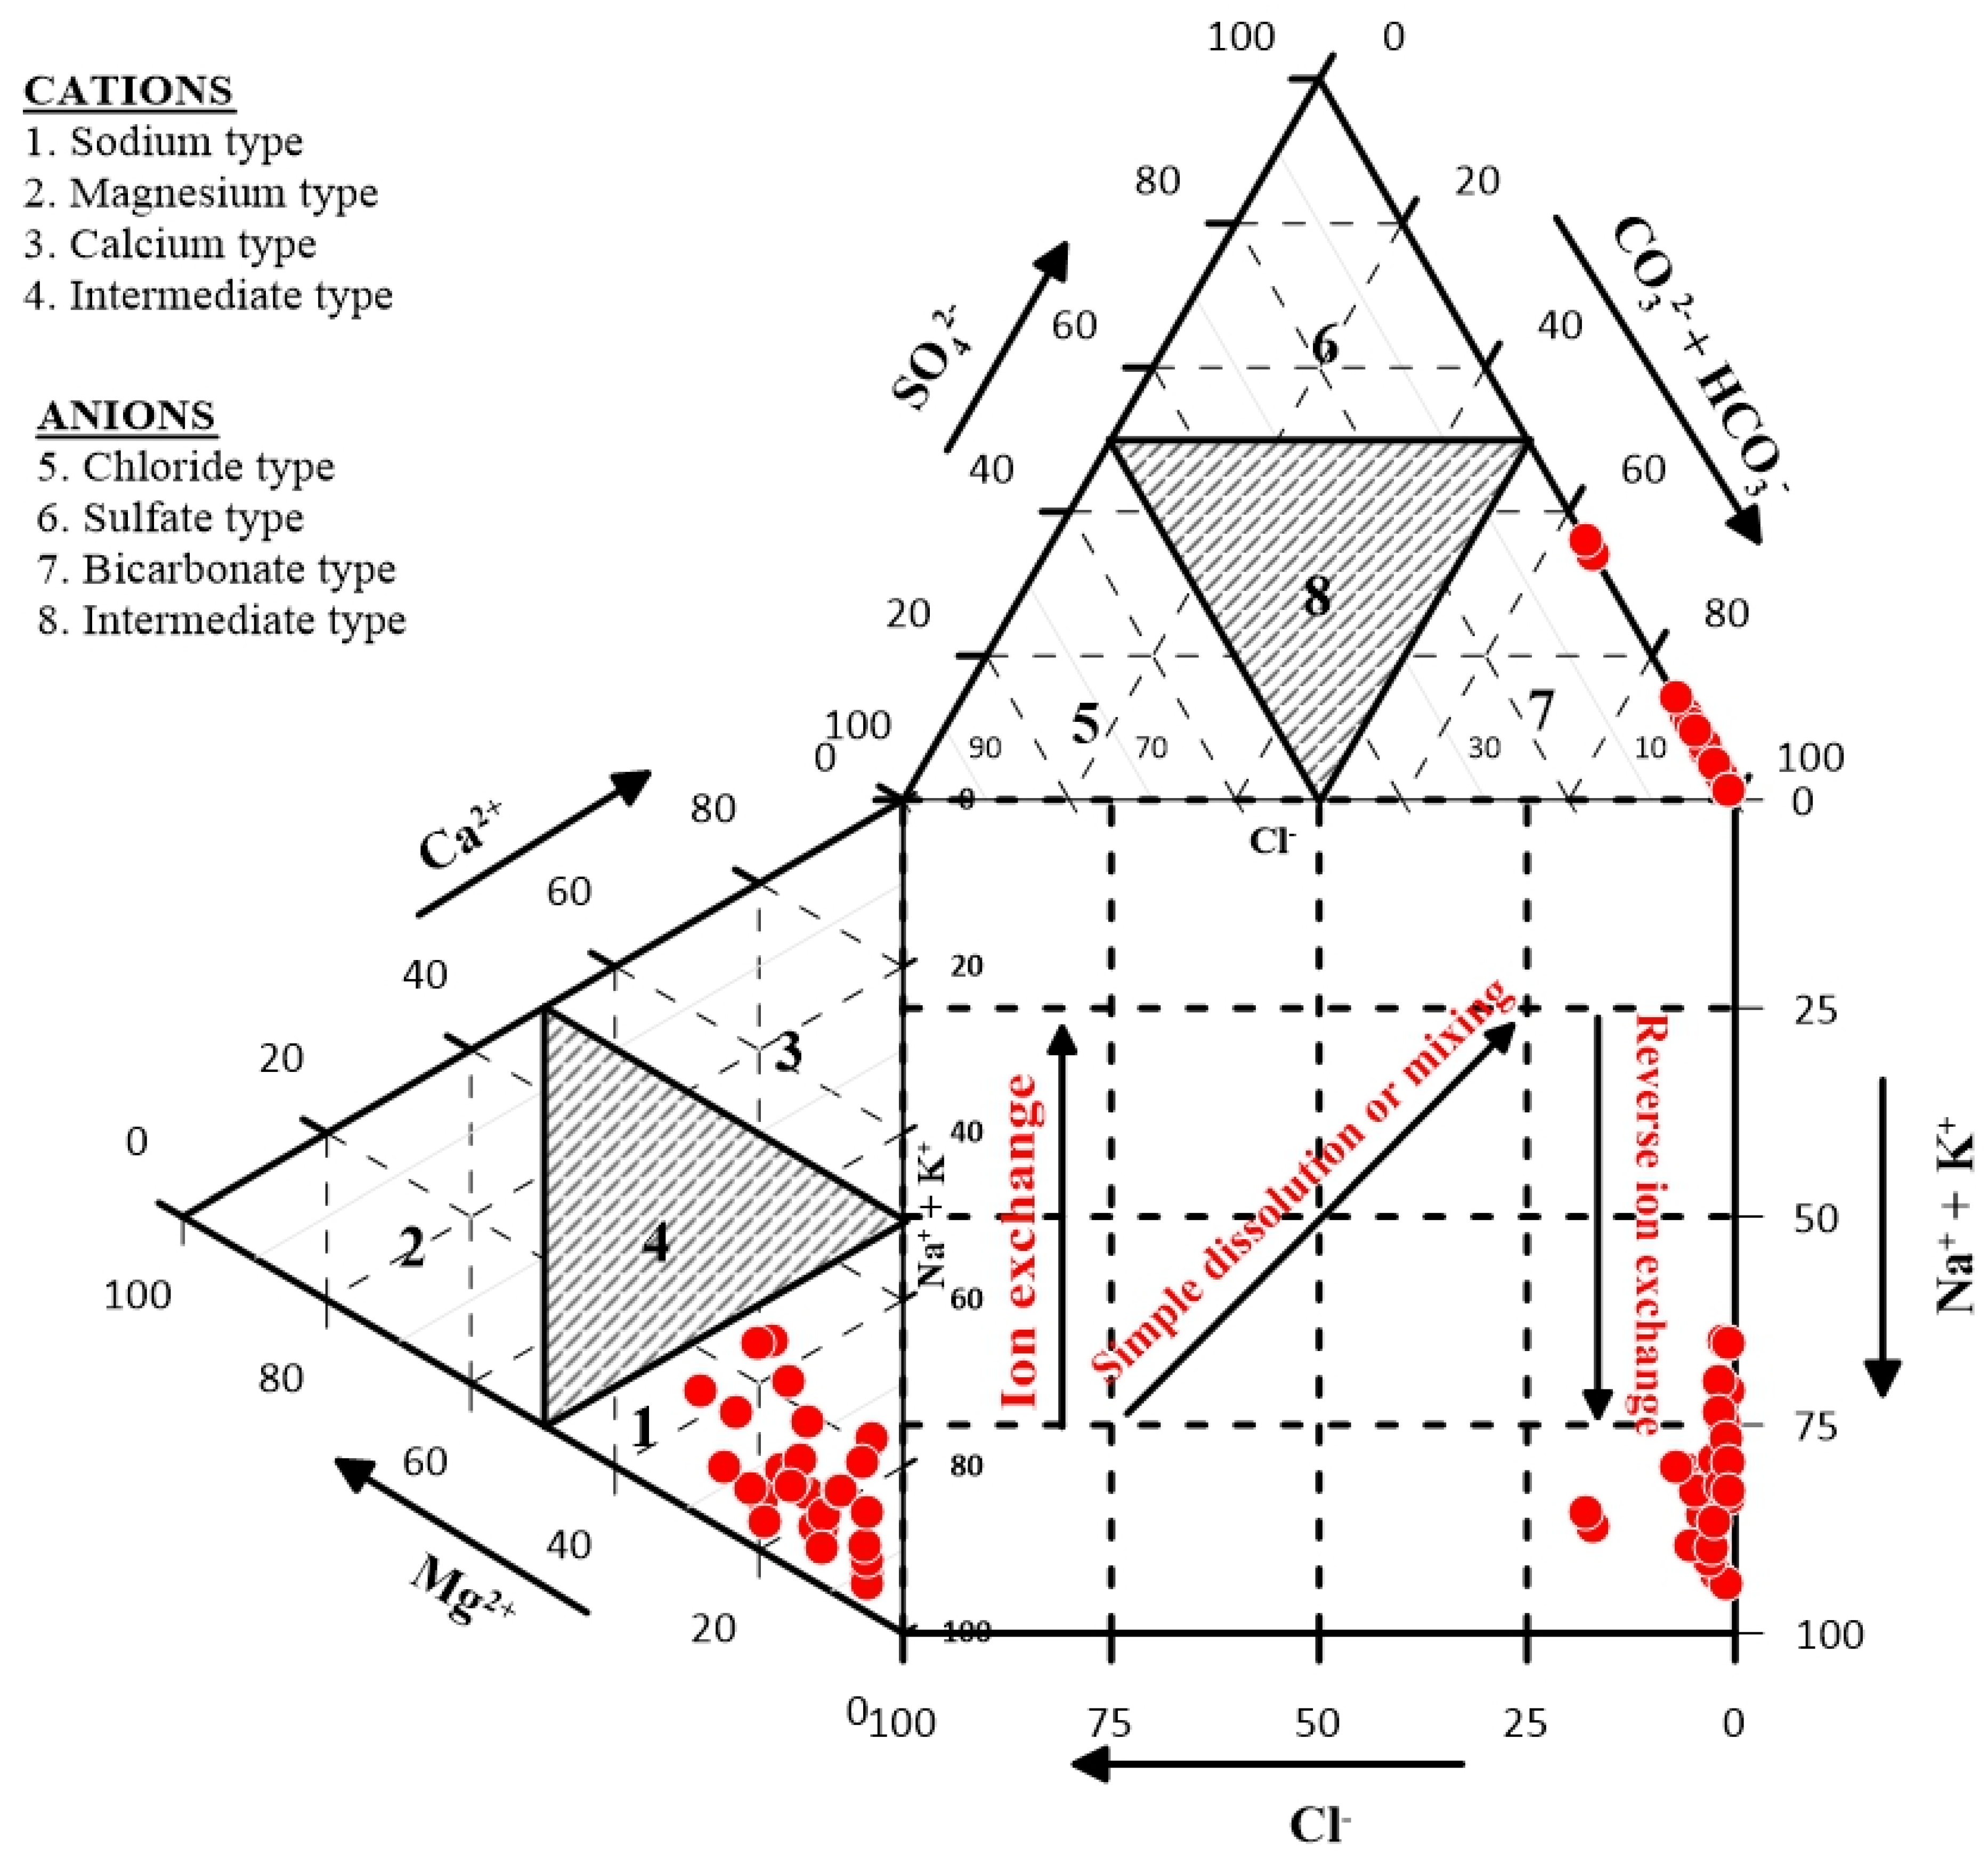
Durov [42] plot showed similar hydrochemical facies as the Piper [41] plot, whereby the cations field shows Na+ + K+ enrichment with HCO3 dominance in the anions field (Figure 4). The plot also suggests reverse ion exchange to be the main hydrochemical processes affecting groundwater chemistry in the study area. This may have been influenced by the dissolution of phyllosilicates such as micas and clay minerals which are common constituents of the geology of the study area (Figure 2), and the subsequent replacement of alkaline earths with the alkalis.
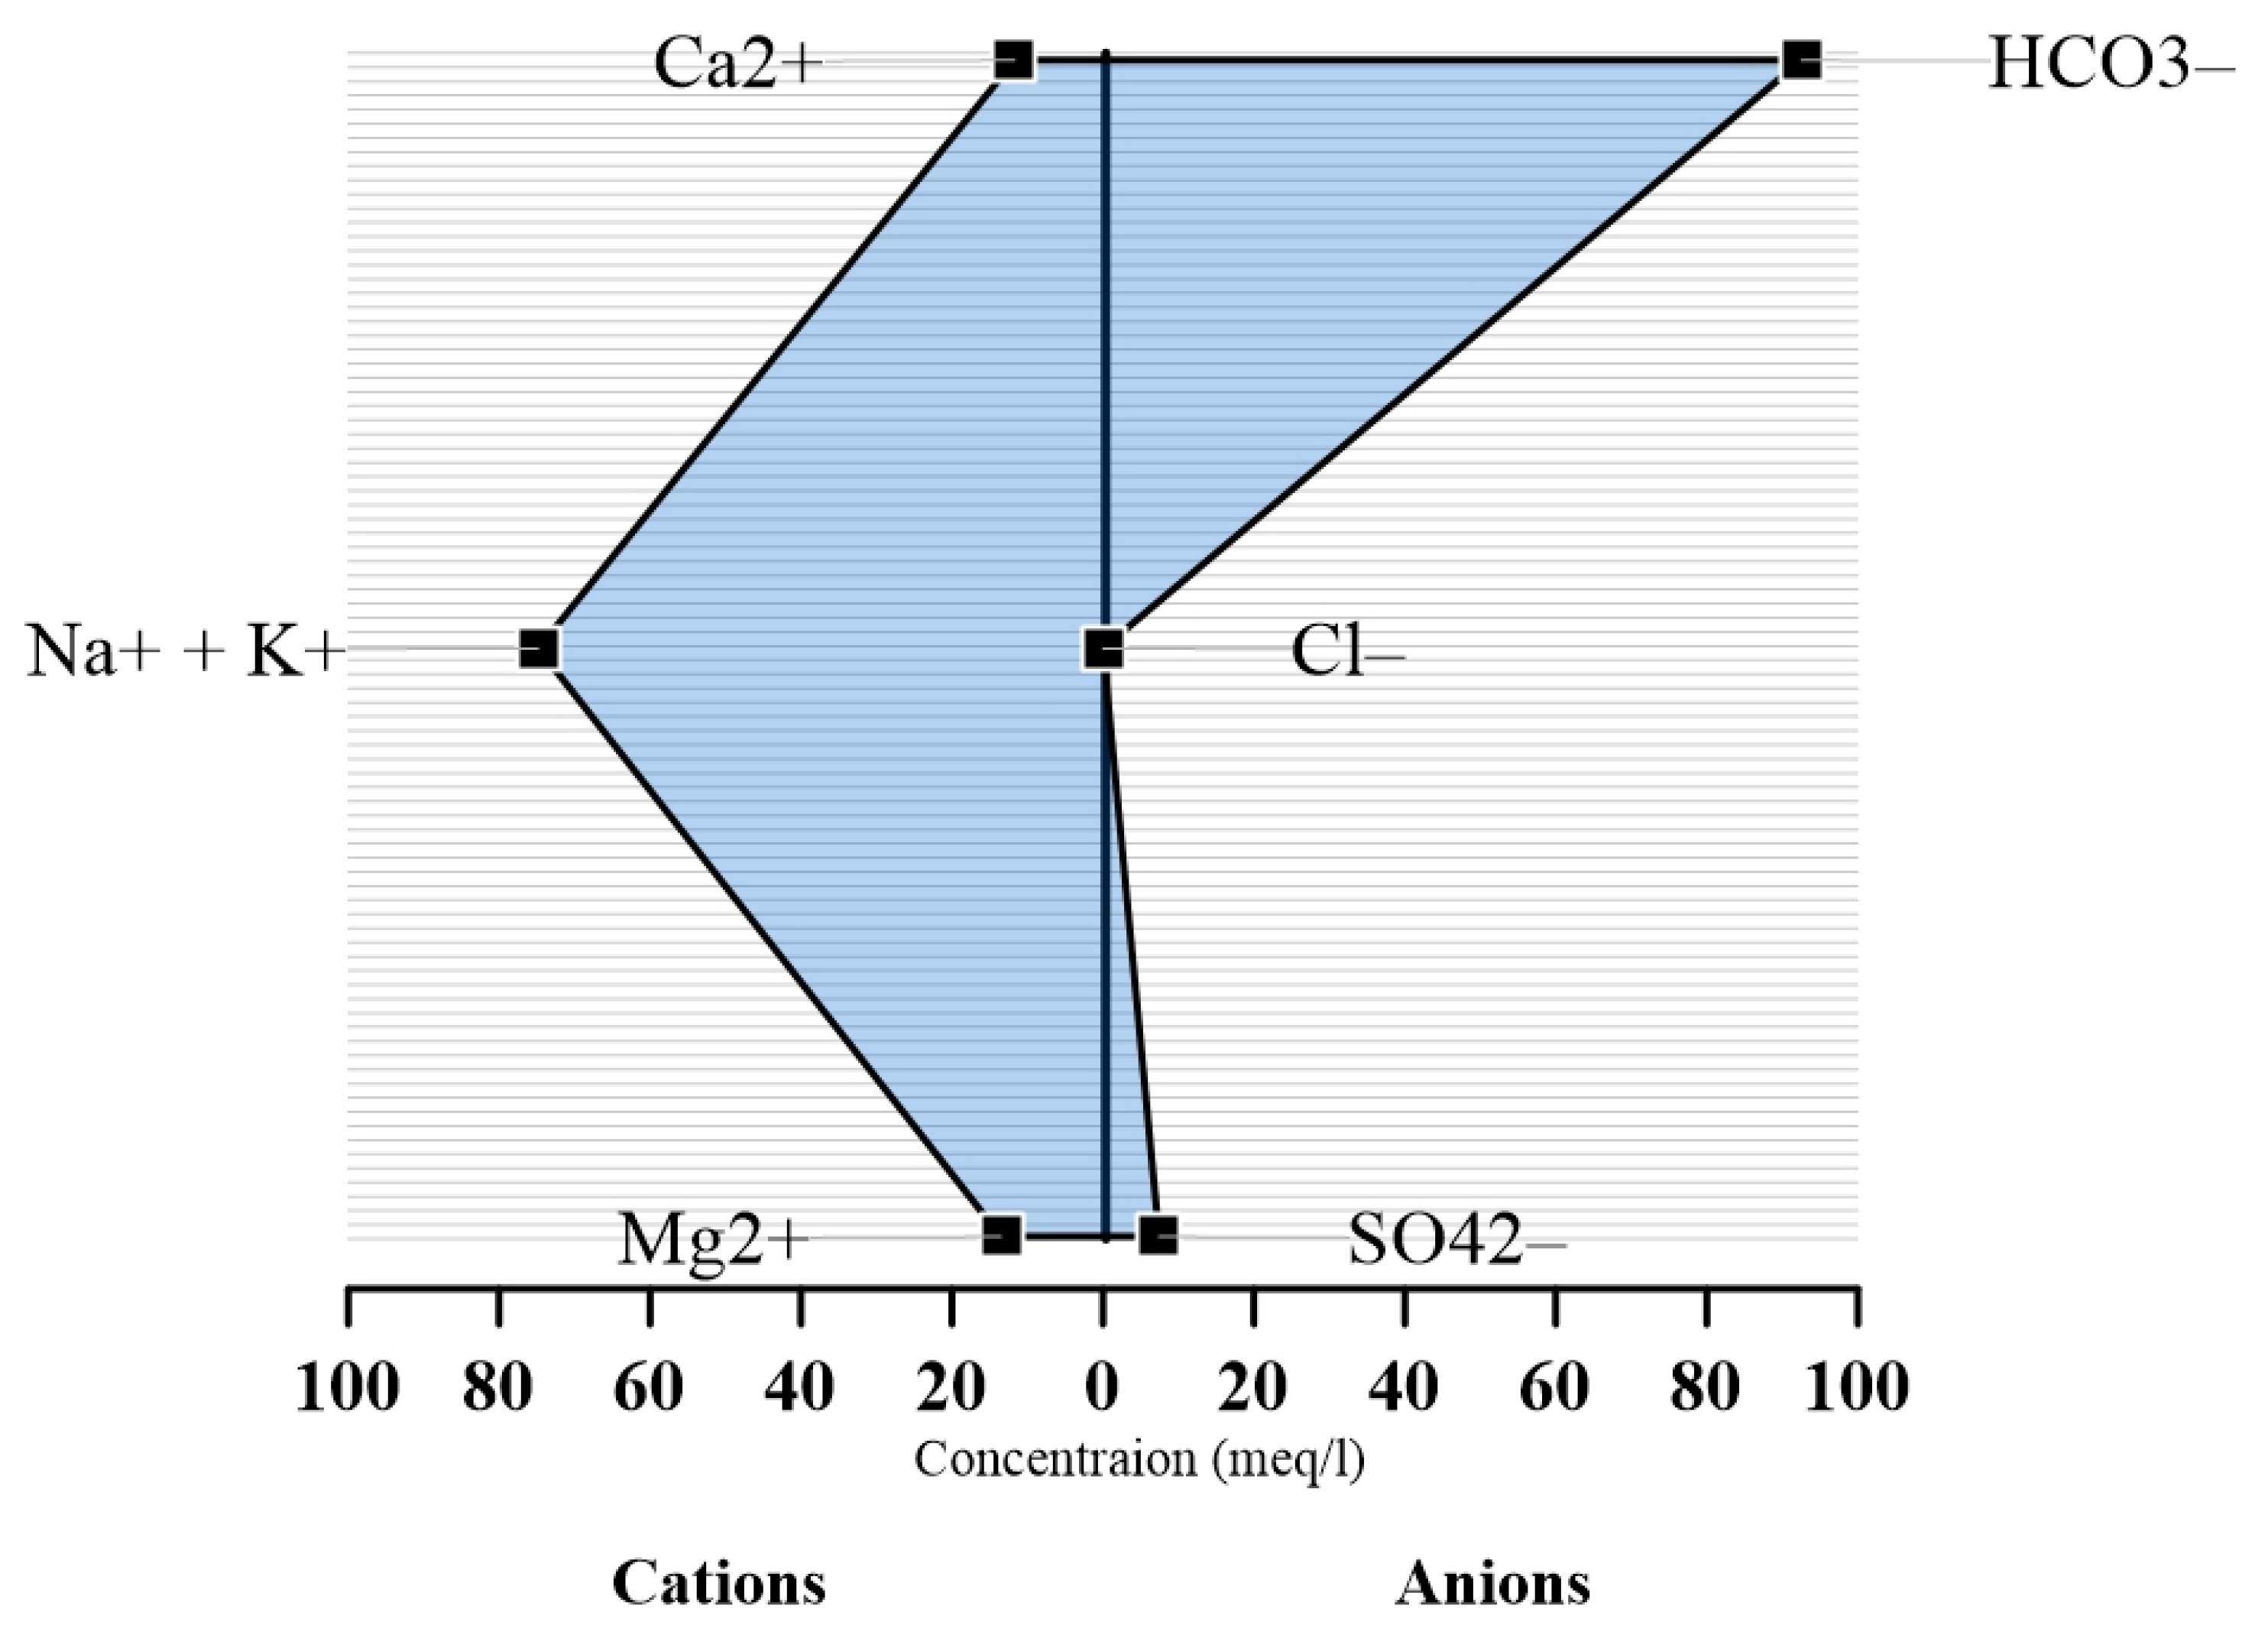
A pattern diagram for representing hydrochemical data using four parallel horizontal axes and one vertical axis was first suggested by Stiff [61]. In this diagram, as described by Singh and Kumar [60], ionic concentrations expressed in meq/L of the major cations (Na+, K+, Ca2+, Mg2+) are plotted to the left of a vertical zero axis and major anions (Cl, SO42−, HCO3, NO3, PO43−) plotted to the right yielding points which when connected, form an irregular polygonal pattern. A distinctive shape is thus defined for waters of similar quality. In this present study, average concentrations of the cations (Ca2+, Na+ + K+, Mg2+) and anions (SO42−, Cl, HCO3) were instead considered for the plot. From the Stiff diagram (Figure 5), the abundance of cations and anions is consistent with the results obtained from both Piper and Durov diagrams which showed sodium and bicarbonate being the dominant cation and anion respectively.

3.3. Assessment of Groundwater Quality for Drinking Purposes

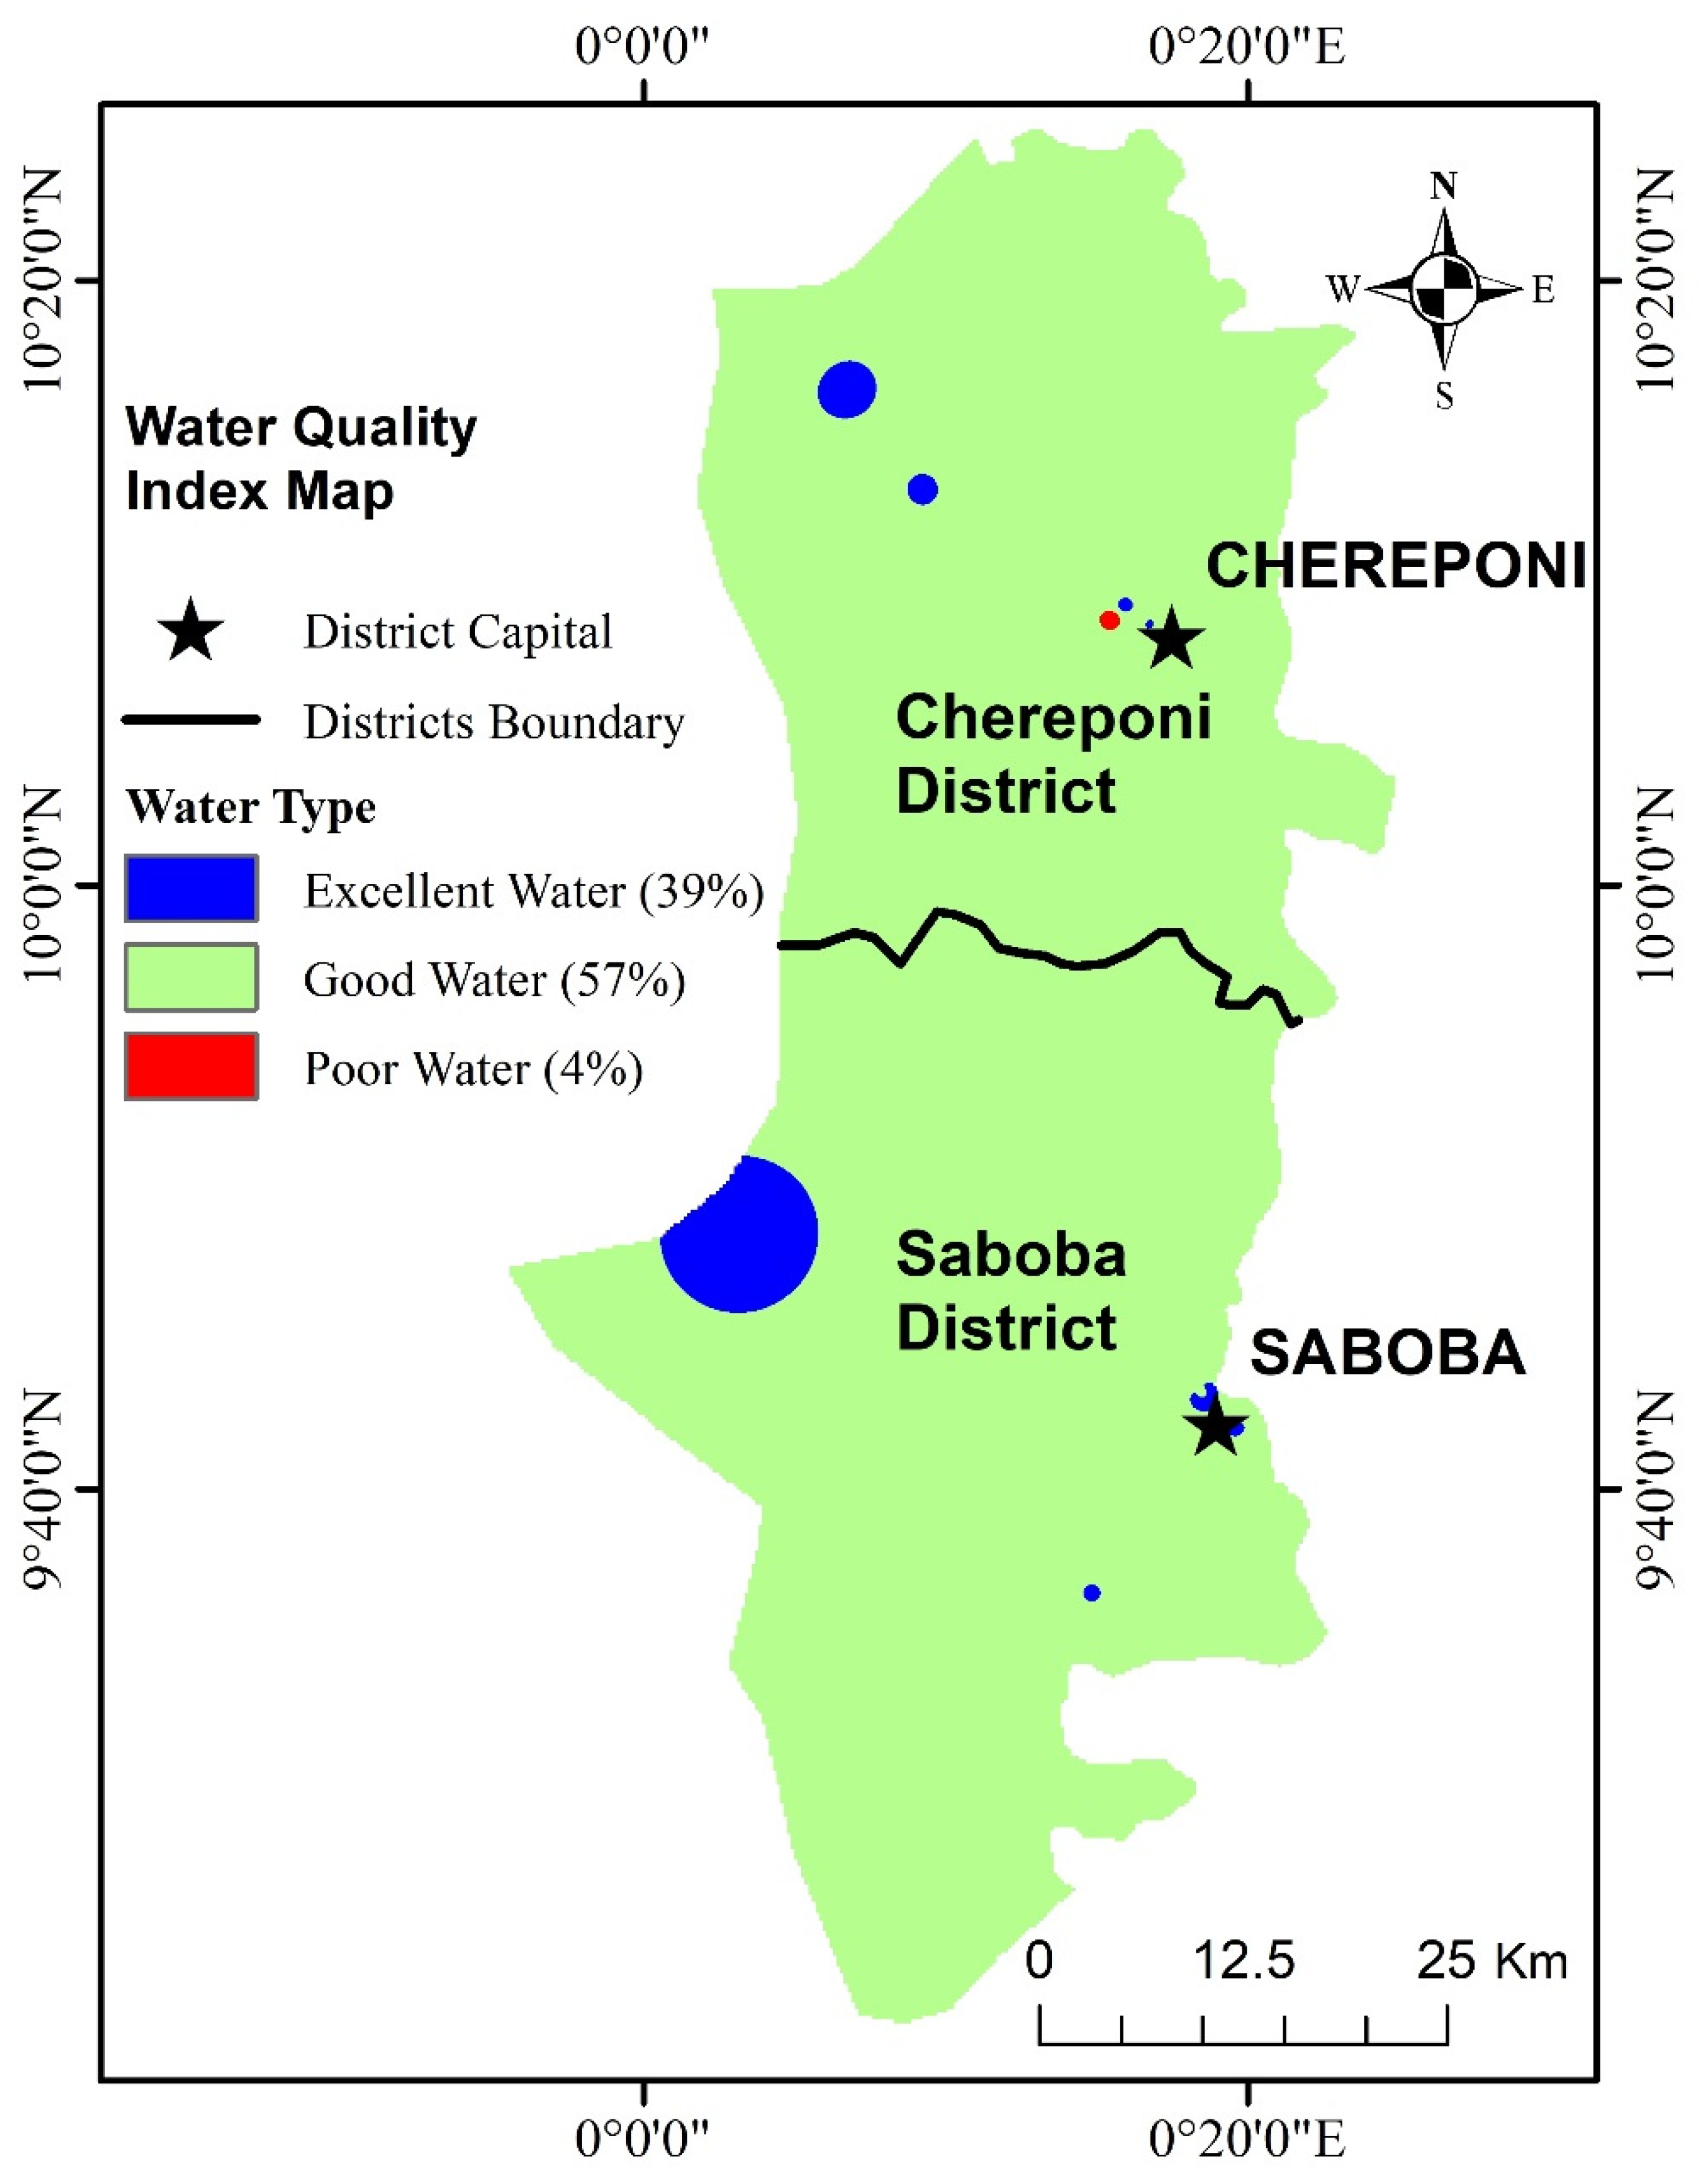
Hydrochemical characterization, as the first step in water quality assessment in this study, identified the concentration of individual parameters and assessed the quality of groundwater by making reference to the WHO guidelines. However, WQI plays an important role in the assessment of the overall quality of groundwater. Because it provides the composite influence of the chemical parameters of groundwater on the overall water quality. Based on the calculated values in Table 5, the WQI for each sample was computed. Using the water classification model by Sahu and Sikdar [40] as present in Table 1, the overall assessment of groundwater for drinking purpose is provided in Table 6. The classification scheme shows that 39% of the samples are within the “excellent water” category, 57% in the “good water” type and 4% considered as “poor water” type. It therefore suggests that, except one sample that is of poor water category, groundwater in the study area is generally suitable for drinking. The composite spatial distribution of water types as represented by the WQI map in Figure 6 suggests that, the entire area is covered by the “good water” type.

3.4. Assessment of Groundwater Quality for Irrigation Purposes

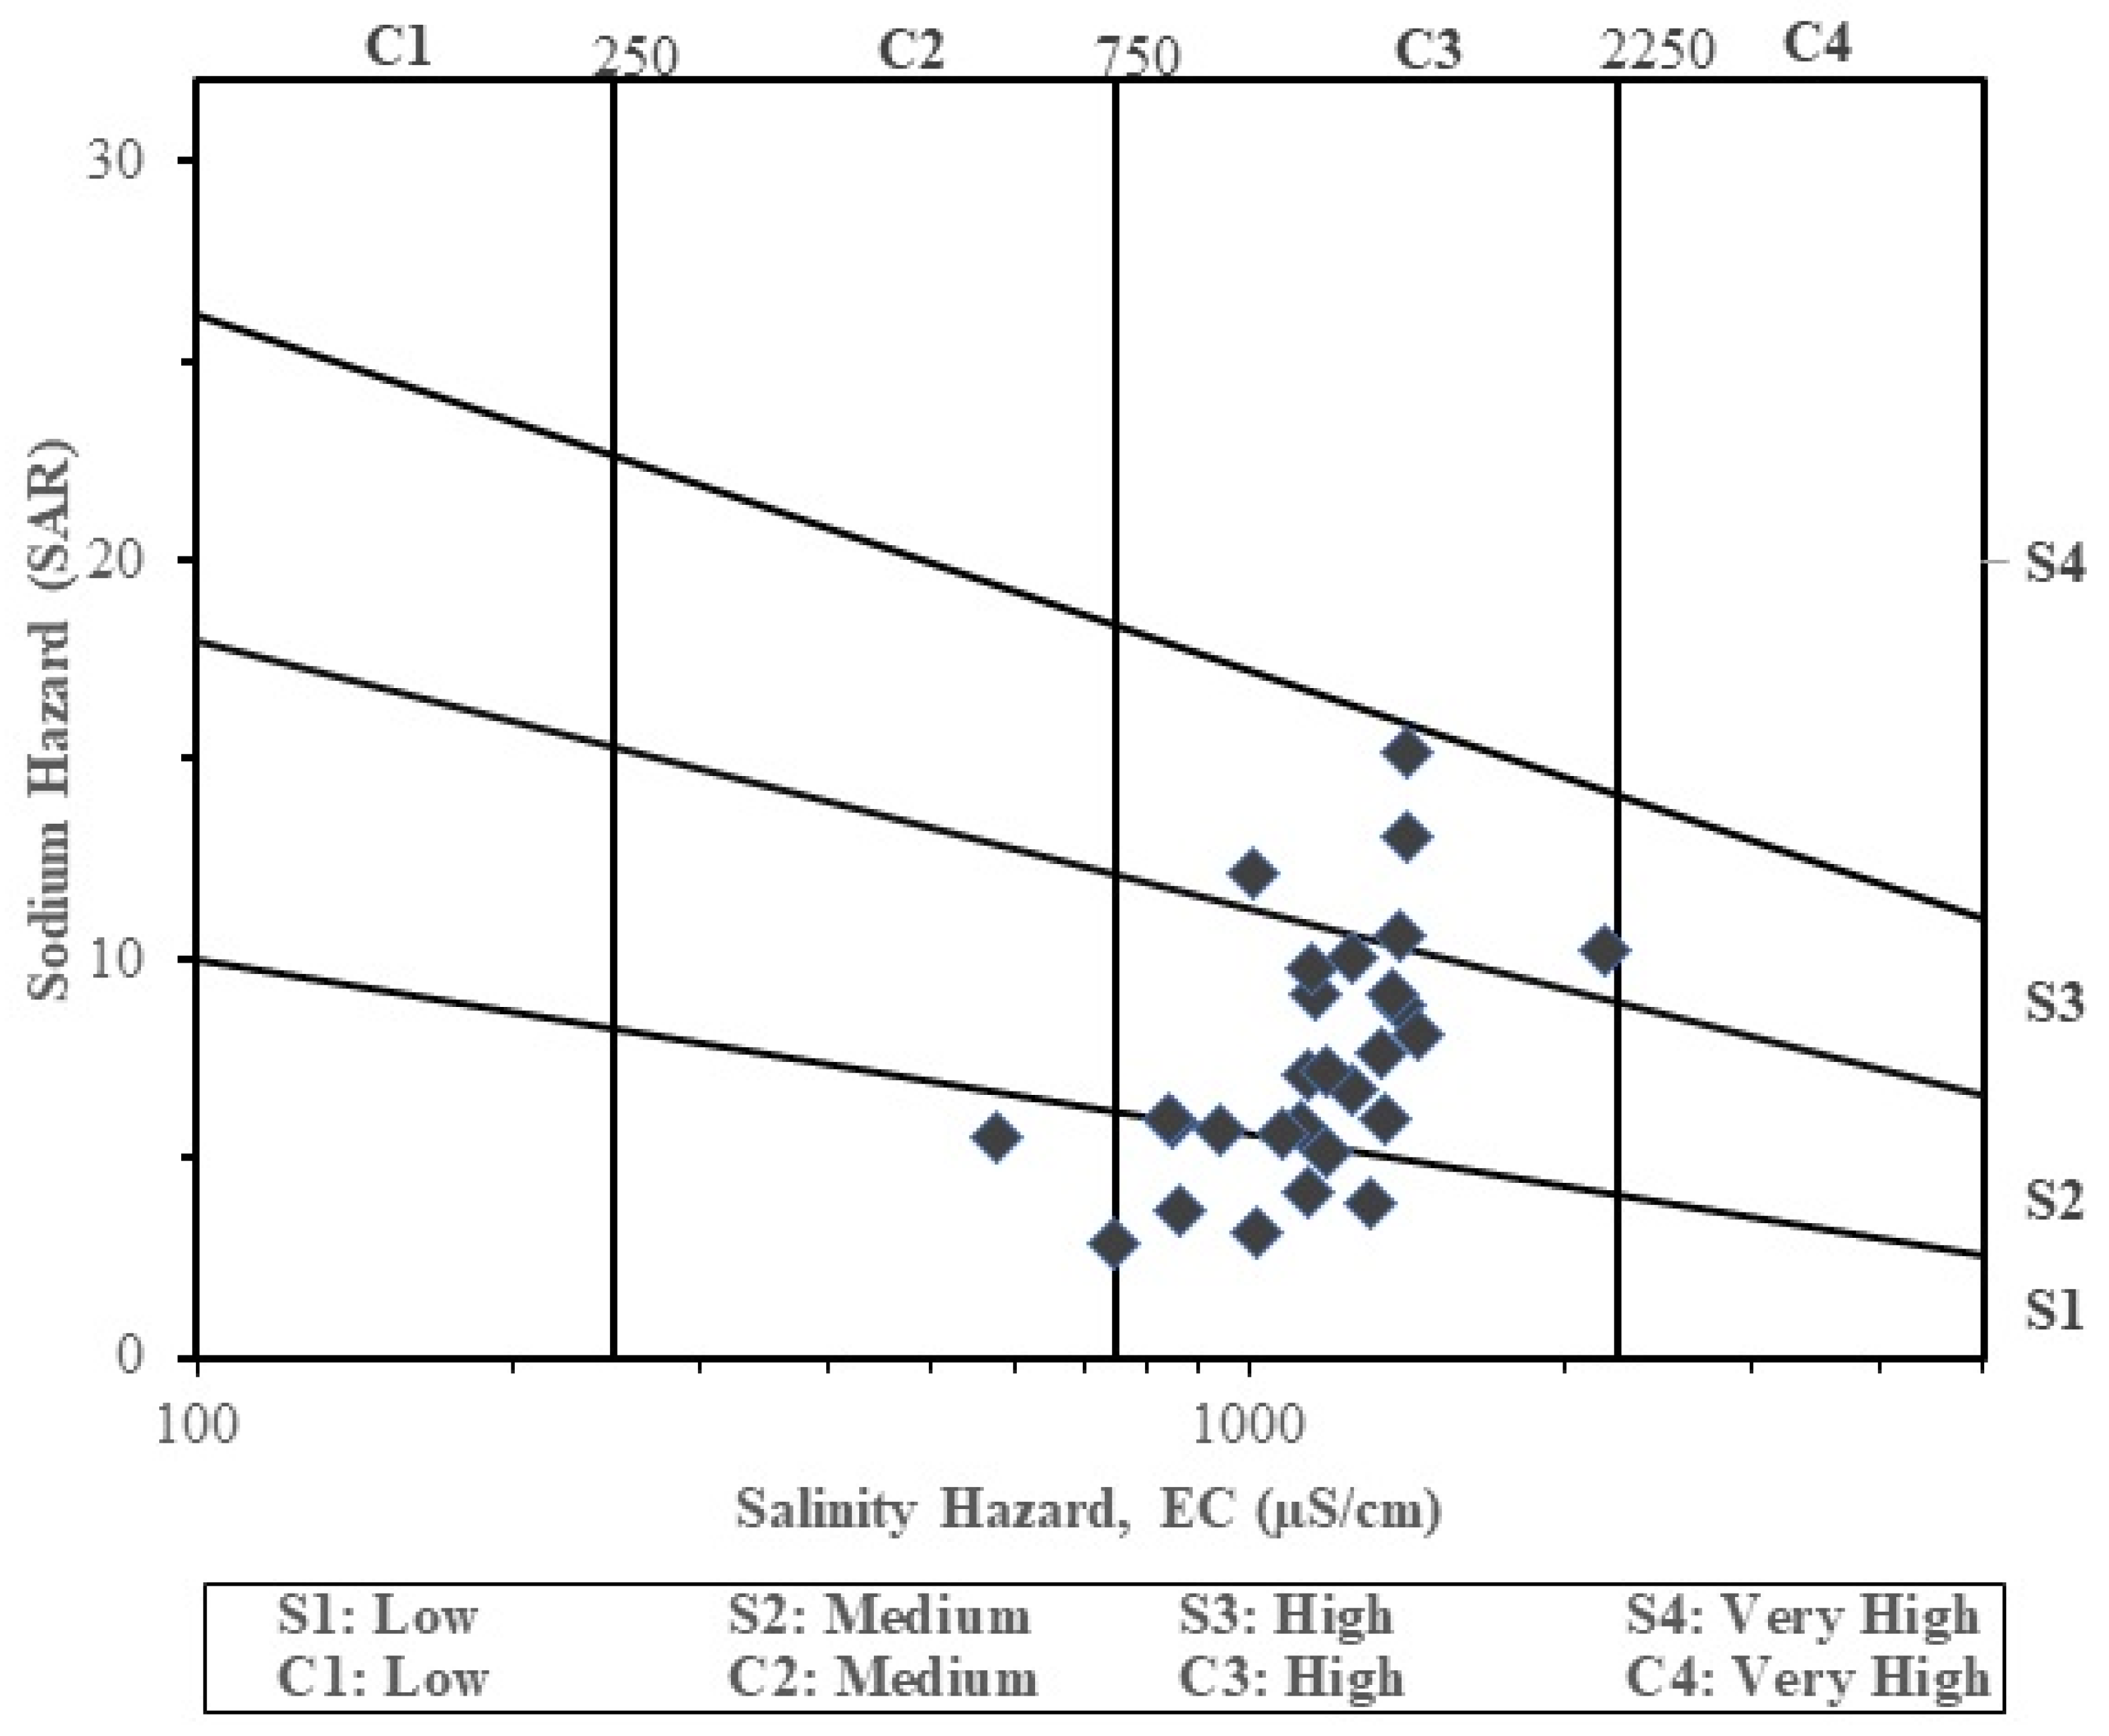
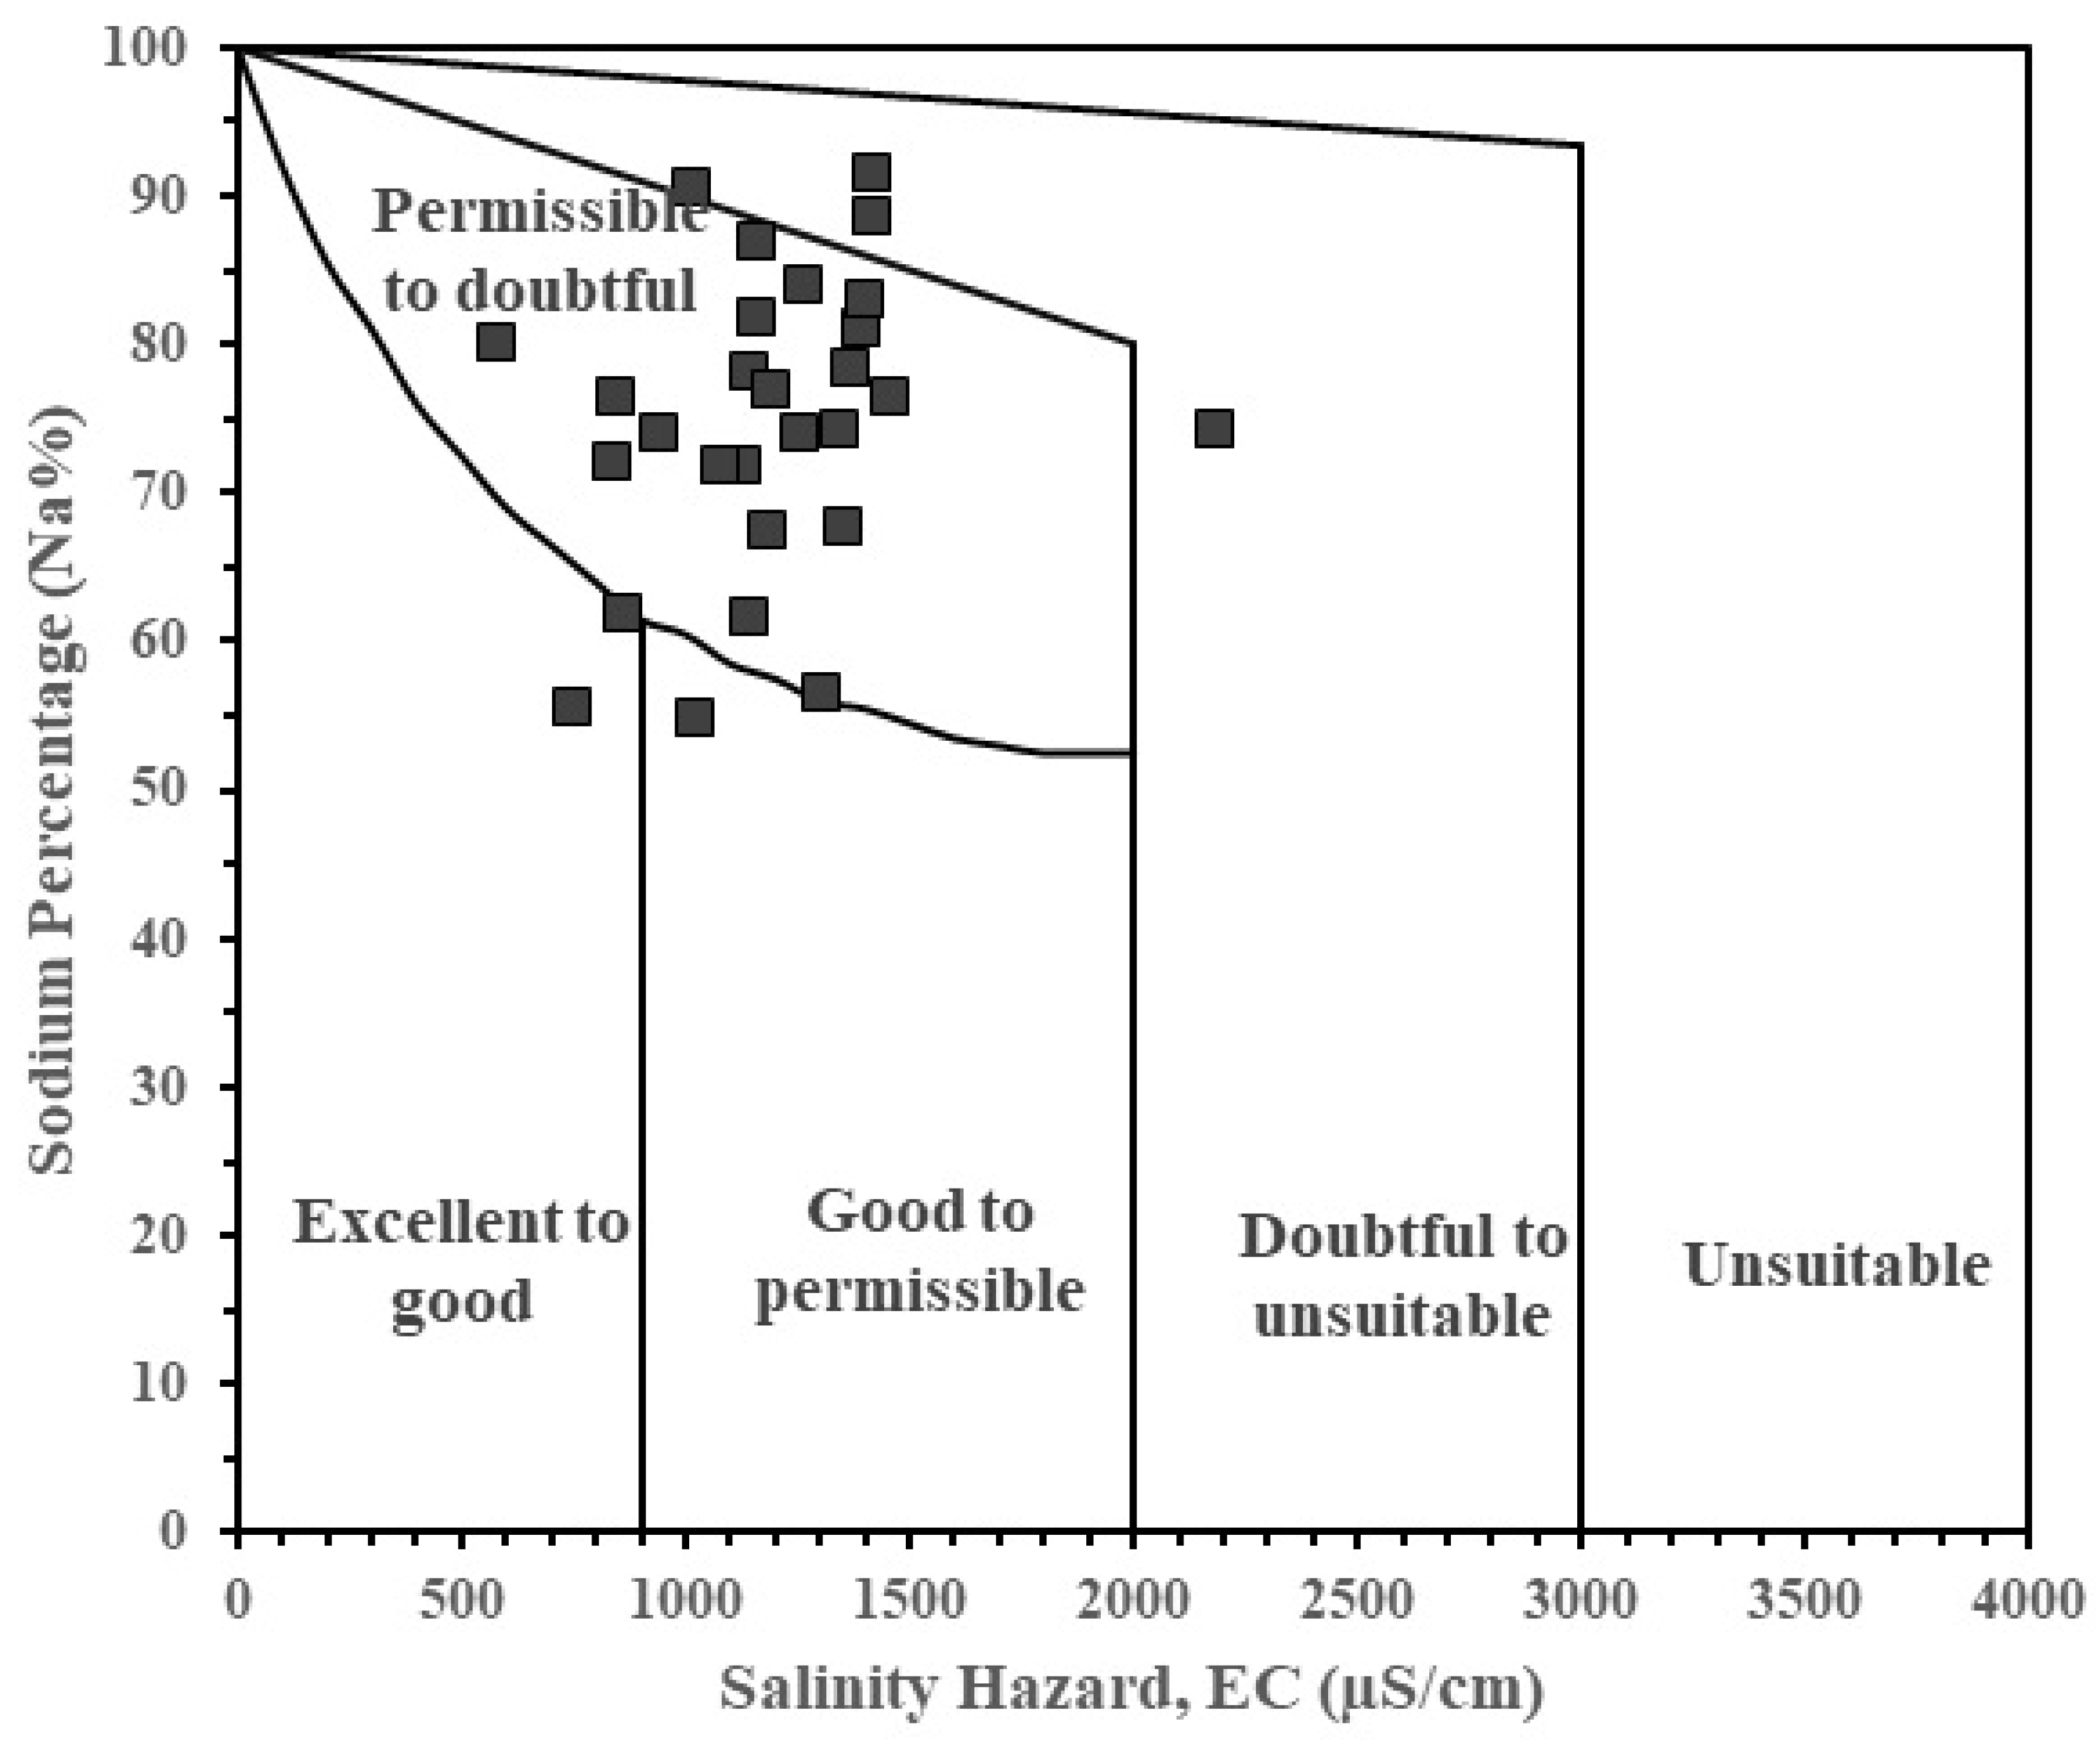
The suitability of groundwater for irrigation has been assessed through the use of USSL [28] and Wilcox [44] diagrams (Figure 7 and Figure 8), together with some irrigation water indices. A statistical summary of the irrigation assessment indices is shown in Table 7.
The USSL [28] developed a relation between SAR and EC used for the determination of irrigation water suitability. In this present study, most of the groundwater samples (26 samples) plotted in the C3-S1-S2-S3 column (Figure 7), indicating high salinity and low to high sodium hazard respectively. Groundwater belonging to these groups can be used for irrigation activities with salinity control. Very few of the samples (2 samples), however, fell within the C2–S1 category, indicating medium salinity (C2) and low sodium hazards (S1). Groundwater belonging to this category can be used for irrigation activities without any serious salinity control. A high amount of salt in irrigation water can alter the osmotic pressure in the root zone, which will result in limiting the amount of water taken by the plant and consequently hindering the plant growth [31].
Similarly, the computed %Na versus EC values have also been plotted on the Wilcox diagram (Figure 8). Results from the Wilcox diagram show most of the groundwater samples falling within the “permissible to doubtful” category followed by “doubtful to unsuitable” category, with two samples falling within the “excellent to good, whiles only one sample plotted within good to permissible category.
For irrigation purposes, EC values of water can have great influence on the level of salinity hazard to crops. With excess salinity, the osmotic activity of plants is reduced thereby interfering with the absorption of water and nutrients from the soil [62]. The values of EC in this study range from 576 to 2180 µS/cm. Based on irrigation water classification (Table 7), it can be observed that, out of the 28 analyzed samples, while 7% of the samples are within the range 250 to 750 µS/cm described as good for irrigation, the remaining samples (93%) have EC values within the 750 to 2250 µS/cm range which is described as permissible water. By this irrigation suitability index (EC), the two types of groundwater identified in the study area suggest that, groundwater under the good water category is not hazardous and thus, needs no restriction in its use for irrigation and can be used for almost all crops and on all types of soils without soil or cropping problems arising. However, groundwater under the permissible category needs slight restriction in its use for irrigation, as very little salinity hazard may develop but under normal irrigation practices, it is permissible for use except in extreme cases of soils of low permeability [8]. The EC results are corroborated by the SAR-EC plots as observed in the USSL diagram in Figure 7 for which 26 samples representing 92.9% falling within the C3-column depicting high salinity hazard and two samples falling within the C2-column depicting medium salinity hazard.
Sodium adsorption ratio is an important irrigation water index for determining the suitability of groundwater for irrigation. It is a measure of sodium or alkali hazard to crops. Irrigation water with high SAR value is suggestive of high Na+ and low Ca2+. Ion exchange favours the abundance of Na+ thereby destroying the soil structure arising from the dispersion of clay particles [62]. The SAR values range between 2.88 to 15.15 with a mean value of 2.88 (Table 7). It can be observed that 78.6% of all the samples have SAR value less than 10 and the remaining 21.4% have values in the range of 10 to 18. Two water types can thus be realized based on the range of SAR values, with excellent water being the dominant type followed by the good water type. The SAR classification system to assess the suitability of groundwater for irrigation purpose can also be determined with the USSL diagram. The results as presented in Figure 7 show 11 samples falling in the S1 field, indicating low sodium hazards, 12 samples falling in the S2 field, indicating medium sodium hazard, and five samples falling in S3 field, an indication of high sodium hazard.
Generally, hardness of water causes building up of scales in irrigation pipes thereby limiting the effective operation and performance of the entire irrigation system. TH values range from 40.7 to 310.3 meq/L (Table 7). Based on the TH values of groundwater in the area, five types of water can be recognized (Table 7): Soft water with 18% of samples falling within this category, moderately hard water, hard water, and very hard water with the respective representation of groundwater samples as 50%, 29% and 4%.
Magnesium ratio or magnesium hazard (MR or MH) is a measure of the effect of magnesium in irrigation water proposed by Paliwal [47]. Excess magnesium content in groundwater results in the dispersion of clay particles thereby damaging the soil structure. Groundwater with MR value less than 50 is considered suitable for irrigation, while MR value greater than 50 is considered unsuitable for irrigation. The present study shows MR values ranging from 17.24 to 83.42. It can be observed that 39.3% of all the sampled water have MR values below 50, indicating that, the water is suitable for irrigation. However, the remaining samples (60.7%) have MR values greater than 50, an indication that, the water is unsuitable for irrigation.
Wilcox’s [44] percentage of sodium (%Na) irrigation water parameter is widely used for assessing the suitability of water for irrigation purposes. With this parameter, Na+ is expressed as soluble sodium percentage (%Na), which is computed using the formula as presented in Table 3. The present study shows %Na values in the range of 55.00% to 91.47%. Three types of water can be recognized using this approach: permissible with three samples, doubtful with sixteen samples, and unsuitable water having nine samples falling within this category.
4. Conclusions

The major hydrochemical species and suitability of groundwater resources within the mudstones, sandstones, and siltstones aquifer units underlying the Saboba and Chereponi Districts have been assessed. The preliminary results reveal that, with the exception of HCO3, considerable number of the physico-chemical parameters fell within the WHO guidelines for potable water, whereas only few showed slight deviations. Sodium and bicarbonate ions are the predominant cations and anions respectively that account for more than 50% of the total ions in groundwater of the study area. The dominance of Na+ and HCO3 suggests the groundwater is predominantly fresh, influenced mainly by precipitation as revealed by the HCO3, and ion exchange by the Na+ dominance, as revealed by the Na-HCO3 water type in the study. Results of the WQI suggest that groundwater is suitable for drinking. All the graphical methods and estimated indices (USSL and Wilcox diagrams, SAR, TH, MR, %Na) used in irrigation suitability assessment, suggest groundwater within the two districts is of acceptable quality for irrigation purposes with varying degrees of acceptability in each method and index used. It can therefore be inferred that, with the exception of isolated cases, groundwater in the study area is generally suitable for drinking, domestic, and agricultural purposes.

Author Contributions

Conceptualization, L.P.C.; methodology, L.P.C. and B.A.A.; software, L.P.C. and B.A.A.; investigation, D.K.A.; data curation, D.K.A.; writing—original draft preparation, L.P.C. and B.A.A.; writing—review and editing, L.P.C., D.K.A., and B.A.A. All authors have read and agreed to the published version of the manuscript.

Funding

This research received no external funding.

Acknowledgments

The authors are grateful to CWSA of the erswhile Saboba-Chereponi District for allowing access to the hydrochemical data used in this study. The authors are also grateful to all those who in any form have contributed to the success of this work. The anonymous reviewers are greatly acknowledged for their critiques and comments that have immensely improved this paper.

Conflicts of Interest

The authors declare no conflict of interest.

Appendix A

Table A1. Hydrochemical dataset used to support the findings of this study.
Borehole IDLatitude (DD)Longitude (DD)pHECCa2+Mg2+Na+K+HCO3SO42−ClNO3PO43−F
WVI 20059.718590.309107.0110147.95.1177.81.943816.811.70.120.0012.51
WVI 200910.142980.280357.3384714.411.2122.71.337527.751.150.0011.21
WVI 201210.14190.282267.81115915.415.32111.540721.21471.290.0012.12
WVI 20199.712830.318687.814158.37.42495.2623.610.6175.90.0012.38
WVI 20219.699020.315607.3139214.917209.92.2442180.145.411.040.0010.51
WVI 20229.703320.316507112220.918.81512.553456.710.123.230.0030.51
WVI 20239.699070.322917.14135247.820.81981.3442.110.190.010.0020.21
WVI 20269.714770.311797.075768.56.588.21.825116.64.80.010.0020.27
WVI 20279.714440.310697.07141815.47.42501425.921.65.20.010.0080.2
WVI 20319.707720.186097.16115413.35.3166.51487.345.611.10.010.0071.75
WVI 20329.703350.191457.19126010.815.6220.50.847022.88.50.010.0012.04
WVI 20339.692240.197267.06125223.320.61844.843826.5130.250.0011.51
WVI 20349.806030.059036.939389.9118.5131.61.64304.7120.80.690.0010.8
WVI 20389.630280.240726.858381325.1160.31.4406.726.116.90.220.0014.2
WVI 20409.631350.248766.87130531.135.1132.325277.7512.90.050.0010.5
WVI 204810.207540.130497.03114522.99.9160.22.549541.913.90.990.0011.95
WVI 205110.216930.151647.1186330.713.296.22.440112.8310.98.960.0021.01
WVI 205210.153140.264716.8574631.813.476.71.73457.18.90.010.0010.62
WVI 206410.271430.111886.84108023.515.11412.449220.17.90.670.0011.13
WVI 206810.302860.064326.8411402725.31245.453217.712.916.860.0011.24
WVI 207010.147290.259166.832180102.913413.82.883113.27920.150.0011.03
WVI 207510.001000.309776.87102038.819.2973487.56.610.910.10.0010.53
WVI 20779.698960.327416.91134026.825.8230.11.743011.310.90.580.0010.25
WVI 20819.610170.247176.85118514.929.1147.94.1473.6628.93.230.0080.55
WVI 20839.638110.190946.8311917.823.8178.16.343517.77.94.110.940.53
WVI 21669.691910.330707.21145647.19.12331.1491.25.82269.950.0061.07
WVI 21679.817510.300427.25137036.715.4259.81.4478.351201.910.0031.1
WVI 21709.767590.249967.1139833.38.8266.71.84301907.91.890.0011.8
DD: Degree Decimal. All parameters are in mg/L except EC (μS/cm), pH (pH units).

References

  1. Berdimbetov, T.T.; Ma, Z.-G.; Liang, C.; Ilyas, S. Impact of Climate Factors and Human Activities on Water Resources in the Aral Sea Basin. Hydrology 2020, 7, 30. [Google Scholar] [CrossRef]
  2. WWAP. The United Nations World Water Development Report 2016: Water and Jobs; UNESCO: Paris, France, 2016; ISBN 978-92-3-100146-8. [Google Scholar]
  3. World Economic Forum Global Water Initiative. Available online: https://www.weforum.org/projects/global-water-initiative/ (accessed on 4 July 2020).
  4. Mullen, K. Information on Earth’s water. Available online: https://www.ngwa.org/what-is-groundwater/About-groundwater/information-on-earths-water (accessed on 4 July 2020).
  5. Climate Change Effects on Groundwater Resources: A Global Synthesis of Findings and Recommendations. In International Association of Hydrogeologists (IAH)—International Contributions to Hydrogeology; Treidel, H.; Martin-Bordes, J.J.; Gurdak, J.J. (Eds.) Taylor & Francis Publishing: Oxford, UK, 2012; p. 414. [Google Scholar]
  6. FAO. The State of Food Insecurity in the World. Addressing Food Insecurity in Protracted Crises. Rome, Italy, 2010. Available online: http://www.fao.org/docrep/013/i1683e/i1683e.pdf (accessed on 15 April 2020).
  7. Yankey, R.K.; Akiti, T.T.; Osae, S.; Fianko, J.R.; Duncan, A.E.; Amartey, E.O.; Essuman, D.K.; Agyemang, O. The Hydrochemical Characteristics of Groundwater in the Tarkwa Mining Area, Ghana. Res. J. Environ. Earth Sci. 2011, 3, 600–607. [Google Scholar]
  8. Tadesse, N.; Bheemalingeswara, K.; Berhane, A. Groundwater Suitability for Irrigation: A Case Study from Debre Kidane Watershed, Eastern Tigray, Ethiopia. Momona Ethiop. J. Sci. 2009, 1, 36–58. [Google Scholar] [CrossRef]
  9. Medici, G.; West, L.J.; Chapman, P.J.; Banwart, S.A. Prediction of contaminant transport in fractured carbonate aquifer types: A case study of the Permian Magnesian Limestone Group (NE England, UK). Environ. Sci. Pollut. Res. 2019, 26, 24863–24884. [Google Scholar] [CrossRef] [Green Version]
  10. Wang, L.; Stuart, M.E.; Lewis, M.A.; Ward, R.S.; Skirvin, D.; Naden, P.S.; Collins, A.L.; Ascott, M.J. The changing trend in nitrate concentrations in major aquifers due to historical nitrate loading from agricultural land across England and Wales from 1925 to 2150. Sci. Total Environ. 2016, 542, 694–705. [Google Scholar] [CrossRef] [Green Version]
  11. Wang, L.; Burke, S.P. A catchment-scale method to simulating the impact of historical nitrate loading from agricultural land on the nitrate-concentration trends in the sandstone aquifers in the Eden Valley, UK. Sci. Total Environ. 2017, 579, 133–148. [Google Scholar] [CrossRef] [Green Version]
  12. Lermi, A.; Ertan, G. Hydrochemical and isotopic studies to understand quality problems in groundwater of the Niğde Province, Central Turkey. Environ. Earth Sci. 2019, 78, 365. [Google Scholar] [CrossRef]
  13. WHO. Guidelines for Drinking-Water Quality: Fourth Edition Incorporating the First Addendum; World Health Organization: Geneva, Switzerland, 2017; ISBN 978-92-4-154995-0. [Google Scholar]
  14. Yidana, S.M.; Banoeng-Yakubo, B.; Sakyi, P.A. Identifying key processes in the hydrochemistry of a basin through the combined use of factor and regression models. J. Earth Syst. Sci. 2012, 121, 491–507. [Google Scholar] [CrossRef] [Green Version]
  15. WRC. Integrated Water Resources Management Plan of the Densu Basin; WRC: Accra, Ghana, 2007. [Google Scholar]
  16. Chegbeleh, L.P.; Akudago, J.A.; Nishigaki, M.; Edusei, S.N.K. Electromagnetic geophysical survey for groundwater exploration in the voltaian of Northern Ghana. J. Environ. Hydrol. 2009, 17, 16. [Google Scholar]
  17. Peel, M.C.; Finlayson, B.L.; McMahon, T.A. Updated world map of the Köppen-Geiger climate classification. Hydrol. Earth Syst. Sci. 2007, 11, 1633–1644. [Google Scholar] [CrossRef] [Green Version]
  18. GSS. Population and Housing Census Summary Report of Final Results; Ghana Statiscical Service: Saboba District, Ghana, 2010. [Google Scholar]
  19. Carney, J.N.; Jordan, C.J.; Thomas, C.W.; Condon, D.J.; Kemp, S.J.; Duodo, J.A. Lithostratigraphy, sedimentation and evolution of the Volta Basin in Ghana. Precambrian Res. 2010, 183, 701–724. [Google Scholar] [CrossRef] [Green Version]
  20. Affaton, P.; Rahaman, M.A.; Trompette, R.; Sougy, J. The Dahomeyide orogeny: Tectonothermal evolution and relationships with the Volta Basin. In The West African Orogens and Circum Atlantic Correlatives; Dallmeyer, R.D., Lecorche, J.P., Eds.; Springer: Berlin, Germany, 1991; pp. 107–122. [Google Scholar]
  21. Griffs, R.J.; Barning, K.; Agezo, F.L.; Akosah, F.K. Gold deposits of Ghana. Miner. Comm. Rep. 2002. [Google Scholar]
  22. Yidana, S.M.; Dzikunoo, E.A.; Aliou, A.-S.; Adams, R.M.; Chagbeleh, L.P.; Anani, C. The geological and hydrogeological framework of the Panabako, Kodjari, and Bimbilla formations of the Voltaian supergroup—Revelations from groundwater hydrochemical data. Appl. Geochem. 2020, 115, 104533. [Google Scholar] [CrossRef]
  23. Obuobie, E.; Agyekum, W.; Appiah-Adjei, E.K.; Upton, K.; Ó Dochartaigh, B.É.; Bellwood-Howard, I. Africa Groundwater Atlas: Hydrogeology of Ghana. Available online: http://earthwise.bgs.ac.uk/index.php/Hydrogeology_of_Ghana (accessed on 5 July 2020).
  24. Duodu, J.A. Ghana National Geological Map Project (Sheet 1:1,000,000); Geological Survey Department of Ghana and Bundesanstalt fur Geowiessenschaften und Rohstoffe (BGR): Accra, Ghana, 2009. [Google Scholar]
  25. Gyau-Boakye, P.; Dapaah-Siakwan, S. Hydrogeologic framework and borehole yields in Ghana. Hydrogeol. J. 2000, 8, 405–416. [Google Scholar] [CrossRef]
  26. Agyekum, W.A. Groundwater resources of Ghana with the focus on international shared aquifer boundaries. In ISARM-AFRICAL—Managing Shared Aquifer Resources in Africa; Appelgren, B., Ed.; IHP-VI, SERIES ON GROUNDWATER; UNESCO: Tripoli, Libya, 2004; p. 600. [Google Scholar]
  27. ALPHA. American Water Works Association; Water Environment Federation. In Standard Methods for the Examination of Water and Wastewater; APHA-AWWA-WEF: Washington, DC, USA, 1998; ISBN 978-0-87553-235-6. [Google Scholar]
  28. USSL. Diagnosis and Improving of Saline and Alkali Soils; United States Department of Agriculture: Washington, DC, USA, 1954; Volume 60.
  29. Soltan, M.E. Characterisation, classification, and evaluation of some ground water samples in upper Egypt. Chemosphere 1998, 37, 735–745. [Google Scholar] [CrossRef]
  30. Singh, P.; Khan, I.A. Ground water quality assessment of Dhankawadi ward of Pune by using GIS. Int. J. Geomat. Geosci. 2011, 2, 688–703. [Google Scholar]
  31. Srinivasamoorthy, K.; Gopinath, M.; Chidambaram, S.; Vasanthavigar, M.; Sarma, V.S. Hydrochemical characterization and quality appraisal of groundwater from Pungar sub basin, Tamilnadu, India. J. King Saud Univ. Sci. 2014, 26, 37–52. [Google Scholar] [CrossRef] [Green Version]
  32. Dinka, M.O.; Loiskandl, W.; Ndambuki, J.M. Hydrochemical characterization of various surface water and groundwater resources available in Matahara areas, Fantalle Woreda of Oromiya region. J. Hydrol. Reg. Stud. 2015, 3, 444–456. [Google Scholar] [CrossRef] [Green Version]
  33. Boah, D.K.; Twum, S.B.; Pelig-Ba, K.B. Mathematical computation of water quality index of Vea dam in upper east Region of Ghana. Environ. Sci. 2015, 3, 11–16. [Google Scholar] [CrossRef] [Green Version]
  34. Mohammed, A.-Q.; Naser, R.S.M.; Farid, H.; Abderrahman, A.; Khadija, E.K.; Achaouch, A.; Driss, B. Hydro-chemical monitoring of Groundwater Quality for Irrigation in Sidi Allal Tazi area, Kenitra, Morocco. Res. J. Chem. Environ. 2018, 22, 36–44. [Google Scholar]
  35. Talib, M.; Tang, Z.; Shahab, A.; Siddique, J.; Faheem, M.; Fatima, M. Hydrogeochemical Characterization rand Suitability Assessment of Groundwater: A Case Study in Central Sindh, Pakistan. Int. J. Environ. Res. Pub. Health 2019, 16, 886. [Google Scholar] [CrossRef] [PubMed] [Green Version]
  36. Tank, D.K.; Chandel, C.P.S. Analysis of The Major Ion Constituents In Groundwater Of Jaipur City. Nat. Sci. 2010, 8, 1–7. [Google Scholar]
  37. Samlafo, V.B.; Ofoe, E.O. Water Quality Analysis of Bobobo Stream, in Tarkwa, Ghana. World Environ. 2018, 8, 15–19. [Google Scholar] [CrossRef]
  38. Alexakis, D.E. Meta-Evaluation of Water Quality Indices. Application into Groundwater Resources. Water 2020, 12, 1890. [Google Scholar] [CrossRef]
  39. Brown, R.M.; McCleiland, N.J.; Deiniger, R.A.; O’Connor, M.F.A. Water quality index—Crossing the physical barrier. In Proceedings of the International Conference on Water Pollution Research Jerusalem, Jerusalem, Israel, 18–23 June 1972; Jenkis, S.H., Ed.; Volume 6, pp. 787–797. [Google Scholar]
  40. Sahu, P.; Sikdar, P.K. Hydrochemical framework of the aquifer in and around East Kolkata wetlands, West Bengal, India. Environ. Geol. 2008, 55, 823–835. [Google Scholar] [CrossRef]
  41. Piper, A.M. A graphic procedure in the geochemical interpretation of water analyses. AGU 1944, 25, 914–928. [Google Scholar] [CrossRef]
  42. Durov, S.A. Classification of natural waters and graphical representation of their composition. Doklady Akademii Nauk SSSR 1948, 59, 87–90. [Google Scholar]
  43. Lloyd, J.A.; Heathcoat, J.A. Natural Inorganic Hydrochemistry in Relation to Groundwater: An Introduction; Oxford University Press: Oxford, UK, 1985. [Google Scholar]
  44. Wilcox, L.V. Classification and Use of Irrigation Waters; United States Department of Agriculture: Washington, DC, USA, 1955.
  45. Vincy, M.; Brilliant, R.; Pradeepkumar, A. Hydrochemical characterization and quality assessment of groundwater for drinking and irrigation purposes: A case study of Meenachil River Basin, Western Ghats, Kerala, India. Environ. Monit. Assess. 2015, 187, 4217. [Google Scholar] [CrossRef]
  46. Karanth, K. Ground Water Assessment, Development and Management; Tata McGraw Hill: New Delhi, India, 1987. [Google Scholar]
  47. Paliwal, K.V. Irrigation with Saline Water; Monograph No. 2 (New Series); ICARI: New Delhi, India, 1972; p. 198. [Google Scholar]
  48. Khodapanah, L.; Sulaiman, W.N.A.; Khodapanah, N. Groundwater quality assessment for different purposes in Eshtehard district, Tehran, Iran. Eur. J. Sci. Res. 2009, 36, 543–553. [Google Scholar]
  49. Sengupta, P. Potential Health Impacts of Hard Water. Int. J. Prev. Med. 2013, 4, 866–875. [Google Scholar] [PubMed]
  50. Regulations for calcium, magnesium or hardness in drinking water in the European Union member states. Regul. Toxicol. Pharmacol. 2020, 112, 104589. [CrossRef] [PubMed]
  51. WHO. Hardness in Drinking Water; WHO Press: Geneva, Switzerland, 2011. [Google Scholar]
  52. Hailu, Y.; Tilahun, E.; Brhane, A.; Resky, H.; Sahu, O. Ion exchanges process for calcium magnesium and total hardness from ground water with natural zeolite. Groundw. Sustain. Dev. 2019, 8, 457–467. [Google Scholar] [CrossRef]
  53. Sunkari, E.D.; Abu, M.; Zango, M.S.; Lomoro Wani, A.M. Hydrogeochemical characterization and assessment of groundwater quality in the Kwahu-Bombouaka Group of the Voltaian Supergroup, Ghana. J. Afr. Earth Sci. 2020, 169, 103899. [Google Scholar] [CrossRef]
  54. Appelo, C.A.J.; Postman, D. Geochemistry, Groundwater and Pollution, 2nd ed.; A.A Balkema: Rotterdam, The Netherlands, 2005. [Google Scholar]
  55. Kokkat, A.; Palanichamy, J.; Joseph, J.E. Spatial and Temporal Variation in Groundwater Quality and Impact of Sea Water in the Cauvery Delta, South India. Int. J. Earth Sci. Eng. 2016, 9, 383–392. [Google Scholar]
  56. WHO. Potassium in Drinking-Water: Background Document for Development of WHO Guidelines for Drinking-Water Quality; WHO Press: Geneva, Switzerland, 2009. [Google Scholar]
  57. Saha, S.; Reza, A.H.M.S.; Roy, M.K. Hydrochemical evaluation of groundwater quality of the Tista floodplain, Rangpur, Bangladesh. Appl. Water Sci. 2019, 9, 198. [Google Scholar] [CrossRef] [Green Version]
  58. Minnesota Department of Health Sulfate in Well Water. Available online: https://www.health.state.mn.us/communities/environment/water/wells/waterquality/sulfate.html (accessed on 4 July 2020).
  59. Sun, H.; Shi, B.; Yang, F.; Wang, D. Effects of sulfate on heavy metal release from iron corrosion scales in drinking water distribution system. Water Res. 2017, 114, 69–77. [Google Scholar] [CrossRef]
  60. Singh, A.K.; Kumar, S.R. Quality assessment of groundwater for drinking and irrigation use in semi-urban area of Tripura, India. Ecol. Environ. Conserv. 2015, 21, 97–108. [Google Scholar]
  61. Stiff, H.A., Jr. The Interpretation of Chemical Water Analysis by Means of Patterns. J. Petrol. Tech. 1951, 3, 15–16. [Google Scholar] [CrossRef]
  62. Todd, D.K. Ground Water Hydrology; Wiley: New York, NY, USA, 1980. [Google Scholar]
Figure 1. Location map of the study area.
Hydrology 07 00053 g001
Figure 2. Geological map of the study area showing major rock units of the Oti-Pendjari group and boreholes locations (Modified from Duodu [24]).
Hydrology 07 00053 g002
Figure 3. Piper diagram of groundwater samples in the study area showing diamond-shaped subdivisions.
Hydrology 07 00053 g003
Figure 4. Durov diagram showing hydrochemical facies and processes (Modified from Singh and Kumar [60]).
Hydrology 07 00053 g004
Figure 5. Stiff diagram created from average concentrations of major ions.
Hydrology 07 00053 g005
Figure 6. Water Quality Index Map.
Hydrology 07 00053 g006
Figure 7. US Salinity classification for irrigation.
Hydrology 07 00053 g007
Figure 8. Wilcox plot for the study area.
Hydrology 07 00053 g008
Table 1. Water quality index (WQI) classification [40].
WQIStatus
<50Excellent water
50–100Good water
100–200Poor water
200–300Very poor water
>300Water unsuitable for drinking
Table 2. Estimation methods for computation of irrigation water suitability (Sources modified by researchers [32,35,45]).
Quality ParametersAbbreviationAdopted FormulaSource
Sodium adsorption ratioSAR Na + 1 2 ( Ca 2 + + Mg 2 + ) [28,34,46]
Total HardnessTH ( Ca 2 + + Mg 2 + ) × 50 [32]
Magnesium hazardMR Mg 2 + ( Ca 2 + + Mg 2 + ) × 100 [35,47]
Sodium percentage%Na ( Na + + K + ) ( Na + + K + + Ca 2 + + Mg 2 + ) × 100 [34,44,48]
All ionic concentrations for computation of the indices are in meq/L.
Table 3. Classification of irrigation water types (Source modified by researchers [28,31]).
ParameterRangeWater Type
EC<250Excellent
250–750Good
750–2250Permissible
2250–5000Doubtful
>5000Unsuitable
SAR<10Excellent
10–18Good
18–26Fair
>26Poor
TH<75Soft
75–150Moderately Hard
150–300Hard
>300Very Hard
MR<50Suitable
>50Unsuitable
%Na<20Excellent
20–40Good
40–60Permissible
60–80Doubtful
>80Unsuitable
Table 4. Descriptive statistical summary of hydrochemical parameters within the three geological units of the study area.
ParametersAFMBFMCFMNumber Within WHO LimitTotal Number Within WHO LimitNumber Outside WHO LimitTotal Number Outside WHO LimitWHO (2017) Limits
MINMAXMEANMINMAXMEANMINMAXMEANAFMBFMCFMAFMBFMCFM
pH6.917.807.176.837.257.056.837.817.0191092800006.5–8.5
EC576.001456.001231.67863.001398.001159.10746.002180.001164.4491092800002500
TH40.70204.89108.7055.00175.84118.6382.03310.30159.478107251023200
Ca2+7.9047.8021.967.8038.8022.7513.00102.9030.449109280000200
Mg2+5.1025.8013.105.3023.8015.0311.2035.1020.299109280000150
Na+88.20250.00198.5696.20266.70176.0676.70413.80169.974771853210200
K+1.005.202.080.806.302.561.305.402.5191092800003000
HCO3251.00623.60453.09401.00495.00455.21345.00831.00487.700000910928150
SO42−5.80180.1036.624.71190.0037.367.1062.0022.549109280000250
Cl4.80226.0037.797.90120.0022.495.00792.00112.499108270011250
NO30.0123.235.650.0110.102.890.0116.862.63910928000050
PO43−<0.0010.0080.0030.0010.9400.0960.0010.0080.0029992701010.7
F0.202.510.880.532.041.300.504.201.407571925291.5
AFM: Afram Formation, BFB: Bimbila Formation, CFM: Chereponi Formation. All parameters are in mg/L except EC (μS/cm), pH (pH units).
Table 5. Standards, weights and relative weights used for WQI computation.
ParameterWHO (2017) Standard (Si) (mg/L)Weight (wi)Relative Weight (Wi)
pH8.550.1282
TH20040.1026
Ca2+20020.0513
Mg2+15020.0513
Na+20020.0513
K+300020.0513
HCO315020.0513
SO42−25030.0769
Cl25030.0769
NO35050.1282
PO43−0.740.1026
F1.550.1282
w i = 39 w i = 1
Table 6. Classification of groundwater quality based on WQI.
WQIWater TypeNumber of SamplesPercentage of Samples
<50Excellent water1139
50–100Good water1657
100–200Poor water14
Table 7. Statistical summary and classification of groundwater quality parameters for irrigation purposes (Source modified by researchers [28,31]).
ParameterRangeWater TypeNumber of SamplesPercentage of SamplesMinMaxMean
EC<250Excellent0057621801184.14
250–750Good27.1
750–2250Permissible2692.9
2250–5000Doubtful00
>5000Unsuitable00
SAR<10Excellent2278.62.8815.157.43
10–18Good621.4
18–26Fair00.0
>26Poor00.0
TH<75Soft517.940.70310.30128.57
75–150Moderately Hard1450.0
150–300Hard828.6
>300Very Hard13.6
MR<50Suitable1139.317.2483.4253.47
>50Unsuitable1760.7
%Na<20Excellent0055.0091.4774.80
20–40Good00
40–60Permissible310.7
60–80Doubtful1657.1
>80Unsuitable932.1