Abstract
The frequency and intensity of flood quantiles and its attendant damage in agricultural establishments have generated a lot of issues in Ethiopia. Moreover, precise estimates of flood quantiles are needed for efficient design of hydraulic structures; however, quantification of these quantiles in data-scarce regions has been a continuing challenge in hydrologic design. Flood frequency analysis is thus essential to reduce possible flood damage by investigating the most suitable flood prediction model. The annual maximum discharges from six representative stations in the Upper Blue Nile River Basin were fitted to the commonly used nine statistical distributions. This study also assessed the performance evolution of the probability distributions with varying spatial scales, such that three different spatial scales of small-, medium-, and large-scale basins in the Blue Nile River Basin were considered. The performances of the candidate probability distributions were assessed using three goodness-of-fit test statistics, root mean square error, and graphical interpretation approaches to investigate the robust probability distribution for flood frequency analysis over different basin spatial scales. Based on the overall analyses, the generalized extreme value distribution was proven to be a robust model for flood frequency analysis in the study region. The generalized extreme value distribution significantly improved the performance of the flood prediction over different spatial scales. The generalized extreme value flood prediction performance improvement measured in root mean square error varied between 5.84 and 67.91% over other commonly used probability distribution models. Thus, the flood frequency analysis using the generalized extreme value distribution could be essential for the efficient planning and design of hydraulic structures in the Blue Nile River Basin. Furthermore, this study suggests that, in the future, significant efforts should be put to conduct similar flood frequency analyses over the other major river basins of Ethiopia.
1. Introduction
In hydrology, the quantification of design peak discharges on data-scarce catchments has been a continuing problem [1,2]. Precise estimates of flood quantiles are needed for the efficient design of hydraulic structures [3,4]; however, historical data that are required to quantify the flood statistics are usually unavailable at the site of interest or the available information may not be representative of the catchment studied because of the changes in the watershed characteristics, such as urbanization [2,5]. The measured hydrological data, particularly in developing countries such as Ethiopia can be limited, short, or nonexistent to the extent that they are far from representative of the basin under consideration [1,6]. A promising and elegant way to solve this problem is deriving the flood frequency curve by using the commonly used probability distribution functions, which is the most frequently used statistical method in hydrology all over the world [2,7,8,9,10,11,12,13,14,15]. Moreover, it is essential to note that the climate and land use changes, as well as human activities, have been known to alter the catchment flood response dynamics. Several studies have reported the increasing trend of flood frequency and magnitudes in different parts of the world [16,17,18]. Thus, investigation of the most suitable flood frequency analysis method is of great importance in improving the reliability of water infrastructures.
The Blue Nile River Basin is the major source of the Nile River, which is the world’s longest river. The basin sustains the livelihood of millions of people across ten countries in Africa (i.e., Ethiopia, Burundi, the Democratic Republic of Congo, Rwanda, Tanzania, Kenya, Uganda, South Sudan, Sudan, and Egypt) [19]. Owing to climate change and population growth in these countries, the Nile River Basin requires new approaches for ensuring the ongoing security of the water supply for drinking purpose, hydropower and agricultural productions. In this direction, the Ethiopian government started to implement a number of water resource projects in the Upper Blue Nile River Basin. This motivated us to investigate the robust flood frequency prediction approach for the region, as this could help to improve the design reliability of various water resources projects in the region. It is common that, from the developed flood frequency curve, the quantile with different return periods can be used for dam safety analysis. For example, a flood with 100-year return period has been recommended in France for flood hazard mappings, while flood with 104-year return period considered for design and safety analysis of mega water infrastructures [2]. Moreover, several countries have developed frameworks suggesting which probability distribution should be used for flood frequency analysis, such as the lognormal distribution in China [20], the three-parameter log-Pearson type 3 distribution for the United States of America [21], and the generalized extreme value distribution in the United Kingdom [22,23]. However, despite the importance of investigating the robust flood frequency prediction model for improving the design, as well as for the efficient planning and management of the regional water resource projects, the flood frequency analysis in the region has not received much attention. Thus, this study relies on the investigation of the robust flood frequency analysis method towards an improved design, plan and management of the Blue Nile River water resources.
Several probability distribution functions have been developed to fit the sample distributions. The suitability of the candidate probability distributions can be evaluated by considering their ability to reproduce different features of the annual maximum flow series (upper bound of the distribution, upper tail of the distribution, the shape of the body of the distribution, lower tail of the distribution, lower bound of the distribution) that are of particular importance in flood frequency modeling [24]. The best probability distributions that can be used in various situations are based on the specific properties of such distributions [2,7,13]. The samples for flood frequency analysis can be chosen based on the annual maximum flow or the annual peak flows over some defined truncation levels. The annual maximum flow method has been widely used for flood frequency analysis in different regions [2,7,8,9,10,11,12,13,14,15,25,26,27,28], in which the sample is defined by the maximum flow of each year of the study period. It is essential to note that the main drawbacks of relying on peaks over threshold method are the threshold selection and assuring independence criteria [27]. Thus, to investigate the robust probability distribution function for flood frequency analysis, this study considered the annual maximum flow series from six representative stations that cover three different spatial scales in the upper Blue Nile River Basin.
Several studies have been reported to be related to the investigation of the most suitable probability distribution for flood frequency analysis in different regions worldwide [2,7,8,9,10,11,12,13,14,15,26,27,28,29,30,31,32,33]. Ahilan et al. [29] compared the family of extreme value distributions using the data from 172 gauging stations in Ireland; they reported that the Gumbel distribution outperformed the other two types of extreme value distributions (i.e., Frechet, and Weibull). Seckin et al. [33] studied the flood frequency analysis using the data from 543 gauging stations in Turkey; they found that the generalized extreme value distribution reproduced the data better than the generalized logistic and log-Pearson type-III distributions. Rizwan et al. [13] tested ten probability distributions using the annual maximum streamflow data recorded for more than 30 years from 11 stations in Pakistan, such that they suggested the generalized Pareto and Weibull distributions. Dong et al. [8] developed a nonstationary flood frequency analysis in China considering climate change and human activity. Chen et al. [7] compared eight probability distributions considering hypothesis tests and information-based criteria for identifying the best flood frequency prediction model in the Thames River from the United Kingdom, Wabash River from the United States of America, and both Beijing River and Huai River from China. They reported that the information-based criteria perform better than hypothesis test methods for identifying the most suitable probability distribution function. Langat et al. [12] compared the performance of six probability distributions for frequency analysis of the maximum, minimum, and mean flows in the Tana River, Kenya. They reported the suitability of the gamma (Pearson type 3) and lognormal distribution functions for predicting the maximum streamflow, while the Weibull and the generalized extreme value distributions for predicting the annual minimum flows, and the lognormal and generalized extreme value distributions for predicting the annual mean flows in the study region. Griffis and Stedinger [30] suggested the log-Pearson type III for flood frequency analysis in the United States of America, while Rahman et al. [32] recommended the log-Pearson type III, generalized extreme value, and generalized Pareto distributions for flood frequency analysis in Australia. Thus, the most widely used and recommended probability distributions in the previous studies have been considered in this study.
It is worth mentioning that the major sources of uncertainty in flood prediction included the heterogeneity of catchments that are included in the flood frequency analysis, the parameter estimation method, and the probability distribution selection approach [2]. The suitability of the probability distribution functions for improved flood frequency analysis might depend on the hydro-climatic regimes of the region; therefore, identification of the most suitable flood frequency probability distribution for different climate zones should be assessed. Thus, the differences in the hydro-climatic characteristics should serve as a hydro-physical basis for choosing the most suitable probability distribution for the studied region. Despite previous efforts in advancing the flood frequency prediction models in different regions, the performance evolution of the flood frequency prediction models considering different spatial scales within the same hydro-climatic setting has not perceived much attention. Most of the existing flood frequency prediction models comparison studies, to our knowledge, are either in the way of investigating the most suitable probability distribution for flood modeling at a specific site of the studied region or investigating the most suitable flood frequency approach for the entire region, including the gauged and ungauged sites, through the regional flood frequency analysis approach. However, investigation of the flood frequency distribution performance evolution considering different spatial scales within the same hydro-climatic setting might give the robust probability distribution model for flood prediction in the entire basin. It is essential to note that the choice of flood prediction model is highly influenced by the flood magnitude. Thus, considering the flood magnitudes from different basin spatial scales could improve our understanding of the probability distributions performance evolution with different basin spatial scales (i.e., with different flood magnitudes). In this respect, this study considered four small spatial scale basins with an area ranging between 514 and 1656 km2, while the large and medium spatial scale basins cover the areas of 199,812 and 65,784 km2, respectively. It is worth mentioning that each of the small-scale catchment contribute to the flow magnitude measured at both the medium scale and large scale basins, such that the performance evolution of each probability distribution function with flow magnitude can be investigated. Thus, the ultimate goal of this study is to investigate the robust flood frequency prediction model among the most commonly used probability distributions by considering different basin spatial scales in the Blue Nile River Basin. The robust probability distribution will perform satisfactorily in all selected basin spatial scale scenarios, such that the investigated flood prediction model can be used for the design, planning, and management of the regional water resources.
This study relies on the investigation of the robust probability distribution among the commonly used univariate two-, three-, and four-parameter probability distributions for flood frequency analysis in the upper Blue Nile River Basin. However, multivariate probability distributions such as bivariate and trivariate have also been suggested by several studies for flood frequency analysis [34,35,36,37,38,39,40,41]. The flood frequency analysis commonly requires fitting univariate distributions to annual peak discharges [34]. However, the flood and watershed characteristics are multidimensional processes; thus, multivariate distributions can be considered for a simultaneous consideration of several hydrological component processes in certain situations. The decision to adopt either the univariate, bivariate or multivariate distribution mainly depends on the objectives of the particular study [34]. For example, a univariate flood frequency analysis might be more suitable in the case of flood protection risk assessment with a small to moderate sized structure [34]. Conversely, a multivariate flood frequency analysis approach is desirable if the flood risk assessment considers the flood attenuation, duration, and volume in addition to the flood magnitude. In general, a multivariate consideration is more appropriate when the variables of interest are a function of two or more hydrological variables. In this direction, the copula-based multivariate distributions were commonly used. Comprehensive definitions and formulae for the copula-based frequency analysis can be found in the study by Salvadori and De Michele [39]. Moreover, Genest and Favre [36] can be referred for a comprehensive review and illustration of a copula estimation procedures.
This study also investigates the best parameter estimation approach for each of the selected probability distribution. The commonly used parameter estimation methods include the method of moments, maximum likelihood method, probability weighted moments, and L-moments [10,12,14,42]. Gharib et al. [10] and Bermudez and Kotz [43] mentioned that the maximum likelihood estimator, the method of moments, and the probability weighted moments are the most widely used and efficient parameter estimation approaches. The maximum likelihood parameter estimation method has been suggested by several previous studies [12,42,44]. For example, Langat et al. [12] and Laio [42] reported that the probability distribution parameter estimates using the maximum likelihood parameter estimation method are consistent, reliable, and unbiased. It is worth mentioning that the maximum likelihood parameter estimation method starts with the likelihood function with unknown model parameters and yielded the parameter values that maximize the sample likelihood. Moreover, the probability-weighted moments [45] were found to be superior to that of the standard moment-based estimates and suggested as an alternative method to the maximum likelihood parameter estimation approach [12]. The L-moment method has also been popularly used for parameter estimation due to its advantages of not being affected by sampling variability, small bias, and robustness compared to that of the standard moment method [24,46]. However, the L-moment method is more suited for three-parameter distributions with small sample sizes [47], and their estimates can be influenced by the outliers [48]. In this aspect, Zhang [49] proposed the hybrid between likelihood and moment parameter estimation approaches called the likelihood moment parameter estimation approach. Thus, this study considered the three commonly used parameter estimation approaches: the maximum likelihood estimation, the probability weighted moments estimation, and the likelihood moment estimation approaches. It is essential to note that an alternative parameter estimation method, such as the maximum entropy and neural network approaches, have also been proposed by the previous studies [50,51,52,53]. The maximum entropy was used for estimating the parameters of several probability distributions such as gamma, Pearson type III, Log-Pearson type III, and generalized Pareto probability distributions [51,52]. Singh [53] reported that the maximum entropy method is comparable to the commonly used method of moments, maximum likelihood method, probability weighted moments, and L-moments parameter estimation approaches. Molina-Aguilar et al. [50] also suggested a meta-heuristic harmonic search approach for estimating the parameters of the generalized extreme value distribution. In general, the specific objectives of this study are to (1) explore the influence of basin spatial scales on the performance of probability distribution functions, (2) select the most suitable parameter estimation technique among the maximum likelihood estimation, the probability weighted moments estimation, and the likelihood moment estimation approaches, and (3) investigate the robust flood prediction probability distribution function for flood frequency analysis considering different spatial scales in the Blue Nile River Basin.
2. Study Area
This study evaluated the performances of the commonly used probability distribution functions for flood frequency analyses in the Upper Blue Nile River Basin, which is the Ethiopian part of the Nile River Basin and locally known as the Abay River Basin (Figure 1). Three different spatial scales (i.e., large, medium and small spatial scales) are considered to evaluate the performances of each probability distribution function in view of reproducing the annual maximum flow series obtained from different basin scales. Investigating the robust probability distribution function considering different spatial scales in the study region has relevant purposes in the development, operation and maintenance of the ongoing and proposed water resources projects in the Upper Blue Nile River Basin. In this respect, the historical annual maximum flow series measured at the border between Ethiopia and Sudan (i.e., Eldiem gauging station) is considered to represent the large spatial scale scenario, whereas the annual maximum flow series at Kessie gauging station is considered to reflect the medium basin scale. Furthermore, four hydrologically different small-scale basins are considered to investigate the performance evolution of the probability distribution functions with relatively less magnitude in the annual maximum flow. The annual maximum flow series that represent the small spatial scales are measured at Gilgel Abay, Gummara, Ribb, and Megech gauging stations (Figure 1). The small-scale catchments area ranging between 514 km2 for Megech and 1656 km2 for Gilgel Abay. Conversely, the large and medium spatial scales cover the areas of 199,812 and 65,784 km2, respectively. Each of the small-scale catchments contribute to the flow magnitude measured at both the medium-scale and large-scale basins, such that the performance evolution of each probability distribution function with flow magnitude can be investigated (Figure 1). The observed streamflow data recorded for the periods 1980–2012, 1965–2013, 1959–2013, 1973–2012, 1960–2014, and 1961–2002, respectively, at Megech, Ribb, Gummara, Gilgel Abay, Kessie, and Eldiem stations, were collected from the Ministry of Water, Irrigation, and Energy of Ethiopia. The selected gauging stations with their spatial scales are shown in Figure 1.
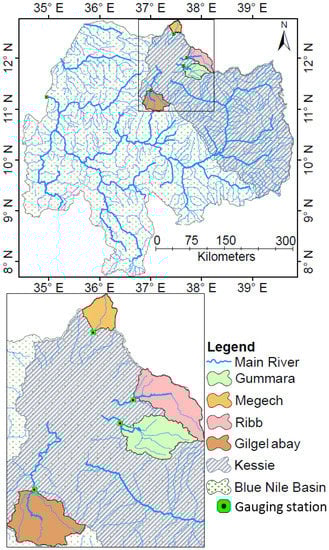
Figure 1.
Location map of the study area (top). The bottom map shows the small-scale basins with high resolution. Six streamflow gauging stations, namely, Gilgel Abay, Gummara, Ribb, Megech, Kessie and Eldiem, were considered in this study to investigate the robust probability distribution function.
From Figure 2, the study basin mainly dominated by wooded grassland, followed by agro-pastoral, agriculture, and sylvo-pastoral. However, in the study basin, the natural vegetation cover is rapidly changing into the agricultural crop land. The deforestation of natural woody vegetation as well as the expansion of cultivated land are increasing in the study basin. Thus, the land use change over the basin can influence the temporal and spatial dynamics of surface runoff. For example, the conversion of the natural vegetation cover into the agricultural crop land will cause an increase in the surface runoff magnitude. Consequently, this will influence the type of probability distribution that has been identified in the region based on prior information. Thus, it is essential to frequently update the most suitable flood frequency prediction model considering the land use changes. Moreover, the topography of the study area shows that the elevation varied between 502 and 4133 m above mean sea level. From the topographic map, the small-scale catchments show a similar slope pattern. Conversely, the medium- and large-scale basins show the diverse slope patterns.
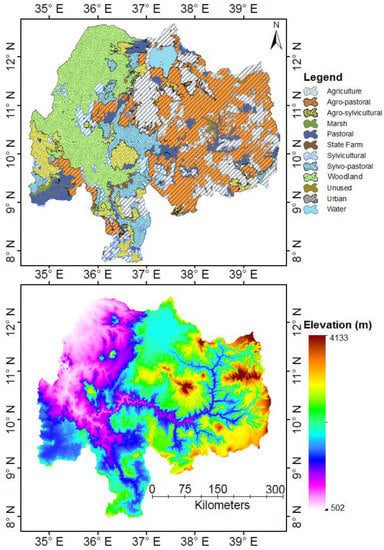
Figure 2.
Land use (top) and topography (bottom) maps of the study basin.
3. Methodology
The general steps followed in this study are (1) acquisition of data for flood extremes analysis; (2) identification of a plotting position formula to compute observed probabilities of occurrence; (3) identification of appropriate parameter estimation technique for each probability distribution function; (4) fitting of the candidate probability distribution functions to the annual maximum flow series; (5) testing the goodness of fit measures; (6) investigating the robust probability distribution function for flood frequency analysis at three different spatial scales; and (7) estimation of flood quantiles with different return periods.
3.1. Acquisition of Data on Flood Extremes
Annual Maximum Flow
The annual maximum flow series from six gauging stations in the Upper Blue Nile River Basin are selected and ranked in descending order of magnitude. From the annual maximum flow series in each station, the highest flood of 115.53, 127.79, 229.45, 260.35, 4763.69, and 7800.03 m3/s were observed at the Megech, Ribb, Gummara, Gilgel Abay, Kessie, and Eldiem stations, respectively. Table 1 presents the main statistical characteristics of the annual maximum flow series obtained from six selected river gauging stations in the Upper Blue Nile River Basin.

Table 1.
The main statistical characteristics of the annual maximum flow data in the six selected gauging stations.
Moreover, the analyses show that there is a weak correlation between the annual maximum flow data of the selected gauging sites in the study basin, such that the best probability distribution function for one gauging site might not be the best for the other sites. The weak correlation between the maximum flow data obtained from six sites might be attributed by the complex spatial and temporal variability of the climate in the Blue Nile River Basin. Therefore, it is essential to investigate the best probability distribution function for each gaging site considered in this study. Moreover, Hosking and Wallis [24] reported that there will be no single distribution that applies to each site in a hydrologically heterogeneous region. Hence, this study aims to find the most suitable probability distribution function for each gauging station considered in this study. Furthermore, the performance evolution of the candidate probability distribution functions over different spatial scales are investigated in order to suggest the robust model for flood frequency analysis in the study region.
3.2. Probability Distributions
The most commonly used probability distribution functions (Table 2) are applied at the selected six representative gauging stations in the Upper Blue Nile River Basin. The candidate probability distribution functions are: extreme value type-II (Frechet, EV2), the three parameter gamma (GM3P), generalized gamma (GMG), generalized extreme value (GEV), beta (BT), the four parameter generalized gamma (GMG4P), Log-Pearson type-III (LP3), the three parameter lognormal (LN3P), and the three parameter Weibull (WB3P) probability distributions.
Table 2.
The probability distribution functions used for this study.
The beta distribution is a continuous probability distribution characterized by boundary parameters [a, b] and parametrized by two shape parameters (α1, and α2). The gamma distribution is defined in terms of a shape factor (α), a scale factor (β), and a location factor (γ). The three-parameter gamma is also referred to as the Pearson Type III distribution. The lognormal distribution is based on the normal distribution with a scale parameter σ and location parameter μ. The Log-Pearson type-III distribution [54] has a shape parameter (α), scale parameter (β), and location parameter (γ). The Log-Pearson type-III distribution has been widely used for hydrologic frequency analyses after the recommendation by the United States Water Resources Council [55]. Similarly, the Weibull distribution has been commonly used for flood frequency analysis and reliability analysis. The Weibull distribution has two versions of two-parameter and three parameter distributions with the shape parameter (α), scale parameter (β) and location parameter (γ, with γ set to zero yields the two-parameter Weibull distribution). Moreover, the generalized extreme value distribution has been popularly used for flood frequency analyses in the United Kingdom [23]; it has three parameters reflecting on shape (k), the scale (σ), and the location (μ). The extreme value type-II is one of the commonly used probability distributions for modeling extreme events with shape parameter (α), scale parameter (β), and location parameter (γ, γ = 0 yields the two-parameter Frechet distribution). Table 2 presents the candidate probability distribution functions with their parameter bounds.
3.3. Parameter Estimation Methods
In this study, nine commonly used probability distributions are considered to suggest the most suitable model for flood frequency analysis in Ethiopia, particularly in the Upper Blue Nile River Basin. The Hazen and Weibull plotting position relationships are the commonly used approaches in flood frequency analysis [56]; both of these methods satisfy the Gumbel’s [57] five criteria in terms of plotting position relationships. The parameters of the candidate probability distributions considered in this study are estimated using three commonly used methods: the maximum likelihood estimation, the probability weighted moments estimation, and the likelihood moment estimation approaches. The estimated parameters are used to calculate quantile estimates for different return periods or, conversely, to calculate the return period for a given flood magnitude.
The maximum likelihood approach [58] is the commonly used parameter estimation approach. This approach maximizes the likelihood function (L) for the selected annual maximum flows (x) as follows
Note that the first derivative of the function (f) provides the estimated parameters that maximize Equation (1).
The probability weighted moment parameter estimation approach has been recommended for flood sample sizes below 500 [59]; thus, this study adopted this approach for estimating the selected probability distribution functions (F) parameters with annual maximum flow (x) as follows
The likelihood moment parameter estimation approach [60] is the hybrid between likelihood and moment parameter estimation approaches based on the following approach
where n is the sample size, , and .
3.4. Performance Measures
The parameter values of the candidate probability distributions were estimated by the commonly used three parameter estimation approaches: the maximum likelihood estimation, the probability weighted moments estimation, and the likelihood moment estimation approaches. The candidate probability distributions were then evaluated based on the goodness of fit tests that were used to measure the compatibility of annual maximum flow data with each probability distribution function. Moreover, the probability differences plot is used to graphically detect the performance variation of each distribution used in this study. The Anderson–Darling (A2), Kolmogorov–Smirnov (D), and Chi-Squared (χ2) statistical tests are the commonly used methods to check the adequacy of the probability distribution functions for flood frequency analysis [27]; therefore, this study considered these three goodness of fit tests with the root mean square error (RMSE) method to investigate the robust probability distribution function for flood frequency analysis in the Blue Nile River Basin. In general, to investigate the robust probability distribution function for the study region, the best probability distribution fit ranking approach was considered that the robust distribution should perform satisfactorily at all spatial scales considered in this study. The probability distribution with the lowest sum of rankings considering all performance metrics at all gauging stations is considered to be the robust probability. The Anderson–Darling (A2), Kolmogorov–Smirnov (D), and Chi-Squared (χ2), and RMSE performance measure values can be computed as follows
where Fi is the empirical distribution function, Fx is the tested distribution function, Qmax,i is a sample maximum flow value, x is a calculated maximum flow value for the selected distribution function, n is a sample size, k is the number of bins, Oi is the observed frequency for bin i, and Ei is the expected frequency for bin i.
4. Results and Discussion
4.1. Application of the Probability Distribution Functions
The parameters of the candidate probability distribution functions considered in this study were estimated using nine of the probability distribution functions. To this end, the maximum likelihood method proved to be good for the EV2 (frechet - 3P), the three-parameter gamma, the generalized gamma, the four-parameter generalized gamma, the beta, the three-parameter lognormal, and the three-parameter Weibull distributions; whereas the probability-weighted moments yielded the best parameter values for the generalized extreme value and Log-Pearson type-III distributions. Figure 3 presents the probability density functions of all candidate distributions computed at each gauging station considered in this study. The probability density function can be used to visually detect the deviation of the predicted quantile from the actual data. The actual and predicted quantiles at the Gilgel Abay and Eldiem gauging stations showed negative skewness, whereas the quantiles in the remaining gauging stations were observed to have a positive skewness. The highest positive skewness was observed at the Megech gauging station, at which the Lognormal and Log-Pearson distributions perform relatively better than the remaining candidate distributions. This indicates that the log-transformation of the highly skewed data could improve the prediction results.
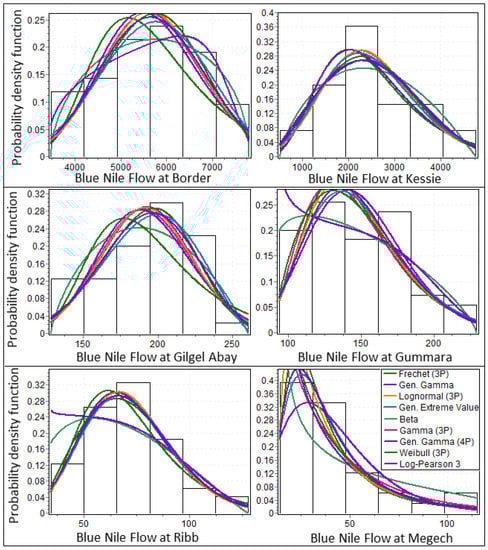
Figure 3.
Probability density functions of the candidate distributions in all gauging stations.
In general, most of the probability distribution functions considered in this study performed relatively better in the large and medium scale basins compared to that of the smaller catchments. In general, it is essential that the flood frequency analysis needs more attention to reduce both the risk of flooding and failure of hydraulic structures as well as to mitigate the flood associated damages in the study region. Therefore, this study infers that a comprehensive flood frequency analysis that aims to investigate the robust probability distribution function in the study region could improve our understanding of the possible future probable flood that leads to the efficient planning and design of hydraulic structures.
4.2. Goodness of Fit Test Statistics
The three goodness of fit test statistics were computed for each probability distribution function at six gauging stations (i.e., Eldiem, Kessie, Gilgel Abay, Gummara, Megech, and Ribb). The goodness of fit test statistics proved that all the candidate probability distributions can be used for flood frequency analyses in the study region with an acceptable fit value that measured at the significance level (alpha) of 0.2. Figure 4 presents the rank of the candidate probability distributions for each gauging station using the three goodness of fit test statistic values. Based on the Kolmogorov–Smirnov test statistic values, the generalized extreme value distribution ranked first at Ribb, Kessie, and Gilgel Abay stations, the beta ranked first at Eldiem (Border) station, the generalized gamma ranked first at the Gummara station, and the lognormal (3P) performed better than the other candidate distributions at Megech station. Similarly, based on the Anderson–Darling test statistic values, the generalized extreme value distribution performed best at both the large and medium scale basins (Eldiem and Kessie), whereas the Weibull (3P) performed better than the other candidate probability distributions at the small scale basins (Gilgel Abay and Gummara). Moreover, the Log-Pearson type-III and lognormal (3P) distributions proved to be the best at Ribb and Megech stations, respectively. Using the Chi-Squared test statistic values, the frechet (3P), gamma (3P), generalized extreme value, and Weibull (3P) distributions were found to be the best at Megech, Gummara, Kessie and Ribb stations, respectively. Conversely, the generalized gamma distribution performed better than the other candidate distributions both at the Eldiem and Gilgel Abay stations based on the Chi-Squared test statistic. Based on the overall analyses (three test statistics and six stations), the generalized extreme value distribution proved to be the robust distribution for flood frequency analysis over different spatial scales in the study region. The generalized extreme value distribution provides satisfactory results in all spatial scales considered in this study. Conversely, the performance of the remaining probability distributions in the six gauging stations varied largely; their performance was dependent on the annual flow magnitudes.
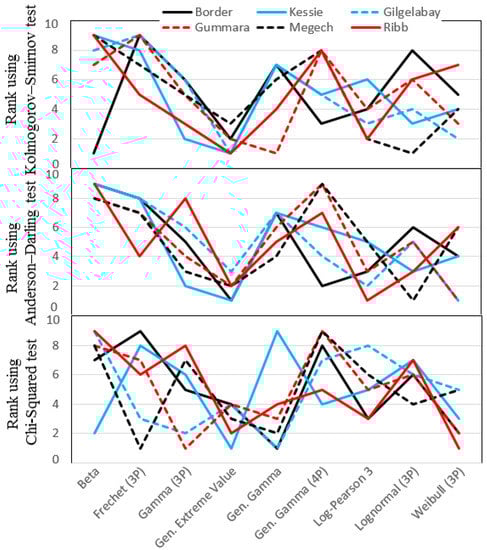
Figure 4.
Plot shows the rank of each probability distribution function computed with three goodness of fit test statistics at all selected gauging stations in the Blue Nile River Basin.
4.3. Discussion
The probability distribution with the lowest sum of rankings in view of the three goodness of test statistic values at all gauging stations (three test statistics and six test stations) is considered to be the robust probability distribution for flood frequency analysis in the Blue Nile River Basin. In this direction, the generalized extreme value distribution proved to be the best for flood frequency analysis in the study region based on the Kolmogorov–Smirnov and Anderson-Darling test statistics, whereas both the generalized extreme value distribution and Weibull (3P) were found to be the best probability distributions based on the Chi-Squared test statistic. Thus, the results showed the robustness of the generalized extreme value distribution for flood frequency analysis over different spatial scales in the Blue Nile River Basin.
This study further compared the performances of the candidate probability distributions using the RMSE to support the results with the three goodness of fit test statistics. Figure 5 presents the stacked bar plots of the RMSE for each probability distribution evaluated at six gauging stations. Again, the generalized extreme value distribution proved to be the best distribution to predict the flood quantiles in all spatial scales considered in this study. The generalized extreme value distribution improved the flood quantile prediction performances obtained by the Frechet (3P), generalized gamma, gamma (3P), lognormal (3P), beta, Log-Pearson 3, Webull (3P), and generalized gamma (4P) probability distributions, respectively, by 67.91%, 39.64%, 22.01%, 20.41%, 16.18%, 12.81%, 8.15%, and 5.84%. The largest cumulative RMSE was observed with the frechet (3P) with value reaches ~691.62 m3/s, while the minimum cumulative RMSE (second to the generalized extreme value distribution) was observed with the generalized gamma (4P) with values of ~235 m3/s. In general, based on the overall results, it can be concluded that the generalized extreme value distribution can be considered as the robust probability distribution function for flood frequency analysis in the Blue Nile River Basin.
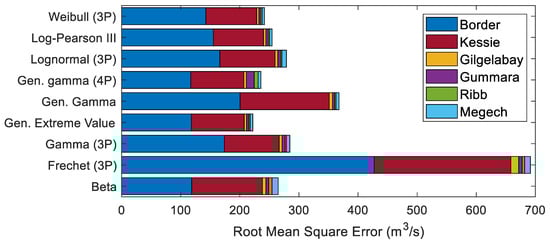
Figure 5.
The root mean square error (RMSE) values of the candidate distributions in each gauging station.
Figure 6 and Figure 7 present the quantile estimates for each site with 95% confidence limits using the generalized extreme value distribution. Note that the predicted quantiles at each spatial scale could be essential for the efficient design of hydraulic structures in the study region. The flood frequency curve for different spatial scales might not be the same since the large scale basin may respond more to the larger-scale dynamics generated by heavy monsoon rains in the region, whereas the small scale basins may respond more to the local flash flood events. Thus, developing a flood frequency curve considering different basin spatial scales might improve our understanding of the probable flood for different return periods. This approach could be used for the efficient planning and design of hydraulic structures in the study region in view of minimizing the risk associated with the estimation of peak design discharges. From the analysis, the flood prediction uncertainty for the Megech and Ribb gauging stations was relatively higher than that of the remaining stations. In general, the flood prediction uncertainty was observed to be minimum in the medium and large basin spatial scales compared to that of the error in the small-basin spatial scales.
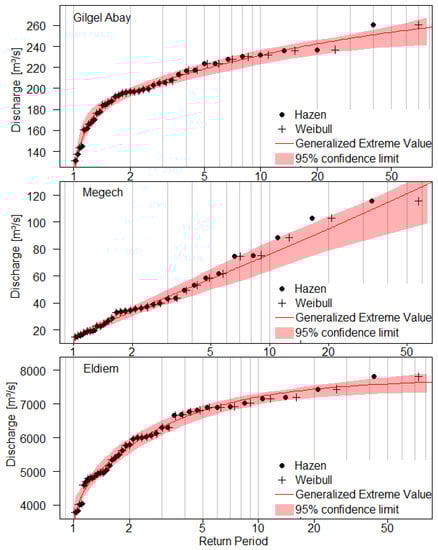
Figure 6.
The flood frequency curves with 95% confidence limits for Gilgel Abay (top), Megech (middle), and Eldiem (bottom) gauging stations.
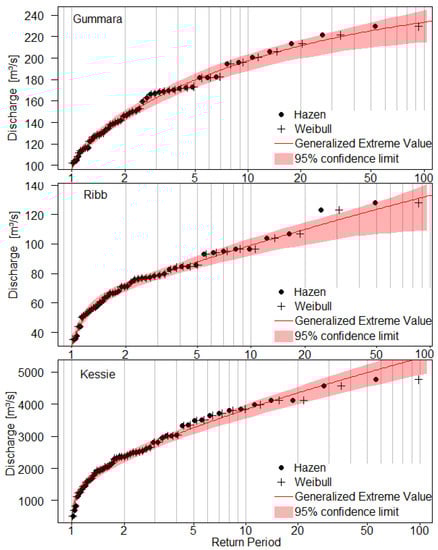
Figure 7.
The flood frequency curves with 95% confidence limits for Gummara (top), Ribb (middle), and Kessie (bottom) gauging stations.
To suggest the robust probability distribution in the Blue Nile River Basin, this study adopted three goodness-of-fit tests: the Anderson–Darling, Kolmogorov–Smirnov, and Chi-Squared statistical tests. However, a major limitation of the present study is that the most suitable probability distribution identified in this study might be different if more goodness-of-fit tests were considered. For example, Haddad et al. [60] considered the Akaike information criterion, Bayesian information criterion, and Anderson–Darling criterion for investigating the most suitable probability distribution function in Australia. They reported that the Anderson–Darling criterion proved to be the best for identifying the most suitable probability distribution compared to the Akaike and Bayesian information criterions for three-parameter distributions. Conversely, the Akaike and Bayesian information criterions were observed to be better than Anderson–Darling criterion for identifying the best probability distribution from two-parameter distributions. Chen et al. [7] also compared eight probability distributions considering hypothesis tests and information-based criteria for identifying the best flood frequency prediction model in the Thames River from the United Kingdom, Wabash River from the United States of America, and both the Beijing River and Huai River from China. They reported that the information-based criteria perform better than that of the hypothesis test methods for identifying the most suitable probability distribution function. In addition, for future study, an alternative flood frequency model such as the multivariate probability approach, which characterizes the simultaneous behavior of flood characteristics (i.e., flood peak, volume and duration), as well as different parameter estimation approaches (e.g., harmonic search, maximum entropy and neural network), should be investigated. Therefore, this study recommends that significant efforts should be devoted to investigating the most suitable probability distribution with a similar approach in the future by considering the major limitations of this study.
5. Conclusions
This study investigated the robust probability distribution function for flood frequency analysis over different basin spatial scales in the Upper Blue Nile River Basin. The commonly used annual maximum flow method was used to investigate the robust probability distribution among nine commonly used probability distributions. In this study, six streamflow gauging sites with different basin spatial scales were considered to check the performance evolution of the probability distribution functions with varying spatial scales. Of six gauging stations, four were considered to represent the small basin spatial scale, whereas one gauging station was considered for the medium and large basin spatial scales. The performances of the candidate probability distributions were assessed using the Anderson–Darling, Kolmogorov–Smirnov, and Chi-Squared statistical tests to check the adequacy of the models in predicting the flood quantiles at each station. The root mean square error was also considered to define the best fit probability distribution for each gauging station. This study also assessed the performance evolution of the selected probability distributions with spatial scales by considering three different basins scales of small-, medium-, and large-scale basins in the Blue Nile River Basin. The flood frequency curve in different basin spatial scales in the Blue Nile River Basin might not be the same, since the large-scale basin may respond more to the larger scale dynamics, whereas the small-scale basins may respond more to the local flash flooding. Thus, flood frequency analyses considering different basin spatial scales might improve our understanding of the flood dynamics in the study region.
Based on the overall analyses, the generalized extreme value distribution was found to be the robust probability distribution for flood frequency analysis over different basin spatial scales in the Blue Nile River Basin; this probability distribution was frequently found to be the highest ranked model for most of the selected stations based on the Anderson–Darling, Kolmogorov–Smirnov, and Chi-Squared statistical tests. As per the root mean square error evaluation criteria, the generalized extreme value and generalized gamma (4P) distributions, respectively, were found to be the first- and second-best probability distributions for predicting the annual maximum flow in all gauging stations. The root mean square error improvement with the generalized extreme value distribution was observed to vary between 5.84% over the generalized gamma (4P) and 67.91% over the frechet (3P). In general, it can be concluded from the overall results that the generalized extreme value distribution proved to be the robust model for flood frequency analysis over different basin spatial scales in the study region. The findings of this study could be used for the efficient planning and design of hydraulic structures that were used to minimize the risk associated with the destructive nature of the flood. Conducting similar flood frequency analyses in the other major river basins of Ethiopia is suggested.
Author Contributions
Conceptualization, G.T.; methodology, G.T., A.M.M., D.H.A, and A.W.W.; software, G.T.; validation, G.T., A.M.M., D.H.A., and A.W.W.; formal analysis, G.T., A.M.M., D.H.A., and A.W.W.; investigation, G.T., A.M.M., D.H.A, and A.W.W.; resources, G.T., A.M.M., D.H.A., and A.W.W.; data curation, G.T., A.M.M., D.H.A, and A.W.W.; writing—original draft preparation, G.T.; writing—review and editing, A.M.M., D.H.A., and A.W.W.; visualization, G.T., A.M.M., D.H.A., and A.W.W. All authors have read and agreed to the published version of the manuscript.
Funding
This research received no external funding.
Acknowledgments
The observed discharge data from six gauging stations used in this paper were collected from the Ethiopian Ministry of Water, Irrigation, and Energy.
Conflicts of Interest
The authors declare that there is no conflict of interest associated with the publication of this manuscript.
References
- Tegegne, G.; Kim, Y.-O. Modelling ungauged catchments using the catchment runoff response similarity. J. Hydrol. 2018, 564, 452–466. [Google Scholar] [CrossRef]
- Hailegeorgis, T.T.; Alfredsen, K. Regional flood frequency analysis and prediction in ungauged basins including estimation of major uncertainties for mid-Norway. J. Hydrol. Reg. Stud. 2017, 9, 104–126. [Google Scholar] [CrossRef]
- Tegegne, G.; Kim, Y.-O. Strategies to enhance the reliability of flow quantile prediction in the gauged and ungauged basins. River Res. Appl. 2020, 36, 724–734. [Google Scholar] [CrossRef]
- Tegegne, G.; Kim, Y.-O.; Seo, S.B.; Kim, Y. Hydrological modelling uncertainty analysis for different flow quantiles: A case study in two hydro-geographically different watersheds. Hydrol. Sci. J. 2019, 64, 473–489. [Google Scholar] [CrossRef]
- Ouarda, T.; Cunderlik, J.M.; St-Hilaire, A.; Barbet, M.; Bruneau, P.; Bobée, B. Data-based comparison of seasonality-based regional flood frequency methods. J. Hydrol. 2006, 330, 329–339. [Google Scholar] [CrossRef]
- Tegegne, G.; Park, D.K.; Kim, Y.-O. Comparison of hydrological models for the assessment of water resources in a data-scarce region, the Upper Blue Nile River Basin. J. Hydrol. Reg. Stud. 2017, 14, 49–66. [Google Scholar] [CrossRef]
- Chen, X.; Shao, Q.; Xu, C.-Y.; Zhang, J.; Zhang, L.; Ye, C. Comparative study on the selection criteria for fitting flood frequency distribution models with emphasis on upper-tail behavior. Water 2017, 9, 320. [Google Scholar] [CrossRef]
- Dong, Q.; Zhang, X.; Lall, U.; Sang, Y.-F.; Xie, P. An improved nonstationary model for flood frequency analysis and its implication for the Three Gorges Dam, China. Hydrol. Sci. J. 2019, 64, 845–855. [Google Scholar] [CrossRef]
- Engeland, K.; Wilson, D.; Borsányi, P.; Roald, L.; Holmqvist, E. Use of historical data in flood frequency analysis: A case study for four catchments in Norway. Hydrol. Res. 2018, 49, 466–486. [Google Scholar] [CrossRef]
- Gharib, A.; Davies, E.G.R.; Goss, G.G.; Faramarzi, M. Assessment of the combined effects of threshold selection and parameter estimation of Generalized Pareto Distribution with applications to flood frequency analysis. Water 2017, 9, 692. [Google Scholar] [CrossRef]
- Kim, S.U.; Son, M.; Chung, E.-S.; Yu, X. Effects of Non-Stationarity on Flood Frequency Analysis: Case Study of the Cheongmicheon Watershed in South Korea. Sustainability 2018, 10, 1329. [Google Scholar] [CrossRef]
- Langat, P.K.; Kumar, L.; Koech, R. Identification of the most suitable probability distribution models for maximum, minimum, and mean streamflow. Water 2019, 11, 734. [Google Scholar] [CrossRef]
- Rizwan, M.; Guo, S.; Xiong, F.; Yin, J. Evaluation of various probability distributions for deriving design flood featuring right-tail events in pakistan. Water 2018, 10, 1603. [Google Scholar] [CrossRef]
- Xiong, F.; Guo, S.; Chen, L.; Yin, J.; Liu, P. Flood frequency analysis using Halphen distribution and maximum entropy. J. Hydrol. Eng 2018, 23, 04018012. [Google Scholar] [CrossRef]
- Yu, G.; Wright, D.B.; Zhu, Z.; Smith, C.; Holman, K.D. Process-based flood frequency analysis in an agricultural watershed exhibiting nonstationary flood seasonality. Hydrol. Earth Syst. Sci. 2019, 23. [Google Scholar] [CrossRef]
- Tegegne, G.; Melesse, A.M. Multimodel Ensemble Projection of Hydro-climatic Extremes for Climate Change Impact Assessment on Water Resources. Water Resour. Manag. 2020, 1–17. [Google Scholar]
- Mallakpour, I.; Villarini, G. The changing nature of flooding across the central United States. Nat. Clim. Chang. 2015, 5, 250–254. [Google Scholar] [CrossRef]
- Vormoor, K.; Lawrence, D.; Schlichting, L.; Wilson, D.; Wong, W.K. Evidence for changes in the magnitude and frequency of observed rainfall vs. snowmelt driven floods in Norway. J. Hydrol. 2016, 538, 33–48. [Google Scholar] [CrossRef]
- Tegegne, G.; Kim, Y.-O. Representing Inflow Uncertainty for the Development of Monthly Reservoir Operations using Genetic Algorithms. J. Hydrol. 2020, 124876. [Google Scholar] [CrossRef]
- Shao, Q.; Wong, H.; Xia, J.; Ip, W.-C. Models for extremes using the extended three-parameter Burr XII system with application to flood frequency analysis/Modèles d’extrêmes utilisant le système Burr XII étendu à trois paramètres et application à l’analyse fréquentielle des crues. Hydrol. Sci. J. 2004, 49. [Google Scholar] [CrossRef]
- Stedinger, J.R.; Griffis, V.W. Flood Frequency Analysis in the United States: Time to Update; American Society of Civil Engineers: Reston, VA, USA, 2008. [Google Scholar]
- Salinas, J.L.; Castellarin, A.; Viglione, A.; Kohnova, S.; Kjeldsen, T.R. Regional parent flood frequency distributions in Europe-Part 1: Is the GEV model suitable as a pan-European parent? Hydrol. Earth Syst. Sci. 2014, 18, 4381. [Google Scholar] [CrossRef]
- Singh, V.P.; Strupczewski, W.G. On the status of flood frequency analysis. Hydrol. Process. 2002, 16, 3737–3740. [Google Scholar] [CrossRef]
- Hosking, J.R.M.; Wallis, J.R. Regional Frequency Analysis: An Approach Based on L-moments; Cambridge University Press: Cambridge, UK, 2005. [Google Scholar]
- Bačová-Mitková, V.; Onderka, M. Analysis of extreme hydrological events on the Danube using the peak over threshold method. J. Hydrol. Hydromech. 2010, 58, 88–101. [Google Scholar] [CrossRef]
- Basu, B.; Srinivas, V.V. Formulation of a mathematical approach to regional frequency analysis. Water Resour. Res. 2013, 49, 6810–6833. [Google Scholar] [CrossRef]
- Bezak, N.; Brilly, M.; Šraj, M. Comparison between the peaks-over-threshold method and the annual maximum method for flood frequency analysis. Hydrol. Sci. J. 2014, 59, 959–977. [Google Scholar] [CrossRef]
- Iacobellis, V.; Fiorentino, M.; Gioia, A.; Manfreda, S. Best fit and selection of theoretical flood frequency distributions based on different runoff generation mechanisms. Water 2010, 2, 239–256. [Google Scholar] [CrossRef]
- Ahilan, S.; Bruen, M.; O’Sullivan, J.J. Influences on flood frequency distributions in Irish river catchments. Hydrol. Earth Syst. Sci. (Hess) 2012, 16, 1137–1150. [Google Scholar] [CrossRef]
- Griffis, V.W.; Stedinger, J.R. Log-Pearson type 3 distribution and its application in flood frequency analysis. I: Distribution characteristics. J. Hydrol. Eng. 2007, 12, 482–491. [Google Scholar] [CrossRef]
- Houessou-Dossou, E.A.Y.; Mwangi Gathenya, J.; Njuguna, M.; Abiero Gariy, Z. Flood Frequency Analysis Using Participatory GIS and Rainfall Data for Two Stations in Narok Town, Kenya. Hydrology 2019, 6, 90. [Google Scholar] [CrossRef]
- Rahman, A.S.; Rahman, A.; Zaman, M.A.; Haddad, K.; Ahsan, A.; Imteaz, M. A study on selection of probability distributions for at-site flood frequency analysis in Australia. Nat. Hazards 2013, 69, 1803–1813. [Google Scholar] [CrossRef]
- Seckin, N.; Haktanir, T.; Yurtal, R. Flood frequency analysis of Turkey using L-moments method. Hydrol. Process. 2011, 25, 3499–3505. [Google Scholar] [CrossRef]
- Chowdhary, H.; Escobar, L.A.; Singh, V.P. Identification of suitable copulas for bivariate frequency analysis of flood peak and flood volume data. Hydrol. Res. 2011, 42, 193–216. [Google Scholar] [CrossRef]
- Dong, N.D.; Agilan, V.; Jayakumar, K.V. Bivariate flood frequency analysis of nonstationary flood characteristics. J. Hydrol. Eng. 2019, 24, 04019007. [Google Scholar] [CrossRef]
- Genest, C.; Favre, A.-C. Everything you always wanted to know about copula modeling but were afraid to ask. J. Hydrol. Eng. 2007, 12, 347–368. [Google Scholar] [CrossRef]
- Guo, A.; Chang, J.; Wang, Y.; Huang, Q.; Guo, Z.; Zhou, S. Bivariate frequency analysis of flood and extreme precipitation under changing environment: Case study in catchments of the Loess Plateau, China. Stoch. Environ. Res. Risk Assess. 2018, 32, 2057–2074. [Google Scholar] [CrossRef]
- Li, T.; Guo, S.; Liu, Z.; Xiong, L.; Yin, J. Bivariate design flood quantile selection using copulas. Hydrol. Res. 2017, 48, 997–1013. [Google Scholar] [CrossRef]
- Salvadori, G.; De Michele, C. Frequency analysis via copulas: Theoretical aspects and applications to hydrological events. Water Resour. Res. 2004, 40. [Google Scholar] [CrossRef]
- Zhang, L.; Singh, V.P. Bivariate flood frequency analysis using the copula method. J. Hydrol. Eng. 2006, 11, 150–164. [Google Scholar] [CrossRef]
- Zhang, L.; Singh, V.P. Trivariate flood frequency analysis using discharge time series with possible different lengths: Cuyahoga river case study. J. Hydrol. Eng. 2014, 19, 05014012. [Google Scholar] [CrossRef]
- Laio, F. Cramer–von Mises and Anderson-Darling goodness of fit tests for extreme value distributions with unknown parameters. Water Resour. Res. 2004, 40. [Google Scholar] [CrossRef]
- de Zea Bermudez, P.; Kotz, S. Parameter estimation of the generalized Pareto distribution—Part I. J. Stat. Plan. Inference 2010, 140, 1353–1373. [Google Scholar] [CrossRef]
- Strupczewski, W.G.; Singh, V.P.; Feluch, W. Non-stationary approach to at-site flood frequency modelling I. Maximum likelihood estimation. J. Hydrol. 2001, 248, 123–142. [Google Scholar] [CrossRef]
- Greenwood, J.A.; Landwehr, J.M.; Matalas, N.C.; Wallis, J.R. Probability weighted moments: Definition and relation to parameters of several distributions expressable in inverse form. Water Resour. Res. 1979, 15, 1049–1054. [Google Scholar] [CrossRef]
- Viglione, A.; Laio, F.; Claps, P. A comparison of homogeneity tests for regional frequency analysis. Water Resour. Res. 2007, 43. [Google Scholar] [CrossRef]
- Kysely, J.; Picek, J. Regional growth curves and improved design value estimates of extreme precipitation events in the Czech Republic. Clim. Res. 2007, 33, 243–255. [Google Scholar] [CrossRef]
- Elamir, E.A.H.; Seheult, A.H. Trimmed L-moments. Comput. Stat. Data Anal. 2003, 43, 299–314. [Google Scholar] [CrossRef]
- Zhang, J. Likelihood moment estimation for the generalized Pareto distribution. Aust. N. Z. J. Stat. 2007, 49, 69–77. [Google Scholar] [CrossRef]
- Molina-Aguilar, J.P.; Gutierrez-Lopez, A.; Raynal-Villaseñor, J.A.; Garcia-Valenzuela, L.G. Optimization of Parameters in the Generalized Extreme-Value Distribution Type 1 for Three Populations Using Harmonic Search. Atmosphere 2019, 10, 257. [Google Scholar] [CrossRef]
- Singh, V.P.; Singh, K. Parameter estimation for log-Pearson type III distribution by POME. J. Hydraul. Eng. 1988, 114, 112–122. [Google Scholar] [CrossRef]
- Singh, V.P.; Guo, H. Parameter estimation for 3-parameter generalized Pareto distribution by the principle of maximum entropy (POME). Hydrol. Sci. J. 1995, 40, 165–181. [Google Scholar] [CrossRef]
- Singh, V.P. Hydrologic synthesis using entropy theory. J. Hydrol. Eng. 2011, 16, 421–433. [Google Scholar] [CrossRef]
- Bobee, B.; Ashkar, F. The Gamma Family and Derived Distributions Applied Inhydrology/Bernard, Bobee and Fahim Ashkar; Water Resources Publications: Littleton, CO, USA, 1991. [Google Scholar]
- Committee, W.R.C.H. Guidelines for Determining Flood Flow Frequency; US Water Resources Council: Reston, VA, USA, 1981; Volume 17. [Google Scholar]
- Haan, C.T. Statistical Methods in Hydrology; The Iowa State University Press: Iowa, IA, USA, 1977. [Google Scholar]
- Gumbel, E.J. Statistics of Extremes; Courier Corporation: Mineola, NY, USA, 2012. [Google Scholar]
- Pickands Iii, J. Statistical inference using extreme order statistics. Ann. Stat. 1975, 3, 119–131. [Google Scholar]
- Hosking, J.R.M.; Wallis, J.R. Parameter and quantile estimation for the generalized Pareto distribution. Technometrics 1987, 29, 339–349. [Google Scholar] [CrossRef]
- Haddad, K.; Rahman, A.; Stedinger, J.R. Regional flood frequency analysis using Bayesian generalized least squares: A comparison between quantile and parameter regression techniques. Hydrol. Process. 2012, 26, 1008–1021. [Google Scholar] [CrossRef]


© 2020 by the authors. Licensee MDPI, Basel, Switzerland. This article is an open access article distributed under the terms and conditions of the Creative Commons Attribution (CC BY) license (http://creativecommons.org/licenses/by/4.0/).