Article

Evaluation of MERRA-2 Precipitation Products Using Gauge Observation in Nepal

1
International Center for Climate and Environment Sciences, Institute of Atmospheric Physics, Chinese Academy of Sciences, P.O. Box 9804, Beijing 100029, China
2
University of Chinese Academy of Sciences, Beijing 100049, China
3
Central Department of Hydrology and Meteorology, Tribhuvan University, Kirtipur, Kathmandu 44613, Nepal
4
Institute of Mountain Hazards and Environment, Chinese Academy of Sciences, Chengdu 610041, China
5
Department of Environmental Science, Patan Multiple Campus, Tribhuvan University, Lalitpur 44700, Nepal
6
Institute of Tibetan Plateau Research, Chinese Academy of Sciences, Beijing 100101, China
7
International Center for Integrated Mountain Development (ICIMOD), Kathmandu 44700, Nepal
8
Kathmandu Centre for Research and Education, Chinese Academy of Sciences-Tribhuvan University, Kirtipur, Kathmandu 44613, Nepal
*
Authors to whom correspondence should be addressed.
Hydrology 2020, 7(3), 40; https://doi.org/10.3390/hydrology7030040
Submission received: 11 June 2020 / Revised: 8 July 2020 / Accepted: 9 July 2020 / Published: 13 July 2020
(This article belongs to the Special Issue Advances in Modelling of Rainfall Fields)

Abstract

:
Precipitation is the most important variable in the climate system and the dominant driver of land surface hydrologic conditions. Rain gauge measurement provides precipitation estimates on the ground surface; however, these measurements are sparse, especially in the high-elevation areas of Nepal. Reanalysis datasets are the potential alternative for precipitation measurement, although it must be evaluated and validated before use. This study evaluates the performance of second-generation Modern-ERA Retrospective analysis for Research and Applications (MERRA-2) datasets with the 141-gauge observations from Nepal between 2000 and 2018 on monthly, seasonal, and annual timescales. Different statistical measures based on the Correlation Coefficient (R), Mean Bias (MB), Root-Mean-Square Error (RMSE), and Nash–Sutcliffe efficiency (NSE) were adopted to determine the performance of both MERRA-2 datasets. The results revealed that gauge calibrated (MERRA-C) underestimated, whereas model-only (MERRA-NC) overestimated the observed seasonal cycle of precipitation. However, both datasets were able to reproduce seasonal precipitation cycle with a high correlation (R ≥ 0.95), as revealed by observation. MERRA-C datasets showed a more consistent spatial performance (higher R-value) to the observed datasets than MERRA-NC, while MERRA-NC is more reasonable to estimate precipitation amount (lower MB) across the country. Both MERRA-2 datasets performed better in winter, post-monsoon, and pre-monsoon than in summer monsoon. Moreover, MERRA-NC overestimated the observed precipitation in mid and high-elevation areas, whereas MERRA-C severely underestimated at most of the stations throughout all seasons. Among both datasets, MERRA-C was only able to reproduce the observed elevation dependency pattern. Furthermore, uncertainties in MERRA-2 precipitation products mentioned above are still worthy of attention by data developers and users.

1. Introduction

Precipitation is an important variable in atmospheric circulation for weather and climatic studies and is the dominant driver of land surface hydrologic conditions [1,2,3,4]. However, precipitation is a complex variable to predict and estimate as it varies highly in space and time due to large-scale atmospheric circulation patterns and the geographic and topographic factors of the region [2,5]. Recent climate change has impacted precipitation distribution and triggered its extremes, such as drought, floods, and soil erosion around the globe [6,7].
The precipitation is one of the crucial factors for causing major environmental changes and disasters, such as drought, floods and landslides across Nepal [8,9,10,11]. Thus, understanding the precipitation patterns and other changes in the hydrometeorological cycle requires high-resolution long-term precipitation records. Rain gauge-based measurement typically provides precise measurement of precipitation on the earth’s surface [12,13]. However, the spatial extent and temporal resolution of rain gauge-based precipitation measurements in the country are inadequate to support the creation of regional precipitation datasets. This is mainly true for high-elevation areas due to the complex geography and remote location [9,14]. Meanwhile, the discontinuity and missing values in meteorological data records even worsened the results and interpretation of precipitation [15]. Consequently, the newly developed climate and weather prediction model (reanalysis) and satellite-based precipitation products (SBPPs) are the potential alternatives to precipitation measurement for the station sparse region [16,17]. However, the existing satellite-based products have limited (short period) period of precipitation records. For example, recent GPM IMERG and TRMM are only available after 1998, and GSMaP product is no exception [18,19,20,21]. PERSIANN products are available for a longer period, although most of the satellite products only provide precipitation data [22]. In contrary, reanalysis product provides comprehensive insights of weather and climate conditions at the regular grid for long periods [23]. These reanalysis datasets assimilate the in situ and remote sensing observations into Numerical Weather Prediction (NWP) model to provide global estimates of land surface, oceanic and atmospheric conditions at different timescale [3]. Therefore, evaluation and validation of reanalysis precipitation products are necessary for the improvement of product quality and hydrometeorological research.
Reanalysis precipitation datasets have been evaluated for different applications around the globe [24,25,26,27,28,29]. The performance of reanalysis precipitation datasets was relatively more reliable and accurate in the flatter regions than that of complex terrains [30]. Different climatic models used in reanalysis datasets may not resolve precipitation in areas of complex topographic relief with drastic elevation changes (e.g., Nepal). The moisture convergence, in such areas, is locally determined and local convective precipitation is strongly dependent upon local thermal forcing of the terrain. The reanalysis datasets (ERA-Interim) overestimated the precipitation over the northern slope of the Himalaya [31]. Whereas, Modern-ERA Retrospective analysis for Research and Applications (MERRA) datasets show more consistent performance to observed precipitation than ERA-Interim and CFSR in a complex topography region of Central Asia [5]. Similarly, MERRA precipitation datasets reproduced observed spatial patterns and their extremes over the United States [32]. The MERRA datasets were more reasonable to capture inter-annual variation and long-term precipitation trends than other reanalysis datasets over the East Asian domain [33].
A comprehensive evaluation and validation of global reanalysis datasets are very limited in Nepal. For example, Barros and Lang [34] evaluated the performance of the National Center for Environmental Prediction (NCPE-NCAR) reanalysis and found that precipitation was consistently underestimated in Marshyangdi river basin (mid-elevation areas of central region) using a limited number of stations. The authors also mentioned that these reanalysis datasets were able to present precipitation trends and spatial variability. Meanwhile, Ichiyanagi et al. [35] found that NCEP datasets showed a positive correlation between monthly, annual and seasonal precipitation with All India-Rainfall (AIR) in western Nepal, while precipitation in eastern Nepal was negatively correlated. However, both studies did not validate or compare their performance concerning observed datasets over the country. Moreover, systematic evaluation of new generation reanalysis product and inter-comparison (spatio-temporal performance) with observed datasets, to date, has not yet been performed in Nepal. Therefore, this study aims to address this research gap by evaluating the performance of second-generation MERRA (MERRA-2) with 141-gauge observations from Nepal. Among the MERRA-2 product, model-only datasets are selected to evaluate the accuracy of MERRA simulation, while gauge calibrated to quantify the performance improvement after the gauge adjustment. The evaluation is based on monthly, seasonal, and annual timescale, spanning the period of 19 years from 2000 to 2018. Further, the evaluation of MERRA-2 precipitation product over unique topographic and climatic regions helps to select these datasets for different hydrometeorological application and identify its tendency and discrepancies, specific weaknesses, and strengths of the product under different circumstances.

2. Materials and Methods
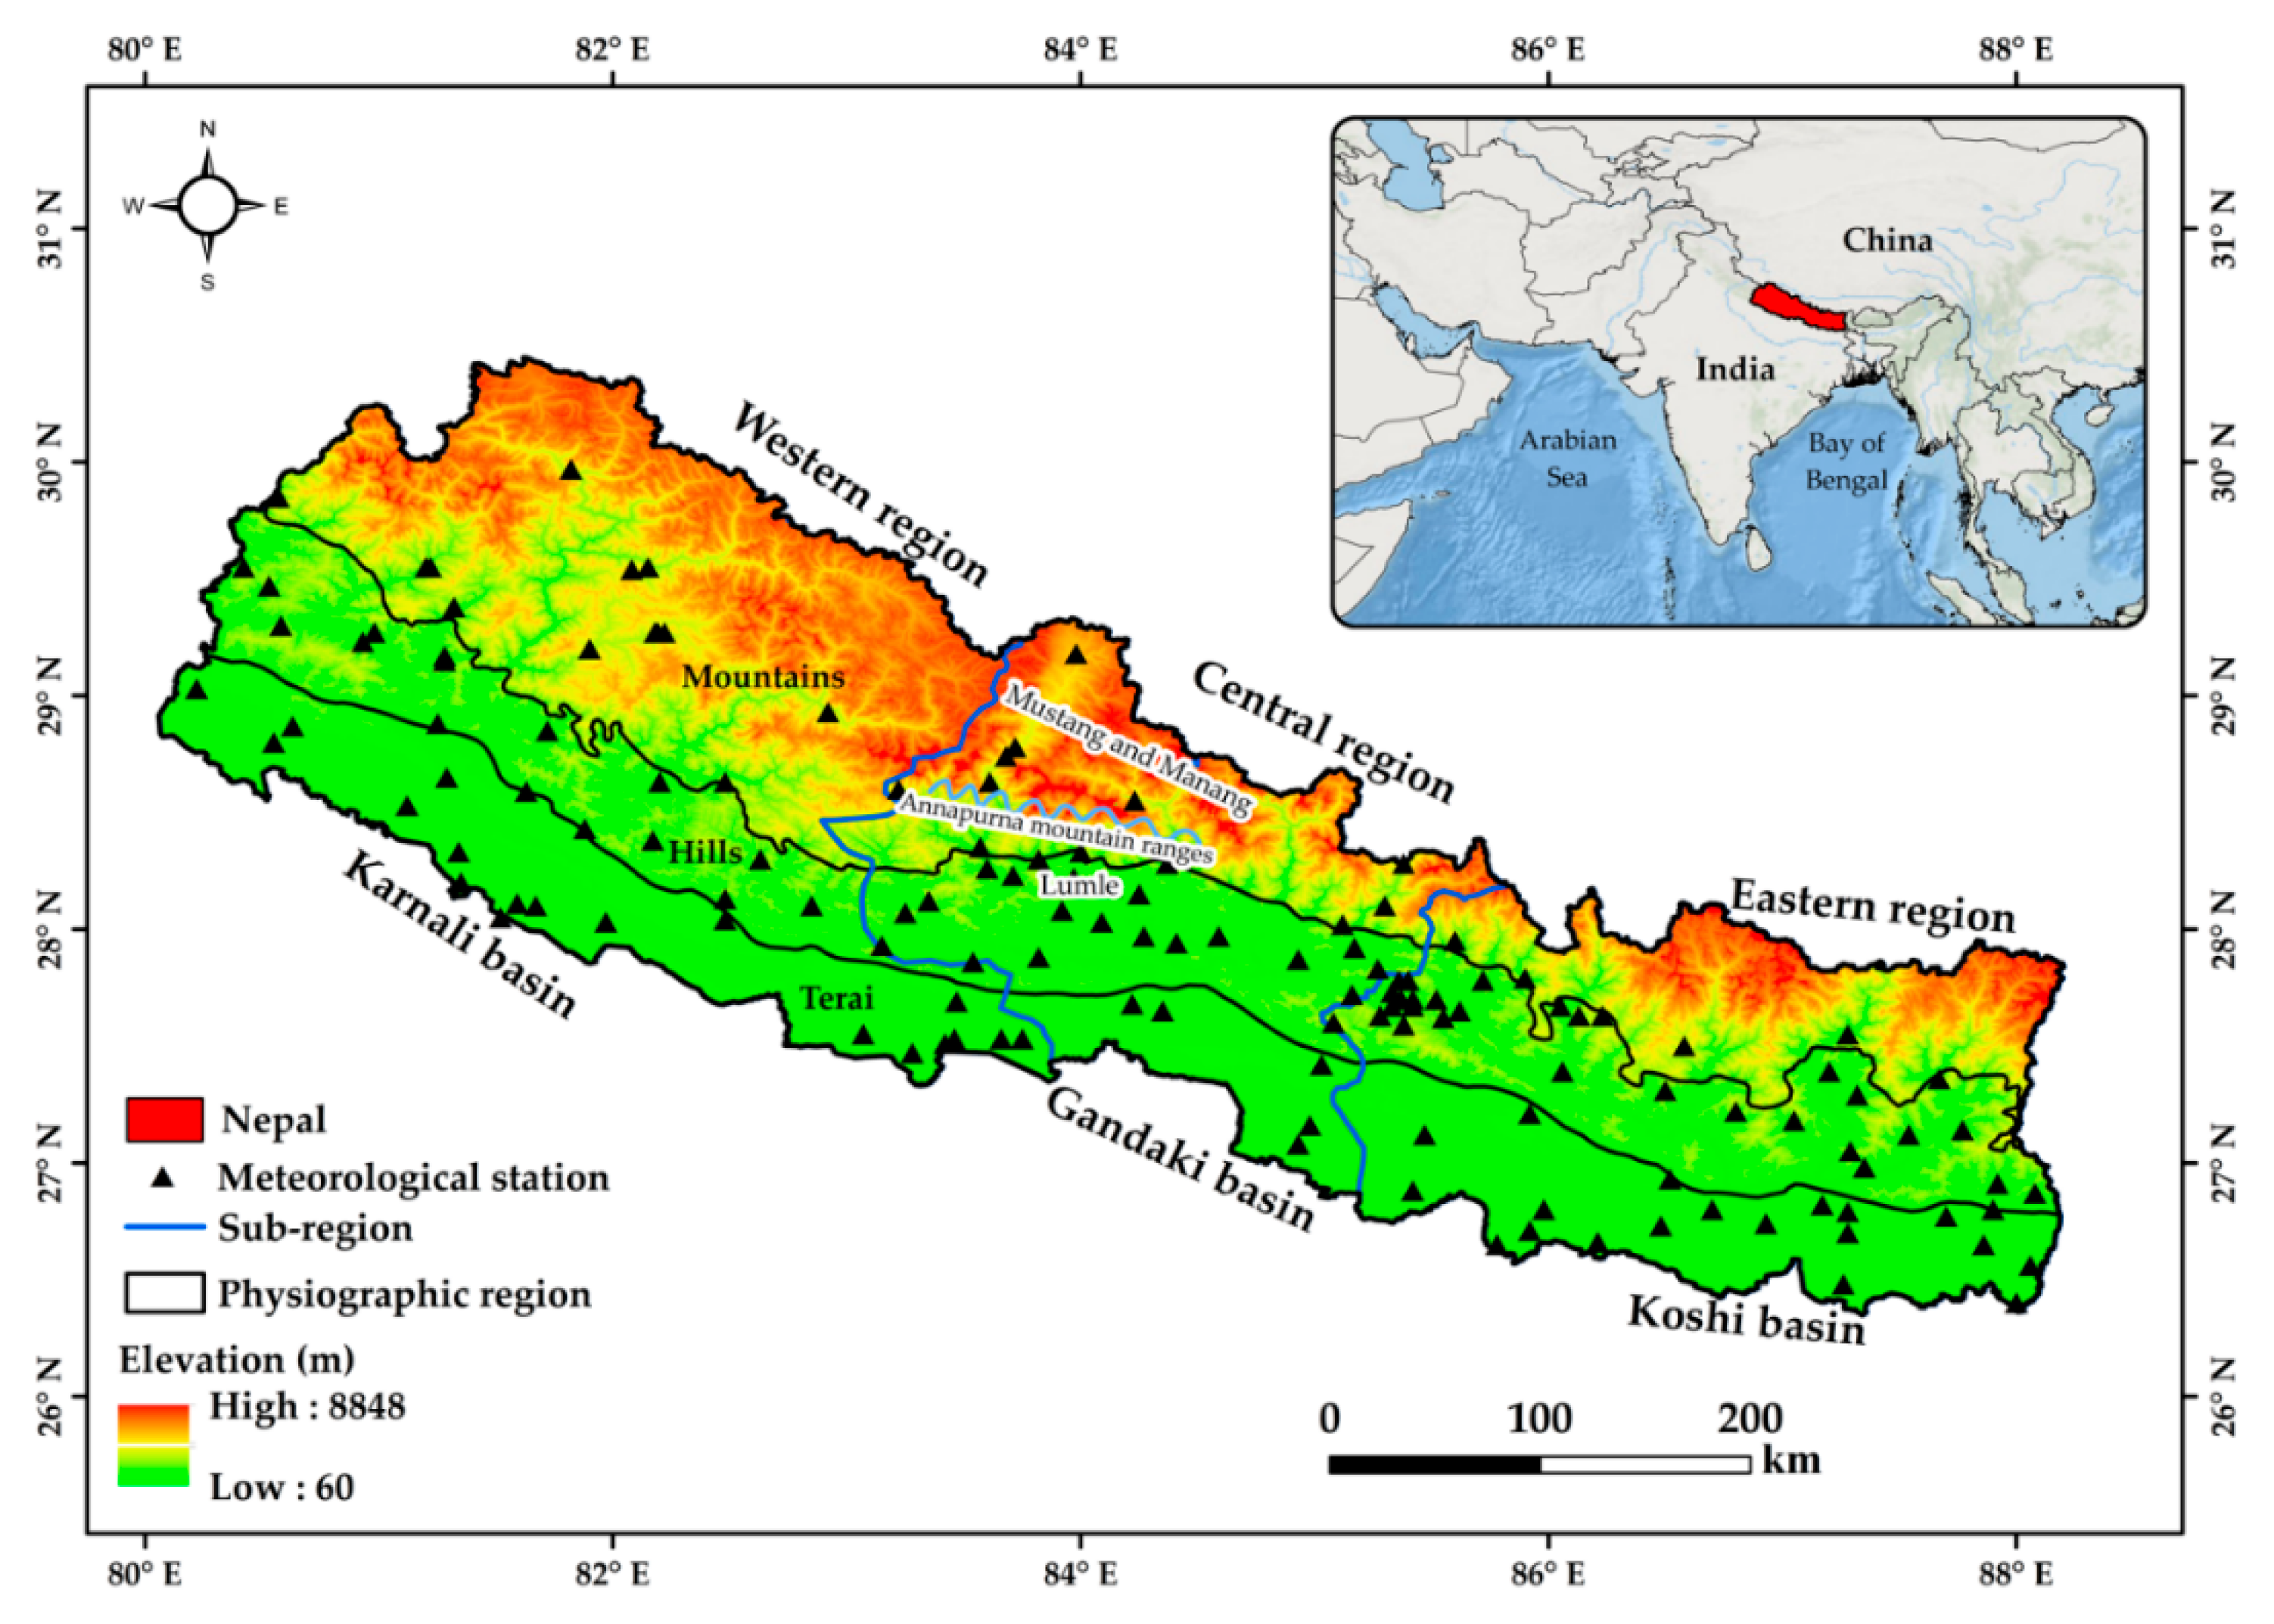
2.1. Study Area

The study area includes the southern slopes of central Himalaya, Nepal. The lowlands (~60 m) in the south to the high Himalayas (up to 8848 m) in the north represent varying landscapes, topography, weather, and vegetation within a small width (average ~192 km) of the country (Figure 1). Nepal is broadly divided into three Ecological zones, named as Terai (Lowland areas), hills, and mountains. The wettest (Lumle) and driest (Mustang and Manang) areas of Nepal are located in the Gandaki river basin. These areas explain how the topography mediates the precipitation distribution, i.e., being located in the windward (Lumle) and leeward (Manang and Mustang) side of the Annapurna mountain ranges [9,36]. The Eastern, Central and Western regions are divided based on three major river basins, namely, Koshi, Gandaki, and Karnali, respectively. Furthermore, the South Asian monsoon and Western disturbances determine the climatology and distribution of the precipitation in Nepal. South Asian monsoon brings widespread precipitation from June to September through the Bay of Bengal, with higher amounts in the Central region than Eastern and Western regions [8,35]. Western disturbances bring precipitation from December to February, which are eastward-moving air currents in mid-latitudes that enter the Western region of Nepal passing through Iran, Afghanistan, Pakistan, and northwest India [37,38]. The average annual precipitation during 1982–2015 in Nepal is 1428 mm [39].

2.2. Datasets

The meteorological station network of Nepal is maintained by the Department of Hydrology and Meteorology (DHM). This network of gauge stations is irregularly distributed [4]; denser on the southern lowlands (below 2500 m elevation) and sparse, especially in the northern mountainous region (above 2500 m elevation), where the terrain is very complex (Figure 1). Such an irregular distribution of network creates an information gap, which ultimately hinders precipitation-related studies over the study areas. Most of the gauge-based datasets are manually collected and are subjected to personnel and instrumental errors [40]. Additional errors for the gauges that are located in high-elevation regions come from the wind effect. Initially, data from 400 stations were collected from DHM (https://www.dhm.gov.np/contents/resources), and quality control was performed for each station; according to WMO standard [41], a year having missing data more than 15% is excluded from the analysis. After quality control, daily data from 141 DHM stations (with ~1044 km2 coverage by single station) were selected from January 2000 to December 2018 for this study.
MERRA is an emerging reanalysis product of the National Aeronautics and Space Administration (NASA) that provides long-term atmospheric and surface records globally [3,42]. MERRA is a modern reanalysis system, which applies advanced numerical models and assimilation schemes to combine gauge observations from multiple sources [42]. Based on the grid to point interpolation, MERRA precipitation product applies three-dimension variational (3D-Var) data assimilation. The second version of the MERRA reanalysis system (MERRA-2) is the latest atmospheric reanalysis of the modern era, produced by NASA’s Global Modeling and Assimilation Office (GMAO) [43]. To provide an advanced product for weather and climate applications, MERRA-2 uses the latest V5 Goddard Earth Observing System Model (GOES) data assimilation with an updated grid to point statistical interpolation system [44,45]. MERRA-2 includes two precipitation datasets, namely PRECTOT (MERRA-NC) and PRECTOTCOR (MERRA-C). MERRA-NC is the model generated precipitation data, while MERRA-C is corrected with CPC Unified Gauge-Based Analysis of Global Daily Precipitation (CPCU) product and the CPC Merged Analysis of Precipitation (CMAP) based precipitation product. With such an advanced and updated data assimilation system, MERRA-2 can be a good alternative to monitor precipitation and hydrological application in the unique physiographic region, where the station is very sparse. This study applies to mean monthly total precipitation (M2TMNXFLX) MERRA-2 data, with a spatial resolution of 0.50° × 0.625°, which was downloaded from NASA’s website (https://disc.gsfc.nasa.gov/datasets/M2TMNXFLX).

2.3. Methodology

Observed precipitation datasets are in point scale (station), while both MERRA-2 datasets provide precipitation at a 0.5 km grid box. The complex topographic gradients and heterogeneous distribution of rain gauge station within the study region restrain the accurate rainfall interpolation [46]. Thus, the point-to-pixel method was adopted to compare rain gauge observation with grid-based MERRA-2 datasets [47,48,49,50]. Grid-based precipitation datasets were extracted to rain-gauge station location using the original resolution of MERRA-2, instead of interpolating the gauge observations to avoid accumulating additional errors by gridding the observed data [51,52]. Meanwhile, stations falling under the same grid were averaged for better representation of the pixel precipitation with station-based datasets.
Observed datasets are in daily timescale, while MERRA-2 in the monthly timescale. To make consistent timescale at each station, monthly data are computed for the station with the availability of more than 25 days of precipitation data in a month; else, the precipitation in a particular month is considered a missing value. If the corresponding monthly data was missing from the observed datasets, then the monthly precipitation data from MERRA-2 were also considered as a missing value for consistency. The number of rain gauge with complete data series in each year during the study period are presented in Figure S1.
Mean, annual and seasonal precipitation (pre-monsoon, summer monsoon, post-monsoon, and winter season) of the observed and both MERRA-2 datasets were calculated for each station. Further, spatial consistency was performed by comparing the spatial distribution of mean precipitation at different seasons, while for temporal consistency, monthly time-series, and annual cycle of precipitation in all datasets are analyzed, respectively. Similarly, both of these datasets are compared for different elevation bins to quantify the performance from low-elevation to high-elevation areas. Additionally, two percentile-based precipitation indices (95th and 5th percentile threshold values of observed datasets at each station) were calculated for different seasons. The total frequency of very wet events (R95p) and very dry (R5p) events [53,54] is relevant for floods and agriculture management (drought) over the region, respectively. The bias in the frequency of these two percentile indices (R95p and R5p) for MERRA-2 product were calculated for each station.
Four different statistical metrics were calculated to quantify the performance of MERRA-2 datasets (Equations (1)–(4)). The Root Mean Square Error (RMSE) measures the average magnitude of the deviation of MERRA-2 dataset from the observed data. Bias (difference) measures any persistent tendency of a dataset to either overestimate or underestimate; correlation coefficient (R) reflects the strength and direction of the linear association between datasets; Nash–Sutcliffe efficiency (NSE) determines the relative magnitude of the residual variance (noise) compared to the observed data variance. RMSE and Bias Equations (1) and (2) indicate a perfect match between observed and predicted values when it equals to 0, with increasing RMSE and mean bias (MB) values indicating an increasingly poor consistency. The NSE Equation (3) ranges between −∞ and 1 and 1 being a perfect score. The R-value in Equation (4) ranges between 0 and 1, with higher values indicating less error variance.
RMSE = i = 1 n ( E i O i ) 2 n
MB = ( E ¯ O ¯ ) n
NSE = 1 i = 1 n ( O i O ¯ ) 2 i = 1 n ( E i O i ) 2 i = 1 n ( O i O ¯ ) 2
R = i = 1 n ( O i O ¯ ) ( E i E ¯ ) i = 1 n ( O i O ¯ ) 2 i = 1 n ( E i E ¯ ) 2
where, O is the observed data, E is the estimated precipitation by both MERRA-2 datasets, and n is the sample size.

3. Results

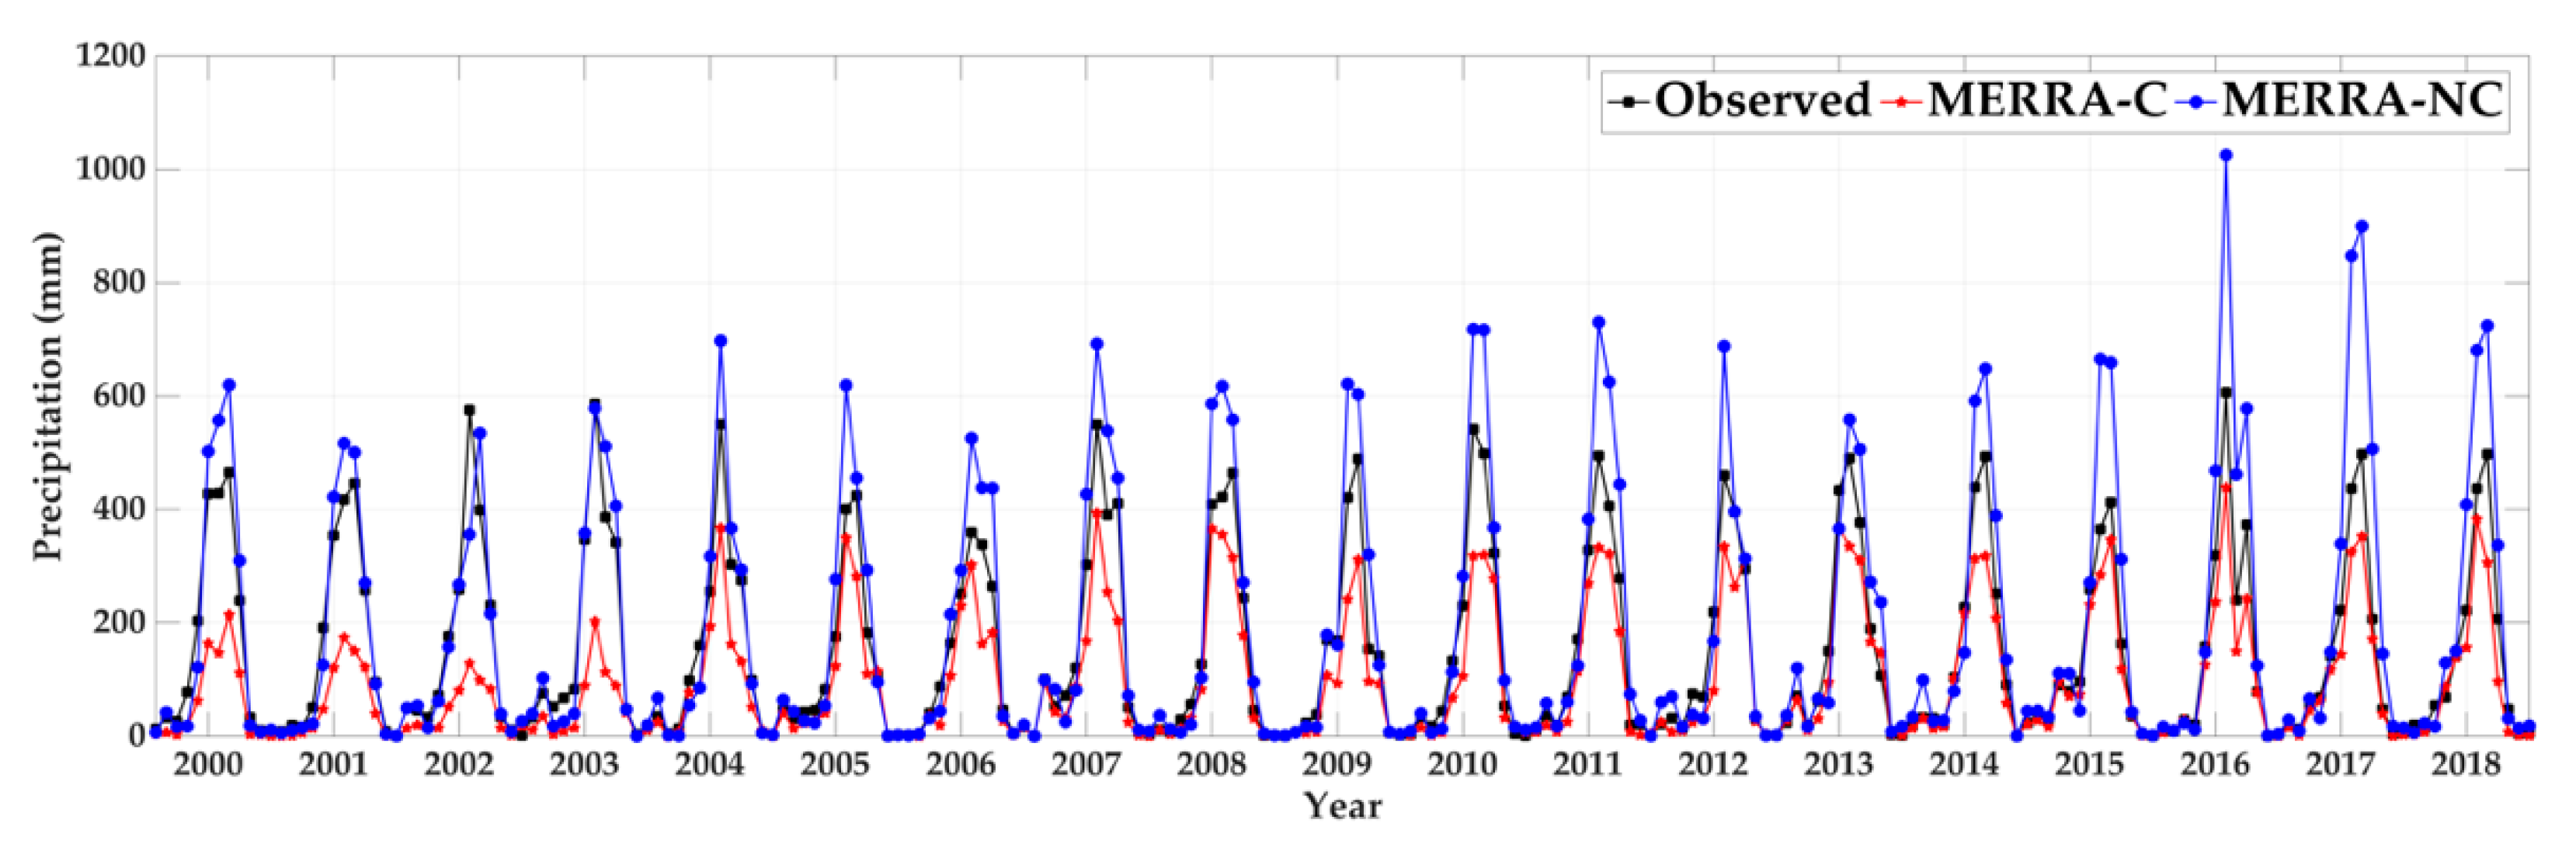
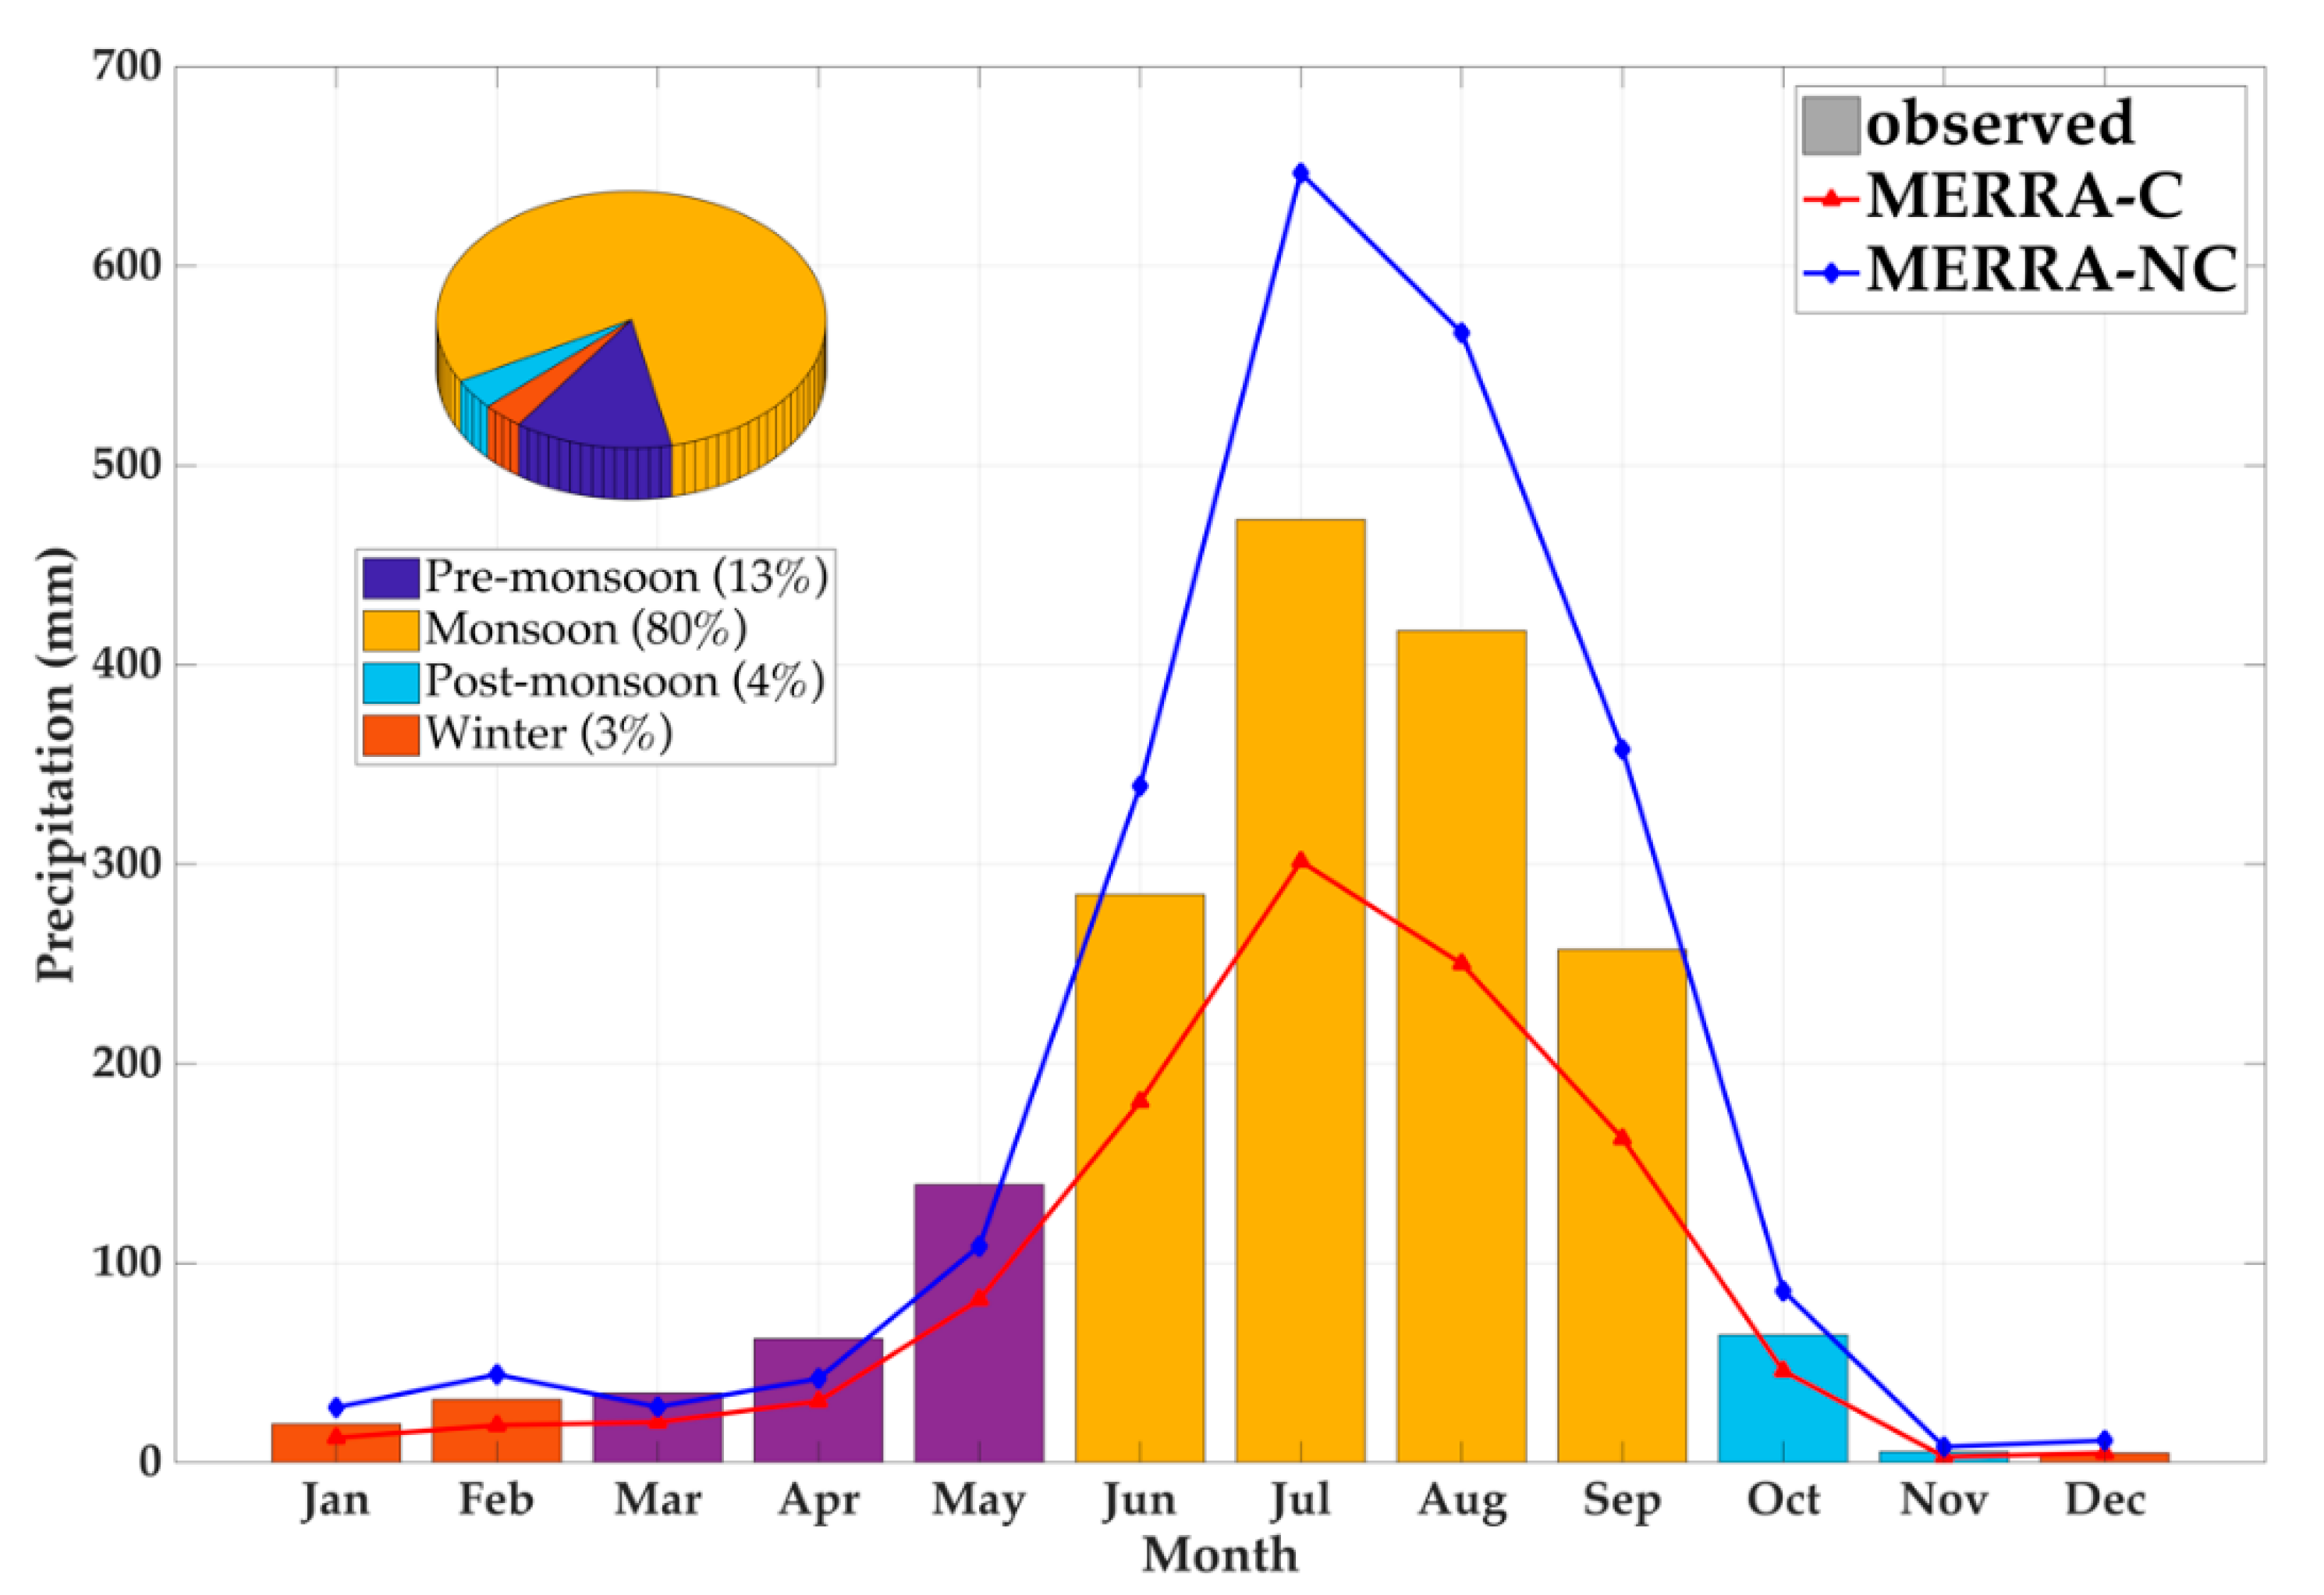
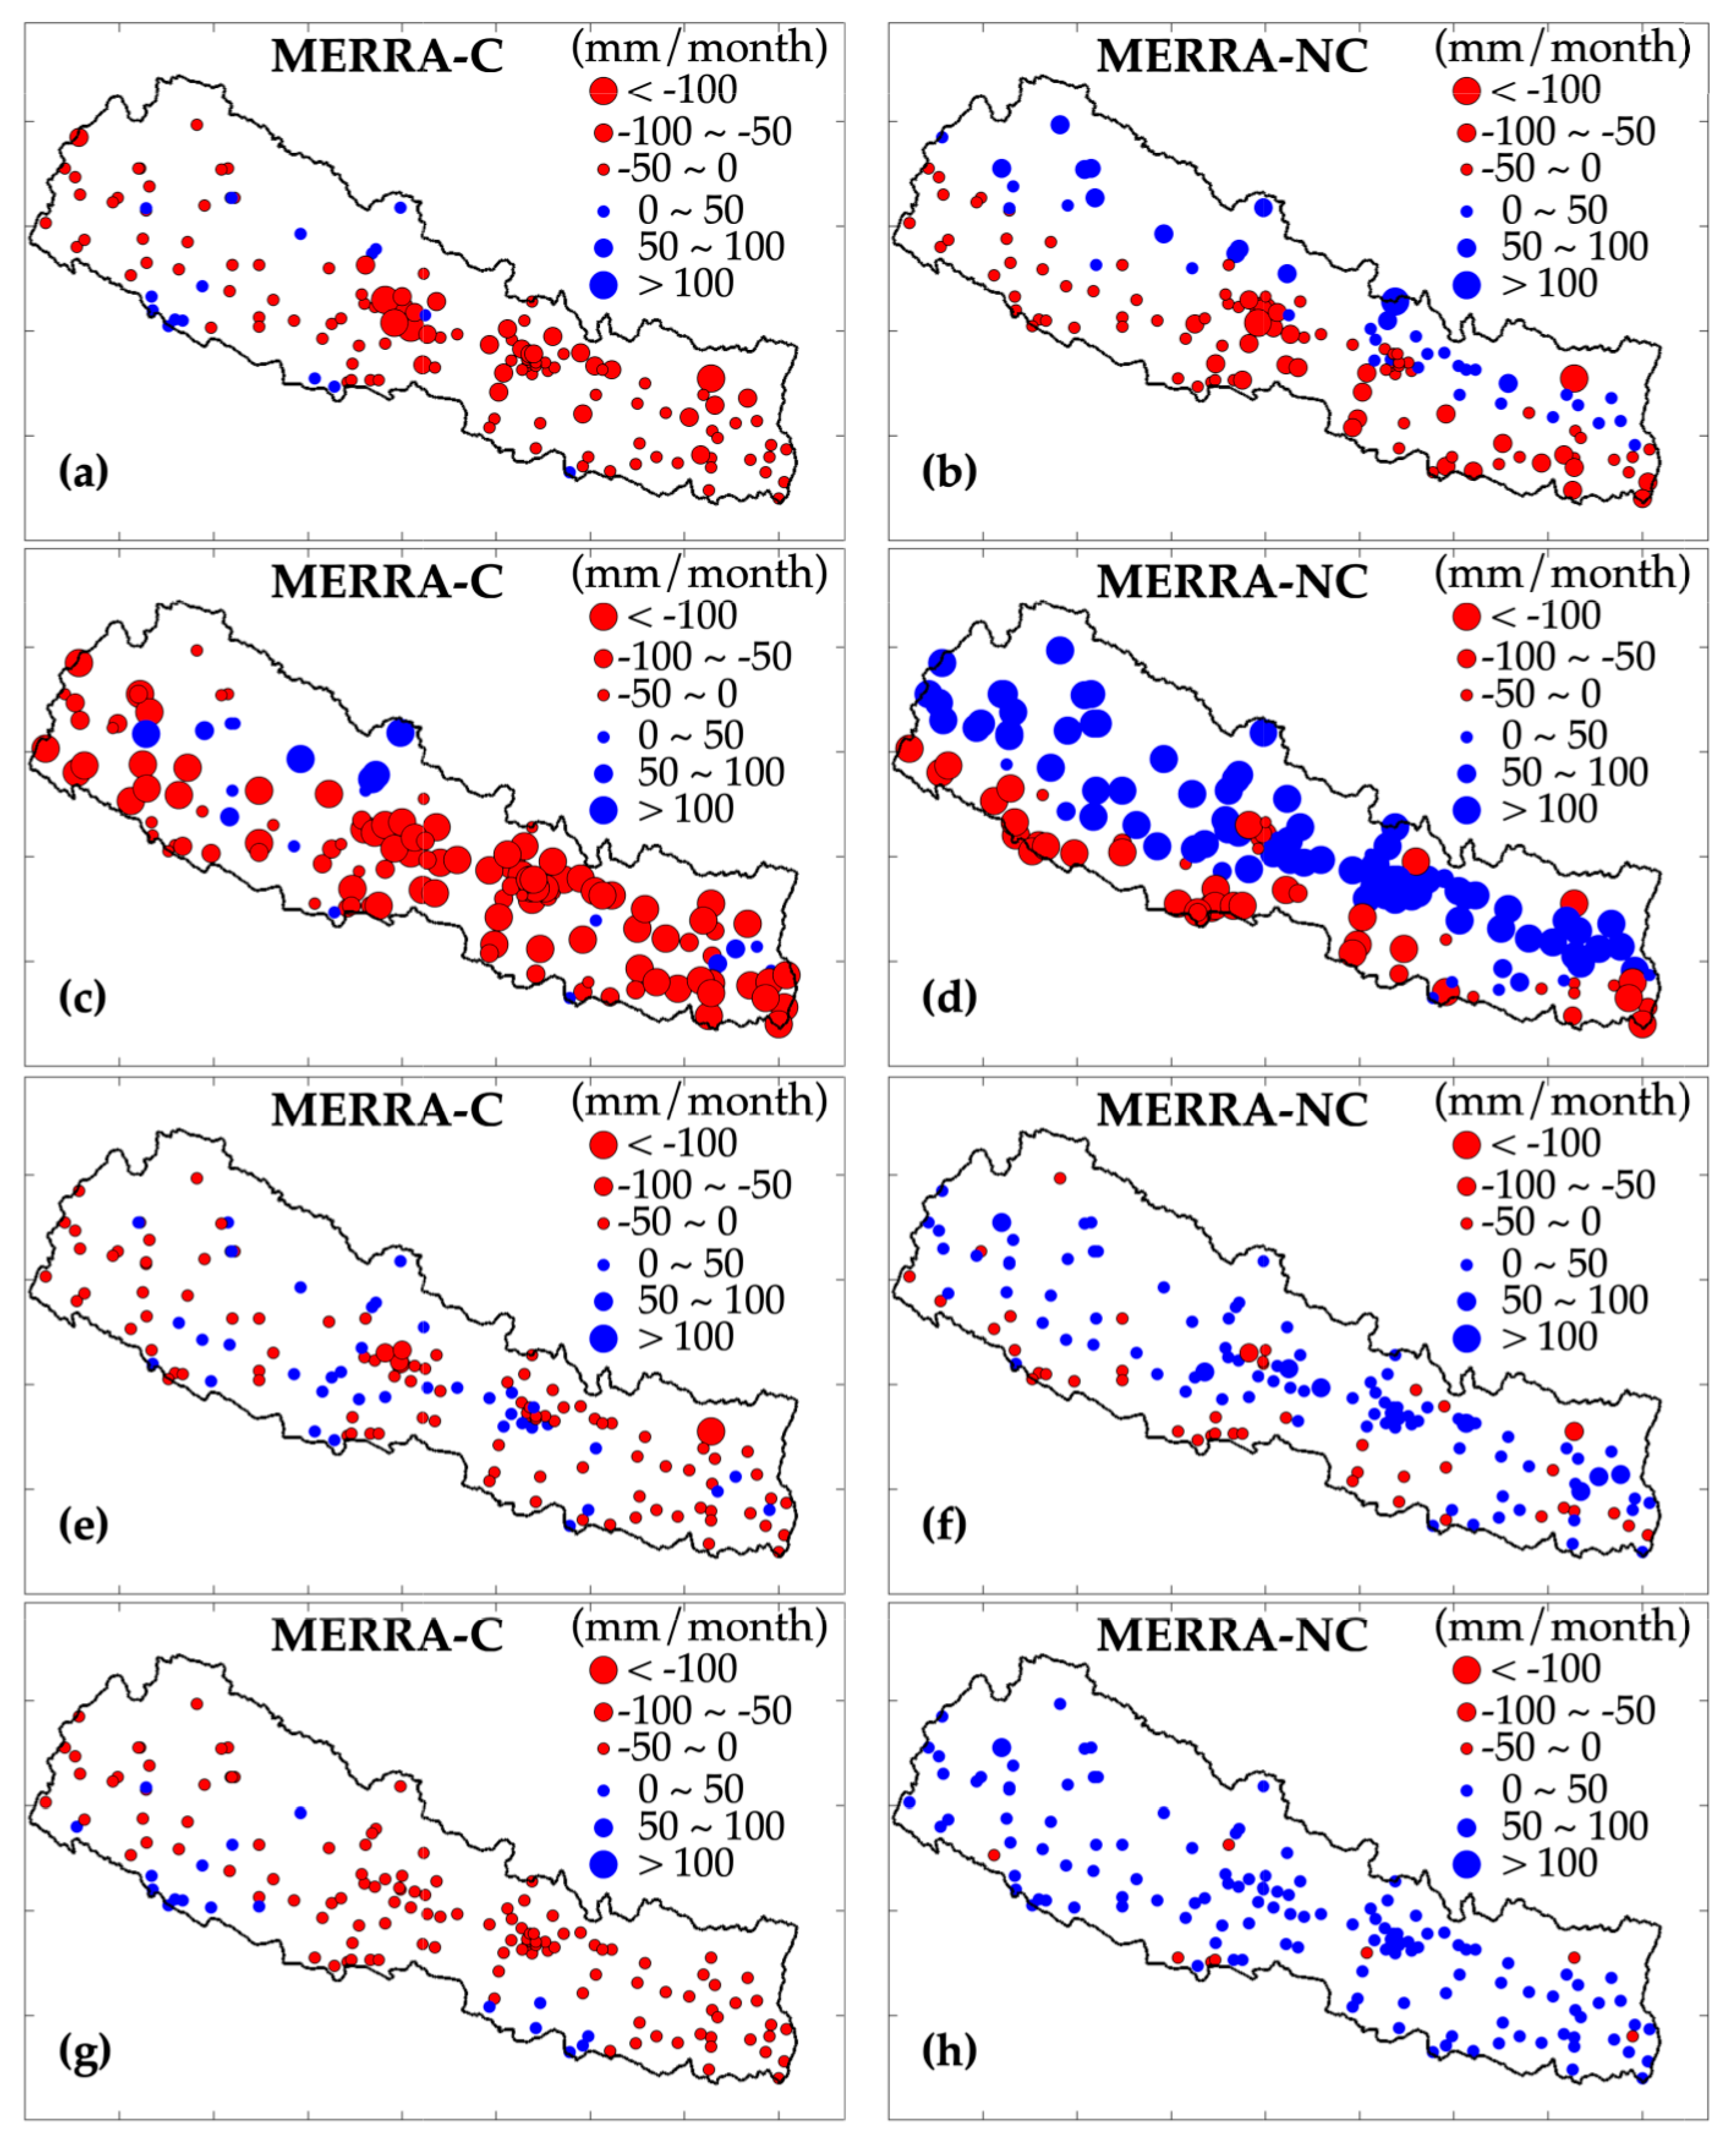
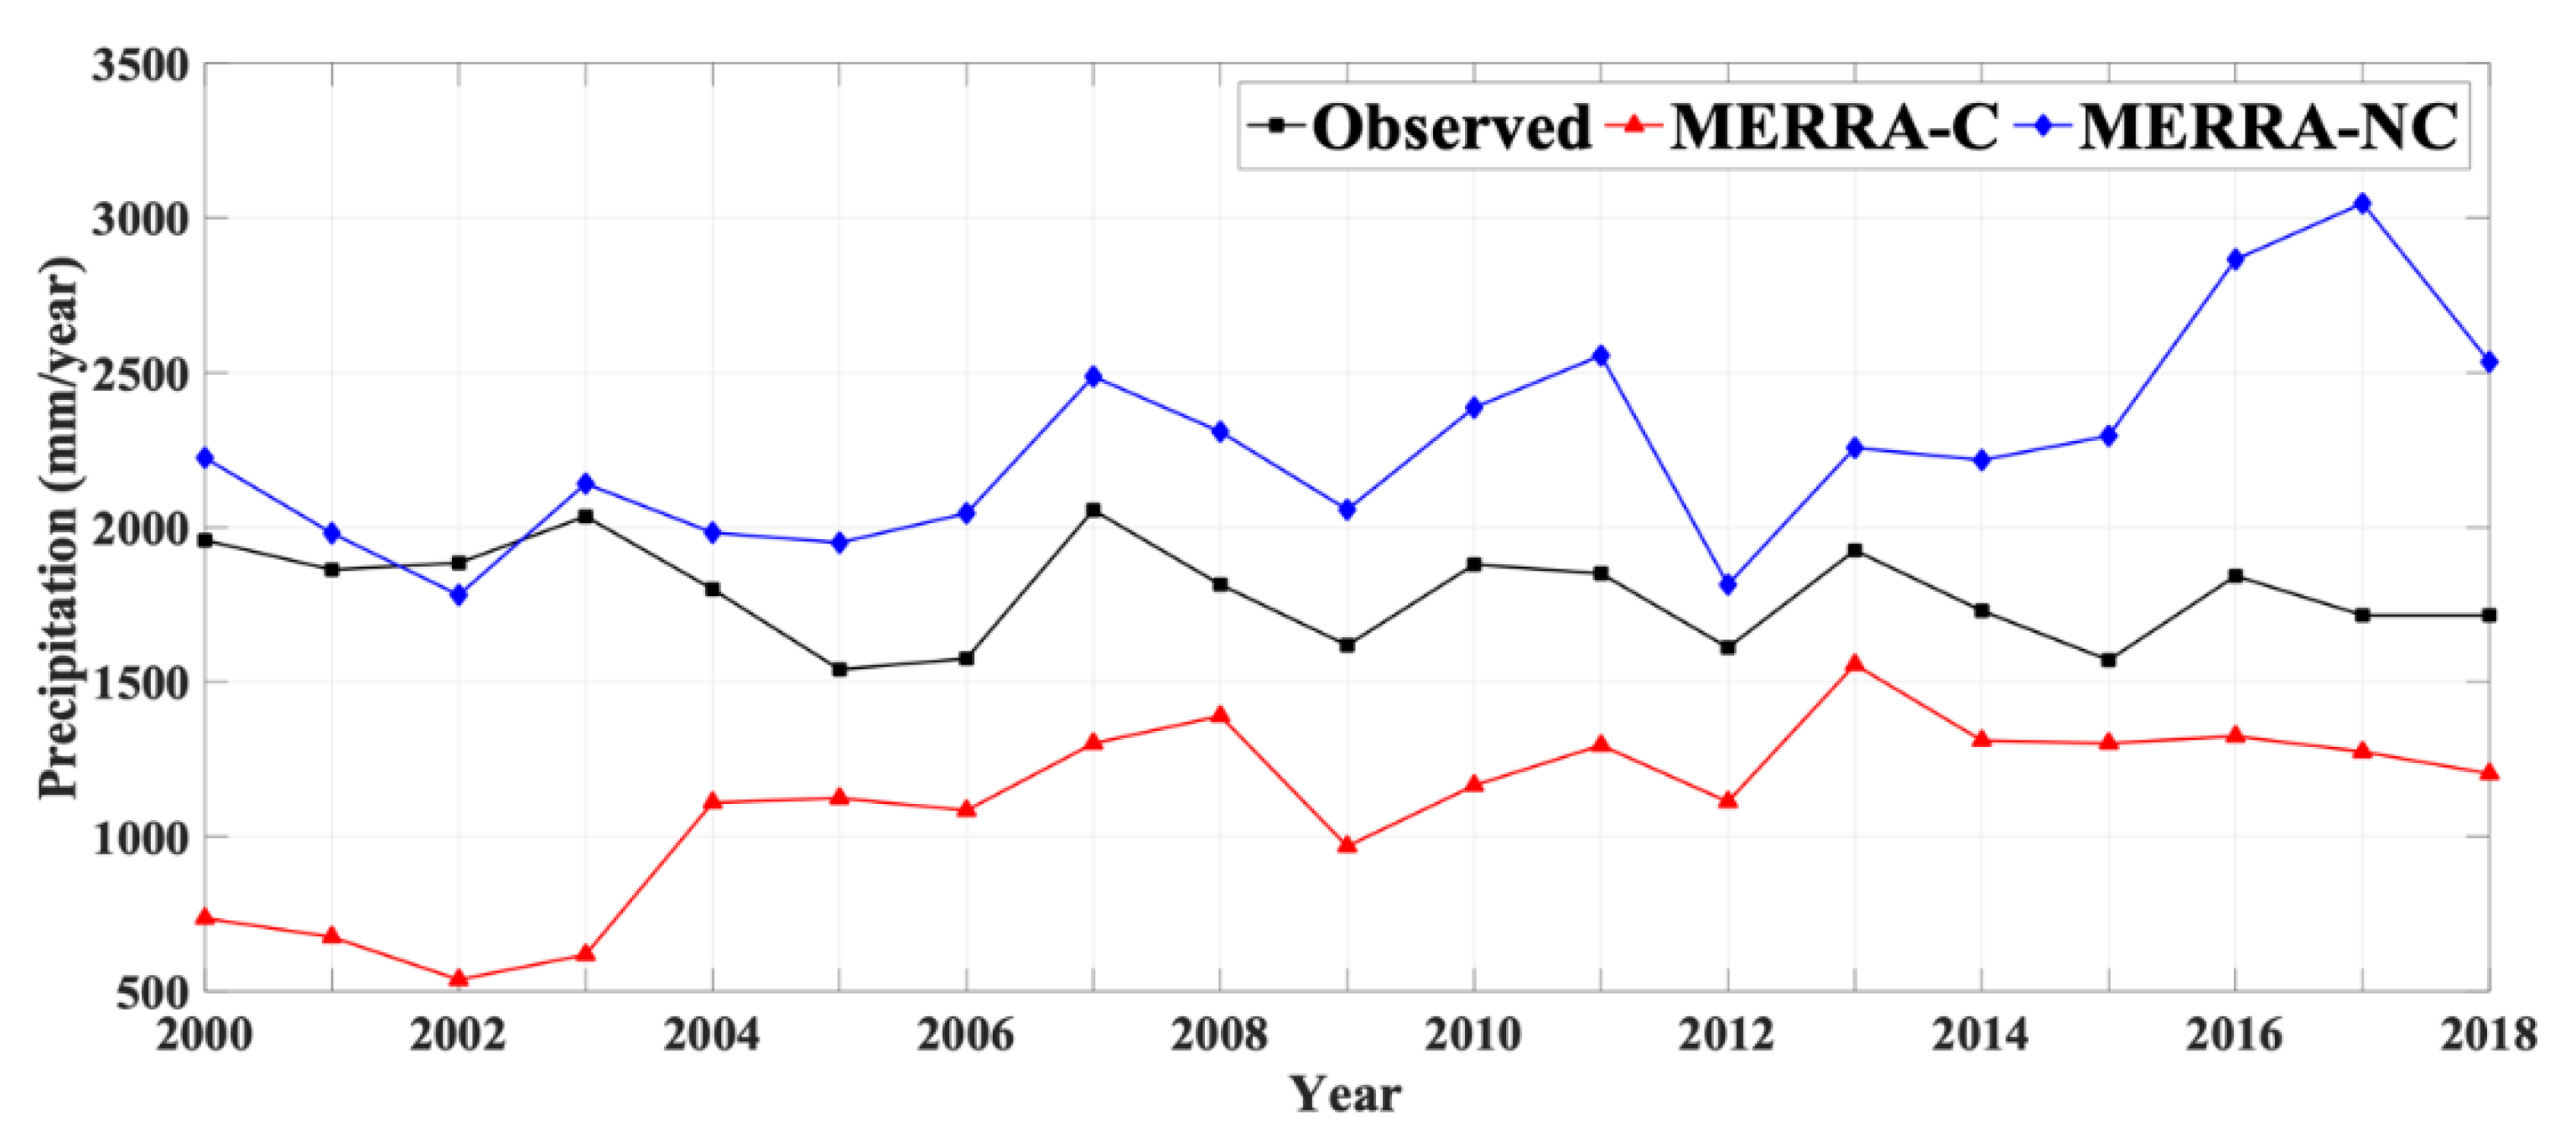
3.1. Seasonal Pattern of Precipitation

The temporal evaluation of precipitation is critical for many different hydrometeorological applications. The monthly precipitation time series (mm) of observed and MERRA-2 product average over Nepal during the study period is shown in Figure 2. Among the MERRA-2 datasets, MERRA-NC overestimated, while MERRA-C underestimated the observed precipitation throughout the study period. The observed data revealed that precipitation peaks during the monsoon (June-September) season. Meanwhile, both the datasets can capture high peaks of summer precipitation during June-September. Further, the estimation of the pecipitation peaks was higher and lower for MERRA-NC and MERRA-C during the monsoon season as compared to another season, respectively. MERRA-C largely underestimated the observed precipitation between 2000 and 2003, while MERRA-NC overestimated mainly after 2015. Meanwhile, MERRA-NC showed higher precipitation with more than 800 mm/month in 2016, 2017, and 2018. MERRA-NC appeared more consistent with observation during 2000–2006, whereas MERRA-C during 2012–2018 (Figure 2). Large errors in MERRA-C during the early 2000s could be attributed to considerable changes in the gauge network over the reanalysis period.
The annual precipitation during the study period was in continuous fluctuation from 2000 to 2018, and the overall pattern of both datasets was consistent with the observation (Figure A1). However, some deviations were found for specific years: the observed rainfall reached a maximum and minimum value in 2007 and 2005, respectively. Whereas, both MERRA-2 datasets were not in agreement: MERRA-C and MERRA-NC showed maximum values in 2013 and 2017, respectively (Figure A1). Meanwhile, changes in the performance of the MERRA-2 datasets may be related to improvements in algorithms and additional data in recent years. The result indicates that rainfall simulation ability in MERRA-2 still needs further enhancement.
Additionally, boxplots of the annual performance metrics (R, RMSE, MB) for MERRA-2 product and observation are presented in Figure 3. These metrics were generated by comparing point data for interannual timescale. MERRA-C datasets show the median R, RRMSE and MB of 0.64, 190.16 mm/year and −152.44 mm/year, respectively. As similar to Figure A1, the model-only MERRA-NC overestimated the annual precipitation amount with a larger error as indicated by higher RMSE values than MERRA-C. Overall, MERRA-C depicts a slightly high median of R-value; however, the difference is nominal.
The monthly cycle of the precipitation average over 2000–2018, shows the maximum precipitation from June to September (summer, 80% of annual precipitation) in the observed dataset, followed by pre-monsoon (13%), post-monsoon (4%), and winter (3%) (Figure 4). Precipitation initially increases in June, reaching a peak during July, and decreasing in August and September. The highest precipitation of ~480 mm was observed in July and the lowest precipitation of ~30 mm during November and December. A similar pattern is also shown by both MERRA-C and MERRA-NC (Figure 4). MERRA-C and MERRA-NC showed the highest precipitation of ~300 mm and 650 mm in July, respectively. It is worth noting that both datasets showed a significant error during the monsoon season as compared to other seasons. Statistics metrics were also calculated by averaging all stations for monthly mean precipitation value (Table 1). Among both datasets, MERRA-NC outperforms MERRA-C in estimating the annual precipitation cycle with lower MB (39.35 mm/month) and RMSE (75.10 mm/month). However, both datasets can capture monthly precipitation variation with a high correlation (R ≥ 0.95) across the country.

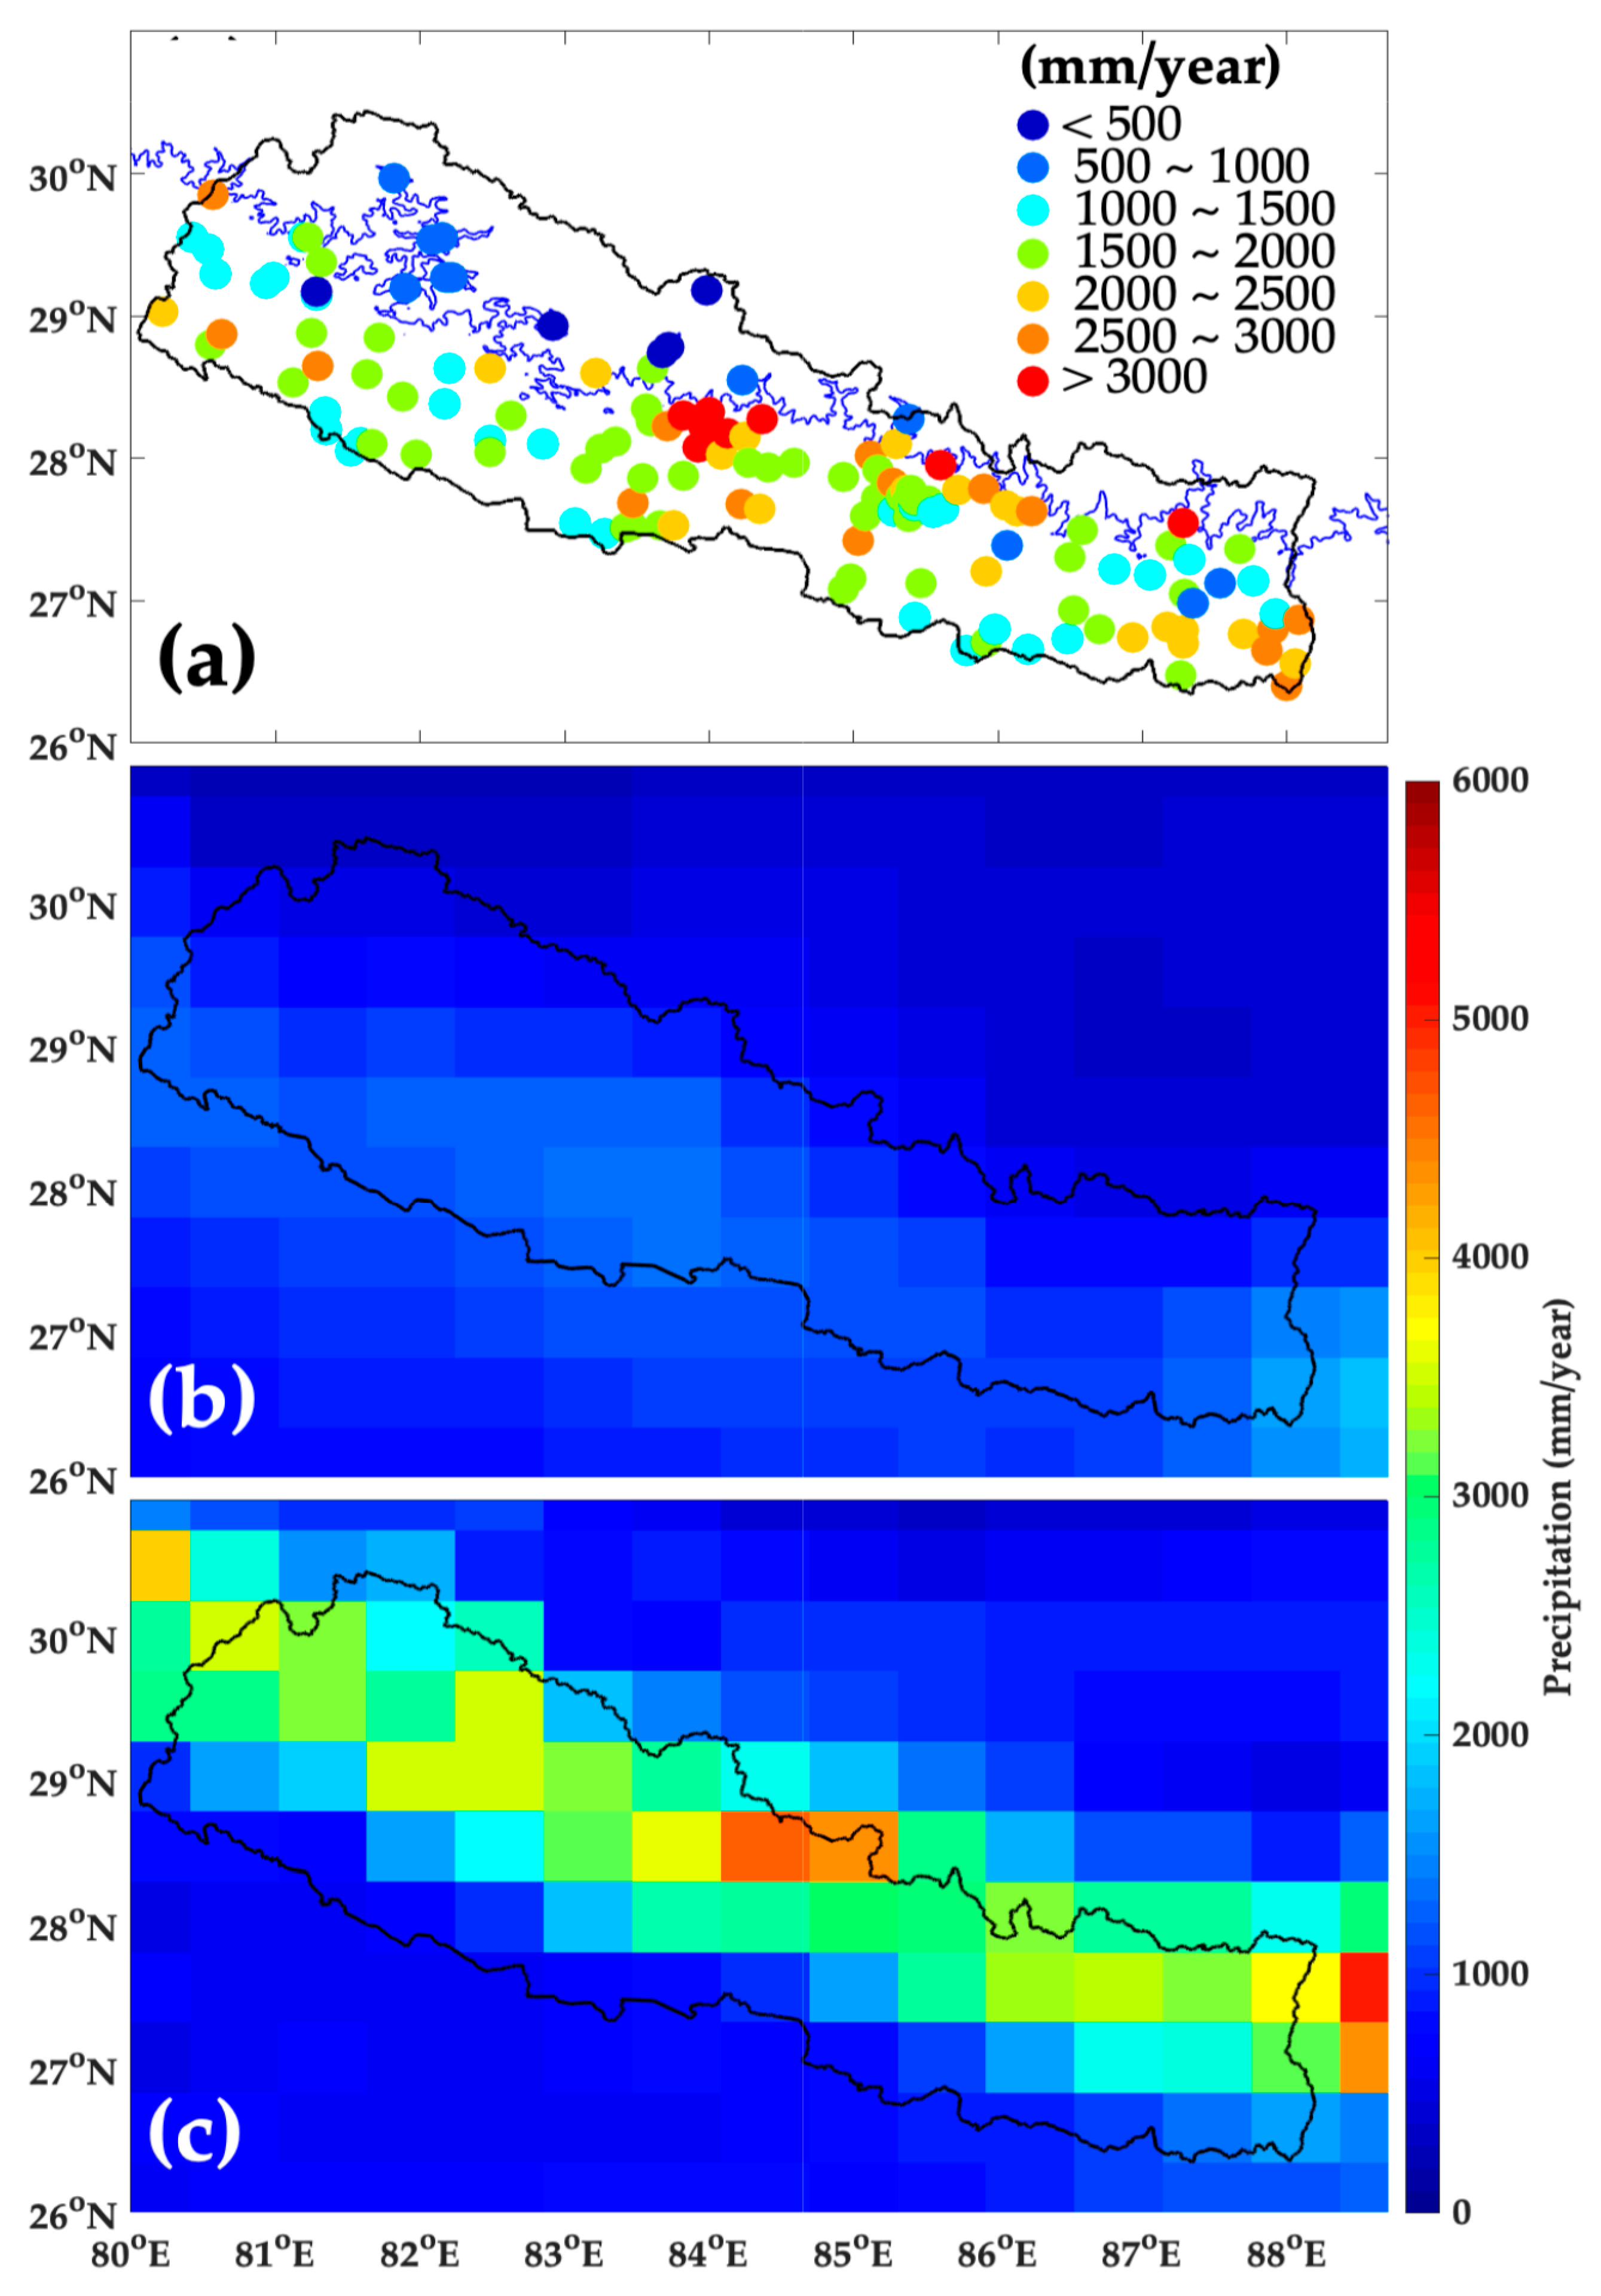
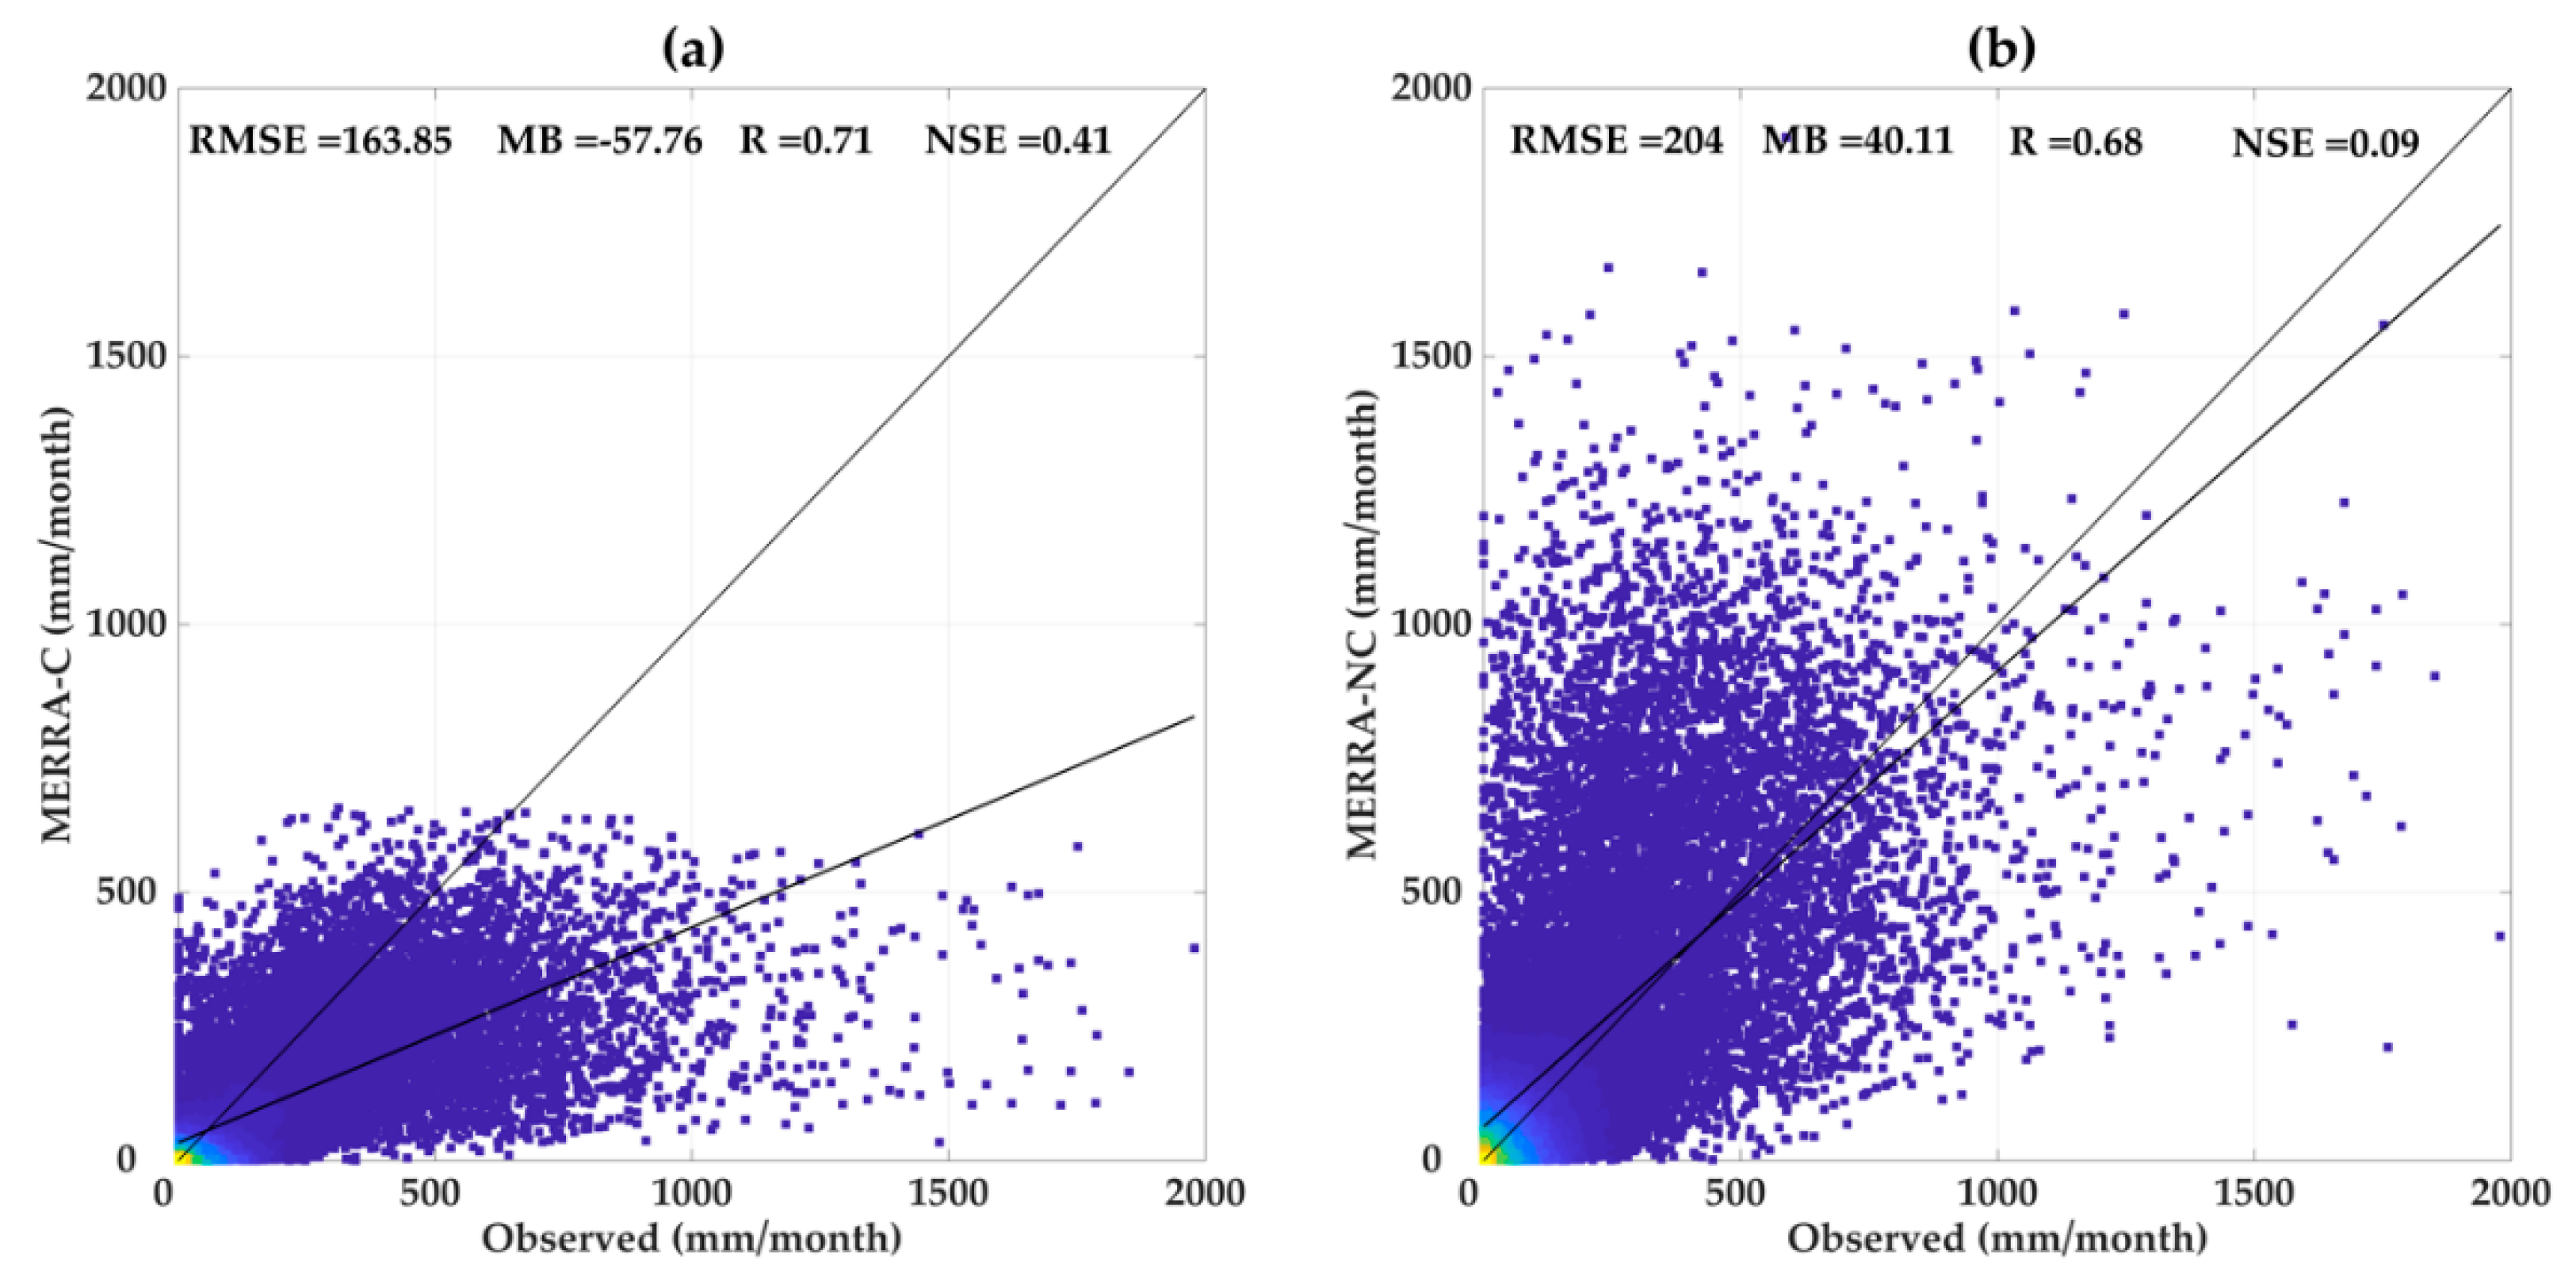
3.2. Spatial Distribution of Precipitation

The mean annual precipitation is calculated (Figure 5) to study the spatially distributed precipitation in observed and both MERRA-2 datasets. In general, the topographical characteristics establish the large spatial variability of precipitation in the country. Precipitation tends to decrease from east to west, with maximum annual precipitation (>3000 mm/year) was observed in mid-elevation areas of the central region (Lumle areas), whereas the minimum precipitation (<500 mm/year) appeared in the high-elevation areas of central and western region (Figure 5a). The presence of the high mountain range in the central region (Figure 1) acts as a south-north (uplifting) moisture barrier and creates an orographic ascent. This phenomenon generates a “rain shadow” to the northern slope (high elevation areas of the central and western region) and considerably increase precipitation in the southern slope of the mountainous region (Lumle). Among the MERRA-2 datasets, only MERRA-C demonstrated a spatial pattern similar to that of the observation, with a noticeable decreasing pattern from the east to west (Figure 5b); and maximum precipitation (~1800 mm/year) in lower reaches of the eastern region, followed by low-elevation areas of the central region (~1500 mm/year). Meanwhile, MERRA-NC showed the annual precipitation with the range of 2500 to 4500 mm/year in mid-elevation areas of the country, with the highest precipitation (~4500 mm/year) in the high-elevation of the central region (Figure 5c). In general, MERRA-C underestimated, and MERRA-NC overestimated mean annual precipitation across the country. However, the spatial patterns depicted by MERRA-C resemble the known precipitation regime over the country, although differences exist in both datasets.
Figure 6 shows the spatial distribution of MB at each station for different seasons calculated by averaging monthly precipitation values of each station. The spatial distribution of MB varies for different stations and seasons over the country. The large MB was observed in the monsoon season as compared to other seasons. During the pre-monsoon season, MERRA-C overestimated, and MERRA-NC underestimated at most of the stations in low-elevation areas, while the latter overestimated in high-elevation areas (Figure 6a,b). Both the datasets showed monsoon distribution as similar to pre-monsoon, but with larger MB (Figure 6c,d). Meanwhile, in post-monsoon and winter season, both datasets showed a very smaller MB and mostly underestimated by MERRA-C, while overestimated by MERRA-NC at most of the stations across the country (Figure 6e–h). Model-only datasets (MERRA-NC) overestimated the observed precipitation, especially in mid and high-elevation areas, whereas, gauge adjusted MERRA-C severely underestimated the observed precipitation, except for few stations. Among the different seasons, both datasets were more consistent with observed datasets in the winter season followed by a post-monsoon, pre-monsoon, and summer monsoon. This might be related to the amount of precipitation in respective seasons (less consistent for a higher amount of precipitation). Overall, the result indicates that the gauge calibration in MERRA-2 effectively reduces positive bias.
Statistical metrics were calculated to quantify the overall performance of the MERRA-2 product, by averaging monthly datasets at each season and presented in Table 2. Performance metrics showed noticeable differences between both datasets for different seasons. MERRA-C underestimated the mean precipitation in all seasons, while MERRA-NC only underestimated during the pre-monsoon season. RMSE in both datasets was very similar, indicating that these two datasets have a similar magnitude of error distribution; however, slightly smaller RMSE and higher R in MERRA-C revealed more spatial consistency with observed datasets. Gauge corrected MERRA-C performed reasonably well with the lowest RMSE, and higher R in all seasons, although estimated precipitation (lower MB) by MERRA-NC was more reliable during pre-monsoon. For the annual performance, MERRA-C archived best overall performance with lower RMSE (86.46 mm/month), higher R (0.34), and NSE of −0.87, although estimated precipitation amount by MERRA-NC was more reliable (lower MB) than MERRA-C. In general, MERRA-C datasets showed more consistent spatial performance (lower RMSE, higher R, and NSE closer to 1) with observed datasets, indicating that the gauge calibrated MERRA-C is more reasonable to reproduce the spatial pattern of observed precipitation over the study area.
Figure 7 shows the spatial distribution of correlation coefficient (R) and RMSE in summer monsoon for both MERRA-2 datasets at each station during the study period (2000–2018). The previous result shows that the large error occurs during the monsoon season (Table 2 and Figure 6) at most of the stations across the country. Both of these MERRA-2 datasets showed a very similar correlation at most of the station, although MERRA-C achieves a slightly higher correlation value at mid-elevation areas of the central region (Figure 7a). MERRA-C showed the larger RMSE (>400 mm/month) at most of the station located at high precipitation areas (central region), while MERRA-NC showed large RMSE at most of the station over mid- and high elevation areas of central and western region (Figure 7b). It is possible that the systematic error in MERRA-C was reduced from MERRA-NC due to bias correction, but the random error might be the same in both the datasets. Hence, the results of comparison over these mountainous regions are uncertain, indicating complex terrain lead to higher uncertainty in rainfall estimates over these regions.

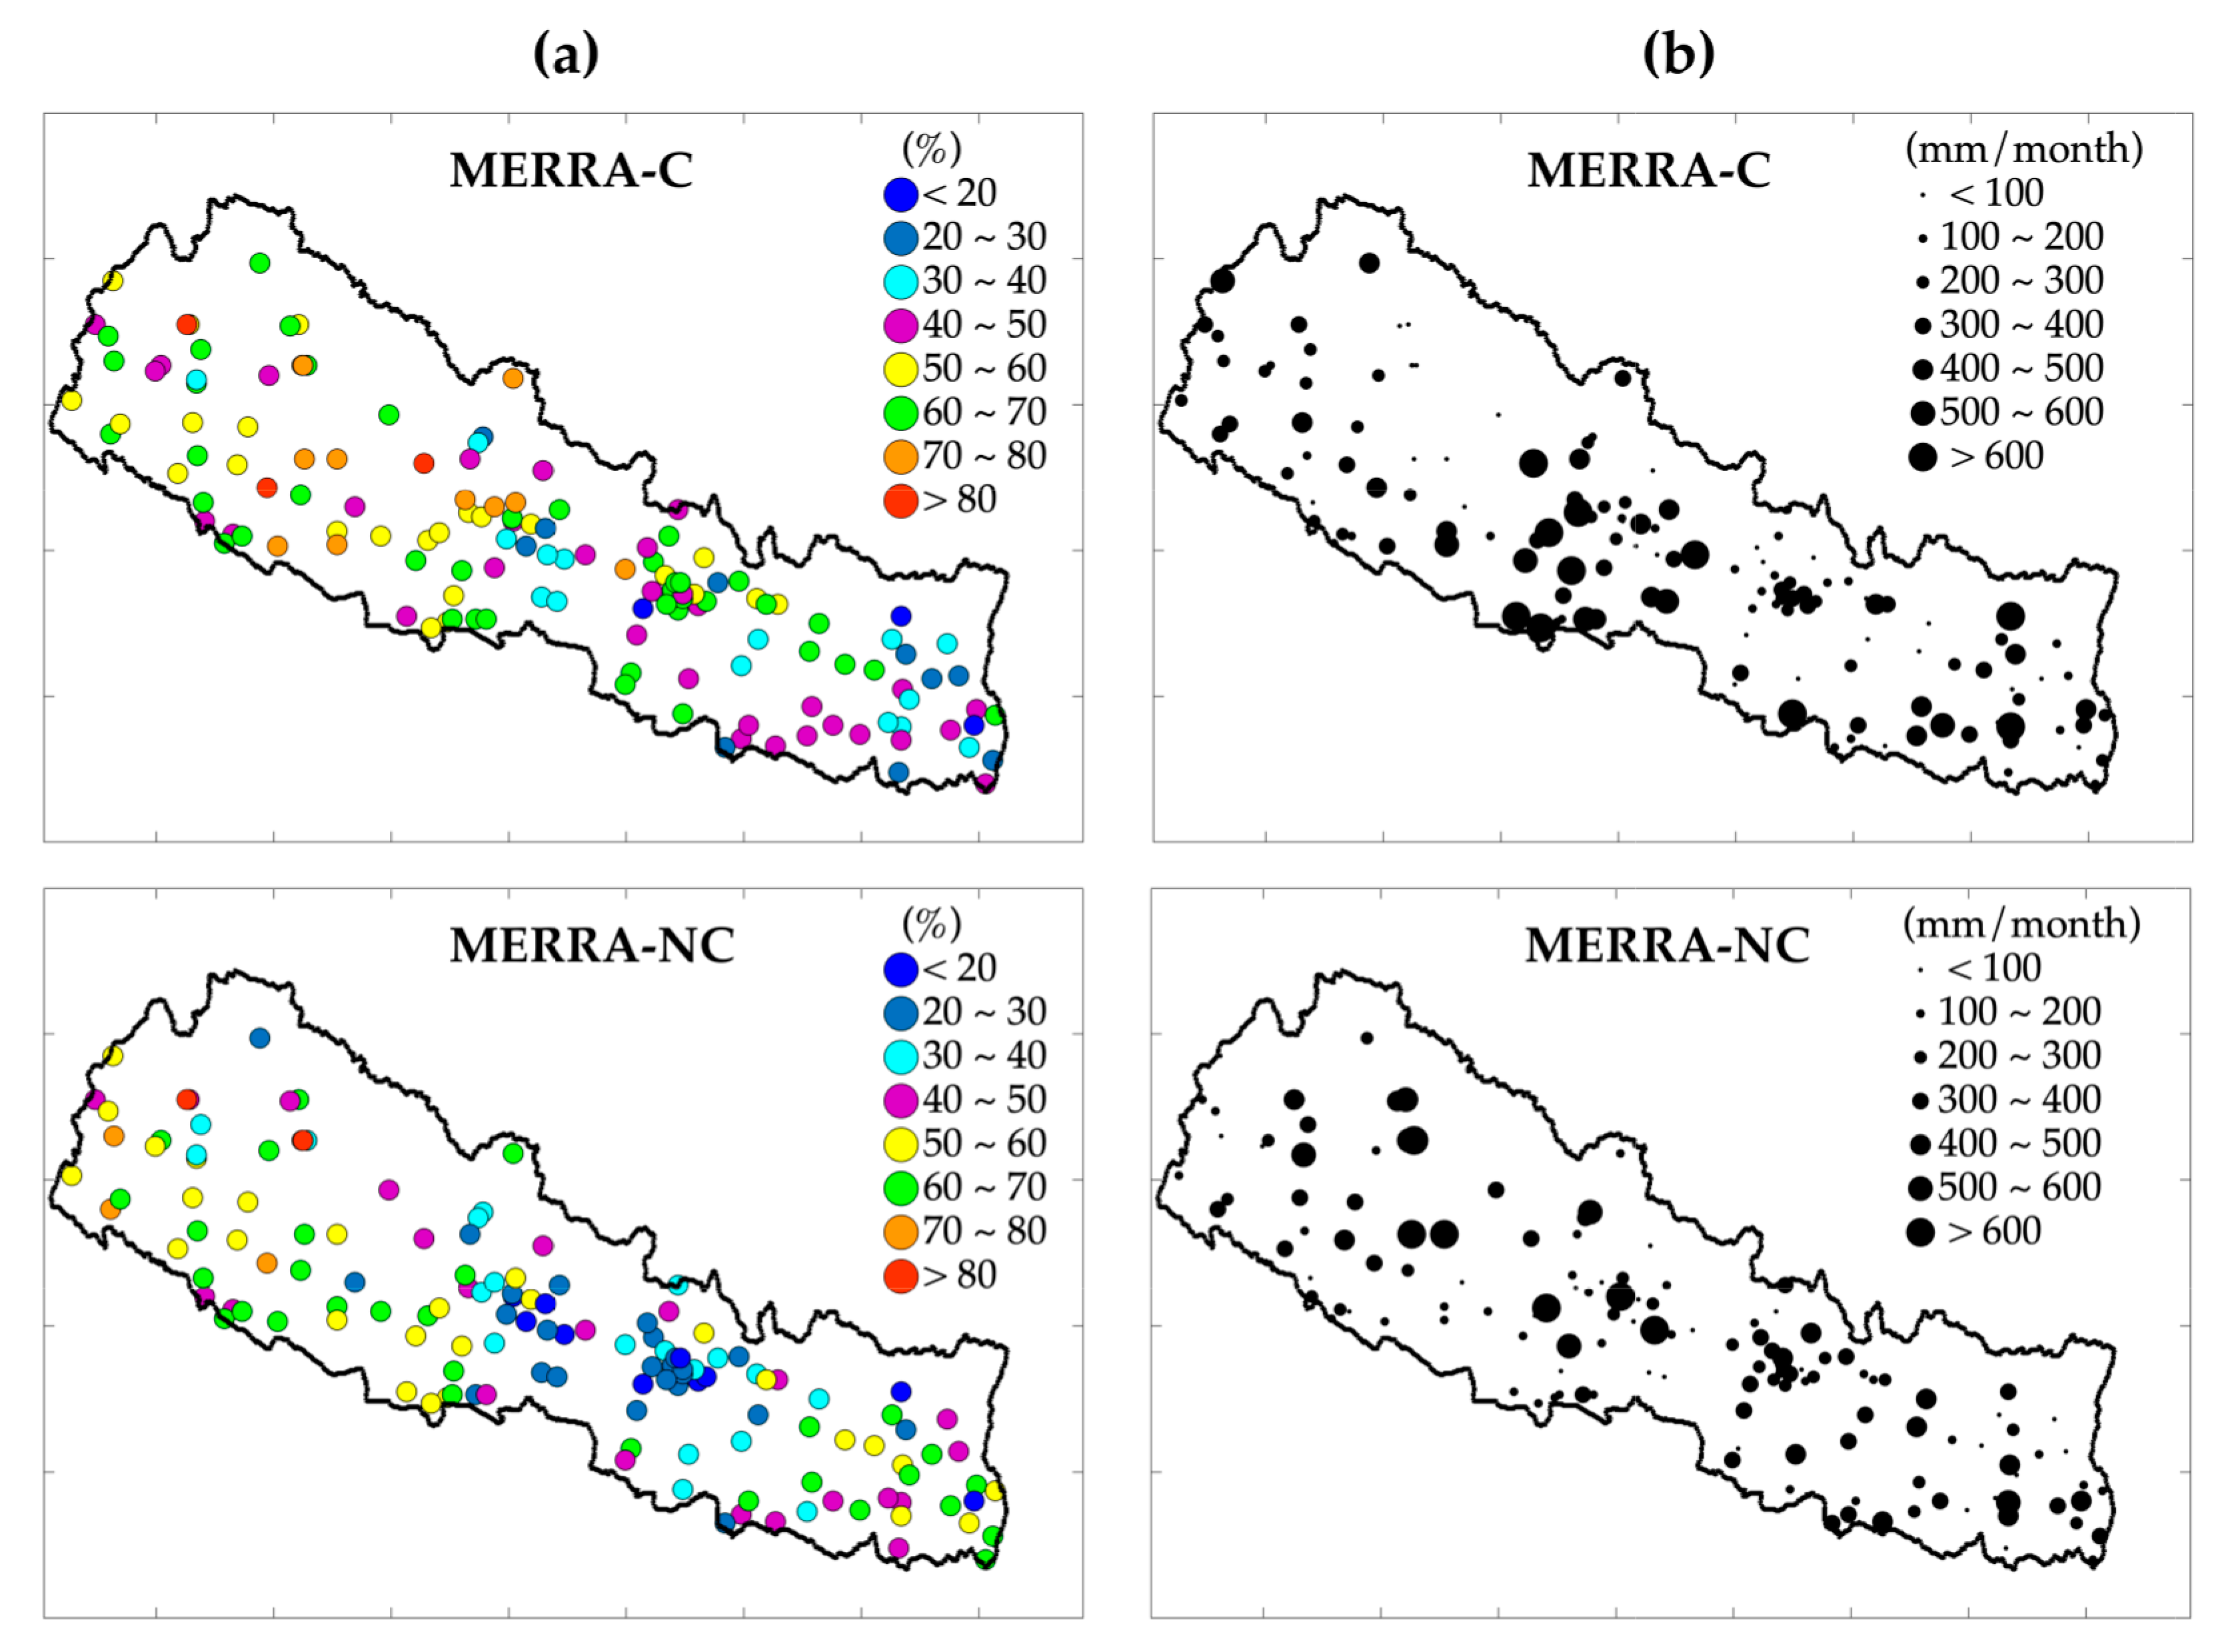
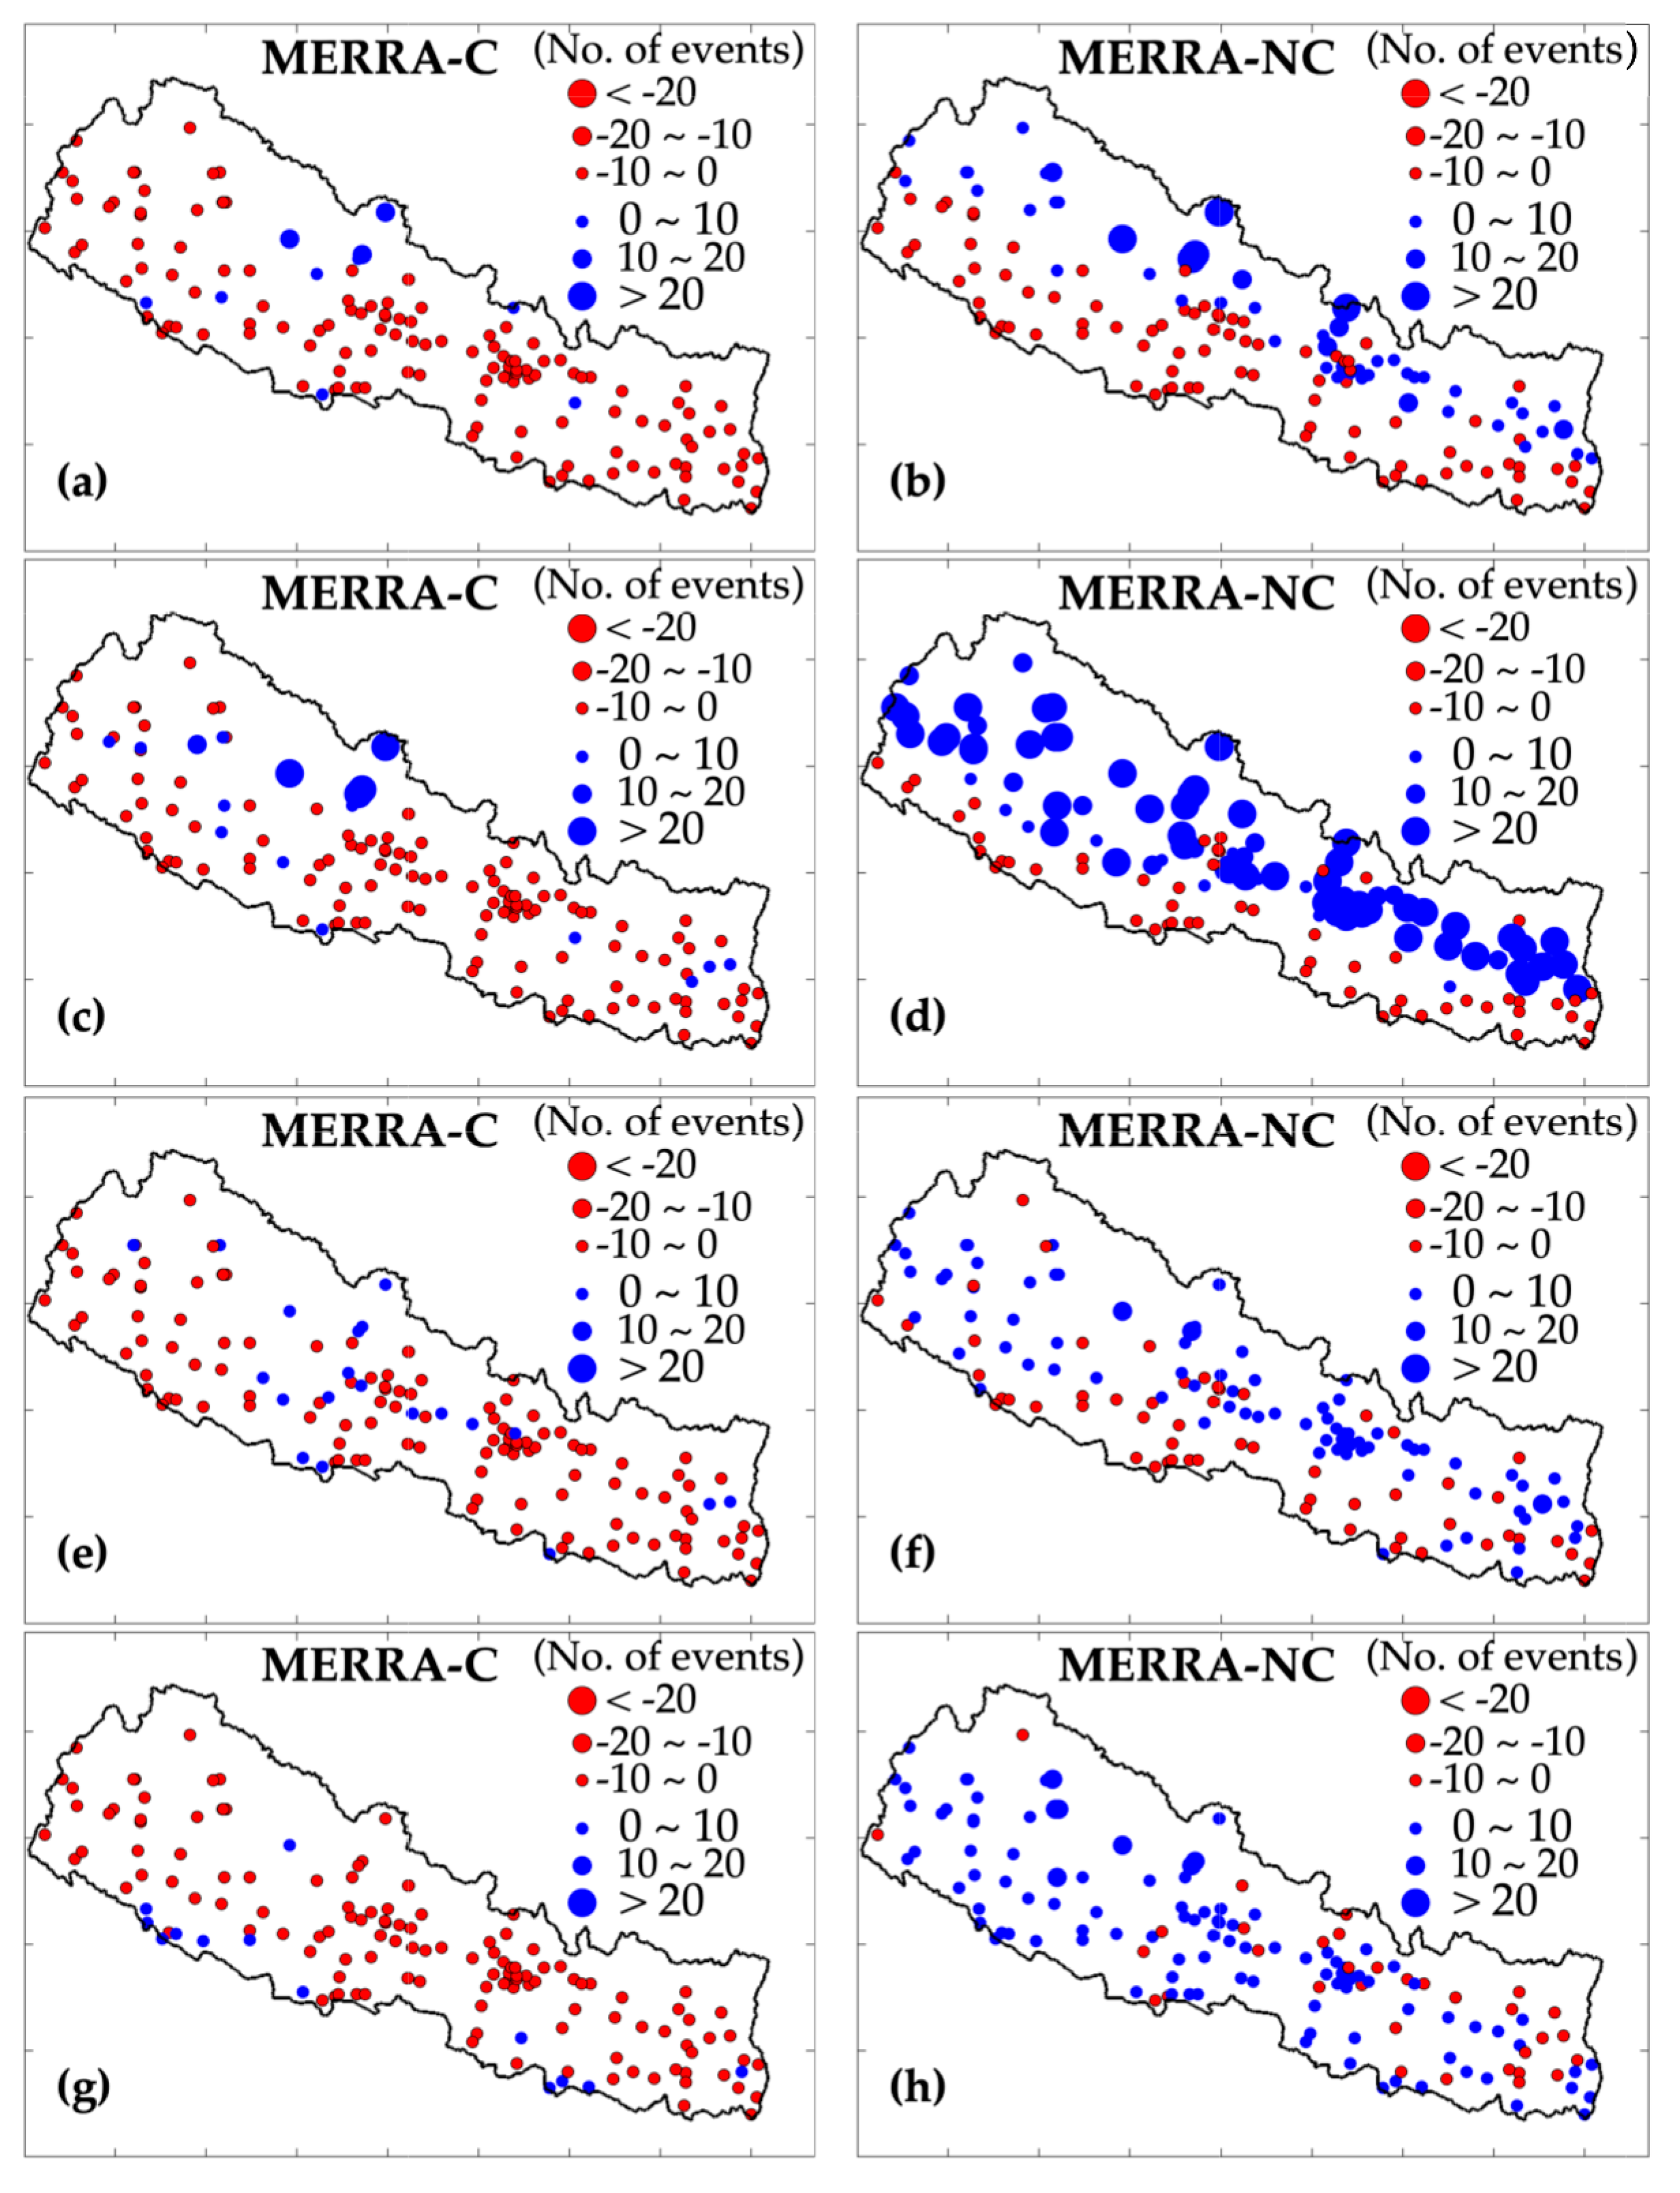
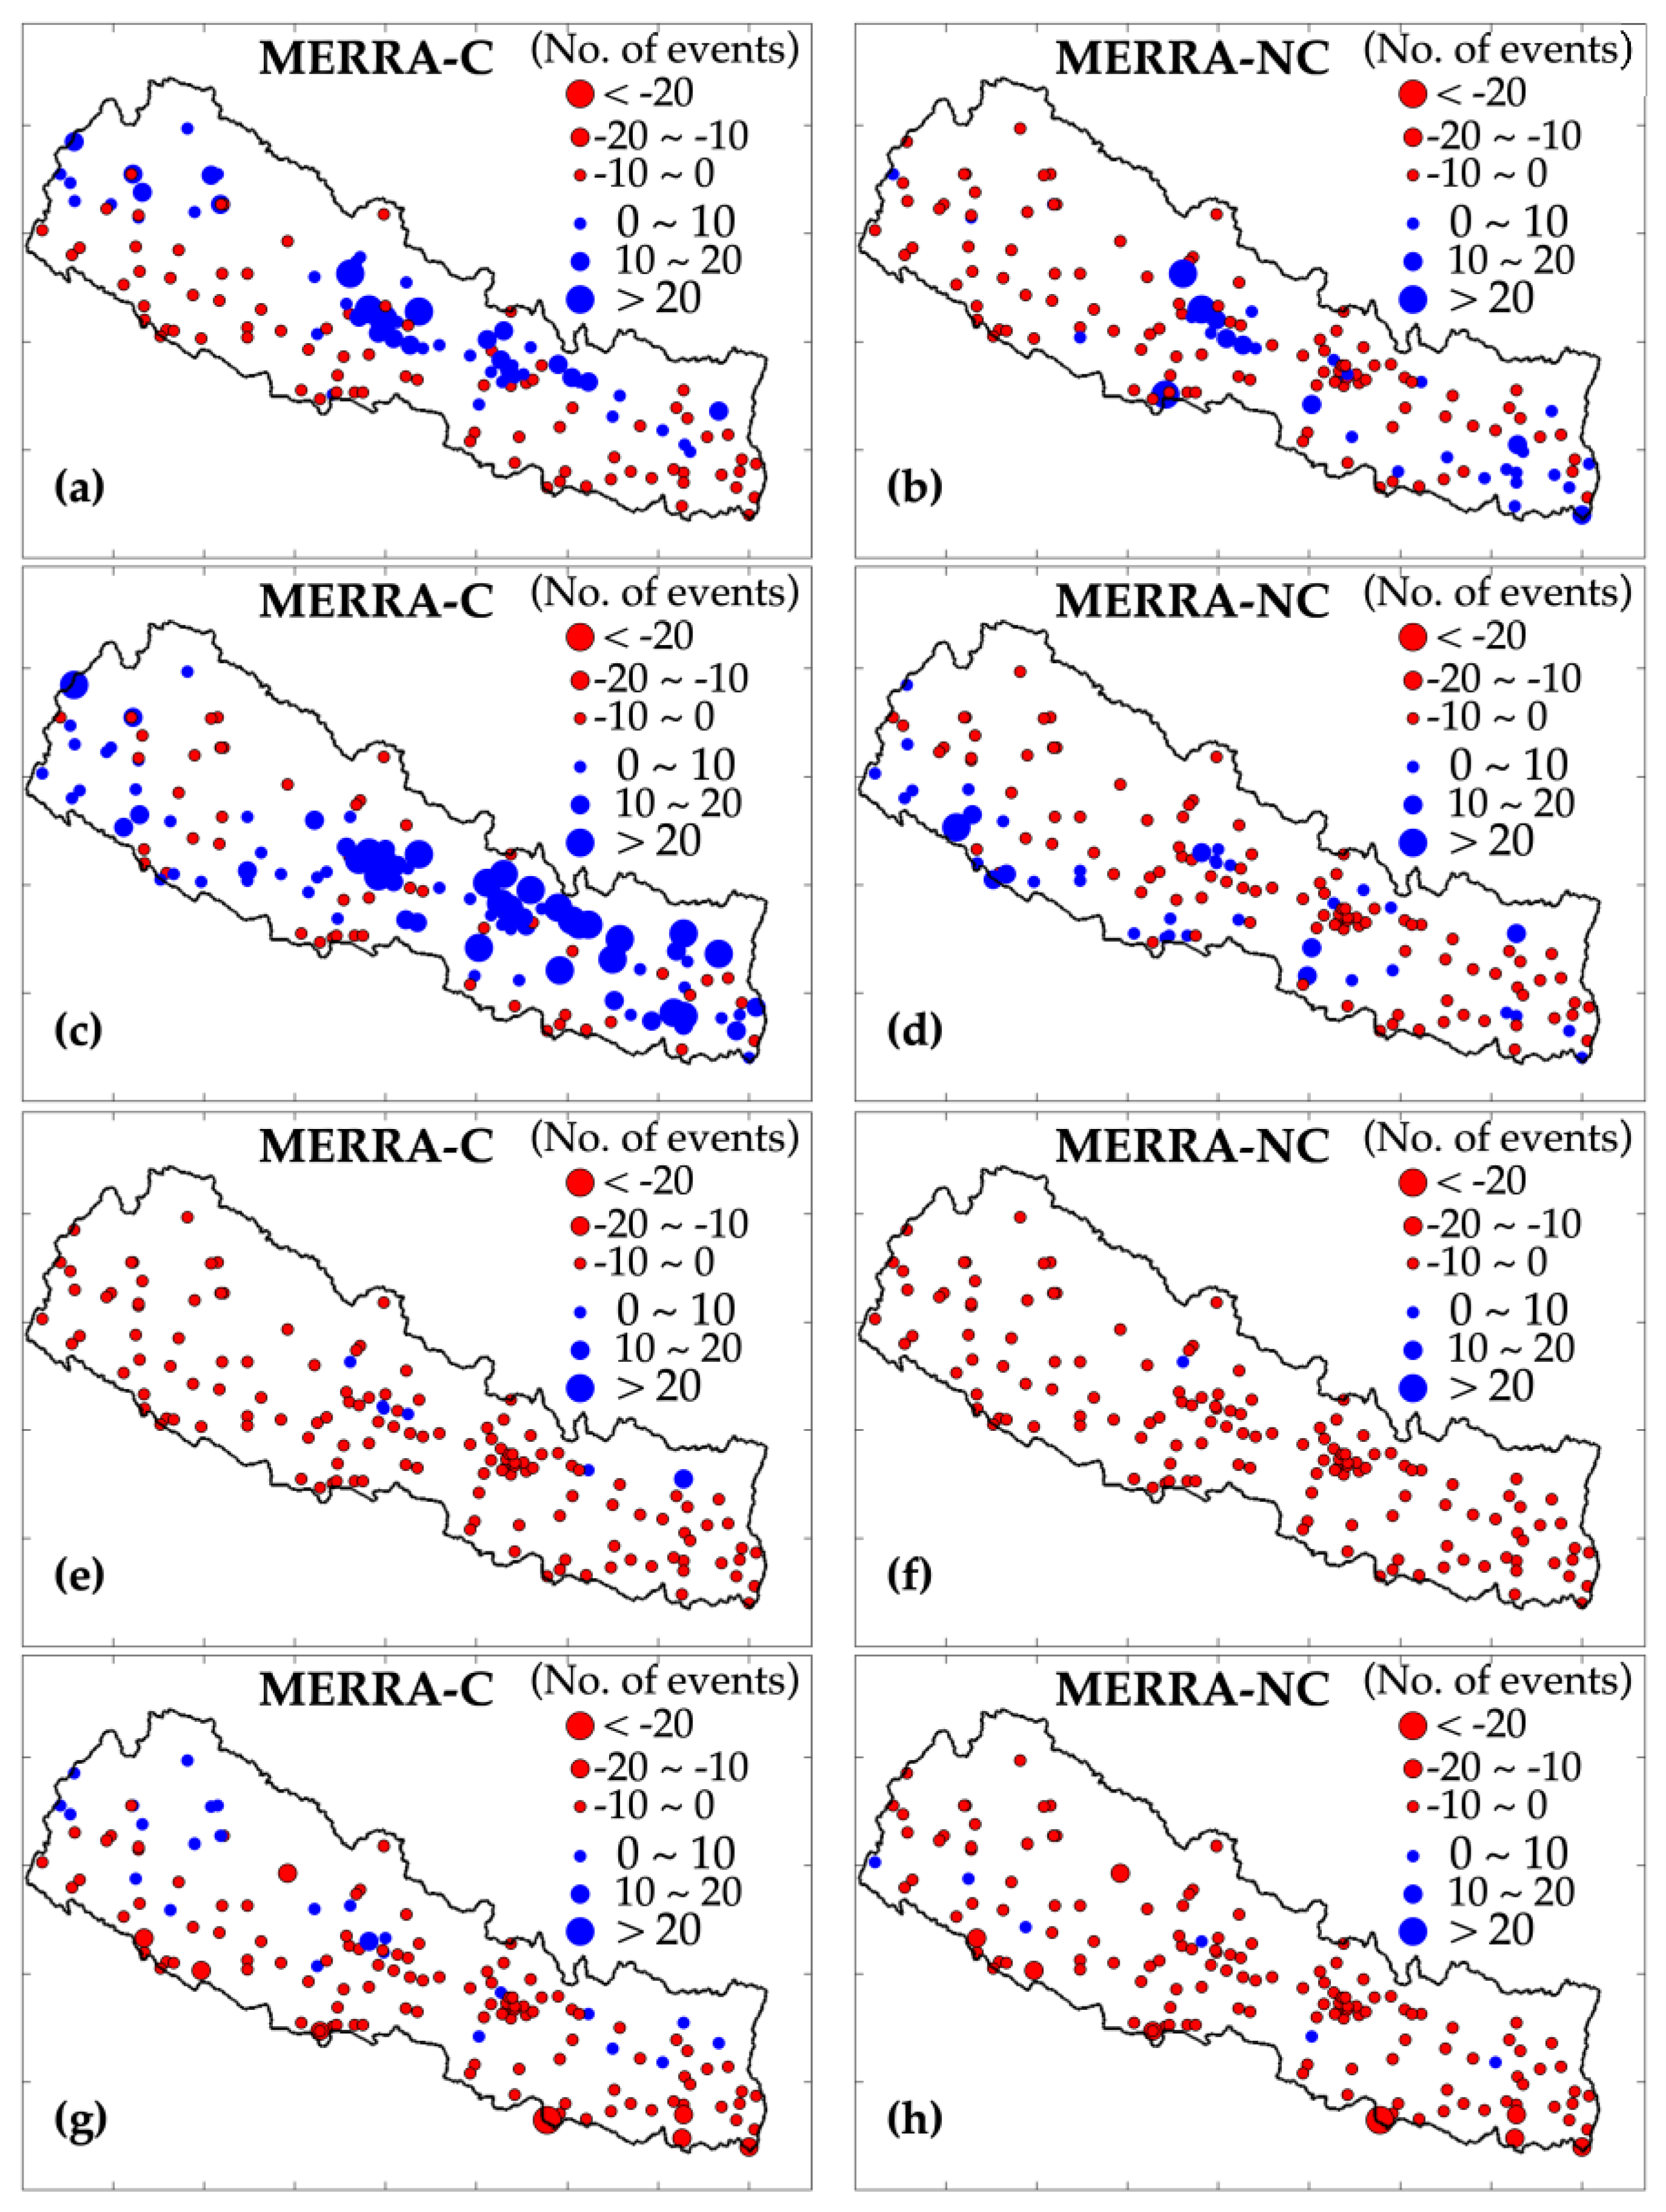
3.3. Extreme Precipitation Events

The bias distribution of very wet (R95p) and very dry (R5p) precipitation events in both MERRA-2 datasets was calculated for different seasons. Figure 8 shows the spatial distribution of bias in the total frequency of R95p at each station across the country. Both datasets show the large positive bias (>10 events) at high-elevation areas of the country during the pre-monsoon (Figure 8a,b). In the monsoon season, MERRA-NC largely overestimated (>20 events) at most of the stations in mid-and high-elevation areas, whereas MERRA-C shows more consistent performance with smaller bias (<−10 events) at most of the stations (Figure 8c,d). For post-monsoon and winter season, MERRA-NC overestimated, and MERRA-C underestimated the total frequency of very wet events (Figure 8e–h). Overall, MERRA-NC shows large positive bias and tends to overestimate the frequency of very wet events, while MERRA-C shows more consistent performance to reproduce the very wet events (smaller bias) across the country.
Figure 9 shows the bias in total low intensity related extreme events (R5p) for different season at each station over the country. Both datasets show very similar bias distribution of dry events (mostly underestimated by >−10 events) during the pre-, post-monsoon, and winter season. In contrast, MERRA-C largely overestimated (with larger bias >20 events) at most of the station during the monsoon season (Figure 9c,d). In this season, MERRA-NC shows very consistent performance with smaller bias (>−10 events). It is worth noting that MERRA-NC shows large error for R95p events, while MERRA-C shows larger error for R5p during the monsoon season at most of the stations across the country.

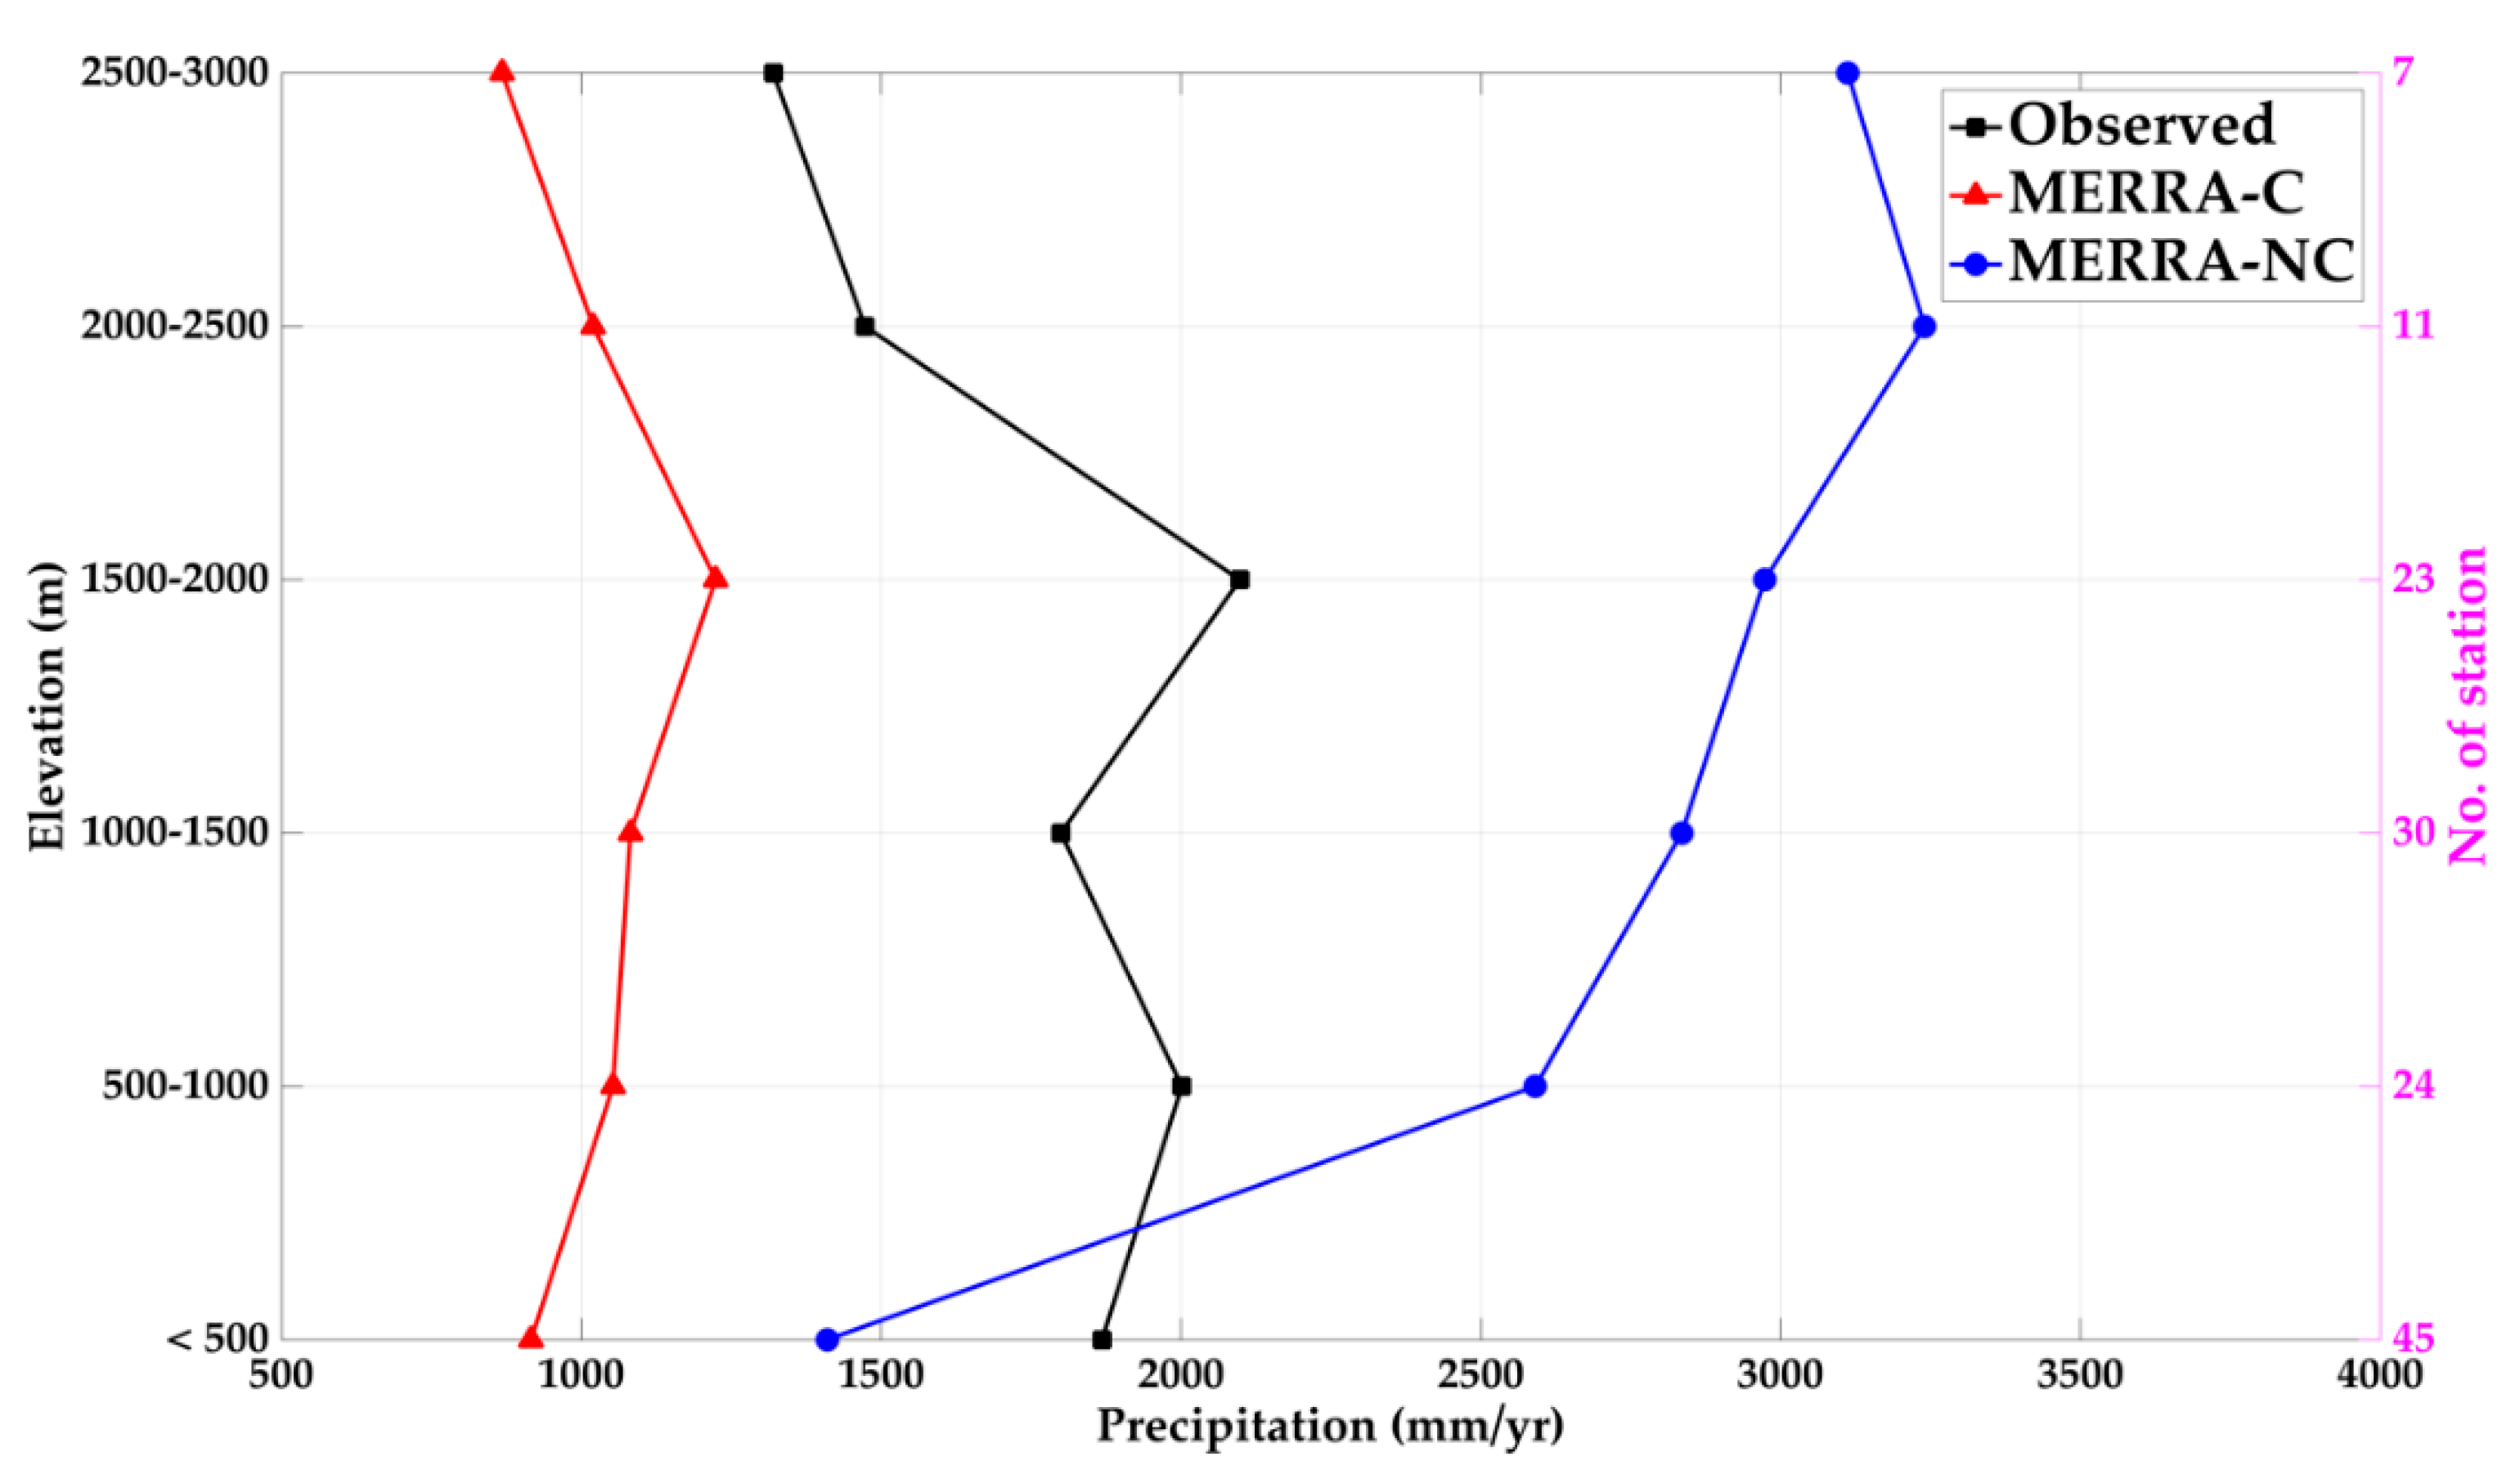
3.4. Precipitation Based on the Elevation Gradient

Nepal is a mountainous country, and the precipitation distribution mainly depends on its orography characteristics. Therefore, we examined the variability of mean annual precipitation for individual rain gauge stations and partitioned the station data into a 500 m elevation range over the study area. The elevation dependency was only calculated below 3000 m due to a limited number of stations in high-elevation areas. Figure 10 presents the elevation dependency pattern of mean annual precipitation over 19 years (2000–2018) from observed and both MERRA-2 datasets with the respective number of stations at each interval. The observed data showed the annual precipitation slightly increased from ~1800 mm/year to 2000 mm/year for elevations range 500–1000 m, and decrease to 1700 mm/year for elevations between 1000 and 1500 m with maximum precipitation of ~2200 mm/year at an elevation range of 1500–2000 m. The pattern shows precipitation initially increases up to 2000 m elevation and decreases with increasing elevation. The MERRA-NC precipitation distribution showed a sharp increase in the range between ~1400 mm/year and ~3200 mm/year for elevations below 2500 m, while the MERRA-C data showed the initial increase in precipitation up to 2000 m and subsequent decrease with elevation, with the highest precipitation of ~1200 mm/year between 1500 and 2000 m elevation. Nevertheless, MERRA-C was able to reproduce the observed elevation dependency pattern, and MERRA-NC fails to capture the pattern. It is worth to note that model-only MERRA-NC datasets fail to reproduce the spatial pattern of precipitation (Figure 5), which might be the reason for inconsistent elevation dependency pattern with observation. Some of these DHM gauges might be the reason for the better overall performance of MERRA-C datasets. The result suggests that after gauge calibration MERRA-C is able to reproduce the evident elevation dependency pattern; however, significant underestimation was observed. The orographic effect on these datasets is further discussed in Section 4.

4. Discussion

This study evaluates and quantifies the spatial and temporal performance of gauge calibrated (MERRA-C) and model-only (MERRA-NC) gridded precipitation datasets from MERRA-2 product using 141-gauge stations of Nepal. We found that MERRA-C datasets underestimated the monthly precipitation cycle and MERRA-NC was largely overestimated, particularly in wet months. In terms of seasonal performance, both the datasets performed poorly in monsoon season (when precipitation amount was higher) than that of the other three seasons. Due to the complex mountainous terrain and interference by wind, DHM gauges may not capture the actual precipitation in the study region. Meanwhile, the lack of solid precipitation measurement in DHM station probably has an impact on the performance of the MERRA-2 product during the winter season. The large uncertainties in the reanalysis product for the wettest season are also reported in previous studies conducted in Assiniboine River Basin (Canada–US border) by Xu et al. [55], Central Africa by Nkiaka et al. [56], and in India by Shah and Mishra [57]. In contrast, Wang et al. [58] found that the reanalysis product showed large bias during the winter season in the Eastern Fringe of Tibetan Plateau. Such uncertainties are primarily related to topographic nature and precipitation distribution of the region. Furthermore, the variational accuracy in interannual performance (Figure 3 and Figure A1) is subject to errors from considerable changes in the number gauge network over the reanalysis period and errors in the input gauge measurements [3].
The spatial distribution of observed precipitation showed large scale precipitation variability with the highest precipitation in the central region (Figure 5). Due to the spatially heterogeneous pattern of precipitation with complex physiography, model datasets have difficulty in resolving the orography effect [5]. The errors over the areas of complex orography may be partially related to the weakness of reanalysis models in simulating the effects of complex terrain [55,58,59]. To minimize such uncertainties, MERRA-C precipitation datasets utilize the several daily CPC gauge-based precipitation datasets from different countries to calibrate the model-only MERRA-NC datasets. The CPC precipitation datasets are derived from ground-based observation data, which is used to adjust MERRA-C datasets. The performance of MERRA-C highly depends on the performance of CPC datasets and adjusted gauge density within each grid box. Hence, the interpolation techniques to generate MERRA gridded datasets from the point and sparse gauge measurements can introduce a considerable level of uncertainty into the gridded dataset, particularly in the high-elevation and remote regions, where a sufficient number of rain gauge stations are usually not available [13,60]. Meanwhile, 45 DHM gauge datasets are also used to generate CPC datasets [61], although information of these assimilated gauge datasets is minimal. The previous study also mentioned that the quality and temporal range of assimilated rain gauge also significantly influence the performance of gauge calibrated precipitation product [62]. DHM rain gauge stations are denser in lowland areas, while too sparse in high-elevation areas of the study region. When these sparse gauges stations were used to calibrate model-only datasets, which may sometimes deteriorate the accuracy of the calibrated product (Table 1 and Table 2), it is worth noting that, after gauge correction, MERRA-C moderately captured the spatial distribution of observed precipitation. Similar to this result, most of the previous study revealed the improved performance of gauge calibrate product over the denser gauge network in the larger basin area of West Africa by Nicholson et al. [63] and Malaysia by Mahmud et al. [64]. Meanwhile, Balcutt et al. [65] evaluated the potential bias correction techniques to improve the rainfall representations with spatially aggregated precipitation for driving hydrological simulation in Nepal. These studies also mentioned that a higher number of gauges at each grid during the interpolation would enhance the performance of the calibrated product. Further, the dense gauge network is more representative to provide the actual distribution of precipitation and also more able to capture the orographic effect than the sparse gauge network, thus improving product accuracy [66]. Moreover, there are other various factors in the construction process of MERRA-2, such as boundary layer parameterization, land–atmosphere interactions, and/or convective precipitation parameterization, and this may cause the uncertainty to correctly reflecting the observation precipitation pattern [67].
The evident elevation dependency pattern (i.e., precipitation initially increases with elevations up to 2000 m and decrease with increasing elevation) is similar to previous studies conducted in the same study region [8]. The high mountain blocks the large-scale monsoon flow moving upward and makes the windward (leeward) side of the central region very wet (dry). As mentioned earlier, reanalysis models have difficulty in resolving the orographic effect of precipitation; this might be the reason for the highest precipitation above 2000 m in model-only MERRA-NC datasets (Figure 5 and Figure 10). However, after the gauge calibration, MERRA-C was able to reproduce the observed elevation dependency pattern. The scatter plots with relative statistical metrics were further discussed to demonstrate the overall performances of MERRA-2 product and observed datasets (Figure 11). The statistics showed that MERRA-C relatively performed better with higher correlation (R = 0.71), and lower RMSE (163.85 mm/month) than MERRA-NC; although the estimated precipitation amount by MERRA-NC was more consistent (lower MB) with observed datasets. Besides, NSE also shows the MERRA-C outperformed MERRA-NC during the study period. As similar to Section 3.1, MERRA-C overestimated the observed precipitation, especially in wettest months (>500 mm/month) when precipitation amount is generally higher (Figure 11a). Meanwhile, MERRA-NC overestimated the lower precipitation value (Figure 11b). Overall, MERRA-C were more consistent with reproducing the spatial pattern of observed datasets, while MERRA-NC datasets were more reliable to estimate the observed precipitation amount. The results are in line with the inclusion of the weather stations into the reanalysis gridded datasets that significantly increased the correlation between observed and the gridded products [68]. It is important to mention while interpreting the results, the CPC was derived from point ground-based measurements, and some of these DHM gauges might be the reason for the better overall performance of MERRA-C.
Moreover, MERRA-C and MERRA-NC showed similar tendencies (large error during the monsoon season) with different magnitude of errors (Figure 6, Figure 7, Figure 8 and Figure 9 and Table 2). Our results provide evidence that interpolation techniques and the sparseness of the gauge measurements can create uncertainties on the performance of gauge calibrated MERRA-2 product. On the other hand, difficulty in resolving the orography effect by the reanalysis model also influenced the overall accuracy of MERRA-2 product [67,68]. Further, the inclusion of a diverse set of station data may increase the accuracy of the reanalysis of data [5]. In conclusion, this study provides shreds of evidence that interpolation techniques and limited or sparseness of the gauge measurements create uncertainties on the performance of reanalysis products, especially in the complex terrain like Nepal. Thus, there is a necessity of adequate gauge stations in the high elevation areas, which not only reduces the uncertainty in the production and validation of gridded datasets but will also be useful for climate and environmental change studies.

5. Conclusions

In this study, we evaluated the performance of MERRA-2 (MERRA-C and MERRA-NC) datasets based on rain-gauge observation over Nepal between 2000 and 2018. The study region features complex terrain and has a significant impact on the distribution of precipitation. Based on the above results, the following conclusions were drawn:
The average seasonal cycle of precipitation during the study period shows the peak precipitation from June to September. MERRA-C and MERRA-NC underestimated and overestimated the observed seasonal cycle of precipitation, respectively. However, MERRA-C and MERRA-NC can reproduce the overall precipitation pattern, but the accuracy is poor in the wettest months for both MERRA-2 datasets.
Gauge calibrated MERRA-C depicted broadly similar spatial distributions of annual precipitation, i.e., precipitation decreased from east to west, with maximum and minimum precipitation in mid-elevation areas of the central region and high-elevation areas of the central and western region, respectively. Both MERRA-2 datasets performed better in winter, post-monsoon, and pre-monsoon than in summer monsoon. For the spatial performance, MERRA-C achieved a higher correlation than MERRA-NC, while both datasets showed a similar magnitude of RMSE. Furthermore, a high correlation in MERRA-C and lower MB in MERRA-NC indicates the better spatial distribution and reliable estimation of precipitation, respectively. MERRA-NC and MERRA-C datasets overestimated the very wet events (R95p) and very dry events (R5p) during the monsoon season, respectively. Whereas, both datasets underestimated the R95p and R5p events for other three seasons at most of the station across the country.
The variability of mean annual precipitation is observed with a 500 m elevation range over the study area. The pattern shows precipitation initially increases up to 2000 m elevation and decreases with increasing elevation. Nevertheless, MERRA-C was able to reproduce the observed elevation dependency pattern, and MERRA-NC fails to capture the observed elevation dependency pattern. The result suggests that MERRA-C datasets have useful implications in Nepal. However, further, improvement is still needed in the MERRA-2 reanalysis product, particularly in the case of mountainous areas such as Nepal.
Evaluation of MERRA-2 precipitation datasets is especially important for understanding the spatio-temporal distribution of precipitation in Nepal. This will eventually benefit from understanding the hydrological processes and water resource management, as it affects the output accuracy of the hydrological model. However, to enhance the precipitation measurement accuracy, the allocation of new measuring stations is still needed to further evaluate the different gridded precipitation products in Nepal.

Supplementary Materials

The following are available online at https://www.mdpi.com/2306-5338/7/3/40/s1, Figure S1: The number of rain gauge with complete data series in each year during the study period (2000–2018).

Author Contributions

Conceptualization, S.S., D.S.; methodology, S.S.; formal analysis, K.H., S.S., N.K.; investigation, S.S., K.H.; funding, B.D., T.X.; data curation, S.S.; writing—original draft preparation, K.H., S.S.; N.K.; writing—review and editing, B.B., M.A., M.S.S., T.X., D.S., B.D.; supervision, D.S., B.D. All authors have read and agreed to the published version of the manuscript.

Funding

The APC was funded by Kathmandu Center for Research and Education, Chinese Academy of Sciences-Tribhuvan University.

Acknowledgments

K. Hamal is supported by Belt and Road Scholarship, and N. Khadka is supported by CAS-TWAS President’s fellowship. Authors would like to acknowledge the DHM for observed precipitation datasets and NASA for providing freely available MERRA-2 product. We also express our thankfulness to the Department of Environmental Science, Patan Multiple Campus, Tribhuvan University, Nepal. The authors would like to thank three anonymous reviewers for their insightful comments and suggestion, which helped to improve the manuscript.

Conflicts of Interest

Authors declare that they have no conflict of interest.

Appendix A

Figure A1. Inter-annual variation of precipitation (mm/year) in observation and both MERRA-2 datasets average over the study area through the study period (2000–2018).
Hydrology 07 00040 g0a1

References

  1. Kidd, C.; Huffman, G. Global precipitation measurement. Meteorol. Appl. 2011, 18, 334–353. [Google Scholar] [CrossRef]
  2. Li, D.; Yang, K.; Tang, W.; Li, X.; Zhou, X.; Guo, D. Characterizing precipitation in high altitudes of the western Tibetan plateau with a focus on major glacier areas. Int. J. Climatol. 2020. [Google Scholar] [CrossRef]
  3. Reichle, R.H.; Liu, Q.; Koster, R.D.; Draper, C.S.; Mahanama, S.P.; Partyka, G.S. Land surface precipitation in MERRA-2. J. Clim. 2017, 30, 1643–1664. [Google Scholar] [CrossRef]
  4. Shrestha, D.; Singh, P.; Nakamura, K. Spatiotemporal variation of rainfall over the central Himalayan region revealed by TRMM Precipitation Radar. J. Geophys. Res. Atmos. 2012, 117. [Google Scholar] [CrossRef] [Green Version]
  5. Hu, Z.; Hu, Q.; Zhang, C.; Chen, X.; Li, Q. Evaluation of reanalysis, spatially interpolated and satellite remotely sensed precipitation data sets in central Asia. J. Geophys. Res. Atmos. 2016, 121, 5648–5663. [Google Scholar] [CrossRef] [Green Version]
  6. Reichstein, M.; Bahn, M.; Ciais, P.; Frank, D.; Mahecha, M.D.; Seneviratne, S.I.; Zscheischler, J.; Beer, C.; Buchmann, N.; Frank, D.C. Climate extremes and the carbon cycle. Nature 2013, 500, 287. [Google Scholar] [CrossRef]
  7. Trenberth, K.E.; Dai, A.; Van Der Schrier, G.; Jones, P.D.; Barichivich, J.; Briffa, K.R.; Sheffield, J. Global warming and changes in drought. Nat. Clim. Change 2014, 4, 17. [Google Scholar] [CrossRef]
  8. Kansakar, S.R.; Hannah, D.M.; Gerrard, J.; Rees, G. Spatial pattern in the precipitation regime of Nepal. Int. J. Climatol. J. R. Meteorol. Soc. 2004, 24, 1645–1659. [Google Scholar] [CrossRef]
  9. Talchabhadel, R.; Karki, R.; Thapa, B.R.; Maharjan, M.; Parajuli, B. Spatio-temporal variability of extreme precipitation in Nepal. Int. J. Climatol. 2018, 38, 4296–4313. [Google Scholar] [CrossRef]
  10. Pokharel, B.; Wang, S.Y.S.; Meyer, J.; Marahatta, S.; Nepal, B.; Chikamoto, Y.; Gillies, R. The east–west division of changing precipitation in Nepal. Int. J. Climatol. 2019. [Google Scholar] [CrossRef]
  11. Shrestha, S.; Yao, T.; Kattel, D.B.; Devkota, L.P. Precipitation characteristics of two complex mountain river basins on the southern slopes of the central Himalayas. Theor. Appl. Climatol. 2019, 138, 1159–1178. [Google Scholar] [CrossRef]
  12. Hou, A.Y.; Skofronick-Jackson, G.; Kummerow, C.D.; Shepherd, J.M. Global precipitation measurement. In Precipitation: Advances in Measurement, Estimation and Prediction; Springer: Cham, Switzerland, 2008; pp. 131–169. [Google Scholar]
  13. Sun, Q.; Miao, C.; Duan, Q.; Ashouri, H.; Sorooshian, S.; Hsu, K.L. A review of global precipitation data sets: Data sources, estimation, and intercomparisons. Rev. Geophys. 2018, 56, 79–107. [Google Scholar] [CrossRef] [Green Version]
  14. Sharma, S.; Khadka, N.; Hamal, K.; Baniya, B.; Luintel, N.; Joshi, B.B. Spatial and Temporal Analysis of Precipitation and Its Extremities in Seven Provinces of Nepal (2001–2016). Appl. Ecol. Environ. Sci. 2020, 8, 64–73. [Google Scholar]
  15. Islam, M.; Das, S.; Uyeda, H. Calibration of TRMM derived rainfall over Nepal during 1998–2007. Open Atmos. Sci. J. 2010, 4, 12–23. [Google Scholar] [CrossRef] [Green Version]
  16. Tapiador, F.J.; Turk, F.J.; Petersen, W.; Hou, A.Y.; Garcia-Ortega, E.; Machado, L.A.T.; Angelis, C.F.; Salio, P.; Kidd, C.; Huffman, G.J.; et al. Global precipitation measurement: Methods, datasets and applications. Atmos. Res. 2012, 104, 70–97. [Google Scholar] [CrossRef]
  17. Ayugi, B.; Tan, G.; Ullah, W.; Boiyo, R.; Ongoma, V. Inter-comparison of remotely sensed precipitation datasets over Kenya during 1998–2016. Atmos. Res. 2019, 225, 96–109. [Google Scholar] [CrossRef]
  18. Hou, A.Y.; Kakar, R.K.; Neeck, S.; Azarbarzin, A.A.; Kummerow, C.D.; Kojima, M.; Oki, R.; Nakamura, K.; Iguchi, T. The global precipitation measurement mission. Bull. Am. Meteorol. Soc. 2014, 95, 701–722. [Google Scholar] [CrossRef]
  19. Huffman, G.J.; Bolvin, D.T.; Braithwaite, D.; Hsu, K.; Joyce, R.; Xie, P.; Yoo, S.-H. NASA global precipitation measurement (GPM) integrated multi-satellite retrievals for GPM (IMERG). Algorithm Theor. Basis Doc. (ATBD) Vers. 2015, 4, 26. [Google Scholar]
  20. Huffman, G.J.; Bolvin, D.T.; Nelkin, E.J.; Wolff, D.B.; Adler, R.F.; Gu, G.; Hong, Y.; Bowman, K.P.; Stocker, E.F. The TRMM multisatellite precipitation analysis (TMPA): Quasi-global, multiyear, combined-sensor precipitation estimates at fine scales. J. Hydrometeorol. 2007, 8, 38–55. [Google Scholar] [CrossRef]
  21. Kubota, T.; Shige, S.; Hashizume, H.; Aonashi, K.; Takahashi, N.; Seto, S.; Hirose, M.; Takayabu, Y.N.; Ushio, T.; Nakagawa, K. Global precipitation map using satellite-borne microwave radiometers by the GSMaP project: Production and validation. IEEE Trans. Geosci. Remote Sens. 2007, 45, 2259–2275. [Google Scholar] [CrossRef]
  22. Joyce, R.J.; Janowiak, J.E.; Arkin, P.A.; Xie, P. CMORPH: A method that produces global precipitation estimates from passive microwave and infrared data at high spatial and temporal resolution. J. Hydrometeorol. 2004, 5, 487–503. [Google Scholar] [CrossRef]
  23. Parker, W.S. Reanalyses and observations: What’s the difference? Bull. Am. Meteorol. Soc. 2016, 97, 1565–1572. [Google Scholar] [CrossRef] [Green Version]
  24. Bosilovich, M.G.; Chen, J.Y.; Robertson, F.R.; Adler, R.F. Evaluation of global precipitation in reanalyses. J. Appl. Meteorol. Climatol. 2008, 47, 2279–2299. [Google Scholar] [CrossRef]
  25. De Leeuw, J.; Methven, J.; Blackburn, M. Evaluation of ERA-Interim reanalysis precipitation products using England and Wales observations. Quart. J. R. Meteorol. Soc. 2015, 141, 798–806. [Google Scholar] [CrossRef] [Green Version]
  26. Behrangi, A.; Christensen, M.; Richardson, M.; Lebsock, M.; Stephens, G.; Huffman, G.J.; Bolvin, D.; Adler, R.F.; Gardner, A.; Lambrigtsen, B.; et al. Status of High latitude precipitation estimates from observations and reanalyses. J. Geophys. Res. Atmos. 2016, 121, 4468–4486. [Google Scholar] [CrossRef]
  27. Kishore, P.; Jyothi, S.; Basha, G.; Rao, S.V.B.; Rajeevan, M.; Velicogna, I.; Sutterley, T.C. Precipitation climatology over India: Validation with observations and reanalysis datasets and spatial trends. Clim. Dynam. 2016, 46, 541–556. [Google Scholar] [CrossRef] [Green Version]
  28. Cuo, L.; Zhang, Y. Spatial patterns of wet season precipitation vertical gradients on the Tibetan Plateau and the surroundings. Sci. Rep. 2017, 7, 5057. [Google Scholar] [CrossRef]
  29. Essou, G.R.C.; Brissette, F.; Lucas-Picher, P. The Use of Reanalyses and Gridded Observations as Weather Input Data for a Hydrological Model: Comparison of Performances of Simulated River Flows Based on the Density of Weather Stations. J. Hydrometeorol. 2017, 18, 497–513. [Google Scholar] [CrossRef]
  30. Ma, L.; Zhang, T.; Frauenfeld, O.W.; Ye, B.; Yang, D.; Qin, D. Evaluation of precipitation from the ERA-40, NCEP-1, and NCEP-2 Reanalyses and CMAP-1, CMAP-2, and GPCP-2 with ground-based measurements in China. J. Geophys. Res. Atmos. 2009, 114. [Google Scholar] [CrossRef]
  31. Tong, K.; Su, F.; Yang, D.; Zhang, L.; Hao, Z. Tibetan Plateau precipitation as depicted by gauge observations, reanalyses and satellite retrievals. Int. J. Climatol. 2014, 34, 265–285. [Google Scholar] [CrossRef]
  32. Ashouri, H.; Sorooshian, S.; Hsu, K.-L.; Bosilovich, M.G.; Lee, J.; Wehner, M.F.; Collow, A. Evaluation of NASA’s MERRA Precipitation Product in Reproducing the Observed Trend and Distribution of Extreme Precipitation Events in the United States. J. Hydrometeorol. 2016, 17, 693–711. [Google Scholar] [CrossRef] [Green Version]
  33. Chen, G.; Iwasaki, T.; Qin, H.; Sha, W. Evaluation of the warm-season diurnal variability over East Asia in recent reanalyses JRA-55, ERA-Interim, NCEP CFSR, and NASA MERRA. J. Clim. 2014, 27, 5517–5537. [Google Scholar] [CrossRef]
  34. Barros, A.P.; Lang, T.J. Monitoring the monsoon in the Himalayas: Observations in central Nepal, June 2001. Mon. Weather Rev. 2003, 131, 1408–1427. [Google Scholar] [CrossRef]
  35. Ichiyanagi, K.; Yamanaka, M.D.; Muraji, Y.; Vaidya, B.K. Precipitation in Nepal between 1987 and 1996. Int. J. Climatol. J. R. Meteorol. Soc. 2007, 27, 1753–1762. [Google Scholar] [CrossRef]
  36. Karki, R.; Schickhoff, U.; Scholten, T.; Böhner, J. Rising precipitation extremes across Nepal. Climate 2017, 5, 4. [Google Scholar] [CrossRef] [Green Version]
  37. Dimri, A. Relationship between ENSO phases with Northwest India winter precipitation. Int. J. Climatol. 2013, 33, 1917–1923. [Google Scholar] [CrossRef]
  38. Hamal, K.; Sharma, S.; Baniya, B.; Khadka, N.; Zhou, X. Inter-annual variability of Winter Precipitation over Nepal coupled with ocean-atmospheric patterns during 1987-2015. Front. Earth Sci. 2020, 8, 161. [Google Scholar] [CrossRef]
  39. Baniya, B.; Tang, Q.; Xu, X.; Haile, G.G.; Chhipi-Shrestha, G. Spatial and temporal variation of drought based on satellite derived vegetation condition index in Nepal from 1982–2015. Sensors 2019, 19, 430. [Google Scholar] [CrossRef] [Green Version]
  40. Talchabhadel, R.; Karki, R.; Parajuli, B. Intercomparison of precipitation measured between automatic and manual precipitation gauge in Nepal. Measurement 2017, 106, 264–273. [Google Scholar] [CrossRef]
  41. Llansó, P. Guidelines on Climate Observation: Networks and Systems; World Meteorological Organization: Geneva, Switzerland, 2003. [Google Scholar]
  42. Rienecker, M.M.; Suarez, M.J.; Gelaro, R.; Todling, R.; Bacmeister, J.; Liu, E.; Bosilovich, M.G.; Schubert, S.D.; Takacs, L.; Kim, G.-K. MERRA: NASA’s modern-era retrospective analysis for research and applications. J. Clim. 2011, 24, 3624–3648. [Google Scholar] [CrossRef]
  43. Gelaro, R.; McCarty, W.; Suarez, M.J.; Todling, R.; Molod, A.; Takacs, L.; Randles, C.A.; Darmenov, A.; Bosilovich, M.G.; Reichle, R.; et al. The Modern-Era Retrospective Analysis for Research and Applications, Version 2 (MERRA-2). J. Clim. 2017, 30, 5419–5454. [Google Scholar] [CrossRef] [PubMed]
  44. Rienecker, M.; Suarez, M.; Todling, R.; Bacmeister, J.; Takacs, L.; Liu, H.-C.; Gu, W.; Sienkiewicz, M.; Koster, R.; Gelaro, R. The GEOS-5 Data Assimilation System—Documentation of Versions 5.0. 1, 5.1. 0, and 5.2. 0; Technical Report Series on Global Modeling and Data Assimilation; NASA: Washington, DC, USA, 2008. [Google Scholar]
  45. Molod, A.; Takacs, L.; Suarez, M.; Bacmeister, J. Development of the GEOS-5 atmospheric general circulation model: Evolution from MERRA to MERRA2. Geosci. Model Dev. 2015, 8, 1339–1356. [Google Scholar] [CrossRef] [Green Version]
  46. Monsieurs, E.; Kirschbaum, D.B.; Tan, J.; Maki Mateso, J.-C.; Jacobs, L.; Plisnier, P.-D.; Thiery, W.; Umutoni, A.; Musoni, D.; Bibentyo, T.M. Evaluating TMPA rainfall over the sparsely gauged East African Rift. J. Hydrometeorol. 2018, 19, 1507–1528. [Google Scholar] [CrossRef]
  47. Liechti, T.C.; Matos, J.P.; Boillat, J.L.; Schleiss, A.J. Comparison and evaluation of satellite derived precipitation products for hydrological modeling of the Zambezi River Basin. Hydrol. Earth Syst. Sci. 2012, 16, 489–500. [Google Scholar] [CrossRef] [Green Version]
  48. Thiemig, V.; Rojas, R.; Zambrano-Bigiarini, M.; Levizzani, V.; De Roo, A. Validation of Satellite-Based Precipitation Products over Sparsely Gauged African River Basins. J. Hydrometeorol. 2012, 13, 1760–1783. [Google Scholar] [CrossRef]
  49. Bai, P.; Liu, X.M. Evaluation of Five Satellite-Based Precipitation Products in Two Gauge-Scarce Basins on the Tibetan Plateau. Remote Sens. 2018, 10, 1316. [Google Scholar] [CrossRef] [Green Version]
  50. Wang, W.; Lu, H.; Zhao, T.J.; Jiang, L.M.; Shi, J.C. Evaluation and Comparison of Daily Rainfall From Latest GPM and TRMM Products Over the Mekong River Basin. IEEE J. Stars 2017, 10, 2540–2549. [Google Scholar] [CrossRef]
  51. Feidas, H. Validation of satellite rainfall products over Greece. Theor. Appl. Climatol. 2010, 99, 193–216. [Google Scholar] [CrossRef]
  52. Li, Z.; Yang, D.W.; Hong, Y. Multi-scale evaluation of high-resolution multi-sensor blended global precipitation products over the Yangtze River. J. Hydrol. 2013, 500, 157–169. [Google Scholar] [CrossRef]
  53. Casanueva Vicente, A.; Rodríguez Puebla, C.; Frías Domínguez, M.D.; González Reviriego, N. Variability of extreme precipitation over Europe and its relationships with teleconnection patterns. Hydrol. Earth Syst. 2014. [Google Scholar] [CrossRef] [Green Version]
  54. Duncan, J.M.; Biggs, E.M.; Dash, J.; Atkinson, P.M. Spatio-temporal trends in precipitation and their implications for water resources management in climate-sensitive Nepal. Appl. Geogr. 2013, 43, 138–146. [Google Scholar] [CrossRef]
  55. Xu, X.; Frey, S.K.; Boluwade, A.; Erler, A.R.; Khader, O.; Lapen, D.R.; Sudicky, E. Evaluation of variability among different precipitation products in the Northern Great Plains. J. Hydrol. Reg. Stud. 2019, 24, 100608. [Google Scholar] [CrossRef]
  56. Nkiaka, E.; Nawaz, N.; Lovett, J. Evaluating global reanalysis precipitation datasets with rain gauge measurements in the Sudano-Sahel region: Case study of the Logone catchment, Lake Chad Basin. Meteorol. Appl. 2017, 24, 9–18. [Google Scholar] [CrossRef]
  57. Shah, R.; Mishra, V. Evaluation of the reanalysis products for the monsoon season droughts in India. J. Hydrometeorol. 2014, 15, 1575–1591. [Google Scholar] [CrossRef]
  58. Wang, G.; Zhang, X.; Zhang, S. Performance of Three Reanalysis Precipitation Datasets over the Qinling-Daba Mountains, Eastern Fringe of Tibetan Plateau, China. Adv. Meteorol. 2019, 2019. [Google Scholar] [CrossRef] [Green Version]
  59. Tarek, M.; Brissette, F.P.; Arsenault, R. Evaluation of the ERA5 reanalysis as a potential reference dataset for hydrological modeling over North-America. Hydrol. Earth Syst. Sci. Discuss. 2019, 1–35. [Google Scholar] [CrossRef]
  60. Jiang, S.; Ren, L.; Hong, Y.; Yong, B.; Yang, X.; Yuan, F.; Ma, M. Comprehensive evaluation of multi-satellite precipitation products with a dense rain gauge network and optimally merging their simulated hydrological flows using the Bayesian model averaging method. J. Hydrol. 2012, 452, 213–225. [Google Scholar] [CrossRef]
  61. Becker, A.; Schneider, U.; Meyer-Christoffer, A.; Ziese, M.; Finger, P.; Stender, P.; Heller, A.; Breidenbach, J. GPCC Report for Years 2009 and 2010; DWD: Offenbach, Germany, 2011. [Google Scholar]
  62. Sharma, S.; Chen, Y.; Zhou, X.; Yang, K.; Li, X.; Niu, X.; Hu, X.; Khadka, N. Evaluation of GPM-Era Satellite Precipitation Products on the Southern Slopes of the Central Himalayas Against Rain Gauge Data. Remote Sens. 2020, 12, 1836. [Google Scholar] [CrossRef]
  63. Nicholson, S.E.; Some, B.; McCollum, J.; Nelkin, E.; Klotter, D.; Berte, Y.; Diallo, B.; Gaye, I.; Kpabeba, G.; Ndiaye, O. Validation of TRMM and other rainfall estimates with a high-density gauge dataset for West Africa. Part I: Validation of GPCC rainfall product and pre-TRMM satellite and blended products. J. Appl. Meteorol. 2003, 42, 1337–1354. [Google Scholar] [CrossRef]
  64. Mahmud, M.R.; Numata, S.; Matsuyama, H.; Hosaka, T.; Hashim, M. Assessment of effective seasonal downscaling of TRMM precipitation data in Peninsular Malaysia. Remote Sens. 2015, 7, 4092–4111. [Google Scholar] [CrossRef] [Green Version]
  65. Müller, M.F.; Thompson, S.E. Bias adjustment of satellite rainfall data through stochastic modeling: Methods development and application to Nepal. Adv. Water Resour. 2013, 60, 121–134. [Google Scholar] [CrossRef] [Green Version]
  66. Blacutt, L.A.; Herdies, D.L.; de Gonçalves, L.G.G.; Vila, D.A.; Andrade, M.J.A.R. Precipitation comparison for the CFSR, MERRA, TRMM3B42 and Combined Scheme datasets in Bolivia. Atmos. Res. 2015, 163, 117–131. [Google Scholar] [CrossRef] [Green Version]
  67. Robertson, F.R.; Bosilovich, M.G.; Chen, J.; Miller, T.L. The effect of satellite observing system changes on MERRA water and energy fluxes. J. Clim. 2011, 24, 5197–5217. [Google Scholar] [CrossRef] [Green Version]
  68. Zandler, H.; Haag, I.; Samimi, C. Evaluation needs and temporal performance differences of gridded precipitation products in peripheral mountain regions. Sci. Rep. 2019, 9, 15118. [Google Scholar] [CrossRef] [PubMed] [Green Version]
Figure 1. The spatial distribution of 141 rain gauge network, and the elevation pattern over the study area. The blue lines divide the three subregions (Western, Central, and Eastern) of the country. The base map in the inset is from ESRI.
Hydrology 07 00040 g001
Figure 2. Monthly precipitation time-series (mm) from observed, MERRA-C, MERRA-NC average over Nepal during 2000–2018.
Hydrology 07 00040 g002
Figure 3. Boxplots for performance metrics (R, Root-Mean-Square Error (RMSE), mean bias (MB)) of MERRA-2 (MERRA-C and MERRA-NC) with observed datasets for annual timescale. The bold values and magenta dot in the boxplot represent the median and mean values of the statistical metrics, respectively.
Hydrology 07 00040 g003
Figure 4. Monthly precipitation cycle (mm/month) derived from observations, MERRA-C, and MERRA-NC for study region from January 2000 to December 2018.
Hydrology 07 00040 g004
Figure 5. Spatial distribution of mean annual precipitation (mm/year) in (a) Observation, (b) MERRA-C, and (c) MERRA-NC during 2000–2018.
Hydrology 07 00040 g005
Figure 6. Spatial distribution of mean bias (MB) at each station in MERRA-C and MERRA-NC for a different season, (a,b) pre-monsoon, (c,d) summer monsoon, (e,f) post-monsoon, and (g,h) winter, respectively. Red and blue circles represent the underestimated and overestimated of precipitation amount across the country, respectively.
Hydrology 07 00040 g006
Figure 7. Spatial distribution of (a) correlation coefficient (R) and (b) RMSE (mm/month) in MERRA-2 datasets for summer monsoon (JJAS) at each station during the study period.
Hydrology 07 00040 g007
Figure 8. Spatial distribution of bias in very wet events (R95p) at each station for (a,b) pre-monsoon, (c,d) monsoon, (e,f) post-monsoon, (g,h) winter between observed and MERRA-2 datasets, respectively. Red and blue circles represent the underestimated and overestimated of R95p events across the country, respectively.
Hydrology 07 00040 g008
Figure 9. Spatial distribution of bias in very wet events (R5p) at each station for (a,b) pre-monsoon, (c,d) monsoon, (e,f) post-monsoon, (g,h) winter between observed and MERRA-2 datasets, respectively. Red and blue circles represent the underestimated and overestimated of R5p events across the country, respectively.
Hydrology 07 00040 g009
Figure 10. Mean annual precipitation in observed and MERRA-2 datasets at different elevation range with a respective number of the station during the study period.
Hydrology 07 00040 g010
Figure 11. Scatterplot between observed, (a) MERRA-C, and (b) MERRA-NC generated by monthly datasets at all stations between 2000 and 2018 across the study area. The unit of the figure metrics is in mm/month.
Hydrology 07 00040 g011
Table 1. The RMSE, MB, R, and Nash–Sutcliffe efficiency (NSE) between MERRA-2 and observed datasets based on the monthly mean value from 2000 to 2018 over the study area. SD represents the standard deviation of respective datasets.
DatasetsMean (mm/Month)RMSE (mm/Month)MB (mm/Month)RNSESD
MERRA-C92.7382.72−56.7210.73104.48
MERRA-NC188.8075.1039.350.990.78229.42
Table 2. Spatial performance of both MERRA-2 datasets for the different seasons during 2000–2018. SD represents the standard deviation of respective datasets. The blue font shows the best performance in the respective metrics.
SeasonDatasetsMean (mm/Month)RMSE (mm/Month)MB (mm/Month)RNSESDMean OBS
(mm/Month)
Pre-monsoonMERRA-C44.6150.75−33.820.44−0.3813.0178.43
MERRA-NC62.4749.27−15.950.37−0.3941.18
Summer monsoonMERRA-C222.64205−130.020.3−0.5348.75353.46
MERRA-NC484.11267.82130.640.1−1.62183.28
Post-monsoonMERRA-C24.7522.37−10.510.50.108.5535.26
MERRA-NC49.2126.9613.950.46−0.4222.07
WinterMERRA-C10.487.35−4.70.650.124.8415.17
MERRA-NC23.912.538.720.77−1.8513.39
AnnualMERRA-C94.2386.48−57.040.34-0.8720.64151.27
MERRA-NC196.9103.9745.620.18−1.2777.08

