Article

Evolution of Acid Mine Drainage from a Coal Waste Rock Pile Reclaimed with a Simple Soil Cover

by
Murugan Ramasamy
1,† and
Christopher Power
2,*
1
Verschuren Centre, Cape Breton University, Sydney, NS B1P 6L2, Canada
2
Department of Civil and Environmental Engineering, Western University, London, ON N6A 5B9, Canada
*
Author to whom correspondence should be addressed.
Now at: National Centre for Earth Science Studies, Ministry of Earth Sciences, Government of India, Kerala 695 011, India
Hydrology 2019, 6(4), 83; https://doi.org/10.3390/hydrology6040083
Submission received: 16 May 2019 / Revised: 18 September 2019 / Accepted: 19 September 2019 / Published: 23 September 2019

Abstract

:
Waste rock piles (WRPs) are commonly remediated with cover systems to limit water and oxygen influx and mitigate the impacts of acid mine drainage (AMD) on the environment. While numerous types of cover systems exist, simple, single-layer soil covers remain an attractive option due to their low cost and simplicity of installation. Since knowledge of their long-term performance in humid climates is limited, this study was undertaken to assess and predict a single-layer cover system at a WRP in Nova Scotia, Canada. A two-dimensional finite element model was developed to simulate variably saturated flow and solute transport at the WRP and surrounding area. Key parameters collected during five years of field monitoring, including moisture contents, groundwater levels and dissolved metal concentrations, were used to produce a well-calibrated and verified model. Early results confirm that the cover system has already decreased AMD into both groundwater (reduced water infiltration/seepage in the WRP) and surface water (eliminated contaminated surface water runoff). Long-term acidity depletion rates indicate that all sulphidic minerals within the pile will be oxidized within 34 years, but due to the slow leaching rates into water, it will take over 9000 years to deplete all acidity. Numerical simulations predict the evolution of groundwater and surface water quality over time until full acidity depletion. Current work involves kinetic tests on waste rock samples to more accurately access the annual generation and release of AMD.

1. Introduction

Mine waste rock piles (WRPs) are large accumulations of waste rock, fine coal, tailings and other mining and processing wastes. WRPs can contain significant amounts of reactive sulphide minerals, including pyrite and pyrrhotite, which when exposed to oxygen and water, can generate acid mine drainage (AMD). This AMD is generally characterized by low pH and high concentrations of sulphate, heavy metals and other toxic elements [1,2,3]. As a result, WRPs have the capacity to cause severe environmental impacts, particularly on soil, water resources and aquatic communities [4,5]. Numerous studies provide detailed reviews of AMD components, including geochemistry [6], impacts [7] and remediation options [8].
To prevent and/or control the generation of AMD, cover systems are installed over the WRP to isolate the reactive waste from the atmosphere and thereby limit the influx of meteoric water and atmospheric oxygen to the waste rock [9,10]. The design of a cover system is site-specific and dependent on several factors, including site conditions (i.e., climate, hydrogeology, waste rock geochemistry), installation complexity and cost, material availability and site closure objectives [11,12]. As a result, numerous covers exist, ranging from a single-layer of earthen material to multiple layers of different materials such as native soils, organic materials and geosynthetics [12,13,14,15,16].
Single-layer cover systems are the most straightforward option to implement and maintain at WRPs. A single layer of earthen material uses the moisture ‘store-and-release’ concept to limit water influx by storing infiltrating water within the material and subsequently releasing it back to the atmosphere via evapotranspiration. The earthen material also provides a medium for the establishment of a vegetative canopy. This cover type is most commonly used in semi-arid and arid climates, where potential evaporation exceeds precipitation [17,18].
In humid regions, water storage can be overwhelmed in the earthen material layer. Monolayer covers with elevated water table have been effective in humid climates to act as a barrier to oxygen influx and prevent new AMD generation [19]. Multi-layer systems have also been applied, which include layered covers with capillary barrier effects (CCBE) [20], geosynthetic clay liner (GCL) [21] or geomembrane liner [12]. However, these more complex and expensive systems can also suffer in humid climates. For example, it can be challenging for CCBE covers to maintain a high degree of saturation all year (i.e., high evaporation during summer months; freeze and thaw effects) [22], while GCLs can be significantly affected by desiccation and freeze-thaw cycling [23]. As a result, single-layer covers can still be an attractive closure option at WRP sites: They are the least complex and most inexpensive system to both install and maintain and can meet other key performance criteria at WRPs, such as landform stability, sustainable vegetation canopy and removal of contaminated surface water runoff [15].
Historically, cover performance has been evaluated by monitoring various parameters within the WRP, such as site-specific climate, pore-gas concentrations, moisture content, net percolation and seepage water quality [24,25]. Power et al. [15] demonstrated the application of a single-layer cover to (i) eliminate contaminated surface water runoff, (ii) minimize AMD impacts to surface water receptors, (iii) maintain a stable landform and (iv) provide a sustainable vegetative canopy. While these field studies have been able to directly assess single-layer cover performance, they are limited to the short-term immediately following installation (≤5 years). No information is available on long-term cover performance and associated AMD evolution.
Numerical modeling is necessary to predict the long-term evolution of groundwater contaminants during and/or following remediation, including chlorinated solvents [26], acid mine drainage [27] and landfill leachate [28]. In WRP studies, numerical models have been used to examine various processes occurring within the waste rock, ranging from unsaturated water flow in hypothetical WRPs [29] to complete representations of sulphide oxidation (including heat transport, diffusive and convective air transport, spatially and temporally dependent pyrite oxidation rates) at full-scale WRPs [30,31,32]. A comprehensive review of WRP numerical modeling studies is provided by Amos et al. [1].
While complex hydrological and geochemical processes within WRPs have been studied, a very limited number of studies have simulated the spatial and temporal evolution of AMD emanating from WRPs. The evolution of AMD impacts on groundwater quality at a WRP site remediated with a geomembrane-lined cover has been simulated [27]; however, no study has incorporated the unsaturated flow through the WRP following remediation, which is still significant when a single-layer soil cover is installed. In addition to AMD, analogous studies have simulated the migration of groundwater plumes containing RDX and nitrate [33] and acrylonitrile [34].
In this study, a numerical investigation is presented of a remediated mining site that includes a WRP overlain with a single-layer moisture ‘store-and-release’ cover system. A two-dimensional (2D) variably saturated water flow and contaminant transport model of the study site was developed in FEFLOW and then calibrated and verified with key parameters collected during post-remediation field monitoring. The model was then simulated for 10,000 years to predict the spatial and temporal evolution of AMD and assess the long-term effectiveness of remediation.

2. Materials and Methods

2.1. Study Site

2.1.1. Site Description

The Sydney Coalfield in Nova Scotia, Canada is one of the oldest mined coal fields in North America, with mining activities performed between the early 1700s and the early 2000s. Mining activities at the former Lingan Mine Colliery site occurred between 1970 and 1992, during which time approximately 28 million tonnes (tonne = Mg) of coal were extracted from the Lingan Harbour Seam. During operation, surplus coal fines and mine waste rock from both the Lingan colliery and adjacent Phalen colliery were deposited into a WRP [16].
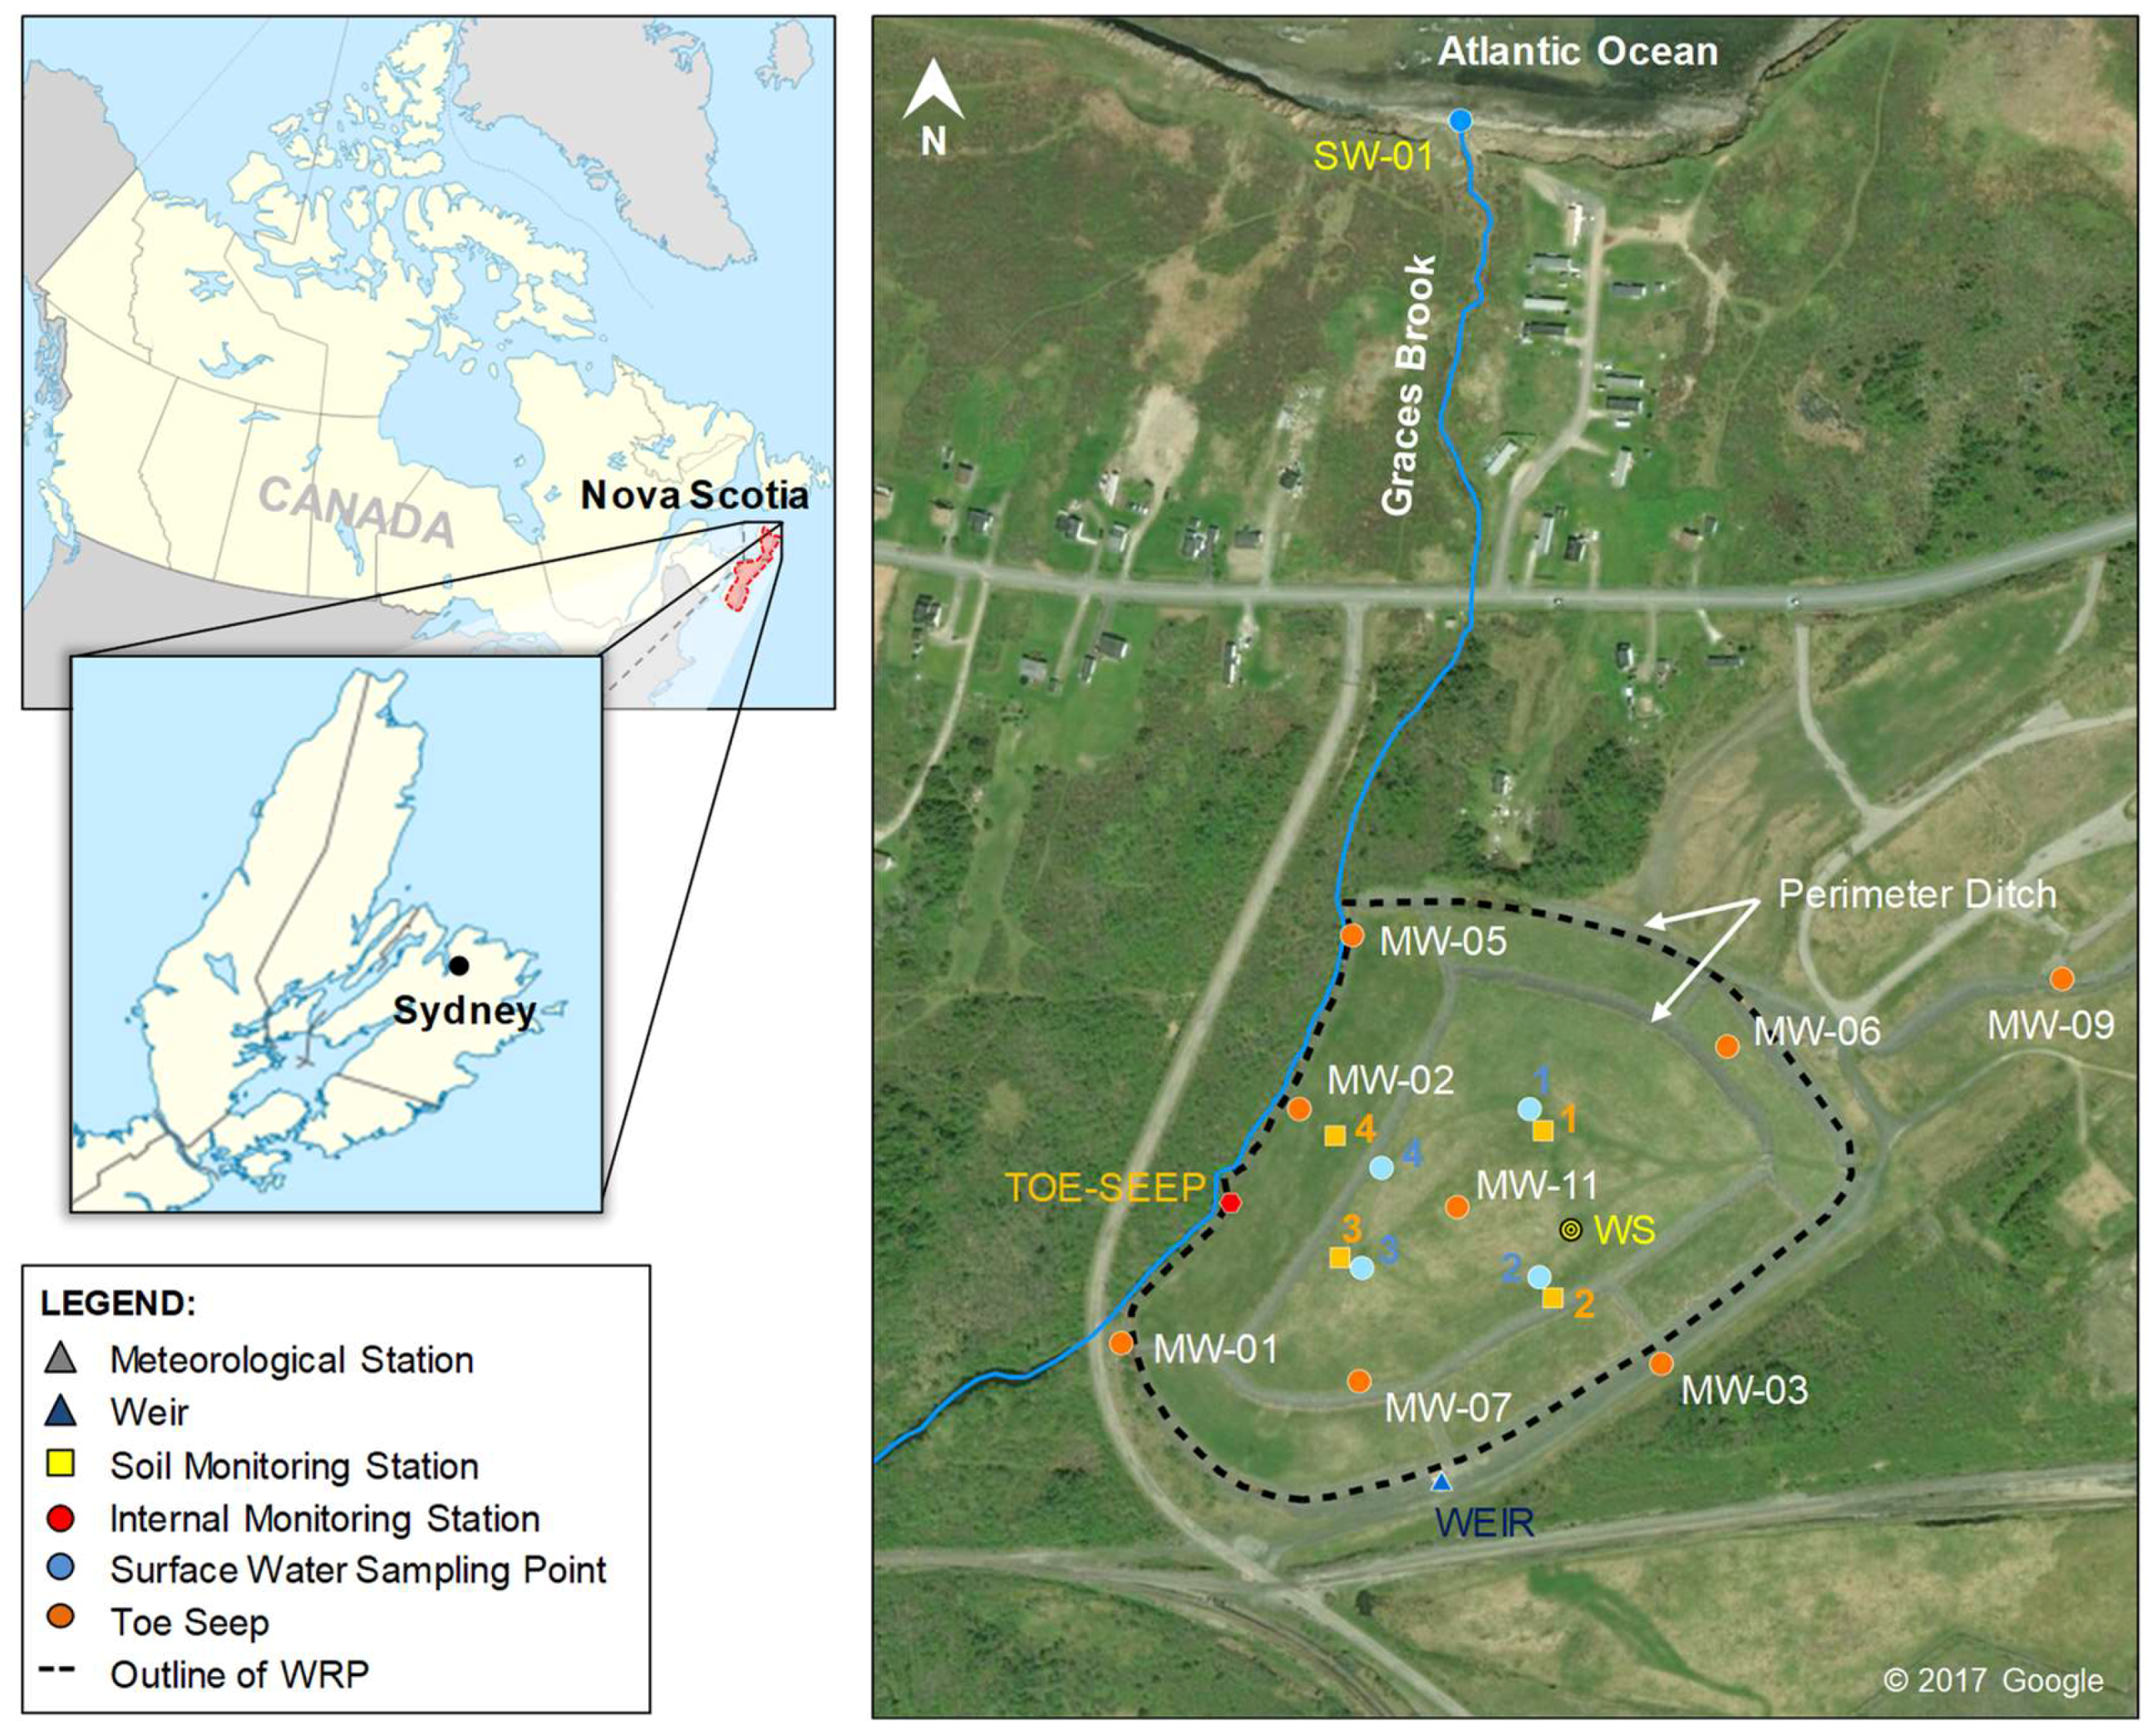
The consolidated WRP covers an area of 82,000 m2 and contains 380,000 m3 of waste rock. It is approximately 15 m high, with slopes ranging between 1% and 10% on the plateau of the pile and between 4% and 20% on the side slopes. Figure 1 presents a plan view of the Lingan WRP and surrounding area. The site lies in a seasonally humid region with a mean annual precipitation of 1500 mm.

2.1.2. Geology and Hydrogeology

A number of site investigations were conducted at the site between 2004 and 2010 to assess and delineate the adverse impacts of the Lingan WRP on the receiving environment and assist in the remedial and cover system design. As part of these investigations, a number of boreholes with monitoring well installations were completed in 2008, within and around the footprint of the WRP. In 2011, four soil monitoring stations (SMSs) and four continuous multi-level tubing (CMT) wells were installed alongside the cover system. At all wells, soil stratigraphy was continuously logged with respect to soil type. The location of these wells is indicated in Figure 1.
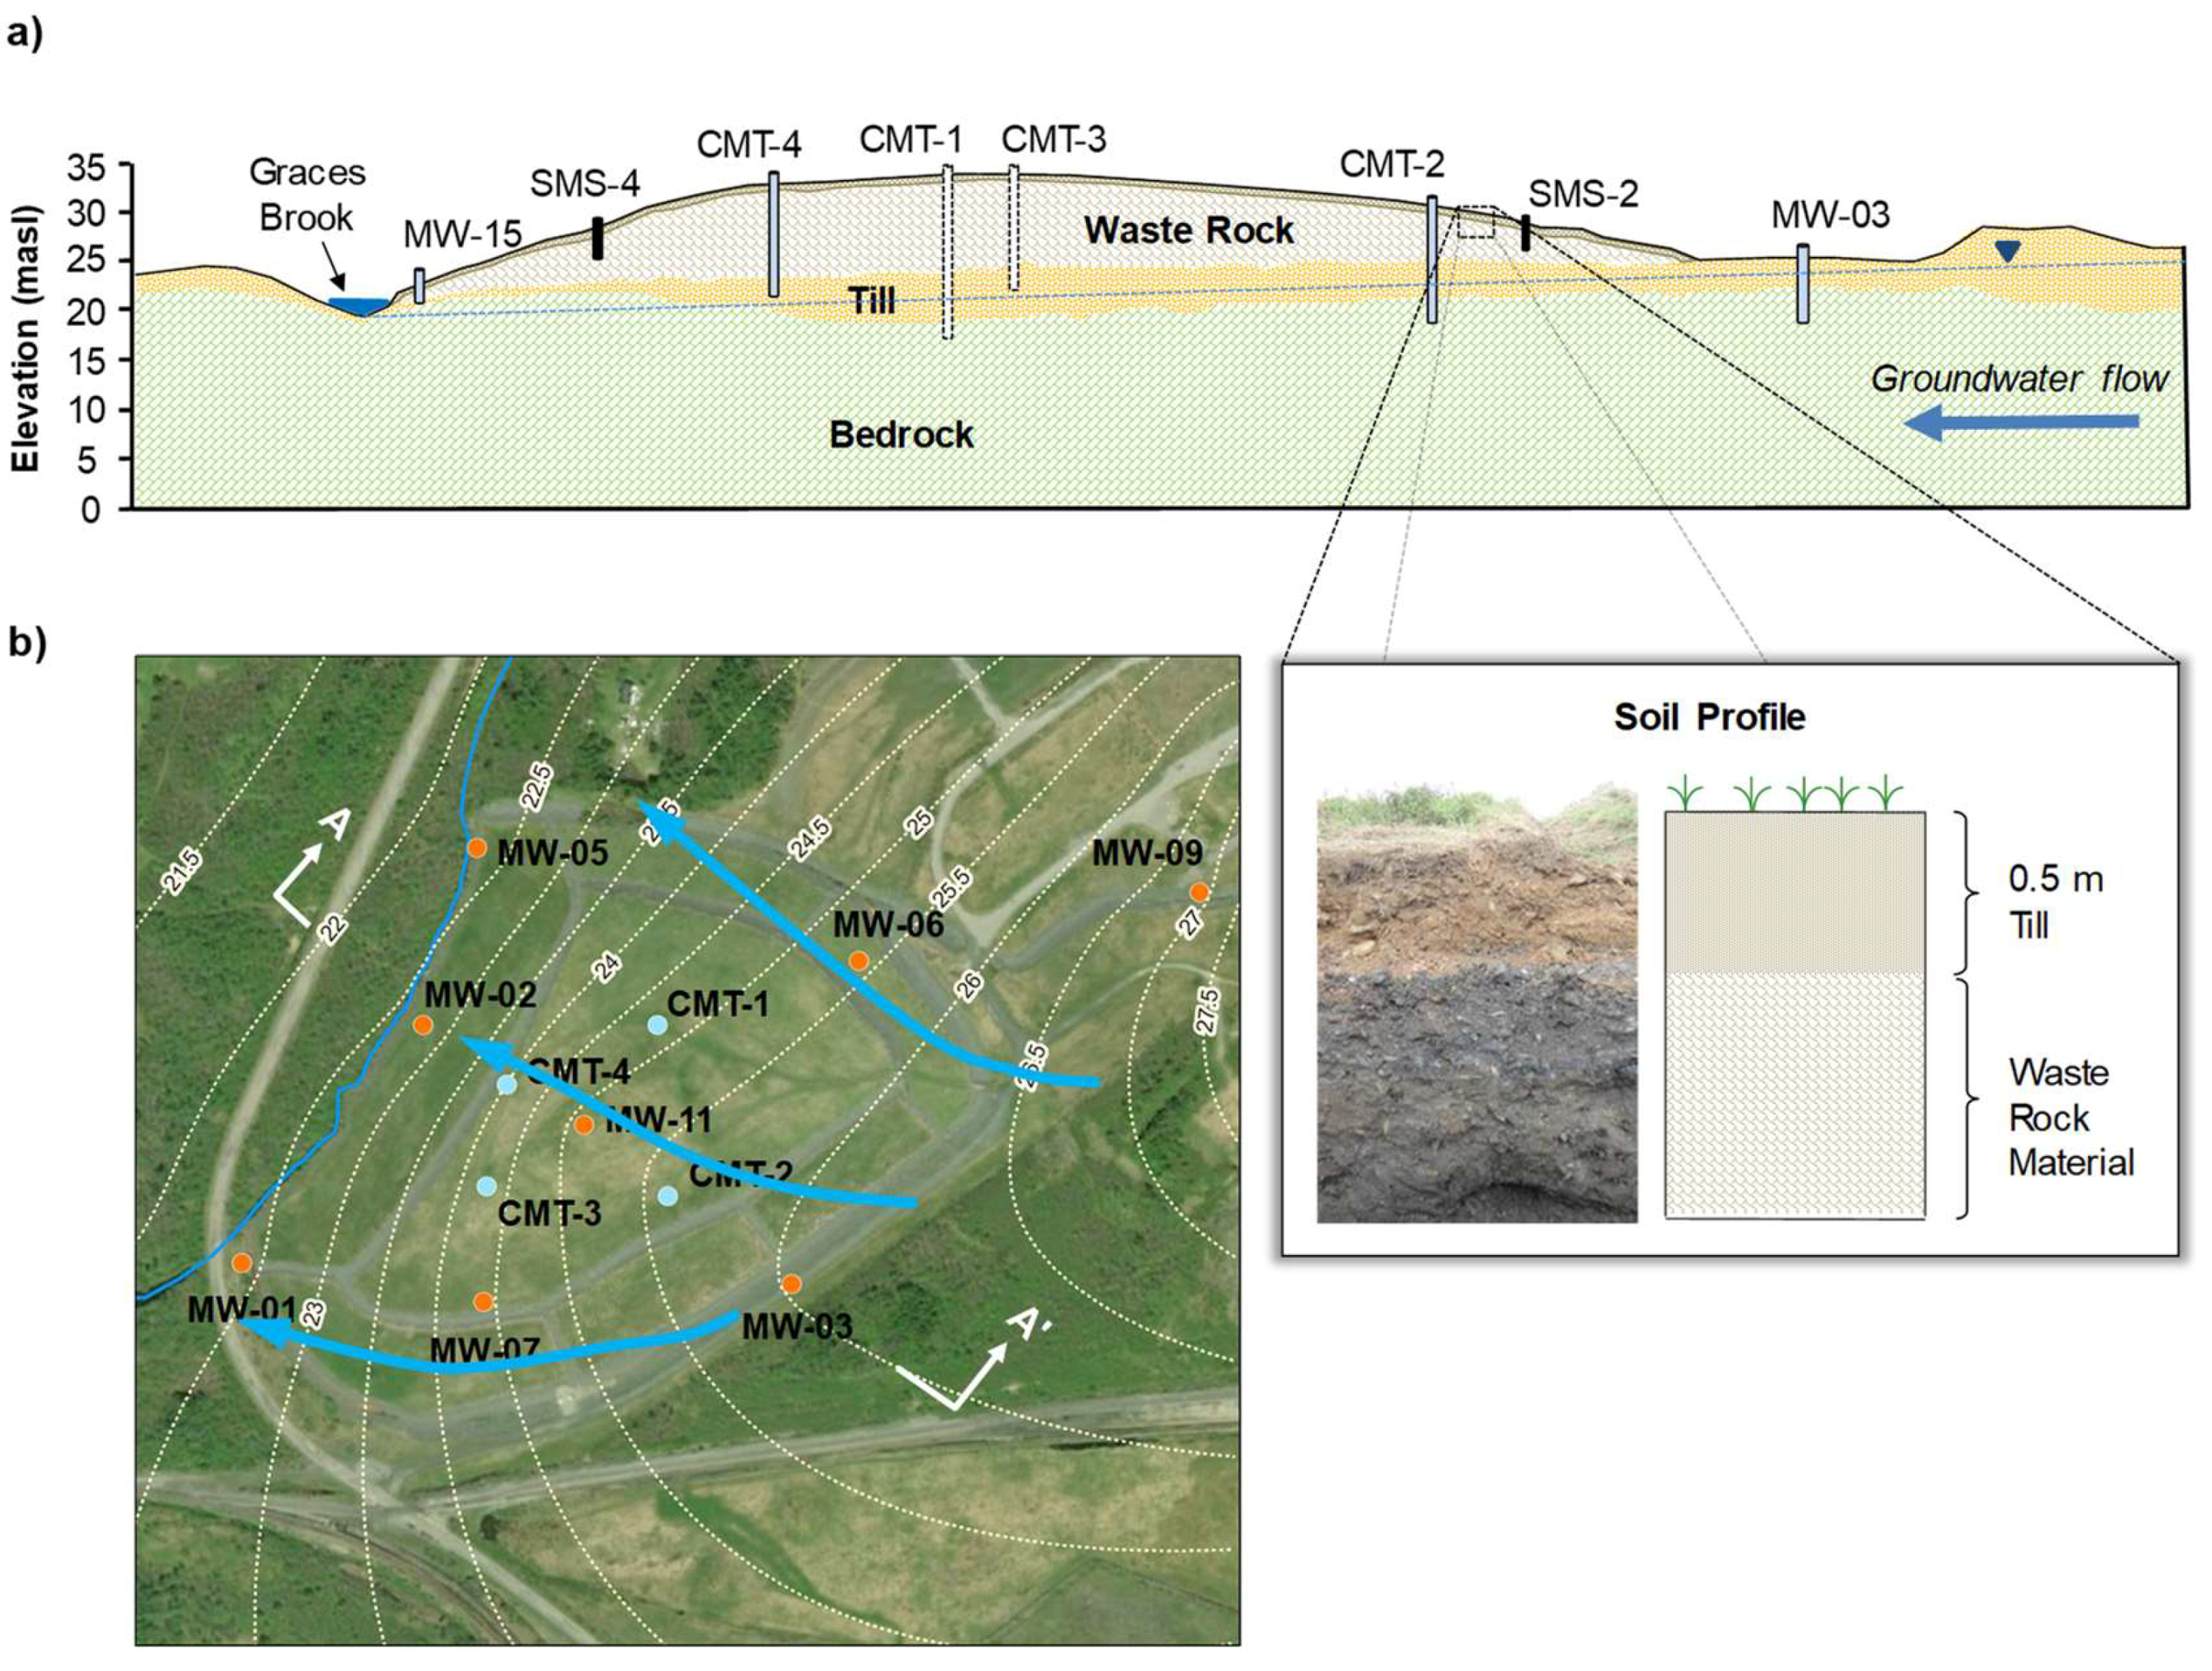
Figure 2a presents a schematic of the geological vertical cross-section (A-A′) through the WRP, and illustrates the waste rock, till and bedrock units. The waste rock material consists of non-native black and brown gravel with sand and coal fines ranging from 1.3 m to 15.2 m in thickness, with the thickest deposits near the center of the WRP. The waste rock overlies a geologic unit of native till material, which consists of brown silty sand with gravel and ranges in thickness from 0.5 m to 6.4 m beneath the pile. The bedrock unit is characterized as soft, brown/grey sandstone from the Morien Group Sydney Mines Formation, of the Late Carboniferous period. Table 1 presents a summary of each geologic unit.
Groundwater levels were measured at the historical monitoring wells in September and December 2008. Since these wells were then decommissioned in 2009, it was not possible to get groundwater levels at the same time as the four CMT wells, which had been installed in 2011. As a result, the mean of the water levels recorded at the monitoring wells in 2008 were combined with the water levels at the four CMT wells in June 2012 to highlight the groundwater flow regime at the site. The piezometric surface and flow directions within the WRP and surrounding area are illustrated in Figure 2b. The groundwater is predominantly flowing in an east-to-northwest direction and coincides with the orientation of the cross-section in Figure 2a. Groundwater is also flowing in an east-to-west direction through the southern part of the pile.
As shown in Figure 1, the stream (known as ‘Graces Brook’) adjacent to the western slope of the WRP flows northwards and ultimately discharges to the Atlantic Ocean. Due to the known groundwater flow direction, Graces Brook is considered downgradient of the WRP and is known to receive shallow groundwater discharge. A small toe seep exists at a single location near Graces Brook where flowing groundwater ‘daylights’ at the surface. From this preliminary investigation, the main environmental receptors of AMD at the study site are the underlying groundwater and Graces Brook. While no subsurface information is available to the west of the WRP and the stream, groundwater is expected to continue along a northwestern path towards the Atlantic Ocean.

2.1.3. Material Characterization

The various materials within the WRP site have been characterized using several methods. Figure 3a,b presents the particle size distribution and moisture retention curves, respectively, for the till material used in the cover and the waste rock material.
Acid base accounting (ABA) tests are well established and widely accepted to characterize waste rock acidity [35,36]. ABA tests were performed on eight waste rock samples that were collected during drilling of the four CMT wells: One shallow and one deep sample were used from each CMT well. Waste rock acidity exists in two forms: Stored acidity or potential acidity. Stored acidity is existing acidity that is readily available for transport to the receiving environment, while potential acidity first requires oxidation of the sulphidic minerals to generate ‘additional’ stored acidity.

2.2. Site Remediation and Monitoring

The key remedial objective at the Lingan WRP was to attenuate the impact of AMD to the primary environmental receptors (groundwater and Graces Brook) over time.

2.2.1. Cover System

The primary mechanisms for long-term mitigation of AMD impacts to the receiving environment would be through: (i) Maintaining and/or reducing AMD loading to underlying groundwater, and (ii) eliminating contaminated surface water runoff from the pile into Graces Brook.
In 2011, the Lingan WRP was overlain with a moisture store-and-release cover system. The cover consists of a 0.5 m thick single layer of till material sourced from local borrow areas. The 0.5 m thickness was sufficient to meet the necessary requirements and provide sufficient depth to allow a vegetative cover and root system to thrive. The cover was then hydro-seeded to promote the establishment of sustainable vegetation. Perimeter ditches were installed around both the plateau and base of the WRP to help manage and divert surface runoff from the pile, and any toe seepage water, into Graces Brook and prevent soil cover erosion. Toe protection was installed at the base of the WRP for long-term protection and stability.

2.2.2. Field Monitoring

An extensive field monitoring program was performed at the study site using state-of-the-art field instrumentation. A meteorological station measured rainfall, air temperature, relative humidity, wind speed and direction, barometric pressure, net radiation and snowpack depth at the pile. Meteorological parameters were measured every 60 s, with hourly and daily averages stored by robust Campbell scientific data acquisition systems (DASs). A 60° V-notch weir monitored runoff flow rates in the perimeter ditch at a southeast location as indicated in Figure 1.
The four SMSs installed across the WRP were used to continuously monitor moisture and temperature conditions within the cover and shallow waste rock material. SMS-1 to SMS-3 are located on the pile plateau, while SMS-4 is located on the slope to capture the differing hydraulic behavior. At all stations, thermal conductivity sensors measured in situ matric suction (negative pore-water pressure), while time domain reflectometry (TDR) sensors measured in situ volumetric moisture content. These sensors were installed along single depth profiles at each station, with sensor depths of 0.05, 0.10, 0.20, 0.30, 0.40, 0.48, 0.52 and 1.85 m. Each parameter was automatically recorded every three hours by DAS. It is assumed that all sensors are unaffected by surrounding soil conditions.
The four CMT wells were installed across the WRP and through the entire depth of the waste rock and completed in the shallow bedrock (depths ranging from 13.7 m to 19.7 m). Each CMT well provided six sampling depths, ranging from 1.4 m to 14.9 m. Soil temperature is automatically monitored at each depth, with pore-gas pressure monitored at two depths and pore-gas concentrations manually measured at the remaining depths. Groundwater levels and groundwater samples (for chemical analysis) were typically collected monthly through the central channel of each CMT well.
The post-remediation monitoring program was conducted between June 2012 and December 2016. This program included the monthly collection of data/samples from the meteorological station, weir, SMSs and CMT wells. Furthermore, surface water flow rates and geochemical analysis was also monitored at various locations along Graces Brook. While the historical monitoring wells were decommissioned in 2009, the groundwater levels and samples collected at these wells in September 2008 and December 2008 were used to estimate pre-remediation conditions. Table 2 summarizes the Lingan WRP site monitoring elements and sampling periods.

3. Model Development

A 2D transient flow and contaminant transport numerical model was developed to analyze and predict the variably saturated flow and AMD contaminant transport at the study site. The model was developed using FEFLOW 6.2, which is a 2D and 3D finite element modeling package that can simulate steady or transient state, unsaturated and saturated flow, fluid density, coupled flow and mass transport [37]. It has been widely used in a range of hydrogeological studies [38,39].

3.1. Model Discretization

Due to the low sampling density and subsurface information available at the site, it was not possible to simulate a 3D model of the site but instead a representative 2D cross-section through the WRP. As indicated in Figure 2b, the cross-section is parallel with the dominant flow direction, orientated in a southeast-to-northwest direction. It intersects the center of the WRP and traverses alongside a number of sampling locations, including SMS-2, SMS-4, CMT-2, CMT-4, MW-03, MW-11 and MW-02. The developed model domain comprises all geologic units and extends beyond the WRP footprint to include upgradient and downgradient geology and the surface water receptor at Graces Brook. The final 2D model domain was 351 m wide and 35 m high.
The model domain was discretized into a 2D finite element mesh. The mesh was generated using the algorithm of the Triangle Mesh generator, with the mesh size ranging from 0.5–1.0 m in length. The resulting model domain consisted of 14,474 triangular finite element cells. It was then subdivided vertically into seven layers with variable thicknesses to represent the various geologic units. The 0.5 m thick cover material was modeled by a single layer (Layer 1), while the variably thick waste rock was modeled by four layers (Layers 2 to 5). Layer 6 and Layer 7 were used to represent the till and bedrock, respectively. Table 1 summarizes the various layers in the model domain.

3.2. Boundary Conditions

The various boundary conditions assigned to the model domain are indicated in Figure 4. Both the right-hand side and left-hand side boundaries of the model were defined as a variable head. The variable heads are based on the varying groundwater levels measured over time in the CMT wells located closest to the boundary. A recharge boundary condition was assigned to the ground surface, with temporally variable flux rates defined for the WRP cover and surrounding overburden. A no flow condition was applied to the bottom boundary, while Graces Brook was defined as a river head boundary. Although not expected to be significant, the small toe seep was modeled by a seepage face boundary that was 1 m in length and located at the downslope of WRP just above the Graces Brook boundary.

3.3. Model Input Parameters

An extensive database of field parameters was generated during the field monitoring program conducted between 2012 and 2016. From this database, the following parameters were used in the development, calibration and verification of the transient flow and contaminant transport model: Material hydraulic properties, hydraulic heads, recharge and contaminant source.

3.3.1. Material Hydraulic Properties

To simulate flow within the variably saturated WRP, the pressure head–saturation and relative hydraulic conductivity–saturation relationships needed to be defined for each finite element. The van Genuchten empirical model [40] was used to describe these relationships, which included the following parameters: Curve fitting parameter (α), pore size distribution index (n), residual saturation (Sr) and maximum saturation (Ss). The initial van Genuchten parameters were based on values using by Widomski et al. [41] for unsaturated layers, and subsequently modified through calibration.

3.3.2. Hydraulic Head

The initial hydraulic head distribution was based on groundwater levels recorded at the four CMT wells following cover installation (June 2012) and the mean groundwater levels recorded at the historical monitoring wells (September and December 2008). Figure 2b shows the piezometric surface at the site following remediation, which indicates the groundwater flow direction that is parallel to the modeled cross-section. The groundwater level along this cross-section is shown in Figure 3. For instance, the initial hydraulic head at CMT-2 and CMT-4 were 20.2 and 23.8 m above sea level (masl), respectively.

3.3.3. Groundwater Recharge

The recharge rate assigned to the surface of the WRP is the net percolation (NP) through the cover system into the waste rock. Annual water balances were developed between 2012 and 2016 to assess cover system dynamics and consisted of the following components:
P P T = R + A E T + Δ W S + Δ S S + N P ,
where PPT is precipitation, R is surface runoff, AET is actual evapotranspiration, ∆WS is the change in water storage and ∆SS is the change in snow storage. NP is estimated as the residual of Equation (1). Table 3 presents the flux of each component and their ratio to PPT (%). A detailed description of the water balance development is shown by Power et al. [15].
The mean annual NP rate between 2012 and 2016 was 374 mm (mean NP/PPT = 28%). Although the cover did not significantly limit water influx to the waste rock and was similar to previous NP rates through single-layer soil covers [42], it did provide a reduction from the previously exposed waste rock. For instance, King et al. [43] demonstrated a NP/PPT ratio of 34% on similar waste rock/fill material; this would have provided a mean ‘uncovered’ NP of 434 mm.
The monthly NP measured between 2012 and 2016 was used to develop a relationship between recharge and PPT. A monthly recharge/PPT ratio was then applied to monthly climatic data between January 1981 and December 2010 (Canadian Climate Normals) to incorporate long-term trends of climate and recharge variations into the model predictions.

3.3.4. AMD Contaminant Source

The geochemical source term for the WRP was determined from representative wells installed within the pile footprint. Wells screened within the waste rock would normally provide the most representative AMD pore-water seeping from the WRP; however, only CMT wells screened in the underlying till and bedrock were available. As a result, groundwater quality at the four CMT wells was used to represent the AMD source.
AMD is generally characterized by sulphate, pH, alkalinity and dissolved concentrations of iron (Fe), aluminum (Al) and manganese (Mn). The majority of acidity in mine water arises from free protons (manifested in low pH) and the mineral acidity arising from dissolved Fe, Al and Mn [44]. The acidity of a mine water sample can be calculated from its pH and the sum of the milliequivalents of these dissolved acidic metals. In many AMD studies, the acidity is calculated as follows [44,45]:
A c i d i t y c a l c = 50 { 2 [ F e ] / 56 + 3 [ A l ] / 27 + 2 [ M n ] / 55 + 1000 10 ( p H ) } .
For this study, acidity will be used as the AMD indicator or geochemical tracer. Acidity concentrations calculated from geochemical parameters measured at the four CMT wells between June 2012 and December 2016 were used to represent the AMD source within the WRP.

3.3.5. Waste Rock Acidity

Table 4 provides a summary of the ABA results on the eight waste rock samples. Due to the measured low paste pH values, negative acid neutralization potential (ANP) values and low ANP:acid generation potential (AGP) ratios (< 1), the waste rock was classified as acid generating. These results were similar to previous ABA testing conducted in 2008 on 26 waste rock samples (not shown). The mean acid generation potential (AGP) of 11.50 kg CaCO3/tonne indicated a potential acidity volume of 7432 tonnes. Based on the mean 0.34 wt% sulphate–sulphur content, 10.71 kg CaCO3/tonne was present as stored acidity, indicating a total volume of 6922 tonnes.

3.3.6. Sulphide Oxidation Rate

To estimate the sulphide oxidation rate, oxygen (O2) ingress rates were first determined. O2 flux through the cover to the underlying waste material can occur through molecular diffusion, barometric pumping and dissolved O2 within percolating water. Diffusive O2 flux is driven by the concentration gradient across the cover/waste rock interface and was estimated by Fick’s Law:
J d i f f = D Δ C / Δ x
where D is the diffusivity coefficient (m2/s), ΔC is the change in O2 concentration (mol/m3) and Δx is the distance across the cover/waste interface (m). The change in O2 concentration was determined from O2 concentrations measured within the cover material and waste rock at each SMS.
Advective O2 flux can occur through convection and barometric pumping, which is dependent on the magnitude and duration of changes in monitored atmospheric pressure and air conductivity in the cover material. Advective flux was found to be negligible, as although barometric pumping is causing O2 to breath in and out of the cover, the maximum penetration depth does not exceed the cover thickness (e.g., maximum O2 depth in 2014 was equal 0.33 m). Dissolved O2 flux was determined by combining dissolved O2 concentration with NP. The dissolved O2 concentration was estimated by (Muralikrishna and Manickam 2017):
C O 2 d i s s = ( P p ) 0.678 / ( 35 + t )
where P is the measured barometric pressure (torr), t is the measured water temperature (°C) and is the saturated vapor pressure (torr). Table 5 presents the annual flux of each component and the total O2 flux. A detailed description of the oxygen flux is shown in Power et al. [15].
The total O2 flux can be converted to an acidity load on the basis of H2SO4 equivalent (mol/m2/yr). The overall summary reaction of pyrite weathering to form AMD is shown in Equation (5), where oxidation of 1 mole of pyrite (FeS2) generates 2 moles of sulphuric acid (H2SO4) per 3.75 moles of O2 present [6]:
F e S 2 + 15 / 4 O 2 + 7 / 2 H 2 O F e ( O H ) 3 + 2 H 2 S O 4 .

3.3.7. Source Depletion Rate

The mean calculated acidity at CMT-2 and CMT-4 between 2012 and 2016 was 13.06 mg/L and 77.58 mg/L, respectively, to provide a WRP average of 50.72 mg/L. This acidity was combined with the mean NP (equal to basal seepage) of 0.97 L/sec (374 mm/yr) to provide a mean acidity loading from the WRP of 1.56 tonne/yr.
From Equation (3), the 2012–2016 mean O2 flux of 49.58 /mol O2/m2/yr (Table 5) generated 26.44 mol H2SO4/m2/yr. Using this acidity rate, the total extrapolated catchment acidity load over the area of the cover system was 216.83 tonnes of acidity per year (as CaCO3). This indicates a high ongoing oxidation rate for sulphide minerals within the WRP. Since the total potential acidity was 7432 tonnes (Section 3.3.5), 2.9% of this potential acidity will oxidize each year. Consequently, it will take approximately 34 years to fully deplete the potential acidity.
Since this oxidation rate of 216.83 tonnes is larger than the acidity seepage rate of 1.56 tonnes, the stored acidity in the pile will actually increase by 215.10 tonnes each year for the 34 years to complete oxidation. At that time, the original stored acidity of 6922 tonnes will have increased to 14,301 tonnes. Assuming a constant seepage rate of 1.56 tonne/yr, it will take a total of 9229 years for full WRP acidity depletion.

3.4. Variably Saturated Flow Model

The key parameters used during the calibration and verification of the transient variably saturated flow model were moisture content and hydraulic heads, which were recorded at the SMSs and CMT wells, respectively. As shown in Figure 2a, SMS-2, SMS-4, CMT-2 and CMT-4 are located along the model domain.
Calibration of the flow model was performed (by systematic trial-and-error) using the first 2.5 years of observed data (June 2012 to December 2014), while model verification was completed using the subsequent two years of observed data (January 2015 to December 2016).

3.4.1. Unsaturated Zone

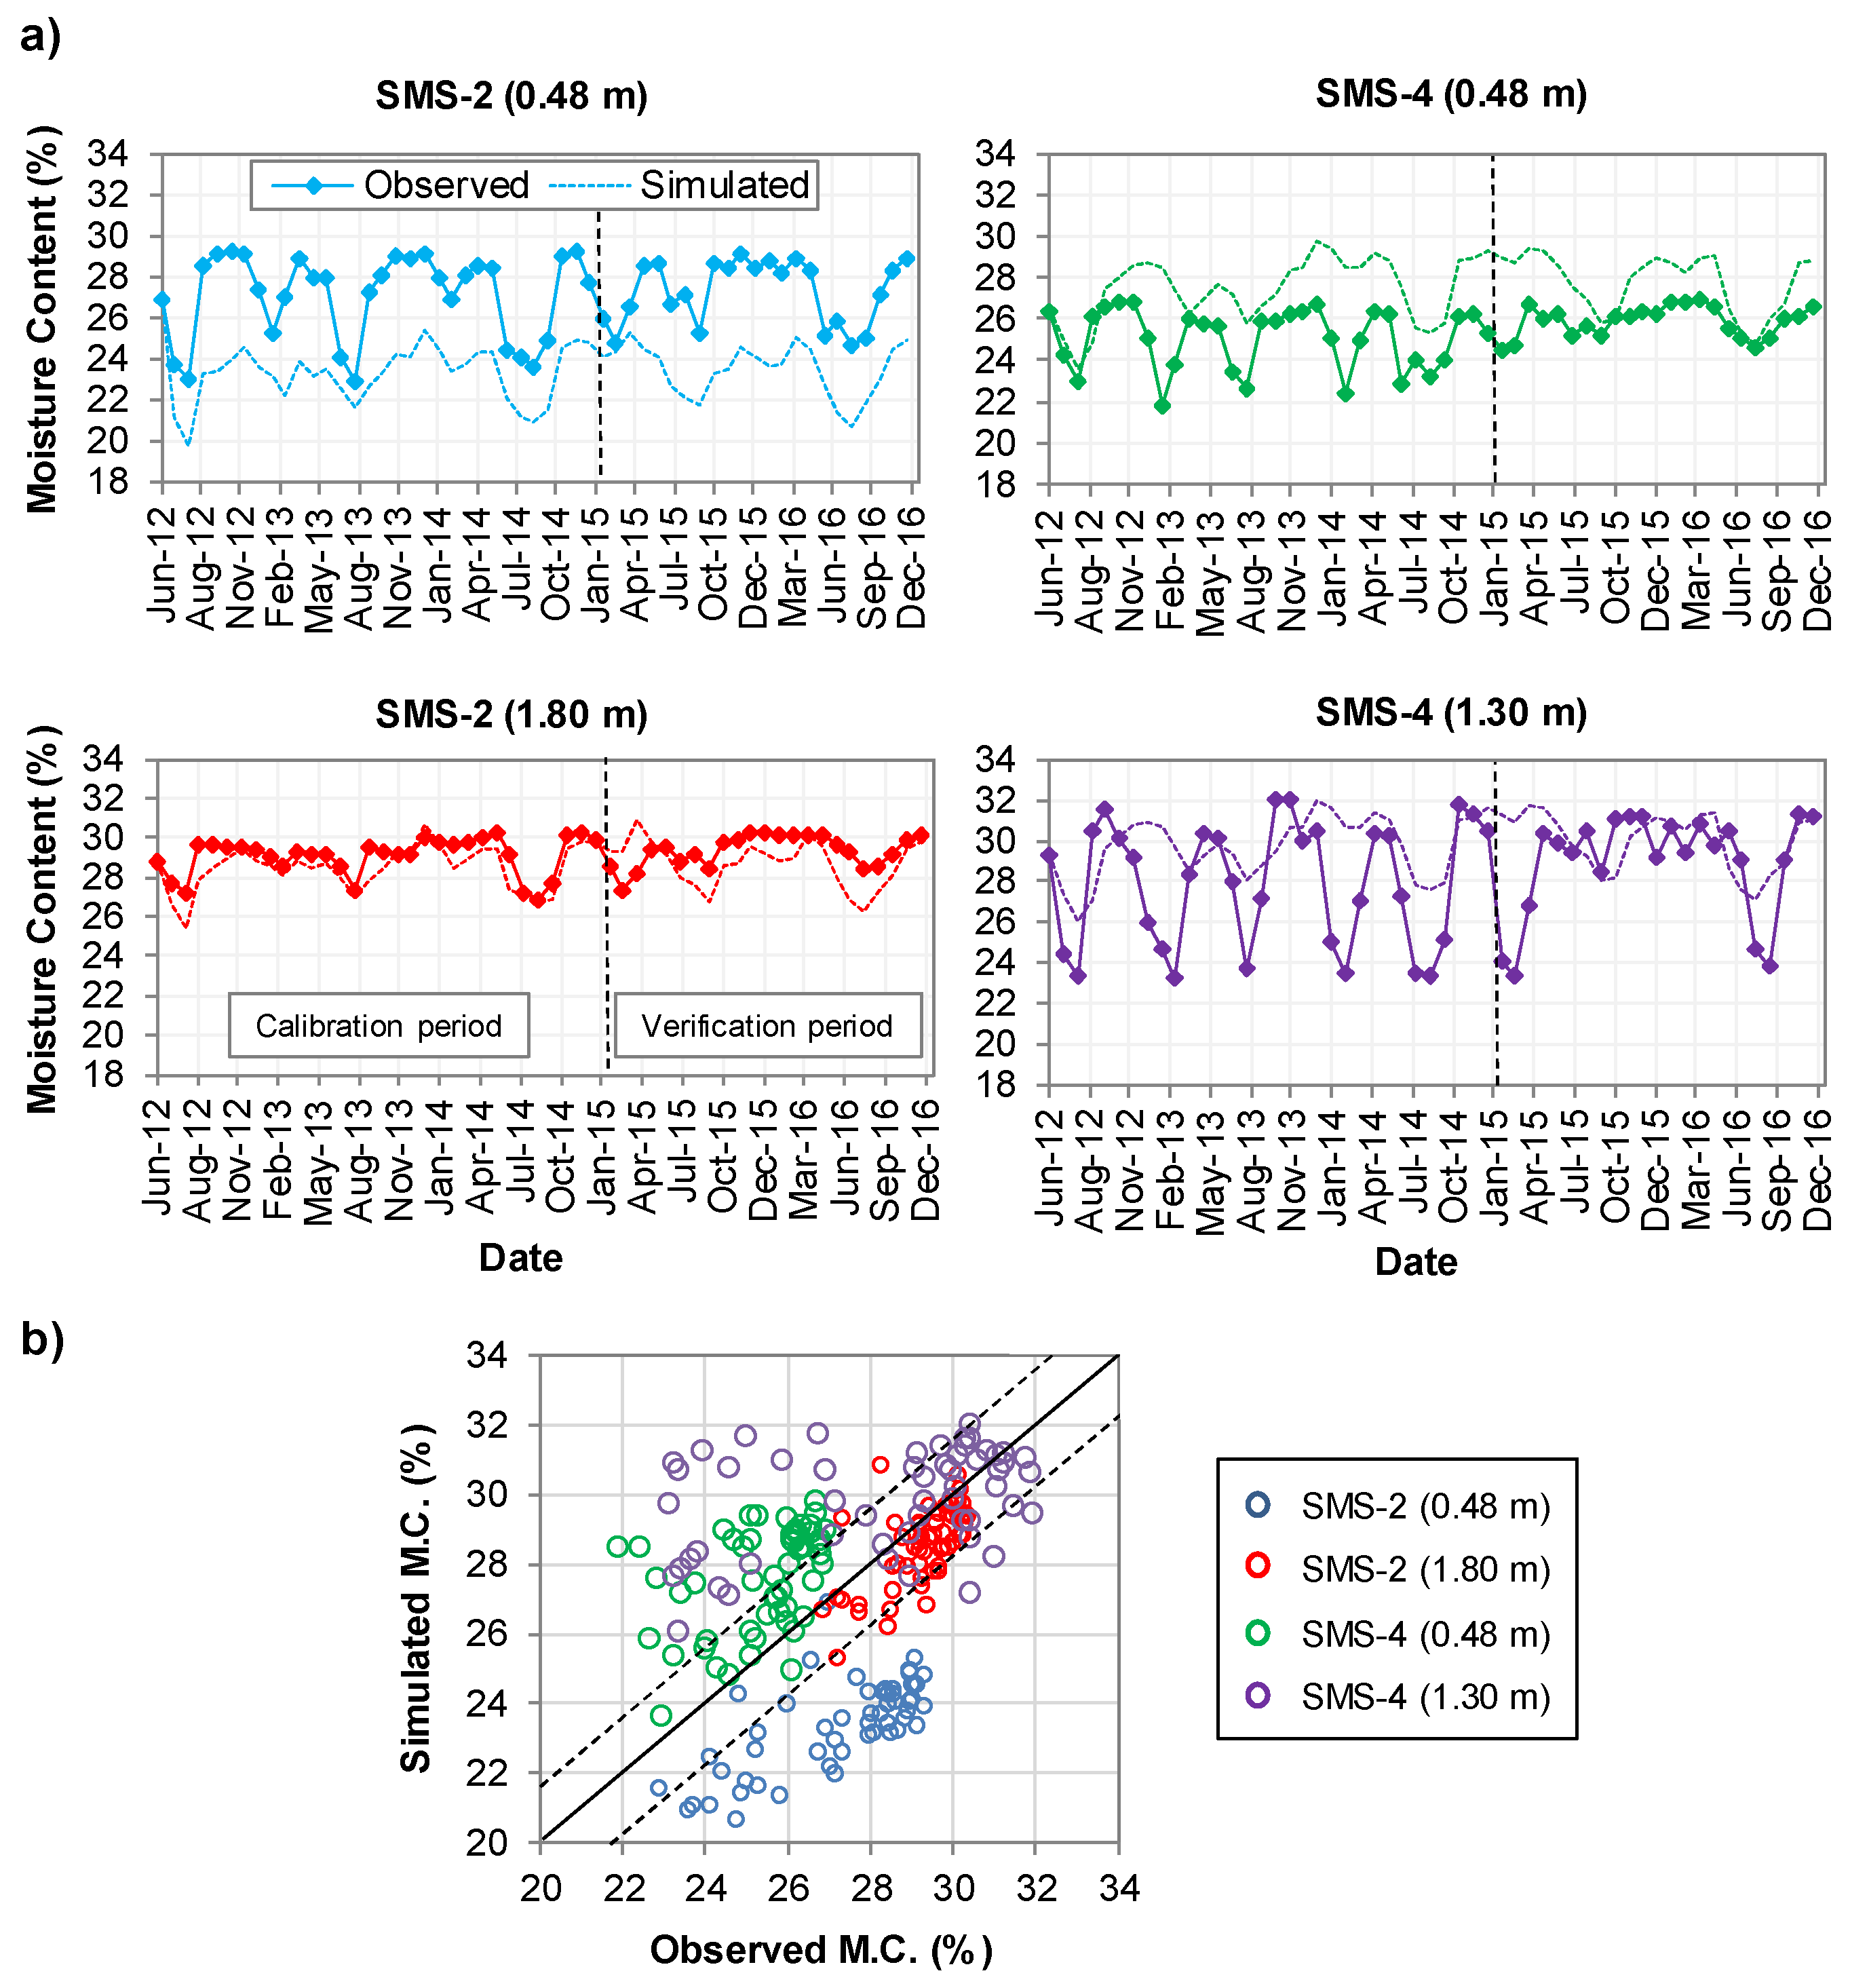
The unsaturated model layers were calibrated and verified against moisture contents recorded at SMS-2 and SMS-4 between June 2012 and December 2016. Specifically, moisture contents recorded near the base of the cover material (0.48 m depth) and within the waste rock (1.30 m at SMS-4 and 1.80 m at SMS-2) were used.
The model was first calibrated to achieve the best correlation between the simulated and the observed moisture contents. For this trial-and-error calibration, the primary variables that were adjusted within an allowable range from initial input values were hydraulic conductivity, porosity and four van Genuchten parameters. The calibration was performed until the mean error of simulated versus observed moisture contents was minimized as much as possible.
Figure 5a plots the observed and simulated moisture contents at both depths at SMS-2 (0.48 m and 1.80 m) and SMS-4 (0.48 m and 1.30 m). It is evident from the calibration period that the simulated moisture contents are reasonably correlated with the observed moisture contents. For instance, the general variation and trend in moisture content at all four observation points were obtained by the model simulation.
Following model calibration and optimization of primary variables, the model was simulated for two years to coincide with the model verification period between January 2015 and December 2016. Figure 5a again demonstrates that the simulated moisture contents are correlated to the temporal variation of the observed moisture contents. In general, moisture contents exhibit expected seasonal variations, with moisture content decreases observed during dry periods (summer) or frozen periods (winter). Similarly, moisture content increases were observed during high water infiltration periods (spring snowmelt and high rainfall in fall).
Furthermore, Figure 5b presents a scatter plot that compares simulated and observed moisture contents at both depths at SMS-2 and SMS-4. It is evident that the larger depths at SMS-2 and SMS-4 (red and purple circles) were generally well correlated, while the shallower depths (blue and green circles) were less correlated; however, their trends were still somewhat linear. This variation in correlation success at the SMSs was related to the assumption that each geological unit is uniform and homogeneous; however, it is expected that the cover material and particularly waste rock are highly heterogeneous.
Table 6 presents the primary variables—hydraulic conductivity, porosity and van Genuchten parameters—following model calibration and verification. The corresponding saturation–pressure curves are realistic (not shown) and exhibit realistic profiles with depth, similar to Figure 3b.

3.4.2. Saturated Zone

The saturated model layers were calibrated and verified against hydraulic heads recorded at CMT-2 and CMT-4 between June 2012 and December 2016. The model was first calibrated to achieve the best correlation between the simulated heads and the observed heads. For this trial-and-error calibration, hydraulic conductivity and the variable head boundary conditions were adjusted within an allowable range until the mean error of simulated versus observed hydraulic heads was minimized as much as possible.
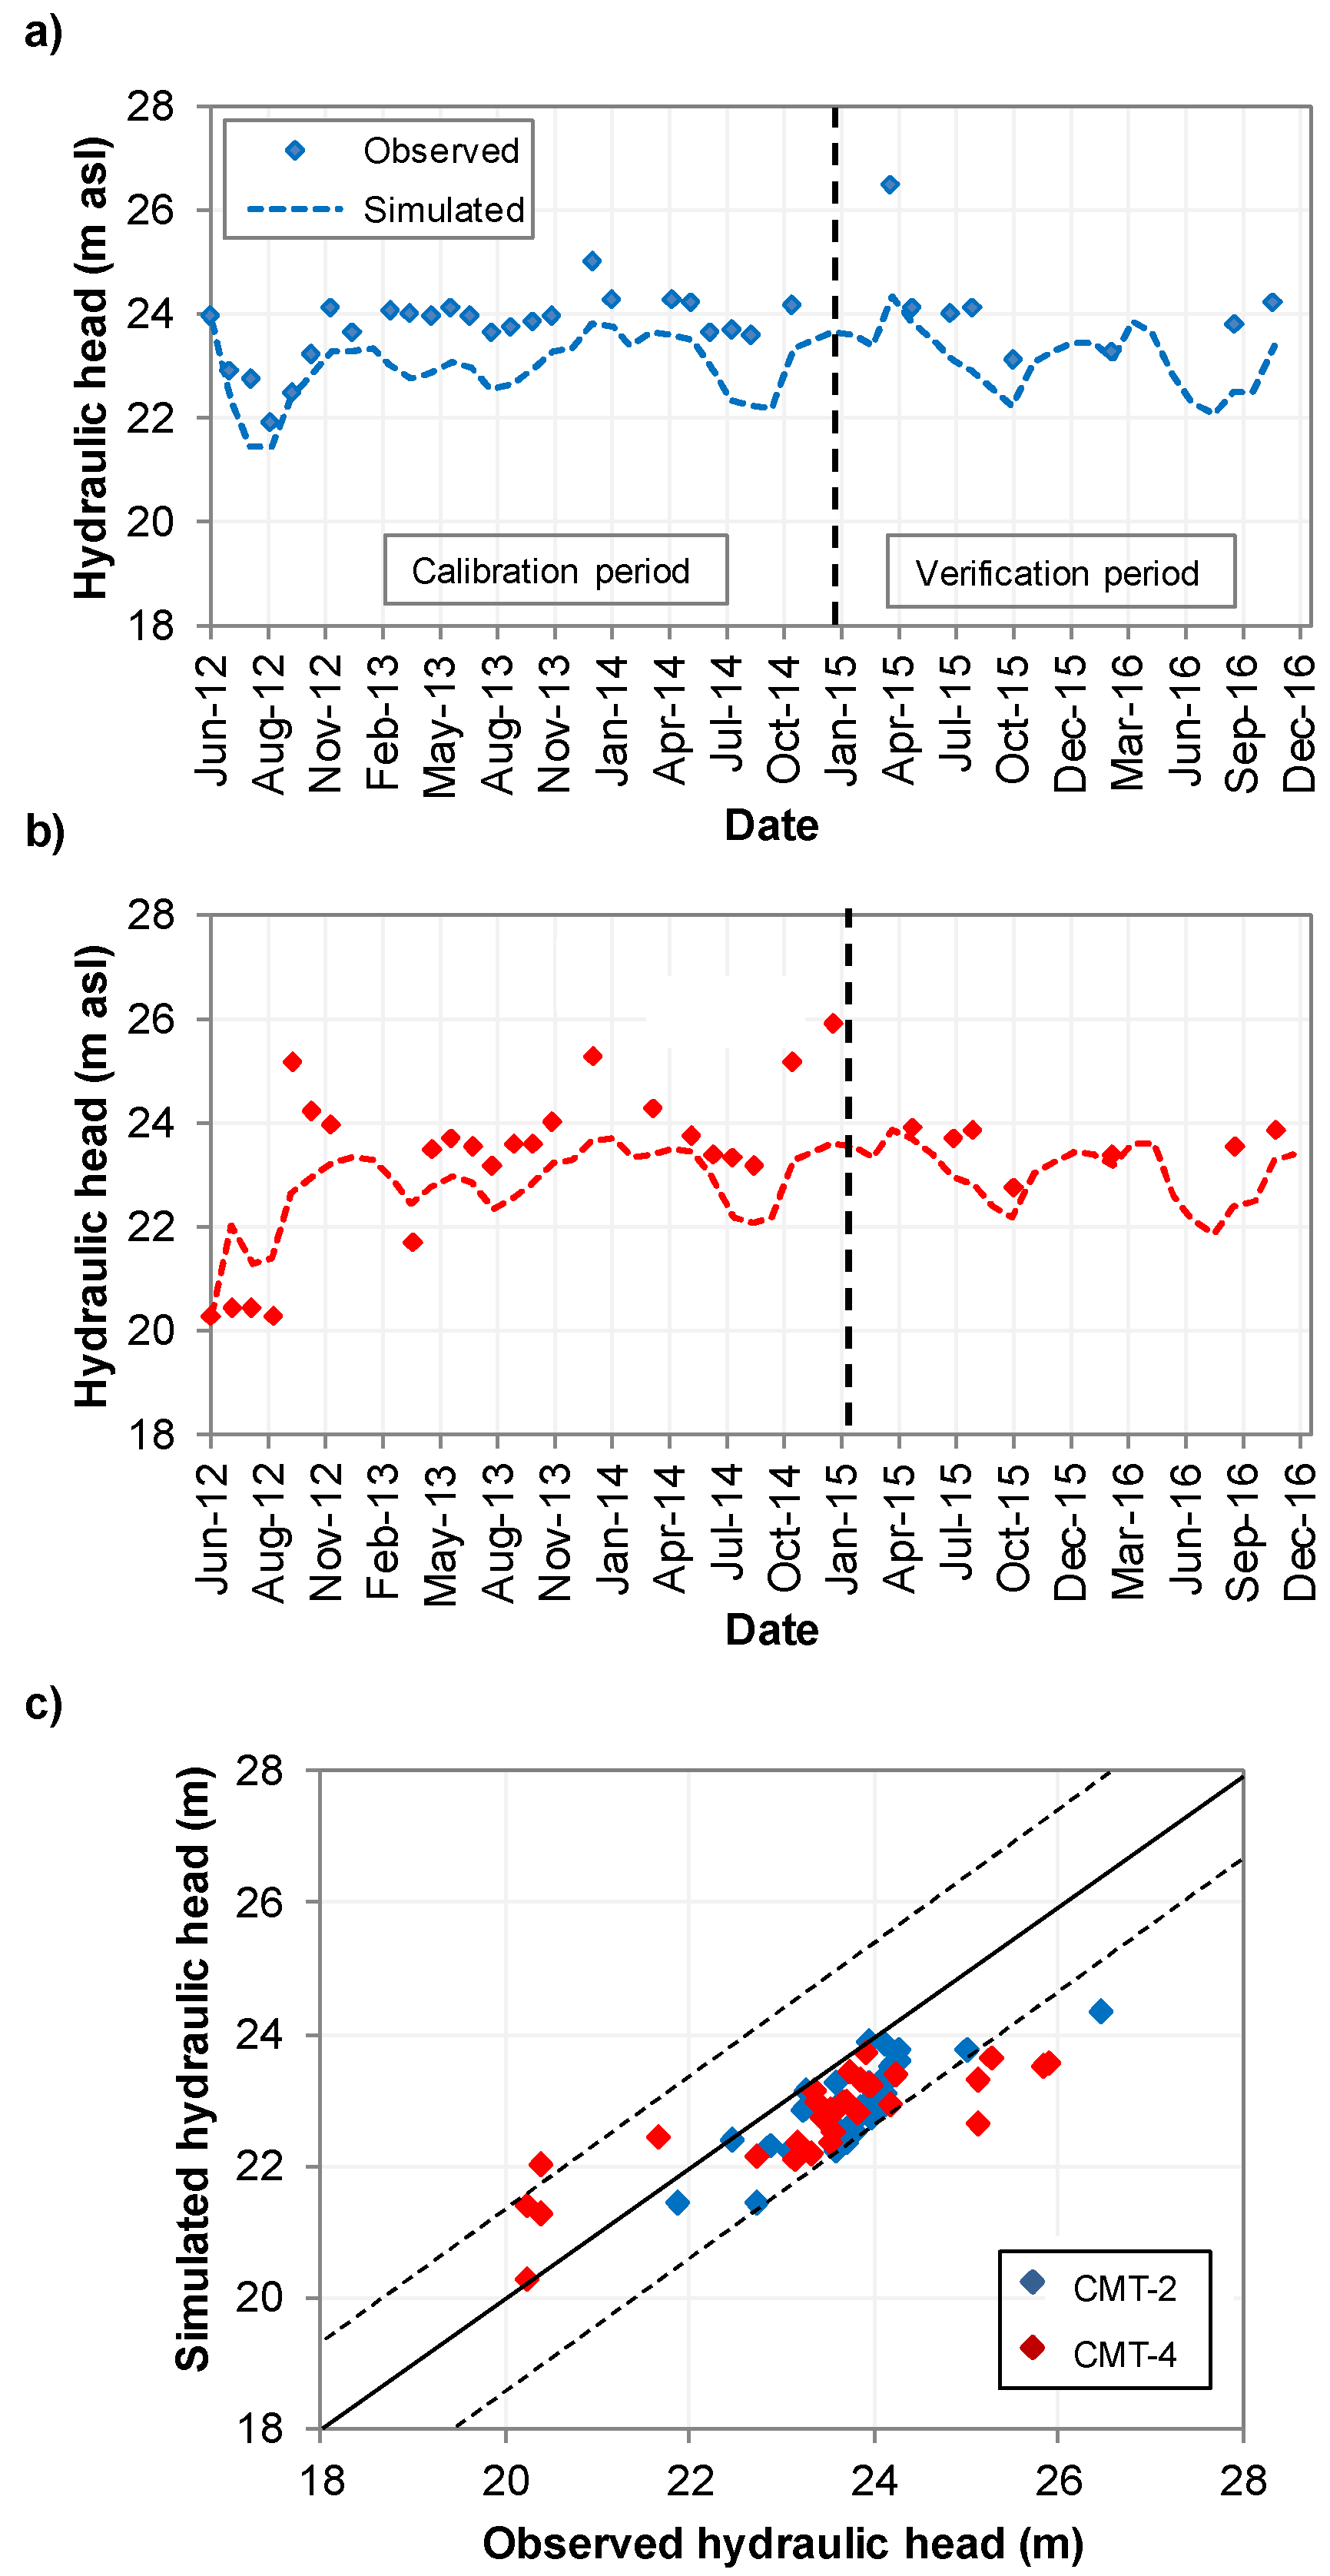
Figure 6a,b plots the observed and simulated hydraulic heads at CMT-2 and CMT-4, respectively. It is evident from the calibration period that a good correlation exists between the simulated and observed heads. For instance, the general variation and trend in hydraulic heads at both well locations are obtained by the model simulation.
Following calibration, the model simulation continued for two years (January 2015 to December 2016) for model verification. Figure 6a,b again demonstrates that the simulated heads are strongly correlated to the observed heads. In general, hydraulic heads exhibit expected seasonal variations, with decreases during dry periods (summer) or frozen periods (winter) and increases during wet periods (spring snowmelt and fall rainfall).
Furthermore, Figure 6c presents a scatter plot that compares simulated and observed heads at both CMT wells. It provides further evidence that the correlation between simulated and observed heads was reasonable. Table 4 presents the optimized hydraulic conductivity following model calibration and verification.

3.5. Contaminant Transport Model

3.5.1. Transport Process

Acidity transport in groundwater is assumed to follow an advection and dispersion–diffusion process. Furthermore, acidity is assumed to be non-reactive in groundwater and no retardation occurs. Transport parameters such as molecular diffusion, longitudinal dispersivity and transverse dispersivity for each geologic unit are presented in Table 7. As site-specific values were not available, established literature values were used [46,47,48].

3.5.2. Acidity Source Function

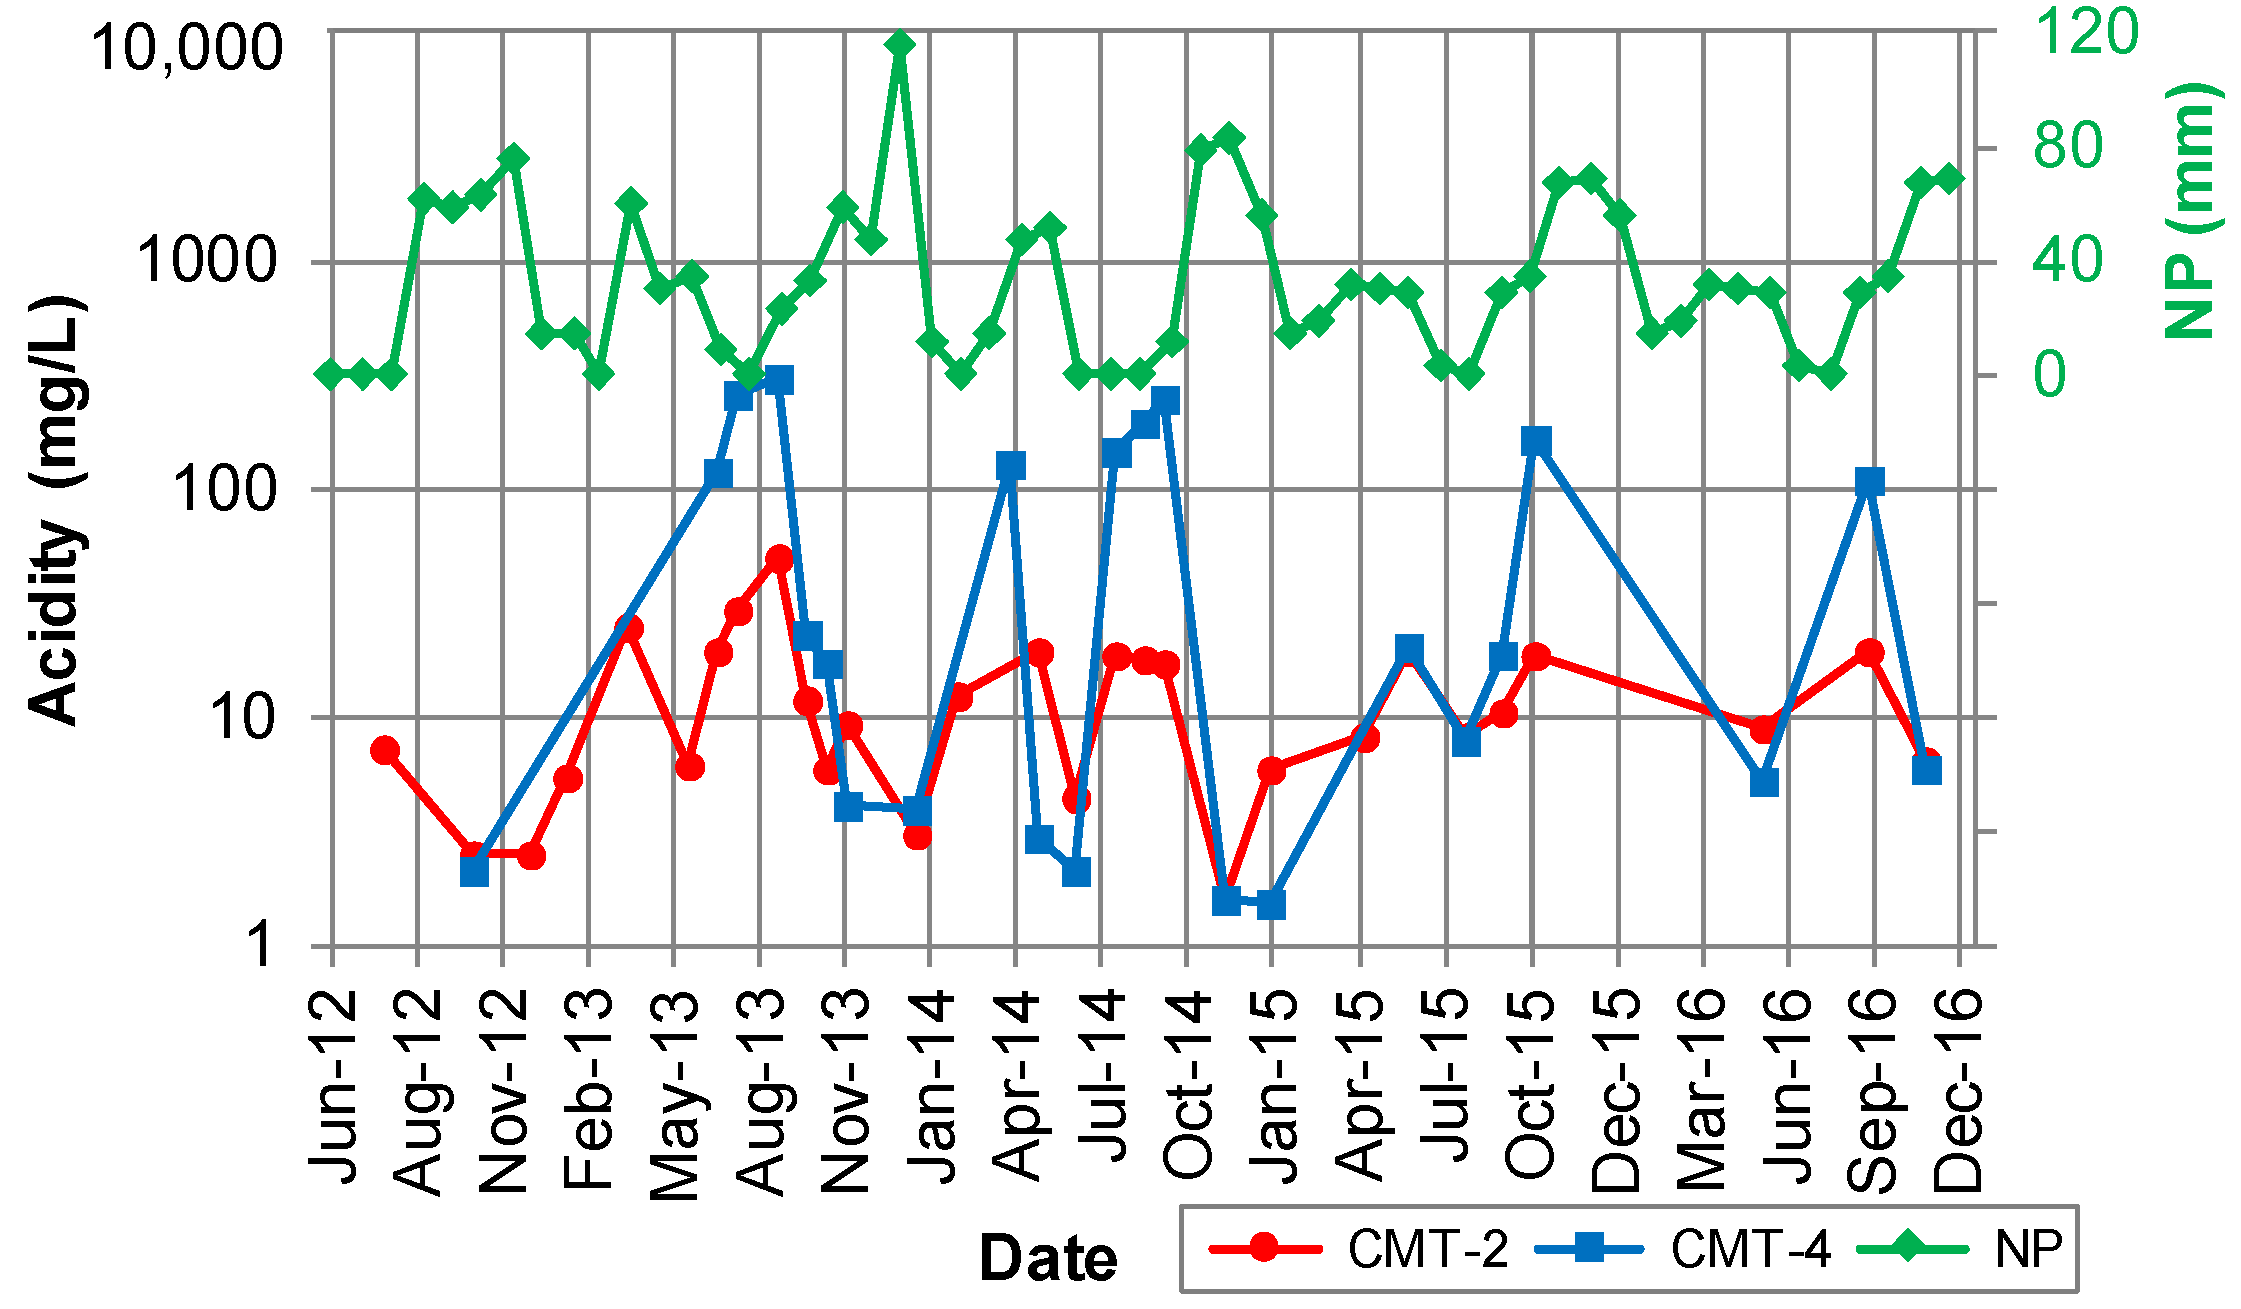
Acidity concentrations measured at CMT-2 and CMT-4 between June 2012 and December 2016 are shown in Figure 7. As shown in Figure 2b, CMT-4 is downgradient along the prominent groundwater flow direction and contaminant pathway, thereby exhibiting higher acidity concentrations compared to CMT-2.
The acidity at both CMT wells in Figure 7 indicates a slightly decreasing trend with seasonal variations correlated to the humid continental climate and variations in NP. For instance, lower concentrations occur during high PPT periods (i.e., snowmelt in April and May and high rainfall in October and November), which causes increased dilution by higher velocity upgradient groundwater.
The initial groundwater acidity was based on the ‘pre-cover’ acidity measured at three representative historical wells in 2008. MW-03, MW-11 and MW-02 were located along the simulated cross-section, as indicated in Figure 1. MW-03 (upgradient of pile), MW-11 (center of pile) and MW-02 (downgradient edge) had acidity values of 24.59 mg/L, 81.32 mg/L and 240.73 mg/L, respectively. The mean value of 115.55 mg/L was used as the homogeneous, pre-cover acidity in the saturated zone.

3.5.3. Model Calibration and Verification

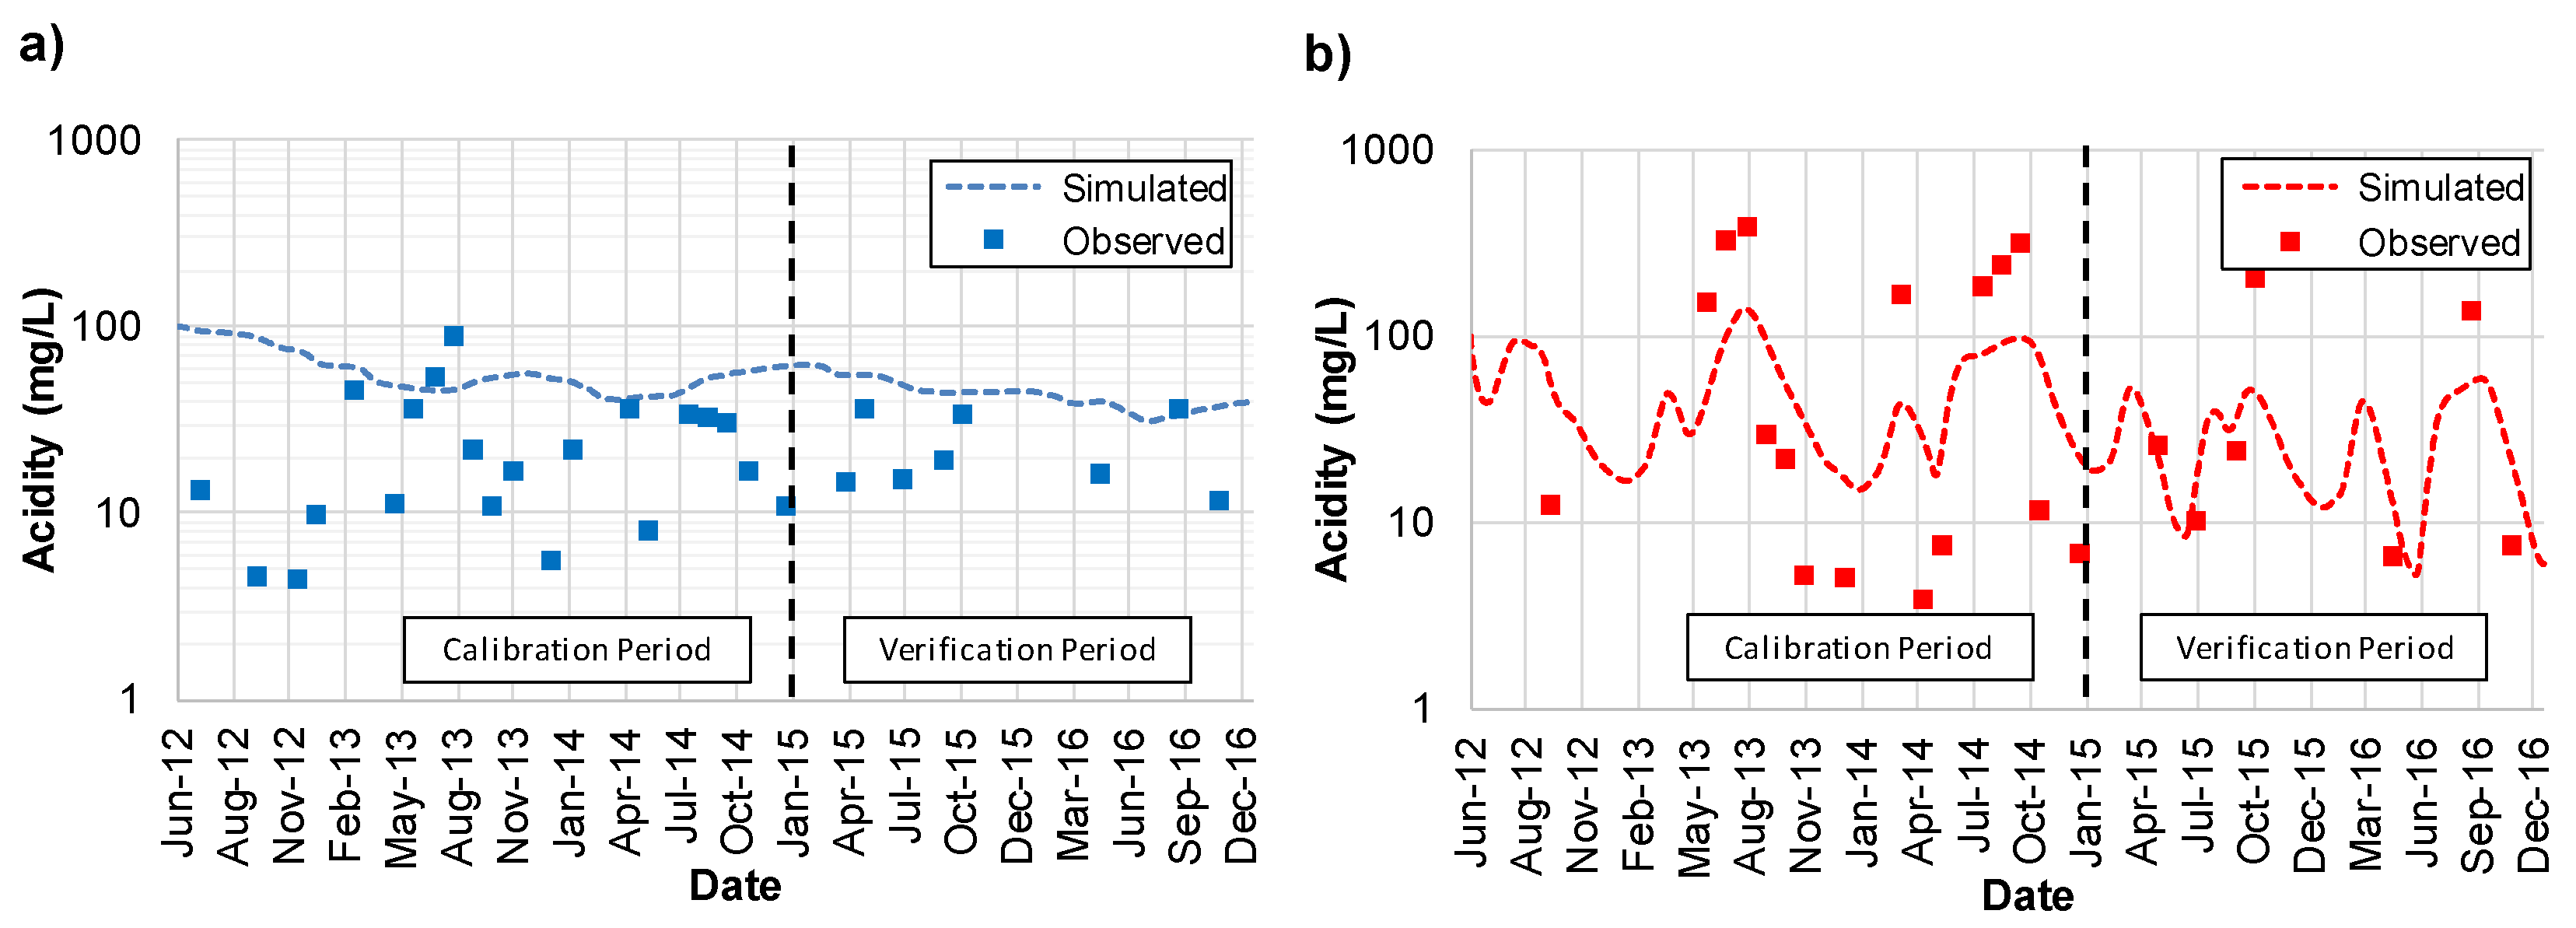
The calibrated transient state flow model was used as the basis for the transient transport model. The mean of the monthly acidity observed at CMT-2 and CMT-4 between 2012 and 2014 was assigned as the transient AMD contaminant source within the model layers of the WRP. Some trial-and-error calibration was performed as a first step against this observed 2012–2014 data. The transport parameters in Table 7 were adjusted to improve the correlation as much as possible between the observed and simulated acidity concentrations.
It is evident from Figure 8a,b that a reasonable correlation exists between the simulated and observed acidity concentrations over time at both CMT-2 and CMT-4. The general trends in observed acidity concentrations were repeated in the simulated concentrations. The magnitude of simulated acidity concentrations were somewhat overestimated at CMT-2; the homogeneous ‘starting’ acidity included the high downgradient acidity, while CMT-2 was located at the upgradient end of the pile. The calibrated model was then verified with the subsequent two years of observed data (January 2015 to December 2016).
It is evident that the transient flow and transport model has been well calibrated and verified to moisture content, hydraulic head and acidity concentration observed during the field monitoring period. The mean monthly acidity shown in Figure 7 will be repeated over 9229 years. This assumes that the WRP will continuously release AMD to groundwater until source depletion. Once depleted, the source concentrations will change to a desired concentration of 1.75 mg/L, which was based on water quality measured upgradient of the WRP study area.

4. Results and Discussion

4.1. AMD in Groundwater

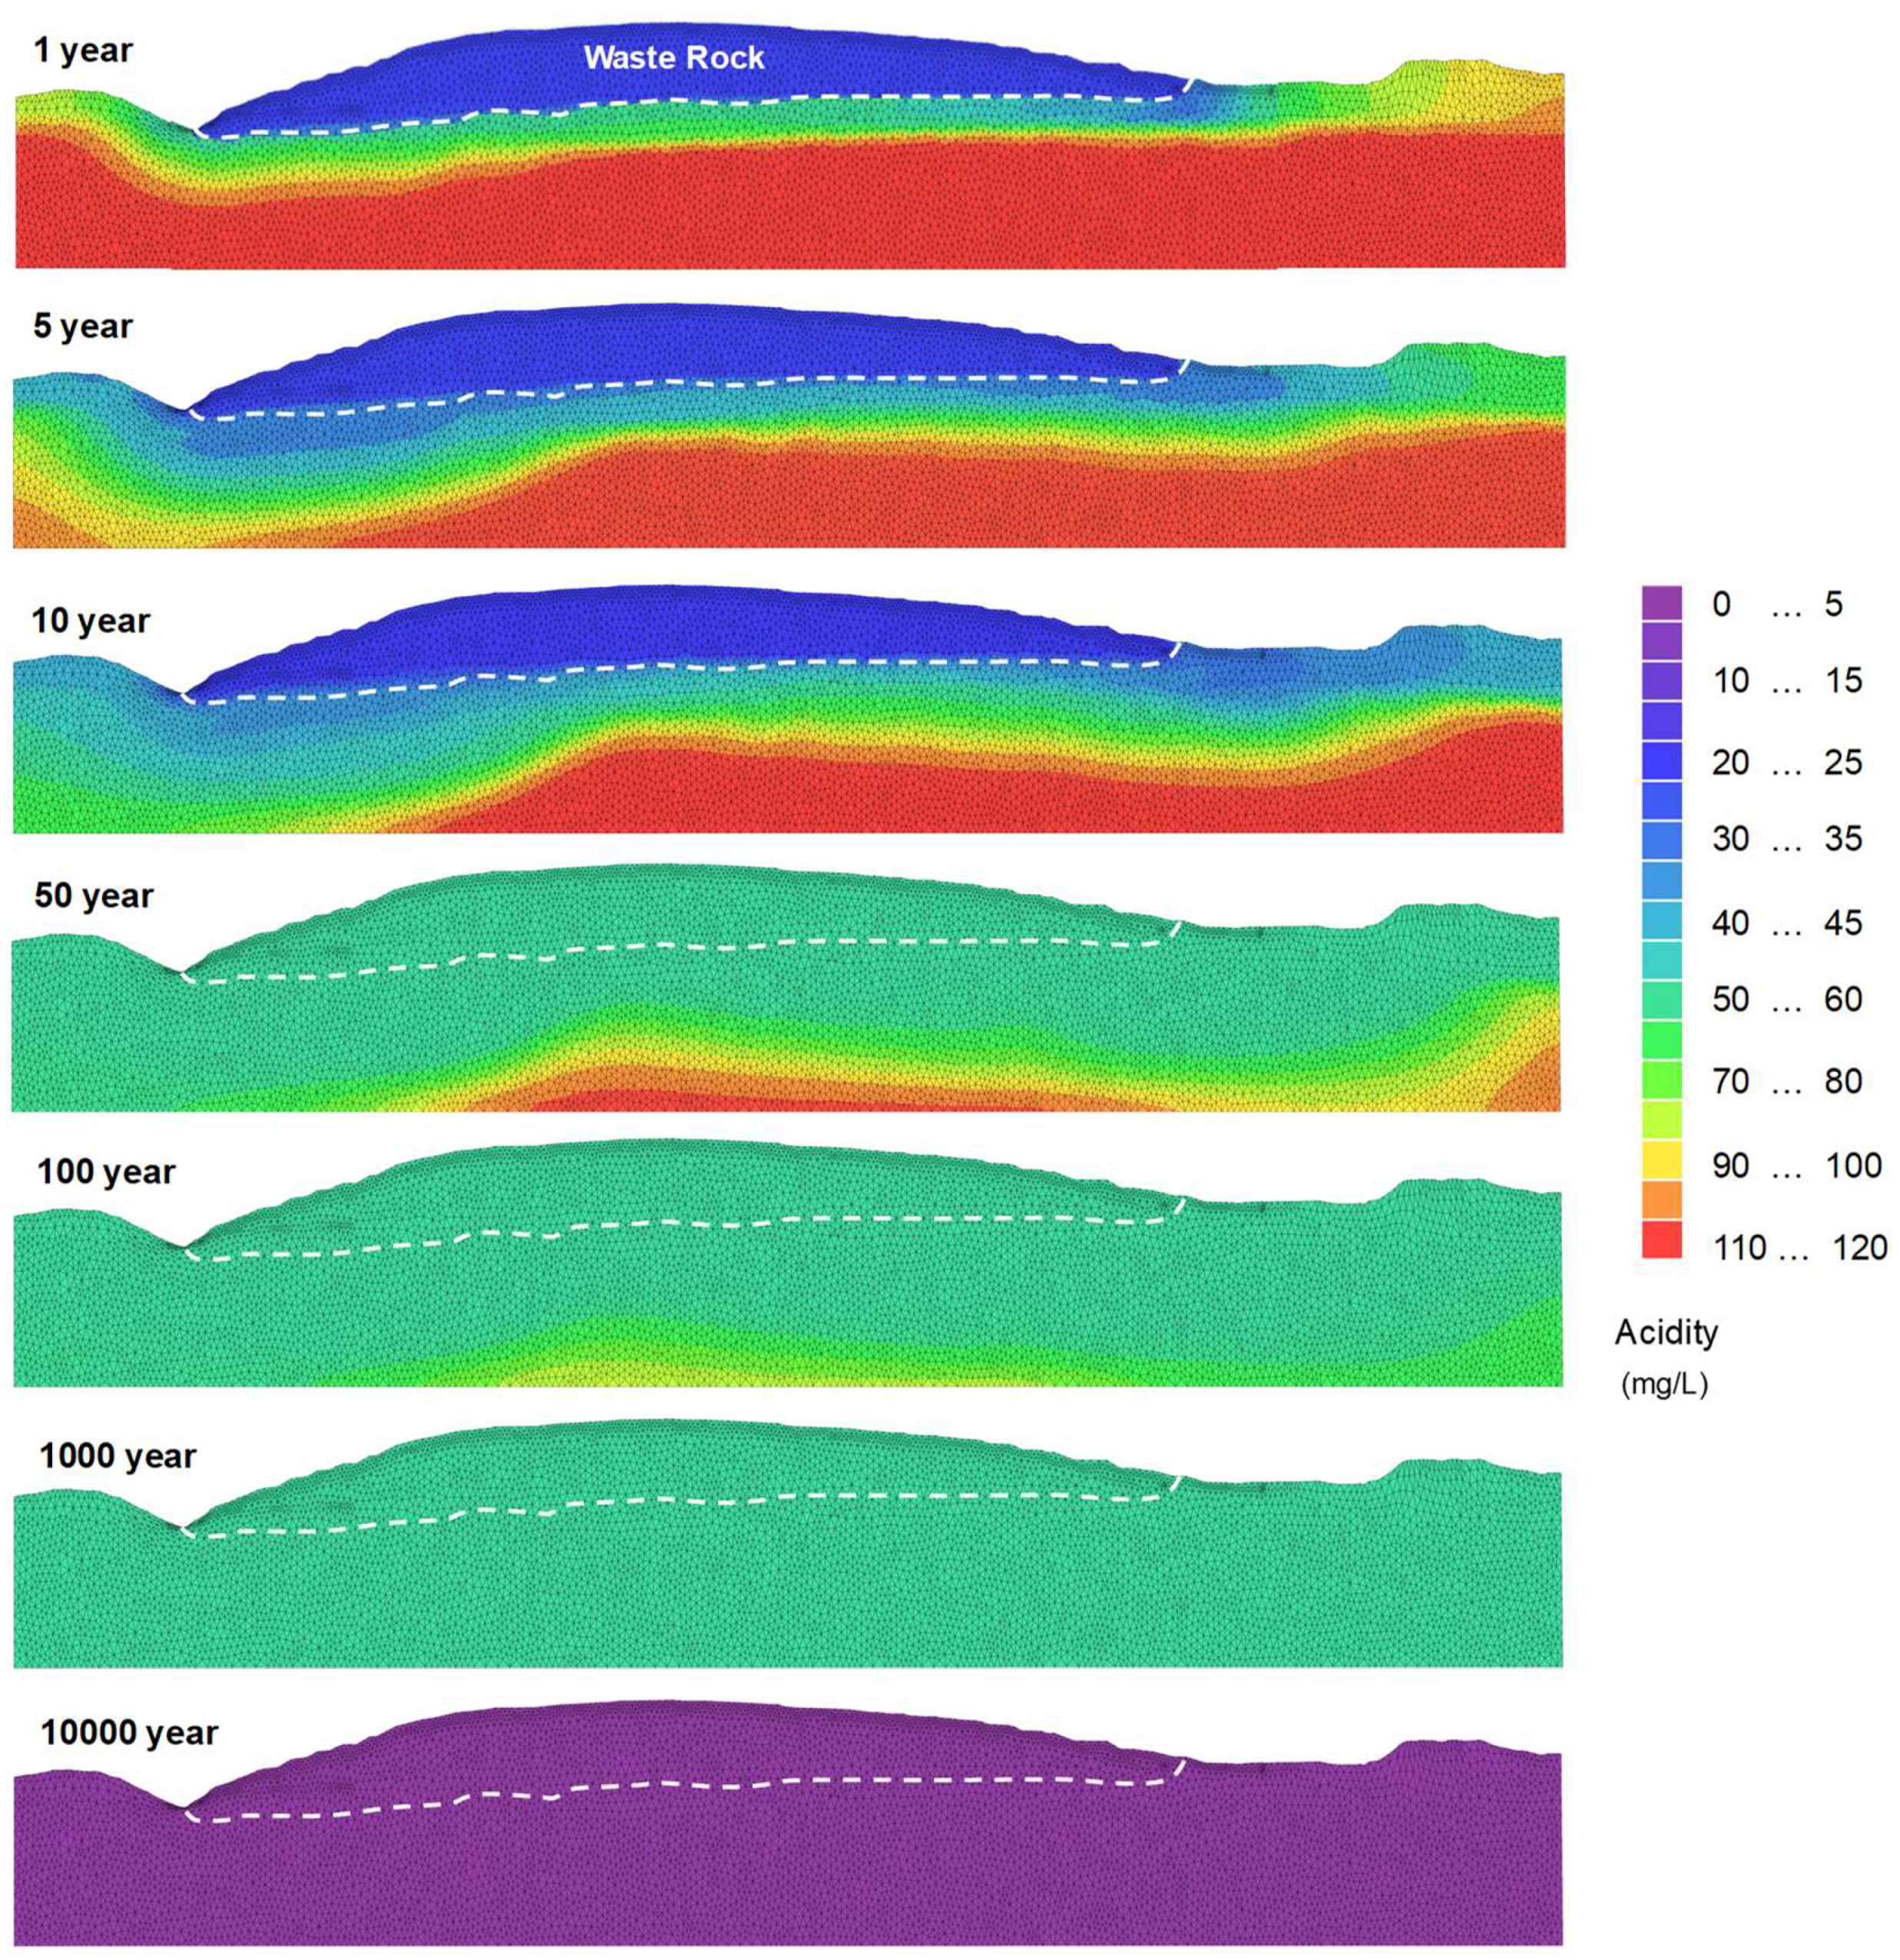
Figure 9 presents the predicted spatial and temporal distribution of the acidity contaminant plume over the 10,000-year simulation period. After 1 year, the WRP source concentrations had begun to seep into and dilute the underlying groundwater. While the general groundwater flow was from west-to-east, mounding of the water table within the center of the pile generates local gradients to both the west and east directions. Within 100 years, the pre-cover groundwater acidity of 115.55 mg/L had almost all continually improved to the post-cover pile acidity (mean = 50.72 mg/L). At 10,000 years, the pile source acidity was depleted and groundwater concentrations had decreased to the target concentration of 1.75 mg/L.
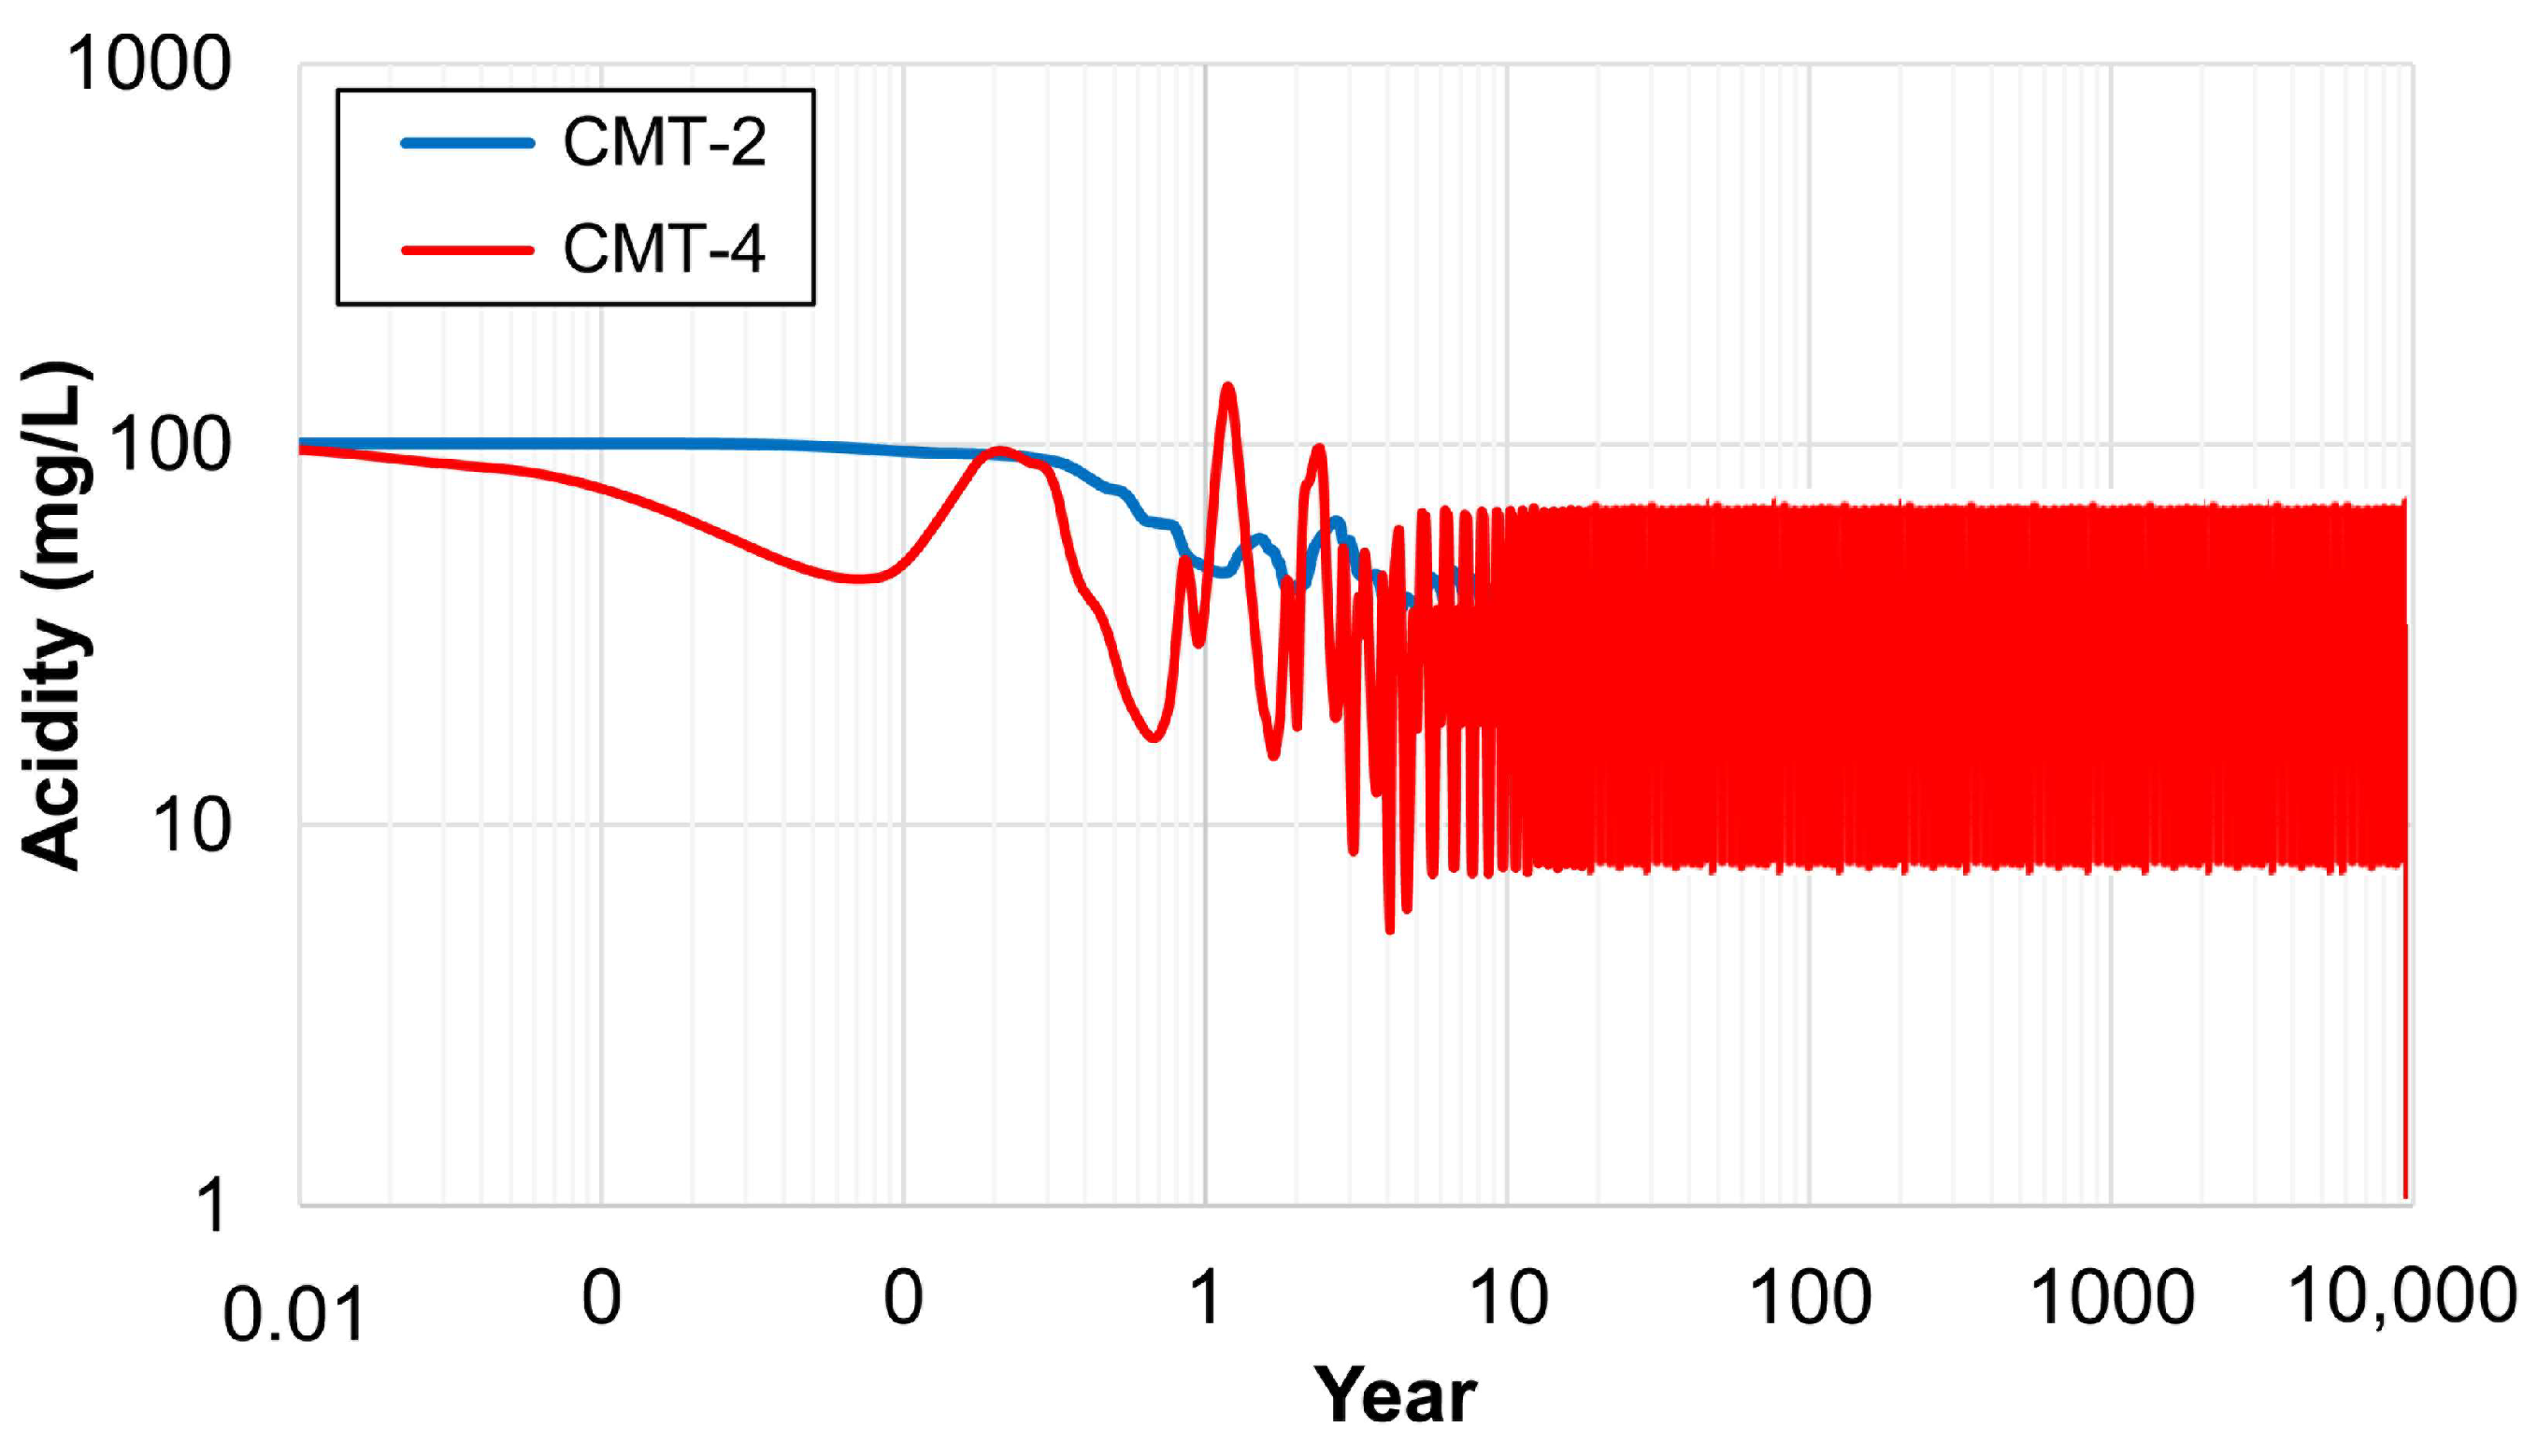
To better analyze the evolution of the AMD plume, Figure 10 presents the acidity concentrations in groundwater at CMT-2 and CMT-4. Acidity concentrations at both wells improve from their initial pre-cover concentrations to the post-cover seepage concentrations. At 9229 years, the acidity at CMT-2 and CMT-4 decreases to the target concentration of 1.75 mg/L.

4.2. AMD in Surface Water

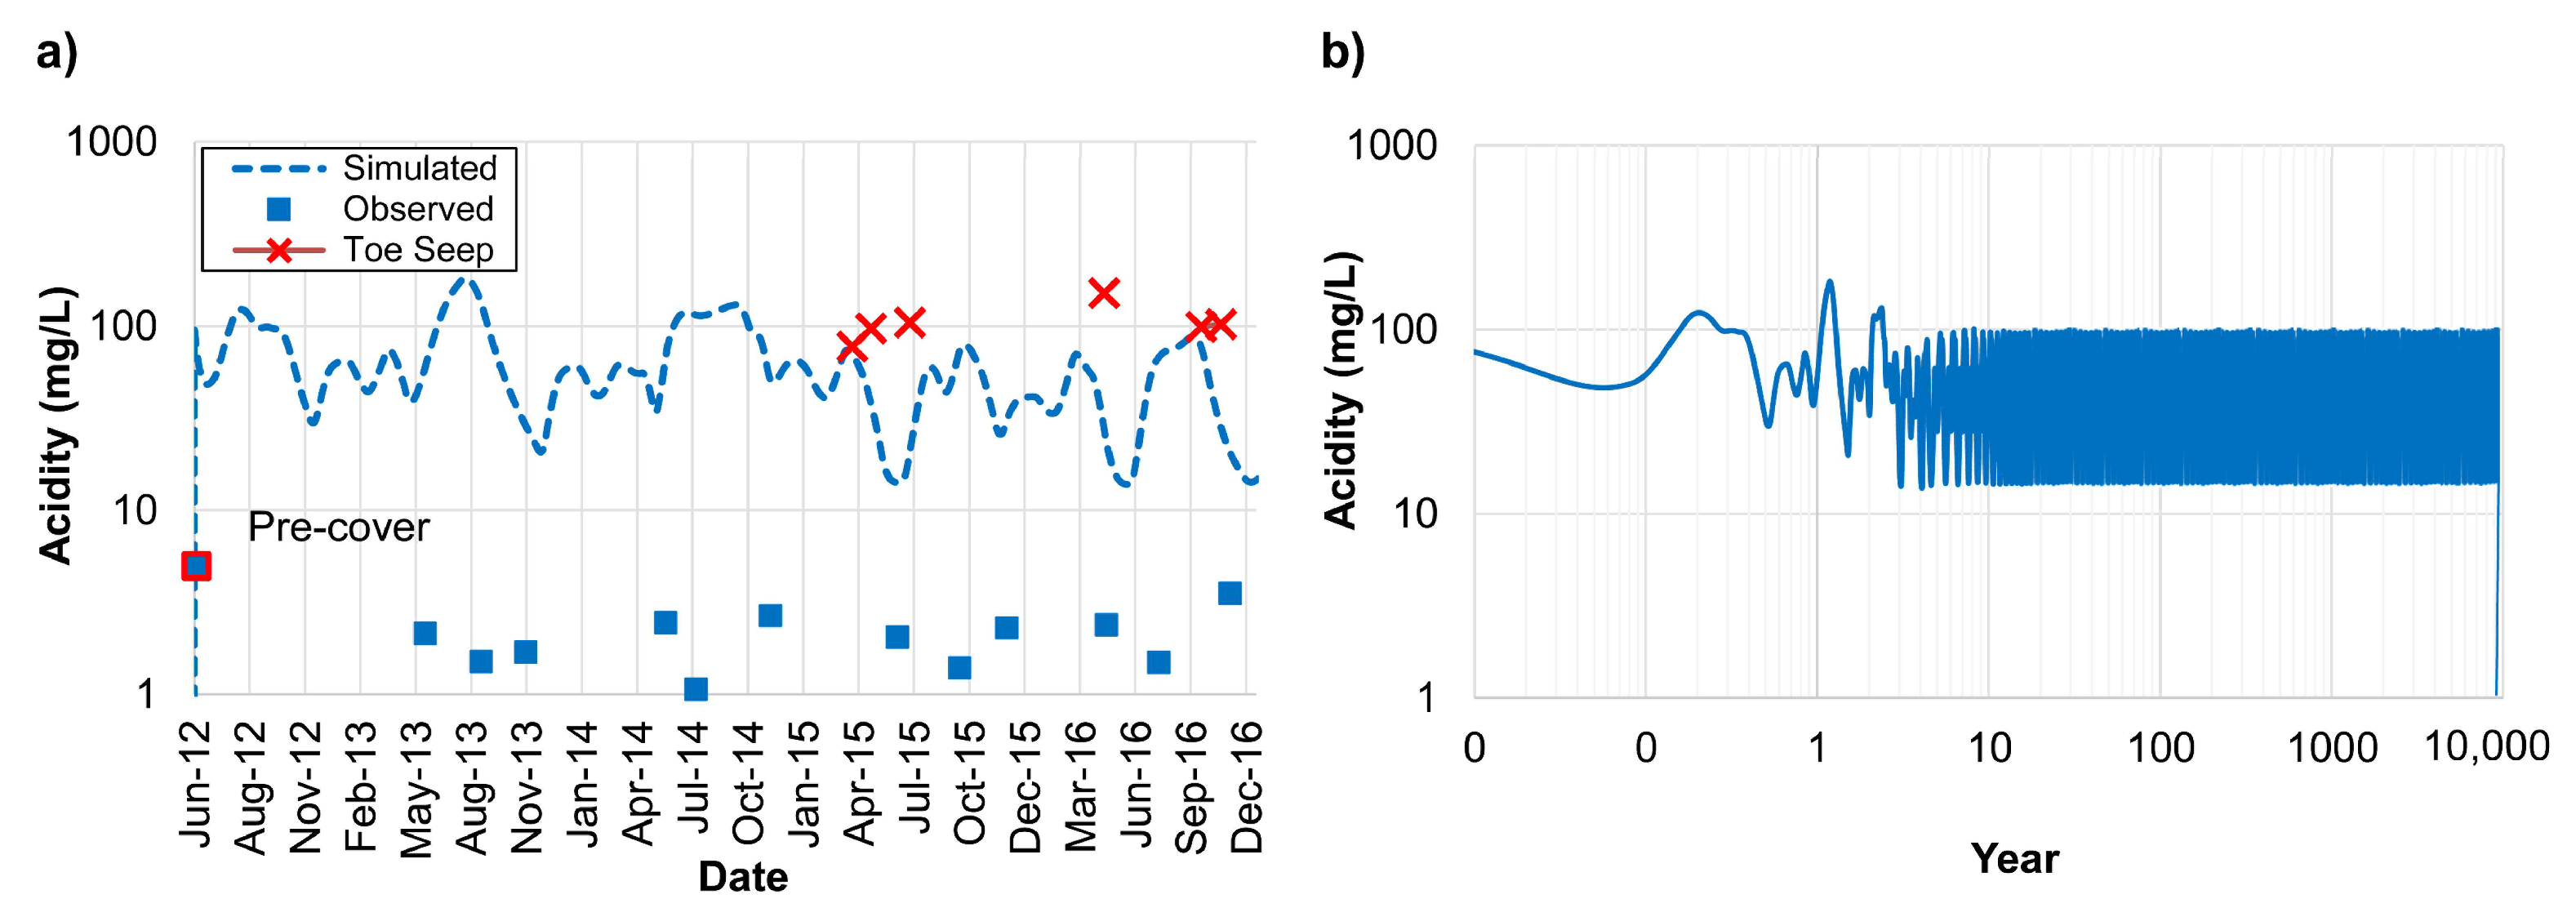
As shown in Figure 9, the groundwater plume migrates to the left-hand side of the model domain towards the key environmental receptor Graces Brook, which flows adjacent to the WRP (see Figure 1). As part of the field monitoring program, acidity concentrations were monitored at a location in Graces Brook downstream of the WRP. Figure 11a presents the acidity concentrations observed at Graces Brook (blue squares) between 2012 and 2016, with the mean pre-cover acidity concentration indicated by the large red-outlined square. This field observed data indicates that water quality in Graces Brook is gradually improving over time. Acidity concentrations measured at the toe seep are indicated by red x’s.
While modeling Graces Brook was beyond the scope of this work, the flow model was used to indirectly assess long-term AMD impacts to Graces Brook. An observation point in the model domain directly below Graces Brook was used to monitor acidity concentrations over time. These simulated concentrations in groundwater at Graces Brook were also plotted in Figure 11a (blue line). It is evident that the simulated acidity concentrations closely followed the same trend as observed acidity concentrations.
While trends were similar, there was a large discrepancy in concentration magnitude, with observed concentrations much lower than simulated concentrations. The observed concentrations were based on water samples collected from Graces Brook, with concentrations impacted by dilution from high water velocity, rainfall and/or surface water runoff. It also indicates that groundwater was not easily discharging into Graces Brook.
In contrast, the observed toe seep concentrations were based on water samples taken directly from ‘daylighting’ groundwater, which then overflowed on the surface directly into Graces Brook. As shown in Figure 11a, the toe seep concentrations were very similar to the simulated concentrations, which was expected as the toe seep water was coming from groundwater at that location.
Figure 11b presents the predicted acidity concentrations over the long-term in groundwater directly below Graces Brook. It is evident that groundwater (and surface water) quality would continue to improve over time until WRP acidity is depleted at 9229 years. Therefore, the remedial performance objectives, which were already being met during the field monitoring program [15], will continue to be achieved over the long-term.

4.3. Model Limitations

It is acknowledged that a number of simplifying assumptions were used in this study. The model layers were assumed to be homogeneous and isotropic, which might be overly simplistic as WRP and geologic units are typically heterogeneous and complex. Therefore, it is acknowledged that this assumption simplifies water flow and contaminant distribution in the model simulation. Mean values used for hydrogeological parameters, such as hydraulic conductivity and porosity, might have led to underestimation, or overestimation, of simulated data (e.g., moisture contents and hydraulic heads) and increased discrepancies with observed data, as evident during model calibration. These discrepancies could then lead to inaccuracies in flow velocities and contaminant concentrations. Nevertheless, it is common in large and complex study areas to assume representative mean values. The mean values used were carefully selected and then subsequently adjusted to obtain the well-calibrated and verified flow and contaminant transport model.
Using the field monitoring data and water balance method, a relationship was developed between NP and precipitation. This monthly NP as a percentage of precipitation was then applied to long-term climatic variations to generate long-term NP rates for the predictive models. simulation. It is acknowledged that a fully calibrated soil-atmosphere model such as VADOSE/W [49] could be used to incorporate climate variability and predict long-term NP through the cover system [14].
It was not possible to obtain pore-water samples directly from the waste rock, as the CMT wells were screened below the waste rock into the shallow bedrock; therefore, groundwater samples from the underlying bedrock were used to represent water quality seeping from the WRP. As a result, acidity generation and loading is likely underestimated as it based on groundwater concentrations that may have already diminished due to dilution with upgradient groundwater. The assumption of homogeneity was also applied to the WRP source concentration, which was taken as the mean acidity concentration from two sampling points (i.e., CMT-2 and CMT-4). Furthermore, the calculated acidity values used in this study assumed there was no buffering within the pile, thereby providing a conservative estimate of acidity seeping from the WRP.
Due to the limited information available and low sampling density at the study site, the modeling was performed in 2D along a representative cross-section through the WRP. It is acknowledged that the 2D model results might be limited the variably saturated flow regime and the AMD contaminant plume transport at the site is 3D in nature.
It is acknowledged that kinetic aspects would need to be incorporated to more accurately access the annual generation and release of AMD to groundwater. Current work involves laboratory tests with humidity cells and leaching columns on waste rock samples to assess various kinetic aspects such as the velocity of sulphide oxidation and metal leaching rates. Future work will incorporate the PHREEQC geochemical reaction model [50] into the FEFLOW model to include kinetic and multiphase transfer processes for improved long-term AMD predictions.

5. Conclusions

A numerical investigation was conducted to predict the long-term performance of a single-layer cover system installed over an acid-generating WRP. In 2011, the Lingan WRP in Nova Scotia, Canada was remediated with a single-layer moisture ‘store-and-release’ cover system. The field monitoring program demonstrated that the cover system generated a small reduction in water infiltration into the WRP, decreasing from 34% to 28% of precipitation. Furthermore, the placement of the cover over the previously exposed waste rock ensured only clean surface water runoff to the adjacent surface water receptor (Graces Brook), with groundwater discharge now the primary source of AMD contamination.
A 2D variably saturated flow and contaminant transport model of the site (WRP and receiving environment), was developed in FEFLOW. Key field parameters observed during post-remediation field monitoring, including moisture content and hydraulic head, were used to effectively calibrate and verify the model.
The model was used to simulate the long-term spatial and temporal distribution of AMD over a 10,000-year period, which was based on the estimated time to acidity depletion in the WRP. Groundwater quality was predicted to improve from initial pre-cover acidity to post-cover pile seepage acidity within 100 years, before eventually reaching background water quality following source depletion at 9229 years. A key site remedial objective was related to water quality improvement in Graces Brook, whose long-term source of AMD contamination was from groundwater discharge. The model was used to confirm that groundwater quality adjacent to Graces Brook (i.e., point of discharge) continually improved over the long-term, thereby indirectly predicting the long-term improvement of Graces Brook.
This study demonstrated the effective long-term performance of a single-layer cover system to reduce the impacts of AMD on the WRP receiving environment. While the findings were from a single field site, they are applicable to other WRP sites reclaimed with a single-layer cover system. Nevertheless, it should be noted that cover performance evolves over time in response to climatic conditions and site-specific physical, chemical and biological processes that are extremely difficult to incorporate in predictive models. If possible, periodic monitoring and physical studies of in situ processes such as freeze-thaw, vegetation and erosion cycles should be conducted to maintain a rigorous evaluation of long-term cover performance.
Author Contributions

M.R. performed the key tasks of the project, including utilization of the FEFLOW software, development of the calibrated and verified model, initial analysis and prepared the original draft. C.P. assisted in data analysis and interpretation, organized and structured the article, reviewed and edited the draft.

Funding

This research was funded by Public Works and Government Services Canada (PWGSC). The APC was funded by the corresponding author at Western University.

Acknowledgments

This work was conducted under the CAPs Monitoring Project funded by Enterprise Cape Breton Corporation (ECBC) which was later dissolved into Public Works and Government Services Canada (PWGSC). The authors would like to give thanks to Martin Mkandawire (Cape Breton University), Joseph MacPhee (PWGSC), Devin MacAskill (Cape Breton Regional Municipality, CBRM), Greg Meiers (O’Kane Consultants), David Mayich and Fred Baechler (exp Consultants) for sharing their expertise during this study.

Conflicts of Interest

The authors declare no conflict of interest.

References

  1. Amos, R.T.; Blowes, D.W.; Bailey, B.L.; Sego, D.C.; Smith, L.; Ritchie, A.I.M. Waste-rock hydrogeology and geochemistry. Appl. Geochem. 2015, 57, 140–156. [Google Scholar] [CrossRef]
  2. Banks, D.; Younger, P.L.; Dumpleton, S. The Historical Use of Mine-Drainage and Pyrite-Oxidation Waters in Central and Eastern England, United Kingdom. Hydrogeol. J. 1996, 4, 55–68. [Google Scholar] [CrossRef]
  3. Masindi, V. A novel technology for neutralizing acidity and attenuating toxic chemical species from acid mine drainage using cryptocrystalline magnesite tailings. J. Water Process. Eng. 2016, 10, 67–77. [Google Scholar] [CrossRef]
  4. Galhardi, J.A.; Bonotto, D.M. Hydrogeochemical features of surface water and groundwater contaminated with acid mine drainage (AMD) in coal mining areas: A case study in southern Brazil. Environ. Sci. Pollut. Res. 2016, 23, 18911–18927. [Google Scholar] [CrossRef] [PubMed]
  5. Grande, J.A.; Beltrán, R.; Sáinz, A.; Santos, J.C.; de la Torre, M.L.; Borrego, J. Acid mine drainage and acid rock drainage processes in the environment of Herrerías Mine (Iberian Pyrite Belt, Huelva-Spain) and impact on the Andevalo Dam. Environ. Geol. 2005, 47, 185–196. [Google Scholar] [CrossRef]
  6. Nordstrom, D.K.; Blowes, D.W.; Ptacek, C.J. Hydrogeochemistry and microbiology of mine drainage: An update. Appl. Geochem. 2015, 57, 3–16. [Google Scholar] [CrossRef]
  7. Price, P.; Wright, I.A. Water Quality Impact from the Discharge of Coal Mine Wastes to Receiving Streams: Comparison of Impacts from an Active Mine with a Closed Mine. Water Air Soil Pollut. 2016, 227, 155. [Google Scholar] [CrossRef]
  8. Pat-Espadas, A.M.; Portales, R.L.; Amabilis-Sosa, L.E.; Gómez, G.; Vidal, G. Review of constructed wetlands for acid mine drainage treatment. Water 2018, 10, 1685. [Google Scholar] [CrossRef]
  9. Johnson, D.B.; Hallberg, K.B. Acid mine drainage remediation options: a review. Sci. Total Environ. 2005, 338, 3–14. [Google Scholar] [CrossRef]
  10. Kefeni, K.K.; Msagati, T.A.M.; Mamba, B.B. Acid mine drainage: Prevention, treatment options, and resource recovery: A review. J. Clean. Prod. 2017, 151, 475–493. [Google Scholar] [CrossRef]
  11. INAP (The International Network for Acid Prevention). Global Acid Rock Drainage Guide. 2014. Available online: http://gardguide.com/images/5/5f/TheGlobalAcidRockDrainageGuide.pdf (accessed on 14 February 2019).
  12. Power, C.; Ramasamy, M.; MacAskill, D.; Shea, J.; MacPhee, J.; Mayich, D.; Baechler, F.; Mkandawire, M. Five-year performance monitoring of a high-density polyethylene (HDPE) cover system at a reclaimed mine waste rock pile in the Sydney Coalfield (Nova Scotia, Canada). Environ. Sci. Pollut. Res. 2017, 24, 26744–26762. [Google Scholar] [CrossRef] [PubMed]
  13. MEND (Mine Environment Neutral Drainage). Design, Construction and Performance Monitoring of Cover Systems for Waste Rock and Tailings. Volume 1–Summary; Canadian Mine Environment Neutral Drainage Program, Project 2.21.4a. 2004. Available online: http://mend-nedem.org/wp-content/uploads/2.21.4a-Cover-Design-Manual.pdf (accessed on 19 January 2019).
  14. Dobchuk, B.S.; Shurniak, R.E.; Barbour, S.L.; Kane, M.A.; Song, Q. Long-term monitoring and modelling of a reclaimed watershed cover on oil sands tailings. Int. J. Min. Reclam. Environ. 2013, 27, 180–201. [Google Scholar] [CrossRef]
  15. Power, C.; Ramasamy, M.; Mkandawire, M. Performance assessment of a single-layer moisture store-and-release cover system at a mine waste rock pile in a seasonally humid region (Nova Scotia, Canada). Environ. Monit. Assess. 2018, 190, 186. [Google Scholar] [CrossRef] [PubMed]
  16. Power, C.; Tsourlos, P.; Ramasamy, M.; Nivorlis, A.; Mkandawire, M. Combined DC resistivity and induced polarization (DC-IP) for mapping the internal composition of a mine waste rock pile in Nova Scotia, Canada. J. Appl. Geophys. 2018, 150, 40–51. [Google Scholar] [CrossRef]
  17. Scanlon, B.R.; Reedy, R.C.; Keese, K.E.; Dwyer, S.F. Evaluation of evapotranspirative covers for waste containment in arid and semi-arid regions in the southwestern USA. Vadose Zone J. 2005, 4, 55–71. [Google Scholar] [CrossRef]
  18. Bossé, B.; Bussiere, B.; Hakkou, R.; Maqsoud, A.; Benzaazoua, M. Assessment of phosphate limestone wastes as a component of a store-and-release cover in a semi-arid climate. Mine Water Environ. 2013, 32, 152–167. [Google Scholar] [CrossRef]
  19. Demers, I.; Bussiere, B.; Benzaazoua, M.; Mbonimpa, M.; Blier, A. Column test investigation on the performance of monolayer covers made of desulphurized tailings to prevent acid mine drainage. Miner Eng. 2008, 4, 317–329. [Google Scholar] [CrossRef]
  20. Aubertin, M.; Cifuentes, E.; Apithy, S.A.; Bussiere, B.; Molson, J.; Chapuis, R.P. Analyses of water diversion along inclined covers with capillary barrier effects. Can. Geotech. J. 2009, 46, 1146–1164. [Google Scholar] [CrossRef]
  21. Benson, C.H.; Thorstad, P.A.; Jo, H.; Rock, S.A. Hydraulic Performance of Geosynthetic Clay Liners in a Landfill Final Cover. J. Geotech. Geoenvironmental Eng. 2007, 133, 814–827. [Google Scholar] [CrossRef]
  22. Ayres, B.; Dirom, G.; Christensen, D.; Januszewski, S.; O’Kane, M. Performance of cover system field trials for waste rock at Myra Falls Operations. In Proceedings of the 6th International Conference on Acid Rock Drainage (ICARD), Cairns, Australia, 12–18 July 2003; Farrell, T., Taylor, G., Eds.; Australasian Institute of Mining and Metallurgy: Carlton, Melbourne, Australia, 2003. ISBN 1875776982. [Google Scholar]
  23. Meer, S.R.; Benson, C.H. Hydraulic conductivity of geosynthetic clay liners exhumed from landfill final covers. J. Geotech. Geoenvironmental Eng. 2007, 133, 550–563. [Google Scholar] [CrossRef]
  24. Adu-Wusu, C.; Yanful, E.K. Performance of engineered test covers on acid-generating waste rock at Whistle mine, Ontario. Can. Geotech. J. 2006, 43, 1–18. [Google Scholar] [CrossRef]
  25. Smith, L.J.D.; Moncur, M.C.; Neuner, M.; Gupton, M.; Blowes, D.W.; Smith, L.; Sego, D.C. The Diavik Waste Rock Project: Design, construction, and instrumentation of field-scale experimental waste-rock piles. Appl. Geochem. 2013, 36, 187–199. [Google Scholar] [CrossRef]
  26. Power, C.; Gerhard, J.I.; Tsourlos, P.; Giannopoulos, A. A new coupled model for simulating the mapping of dense nonaqueous phase liquids using electrical resistivity tomography. Geophysics 2013, 78, EN1–EN15. [Google Scholar] [CrossRef] [Green Version]
  27. Ramasamy, M.; Power, C.; Mkandawire, M. Numerical prediction of the long-term evolution of acid mine drainage at a waste rock pile site remediated with an HDPE-lined cover system. J. Contam. Hydrol. 2018, 216, 10–26. [Google Scholar] [CrossRef] [PubMed]
  28. Sizirici, B.; Tansel, B. Projection of landfill stabilization period by time series analysis of leachate quality and transformation trends of VOCs. Waste Manag. 2010, 30, 82–91. [Google Scholar] [CrossRef] [PubMed]
  29. Fala, O.; Molson, J.; Aubertin, M.; Bussière, B. Numerical modelling of flow and capillary barrier effects in unsaturated waste rock piles. Mine Water Environ. 2005, 24, 172–185. [Google Scholar] [CrossRef]
  30. Molson, J.; Fala, O.; Aubertin, M.; Bussière, B. Numerical simulations of pyrite oxidation and acid mine drainage in unsaturated waste rock piles. J. Contam. Hydrol. 2005, 78, 343–371. [Google Scholar] [CrossRef] [PubMed]
  31. Fala, O.; Molson, J.; Aubertin, M.; Dawood, I.; Bussière, B.; Chapuis, R.P. A numerical modelling approach to assess long-term unsaturated flow and geochemical transport in a waste rock pile. Int. J. Min. Reclam. Environ. 2013, 27, 38–55. [Google Scholar] [CrossRef]
  32. Lahmira, B.; Lefebvre, R. Numerical modelling of transfer processes in a waste rock pile undergoing the temporal evolution of its heterogeneous material properties. Int. J. Min. Reclam. Environ. 2015, 29, 499–520. [Google Scholar] [CrossRef]
  33. Bordeleau, G.; Martel, R.; Schäfer, D.; Ampleman, G.; Thiboutot, S. Groundwater flow and contaminant transport modelling at an air weapons range. Environ. Geol. 2008, 55, 385. [Google Scholar] [CrossRef]
  34. Şengör, S.S.; Ünlü, K. Modeling contaminant transport and remediation at an acrylonitrile spill site in Turkey. J. Contam. Hydrol. 2013, 150, 77–92. [Google Scholar] [CrossRef] [PubMed]
  35. Parbhakar-Fox, A.; Lottermoser, B.G. A critical review of acid rock drainage prediction methods and practices. Miner. Eng. 2015, 82, 107–124. [Google Scholar] [CrossRef]
  36. Yucel, D.S.; Baba, A. Prediction of acid mine drainage generation potential of various lithologies using static tests: Etili coal mine (NW Turkey) as a case study. Environ. Monit. Assess. 2016, 188, 473. [Google Scholar] [CrossRef] [PubMed]
  37. Diersch, H.J.G. Feflow: Finite Element Modeling of Flow, Mass and Heat Transport in Porous and Fractured Media; Springer: Berlin/Heidelberg, Germany, 2014; p. 996. [Google Scholar]
  38. Liu, Y.; Kuang, X.; Jiao, J.J.; Li, J. Numerical study of variable-density flow and transport in unsaturated-saturated porous media. J. Contam. Hydrol. 2015, 182, 117–130. [Google Scholar] [CrossRef] [PubMed]
  39. Regnery, J.; Lee, J.; Drumheller, Z.W.; Drewes, J.E.; Illangasekare, T.H.; Kitanidis, P.K.; McCray, J.E.; Smits, K.M. Trace organic chemical attenuation during managed aquifer recharge: Insights from a variably saturated 2D tank experiment. J. Hydrol. 2017, 548, 641–651. [Google Scholar] [CrossRef] [Green Version]
  40. Van Genuchten, M.T. A closed-form equation for predicting the hydraulic conductivity of unsaturated soils. Soil Sci. Soc. Am. J. 1980, 44, 892–898. [Google Scholar] [CrossRef]
  41. Widomski, M.K.; Beck Broichsitter, S.; Zink, A.; Fleige, H.; Horn, R.; Stępniewski, W. Numerical modeling of water balance for temporary landfill cover in North Germany. J. Plant Nutr. Soil Sci. 2015, 178, 401–412. [Google Scholar] [CrossRef]
  42. Barber, L.A.; Ayres, B.K.; Schmid, B. Performance evaluation of reclamation soil covers at Cluff Lake mine in northern Saskatchewan. In Mine Closure 2015: Proceedings of the Tenth International Conference on Mine Closure, Vancouver, BC, Canada, 1–3 June 2015; Fourie, A.B., Tibbett, M., Sawatsky, L., van Zyl, D., Eds.; Australian Centre for Geomechanics: Perth, Australia, 2015; ISBN 9780991790593. [Google Scholar]
  43. King, M.; Check, G.; Carey, G.; Abbey, D.; Baechler, F. Groundwater and contaminant transport modelling at the Sydney Tar Ponds. In Proceedings of the 56th Annual Canadian Geotechnical Conference and 4th Joint IAH-CNC/CGS Groundwater Specialty Conference, Winnipeg, Manitoba, Canada, 29 September–1 October 2003; Kingerski, D., Ed.; Canadian Geotechnical Society: Alliston, Ontario, Canada, 2003. [Google Scholar]
  44. Kirby, C.S.; Cravotta, C.A., III. Net alkalinity and net acidity 1: Theoretical considerations. Appl. Geochem. 2005, 20, 1920–1940. [Google Scholar] [CrossRef]
  45. Park, D.; Park, B.; Mendinsky, J.J.; Paksuchon, B.; Suhataikul, R.; Dempsey, B.A.; Cho, Y. Evaluation of acidity estimation methods for mine drainage, Pennsylvania, USA. Environ. Monit. Assess. 2015, 187, 4095. [Google Scholar] [CrossRef]
  46. McWhorter, D.B.; Sunada, D.K. Ground-Water Hydrology and Hydraulics; Water Resources Publications: Highlands Ranch, Colorado, 1981; ISBN 0918334187. [Google Scholar]
  47. Domenico, P.A.; Schwartz, F.W. Physical and Chemical Hydrogeology-Hydraulic Testing: Models, Methods, and Applications; John Wiley & Sons Inc.: New York, NY, USA, 1990. [Google Scholar]
  48. Schulze-Makuch, D. Longitudinal dispersivity data and implications for scaling behavior. Ground Water 2005, 43, 443–456. [Google Scholar] [CrossRef]
  49. Krahn, J. Vadose Zone Modeling with VADOSE/W: An Engineering Methodology, 1st ed.; GEO-SLOPE International Ltd.: Calgary, AB, Canada, 2014. [Google Scholar]
  50. Charlton, S.R.; Parkhurst, D.L. Modules based on the geochemical model PHREEQC for use in scripting and programming languages. Comput. Geosci. 2011, 37, 1653–1663. [Google Scholar] [CrossRef]
Figure 1. Plan view of the study site showing the Lingan waste rock pile (WRP; including the location of key field instrumentation/monitoring points) and environmental receptors.
Hydrology 06 00083 g001
Figure 2. (a) Schematic diagram of the geological cross-section A-A′ through the WRP, indicating the location of the various monitoring wells (MWs), continuous multi-level tubing (CMT) wells and soil monitoring stations (SMSs), and (b) groundwater flow regime beneath the WRP. CMT-1 and CMT-3 are represented by dashed outlines to indicate their location is offset from cross-section A-A′. The yellow dashed lines and blue arrows in (b) represent the piezometric surface and dominant groundwater flow directions, respectively.
Hydrology 06 00083 g002
Figure 3. (a) Particle size distribution for both the till cover and waste rock material, and (b) moisture retention curves based on the mean moisture content and suction measurements taken at various depth intervals at the four SMSs.
Hydrology 06 00083 g003
Figure 4. 2D model cross-section indicating the various geologic units and boundary conditions.
Hydrology 06 00083 g004
Figure 5. (a) Evolving simulated and observed moisture content at SMS-2 and SMS-4 during calibration and verification periods, and (b) scatter plot of simulated and observed moisture contents. The solid black line in (b) represents the 1:1 and the dashed lines represent one standard deviation of ±1.74%.
Hydrology 06 00083 g005
Figure 6. Comparison of the simulated and observed hydraulic heads at (a) CMT-2 and (b) CMT-4 over time. (c) Scatter plot of simulated and observed heads at both CMT-2 and CMT-4. The solid black line in (c) represents the 1:1 and the dashed lines represent one standard deviation of ±1.22 m.
Hydrology 06 00083 g006
Figure 7. Evolution of acidity concentrations at CMT-2 (red) and CMT-4 (blue) between June 2012 and December 2016, along with the monthly net percolation values (green).
Hydrology 06 00083 g007
Figure 8. Comparison of the simulated and observed acidity concentrations at (a) CMT-2 and (b) CMT-4 over time.
Hydrology 06 00083 g008
Figure 9. Spatial distribution of simulated acidity concentrations over time at the Lingan WRP. The white dashed line defines the base of the waste rock layer throughout all time steps.
Hydrology 06 00083 g009
Figure 10. Evolution of acidity at CMT-2 and CMT-4 during the 10,000-year simulation period.
Hydrology 06 00083 g010
Figure 11. (a) Evolution of observed and simulated acidity concentrations in Graces Brook, and acidity observed at the toe seep (red x’s), and (b) predicted acidity concentrations during the simulation period. The blue square with the red outline in (a) represents the mean observed pre-cover acidity.
Hydrology 06 00083 g011
Table 1. Summary of geological units at the Lingan mine site.
UnitGeologyThickness (m)Hydraulic Conductivity (m/s)Porosity (–)PSD (%) aModel Layer
CoverTill0.52.72 × 10−5–8.38 × 10−30.3736/43/211
Waste rockFill1–152.78 × 10⁻⁵–9.08 × 10−40.3538/44/182–5
TillTill0.5–55.09 × 10⁻⁵–1.69 × 10−30.2528/40/326
BedrockSandstone~ 252.83 × 10⁻⁶–1.69 × 10−30.11-7
a Particle size distribution (PSD) percentages are listed as ‘gravel’/’sand’/’silt/clay’.
Table 2. Summary of groundwater sampling (levels and geochemistry) in the study area.
Monitoring ElementNumberGeologic UnitMonitoring Period
Pre-Cover aPost-Cover b
Soil Monitoring Station4Cover, waste rock-Jun 2012–Dec 2016 (30)
CMT Wells4Till, bedrock-Jun 2012–Dec 2016 (30)
Monitoring Wells4Till, bedrockSept 2008–Dec 2008 (2)-
Surface Water Sampling2Graces Brook-Jun 2012–Dec 2016 (14)
a The CMT wells were only installed in 2011 so ‘pre-cover’ groundwater information does not exist. b The number of samples collected in the stated sampling period is given in parentheses.
Table 3. Annual water flux components between 2012 and 2016.
Component20122013201420152016Mean
mm% amm%mm%mm%mm%mm%
PPT1191-1311-1322-1426-1442-1338-
R418354543553445535375413849637
AET408344163241434356253652539230
ΔWS–13030–508119120
ΔSS3012792012891118745
NP375313112437731399284062837428
a Each water balance component is also indicated as a percentage of precipitation (% PPT).
Table 4. Summary of ABA tests (N = 8), including paste pH, total sulphur, acid neutralization potential (ANP), acid generation potential (AGP) and net neutralization potential (NNP).
SamplePaste pHTotal SSulphideSulphateANPAGPNNP
wt%wt%wt%kg CaCO3/tkg CaCO3/tkg CaCO3/t
Mean4.750.710.370.34–0.3811.50−11.88
Min–max3.2–7.20.17–0.990.10–0.600.07–0.51−8.66–6.953.06–18.63−23.97–3.89
Std dev1.630.280.160.156.495.109.45
Table 5. Annual oxygen flux between 2012 and 2016 for each mechanism.
Mechanism20122013201420152016Mean
mol/m2mol/m2mol/m2mol/m2mol/m2mol/m2
Diffusion46.3362.4778.3920.4840.0449.54
Dissolved0.0440.0360.0440.0460.0470.043
Total46.3762.5178.4420.5340.0949.58
Table 6. Values of key model parameters following flow model calibration and verification.
Model LayerHydraulic Conductivity (m/s)PorosityMaximum Saturation (Ss)Residual Saturation (Sr)α (Fitting Coefficient) (l/m)n (Fitting Parameter)
14.32 × 10−30.3710.0250.072.6
25.00 × 10−40.3510.10.072.6
30.3510.10.22.68
40.3510.10.14.4
50.3510.10.14.4
62.50 × 10−40.25----
75.90 × 10−40.11----
Table 7. Key input parameters to contaminant transport model.
ParameterUnitOverburdenBedrock
Molecular diffusionm2/s1 × 10−91 × 10−9
Longitudinal dispersivitym63
Transverse dispersivitym0.60.3