Abstract
The objective of this study was to establish drought classification maps to simulate and calculate the lack of discharge in the Ba River basin in Vietnam. The maps were established using three meteorological drought indices (the Standardized Precipitation Index (SPI), the Drought Index (J), and the Ped Index (Ped)), the Soil and Water Assessment Tool (SWAT) model, and the hydrological drought index (KDrought). The results from the calculation of the SPI, Aridity Index (AI), and Ped at three stations (An Khe, Ayunpa, and MDrak) showed that the J index was suitable for the study area. Based on the J index, an extreme drought was predicted to occur at the Ayunpa, An Khe, and MDrak stations. During the calibration process, the SWAT Calibration Uncertainties Program (SWAT-CUP) model, with automatic algorithms, was used to select the parameters to optimize the SWAT model. For the calibration and validation, the observed discharge at two hydrology stations, An Khe and Cung Son, from the periods 1981–1991 and 1992–2002, respectively, were used. The simulated discharge was found to be acceptable, with the Nash–Sutcliffe efficiency (NSE), Percent bias (PBIAS), and R2 reaching good levels in both calibration and validation. The results from the calculation of the drought index (KDrought), and the established drought classification maps in 2016, showed that the most affected areas were the communes of the Gia Lai and Dak Lak provinces. The results from the simulation and calculations were found to be consistent with the situation that occurred in practice. The application of meteorological and hydrological drought indices, as well as the hydrological model, to support impact assessments of drought classification in space and time, as well as the establishment of forecasting and warning maps, will help managers to effectively plan policy responses to drought.
1. Introduction
Drought is a stochastic and recurring natural hazard that has costly and devastating impacts on surface and groundwater supplies, crop production, ecological water quality, electricity production (hydropower), modern industrial production, and waterborne transportation [1,2,3]. Wilhite and Glantz (1985) [4] identified four categories of drought: meteorological drought, agricultural drought, hydrological drought, and socio-economic drought. The prediction of drought can play an important role in the mitigation of its effects. In other words, fundamental to mitigating the detrimental effects of droughts is the ability to forecast drought conditions in advance by either a few months or a number of seasons [5]. These studies evaluate drought on a global scale [6], as well as on regional and local scales [7,8]. In recent years, drought indices have become a primary option for drought monitoring and characterization. Based on different variables and mathematical algorithms, more than 150 drought indices have been proposed [9]. Previous studies have developed a variety of indices to assess meteorological drought and hydrological drought. A review of drought indices can be found in several previous studies [10,11,12]. The Rainfall Anomaly Index (RAI) [13], Deciles Index (DI) [14], Drought Area Index (DAI) [15], surface humidity index [16], Reconnaissance Drought Index (RDI) [17], and Standardized Precipitation Index (SPI) [18,19,20,21] have been utilized. Among these indices, the Palmer drought severity index (PDSI) [22] and the standardized precipitation index (SPI) [18] could be regarded as two outstanding representatives, since their algorithms are widely applied in other drought indices. Bazrafshan (2002) [23] analyzed seven meteorological drought indices for diverse climates in Iran (arid to very humid regions) and recommended the standard index of annual precipitation (SIAP), SPI, and effective drought index (EDI) for drought monitoring on annual, monthly, and daily timescales, respectively. The application of a drought index has been based on rainfall data and temperature and humidity monitoring in the past. It shows that the drought event, the frequency and severity of droughts, and the duration of a drought’s prolongation in some areas have increased significantly. In Vietnam, these studies often use drought indices, such as the SPI, rainfall standards, the drought index (K), the Ped Index (Ped), the moisture index, and the Palmer index, to study drought variation [24,25,26]. The results show that drought, on a national scale, mainly occurs in winter and spring. Particularly, drought in the South-Central region occurs in spring and summer, while drought in the North-Central region occurs in summer.
Many studies have focused on individual drought categories, whereas only a few studies have analyzed the relationships between meteorological drought and hydrological drought. This is due to the complexity in the underlying conditions, such as land cover, vegetation, topography, and other associated hydrologic/climatic variables [27,28,29].
Hydrological models, including physical-distribution-based models, such as the European Hydrological System Model (MIKE-SHE), Topography Based Hydrological Model (TOPMODEL) [30], the Hydrologic Modelling System (HEC-HMS) [31,32], the Variable Infiltration Capacity (VIC) [33], the Soil and Water Assessment Tool (SWAT) [34], the Soil and Water Integrated Model (SWIM) [35], and the Water-Global Assessment and Prognosis (WaterGAP) [36], are capable of simulating temporal–spatial variations in hydrological processes and assisting us to understand the mechanisms of influence behind land use impacts [37,38,39,40,41,42]. Many studies have demonstrated the ability of SWAT to detect the impacts of land use and climate change on hydrological components in different areas [43,44,45,46,47]. The objectives of this study were: (1) the calculation of meteorological drought indices (the Drought Index (J), Ped, and SPI); (2) the application of a hydrological model (SWAT) to the calculation of the outflow of each sub-catchment; (3) the application of a drought index (KDrought) to the calculation and evaluation of the drought classification of each sub-catchment; and (4) the application of the ArcGIS tool to the establishment of drought classification maps of the Ba River basin in Vietnam.
2. Materials and Methods
The flow diagram of this study’s methodology is presented in Figure 1.
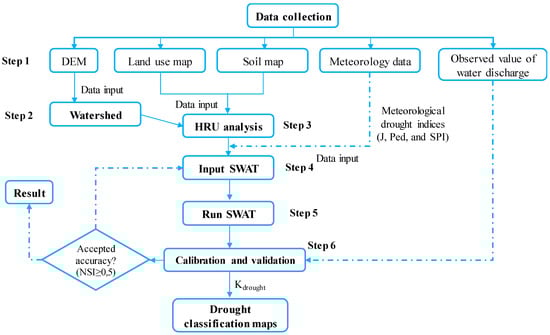
Figure 1.
The flow diagram of the methodology.
2.1. Description of the Study Site
The Ba River basin is located within the administrative boundary of 20 districts and one city belonging to three provinces of the Central Highlands, namely Kon Tum, Gia Lai, Daklak, and a coastal province in the South-Central region of Phu Yen, in which there is one district in the Kon Tum province, namely the KonPlong district, and 10 districts in the Gia Lai province, including Kbang town, An Khe, Dakpo, Konch Ro, DakDoa, Mang Yang, Chu Se, Ayun Pa, Krong Pa, and EaPa. The four districts of the Dak Lak province are Ea Hleo, Krong HNang, Eakar, and MadRak, and there are five districts in the Phu Yen province, namely Son Hoa, Song Hinh, Phu Hoa, Tuy Hoa, and Tuy Hoa city (Figure 2). The geographical position of the basin is about 12°55′ to 14°38′ north latitude and 108°00′ to 109°55′ east longitude on the northern borders of the Sesan river basin and the Tra Khuc river, the southern borders of the Cai river basin and the Srepok river, and the eastern borders of the basin of Kon river, the Ky Lo river, and the East sea. The natural area of the basin (including the Ban Thach branch) is 1,413,204 ha.
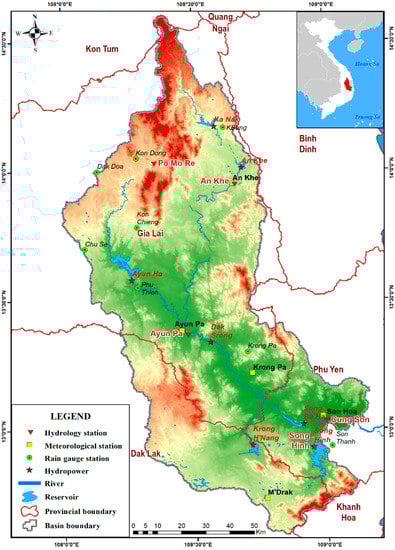
Figure 2.
A map of the study site.
2.2. Standardized Precipitation Index (SPI), Aridity Index (AI), and Ped Index
McKee et al. (1993) [18] developed and introduced the SPI for the purpose of identifying and monitoring drought events using monthly rainfall data. It is intended to identify drought periods, as well as the severity of droughts, at multiple time steps, such as at 1, 3, 6, 9, and 12. However, the objective choice on the best time step may depend on the purpose of the drought analysis. As reported by the World Meteorological Organization (WMO), the SPI is based on the probability of precipitation for any timescale. The SPI is used extensively in various parts of the world [48,49,50,51,52]. Scientists appreciate the flexibility of the SPI, and it is used in national institutes, universities, and meteorological and service centers around the world as part of drought warning and forecast systems [53,54,55,56,57]. The advantages of the SPI are that its only input parameter is precipitation, it can be calculated for different time periods, it can provide early warning information, and it can be used to assess the severity of drought. However, continuous long-term data from the period 1981–2016 are used to compute the SPI; it does not allow for missing data. The complete procedure for the estimation of the SPI is available in Edwards and Mckee (1997) [58].
The aridity indices have been reviewed by Walton (1969) [59] and Stadler (2005) [60]. The simplest aridity index is based solely on precipitation. A commonly used rainfall-based definition is that an arid region receives less than 10 inches or 250 mm of precipitation per year. This criterion for aridity was used by the Intergovernmental Panel on Climate Change [61]. Semiarid regions are commonly defined by an annual rainfall of between 10 and 20 inches (250 and 500 mm). United Nations Educational, Scientific and Cultural Organization (UNESCO) (1979) [62] provides an aridity index (AI) based on the ratio of annual rainfall (P) to the rate of potential evaporation (ETp), as follows:
where ETp is calculated by the Penman (1948) [63] formula. Warm arid areas have a low P, a high ETp, and very low AI values.
Because ETp data may not be available, the use of the AI is limited by UNESCO. De Martonne (1926) [64] provided a drought index (J), instead of using temperature as a function of ETp, as follows:
The above formula applies to the J index, calculated for a one-year period, where Pi is the i-th total monthly rainfall, and Ti is the i-th monthly average temperature. The J index can be expressed by the following formula:
However, to calculate the J index for each month, this formula can be used flexibly as follows:
The above equation is suitable for a temperature T greater than −9.9 °C. The Ped index, introduced by Pedey [65], and used to determine drought, is used at the Hydro-Meteorological Centre of Russia. The advantage of this indicator is that it is easy to classify weather conditions (drought or wet weather) (Table 1). The formula is calculated as follows:
where P is the total annual rainfall (mm); Pi is the i-th monthly average rainfall (mm); T is the monthly average temperature (°C); ΔT is the deviation in air temperature (°C); ΔP is the deviation in precipitation (mm); is the standard deviation of the temperature (°C); is the standard deviation of the precipitation (mm); and ETp is the rate of potential evaporation.

Table 1.
Classification of drought according to the Ped index.
Drought will occur when the temperature increases, and precipitation falls sharply.
The Ped index depends on temperature and precipitation variations. Positive values of Ped correspond to a dry weather or a warmer temperature regime, while negative values of Ped correspond to wet weather. In order to easily analyze and compare the results, this study set the thresholds for determining the drought ability for the three indices J, SPI, and Ped to those shown in Table 2.
Table 2.
Classification of drought according to the Drought Index (J), the Standardized Precipitation Index (SPI), and the Ped index.
2.3. Description of the SWAT Model
The Soil and Water Assessment Tool (SWAT) model was developed by the Agricultural Research Service (ARS), U.S. Department of Agriculture (USDA), namely the Grassland Soil and Water Research Laboratory in Texas. The model consists of the integration of several physical and conceptual models [66] for the simulation of a series of physicochemical processes in a watershed. The SWAT is a conceptual-distributive model that was initially designed for large basins and has gradually been expanded to various applications. The SWAT model consists of three main components, namely model inputs, model outputs, and the model’s main program. The SWAT model includes nine main parameters and about 22 secondary parameters, which simulate six hydrological and biological variables and processes [34]. In this model, each basin is divided into many sub-basins, and each of the sub-basins is divided into many Hydrologic Reaction Units (HRUs), which are homogenous from the viewpoint of the land use and soil features.
The SWAT model is widely applied for runoff and water quality modeling in changing scenarios [67,68,69,70,71]. The SWAT model has been used for simulation of the river flow in the Qareh Sar sub-basin in the northwest of the Karkheh River and showed a higher sensitivity for the curve number parameter [72]. The SWAT model was also used to simulate the monthly average discharge at the Emameh basin, one of the sub-basins of the Jajerood river [73], and the results showed that the model has a high sensitivity to the roughness of the land surface. The SWAT model was also calibrated for the Atrova river basin in Kaneon, with an area of 1680 km2 [74]. The calibration results of the daily and monthly flows were satisfactory, and the results showed that the model has a good performance in terms of flow prediction. In this paper, the SWAT model was applied to simulate the flow and to evaluate the lack of flow, as well as the hydrological drought, at the study site.
2.4. The Hydrological Drought Index (KDrought)
In order to assess the extent of drought in the study area over time and space, it is necessary to develop a drought map of the river basins in the study area. The research method in this paper is based on the calculation of drought indices for sub-basins, with the potential evapotranspiration calculated by the Penman–Monteith model, the average rainfall determined by the Thiessen polygon method, and the average flow of sub-basins based on the following formulas:
where K1 is the dry coefficient, which indicates the level of meteorological drought; K2 is the water discharge of the dry coefficient, which indicates the abundance level of water resources at some time of the year; X is a month’s precipitation; ETp is the potential evaporation; Qj,i is the average water discharge during the j period of year i; Qi is the average water discharge of the year i; and Q0 is the average water discharge over many years.
Thus, Kdrought is an index that indicates the classification of a drought (both dry weather and drought) in terms of the occurrence and the place. The Kdrought is calculated for each meteorological station located in the basin or adjacent to the basin. It is determined when K1 and K2 are simultaneously positive. Criteria for the classification of the term are based on actual developments over years (Table 3) [75].
Table 3.
Definition of the state of hydrological drought indices.
2.5. SWAT Model Setup
The SWAT model requires different input data. However, not all input data are required, and some unnecessary data may be ignored in some specific cases. In general, the process of setting up the SWAT model for any application consists of six steps: (1) data preparation, (2) basin identification, (3) hydrologic unit definition, (4) entering of the input data, (5) running of the model, and (6) calibration and verification of the model (Figure 1). Setting up the input data for the model involved the following steps: (1) The digital elevation model (DEM) was collected from the National Aeronautics and Space Administration (NASA)’s high-altitude digital data Advanced Space borne and Reflection Radiometer (ASTER), with a resolution of 30 m × 30 m and an altitude from 65 to 2445 m (Figure 3a); (2) Based on the hydrological station network and the DEM topographic map, the SWAT model divided the basin into 43 sub-catchments (Figure 3b); (3) A soil map of the Ba river basin was collected from the Institute of Minerals and Geology. The types of soil encoded in the SWAT model include reddish-brown soil, discolored gray soil, black soil with patchy layers, cracked black soil, new soil that is moderately acidic, patchy cracked soil, alluvial soil, and neutral soil with little acidity (Figure 3c); and (4) Finally, a three-year basin land use map was interpreted from a Landsat 4.5 satellite image, downloaded from the website http://earthexplorer.usgs.gov, with a resolution of 30 m × 30 m. Similar to other maps, the land cover maps were divided into seven categories based on the code of the SWAT model, including perennials, annual trees, deciduous forests, evergreen forests, mixed forests, special-use forests, and surface water (Figure 3d).
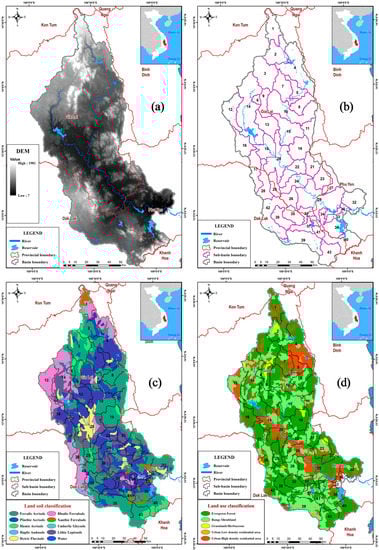
Figure 3.
(a) Digital elevation model (DEM) map; (b) Sub-basin division in the Soil and Water Assessment Tool (SWAT) model; (c) Land soil map; (d) Land use map.
2.6. Evaluation Model
Nash–Sutcliffe efficiency (1970) (NSE) [76] is the most common, and a highly reliable, method for evaluating the analytical power of hydrological models. It is represented in Equation (7). NSE values range between 0 and 1. According to Andersen et al. (2001) [77], NSE values between 0.50 and 0.95 represent a good simulation result. It is worth mentioning that a subset of these statistics has been and is being used in studies on model evaluation, with the use of NSE as the most common tool in most studies [78].
Gupta et al. (1999) [79] reported that the pecent bias (PBIAS) is a type of statistical error analysis that quantifies the likelihood that simulated model values will overestimate or underestimate the observed data. PBIAS can be calculated using Equation (8).
This can be described as the square of the correlation coefficient [80]. The equation representing R2 is presented in Equation (9). The coefficient of determination (R2) values range from 0 to 1, which illustrates how the distributed observed variables are described by the simulation. Simulated values equal to 1 represent a perfect distribution between the observed and simulated model values, while values equal to 0 signify no correlation. One major disadvantage of R2 is that there will be ambiguity in the results if the model underestimates or overestimates the results [81]. This can easily be sorted out by comparing visually the observed and simulated results [82].
where QSim is the simulated discharge at time t = i; QObs is the observed discharge at time t = i; is the average simulated discharge; is the average observed discharge; and N is the number of observations.
3. Results and Discussion
3.1. Drought Frequency with the J, SPI, and Ped Indices
Figure 3 shows the frequency distribution of the three indices J, SPI, and Ped at the An Khe, Ayunpa, and MDrak stations, which are typical for the Central Highlands. Among these, index J shows a different trend as compared to the other two indices. In particular, the J index for the frequency of drought is clearly limited in the months with frequencies greater than 50% and less than 50%. Meanwhile, the SPI and PED indices for the 12-month term are common in the range of 20–50%. Specifically, for index J, at the An Khe station, the highest frequency of occurrence occurs from January to April, ranging from 83 to 100%. At the Ayunpa station, the largest frequency of drought lasts from December of the previous year to April of the following year and varies from 63% to 100%. The MDrak station is similar to the An Khe station, with the largest frequency of droughts in the first four months of the year, from 64% to 94% (Table 4, Figure 4).
Table 4.
The frequency of monthly drought, based on the three indices, at the An Khe, Ayunpa, and MDrak stations.
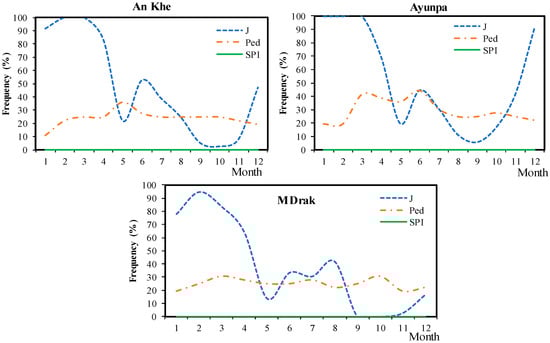
Figure 4.
The frequency distribution of monthly drought, based on the three indices, at the stations of An Khe, Ayunpa, and MDrak.
Thus, the J index best reflected the frequency of drought in accordance with the climate pattern in the Central Highlands region. In particular, the drought was mainly concentrated in the winter months, with the highest occurrence from January to the end of April over 60%. It was also the period when the Central Highlands region was dominated by the northeast to east wind field, from the dry continental high-pressure margin from the north, combined with the high-altitude currents of the Western Pacific subtropical system. Therefore, it was less likely to rain.
3.2. Drought Classification with the J, SPI, and Ped Indices
The frequency of drought classification based on the three indices indicates that, for the An Khe station, the J index shows a larger proportion, accounting for 15.7%, while the remaining indices (Ped and SPI) are only approximately 2.3%. At the Ayunpa station, the frequency of extreme drought, according to the J index, also accounts for approximately 30%, and the remaining two indices are 2.8% and 1.4%, respectively. The same is true for the MDrak station, although the frequency of extreme drought is not very high, at approximately 9%. However, it accounts for more than the Ped and SPI indicators. In addition, if the drought classification is based on the medium term, the J-index also shows a higher frequency than that of the other indicators, at 22.2% at the An Khe station, 13.7% at the Ayunpa station, and 19.7% at the Dak Lak station (Table 5, Figure 5). The results of the calculation of the drought classification at typical stations in the Central Highlands region show that index J is the most suitable choice in this area. In addition, considering the J index, a period of extreme drought will occur at the Ayunpa station, then at the An Khe station, and, finally, at the Dak Lak station.
Table 5.
The drought classification frequency (%), with the J, SPI, and Ped indices.
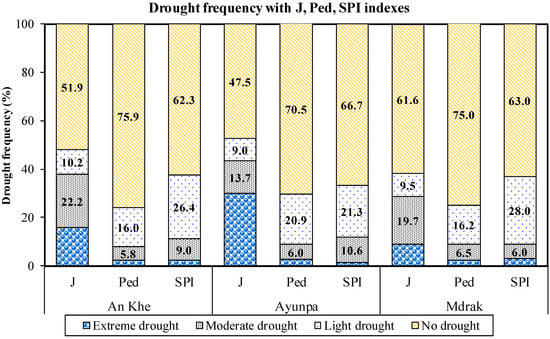
Figure 5.
The frequency distribution of drought classification at the An Khe, Ayunpa, and Mdrak stations according to the J, Ped, and SPI indices.
3.3. Statistics Concerning the Greatest Number of Drought Years with the J Index
Table 6 shows the year-end statistics according to the J index. The highest occurrence of drought occurred in December 2013, and all three stations experienced extreme drought. In 2016, the drought appeared at two typical stations: An Khe and Ayunpa in March, especially during the period from January to March at the Ayunpa station. In 2006, the term only appeared at the Ayunpa station in January and February. Based on the statistics and an analysis of very severe drought years in the period of 1981–2016 for index J, 2016 was a typical year to simulate assessments and develop a distribution map.
Table 6.
Statistics of the years of extreme drought in the period 1981–2016, with index J ≤ 5.
3.4. Calibration and Validation of the SWAT Model
The calibration and verification of the SWAT model, using flow data collected at the An Khe hydrological station and the Cung Son hydrological station, was divided into two phases: calibration (1981–1991) (Figure 6a,b) and verification (1992–2002) (Figure 6c,d). The parameter optimization techniques have been analyzed and applied in recent studies, such as Wang et al. (2019) [83] and Di et al. (2018) [84]. However, the automatic calibration process uses the SWAT Calibration Uncertainties Program (SWAT-CUP) software, with automatic algorithms that match the instability values. The adjustment process was performed separately for each hydrological station, with the principle of adjustment from the upstream station to the downstream station.
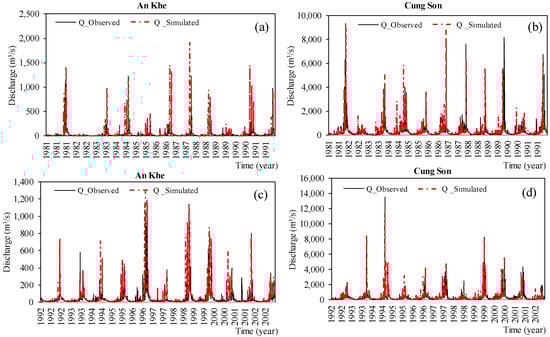
Figure 6.
Calibration and validation of the water discharge at two stations, An Khe and Cung Son, from the periods 1981–1991 (a,b) and 1992–2002 (c,d).
To assess the appropriateness between the results and measured values, the hierarchy of Moriasi et al. (2007) [82] shows that the results from a simulation of the SWAT model for the Ba river basin are relatively good (Figure 6). The NSE values ranged from 0.72 to 0.75; the R2 values ranged from 0.67 to 0.80; and the PBIAS values ranged from 0.45 to 0.68, with a high evaluation (PBIAS < ±10%). The results of the evaluation of the calibration and validation process are presented in Table 7.
Table 7.
The results of the calibration and validation of the SWAT model.
After revising and verifying the SWAT model and finding the model parameters that were suitable for the basins over which we performed calculations, a simulation of the dry season flow in the selected year was conducted to assess the study area (Table 8). During the calibration process, the SWAT-CUP model with automatic algorithms was used for unstable parameters. We used the year 2016 in the simulation of a typical year, and the balance components, such as the potential rainfall, evaporation, and waterflow, were extracted from the model for the calculation of the index in the basin.
Table 8.
SWAT model parameters.
3.5. Establishment of Drought Classification Maps
The water balance components, such as the potential rainfall, evaporation, and water flow, were extracted from the model to calculate drought index in the basin. Based on documents concerning the potential vapor evaporation, rainfall, and monthly average water flow from 1981 to 2016, the dryness index and the drought index were calculated according to the formula given in Section 2.4. The results of the calculation and development of partition maps of dryness and drought for 43 sub-basins from 1981 to 2016 are shown in Figure 7. Through the process of analyzing, evaluating, and synthesizing data on Central Vietnam, a relatively extreme drought was found to have occurred in 2016; so, the study conducted the simulation using the 2016 data, and calculated the Kdrought and developed a partition map of drought in 2016 for the Ba river basin. Figure 8 shows the results of the K1, K2, and KDrought indices of the map of the Ba river sub-basins in 2016.
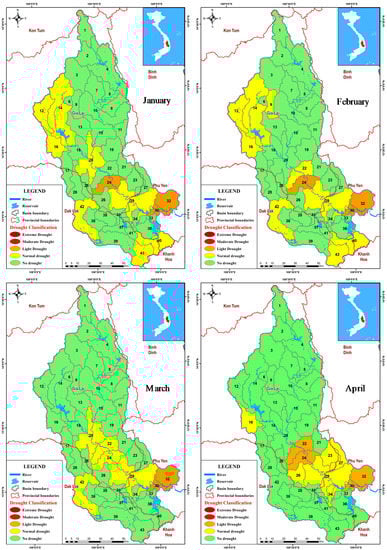
Figure 7.
The average drought classification maps from January to April for the period 1981–2016 in the Ba River basin.
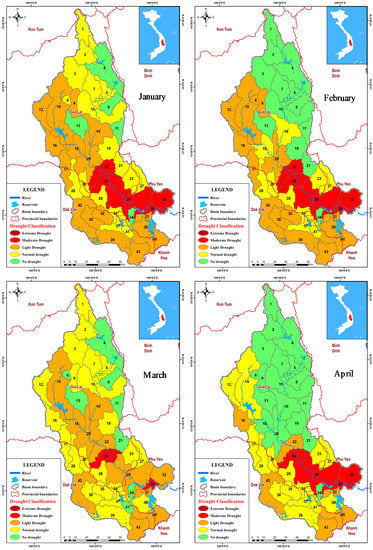
Figure 8.
The drought classification maps from January to April in 2016 in the Ba River basin.
The results show that the SWAT model is appropriate for the simulation of the flow process of the Ba river basin in 2016. The results provide sufficient information to calculate the hydrologic drought index. The results of the calculation shown in Figure 8 show that, in 2016, drought mostly occurs in the area of the Ba river basin, and the drought took place from January to April. It can be seen that many severe droughts have occurred in some of the sub-basins in the study area, and the most affected areas are the communes of the Gia Lai and Dak Lak provinces. The results of the simulation are consistent with the data on the actual situation. Thus, the hydrological model can be effectively applied to support the process of assessing the impact of drought through space and time as well as to develop drought warning maps to help managers to plan policies to deal with drought in the future. It can be seen that the application of the model to assess the impact of drought on the study area through space and time is effective and meaningful, especially in the context of climate change, which increasingly affects Vietnam in general and the central coastal areas in particular.
4. Conclusions
In this study, we established, combined, and applied drought classification maps of the Ba River basin in Vietnam using meteorological drought indices (SPI, J, and Ped), a hydrological model (SWAT), a hydrology drought index (KDrought), and Geographic Information System (GIS) tool. The major findings can be summarized as follows:
- (1)
- The J index best shows the frequency of drought in accordance with the climate patterns in the Central Highlands, in which the drought was mainly concentrated in the winter months, and the highest frequency was concentrated from January to the end of April, with a frequency of over 60%.
- (2)
- From the results of the drought indices and the drought classification at typical stations in the Central Highlands, index J was found to be the most suitable choice in this area. In addition, considering the J index, the most extreme drought occurs at the Ayunpa station, then at the An Khe station, and, finally, at the MDrak station.
- (3)
- Based on the statistics and analysis of 35 years of severe droughts during the period 1981–2016, and based on the J index, 2016 was used as a typical year for the simulation and evaluation of drought, and the construction of drought classification maps, from January to April in the Ba River basin.
- (4)
- The results show that the SWAT model can be applied to simulate the outflow of sub-catchments during the dry season in the study area, with good results from the calibration and verification of the model. The simulation results of the SWAT model will provide and fully supply the necessary data to calculate the hydrological drought index of the study area. Drought classification maps, based on the results of the calculation of the drought index (KDrought), have yielded a number of assessments of drought impacts on the study area in a spatial and temporal scope.
For a future study, it is recommended that the uncertainty in the meteorological drought index and the hydrological modeling (SWAT) be improved, as follows:
- (1)
- Drought in the Central region is related to the moisture regime. Therefore, future research should calculate additional related indices to soil moisture, such as the Palmer Drought Severity Index (PDSI) and the Crop Moisture Index (CMI).
- (2)
- The number of calibrations and validations in the SWAT model is low. This number may not be sufficient to evaluate the adequacy of the model in the study area.
Author Contributions
Conceptualization, D.Q.T. and D.D.T.; Methodology, D.Q.T.; Software, D.Q.T.; Calibration and validation, D.Q.T. and D.D.T.; Formal analysis, T.T.D.; Investigation, T.T.D. and D.D.T.; Data curation, D.Q.T.; Writing—original draft preparation, D.Q.T. and D.D.T.; Writing—review and editing, T.T.D.; Visualization, D.Q.T. and T.T.D.
Funding
This study was supported by funding from the government project titled “Research on the valuation of economic losses caused by extreme hydro-meteorological phenomena in the context of climate change and propose risk management solutions for coastal provinces of Central Vietnam” with grant number: BDKH.22/16-20.
Acknowledgments
The authors gratefully acknowledge the financial support from the Ton Duc Thang University and the permission to use its facilities to perform the study.
Conflicts of Interest
The authors declare no conflicts of interest.
References
- Wilhite, D.A. Drought as a natural hazard: concepts and definitions. In Drought: A Global Assessment; Routledge: New York, NY, USA, 2000; pp. 3–18. Available online: http://digitalcommons.unl.edu/droughtfacpub/69 (accessed on 6 June 2019).
- Van Loon, A.F. Hydrological drought explained. WIREs Water 2015, 2, 359–392. [Google Scholar] [CrossRef]
- Crausbay, S.D.; Ramirez, A.R.; Carter, S.L.; Cross, M.S.; Hall, K.R.; Bathke, D.J.; Betancourt, J.L.; Colt, S.; Cravens, A.E.; Dalton, M.S.; et al. Defining ecological drought for the twenty-first century. Bull. Am. Meteorol. Soc. 2017, 98, 2543–2550. [Google Scholar] [CrossRef]
- Wilhite, D.A.; Glantz, M.H. Understanding the drought phenomenon: the role of definitions. Water Int. 1985, 10, 111–120. [Google Scholar] [CrossRef]
- Dastorani, M.T.; Massah Bavani, A.R.; Poormohammadi, S.; Rahimian, M.H. Assessment of potential climate change impacts on drought indicators (Case study: Yazd station, Central Iran). Desert 2011, 16, 159–167. [Google Scholar]
- Dai, A.; Trenberth, K.E.; Qian, T. A Global Dataset of Palmer Drought Severity Index for 1870–2002: Relationship with Soil Moisture and Effects of Surface Warming. J. Hydrometeorol. 2004, 5, 1117–1130. [Google Scholar] [CrossRef]
- Benjamin, L.H.; Mark, A. European drought climatology and prediction using the Standardised Precipitation Index (SPI). In Proceedings of the 8.11 13th Conference on Applied Meteorology, Orlando, FL, USA, 13–17 January 2002; American Meteorological Society: Boston, MA, USA; pp. 13–16. [Google Scholar]
- Hayes, M.J.; Svobova, M.D.; Wilhite, D.A.; Vanyarkho, O.V. Monitoring the 1996 drought using the standardized precipitation index. Bull. Am. Meteorol. Soc. 1999, 80, 429–438. [Google Scholar] [CrossRef]
- Niemeyer, S. New drought indices, options méditerranéennes. Sér. A: Sémin. Méditerr. 2008, 80, 267–274. Available online: http://om.ciheam.org/om/pdf/a80/00800451.pdf (accessed on 6 June 2019).
- Bazrafshan, J.; Khalili, A. Spatial Analysis of Meteorological Drought in Iran from 1965 to 2003. Desert 2013, 18, 63–71. [Google Scholar]
- Shahabfar, A.R.; Eitzinger, J. Spatio-Temporal Analysis of Droughts in Semi-Arid Regions by Using Meteorological Drought Indices. Atmosphere 2013, 4, 94–112. [Google Scholar] [CrossRef]
- Asefjaha, B.; Faniana, F.; Feizia, Z.; Abolhasania, A.; Paktinat, H.; Naghiloua, M.; Molaei Atanic, A.; Asadollahia, M.; Babakhania, M.; Kouroshni, A.; et al. Meteorological drought monitoring using several drought indices (case study: Salt Lake Basin in Iran). Desert 2014, 19, 155–165. [Google Scholar]
- Van-Rooy, M.P. A rainfall anomaly index (RAI) independent of time and space. Notos 1965, 14, 43–48. [Google Scholar]
- Gibbs, W.J.; Maher, J.V. Rainfall Deciles as Drought Indicators. Melbourne: Bureau of Meteorology. 1967. Available online: https://trove.nla.gov.au/version/25447946 (accessed on 6 June 2019).
- Bhalme, H.N.; Mooley, D.A. Large-scale drought/floods and monsoon circulation. Mon. Weather Rev. 1980, 108, 1197–1211. [Google Scholar] [CrossRef]
- Ma, Z.; Fu, C. Trend of surface humid index in the arid area of northern China. Acta Meteorol. Sin. 2001, 59, 737–746. (In Chinese) [Google Scholar]
- Tsakiris, G.; Vangelis, H. Establishing a drought index incorporating evapotranspiration. Eur. Water 2005, 9, 3–11. [Google Scholar]
- McKee, T.B.; Doeskin, N.J.; Kleist, J. The relationship of drought frequency and duration to time scales. In Proceedings of the 8th Conference on Applied Climatology, American Meteorological Society, Anaheim, CA, USA, 17–22 January 1993; pp. 179–184. [Google Scholar]
- Loukas, A.; Vasiliades, L. Probabilistic analysis of drought spatiotemporal characteristics in Thessaly region, Greece. Nat. Hazards Earth Syst. Sci. 2004, 4, 719–731. [Google Scholar] [CrossRef]
- Leng, G.; Tang, Q.; Rayburg, S. Climate change impacts on meteorological, agricultural and hydrological droughts in China. Glob. Planet. Chang. 2015, 126, 23–34. [Google Scholar] [CrossRef]
- Huang, S.; Li, P.; Huang, Q.; Leng, G.; Hou, B.; Ma, L. The propagation from meteorological to hydrological drought and its potential influence factors. J. Hydrol. 2017, 547, 184–195. [Google Scholar] [CrossRef]
- Palmer, W.C. Meteorological Drought. Research Paper No. 45. U.S. Department of Commerce Weather Bureau: Washington, DC, USA, 1965. Available online: https://www.ncdc.noaa.gov/temp-and-precip/drought/docs/palmer.pdf (accessed on 6 June 2019).
- Bazrafshan, J. A comparative study of several meteorological drought indices in some climatic zones of Iran. Master’s Thesis, University of Tehran, Karaj, Iran, 2002. [Google Scholar]
- Vu, T.H.; Ngo, T.T.H.; Nguyen, Q.T.; Trinh, T.L. Projected drought conditions in the Central of Vietnam during 2011-2050 using the output of Regional Climate Model RegCM3. VNU J. Sci. 2011, 27, 21–31. [Google Scholar]
- Nguyen, Q.K. Study on drought forecasting in the South Central and Highland regions and establishing prevention sollutions, government project, grand number: KC.08.22. 2005; 354. [Google Scholar]
- Nguyen, T.H.; Nguyen, V.T.; Pham, T.T.H.; Vu, V.T. Impact of cliamte change on drought in climatic regions in Vietnam. Sci. Tech. Hydro-Meteorol. J. 2010, 598, 21–25. (In Vietnamese) [Google Scholar]
- Mo, K.C. Model-based drought indices over the United States. J. Hydrometeorol. 2008, 9, 1212–1230. [Google Scholar] [CrossRef]
- Mishra, V.; Cherkauer, K.A. Retrospective droughts in the crop growing season: implications to corn and soybean yield in the Midwestern United States. Agric. Forest Meteorol. 2010, 150, 1030–1045. [Google Scholar] [CrossRef]
- Mishra, V.; Cherkauer, K.A.; Shukla, S. Assessment of drought due to historic climate variability and projected future climate change in the midwestern United States. J. Hydrometeorol. 2010, 11, 46–68. [Google Scholar] [CrossRef]
- Beven, K.J.; Kirkby, M.J. A physically based variable contributing area model of basin hydrology. Hydrol. Sci. Bull. 1979, 24, 43–69. [Google Scholar] [CrossRef]
- William, C.; Pabst, A.; Peters, J. The Hydrologic Modeling System (HEC-HMS): Design and Development Issues; Institute for Water Resources, Hydrologic Engineering Center: Davis, CA, USA, 1995; Available online: https://www.hec.usace.army.mil/publications/TechnicalPapers/TP-149.pdf (accessed on 6 June 2019).
- U.S. Army Corps of Engineers. HEC-HMS Hydrologic Modeling System User’s Manual; Ver. 4.2; Hydrologic Engineering Center: Davis, CA, USA, 2016. [Google Scholar]
- Liang, X.; Lettenmaier, D.P.; Wood, E.F.; Burges, S.J. A simple hydrologically based model of land surface water and energy fluxes for general circulation model. J. Geophys. Res. 1994, 99, 415–428. [Google Scholar] [CrossRef]
- Arnold, J.G.; Srinivasan, R.; Muttiah, R.S.; Williams, J.R. Large area hydrologic modeling and assessment part I: Model development. J. Am. Water Res. Assoc. 1998, 34, 73–89. [Google Scholar] [CrossRef]
- Krysanova, V.; Hattermann, F.; Wechsung, F. Development of the ecohydrological model SWIM for regional impact studies and vulnerability assessment. Hydrol. Process. 2005, 19, 763–783. [Google Scholar] [CrossRef]
- Verzano, K. Climate Change Impacts on Flood Related Hydrological Processes: Further Development and Application of a Global Scale Hydrological Model. Ph.D. Dissertation, International Max Planck Research School on Earth System Modelling, University of Kassel, Kassel, Germany, 2009. [Google Scholar]
- Santhi, C.; Arnold, J.G.; Williams, J.R.; Dugas, W.A.; Srinivasan, R.; Hauck, L.M. Validation of the SWAT model on a large river basin with point and nonpoint sources. J. Am. Water Res. Assoc. 2001, 37, 1169–1188. [Google Scholar] [CrossRef]
- Liem, N.D.; Hong, N.T.; Minh, T.P.; Loi, N.K. Assessing Water Discharge in Be River Basin, Vietnam using GIS and SWAT model. In Proceedings of the National GIS Conference, Da Nang, Vietnam, 17–18 December 2011. [Google Scholar]
- Tram, V.N.Q.; Liem, N.D.; Loi, N.K. Assessing Water Availability in PoKo Catchment using SWAT model. Khon Kaen Agric. J. 2014, 42, 73–84. [Google Scholar]
- Singh, H.V.; Kalin, L.; Morrison, A.; Srivastava, P.; Lockaby, G.; Pan, S. Post-validation of SWAT model in a coastal watershed for predicting land use/cover change impacts. Hydrol. Res. 2015, 46, 837–853. [Google Scholar] [CrossRef]
- Li, Y.Y.; Chang, J.X.; Luo, L.F.; Wang, Y.M.; Guo, A.J.; Ma, F.; Fan, J.J. Spatiotemporal impacts of land use land cover changes on hydrology from the mechanism perspective using SWAT model with time-varying parameters. Hydrol. Res. 2018, 50, 244–261. [Google Scholar] [CrossRef]
- Nguyen, N.H.; Ngo, L.A.; Doan, Q.T.; Tran, T.D.; Dang, T.M.; Dinh, D.T. Research on forecasting and warning methods in hydrometeorological drought: case study at Dak Lak province, highland in vietnam. VN J. Hydrometeorol. 2019, 699, 30–41. (In Vietnamese) [Google Scholar]
- Gassman, P.W.; Reyes, M.R.; Green, C.H.; Arnold, J.G. The Soil and Water Assessment Tool: historical development, applications, and future research directions. Trans. ASABE 2007, 50, 1211–1250. [Google Scholar] [CrossRef]
- Guo, H.; Hu, Q.; Jiang, T. Annual and seasonal streamflow responses to climate and land-cover changes in the Poyang Lake basin. China. J. Hydrol. 2008, 355, 106–122. [Google Scholar] [CrossRef]
- Fan, M.; Shibata, H. Simulation of watershed hydrology and stream water quality under landuse and climate change scenarios in Teshio River watershed, northern Japan. Ecol. Indic. 2015, 50, 79–89. [Google Scholar] [CrossRef]
- Nie, W.; Yuan, Y.; Kepner, W.; Nash, M.S.; Jackson, M.; Erickson, C. Assessing impacts of landuse and landcover changes on hydrology for the upper San Pedro watershed. J. Hydrol. 2011, 407, 105–114. [Google Scholar] [CrossRef]
- Zhou, F.; Xu, Y.; Chen, Y.; Xu, C.Y.; Gao, Y.; Du, J. Hydrological response to urbanization at different spatio-temporal scales simulated by coupling of CLUE-S and the SWAT model in the Yangtze River Delta region. J. Hydrol. 2013, 485, 113–125. [Google Scholar] [CrossRef]
- Pandey, R.P.; Dash, B.B.; Mishra, S.K.; Singh, R. Study of indices for drought characterization in KBK districts in Orissa (India). Hydrol. Process. 2008, 22, 1895–1907. [Google Scholar] [CrossRef]
- Mishra, A.K.; Singh, V.P. Analysis of drought severity-area-frequency curves using ageneral circulation model and scenario uncertainty. J. Geophys. Res. 2009, 114, D06120. [Google Scholar] [CrossRef]
- Roudier, P.; Mahe, G. Study of water stress and droughts with indicators using daily data on the Bani River (Niger Basin, Mali). Int. J. Climatol. 2010, 30, 1689–1705. [Google Scholar] [CrossRef]
- Stricevic, R.; Djurovic, N.; Djurovic, Z. Drought classification in Northern Serbia based on SPI and statistical pattern recognition. Meteorol. Appl. 2011, 18, 60–69. [Google Scholar] [CrossRef]
- Jain, V.K.; Pandey, R.P.; Jain, M.K.; Byun, H.R. Comparison of drought indices for appraisal of drought characteristics in the Ken River Basin. Weather Clim. Extrem. 2015, 8, 1–11. [Google Scholar] [CrossRef]
- Zhang, Q.; Zou, X.K.; Xiao, F.J.; Lü, H.Q.; Liu, H.B.; Zhu, C.H.; Zhu, S.Q. An Classification of Meteorological Drought; China Meteorological Press: Beijing, China, 2008; pp. 33–53. (In Chinese)
- Vicente-Serrano, S.M.; Beguería, S.; López-Moreno, J.I. A multiscalar drought index sensitive to global warming: The standardized precipitation evapotranspiration index. J. Clim. 2010, 23, 1696–1718. [Google Scholar] [CrossRef]
- Zhang, Q.; Xiao, M.; Singh, V.P.; Li, J. Regionalization and spatial changing properties of droughts across the Pearl River basin, China. J. Hydrol. 2012, 472, 355–366. [Google Scholar] [CrossRef]
- Bonaccorso, B.; Cancelliere, A.; Rossi, G. Probabilistic forecasting of drought class transitions in Sicily (Italy) using standardized precipitation index and North Atlantic oscillation index. J. Hydrol. 2015, 526, 136–150. [Google Scholar] [CrossRef]
- Park, J.; Lim, Y.J.; Kim, B.J.; Sung, J.H. Appraisal of drought characteristics of representative drought indices using meteorological variables. KSCE J. Civ. Eng. 2018, 22, 2002–2009. [Google Scholar] [CrossRef]
- Edwards, D.C.; Mckee, T.B. Characteristics of 20th century drought in the United States at multiple time scales. Atmos. Sci. Pap. 1997, 63, 1–30. [Google Scholar]
- Walton, K. The Arid Zone; Aldine Publishing Co.: Chicago, IL, USA, 1969. [Google Scholar]
- Stadler, S.J. Aridity indexes. In Encyclopedia of World Climatology; Oliver, J.E., Ed.; Springer: Heidelberg, Germany, 2005; pp. 89–94. [Google Scholar]
- IPCC. Climate change 2007: Impacts, adaptation and vulnerability. In Contribution of Working Group II to the Fourth Assessment, Report of the Intergovernmental Panel on Climate Change; Parry, M.L., Canziani, O.F., Palutikof, J.P., van der Linden, P.J., Hanson, C.E., Eds.; Cambridge University Press: Cambridge, UK, 2007; Available online: https://www.ipcc.ch/report/ar4/wg2/ (accessed on 6 June 2019).
- United Nations Educational, Scientific and Cultural Organization (UNESCO). Map of the World Distribution of Arid Regions: Map at Scale 1:25,000,000 with Explanatory Note; MAB Technical Notes 7; UNESCO: Paris, France, 1979. [Google Scholar]
- Penman, H. Natural evaporation from open water, bare soil and grass. Proc. R. Soc. 1948, A193, 120–145. [Google Scholar]
- De Martonne, E. Aréisme et indice artidite; Comptes Rendus de L’Acad Sci: Paris, France, 1926; Volume 182, pp. 1395–1398. [Google Scholar]
- Pedey, D.A. On indicators of droughts and wet conditions (in Russian). Proc. USSR Hydrometeorol. Centre Russian Meteorol. Hydrol. 1975, 156, 19–39. [Google Scholar]
- Neitsch, S.L.; Arnold, J.G.; Kiniry, J.R.; Srinivasan, R.; Williams, J.R. Soil and Water Assessment Tool (SWAT) User’s Manual, Version 2000, Grassland Soil and Water Research Laboratory. Blackland Research Center, Texas Agricultural Experiment Station, Texas Water Resources Institute, Texas Water Resources Institute: College Station, TX, USA, 2002. Available online: https://swat.tamu.edu/media/1294/swatuserman.pdf (accessed on 6 June 2019).
- Baker, T.J.; Miller, S.N. Using the Soil and Water Assessment Tool (SWAT) to assess land use impact on water resources in an East African watershed. J. Hydrol. 2013, 486, 100–111. [Google Scholar] [CrossRef]
- Glavan, M.; Ceglar, A.; Pintar, M. Assessing the impacts of climate change on water quantity and quality modelling in small Slovenian Mediterranean catchment – lesson for policy and decision makers. Hydrol. Process. 2015, 29, 3124–3144. [Google Scholar] [CrossRef]
- Qiu, L.; Wu, Y.; Wang, L.; Lei, X.; Liao, W.; Hui, Y.; Meng, X. Spatiotemporal response of the water cycle to land use conversions in a typical hilly-gully basin on the Loess Plateau, China. Hydrol. Earth Syst. Sci. 2017, 21, 6485–6499. [Google Scholar] [CrossRef]
- Yan, B.; Fang, N.F.; Zhang, P.C.; Shi, Z.H. Impacts of land use change on watershed streamflow and sediment yield: An assessment using hydrologic modelling and partial least squares regression. J. Hydrol. 2013, 484, 26–37. [Google Scholar] [CrossRef]
- Yu, D.; Xie, P.; Dong, X.; Su, B.; Hu, X.; Wang, K.; Xu, S. The development of land use planning scenarios based on land suitability and its influences on eco-hydrological responses in the upstream of the Huaihe River basin. Ecol. Model. 2018, 373, 53–67. [Google Scholar] [CrossRef]
- Ghane, M.; Alvankar, S.R.; Eslamian, S.; Mahboubeh, A.K.; Gandomkar, A.; Zamani, E.; Maryam, M.B.; Kazemi, M.; Soltani, M.; Dehghan, S.; et al. Sensitivity Analysis of Runoff Model by SWAT to Meteorological Parameters: A Case Study of Kasillian Watershed, Mazandaran, Iran. Int. J. Res. Stud. Agric. Sci. 2017, 3, 17–36. [Google Scholar]
- Bazrkar, M.H.; Eslamian, S. Ocean Oscillation and Drought Indices: Application. In Handbook of Drought and Water Scarcity; Vol. 1: Principles of Drought and Water Scarcity; Eslamian, S., Eslamian, F., Eds.; Francis and Taylor, CRC Press: Boca Raton, FL, USA, 2017; Chapter 8; pp. 127–136. [Google Scholar]
- Lin, Z.; Radcliffe, D.E. Automatic Calibration and Predictive Uncertainty Analysis of a Semidistributed Watershed Model. Vadose Zone J. 2006, 5, 248–260. [Google Scholar] [CrossRef]
- Nguyen, T.N.Q.; Nguyen, D.L.; Nguyen, D.N.; Nguyen, T.; Bui, T.L.; Nguyen, K.L. Zoning Drought Reply on Drought Index and Simulation Hydrological Regime in Srepok Watershed Tay Nguyen Area. VNU J. Sci. Earth Env. Sci. 2017, 33, 65–81. [Google Scholar]
- Nash, J.E.; Sutcliffe, J.V. River flow forecasting through conceptual models part I-a discussion of principles. J. Hydrol. 1970, 10, 282–290. [Google Scholar] [CrossRef]
- Andersen, J.; Refsgaard, J.C.; Jensen, K.H. Distributed hydrological modelling of the Senegal River basin–Model construction and validation. J. Hydrol. 2001, 247, 200–214. [Google Scholar] [CrossRef]
- McCuen, R.H.; Knight, Z.; Cutter, A.G. Evaluation of the Nash–Sutcliffe efficiency Index. J. Hydrol. Eng. 2006, 11, 597–602. [Google Scholar] [CrossRef]
- Gupta, H.V.; Sorooshian, S.; Yapo, P.O. Status of automatic calibration for hydrologic models: comparison with multilevel expert calibration. J. Hydrol. Eng. 1999, 4, 135–143. [Google Scholar] [CrossRef]
- Krause, P.; Boyle, D.P.; Bäse, F. Comparison of different efficiency criteria for hydrological model assessment. Adv. Geosci. 2005, 5, 89–97. [Google Scholar] [CrossRef]
- Nejadhashemi, A.P.; Wardynski, B.J.; Munoz, J.D. Evaluating the impacts of land use changes on hydrologic responses in the agricultural regions of Michigan and Wisconsin. Hydrol. Earth Syst. Sci. 2011, 8, 3421–3468. [Google Scholar] [CrossRef]
- Moriasi, D.N.; Arnold, J.G.; Van Liew, M.W.; Bingner, R.L.; Harmel, R.D.; Veith, T.L. Model evaluation guidelines for systematic quantification of accuracy in watershed simulations. Trans. ASABE 2007, 50, 885–900. [Google Scholar] [CrossRef]
- Wang, K.; Liu, X.; Tian, W.; Li, Y.; Liang, K.; Liu, C.; Li, Y.; Yang, X. Pan coefficient sensitivity to environment variables across China. J. Hydrol. 2019, 572, 582–591. [Google Scholar] [CrossRef]
- Di, C.; Wang, T.; Yang, X.; Li, S. Technical note: An improved Grassberger–Procaccia algorithm for analysis of climate system complexity. Hydrol. Earth Syst. Sci. 2018, 22, 5069–5079. [Google Scholar] [CrossRef]
© 2019 by the authors. Licensee MDPI, Basel, Switzerland. This article is an open access article distributed under the terms and conditions of the Creative Commons Attribution (CC BY) license (http://creativecommons.org/licenses/by/4.0/).