Assessment of Groundwater Recharge, Evaporation, and Runoff in the Drava Basin in Hungary with the WetSpass Model


Abstract
:1. Introduction
2. Materials and Methods
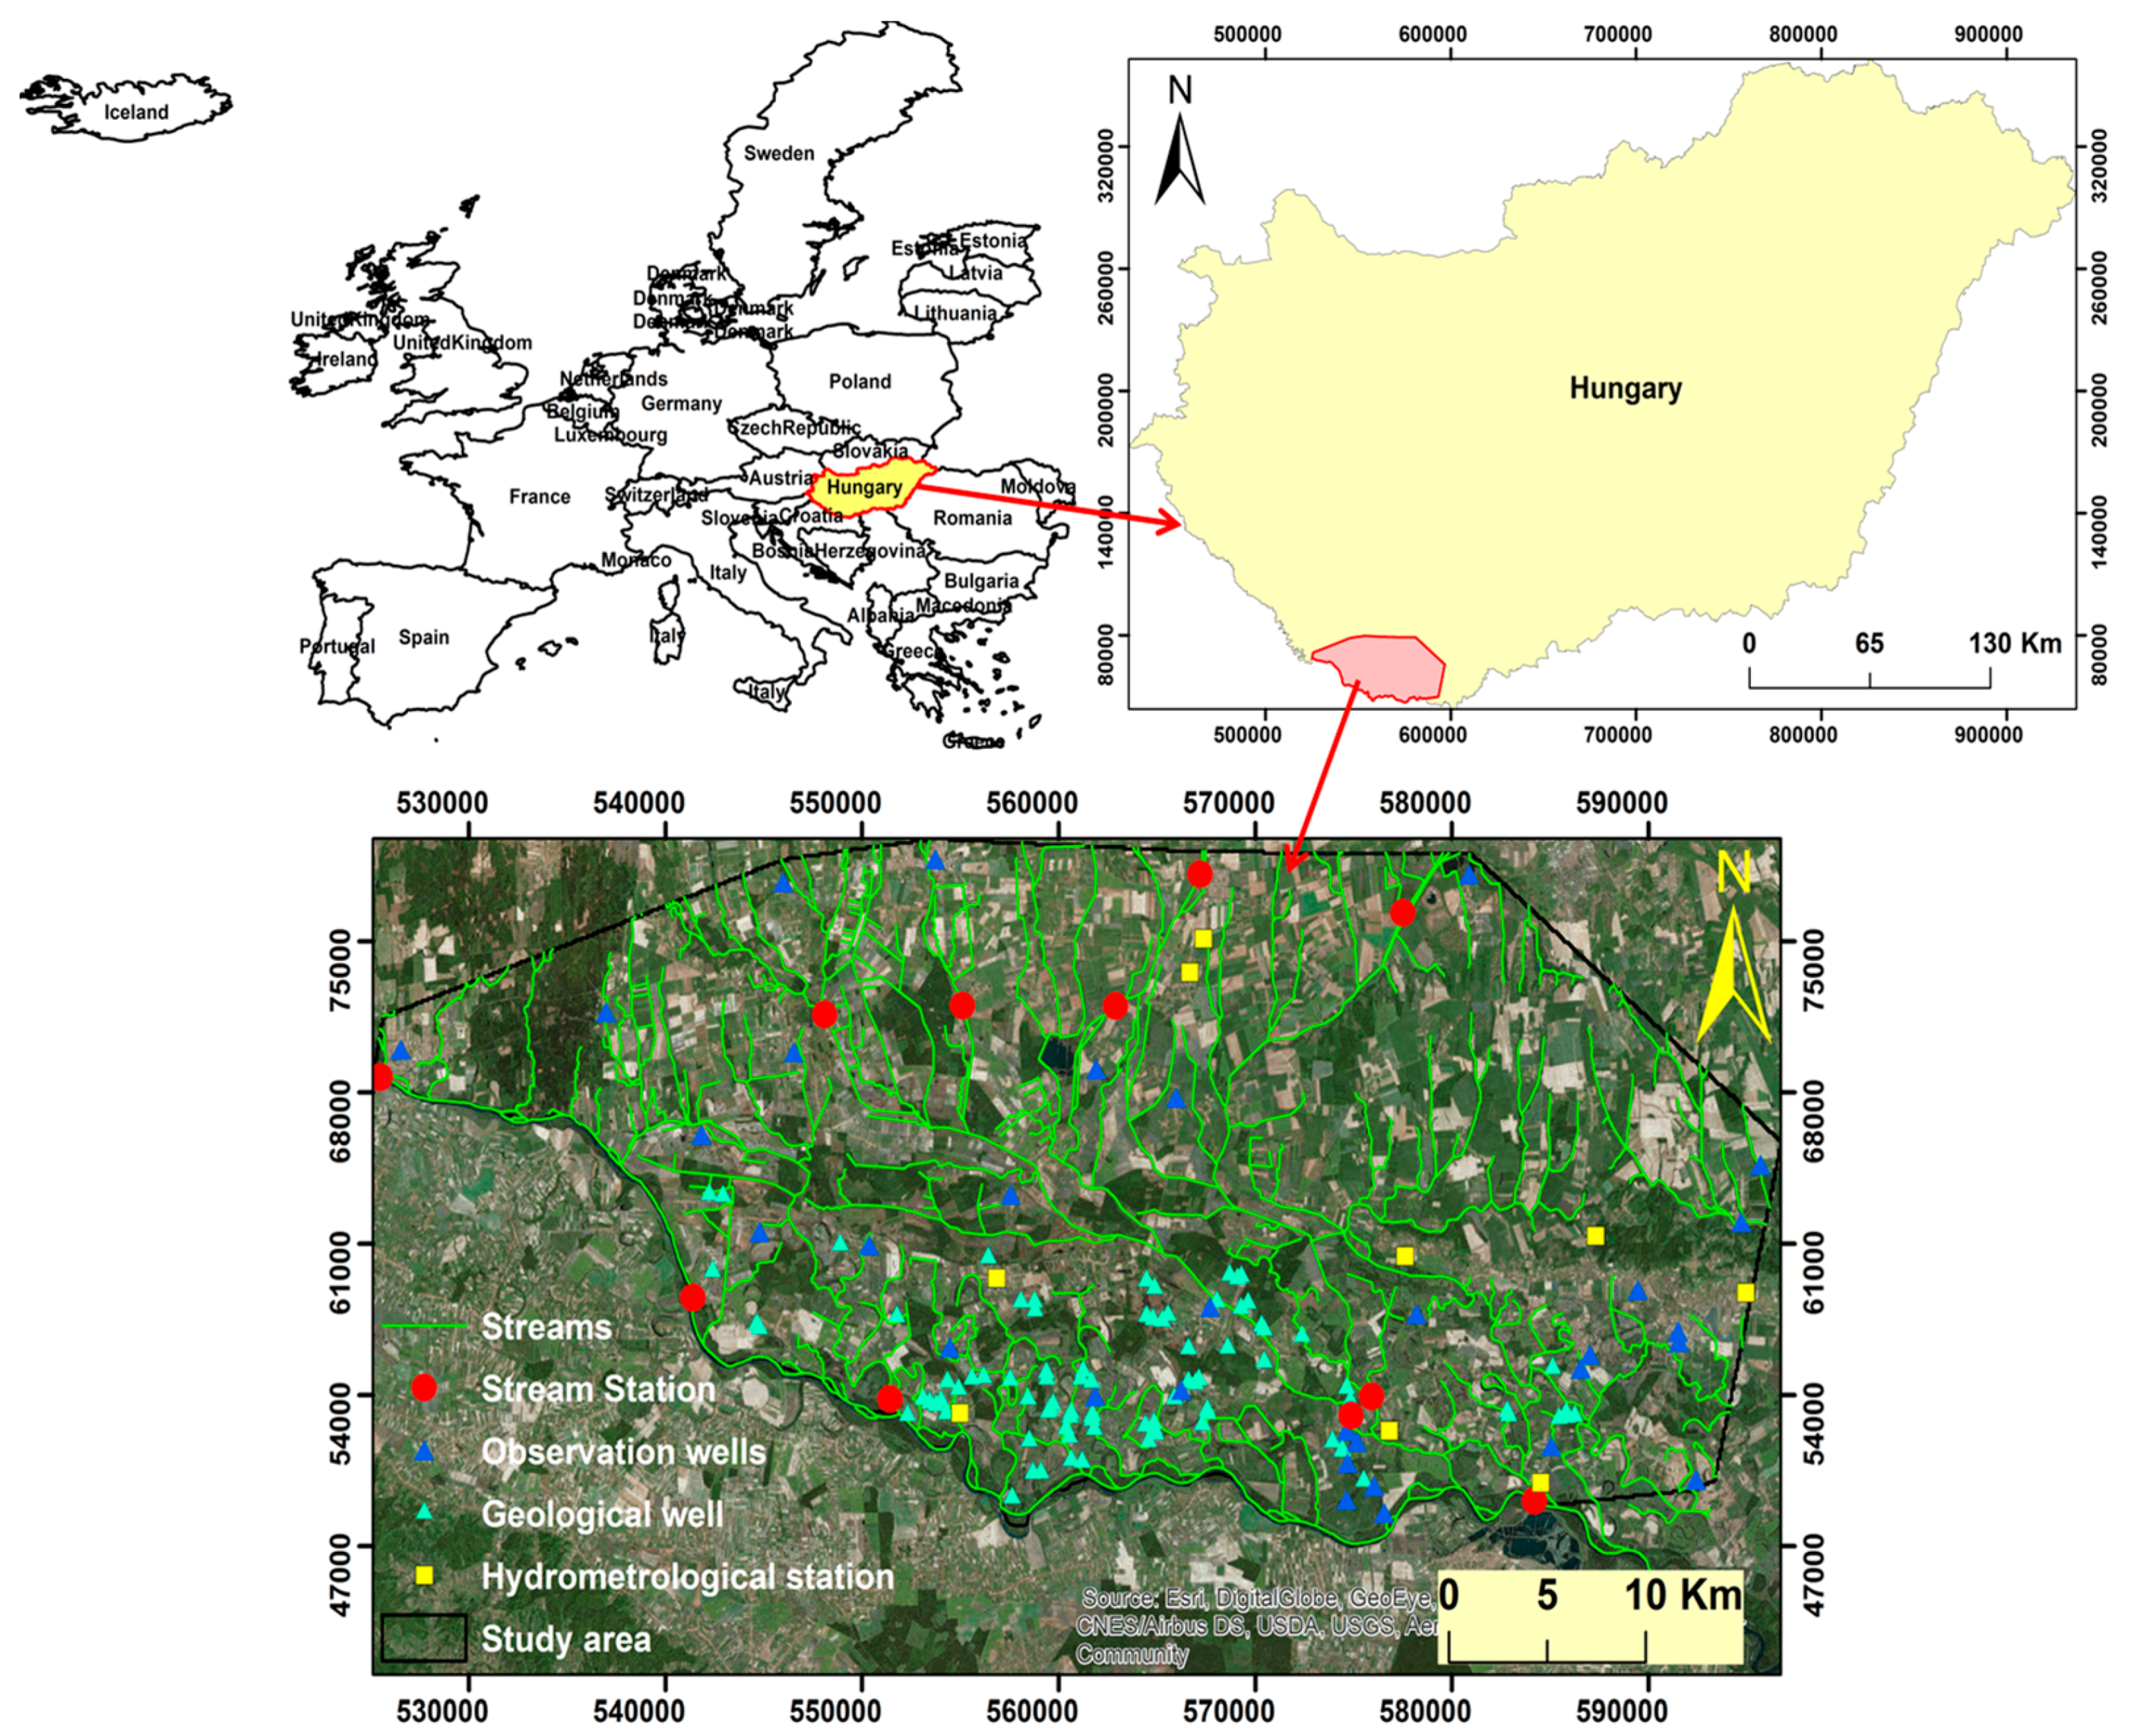
2.1. Study Area
2.2. WetSpass Model
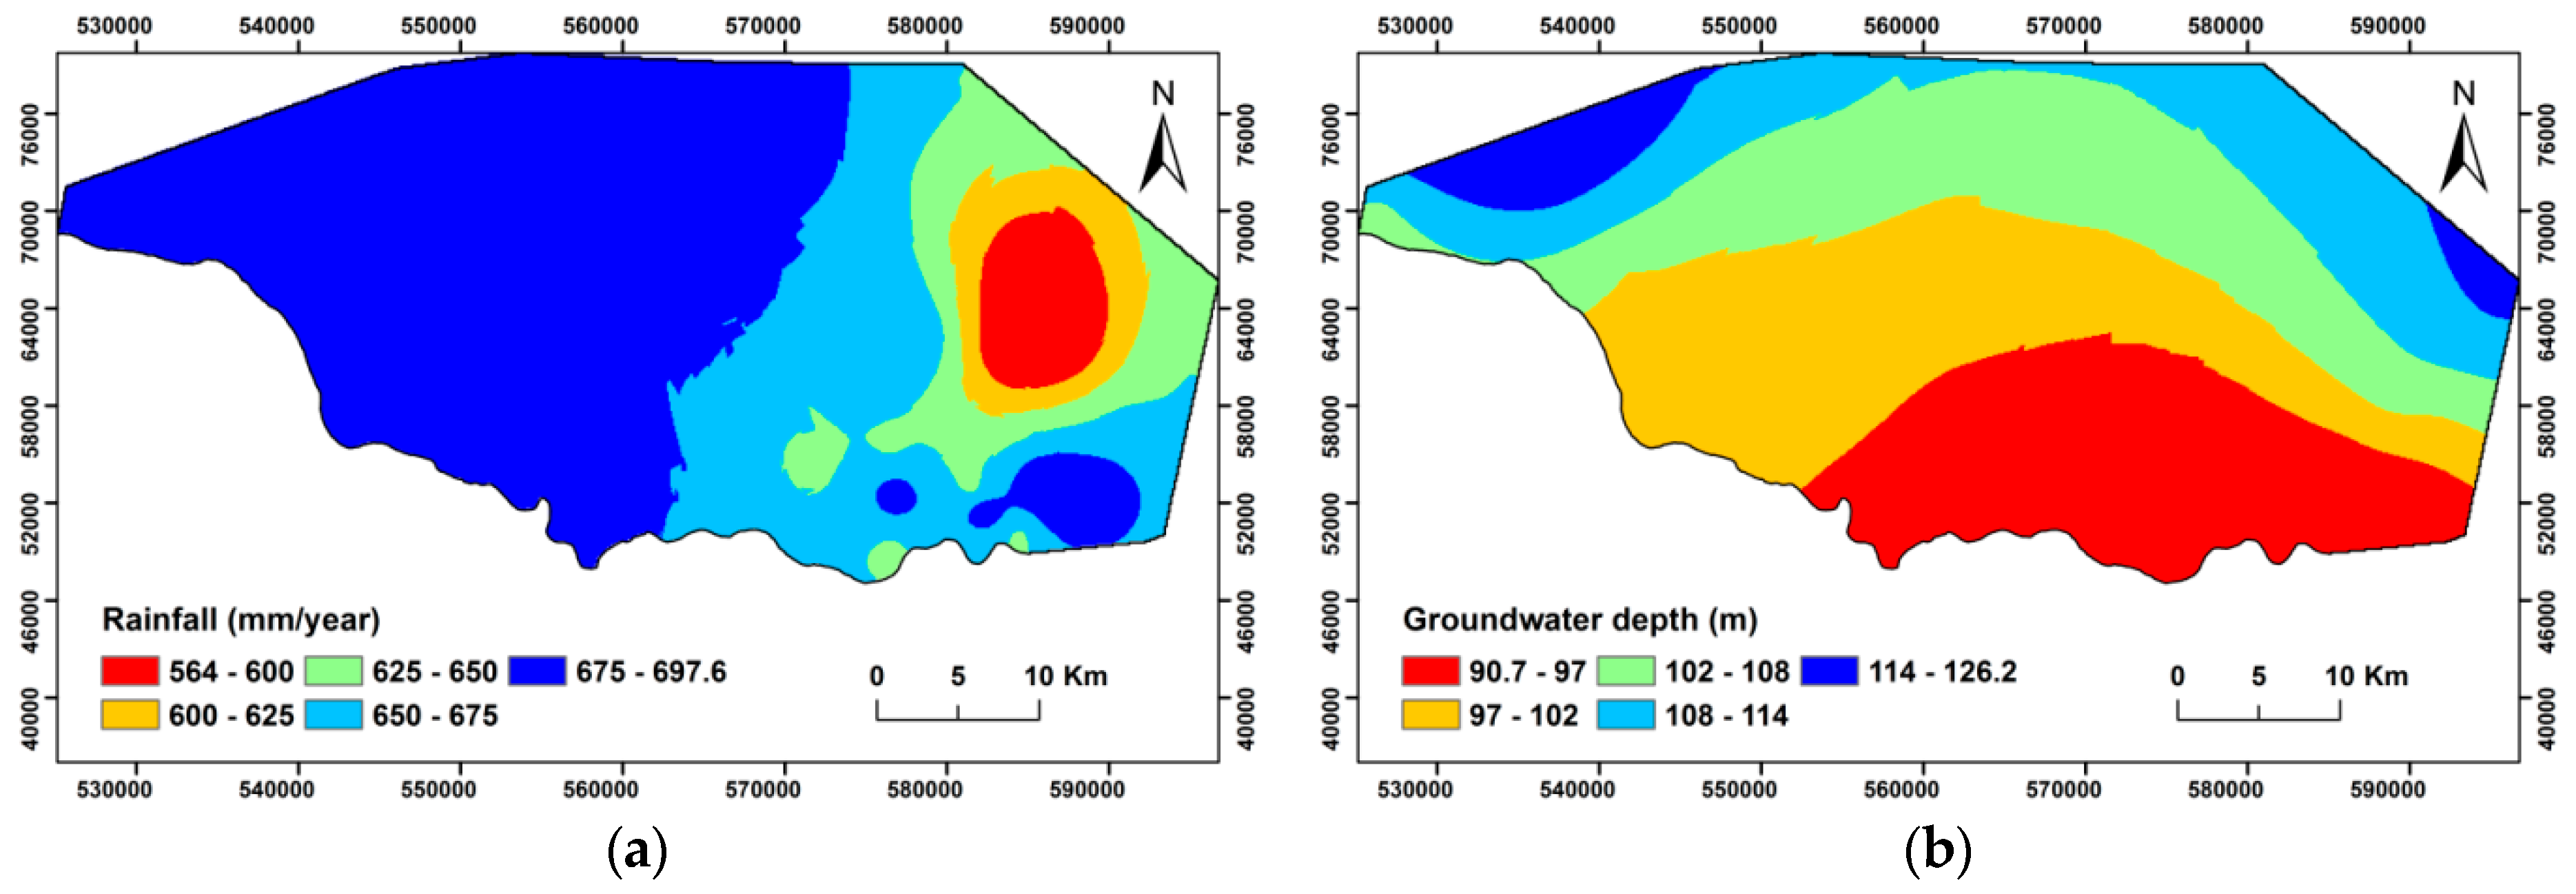
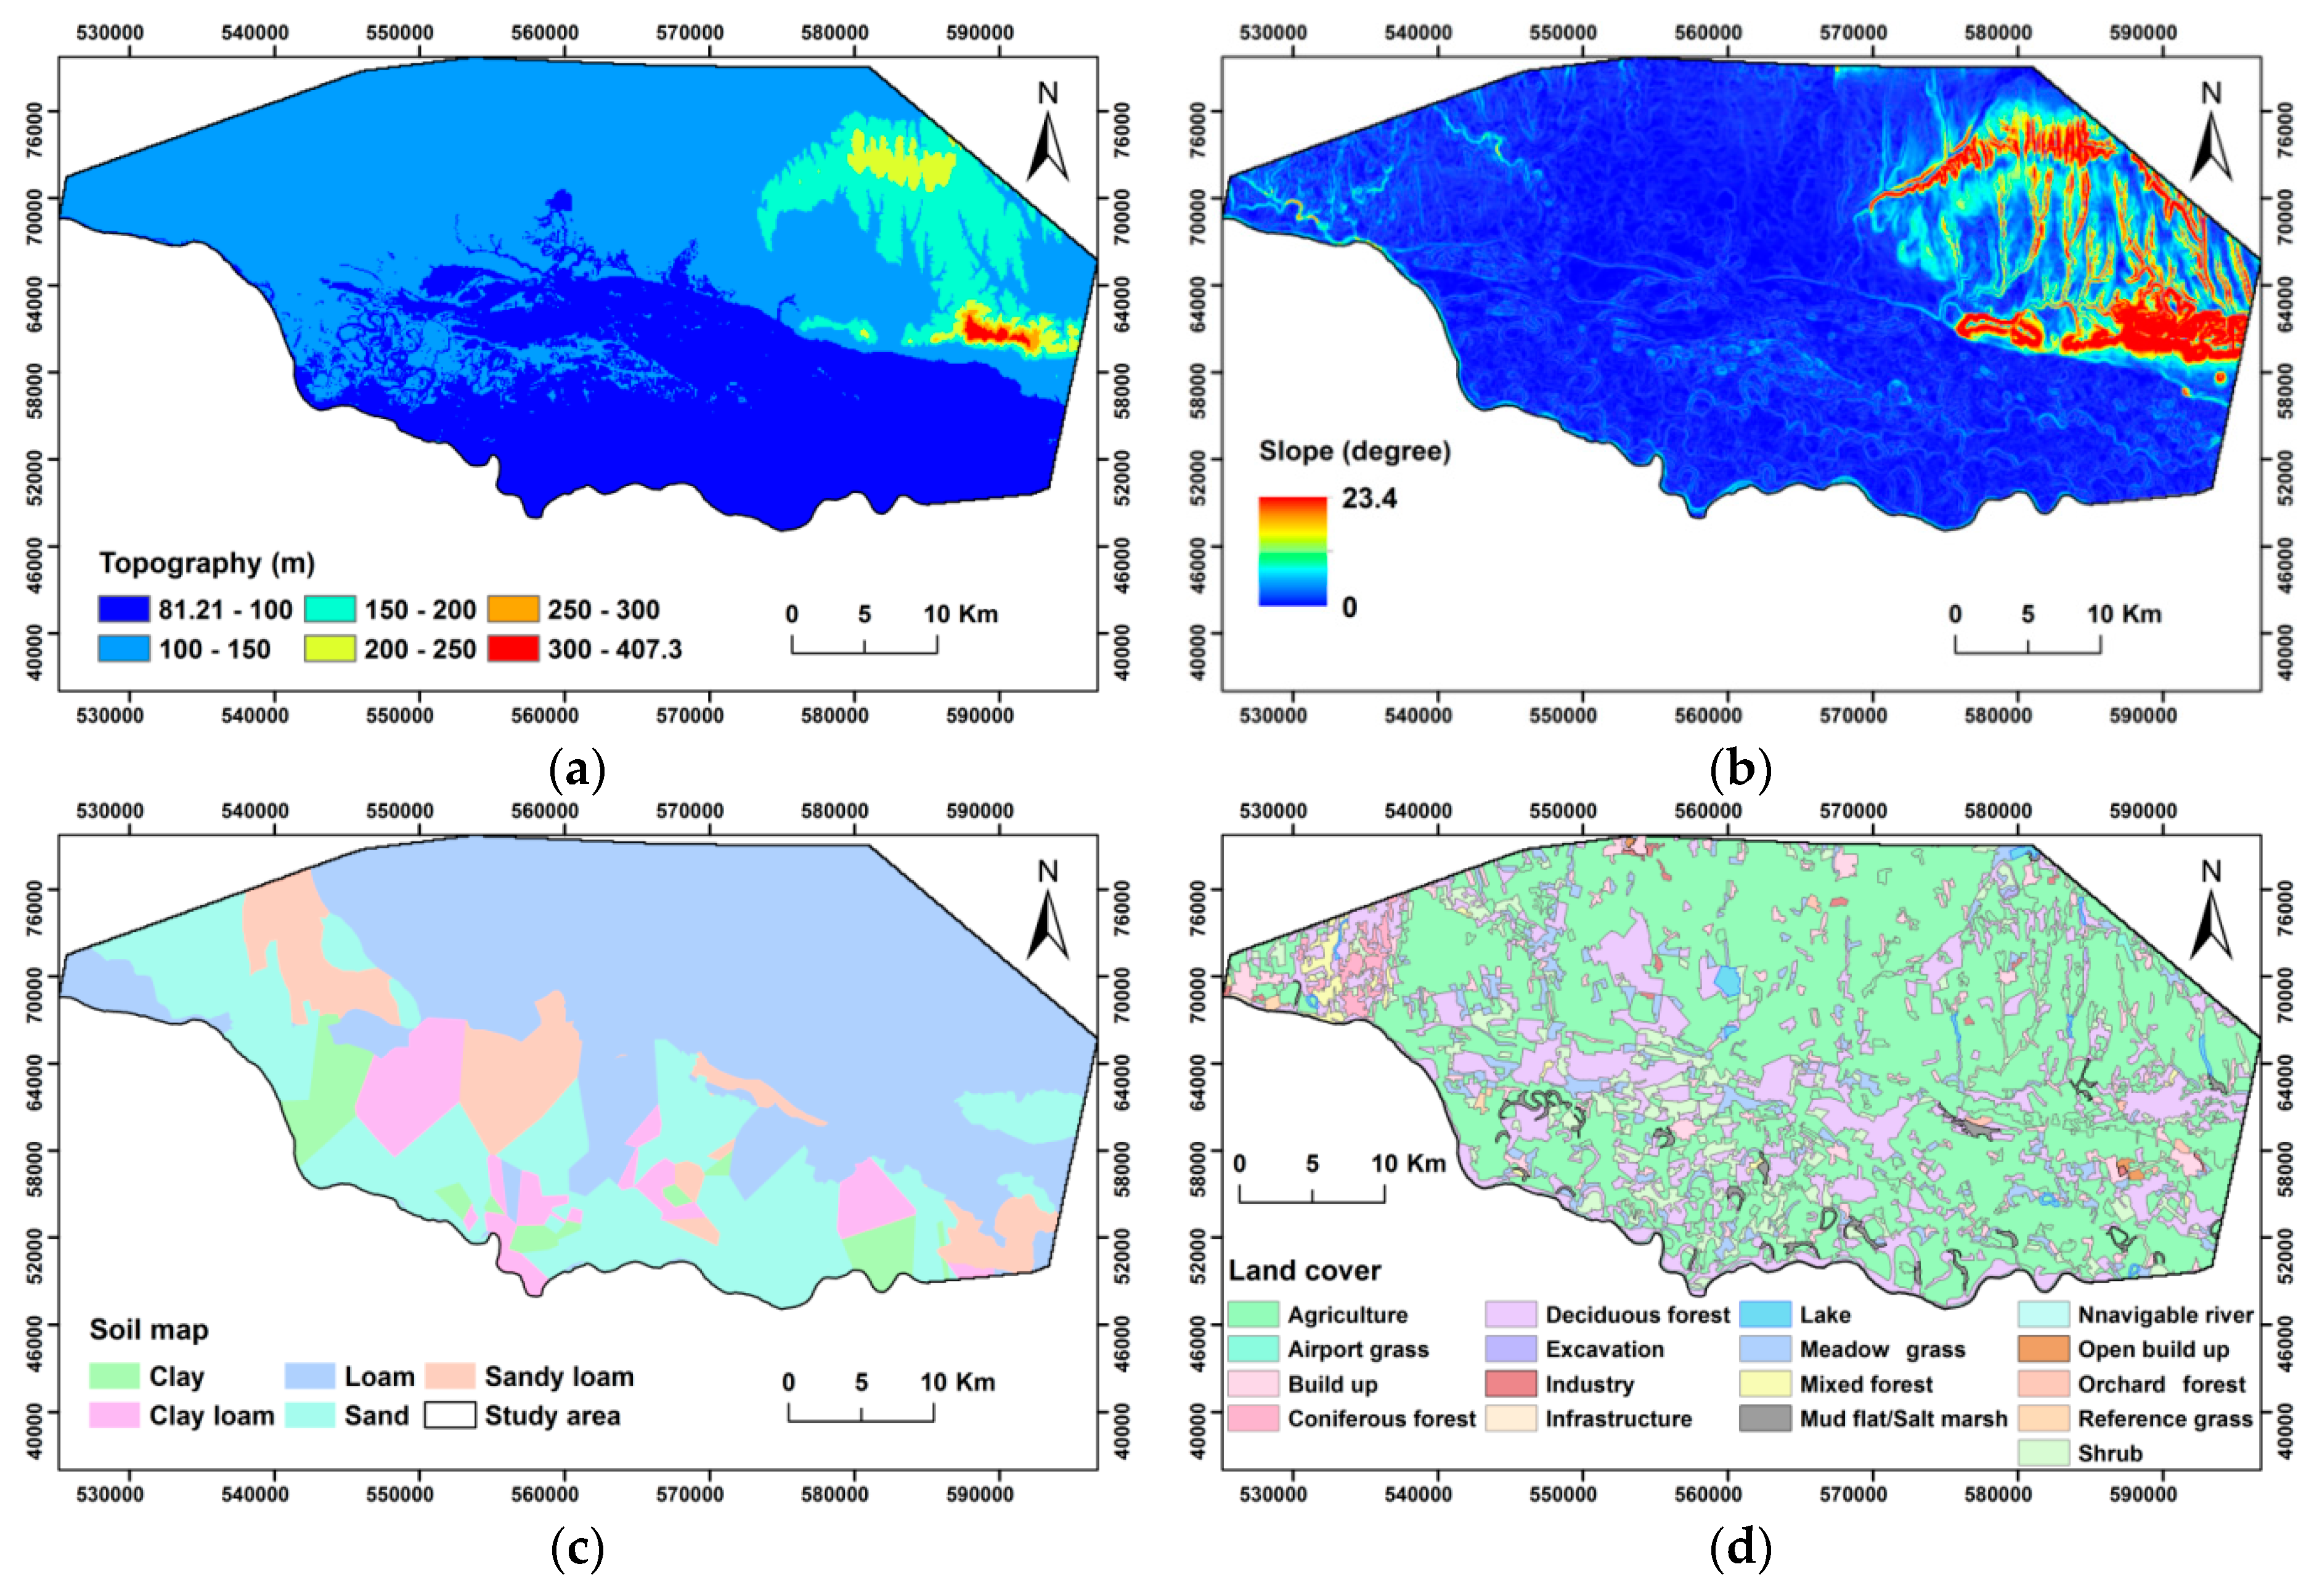
2.3. Input Data
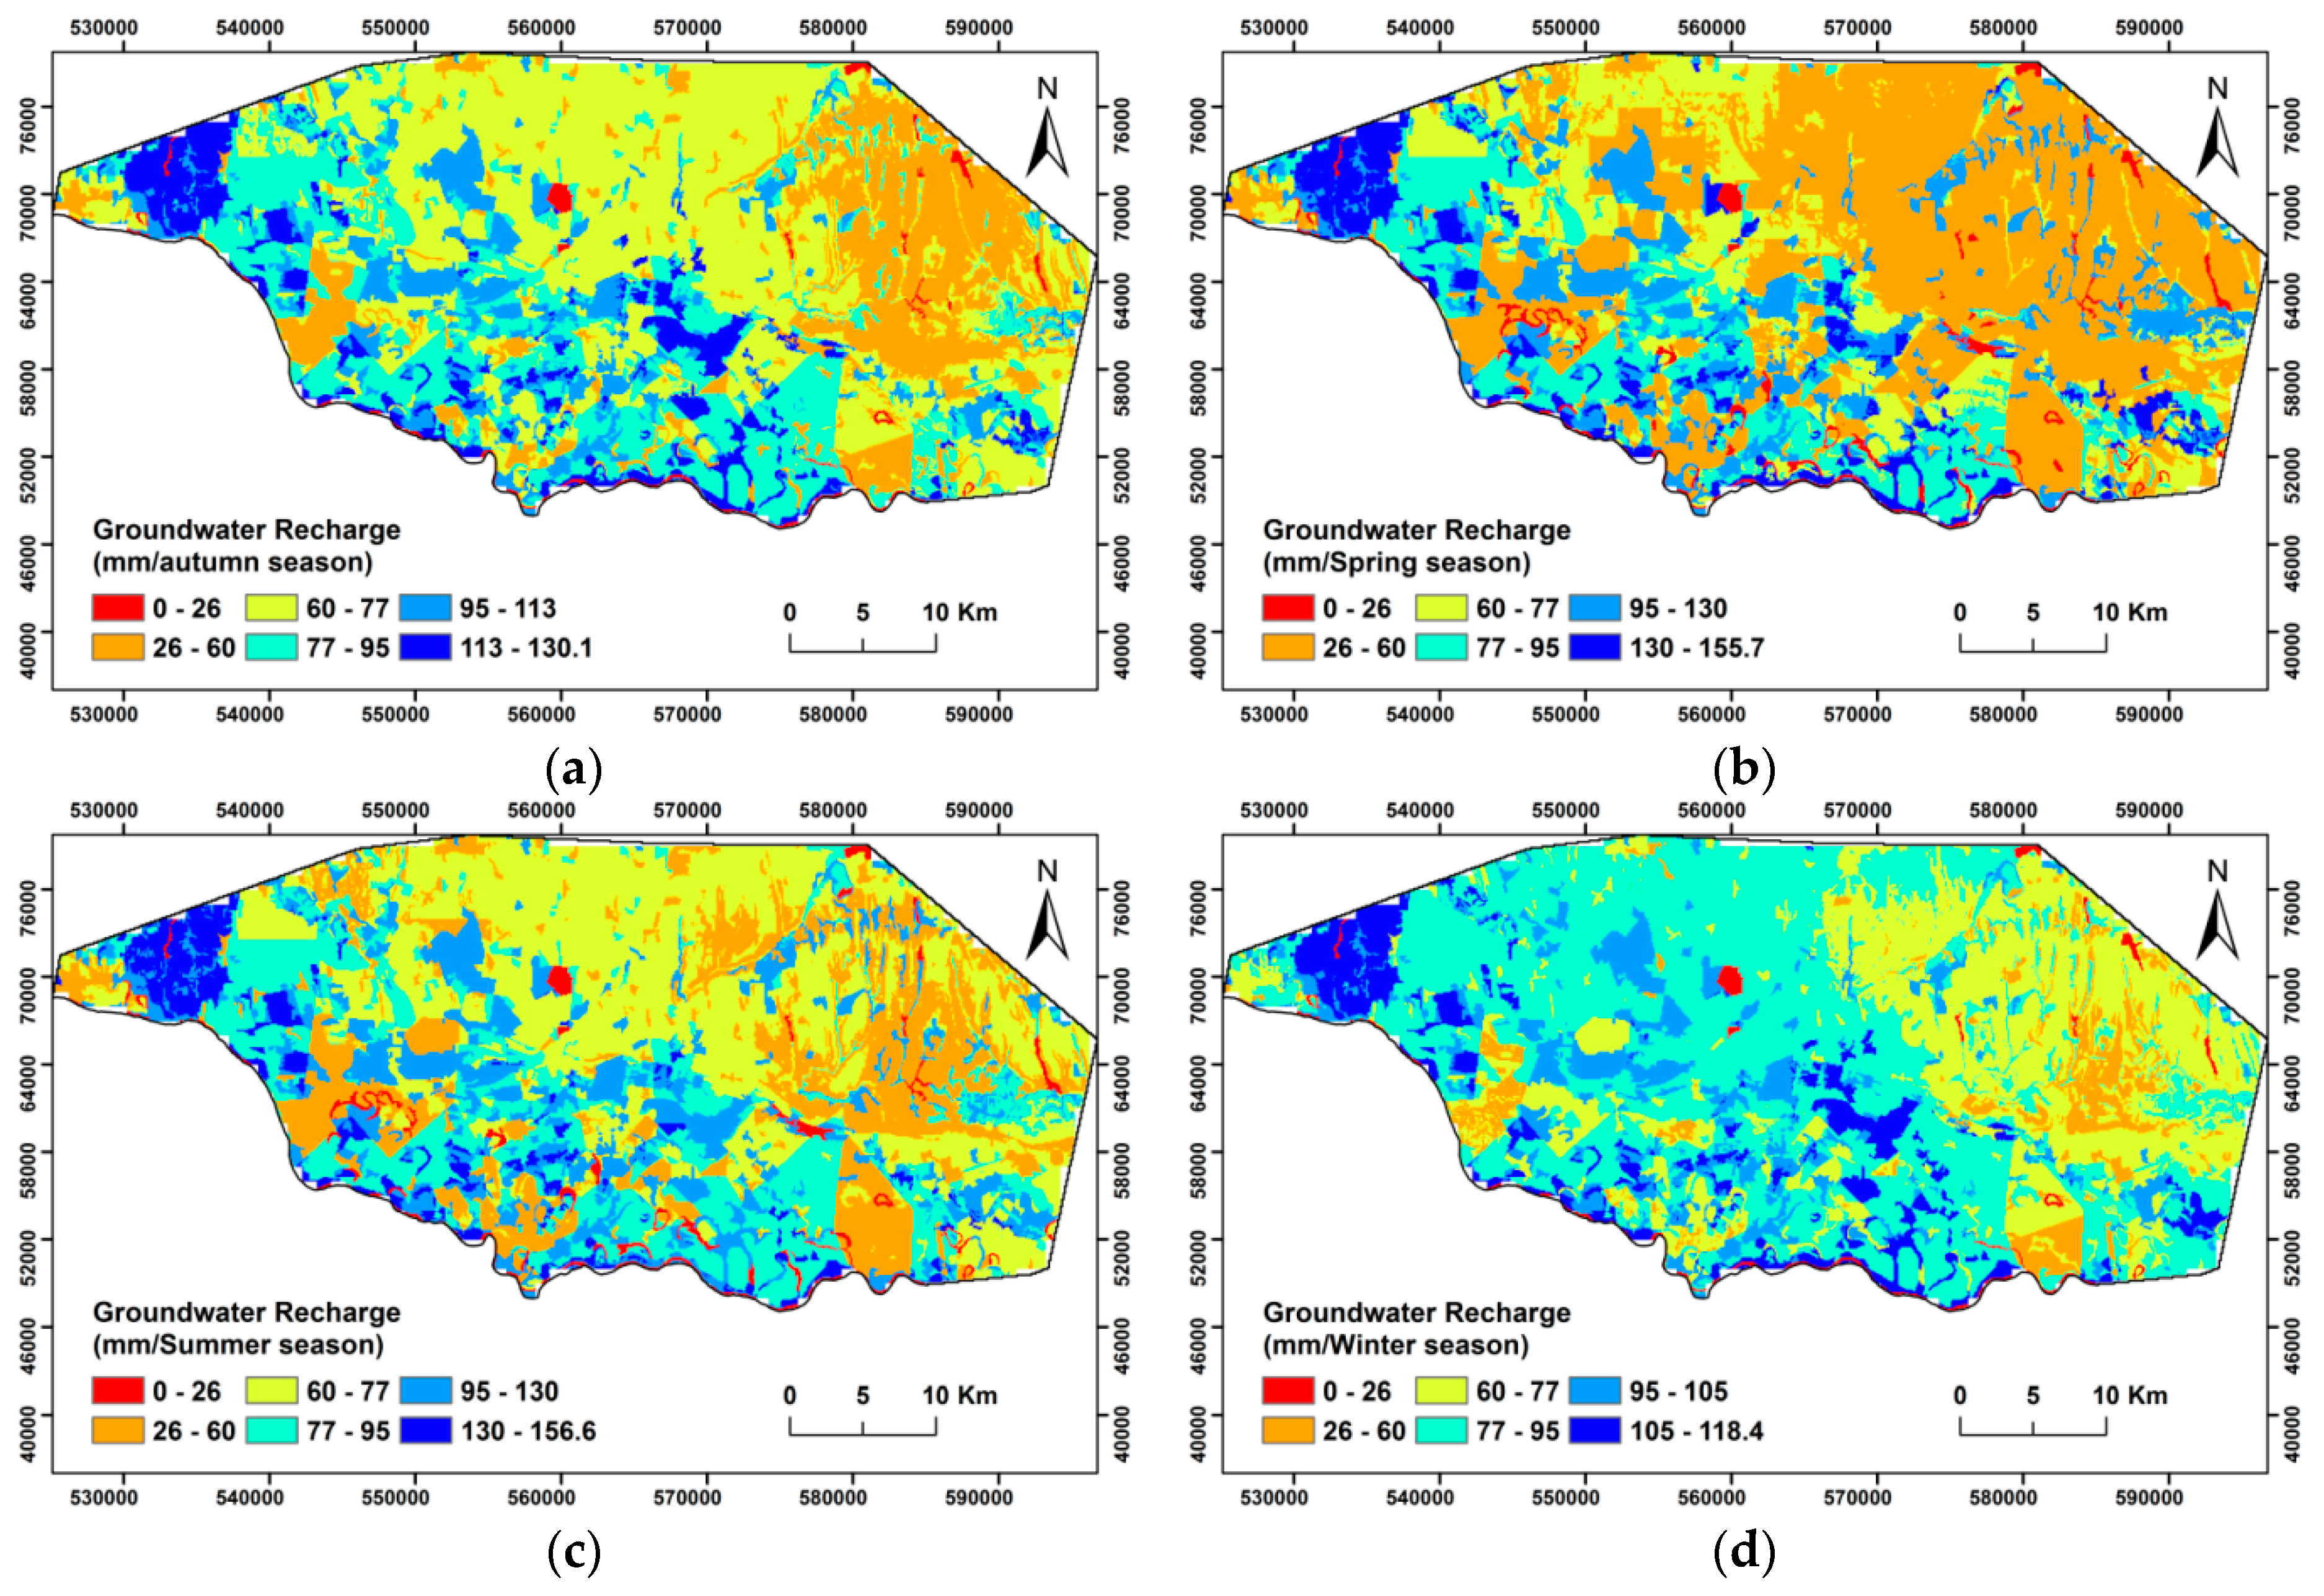
3. Results and Discussion
4. Conclusions
Author Contributions
Funding
Acknowledgments
Conflicts of Interest
Appendix A
References
- NRC (National Research Council). Water Implications of Biofuels Production in the United States; National Academies Press: Washington, DC, USA, 2008. [Google Scholar]
- Dezső, J.; Lóczy, D.; Salem, A.M.; Nagy, G. Floodplain connectivity. In The Drava River: Environmental Problems and Solutions; Lóczy, D., Ed.; Springer Science + Media: Cham, Switzerland, 2018; pp. 215–230. [Google Scholar]
- Lóczy, D.; Dezső, J.; Czigány, S.Z.; Prokos, H.; Tóth, G. An environmental assessment of water replenishment to a floodplain lake. J. Environ. 2017, 202, 337–347. [Google Scholar] [CrossRef] [PubMed]
- Burián, A.; Horváth, G.; Márk, L. Channel Incision along the lower Drava. In The Drava River: Environmental Problems and Solutions; Lóczy, D., Ed.; Springer Science + Media: Cham, Switzerland, 2019; pp. 139–157. [Google Scholar]
- Lóczy, D.; Dezső, J.; Czigány, S.; Gyenizse, P.; Pirkhoffer, E.; Halász, A. Rehabilitation potential of the Drava river floodplain in Hungary. In Water Resources and Wetlands, Conference Proceedings, Tulcea, Romania, 11–13 September 2014; Gâştescu, P., Marszelewski, W., Breţcan, P., Eds.; Transversal Publishing House: Targoviste, Romania, 2014; pp. 21–29. [Google Scholar]
- Wang, B.; Jin, M.; Nimmo, J.R.; Yang, L.; Wang, W. Estimating groundwater recharge in Hebei Plain, China under varying land use practices using tritium and bromide tracers. J. Hydrol. 2008, 356, 209–222. [Google Scholar] [CrossRef]
- Moon, S.; Woo, N.C.; Lee, K.S. Statistical analysis of hydrograph and water-table fluctuation to estimate groundwater recharge. Hydrology 2004, 292, 198–209. [Google Scholar] [CrossRef]
- Manghi, F.; Mortazavi, B.; Crother, C.; Hamdi, M.R. Estimating regional groundwater recharge using a hydrological budget method. Water Resour. Manag. 2009, 23, 2475–2489. [Google Scholar] [CrossRef]
- Martin, N. Development of a Water Balance for the Atankwidi Catchment, West Africa—A Case Study of Groundwater Recharge in a Semi-Arid Climate. Ph.D. Thesis, University of Göttingen, Göttingen, Germany, 2005. [Google Scholar]
- El-Rawy, M.; Zlotnik, V.A.; Al-Raggad, M.; Al-Maktoumi, A.; Kacimov, A.; Abdalla, O. Conjunctive use of groundwater and surface water resources with aquifer recharge by treated wastewater: Evaluation of management scenarios in the Zarqa River basin, Jordan. Environ. Earth Sci. 2016, 75, 1146. [Google Scholar] [CrossRef]
- Salem, A.; Dezső, J.; Lóczy, D.; El-Rawy, M.; Słowik, M. Modeling surface water-groundwater interaction in an oxbow of the Drava floodplain. In Proceedings of the 13th International Conference on Hydroinformatics (HIC 2018), Palermo, Italy, 1–6 July 2018; Volume 3, pp. 1832–1840. [Google Scholar] [CrossRef]
- Batelaan, O.; de Smedt, F. Wetspass: A flexible, GIS based, distributed recharge methodology for regional groundwater modelling. In Impact of Human Activity on Groundwater Dynamics; Gehrels, H., Peters, J., Leibundgut, C., Eds.; International Association of Hydrological Sciences: Wallingford, UK, 2001; pp. 11–17. [Google Scholar]
- Abdollahi, K.; Bashir, I.; Verbeiren, B.; Harouna, M.R.; Griensven, A.V.; Husmans, M.; Batelaan, O. A distributed monthly water balance model: Formulation and application on Black Volta Basin. Environ. Earth Sci. 2017, 76, 198. [Google Scholar] [CrossRef]
- Abu-Saleem, A. Estimation of Water Balance Components in the Hasa Basin with GIS Based–WetSpass Model. Master’s Thesis, Al Balqa Applied University, Salt, Jordan, 2010; p. 61. [Google Scholar]
- Abu-Saleem, A.; Al-Zubi, Y.; Rimawi, O.; Al-Zubi, J.; Alouran, N. Estimation of water balance components in the Hasa basin with GIS based WetSpass model. J. Agron. 2010, 9, 119–125. [Google Scholar] [CrossRef]
- Al Kuisi, M.; El-Naqa, A. GIS based spatial groundwater recharge estimation in the Jafr basin, Jordan–Application of WetSpass models for arid regions. Revista Mexicana de Ciencias Geológicas 2013, 30, 96–109. [Google Scholar]
- Gebremeskel, G.; Kebede, A. Spatial estimation of long-term seasonal and annual groundwater resources: Application of WetSpass model in the Werii watershed of the Tekeze River Basin, Ethiopia. Phys. Geogr. 2017, 38, 338–359. [Google Scholar] [CrossRef]
- Gebreyohannes, T.; Smedt, F.; Walraevens, K.; Gebresilassie, S. Application of a spatially distributed water balance model for assessing surface water and groundwater resources in the Geba basin, Tigray, Ethiopia. J. Hydrol. 2013, 499, 110–123. [Google Scholar] [CrossRef]
- Arefaine, T.; Nedaw, D.; Gebreyohannes, T. Groundwater Recharge, Evapotranspiration and Surface Runoff Estimation Using WetSpass Modeling Method in Illala Catchment, Northern Ethiopia. Momona Ethiop. J. Sci. 2012, 4, 96–110. [Google Scholar]
- Zarei, M.; Ghazavi, R.; Vali, A.; Abdollahi, K. Estimating Groundwater Recharge, Evapotranspiration and Surface Runoff using Land-use data: A Case Study in Northeast Iran. Biol. Forum Int. J. 2016, 8, 196–202. [Google Scholar]
- Ghouili, N.; Horriche, F.J.; Zammouri, M.; Benabdallah, S.; Farhat, B. Coupling WetSpass and MODFLOW for groundwater recharge assessment: Case study of the Takelsa multilayer aquifer, northeastern Tunisia. Geosci. J. 2017, 21, 791–805. [Google Scholar] [CrossRef]
- Aish, A.M. Estimation of water balance components in the Gaza Strip with GIS based WetSpass model. Civ. Environ. Res. 2014, 6, 77–84. [Google Scholar]
- Armanuos, A.M.; Negm, A.; Yoshimura, C.; Saavedra Valeriano, O.C. Application of WetSpass model to estimate groundwater recharge variability in the Nile Delta aquifer. Arab. J Geosci. 2016, 9, 553. [Google Scholar] [CrossRef]
- Pálfai, I. Magyarország holtágai (Oxbows in Hungary); Hungarian Ministry of Transport and Water Management: Budapest, Hungary, 2001; 231p. (In Hungarian) [Google Scholar]
- Dezső, J.; Salem, A.; Lóczy, D.; Marcin, S.; Dávid, P. Randomly layered fluvial sediments influenced groundwater-surface water interaction. In Proceedings of the 17th International Multidisciplinary Scientific GeoConference SGEM 2017, SGEM2017 Vienna GREEN Conference Proceedings, Vienna, Austria, 27–29 November 2017; Volume 17, pp. 331–338, ISBN 978-619-7408-27-0. [Google Scholar] [CrossRef]
- Batelaan, O.; De Smedt, F. GIS-based recharge estimation by coupling surface-subsurface water balances. J. Hydrol. 2007, 337, 337–355. [Google Scholar] [CrossRef]
- Ampe, E.M.; Vanhamel, I.; Salvadore, E.; Dams, J.; Bashir, I.; Demarchi, L.; Batelaan, O. Impact of urban land-cover classification on groundwater recharge uncertainty. IEEE J. Sel. Top. Appl. Earth Obs. Remote Sens. 2012, 5, 1859–1867. [Google Scholar] [CrossRef]
- MTA ATK TAKI. 2013. Available online: http://mta-taki.hu/osztalyok/gis-labor/agrotopo (accessed on 25 June 2018).
- Thornthwaite, C.W. An approach toward a rational classification of climate. Geogr. Rev. 1948, 38, 55–94. [Google Scholar] [CrossRef]
- Subramanya, K. Engineering Hydrology, 3rd ed.; Tata McGraw-Hill: New Delhi, India, 2008; 434p, ISBN 978-0-07-015146-8. [Google Scholar]
- Pistocchi, A. Leaf Area Index (MAPPE Model). European Commission, Joint Research Centre (JRC) [Dataset] PID. 2015. Available online: http://data.europa.eu/89h/jrc-mappe-europe-setup-d-18-lai (accessed on 5 July 2018).
- Batelaan, O.; De Smedt, F.; Triest, L. Regional groundwater discharge: Phreatophyte mapping, groundwater modelling and impact analysis of land-use change. J. Hydrol. 2003, 275, 86–108. [Google Scholar] [CrossRef]
- Alley, W.; Healy, R.; LaBaugh, J.; Reilly, T. Flow and storage in groundwater systems. Science 2002, 296, 1985–1990. [Google Scholar] [CrossRef] [PubMed]
- Healy, R.; Scanlon, B. Groundwater recharge. In Estimating Groundwater Recharge; Cambridge University Press: Cambridge, UK, 2010; pp. 1–14. [Google Scholar] [CrossRef]
- Batelaan, O.; Woldeamlak, S.T. Arcview Interface for WetSpass; Version 13-06-2007; Vrije University Brussels: Brussels, Belgium, 2007. [Google Scholar]


| Period | Value | Precipitation (mm) | Recharge (mm) | Evapotranspiration (mm) | Runoff (mm) |
|---|---|---|---|---|---|
| Monthly | Range | 0–229 | 0–58 | 0–67 | 0–114 |
| Average | 58 | 25 | 16 | 17 | |
| Std. dev. | 28 | 10 | 14 | 13 | |
| Annual | Range | 398–1072 | 175–412 | 127–263 | 77–418 |
| Average | 696 | 307 | 190 | 199 | |
| Std. dev. | 161 | 55 | 39 | 81 | |
| Winter | Range | 44–202 | 30–121 | 6–16 | 9–71 |
| Average | 129 | 81 | 11 | 37 | |
| Std. dev. | 47 | 28 | 3 | 18 | |
| Spring | Range | 93–414 | 48–102 | 41–138 | 10–187 |
| Average | 215 | 72 | 83 | 59 | |
| Std. dev. | 67 | 14 | 23 | 39 | |
| Summer | Range | 94–334 | 50–104 | 40–152 | 9–123 |
| Average | 200 | 76 | 76 | 46 | |
| Std. dev. | 62 | 14 | 24 | 32 | |
| Autumn | Range | 82–228 | 49–110 | 13–31 | 22–96 |
| Average | 153 | 77 | 21 | 57 | |
| Std. dev. | 38 | 17 | 4 | 23 |
© 2019 by the authors. Licensee MDPI, Basel, Switzerland. This article is an open access article distributed under the terms and conditions of the Creative Commons Attribution (CC BY) license (http://creativecommons.org/licenses/by/4.0/).
Share and Cite
Salem, A.; Dezső, J.; El-Rawy, M. Assessment of Groundwater Recharge, Evaporation, and Runoff in the Drava Basin in Hungary with the WetSpass Model. Hydrology 2019, 6, 23. https://doi.org/10.3390/hydrology6010023
Salem A, Dezső J, El-Rawy M. Assessment of Groundwater Recharge, Evaporation, and Runoff in the Drava Basin in Hungary with the WetSpass Model. Hydrology. 2019; 6(1):23. https://doi.org/10.3390/hydrology6010023
Chicago/Turabian StyleSalem, Ali, József Dezső, and Mustafa El-Rawy. 2019. "Assessment of Groundwater Recharge, Evaporation, and Runoff in the Drava Basin in Hungary with the WetSpass Model" Hydrology 6, no. 1: 23. https://doi.org/10.3390/hydrology6010023
APA StyleSalem, A., Dezső, J., & El-Rawy, M. (2019). Assessment of Groundwater Recharge, Evaporation, and Runoff in the Drava Basin in Hungary with the WetSpass Model. Hydrology, 6(1), 23. https://doi.org/10.3390/hydrology6010023