Article

Reconstruction of Water Infiltration Rate Reducibility in Response to Suspended Solid Characteristics Using Singular Spectrum Analysis: An Application to the Caspian Sea Coast of Nur, Iran

by
Majid Taie Semiromi
1,* and
Davood Ghasemian
2
1
Department of Geohydraulics and Engineering Hydrology, University of Kassel, Kurt- Wolters St. 3, 34109 Kassel, Germany
2
Department of Hydrology and Atmospheric Sciences, University of Arizona, John W. Harshbarger Bldg.1133 E. James E Rogers Way, Tucson, AZ 85721, USA
*
Author to whom correspondence should be addressed.
Hydrology 2018, 5(4), 59; https://doi.org/10.3390/hydrology5040059
Submission received: 16 September 2018 / Revised: 15 October 2018 / Accepted: 15 October 2018 / Published: 19 October 2018

Abstract

:
Drawing a distinction between the suspended solid size and concentration impacts on physical clogging process in the Managed Aquifer Recharge (MAR) systems has been fraught with difficulties. Therefore, the current study was then aimed to statistically investigate and differentiate the impacts of clay-, silt- and sand-sized suspended solids at three concentration levels including 2, 5 and 10 g/L, compared with the clean water (0 g/L), on infiltration rate reducibility. The treatments were compared by virtue of Cohen’s d effect size measure. Furthermore, the competency of Singular Spectrum Analysis (SSA) was evaluated in reconstruction of infiltration rate. Results showed that clay-sized suspended solids were found to be the most important determining factor in physical clogging occurrence. The effect size measure highlighted that a lower concentration level of clay-sized suspended solids, that is, 2 g/L could be more important in trigging the physical clogging than a higher concentration level of silt-sized suspended solids namely 5 g/L. Also, we recognized that concentration level of clay-sized suspended sediments could non-linearly decrease the infiltrability. Also, findings revealed that SSA represented a high level of competency in reconstruction of the infiltration rate under all treatments. Hence, SSA can be quite beneficial to MAR systems for forecasting applications.

1. Introduction

Owing to ongoing climate change impacts and water scarcity, authorities must come up with solutions to adapt to and mitigate the threats anticipated due to water insecurity and increasing water demand stemmed mainly from population growth and rising standards of living [1]. Managed Aquifer Recharge (MAR), as the most economical approach to afford a new source of water for towns and small communities [2], is a scheme falling into the category of water resources management measures to artificially replenish aquifer storages, particularly those are depleting owing to over-utilization [3]. That means once groundwater is relentlessly over-drafted, the volume extracted from the aquifer cannot be recovered by the natural recharge including the diffuse and localized recharge. Consequently, the groundwater head falls sharply and even under non-pumping conditions returning to the initial heads would become a formidable challenge [4]. Therefore, there is an urgent need to compensate for the balance lost due to the groundwater over-exploitation. In this respect, MAR has been gaining popularity as a solid system to replenish the groundwater storage [5]. However, securing its operability over the time is accounted for a major challenge by virtue of clogging (plugging) occurrence [6,7].
The major issue in the systems of groundwater MAR systems is clogging (of infiltration basin bottoms, banks of trenches and vadose zone wells and well-aquifer interfaces in injection wells) which triggers decreasing in infiltration rates. Clogging stems from physical, biological and chemical processes [8,9]. Physical clogging is resulted from accumulation of inorganic and organic suspended solids available in the water entering into MAR systems. From a sediment texture point of view, the suspended solids causing physical clogging consisting of silt particles, algae cells, microorganism cells and fragments and sludge flocs in sewage effluent. Another prevailing physical process leading to clogging is the movement of fine sediments including clay particles towards the unsaturated zone and settlement of these fine solids in some depths where the total porosity is noticeable [10]. The settlement of such solid particles can take place in different depths depending on the particle sizes which differ from a few millimetres to a few centimetres or more [11]. Moreover, the accumulation of fine solids over the bottom of the infiltration basins may cause crusts which then restrains the infiltration rate. Biological clogging processes occur on account of (1) agglomeration of algae and bacterial flocs on the walls and bottom of the MAR systems (e.g., infiltration basins) [12]; and (2) developing biofilms and biomass over the recharge zone due to growth of micro-organisms that occupy some fraction of porous medium [6]. Following study undertaken by Dillon, et al. [13], the biological clogging is found to be the determining factor for a long-term impediment to effectively function MAR systems. It is worth mentioning that pre-treatment undergone to the recharging water—using designing a sedimentation basin in the inlet of a MAR system—can greatly enhance the operation of a MAR system by causing delay in physical clogging process; while this does not hold for the biological clogging. As a complex process, to decelerate whose progress, the recharging water must be also biologically stable and nutrients, including nitrogen and phosphorous, should be removed [14,15]. Chemical processes yielding clogging are mainly attributed to precipitation of calcium carbonate, gypsum, phosphate and other chemicals on and in the soil. Sometimes, these precipitations are resulted from rising in pH produced by algae as they remove dissolved carbon dioxide (CO2) from the water for photosynthesis [3]. Bacteria also are able to generate some gases such as nitrogen and methane that can plug pores and aggregate below clogging layers to create vapour barriers to infiltration [6].
Since coastal aquifers serve as major sources for freshwater supply in many countries around the world, especially in arid and semi-arid zones such as Iran, sea water intrusion has threatened supplying fresh groundwater in these regions [16,17,18]. To impede sea water intrusion, establishing MAR systems would be an asset, however, the clogging process can effectively reduce durability and functionality of such systems [19]. In this regard, physical clogging evolving as a result of entering suspended solids into infiltration basins and injection wells is a determining factor to abate soil permeability/infiltrability owing to the progressive filling of the soil pores by the finest particles [20]. Therefore, assessing and quantifying the influence of the suspended solid, entering into infiltration basins and/or MAR systems, on infiltration rate variability is of paramount importance in order to set up effective sedimentation basins in inlet of the MAR systems to trap some parts of the suspended solids. To address this issue, although several studies have taken physical clogging process into account, they either analyse the influence of suspended solid size or concentration on infiltration and recharge rate [3,5,10,11,21]. Nevertheless, differentiating the effects of suspended solid sizes including clay, silt and sand from those of concentration levels have remained unresolved. Hence, the present study has attempted to statistically distinguish their adverse effects on the physical clogging process and the ensuing consequences on infiltration/recharge rate reducibility.
Furthermore, due to non-linearity and complexity of infiltration rate in response to particle size and suspended solid concentration, reconstruction and prediction of such a phenomenon can be beneficial to better manage the MAR systems by setting up appropriate periods when the basin must be kept dry and even remove the surface clogged layer to recover the system for future storm/flood events carrying a lot of suspended solids [15]. In the present study, a data-driven model so called Singular Spectrum Analysis (SSA), whose application is not based upon any underlying assumption about the time series of interest (e.g., infiltration rate), decomposes a time series into several compartments including trends, oscillatory and noise components [22,23,24,25]. Indeed, SSA elicits information from short and noisy time series without prior knowledge of the dynamics controlling the time series [26,27]. SSA is derived by singular value decomposition (SVD) of a certain matrix created using the time series. The SSA approach is dependent on neither a parametric model nor stationarity-type conditions which are accounted for assumption of many multi-variate statistical methods. Hence, this leads to a very wide range of usages [28]. Although SSA has been used for some applications such as imputation of missing values in short- and long-term sediment concentration [27,29], streamflow data gap filling [30,31], prediction of daily maximum tropospheric ozone concentrations [32] and wind speed prediction [33], to our best knowledge, this approach has not been used to reconstruct infiltration rate under different suspended solid sizes and concentrations as of yet. The competency of this model was evaluated against the observed infiltration rate measured using double-rings infiltrometers. To assess the skill of this model in reconstructing the infiltration rate variability in response to the predetermined treatments, two well-known and most widely used statistical metrics including coefficient of determination (R2) and Nash-Sutcliffe efficiency (NS) were used.
Thus, the objects of the current study are: (1) characterizing and quantifying the effects of solid particle size (clay, silt and sand suspended solids) in tandem with whose concentration (2, 5, 10 mg/L) on different properties of the infiltration variability measured using double-rings infiltrometers in a coastal site belonging to Caspian Sea in the north of Iran (2) assessing the skill of a data-driven model so called Singular Spectrum Analysis (SSA) to decompose the measured infiltration rate under a wide range of predefined treatments and then reconstruct them without any additional physically-based information or a certain assumption. With regard to this model, the reconstruction of a time series is quite different from a classic modelling approach where some partition of the observed date/time series is used for the calibration/training and the reminder for the validation.
The application area is located in the Nur coastal part of the Caspian Sea where, due to groundwater over-utilization, the coastal aquifer has become highly vulnerable to sea water intrusion [34]. To counteract the impacts of the ongoing sea water intrusion, setting up MAR systems in terms of infiltration basins have been proposed by water authorities.
Despite the fact that the precipitation and climatological and physiographical factors are suitable to provide a rich vegetation cover against soil erosion production and accordingly suspended sediment yield in this region, due to considerable anthropogenic activities including land use/land cover change and particularly vast deforestation as well as heavy storm events occurring as a consequence of ongoing climate change, suspended sediment concentration (SSC) has been being risen in the rivers/tributaries flowing into Caspian Sea, particularly when flash floods occur.
Correspondingly, in comparison to other clogging types, the physical clogging mechanism can be easily triggered in this region and, more importantly, since infiltration basins and water spreading systems are prevailing approaches for the establishment of a MAR system in this region, the results of this study can be quite useful to other coastal areas of the Caspian Sea with similar environmental and hydro-morphic conditions where sedimentation basins should be designed to hinder physical clogging process in ongoing and under construction MAR systems.

2. Materials and Methods

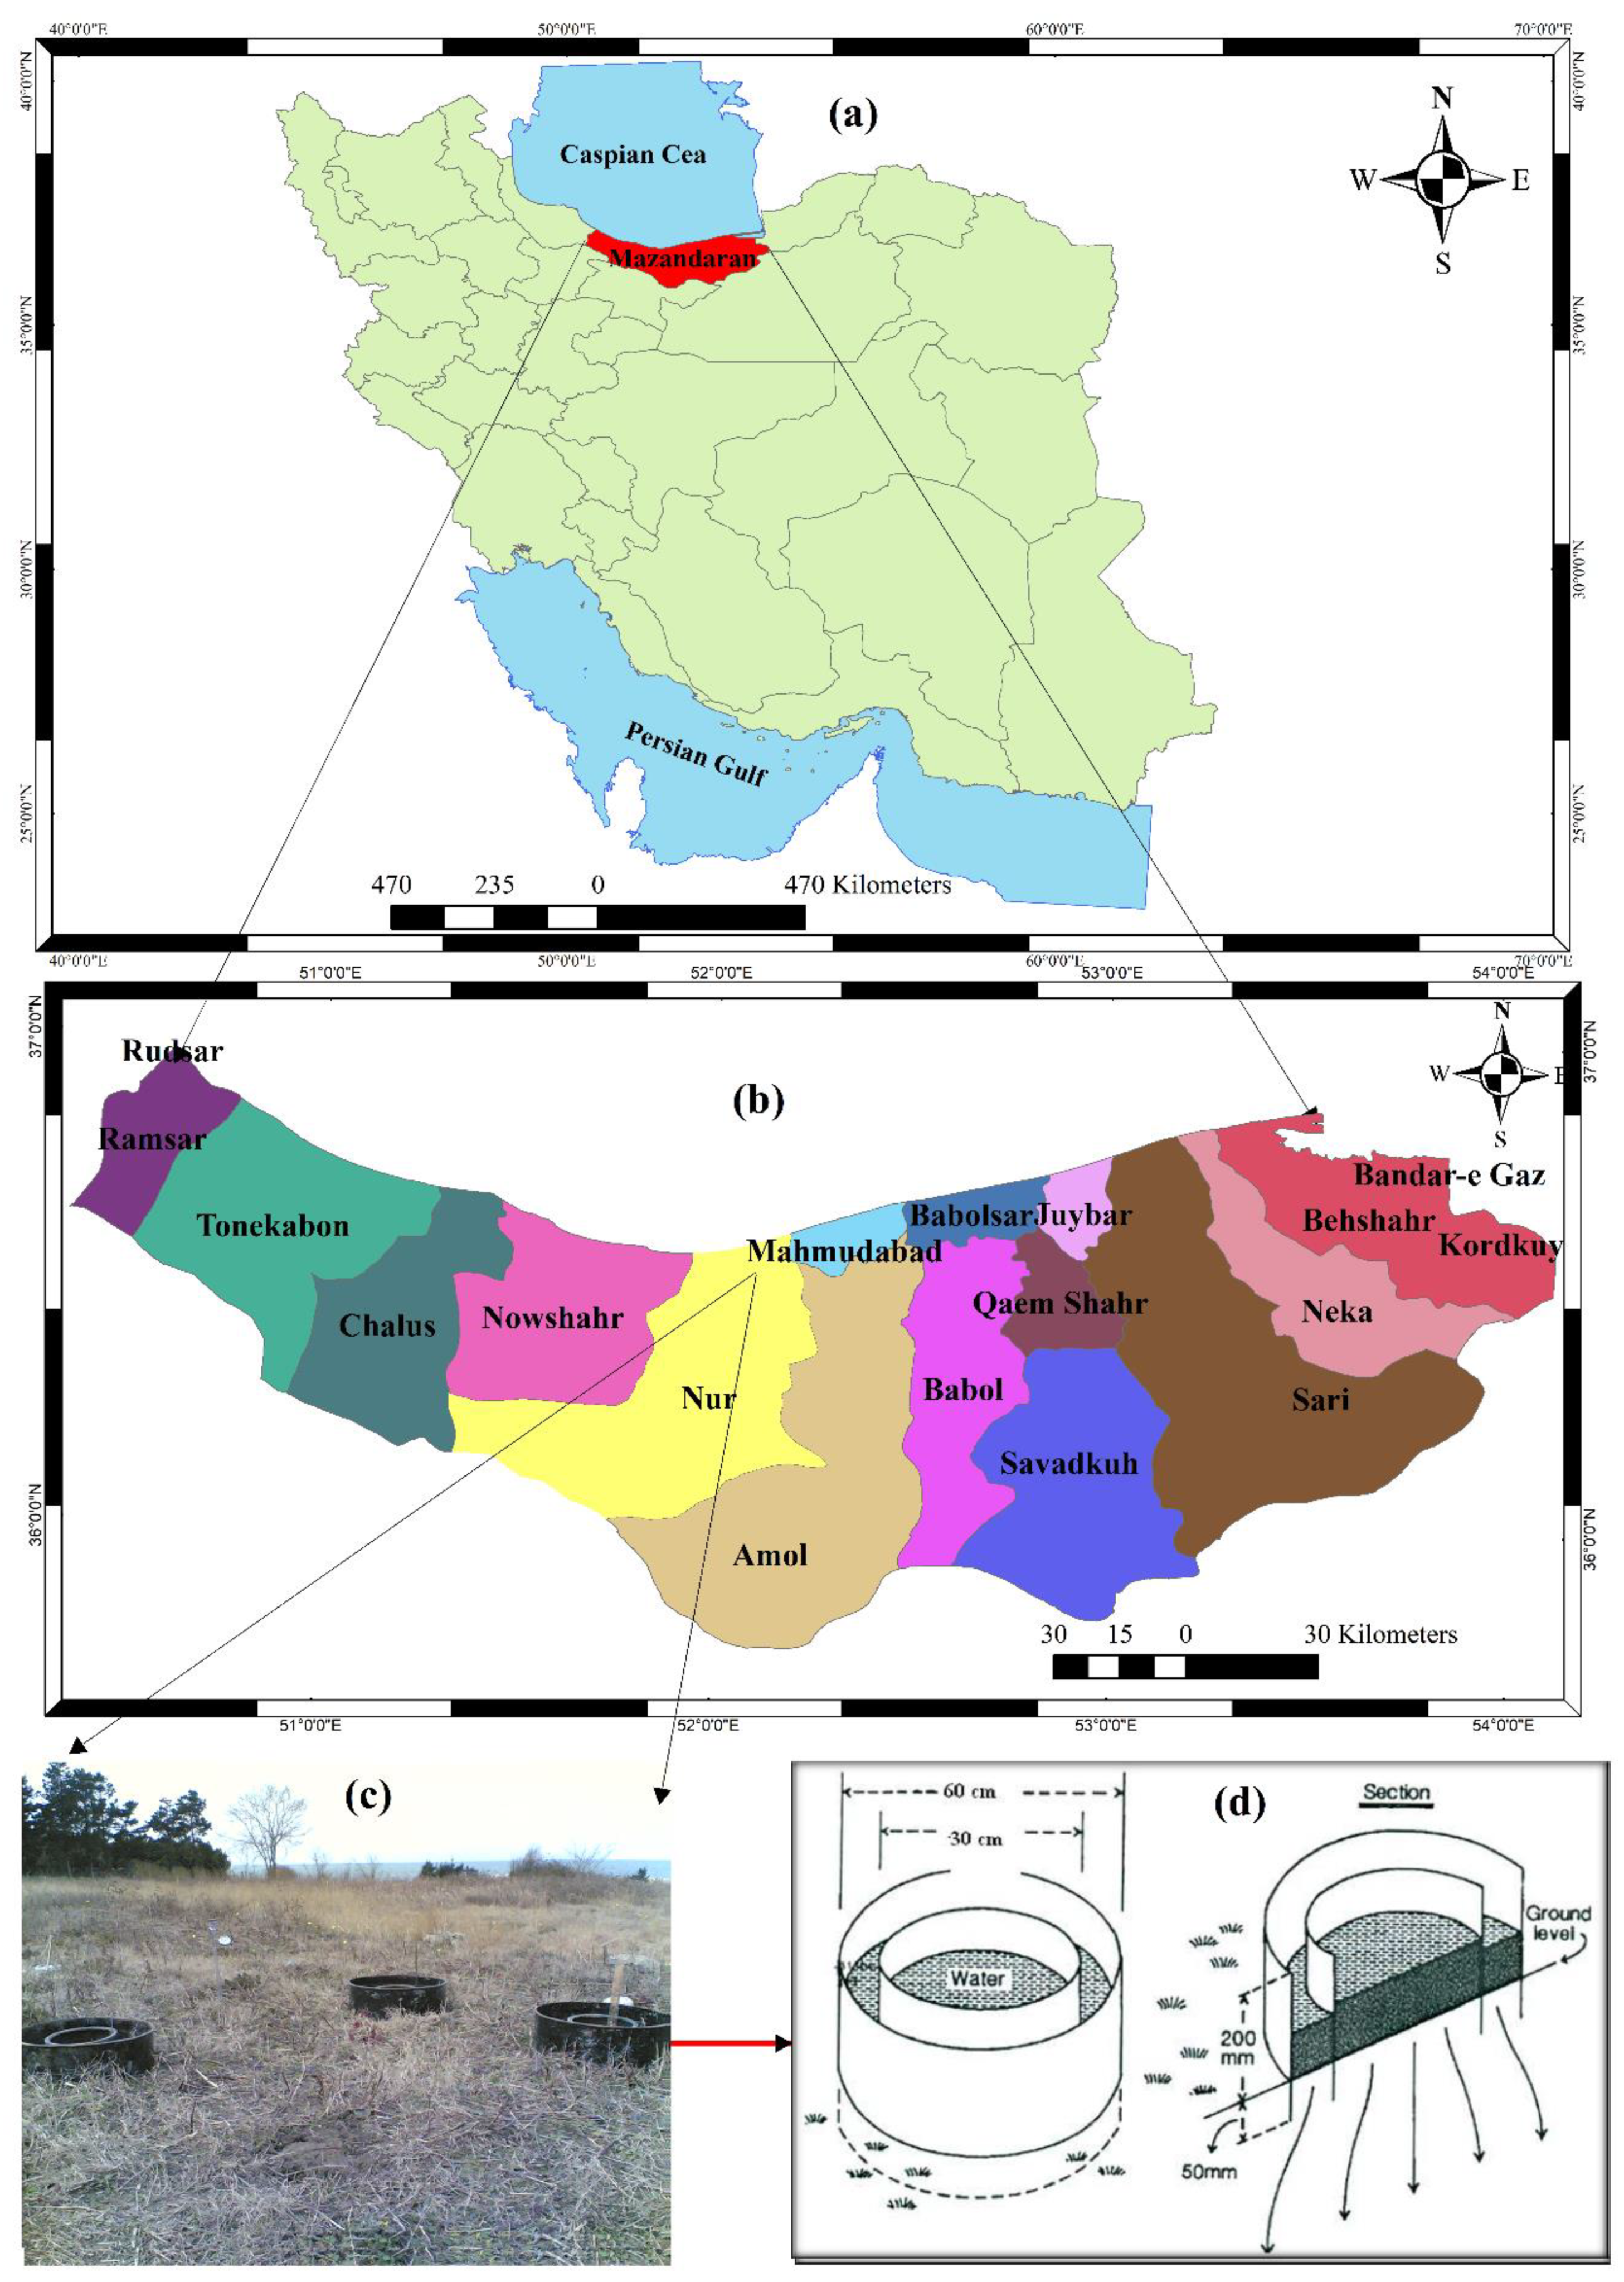
2.1. Application Area

The application site (36°34′ N and 52°02′ E) is situated on the southern-coastal part of Caspian Sea in Nur city, Mazandaran province, Iran (Figure 1). As the site area meets the required factors considered for implementing MAR systems, specifically in terms of slope, soil, geology and unsaturated zone thickness, was selected to conduct the defined experiments. Some of the pedologic and topographic properties, measured at the time of conducting the experiments, that affect the infiltration rate are listed in Table 1.

2.2. Infiltration Rate Measurement

Measuring of infiltration rate was taken through double rings infiltrometer (Figure 1c–d). It consists of the two rings (22.5 to 90 cm diameter) driven into the ground by a driving plate and hammer, to penetrate into the soil uniformly without tilt or undue disturbance of the soil surface to a depth of 15 cm [36]. After driving is over, any disturbed soil adjacent to the sides tamped with a metal tamper. Point gauges are fixed in the centre of the rings and in the annular space between the two rings. Water is poured into the rings to maintain the desired depth (2.5 to 15 cm with a minimum of 5 mm) and the water added to maintain the original constant depth at regular time intervals (after the commencement of the experiment) of 5, 10, 15, 20, 30, 40, 60 min and so forth, up to a period of at least 6 h is noted (in case the infiltration rate is not reached the constant value). The purpose of the outer tube is to eliminate to some extent the edge effect of the surrounding drier soil and to prevent the water within the inner space from spreading over a larger area after penetrating below the bottom of the ring [37].
Also, it should be noted that with the aim of keeping the same environmental situation for each measurement, we measured all infiltration rate treatments within one day to ensure that the same antecedent soil moisture was considered for each measurement. Furthermore, to minimize the impacts of local soil heterogeneity, we did intensive field surveys in order to carefully select the site in a way that soil type, unsaturated thickness and land cover to not change over this already very small application site.

2.3. Set Up the Experiments

Since different types of the suspended solids in terms of sizes and concentrations are expected to enter into the MAR systems, three suspended solids consisting mainly of clay, silt and sand grains were created using sieve analysis approach advised by American Society for Testing and Materials (ASTM) [38]. The analyses were carried out in Water and Soil Engineering Lab in the Department of Watershed Management Engineering at Tarbiat Modares University (TMU), Iran. The fractions of constituents for each suspended solid are given in Table 2. In addition to the solid size, the concentration of the suspended loads plays an important role in the clogging process occurrence and subsequently the operability of the MAR systems. To that respect, four different levels of the concentration falling into distinct categories were created including 0, 2, 5 and 10 g per litre (g/L). Indeed, 0 g/L represents the control treatment (clean water) for making the comparability possible with the other treatments.
Given the fact that uplannds of the watersheds the streamflow/recharging water comes from have been formerly well protected against soil erosion and sediment production, they are recently under vast deforestation and due to ongoing climate change impacts, SSC of the downstream streams has been being greatly increased.
Thus, notwithstanding a lower suspended sediment yield for baseflow conditions expected during dry periods [39], SSC can often even exceed the maximum concentration set out for this study, that is, 10 g/L. More importantly, as there is not enough recharging water for MAR operation during baseflow conditions, when the irrigated agriculture and environmental flow requirements must be met too, major portion of water inflowing into MAR systems is supplied via diverting the flash floods which contain a very high SSC as well as a wide variety of suspended sediment sizes that enter into MAR systems in this region. It should be noted that these predefined concentration levels, except for 0 g/L denoting the clean water/control treatment, are realistic values reported by some studies conducted on suspended sediment concentration of rivers in response to storm/flood events which recurrently occur in this region [39]. To clearly distinguish the impacts of different suspended solid concentrations on the infiltration rate reducibility, we have ascertained a wide but realistic range of concentration levels. However, findings of this study cannot be linearly generalized to other concentration levels below or over the predetermined levels.
With regard to the soil heterogeneity existing in the site area and to meet statistical prerequisites, four replications were considered for each treatment. Thus, in the light of four concentration levels and three suspended solid types, 48 double-rings infiltrometers were penetrated into the soil. It should be noted that the infiltration rates averaged for four replications were then used for further assessment. The infiltration rate was measured by 100 min to ensure a constant/final infiltration rate.

2.4. Statistical Analysis and Cohen’s d Effect Size Measure

There are a wide range of “effect size” measures, defined as a quantitative metric of the magnitude of a phenomenon, including Cohen’s d, Pearson’s r correlation, odds ratio (OR), relative risk or risk ratio (RR) and coefficient of determination (R2) that can be used for drawing statistical comparisons between observations/treatments [40].
As a matter of fact, studies emphasizing only the need for using statistical significant test to report the obtained results may come to a subjective judgment [41]. Moreover, it should be noted that there is a difference between statistical and practical significance. For instance, if there is a statistical significant difference between two treatments (e.g., p-value ≤ 0.05), it does not necessarily mean that a practical significant can be detected as well [42]. On the other hand, a p-value can advise the reader whether an effect exists, while it cannot enlighten the size of the effect [40].
Above all, a statistically significant test may not be easy to reproduce [43]. Therefore, to overcome the issues stated regarding using classical null hypothesis significance tests [44], we took advantages of Cohen’s d effect size by which one can practically measure the difference between observations. Also, it quantifies the strength of an effect by virtue of the distance between two means in units of standard deviation.
In many of effect size measure interpretations, a larger absolute value always demonstrates a stronger effect, with the main exception being if the effect size is an odds ratio. One of the most commonly used measures to quantify effect size is Cohen’s d [45], which is defined as the difference between two means divided by a standard deviation for the data as follows:
  d = x ¯ 1 x ¯ 2 s μ 1 μ 2 σ  
where μ 1 is the mean for one group of treatments, μ 1 is the mean for the other population (in this study, it denotes the control treatment/clean water), σ denotes the pooled standard deviation of the two groups and s states the pooled sample standard deviation of the two groups.
Cohen [45] proposed computing s as the pooled standard deviation of two independent samples as follows:
  s = ( n 1 1 ) s 1   2 + ( n 2 1 ) s 2 2 n 1 + n 2 2  
where n 1 and n 2 show the numbers of observations for the two samples being compared,   s 1   2 and s 2 2 are variances of the two groups.
The absolute values listed in Table 3, which were originally suggested by Cohen [45] and expanded by Sawilowsky [46], describe the magnitudes of Cohen’s d varying from 0.01 to larger than 2.0.
A generally accepted minimum level of d for a large effect is 0.80 [45]. We calculated the effect size using Cohen’s d approach as implemented in R package so called “effsize” (https://cran.r-project.org/web/packages/esc/esc.pdf).
Based on the given statistical approach, firstly, a comparison was made between the clean water as the control treatment with the reminder treatments. Secondly, we drew a comparison between clay- and silt-sized suspended solids under different concentrations which have been reported as the major triggers of clogging and consequently reducibility of the recharge.

2.5. SSA Structure

In this section, the SSA technique is described for the way it can be used for reconstruction of the infiltration rate under the defined treatment. The major goal of an SSA analysis is to decompose a time series into the sum of independent and interpretable components, namely, a sum of trend, cyclical, seasonal and noise compartments by means of an Eigen-decomposition of the so-called trajectory matrix [47]. Singular Spectrum Analysis (SSA) is a relatively new data-driven model among many non-parametric approaches and its very successful applications have been widely reported. Compared with other data-driven models particularly in hydrological study applications [48,49,50], the main advantages of the SSA technique over some well-known data driven models such as neural networks [51,52], fuzzy rule-based systems and genetic algorithms [53] can be explained by the competency of SSA in signal extraction and filtering capabilities [54], batch processing of a set of similar series [55] and derivation of an analytical formula of the signal [25]. As the hydrological time series suffers from a considerable noise, SSA’s filtering capabilities would be quite helpful to separate the noise from trend, seasonality, periodicity. Furthermore, in comparison with the autoregressive (AR) models, despite the fact that both of them are dependent upon linear recurrence relations, SSA does not require an a-priori model for trend as well as the a-priori knowledge of number of periodicities and period values. Also, periodicities can be modulated by different ways and therefore the type of model, additive or multiplicative, is not necessary to be hold and taken into consideration [56].
In the light of this decomposition, the original series can be reconstructed with a reasonable accuracy by execution of the following four steps including (1) embedding, (2) singular value decomposition (SVD), (3) eigentriple grouping and (4) diagonal averaging. These four procedures are concisely described as follow.

2.5.1. Embedding

Assuming a real-time series   X n = ( x 1 , , x N ) of length N which L (1 < L < N) should be an integer value so called window length and K = NL + 1. To conduct the embedding, the initial time series is projected into a sequence of lagged vectors of size L by creating K = NL + 1 lagged vectors (Equation (3)) which in turn trajectory matrix is made (Equation (4)).
  X i = ( x i , , x i   + L 1   ) T ,   i = 1 , ,   K .
  X = [ X 1 :   : X K ] = ( X i j ) i , j = 1 L , K = ( x 1 x 2 x 3 x K x 2 x 3 x 4 x K + 1 x 3 x 4 x 5 x K + 2 x L x L + 1 x L + 2 x N )  
In this matrix, two main characteristics exist including (1) the rows and columns of X are subseries of the initial time series and (2) X has equal elements on anti-diagonals and therefore the trajectory matrix is catalecticant matrix.

2.5.2. Singular Value Decomposition

Considering { P i } i = 1 L is an orthonormal basis in R L (where R denote the reconstructed time series and L is the window length), the following decomposition of the trajectory matrix is expressed as:
  X = i = 1 L P i Q i T = X 1 + + X L  
where Q i = X T P i and calculated as λ i = X i 2 = Q i 2 . Then, two options are regarded for the basis { P i } i = 1 L including (a) basic: { P i } i = 1 L and (b) eigenvectors of X X T .
Under two chosen cases, the eigenvectors are ordered in a way that the corresponding eigenvalues are arranged in the decreasing order. Regarding that, case (a) related to Singular Value Decomposition (SVD) of X, stated as X = i λ i U i V i T ,   P i = U i are left singular vectors of X, Qi = λ i V i V i are called factor vectors or right singular vectors, λ i are eigenvalues of X X T , therefore, λ 1 ≥ ⋯ ≥ λ L ≥ 0. However, case (b) is useful only for the analysis of stationary time series with zero mean [57]. For SSA applications, case (a) is usually abbreviated to BK version. In case (a), the triple ( λi, Ui, Vi) is called ith eigentriple (abbreviated to ET).

2.5.3. Eigentriple Grouping

Let d = max {j: λ i ≠ 0}. As the expansion (6) is assured, the grouping procedure divides the set of indices {1,…, d} into m disjoint subsets namely I 1 , ,   I m and if we state X i = i I X i . The expansion (5) results in the decomposition (Equation (6)).
  X = X I 1 + + X I m  
The process of selecting the sets I 1 , ,   I m is named eigentriple grouping. If m = d and I j j = {j}, j = 1,…, d, then the corresponding grouping is called elementary. The option of many principal eigentriples for case (a) is concerned to the approximation of the time series in respect to the well-known optimality property of the SVD.

2.5.4. Diagonal Averaging

If the compartments of the series are distinguishable and the indices are being decomposed accordingly, then all the matrices in the expansion 6 are Hankel matrices. Thus, promptly, the decomposition of the original series is obtained. However, in effect, this condition cannot be realistic, which means that no secondary diagonal contains equal elements. Hence, an arbitrary matrix is transferred into a Hankel matrix and therefore into a series. To do so, we may consider the procedure of diagonal averaging, which defines the values of the time series X ˜ ( k ) as averages of the corresponding diagonals of the matrices X I k .
At this part, each matrix X I j of the grouped decomposition (6) is converted into a new series of length N. Concerning Y is an L × K matrix with elements y i j , 1 ≤ i ≤ L, 1 ≤ j ≤ K and then for simplification LK, by creating the diagonal averaging, we transfer the matrix Y, which is converted to the series ( y ˜ i , , y ˜ N ) using the following equation:
  y ˜ s = ( l , k ) A s y l k / | A s |  
where A S = {(l, k): l + k = s + 1, 1 ≤ lL, 1 ≤ kK} and | A S | indicates the number of elements in the set As so that this corresponds to averaging the matrix elements over the anti-diagonals.
Diagonal averaging (Equation (7)) applied to a resultant matrix XIk generates a reconstructed series namely X ˜ ( k ) = ( x ˜ 1 ( k ) , , x ˜ N ( k ) ) . Thus, the initial series ( x 1 , , x N ) is decomposed into a sum of m reconstructed series:
  x n = k = 1 m x ˜ n ( k ) ,   n = 1 ,   ,   N .
The reconstructed series resulted from the elementary grouping is called elementary reconstructed series [25].

2.6. Assessment the Performance of the Reconstructed Infiltration Rates

To assess the goodness-of-fit between the reconstructed and observed infiltration rate for all the treatments, two well-known statistical metrics including coefficient of determination (R2) and Nash-Sutcliffe efficiency (NS), given in Equations (9) and 10, respectively, were computed.
  R 2 = ( i = 1 n ( O i O ¯ ) ( P i P ¯ ) i = 1 n ( O i O ¯ ) 2   i = 1 n ( P i P ¯ ) 2 ) 2  
  N S = 1 ( i = 1 n ( O i P i ) 2 i = 1 n ( O i O ¯ ) 2 )
where O i denotes the observed, O ¯ i the average of observed and P i the reconstructed infiltration rate at time i. R2 ranges between 0 and 1 (perfect fit) and describes how much of the observed dispersion is explained by the prediction. NS varies between −∞ and 1.0 (perfect fit), wherefore NS < 0 indicates that the mean value of the observed series is an even better predictor than that of the model [58].
Since the dispersion is the only property quantified when applying R2, this is accounted for the most important shortcoming. A model which systematically over- or under-estimates over all the observation times will still produce good R2 which is close to 1.0 although, there is a large discrepancy/residual between observed and simulated time series. Thus, it is worth mentioning that if R2 is used for model validation, some further information including the gradient (b) and the intercept (a) of the regression model should be considered to address this problem [58].
The most serious disadvantage of the NS is the fact that the differences between the observed and simulated values are computed as squared values. Correspondingly, grater values in a time series are substantially overestimated, while smaller values are ignored [59]. The similar to R2, the NS is not very sensitive to systematic model over- or under-estimation.

3. Results

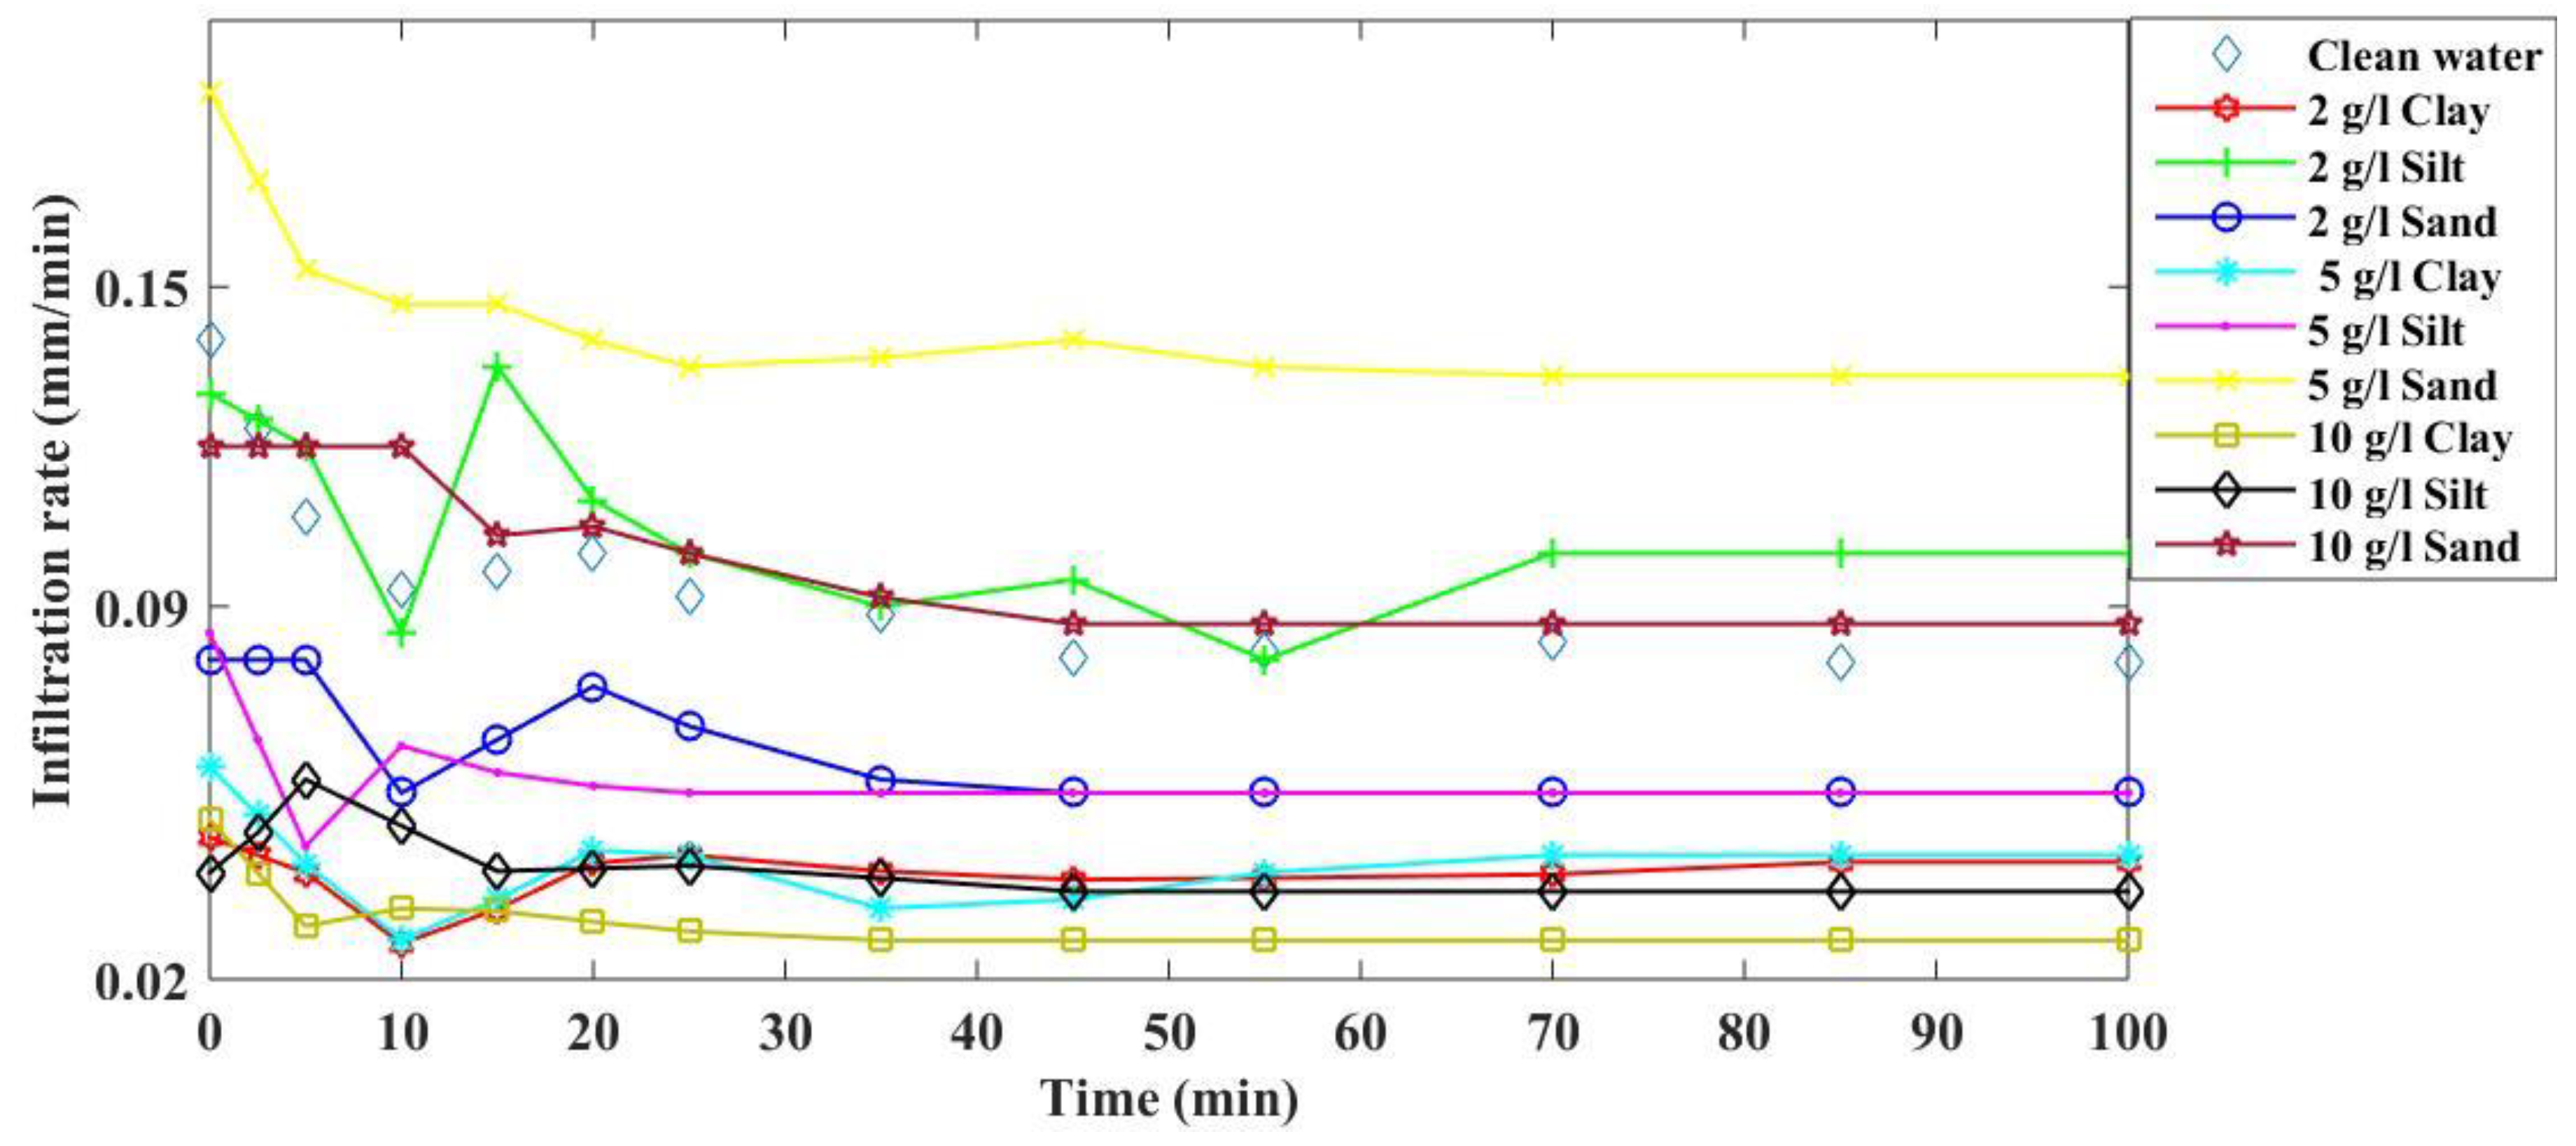
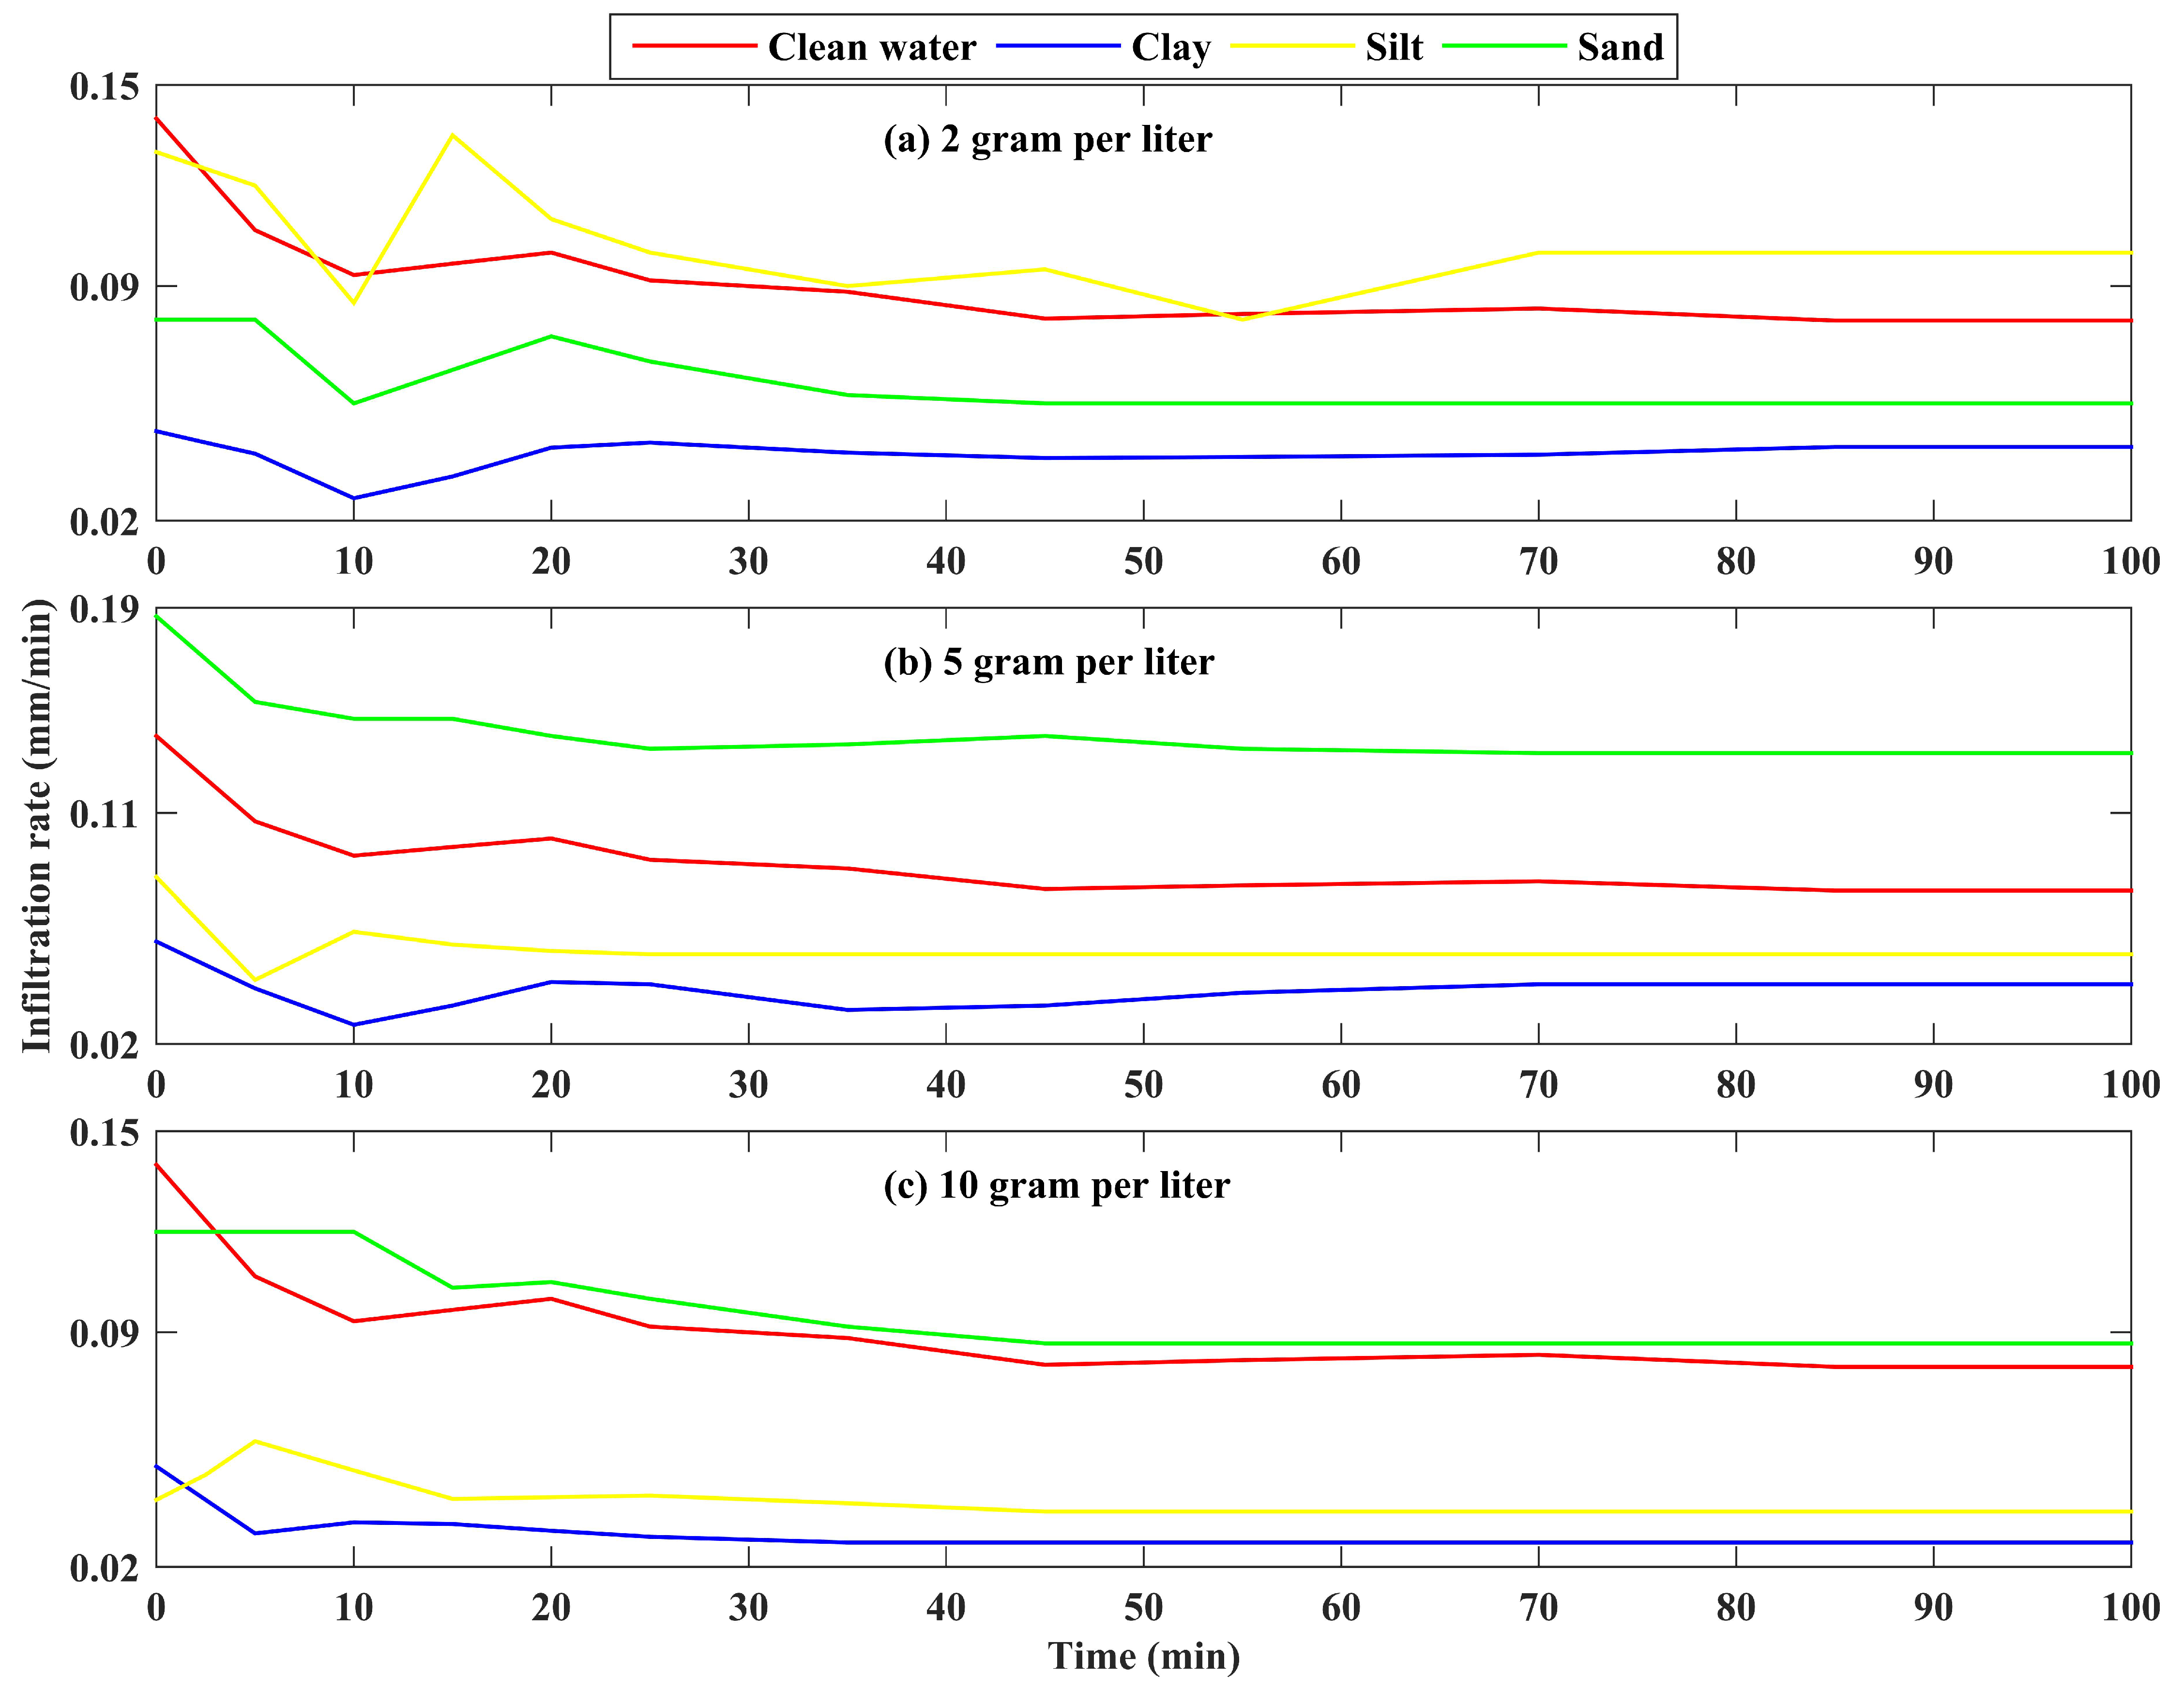
3.1. Infiltration Rate for Clay-Silt- and Sand-Sized Suspended Solids

The impacts of the suspended solid characteristics including the particle size, that is, sediment particle texture and concentration on water infiltration rate, measured by double-rings, have been graphically assessed. Interestingly, compared with the clean water (0 g/L), 5 gr/l and suspended sand and partially 2 g/L suspended silt have shown a higher rate of water infiltration into soil (Figure 1). As expected, one can clearly notice that clay suspended solids containing 10 g/L concentration has indicated the lowest rate of the infiltration approximately all over the time except for the measured time 10 min. Similarly, clay-sized suspended solids including 2 and 5 g/L, particularly, in initial times (e.g., by 15 min), have represented the lowest order of magnitude (Figure 2). From min 55 onwards, silt-sized suspended solids containing 10 g/L concentration have shown the second lowest amount of infiltration rate. Interestingly, infiltration rate with respect to sand-sized suspended solids at 10 g/L has provided the third smallest order of magnitude. Infiltration rate represents a parabolic function under an ideal normal condition, however, there is a jump in terms of a sudden increase in infiltration rate, occurred in different times (e.g., in 10 min for 2 and 5 g/L of clay suspended solids) for all these 10 treatments.
In addition, the infiltration rates of clay-, silt- and sand-sized suspended solids under three concentration levels 2, 5 and 10 g/L have been compared to 0 g/L to gain a clearer insight into the impacts of each grain size and concentration on infiltration rates (Figure 3). As indicated, clay-sized suspended solids (Figure 3, blue curves) have been heavily reduced infiltration rate under three concentration levels 2, 5 and 10 g/L compared with the 0 g/L. Likewise, silt-sized suspended solids have resembled this behaviour, except where 2 g/L concentration has not affected the infiltration rate. It seems that under 2 g/L concentration, clay-sized suspended solids could abate the infiltration into the soil rather than the other treatments.

3.2. Statistical Comparisons amongst the Defined Infiltration Rate Treatments

Six important characteristics derived from infiltration rate were compared including (1) cumulative infiltration from 0-100 min; (2) maximum infiltration rate seen during the time span 0–100 min; (3) minimum infiltration rate seen during the time span 0–100 min; (4) average of the infiltration rate calculated over all measured times; (5) amount of the constant infiltration rate reached after being saturated the surface soil layer; and (6) the time lasted until reaching the constant infiltration rate (Table S1).
The largest and smallest cumulative infiltration have been ascertained for sand- and clay-sized suspended solids at 5 and 10 g/L concentration levels respectively. With regard to the maximum infiltration, the highest and lowest rate were found to be under sand- and clay-sized suspended solids at 5 and 2 g/L respectively (Table S1). Similar results were held for the minimum infiltration—the highest and lowest amount were measured for sand- and clay-sized suspended solids at 5 and 2 g/L respectively. Concerning the average of the infiltration, the highest quantity was detected for two solid materials namely clay- and silt-sized suspended solids at 10 and 2 g/L respectively, while the smallest quantity of this metric was found out for clay-sized suspended solids at 2 g/L concentration. Regarding the other metric, constant infiltration rate, the highest and lowest rate were identified for sand- and clay-sized suspended solids at 5 and 10 g/L respectively. Ultimately, the longest time required to get to the constant infiltration rate was detected for the clean water and sand/silt-sized suspended solids at 2 g/L, whereas that of the shortest time was obtained for silt-sized suspended solids at 5 g/L.
In addition to the quantitative comparison made above, a statistical approach, Cohen’s d effect size measure, was used to compare the impacts of suspended solid sizes at three concentrations on infiltrability. To that respect, firstly, we compared the infiltration rate of all treatments with the clean water (Table 4) and secondly, we appraised the infiltration rates of clay-sized suspended solids under 0, 2 and 10 g/L rather than that of silt-sized suspended solid sizes and under the same concentration levels (Table 5). As given in Table 4, infiltration rate resulted from clay-sized suspended sediments at 2, 5 and 10 g/L concentration levels demonstrate the lowest magnitude of order, respectively, in comparison with that of the clean water. Approximately, the same holds for silt-sized suspended sediments. While, one cannot clearly notice an impact of sand-sized suspended sediments on the infiltrability, because there is no general trend with respect to the concentration effect.
Such a peculiar behaviour can be attributed to the impacts of preferential flow referring to the uneven and often quick movement of water through porous media, typically soil, characterized by regions of enhanced flux such that a small fraction of media, resulted from wormholes, root holes and cracks, which contributes to a large fraction of the flow. Thus, the impacts of the preferential flow taken place, where the double-rings infiltrometers containing suspended sands had been penetrated into the soil, might counteract the influence of the suspended solid sand-size and whose concentrations. Also, inasmuch as the antecedence soil moisture play an important role in controlling the infiltration rate, the places where the double-rings infiltrometers containing suspended sand-size were installed might have less moisture content and as a result, the effect of the sand-size sediments and concentrations is offset. Therefore, it is highly recommended performing the experiments for sand-sized sediments with more replications than this study, 4 replications, to get a better insight into this solid type and whose concentration on possible physical clogging.
It should be noted that even though the pooled standard deviation for Cohen’s d was calculated assuming independence of observations, in time series, this assumption may not be satisfied. Therefore, the results presented in Table 4 should be interpreted carefully. Comparison drawn between infiltration rates resulted from clay- and silt-sized suspended sediments (Table 5) highlighted that under the same concentration level, clay suspended grains play a “huge” effect on reduction of infiltrability, rather than silt sediments. For instance, even 2 g/L clay could “very large” decline the infiltration rate relative to silt-sized suspended solids at 5 g/L. However, this is not true for the infiltration rate resulted from 10 g/L silt-sized suspended sediment—we observed a higher infiltration rate for 5 g/L clay-sized suspended sediments.

3.3. Reconstruction of Water Infiltration Rate using SSA

3.3.1. SSA Objects

Before reconstructing the infiltration rate under all treatments, analysing eigenvalues, scatterplots of eigenvectors, w-correlation matrix of the elementary components and reproduced infiltration rate, fed by each corresponding eigenvector, are of paramount importance [25]. To illustrate each of aforementioned objects, in the current study, as an example, time series decomposition of infiltration rate of 2 g/L clay-sized suspended sediments were provided. In this regard, as shown by Figure S1, six leading eigenvectors, which are known for having nearly constant coordinates, have resulted in six initially reconstructed infiltration rates of 2 g/L clay-sized suspended solids (Figure S5). As given, two first eigenvectors have mainly led to reconstruction of “trend,” while the rest eigenvectors represent high-frequency elements and thus are not associated with the trend. The trend represented in Figure S6 is majorly reproduced by the second leading eigentriple, that is, eigenvector (Figure S1).
Hence, graphs of eigenvectors can be valuable to the identification of time series decomposition mechanism. Furthermore, the scatter plot of a pair of eigenvectors (Figure S4) producing thereabouts regular T-vertex polygon is valuable to discern a sinusoid of a periodic component. Regarding eigenvalues (Figure S2), several steps are generated by approximately similar eigenvalues and in principal, each step is mainly yielded by a pair of eigenvectors which correspond to a sine wave. The graph of eigenvalues is not informative here and only shows a noticeable contribution of the leading eigenvectors which demonstrates nearly constant coordinates and therefore it corresponds to a pure smoothing [25]. W-correlation matrix (Figure S3), produced in the second decomposition step, indicates that there is a strong correlation amongst the same pairs of components, while this does not hold for the other pairs of the components.

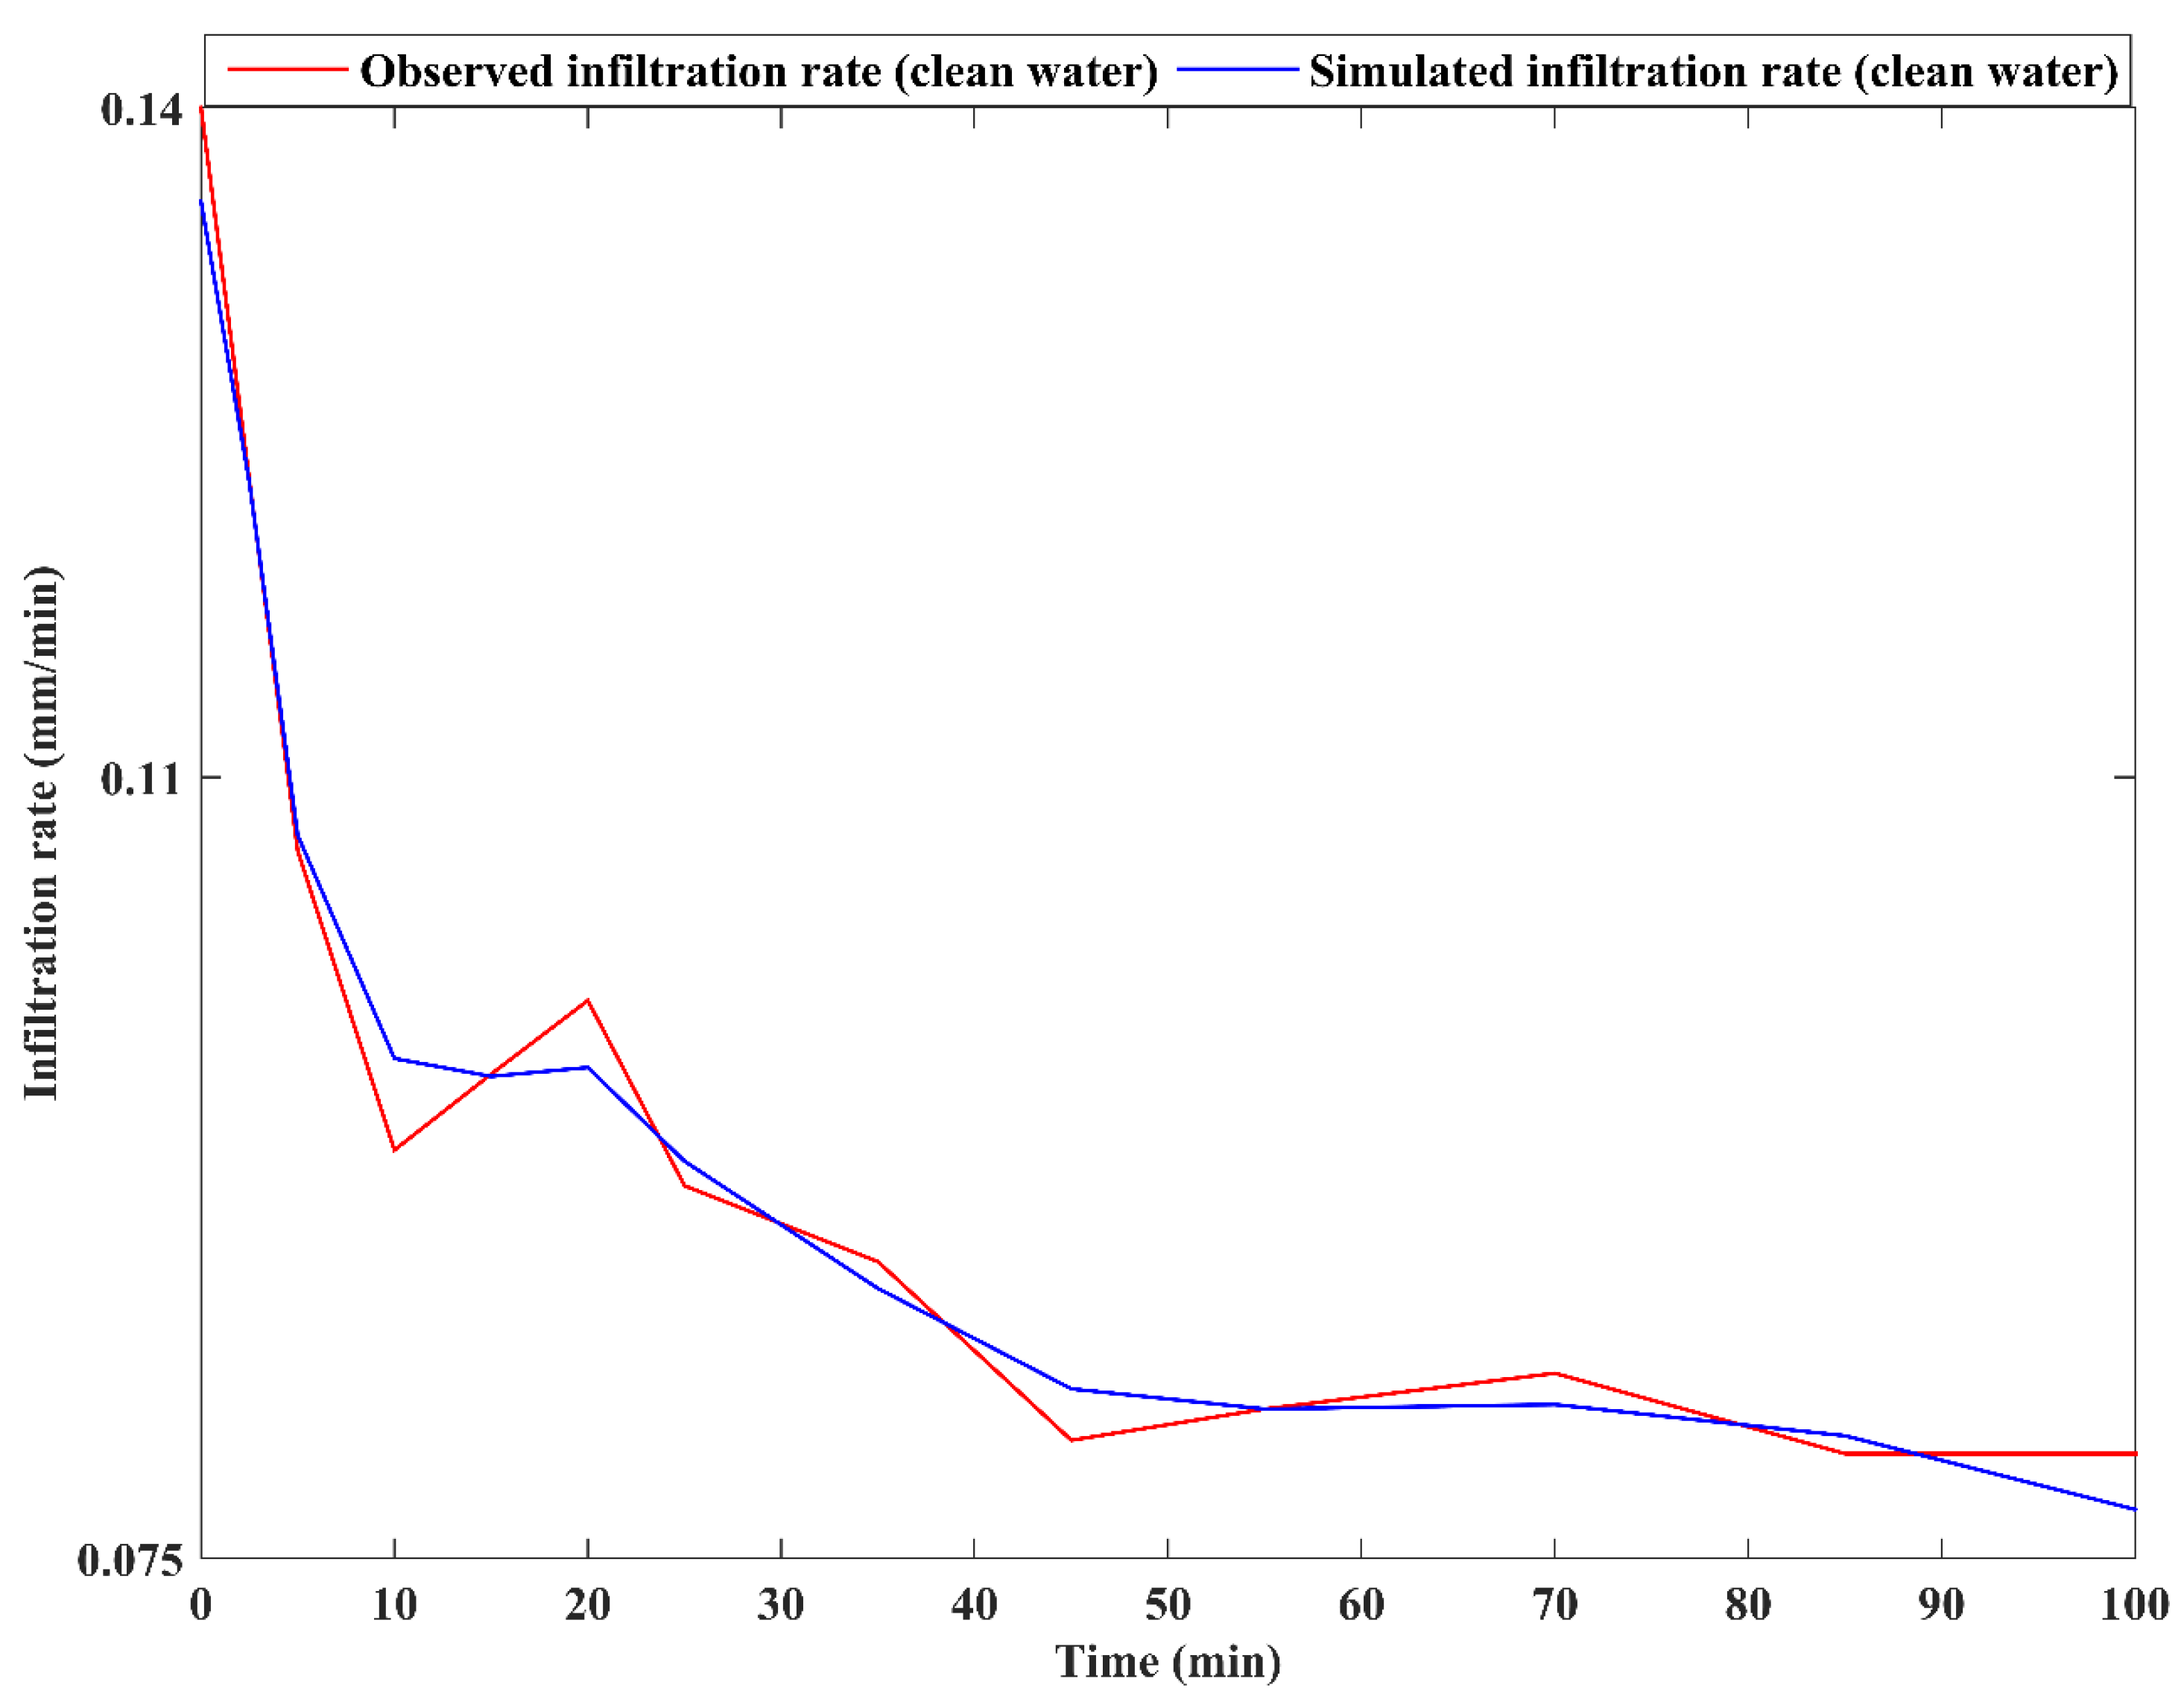
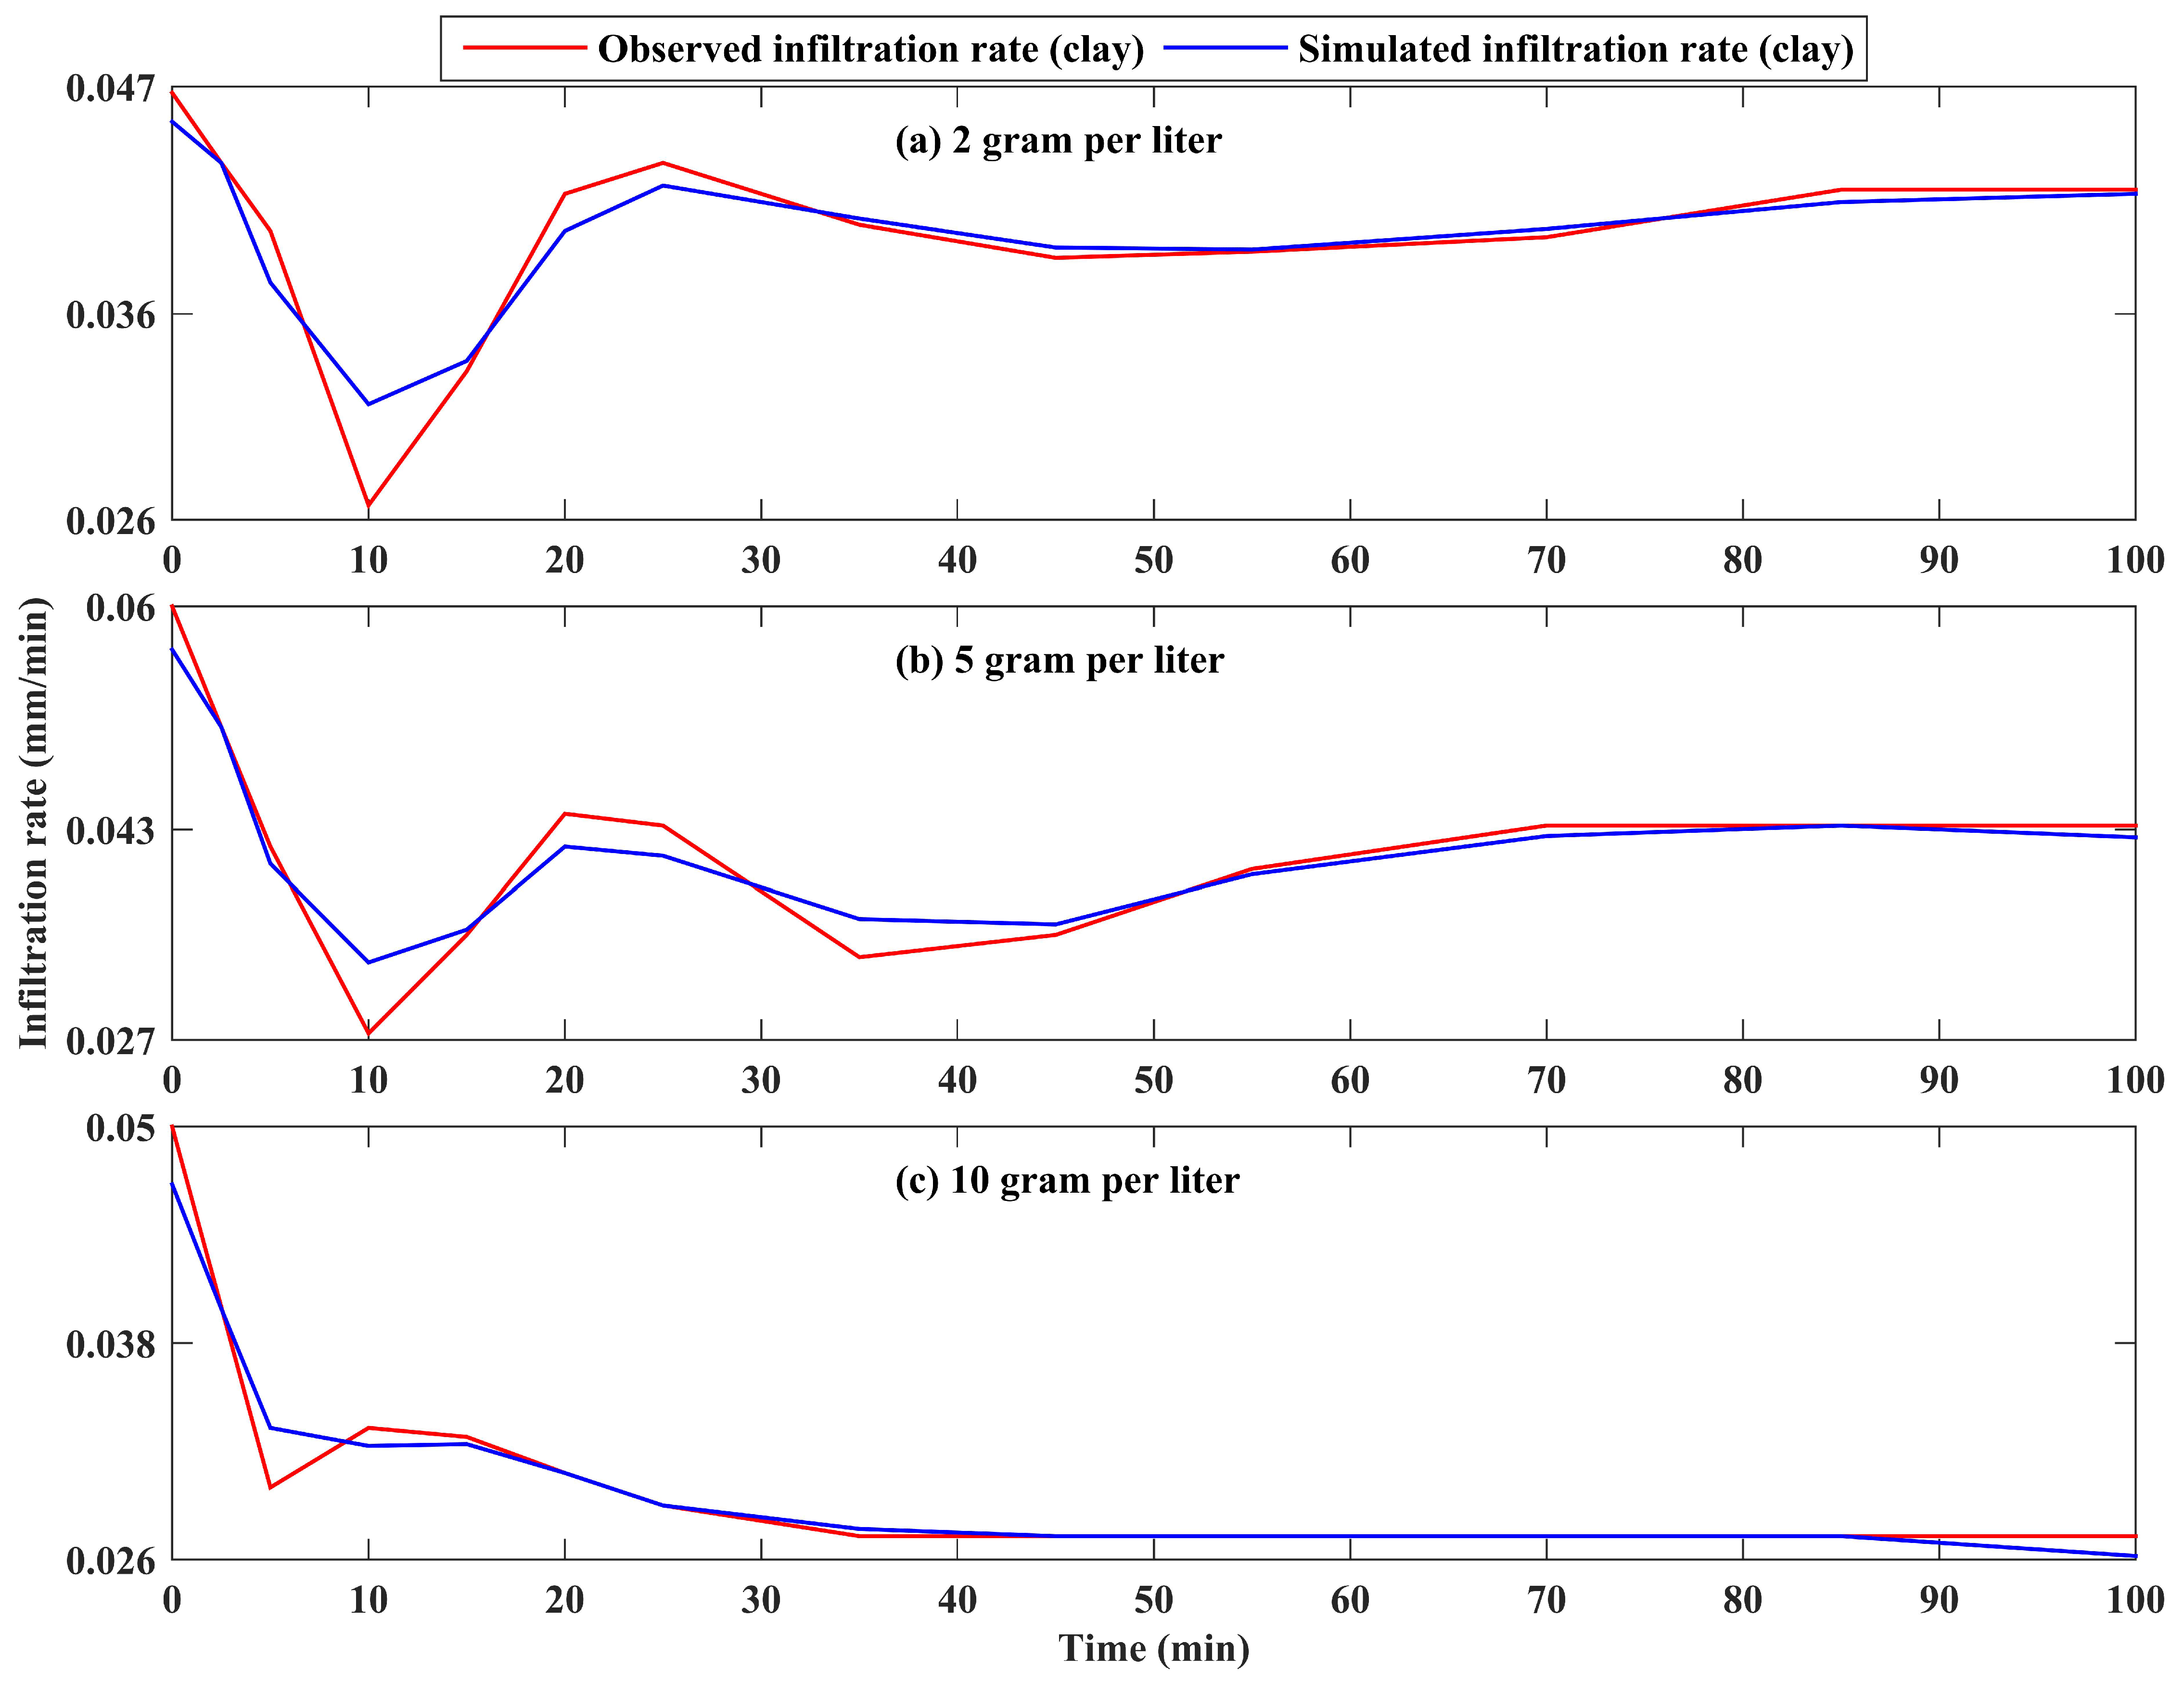
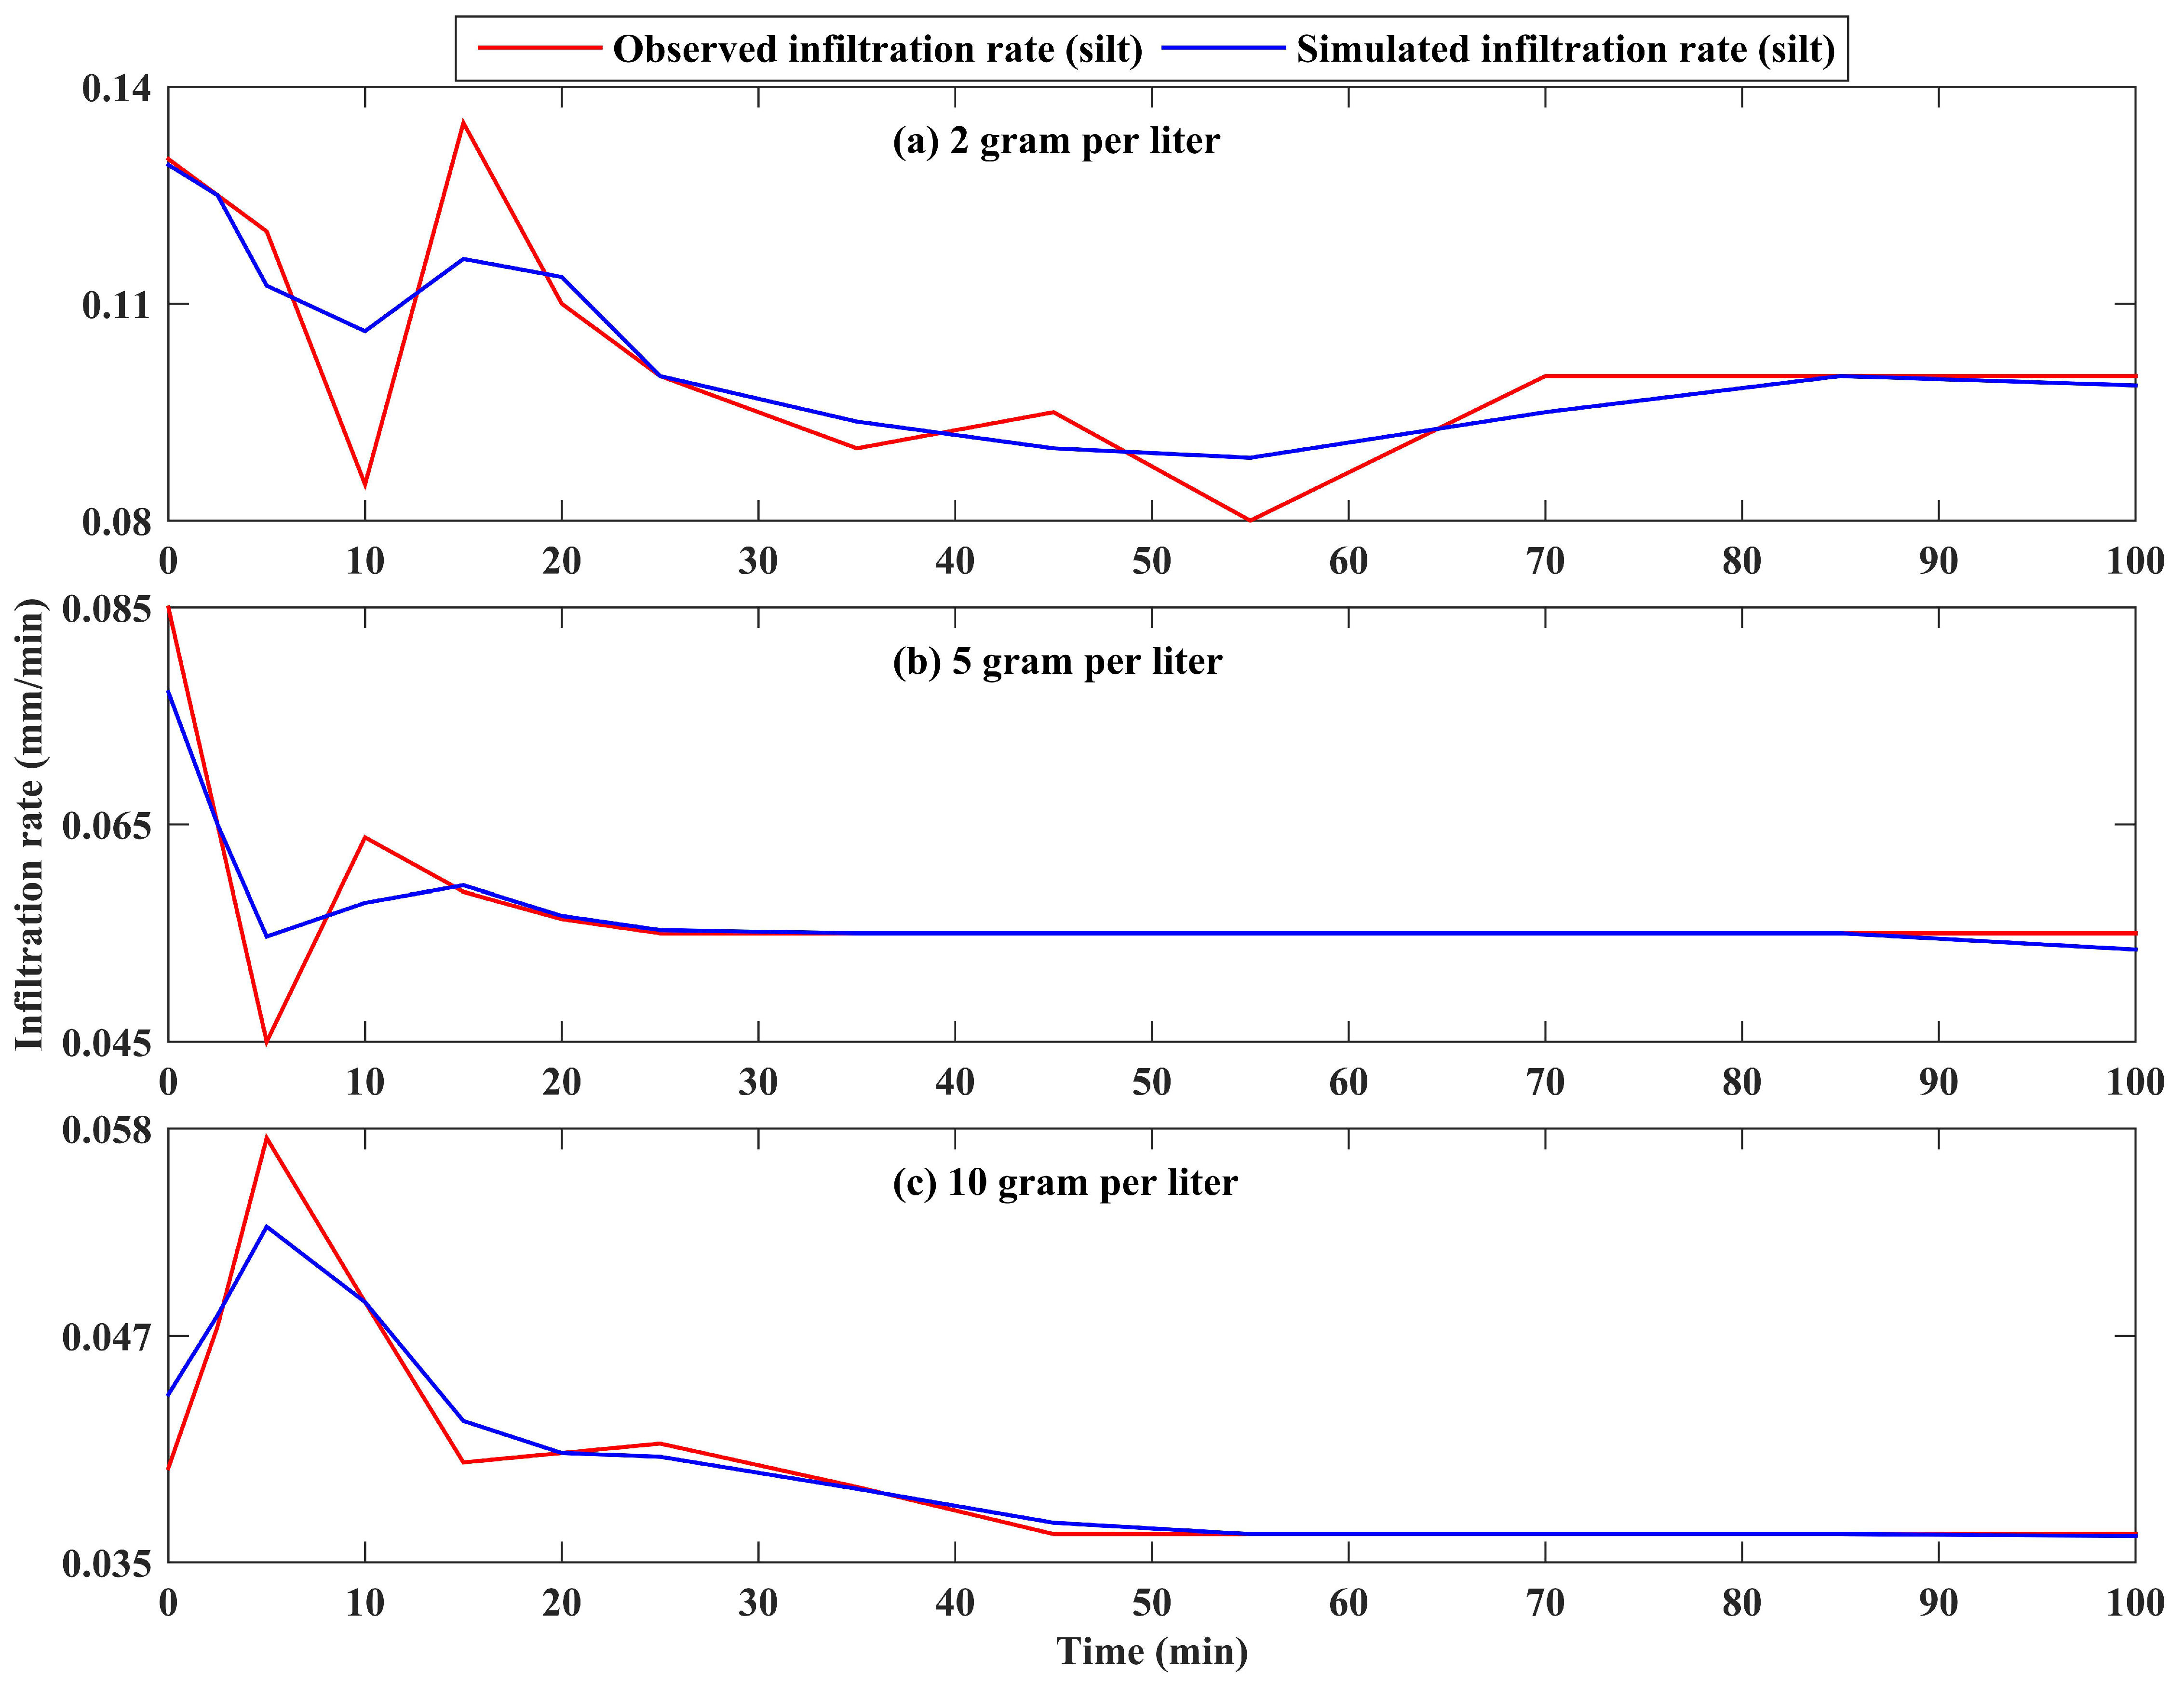
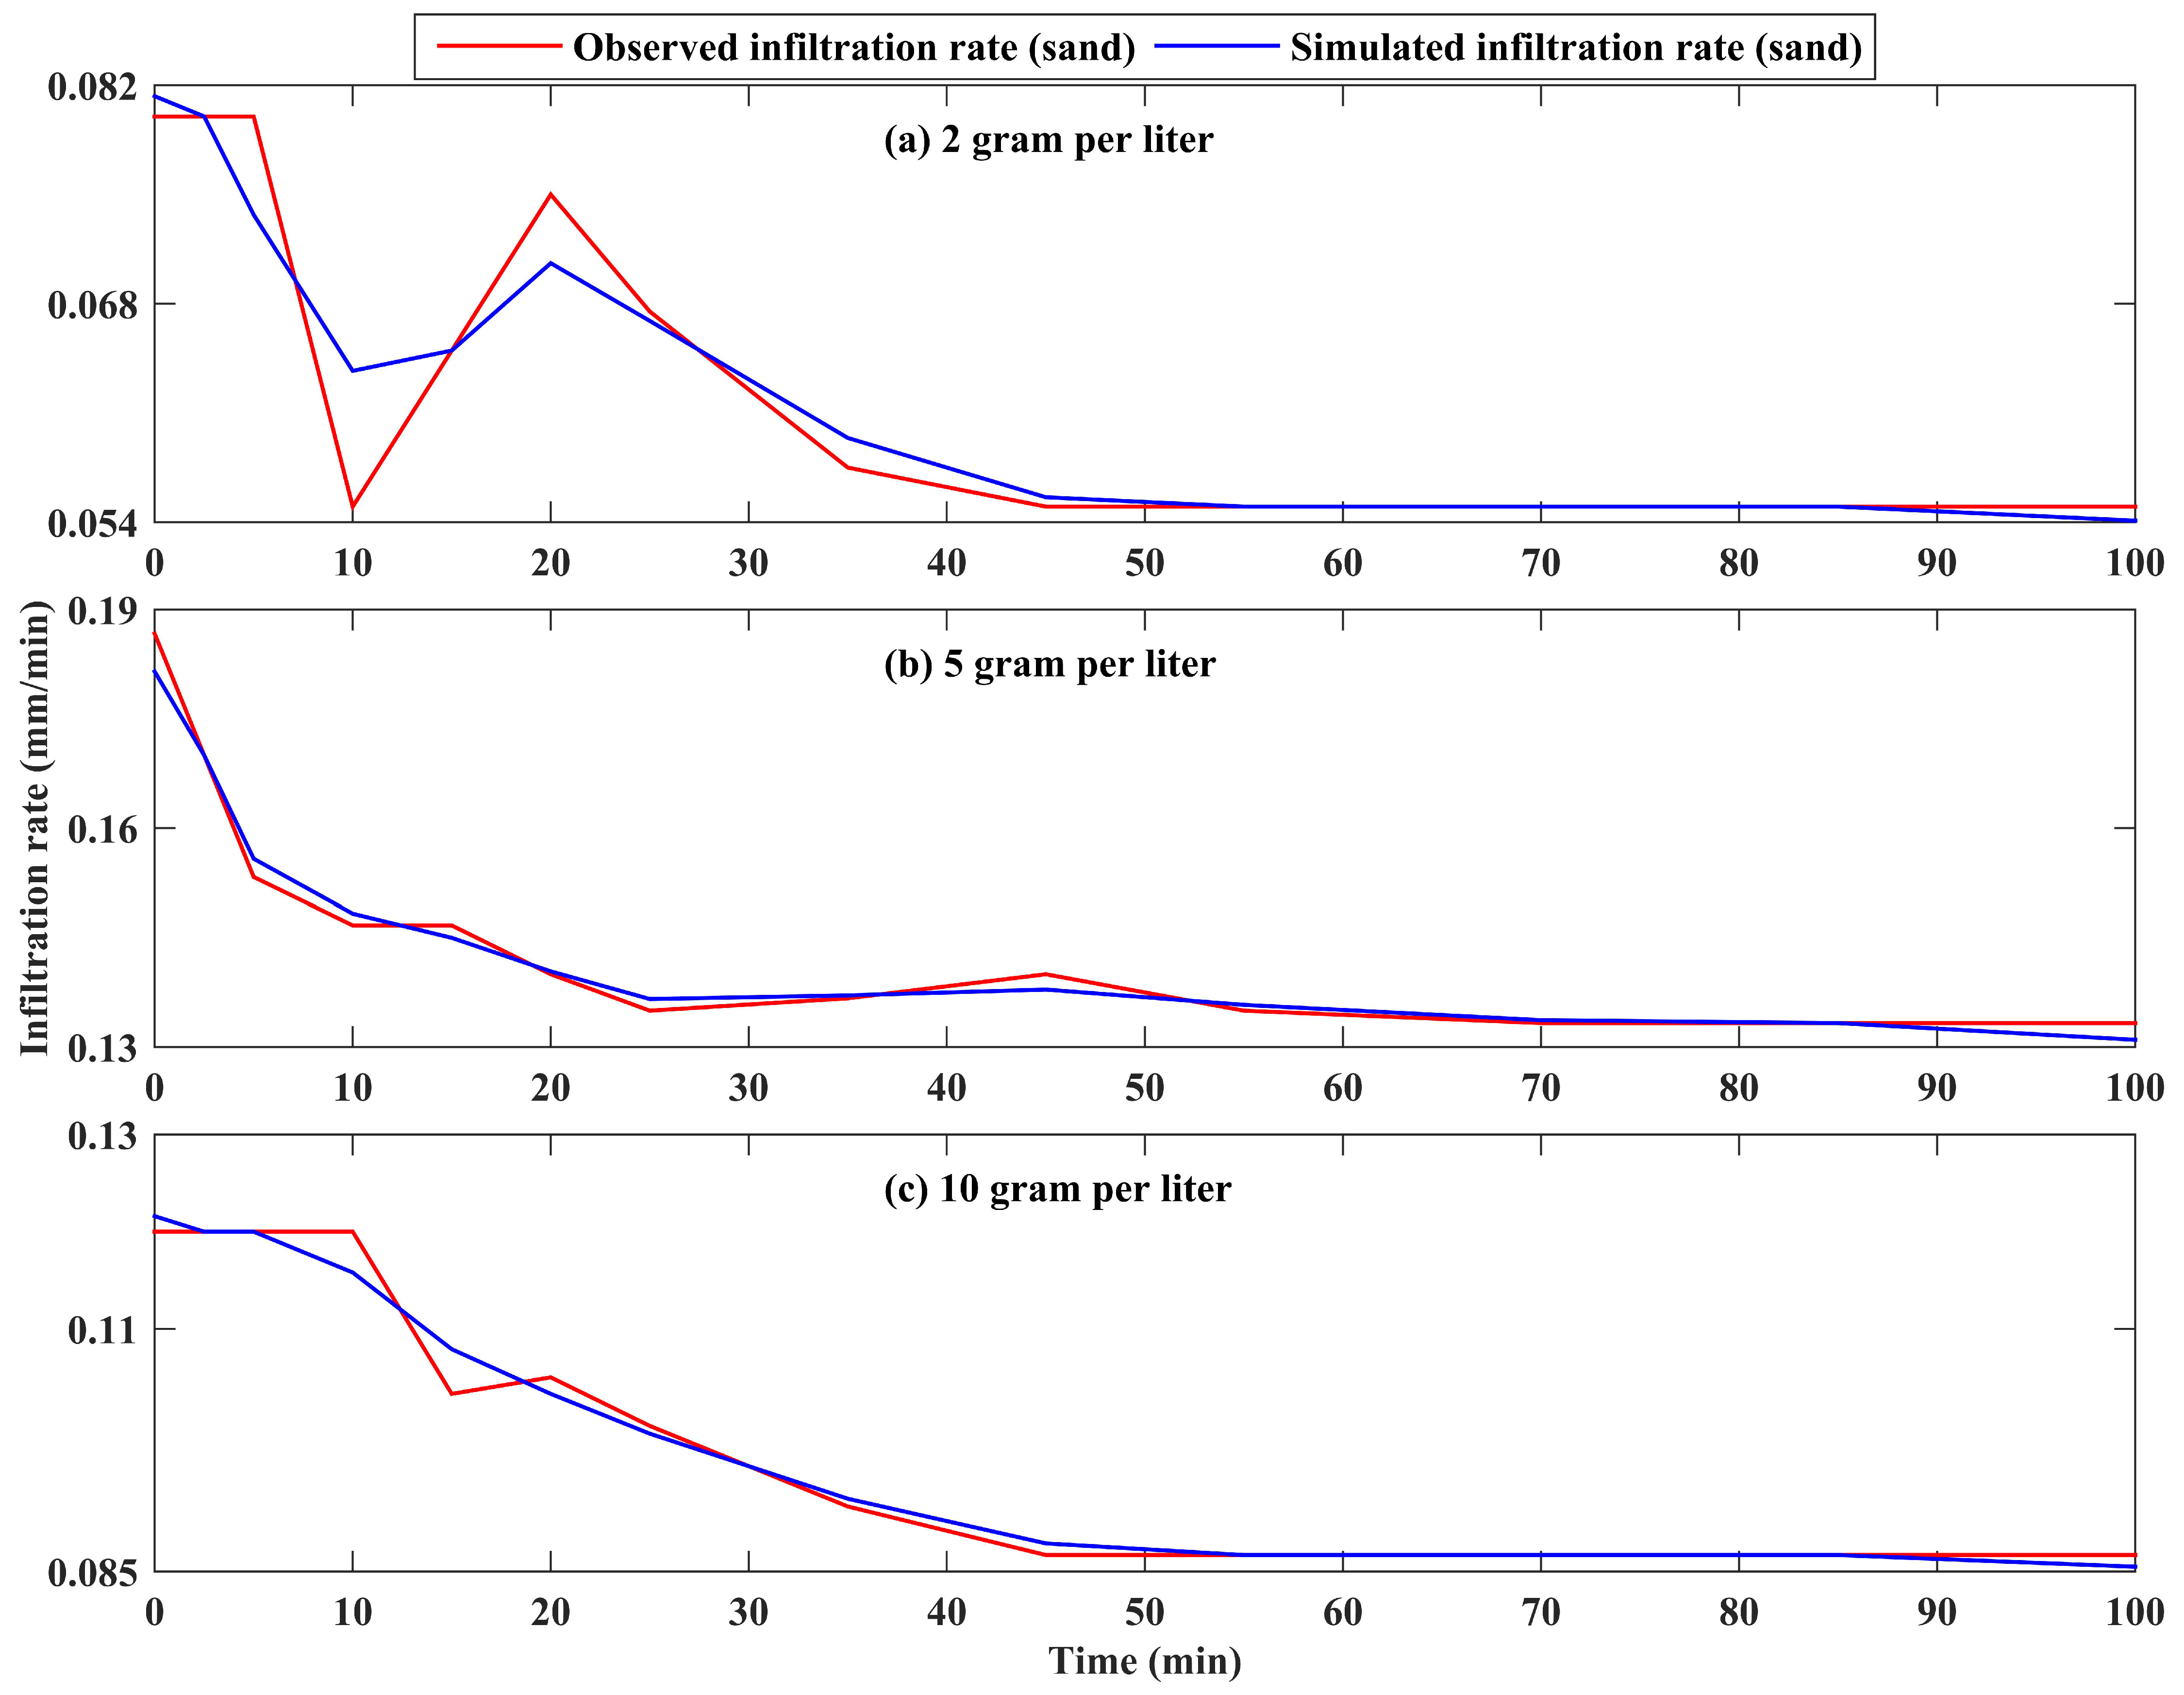
3.3.2. Comparison of Measured and Reconstructed Infiltration Rate

The reconstructed infiltration rates reproduced by SSA demonstrated high skill in reproducing the infiltration rate under the clean water treatment, particularly when there was a clear trend in falling the infiltration rate (e.g., in the initial times) (Figure 4). The discrepancy between the observed and reconstructed clean water infiltration was further scrutinized using two well-known goodness-of-fit metrics including R2 and NS (Table 6). The R2 of 0.99 and NS of 0.98 have proved a highly acceptable reconstruction performed using SSA.
Likewise, to appraise the competency and sensitivity of the propounded SSA data-driven model to the suspended solids, the reconstruction of the infiltration rate was carried out under three predefined sediment textures namely clay, silt and sand with three concentration levels including 2, 5 and 10 g/L (Figure 5, Figure 6 and Figure 7). Results showed that the reconstructed infiltration could satisfactorily imitate the observed infiltration under all of the treatments over the measured times. These obtained results were further supported by high R2 and NS computed for the aforementioned treatments. In this respect, the infiltration rates, reproduced under sand-sized suspended solids, with values of 0.97 and 0.95 for R2 and NS respectively, have represented the lowest average of discrepancy (averaged for three concentration levels); whereas the poorest performance of SSA has found for silt-sized suspended solids with an average of 0.91 for R2 and 0.81 of NS, which are still quite acceptable (>0.7) (Table 6).
Overall, the results show that as long as the infiltration rate resembled a parabolic function (Figure 4), the regular behaviour of the infiltration rate over the time, SSA could promisingly reconstruct the infiltration rate regardless of the solid sizes and concentration levels. Nevertheless, when there was a sudden break (increase or decrease), in the infiltration rate, the highest mismatch was then found out between the reconstructed and observed time series (e.g., Figure 6a, in time 10).

4. Discussion

The results indicated that the infiltration rates have been mostly affected by the clay-sized suspended solids in comparison with that of the silt- and sand-sized suspended solids. For instance, the smallest magnitude of the order of the infiltration rate was recognized for clay suspended solids regardless of the concentration levels (Figure 2). These findings were also confirmed by the effect size statistical comparisons drawn between particularly the infiltration rate measured under the clay and silt-sized suspended solids as well as the clean water (Table 4 and Table 5). The infiltration rate was found to be noticeably declined in the initial times, while the difference was found to be minor, especially from 5 min onwards (Figure 2). This can be explained by the fact that most portion of the suspended solids accumulated and settled down quickly within the initial times and correspondingly, the suspended loads were then diluted over the time. On the other hand, according to Stokes’ law, sedimentation of the particles takes place subject to the size of the particle; coarser solid grains (e.g., sand) deposit quicker and vice versa. From the time that each suspension (e.g., 2 g/L suspended solid clay-size) was added to the infiltrometer onwards, the concentration of the suspension was being quickly decreased because a large portion of the solids were settling down over the bed of the double-ring infiltrometers and consequently, the infiltration rate was substantially reduced in initial times of measurements.
Interestingly, compared with the concentration levels, the size of solids was found to be a determining factor in occurrence of the clogging process which is consistent with those obtained by Du, Ye and Zhang [21].
The findings of this study revealed that infiltration rate measured under clay-sized suspended sediments manifested the biggest difference rather than the clean water infiltration rate. Furthermore, we recognized that a higher clay-sized sediment concentration had led to a lower infiltrability with respect to Cohen’s d effect sizes −3.24, −3.81 and −5. 23 under 2, 5 and 10 g/L concentration levels respectively, although this does not sound to be changed linearly. Approximately, the same is true for silt-sized suspended sediments. whereas, we could not clearly discern an impact of sand-sized suspended sediments on the infiltrability, owing to that a general trend in terms of reducibility of the infiltration cannot be ascertained when the concentration is increased. This can be associated with preferential flow influences which might mask this effect. We also recognized that infiltrability was much more impacted by clay-sized suspended solids in comparison with that of silt-sized suspended solids (Table 5). Our findings have been corroborated by previous studies [6,10,11,21]. For instance, Goss and Jones [11] have found that clay-sized sediments, suspended in the recharge water and diverted from storms and/or floods into the MAR systems, can potentially enter into the bottom of MAR systems by as much as 18 cinches which will then markedly abate the infiltrability and permeability of the wall (e.g., in injection wells) and bottoms of such systems.
Regarding the sharp-observed rise in the infiltration rate in the initial times, it should be noted that there are different soil layers in terms of the grain size in this application site. As illustrated by a profile dug near to the measurement site (Figure 8), there is a clear and distinct transition from a loamy soil layer to sandy soil class at the depth 30 cm. Therefore, the noticeable and unnatural increase detected in the initial times of infiltration rate measurements (e.g., in 10 min for 2 and 5 g/L of clay-sized suspended solids, see Figure 2) can be attributed to this discernible soil type change. To that respect, when the recharging/infiltrating water arrives at this transition layer, a dramatic increase in infiltration rate will occur because the following soil layer composes of coarser grains and subsequently a higher effective porosity (a fraction of the total porosity that allows water to move freely through the soil medium under the gravitational force) is expected. Despite the fact that a substantial increase was detected in initial times, when even that coarser soil layer got saturated the infiltration rate was fallen parabolically.
Moreover, the higher infiltration rate observed for sand- and silt-sized suspended solids rather than the clean water (Figure 2) is subjected to the local soil heterogeneity occurred due to the different antecedent soil moisture content and soil texture and structure of the site, even though we tried to eliminate the local soil heterogeneity impacts by including 4 replications for each experiment/treatment. Above all, the preferential flow referring to the uneven and often rapid movement of water and solutes through porous media, typically soil, characterized by regions of enhanced flux such that a small fraction of media (such as wormholes, root holes, cracks) [60] may play an important role in this site to see such a higher infiltration rate for some of sand- and silt-sized suspended treatments.
The findings of this study are corroborated by other studies such as Wang, et al. [61] through which they found that physical clogging is heavily influenced by not only the suspended solid size but also by the unsaturated sediment sizes of MAR systems. Their findings confirmed where the sediments of the bed and walls of MAR systems are coarse sands, the physical clogging hampered. On the contrary, where the sediments of bed and walls are dominant with clay-sized grains, the physical mechanism progress was accelerated accordingly. In accordance with the findings of the current study, they identified that as the suspended solid size is smaller, the depths of settlement with the soil become deeper. For instance, suspended sediments with 0.050–0.0385 mm in diameter could cause clogging on the surface layer. Subsequently, they resulted in a reduction of infiltrability mostly within 1–10 cm depth of the soil. Conversely, suspended sediment sizes which are smaller than 0.0385 mm in diameter could penetrated as approximately as 2 cm which correspondingly a greater magnitude of order in terms of clogging was recognized in deeper soil layers of the MAR system. Their yielded results are consistent with obtained results of the present study through which we have ascertained that the suspended solid size in comparison with whose concentration levels played a more important role in clogging mechanism. Thus, an enhanced pre-treatment must be taken into account in order to minimize entering fine-sediments sizes, particularly clay-sized solids, into MAR systems. Also, the clogging by suspended solids with smaller diameters can bring into effect at higher rates rather than by those with large diameters as reported by Siriwardene, Deletic and Fletcher [20].
Ultimately, the results of applying SSA in reconstruction of the infiltration rate under a wide range of suspended solids and concentrations demonstrated that this data-driven approach can be a robust model to reproduce the infiltration rate under different scenarios which make it possible to be used for assisting the MAR system operators/technicians to forecast the acceptable level of the solid concentrations and sizes entering into the MAR systems. Afterwards, based on the knowledge obtained from SSA, the maintenance cost of these systems for keeping their functionality can be predicted and then required operations can be proposed accordingly.

5. Conclusions

The current study aimed at evaluating the suspended solid characteristics including the size and concentration on how the infiltration rate can be changed owing to the ensued physical clogging process. The statistical comparisons were made by means of Cohen’s d effect size measure. Moreover, the skill of Singular Spectrum Analysis, as a data-driven model, was appraised in reconstruction of infiltration rate with respective to clay-, silt- and sand-sized suspended sediments at four concentration levels including 0 (clean water), 2, 5 and 10 g/L.
Results highlighted that, compared with all treatments, clay-sized suspended solids could majorly trigger the physical clogging process; as a lower concentration of clay-sized suspended solids, that is, 2 g/L could more reduce the infiltration rate relative to that of obtained under a higher concentration of silt-sized suspended solids, that is, 5 g/L. We noticed that concentration level of clay-sized suspended sediments could non-linearly drive clogging process. Also, findings revealed that SSA could represent a high level of competency in reconstruction of the infiltration rate under a wide range of the predefined suspended solid sizes and concentrations.
Based on the assessment carried out on the reconstructed infiltration rate, under all treatments, against the observed/measured infiltration rate using NS and R2, SSA could well resemble the infiltration rate under all circumstances. With respect to the conditions through which the experiments performed using double-rings infiltrometers, we suggest considering these treatments in an actual infiltration basin, where a MAR system is established, in order to draw a comparison with findings achieved using the double-rings infiltrometers. Thus, we will be able to advance our understanding of scale effect on the physical clogging mechanism and correspondingly the infiltration reducibility which is anticipated.
Furthermore, since in addition to suspended solid size and concentration of the recharging water, the soil/sediment texture of a MAR site brings physical clogging into effect, considering the impacts of the sediment texture of the MAR site in accelerating or hindering the infiltration reducibility can be taken into account for future studies. Similarly, the independent influence of this parameter on occurrence of physical clogging can be differentiated from the two others.
According to the promising results obtained from using SSA for constructing these kinds of short time series, forecasting the infiltration/recharge rate by partitioning the time series into calibration/training and validation sets for a real MAR system, where supposedly a long time series of recharge rate is produced, will be undertaken for perspective research. Indeed, predictability of recharge reduction due to the clogging, irrespective of whose type, using this approach would be an asset for imposing timely measures to recover the system, while reducing the ensuing maintenance costs.

Supplementary Materials

The following are available online at https://www.mdpi.com/2306-5338/5/4/59/s1, Figure S1: 1st stage: eigenvectors (L = 12): infiltration rate under treatment 2 g/L clay-sized suspended solids (L = 6), Figure S2: 2nd stage: eigenvalues: The six eigenvalues calculated for infiltration rate under treatment 2 g/L clay-sized suspended solids (L = 6), Figure S3: 2nd stage: w-correlation matrix: infiltration rate under treatment 2 g/L clay-sized suspended solids (L = 6), Figure S4: 2nd stage: scatterplots for eigenvector pairs: infiltration rate under treatment 2 g/L clay-sized suspended solids (L = 6), Figure S5: Initial Reconstructed infiltration rate under treatment 2 g/L clay-sized suspended solids using each of eigenvectors (see Figure S1) Figure S6: Reconstructed infiltration rate of 2 g/L clay-sized suspended sediments (L = 6), Table S1: Infiltration characteristics computed for different concentration levels and suspended solid sizes.

Author Contributions

M.T.S.: Investigation, Mehtodology and Software. D.G.: Data curation, Formal analysis and Methodology.

Acknowledgments

The authors would like to thank Sadegh Bour, the technical staff of Water and Soil Engineering Lab in the Department of Watershed Management Engineering at Tarbiat Modares University (TMU), Iran, who greatly assisted the authors with the measurements of the soil sample properties. Also, we would like to extend our gratitude to two anonymous reviewers whose comments greatly improve the paper.

Conflicts of Interest

The authors declare no conflict of interest.

References

  1. Jury, W.A.; Vaux, H.J. The emerging global water crisis: managing scarcity and conflict between water users. In Advances in Agronomy; Academic Press: Cambridge, MA, USA, 2007; Volume 95, pp. 1–76. [Google Scholar]
  2. Dillon, P. Future management of aquifer recharge. Hydrogeol. J. 2005, 13, 313–316. [Google Scholar] [CrossRef]
  3. Martin, R. Clogging Issues Associated with Managed Aquifer Recharge Methods; IAH Commission on Managing Aquifer Recharge: Perth, Australia, 2013. [Google Scholar]
  4. Casanova, J.; Devau, N.; Pettenati, M. Managed aquifer recharge: an overview of issues and options. In Integrated Groundwater Management: Concepts, Approaches and Challenges; Jakeman, A.J., Barreteau, O., Hunt, R.J., Rinaudo, J.-D., Ross, A., Eds.; Springer International Publishing: Cham, Switzerland, 2016; pp. 413–434. [Google Scholar]
  5. Schuh, W.M. Seasonal variation of clogging of an artificial recharge basin in a northern climate. J. Hydrol. 1990, 121, 193–215. [Google Scholar] [CrossRef]
  6. Bouwer, H. Artificial recharge of groundwater: Hydrogeology and engineering. Hydrogeol. J. 2002, 10, 121–142. [Google Scholar] [CrossRef]
  7. Maddock, I. Groundwater in the environment: An introduction, by Paul L. Younger, 2007. Blackwell: London, 390 pages. ISBN 1-4051-2143-2. River Res. Appl. 2008, 24, 1377. [Google Scholar] [CrossRef]
  8. Baveye, P.; Vandevivere, P.; Hoyle, B.L.; DeLeo, P.C.; de Lozada, D.S. Environmental impact and mechanisms of the biological clogging of saturated soils and aquifer materials. Crit. Rev. Environ. Sci. Technol. 1998, 28, 123–191. [Google Scholar] [CrossRef]
  9. Vetter, A.; Mangelsdorf, K.; Wolfgramm, M.; Rauppach, K.; Schettler, G.; Vieth-Hillebrand, A. Variations in fluid chemistry and membrane phospholipid fatty acid composition of the bacterial community in a cold storage groundwater system during clogging events. Appl. Geochem. 2012, 27, 1278–1290. [Google Scholar] [CrossRef] [Green Version]
  10. Goss, D.W.; Smith, S.J.; Stewart, B.A.; Jones, O.R. Fate of suspended sediment during basin recharge. Water Resour. Res. 1973, 9, 668–675. [Google Scholar] [CrossRef]
  11. Goss, D.W.; Jones, O.R. Movement and accumulation of suspended sediment during basin recharge. AAPG Bull. 1973, 57, 468–480. [Google Scholar]
  12. Katznelson, R. Clogging of groundwater recharge basins by cyanobacterial mats. FEMS Microbiol. Lett. 1989, 62, 231–242. [Google Scholar] [CrossRef]
  13. Dillon, P.; Vanderzalm, J.; Page, D.; Barry, K.; Gonzalez, D.; Muthukaruppan, M.; Hudson, M. Analysis of ASR clogging investigations at three Australian ASR sites in a Bayesian context. Water 2016, 8, 442. [Google Scholar] [CrossRef]
  14. Page, D.; Miotliński, K.; Dillon, P.; Taylor, R.; Wakelin, S.; Levett, K.; Barry, K.; Pavelic, P. Water quality requirements for sustaining aquifer storage and recovery operations in a low permeability fractured rock aquifer. J. Environ. Manag. 2011, 92, 2410–2418. [Google Scholar] [CrossRef] [PubMed]
  15. Page, D.; Vanderzalm, J.; Miotliński, K.; Barry, K.; Dillon, P.; Lawrie, K.; Brodie, R.S. Determining treatment requirements for turbid river water to avoid clogging of aquifer storage and recovery wells in siliceous alluvium. Water Res. 2014, 66, 99–110. [Google Scholar] [CrossRef] [PubMed]
  16. Mahesha, A.; Lakshmikant, P. Saltwater Intrusion in Coastal Aquifers Subjected to Freshwater Pumping. J. Hydrol. Eng. 2014, 19, 448–456. [Google Scholar] [CrossRef]
  17. Melloul, A.J.; Goldenberg, L.C. Monitoring of seawater intrusion in coastal aquifers: basics and local concerns. J. Environ. Manag. 1997, 51, 73–86. [Google Scholar] [CrossRef]
  18. Sebben, M.L.; Werner, A.D.; Graf, T. Seawater intrusion in fractured coastal aquifers: A preliminary numerical investigation using a fractured Henry problem. Adv. Water Resour. 2015, 85, 93–108. [Google Scholar] [CrossRef]
  19. Masciopinto, C. Management of aquifer recharge in Lebanon by removing seawater intrusion from coastal aquifers. J. Environ. Manag. 2013, 130, 306–312. [Google Scholar] [CrossRef] [PubMed]
  20. Siriwardene, N.R.; Deletic, A.; Fletcher, T.D. Clogging of stormwater gravel infiltration systems and filters: Insights from a laboratory study. Water Res. 2007, 41, 1433–1440. [Google Scholar] [CrossRef] [PubMed]
  21. Du, X.; Ye, X.; Zhang, X. Clogging of saturated porous media by silt-sized suspended solids under varying physical conditions during managed aquifer recharge. Hydrol. Process. 2018, 32, 2254–2262. [Google Scholar] [CrossRef]
  22. Loève, M. Probability Theory, 4th ed.; Springer-Verlag: New York, NY, USA, 1977. [Google Scholar]
  23. Golyandina, N.; Nekrutkin, V.V.; Zhigljavsky, A.A. Analysis of Time Series Structure: SSA and Related Techniques; Chapman & Hall/CRC: Boca Raton, FL, USA, 2001; p. xii. 305p. [Google Scholar]
  24. Rodrigues, P.C.; de Carvalho, M. Spectral modeling of time series with missing data. Appl. Math. Model. 2013, 37, 4676–4684. [Google Scholar] [CrossRef]
  25. Golyandina, N.; Korobeynikov, A. Basic Singular Spectrum Analysis and forecasting with R. Comput. Stat. Data Anal. 2014, 71, 934–954. [Google Scholar] [CrossRef] [Green Version]
  26. Vautard, R.; Ghil, M. Singular spectrum analysis in nonlinear dynamics, with applications to paleoclimatic time-series. Phys. D 1989, 35, 395–424. [Google Scholar] [CrossRef]
  27. Schoellhamer, D.H. Singular spectrum analysis for time series with missing data. Geophys. Res. Lett. 2001, 28, 3187–3190. [Google Scholar] [CrossRef] [Green Version]
  28. Golyandina, N.; Zhigljavsky, A.A. Singular Spectrum Analysis for Time Series; Springer: Heidelberg, Germany, 2013; p. vii. 119p. [Google Scholar]
  29. Shen, Y.; Peng, F.; Li, B. Improved singular spectrum analysis for time series with missing data. Nonlinear Process. Geophys. 2015, 22, 371–376. [Google Scholar] [CrossRef]
  30. Agac, K.; Baydaroglu, Ö.; Kocak, K. Reconstruction of gaps in flow series using singular spectrum analysis (SSA) and multi-channel SSA (M-SSA). In Proceedings of the 27th Conference on Weather Analysis and Forecasting/23rd Conference on Numerical Weather Prediction, Chicago, IL, USA, 28 June–3 July 2015. [Google Scholar]
  31. Kondrashov, D.; Feliks, Y.; Ghil, M. Oscillatory modes of extended Nile River records (AD 622-1922). Geophys. Res. Lett. 2005, 32, L10702. [Google Scholar] [CrossRef]
  32. Hansen, B.; Noguchi, K. Improved short-term point and interval forecasts of the daily maximum tropospheric ozone levels via singular spectrum analysis. Environmetrics 2017, 28, e2479. [Google Scholar] [CrossRef]
  33. Moreno, S.R.; dos Santos Coelho, L. Wind speed forecasting approach based on singular spectrum analysis and adaptive neuro fuzzy inference system. Renew. Energy 2018, 126, 736–754. [Google Scholar] [CrossRef]
  34. Golshan, M.; Colombani, N.; Mastrocicco, M. Assessing aquifer salinization with multiple techniques along the southern caspian sea shore (Iran). Water 2018, 10, 348. [Google Scholar] [CrossRef]
  35. Diamond, J.; Shanley, T. Infiltration rate assessment of some major soils. Irish Geogr. 2003, 36, 32–46. [Google Scholar] [CrossRef] [Green Version]
  36. Sidiras, N.; Roth, C.H. Infiltration measurements with double-ring infiltrometers and a rainfall simulator under different surface conditions on an Oxisol. Soil Tillage Res. 1987, 9, 161–168. [Google Scholar] [CrossRef]
  37. Bean, E.; Dukes, M. Evaluation of infiltration basin performance on coarse soils. J. Hydrol. Eng. 2016, 21. [Google Scholar] [CrossRef]
  38. ASTM. Standard Test Method for Sieve Analysis of Fine and Coarse Aggregates; ASTM: West Conshohocken, PA, USA, 2014. [Google Scholar]
  39. Sadeghi, S.H.; Kiani-Harchegani, M.; Younesi, H. Suspended sediment concentration and particle size distribution, and their relationship with heavy metal content. J. Earth Syst. Sci. 2012, 121, 63–71. [Google Scholar] [CrossRef]
  40. Sullivan, G.M.; Feinn, R. Using effect size—Or why the p value is not enough. J. Grad. Med. Educ. 2012, 4, 279–282. [Google Scholar] [CrossRef] [PubMed]
  41. Carver, R.P. The case against statistical significance testing, revisited. J. Exp. Educ. 1993, 61, 287–292. [Google Scholar] [CrossRef]
  42. Hojat, M.; Xu, G. A visitor’s guide to effect sizes—Statistical significance versus practical (clinical) importance of research findings. Adv. Health Sci. Educ. Theory Pract. 2004, 9, 241–249. [Google Scholar] [CrossRef] [PubMed]
  43. Amrhein, V.; Korner-Nievergelt, F.; Roth, T. The earth is flat (p > 0.05): Significance thresholds and the crisis of unreplicable research. PeerJ 2017, 5, e3544. [Google Scholar] [CrossRef] [PubMed]
  44. Lakens, D. Calculating and reporting effect sizes to facilitate cumulative science: A practical primer for t-tests and ANOVAs. Front. Psychol. 2013, 4, 863. [Google Scholar] [CrossRef] [PubMed]
  45. Cohen, J. Chapter 3—The significance of a product moment rs. In Statistical Power Analysis for the Behavioral Sciences; Cohen, J., Ed.; Academic Press: Cambridge, MA, USA, 1977; pp. 75–107. [Google Scholar]
  46. Sawilowsky, S. New Effect Size Rules of Thumb. J. Mod. Appl. Stat. Methods 2009, 8, 597–599. [Google Scholar] [CrossRef] [Green Version]
  47. Khan, M.A.R.; Poskitt, D.S. A note on window length selection in singular spectrum analysis. Aust. N. Z. J. Stat. 2013, 55, 87–108. [Google Scholar] [CrossRef]
  48. Fotovatikhah, F.; Herrera, M.; Shamshirband, S.; Chau, K.-W.; Faizollahzadeh Ardabili, S.; Piran, M.J. Survey of computational intelligence as basis to big flood management: Challenges, research directions and future work. Eng. Appl. Comput. Fluid Mech. 2018, 12, 411–437. [Google Scholar] [CrossRef]
  49. Wang, W.-C.; Xu, D.-M.; Chau, K.-W.; Chen, S. Improved annual rainfall-runoff forecasting using PSO-SVM model based on EEMD. J. Hydroinformatics 2013, 15, 1377–1390. [Google Scholar] [CrossRef]
  50. Chau, K.-W. Use of meta-heuristic techniques in rainfall-runoff modelling. Water 2017, 9, 186. [Google Scholar] [CrossRef]
  51. Taormina, R.; Chau, K.-W.; Sivakumar, B. Neural network river forecasting through baseflow separation and binary-coded swarm optimization. J. Hydrol. 2015, 529, 1788–1797. [Google Scholar] [CrossRef]
  52. Wu, C.L.; Chau, K.W. Rainfall–runoff modeling using artificial neural network coupled with singular spectrum analysis. J. Hydrol. 2011, 399, 394–409. [Google Scholar] [CrossRef] [Green Version]
  53. Cheng, C.-T.; Wu, X.-Y.; Chau, K.W. Multiple criteria rainfall–runoff model calibration using a parallel genetic algorithm in a cluster of computers/Calage multi-critères en modélisation pluie–débit par un algorithme génétique parallèle mis en œuvre par une grappe d’ordinateurs. Hydrol. Sci. J. 2005, 50, 1087. [Google Scholar] [CrossRef]
  54. Holloway, D.M.; Harrison, L.G.; Kosman, D.; Vanario-Alonso, C.E.; Spirov, A.V. Analysis of pattern precision shows that Drosophila segmentation develops substantial independence from gradients of maternal gene products. Dev. Dyn. 2006, 235, 2949–2960. [Google Scholar] [CrossRef] [PubMed]
  55. Spellman, P.T.; Sherlock, G.; Zhang, M.Q.; Iyer, V.R.; Anders, K.; Eisen, M.B.; Brown, P.O.; Botstein, D.; Futcher, B. Comprehensive identification of cell cycle–regulated genes of the yeast saccharomyces cerevisiae by microarray hybridization. Mol. Biol. Cell 1998, 9, 3273–3297. [Google Scholar] [CrossRef] [PubMed]
  56. Hassani, H.; Heravi, S.; Zhigljavsky, A. Forecasting European industrial production with singular spectrum analysis. Int. J. Forecast. 2009, 25, 103–118. [Google Scholar] [CrossRef]
  57. Golyandina, N. On the choice of parameters in Singular Spectrum Analysis and related subspace-based methods. Stat. Its Interface 2010, 3, 259–279. [Google Scholar] [CrossRef]
  58. Nash, J.E.; Sutcliffe, J.V. River flow forecasting through conceptual models Part I—A discussion of principles. J. Hydrol. 1970, 10, 282–290. [Google Scholar] [CrossRef]
  59. Legates, D.R.; McCabe, G.J. Evaluating the use of “goodness-of-fit” Measures in hydrologic and hydroclimatic model validation. Water Resour. Res. 1999, 35, 233–241. [Google Scholar] [CrossRef] [Green Version]
  60. Gerke, H.H. Preferential flow descriptions for structured soils. J. Plant Nutr. Soil Sci. 2006, 169, 382–400. [Google Scholar] [CrossRef]
  61. Wang, Z.; Du, X.; Yang, Y.; Ye, X. Surface clogging process modeling of suspended solids during urban stormwater aquifer recharge. J. Environ. Sci. (China) 2012, 24, 1418–1424. [Google Scholar] [CrossRef]
Figure 1. Geographical position of the application site on Iran (a) and Mazandaran province (b) maps accompanied with a close-up view of the site where the double-rings infiltrometers were installed (c) as well as a cross-section of a double-rings infiltrometer adapted from Diamond and Shanley [35] (d).
Hydrology 05 00059 g001
Figure 2. Infiltration rate plotted under different suspended solid sizes and concentrations.
Hydrology 05 00059 g002
Figure 3. Comparison of infiltration rate under each of suspended solids categories (clay, silt and sand) and concentration level (0, 2, 5 and 10 g/L).
Hydrology 05 00059 g003
Figure 4. Comparison of the infiltration rate observed for the clean water (0 g/L) with that of the reconstructed using SSA.
Hydrology 05 00059 g004
Figure 5. Comparison of the infiltration rate observed for the clean water (0 g/L) with that of the reconstructed using SSA for clay-sized suspended solids under three concentration levels 2, 5 and 10 g/L.
Hydrology 05 00059 g005
Figure 6. Comparison of the infiltration rate observed for the clean water (0 g/L) with that of the reconstructed using SSA for clay-sized suspended solids under three concentration levels 2, 5 and 10 g/L.
Hydrology 05 00059 g006
Figure 7. Comparison of the infiltration rate observed for the clean water (0 g/L) with that of the reconstructed using SSA for clay-sized suspended solids under three concentration levels 2, 5 and 10 g/L.
Hydrology 05 00059 g007
Figure 8. Transition of soil texture in a natural profile located near the site. Note the position of the red arrow where the soil texture transition takes place.
Hydrology 05 00059 g008
Table 1. Soil and topographic characteristics influencing on the soil infiltrability.
Slope (Percent)Dominant Soil Texture ClassVolumetric Soil Water Content (Percent)Gravimetric Soil Water Content (Percent)Porosity (Percent)Average of Matric Potential (Centibar)Bulk Density (g/cm3)
5Sandy loamy32.0428.4621.93.511.12
Table 2. The sediment constituents used to create the suspended solids.
Size of Suspended SolidsClaySiltSand
Clay fraction (percent)5280
Silt fraction(percent)12540
Sand fraction (percent)3638100
Table 3. The magnitude descriptors of Cohen’s d effect size measure.
Effect Size DescriptionCohen’s d
Very small0.01
Small0.20
Medium0.50
Large0.80
Very large1.20
Huge≥2.00
Table 4. Comparison of clean water infiltration rate with clay-, sand- and silt-sized suspended solids at 2, 5 and 10 g/L concentration levels using Cohen’s d effect size measure.
Concentration2 g/L5 g/L10 g/L
TreatmentClay vs. CWSilt vs. CWSand vs. CWClay vs. CWSilt vs. CWSand vs. CWClay vs. CWSilt vs. CWSand vs. CW
Cohen’s d−3.240.72−3.05−3.81−2.809.58−5.23−3.310.51
DescriptionHugeMediumHugeHugeHugeHugeHugeHugeMedium
Note that negative values denote a smaller magnitude of infiltration rate relative to that of clean water (0 g/L) and vice versa.
Table 5. Comparison of infiltration rate of clay-sized suspended solids with that of silt-sized suspended solids at 2, 5 and 10 g/L concentration levels using Cohen’s d effect size measure.
Concentration and Treatment2 g/L Clay vs.
2 g/L Silt
2 g/L Clay vs.
5 g/L Silt
5 g/L Clay vs.
10 g/L Silt
10 g/L Clay vs.
10 g/L Silt
Cohen’s d−3.94−1.911.59−1.23
DescriptionHugeVery largeVery largeVery large
Note that negative values denote a smaller magnitude of clay-sized suspended solids infiltration rate relative to that of silt-sized suspended solids and vice versa.
Table 6. Goodness-of-fit, represented by R2 and NS, calculated on basis of the observed and reconstructed infiltration rate under the defined treatments.
Suspended Solid SizeConcentration (g/L)R2NS
Clean water/NA00.990.98
Clay20.960.87
50.970.91
100.980.95
Silty20.850.71
50.930.81
100.950.91
Sand20.950.90
50.990.98
100.990.98

