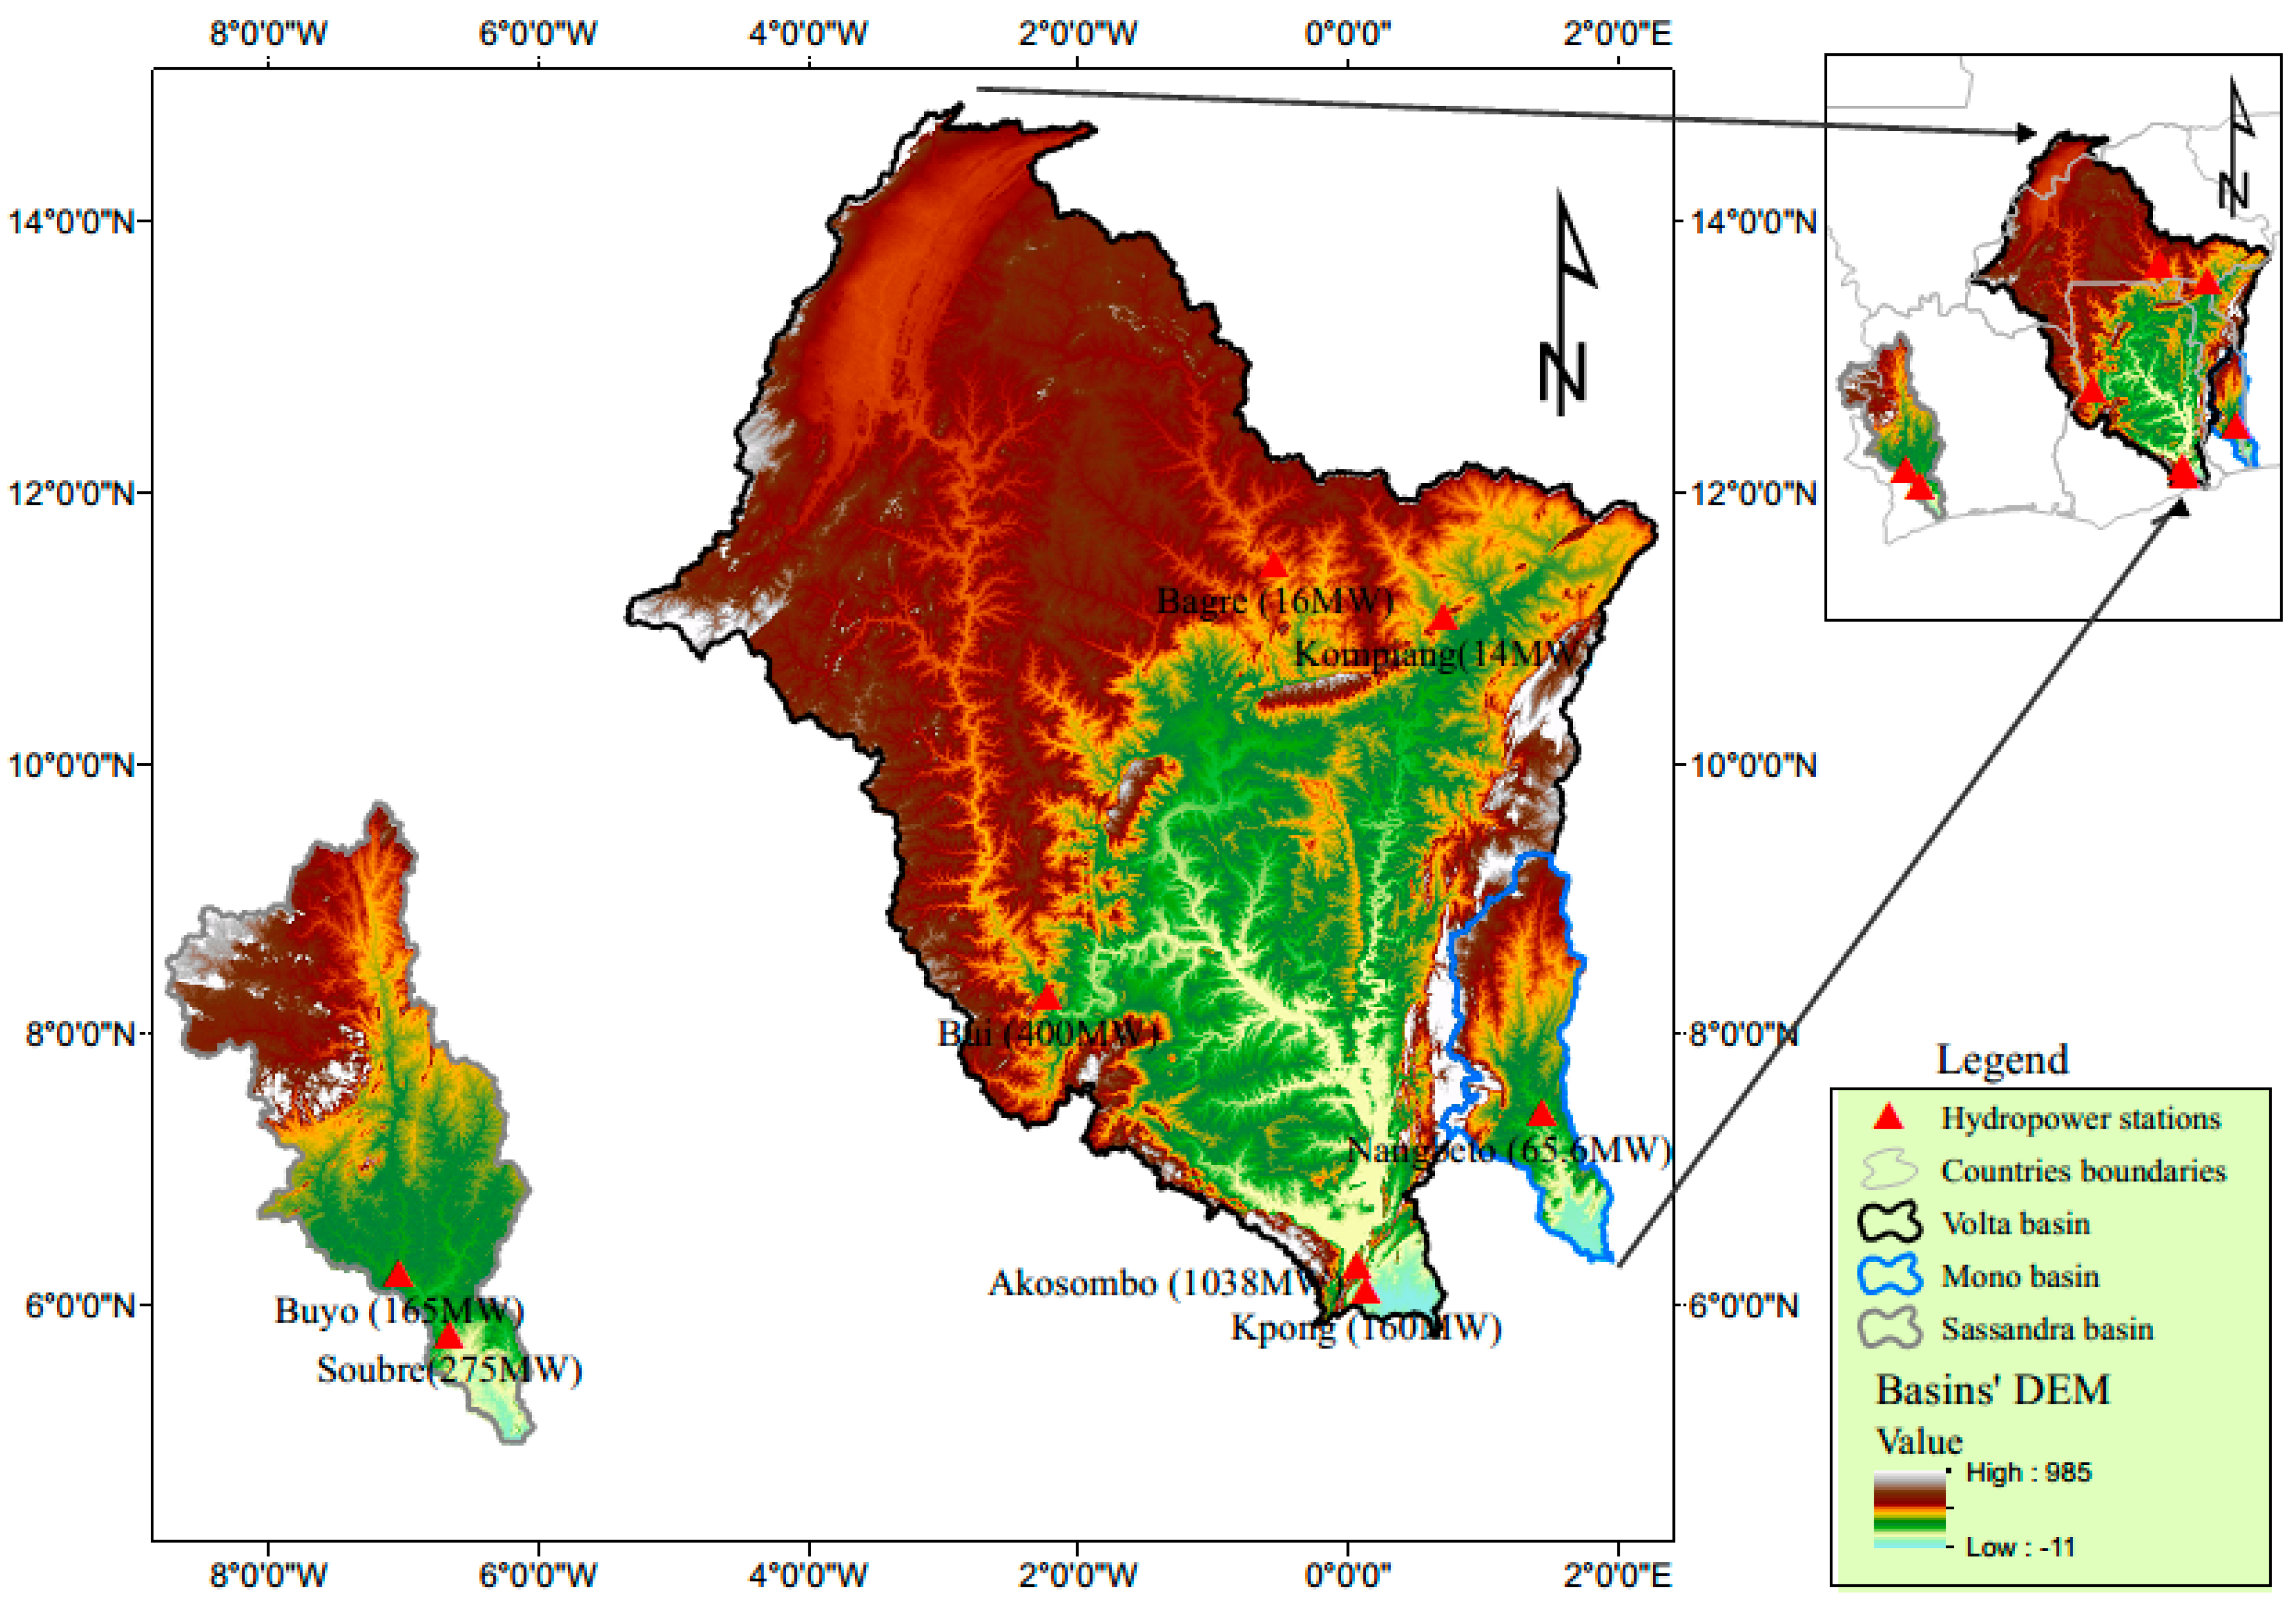
4.1. Spatio-Temporal Changes of Land Use and Land Cover
The
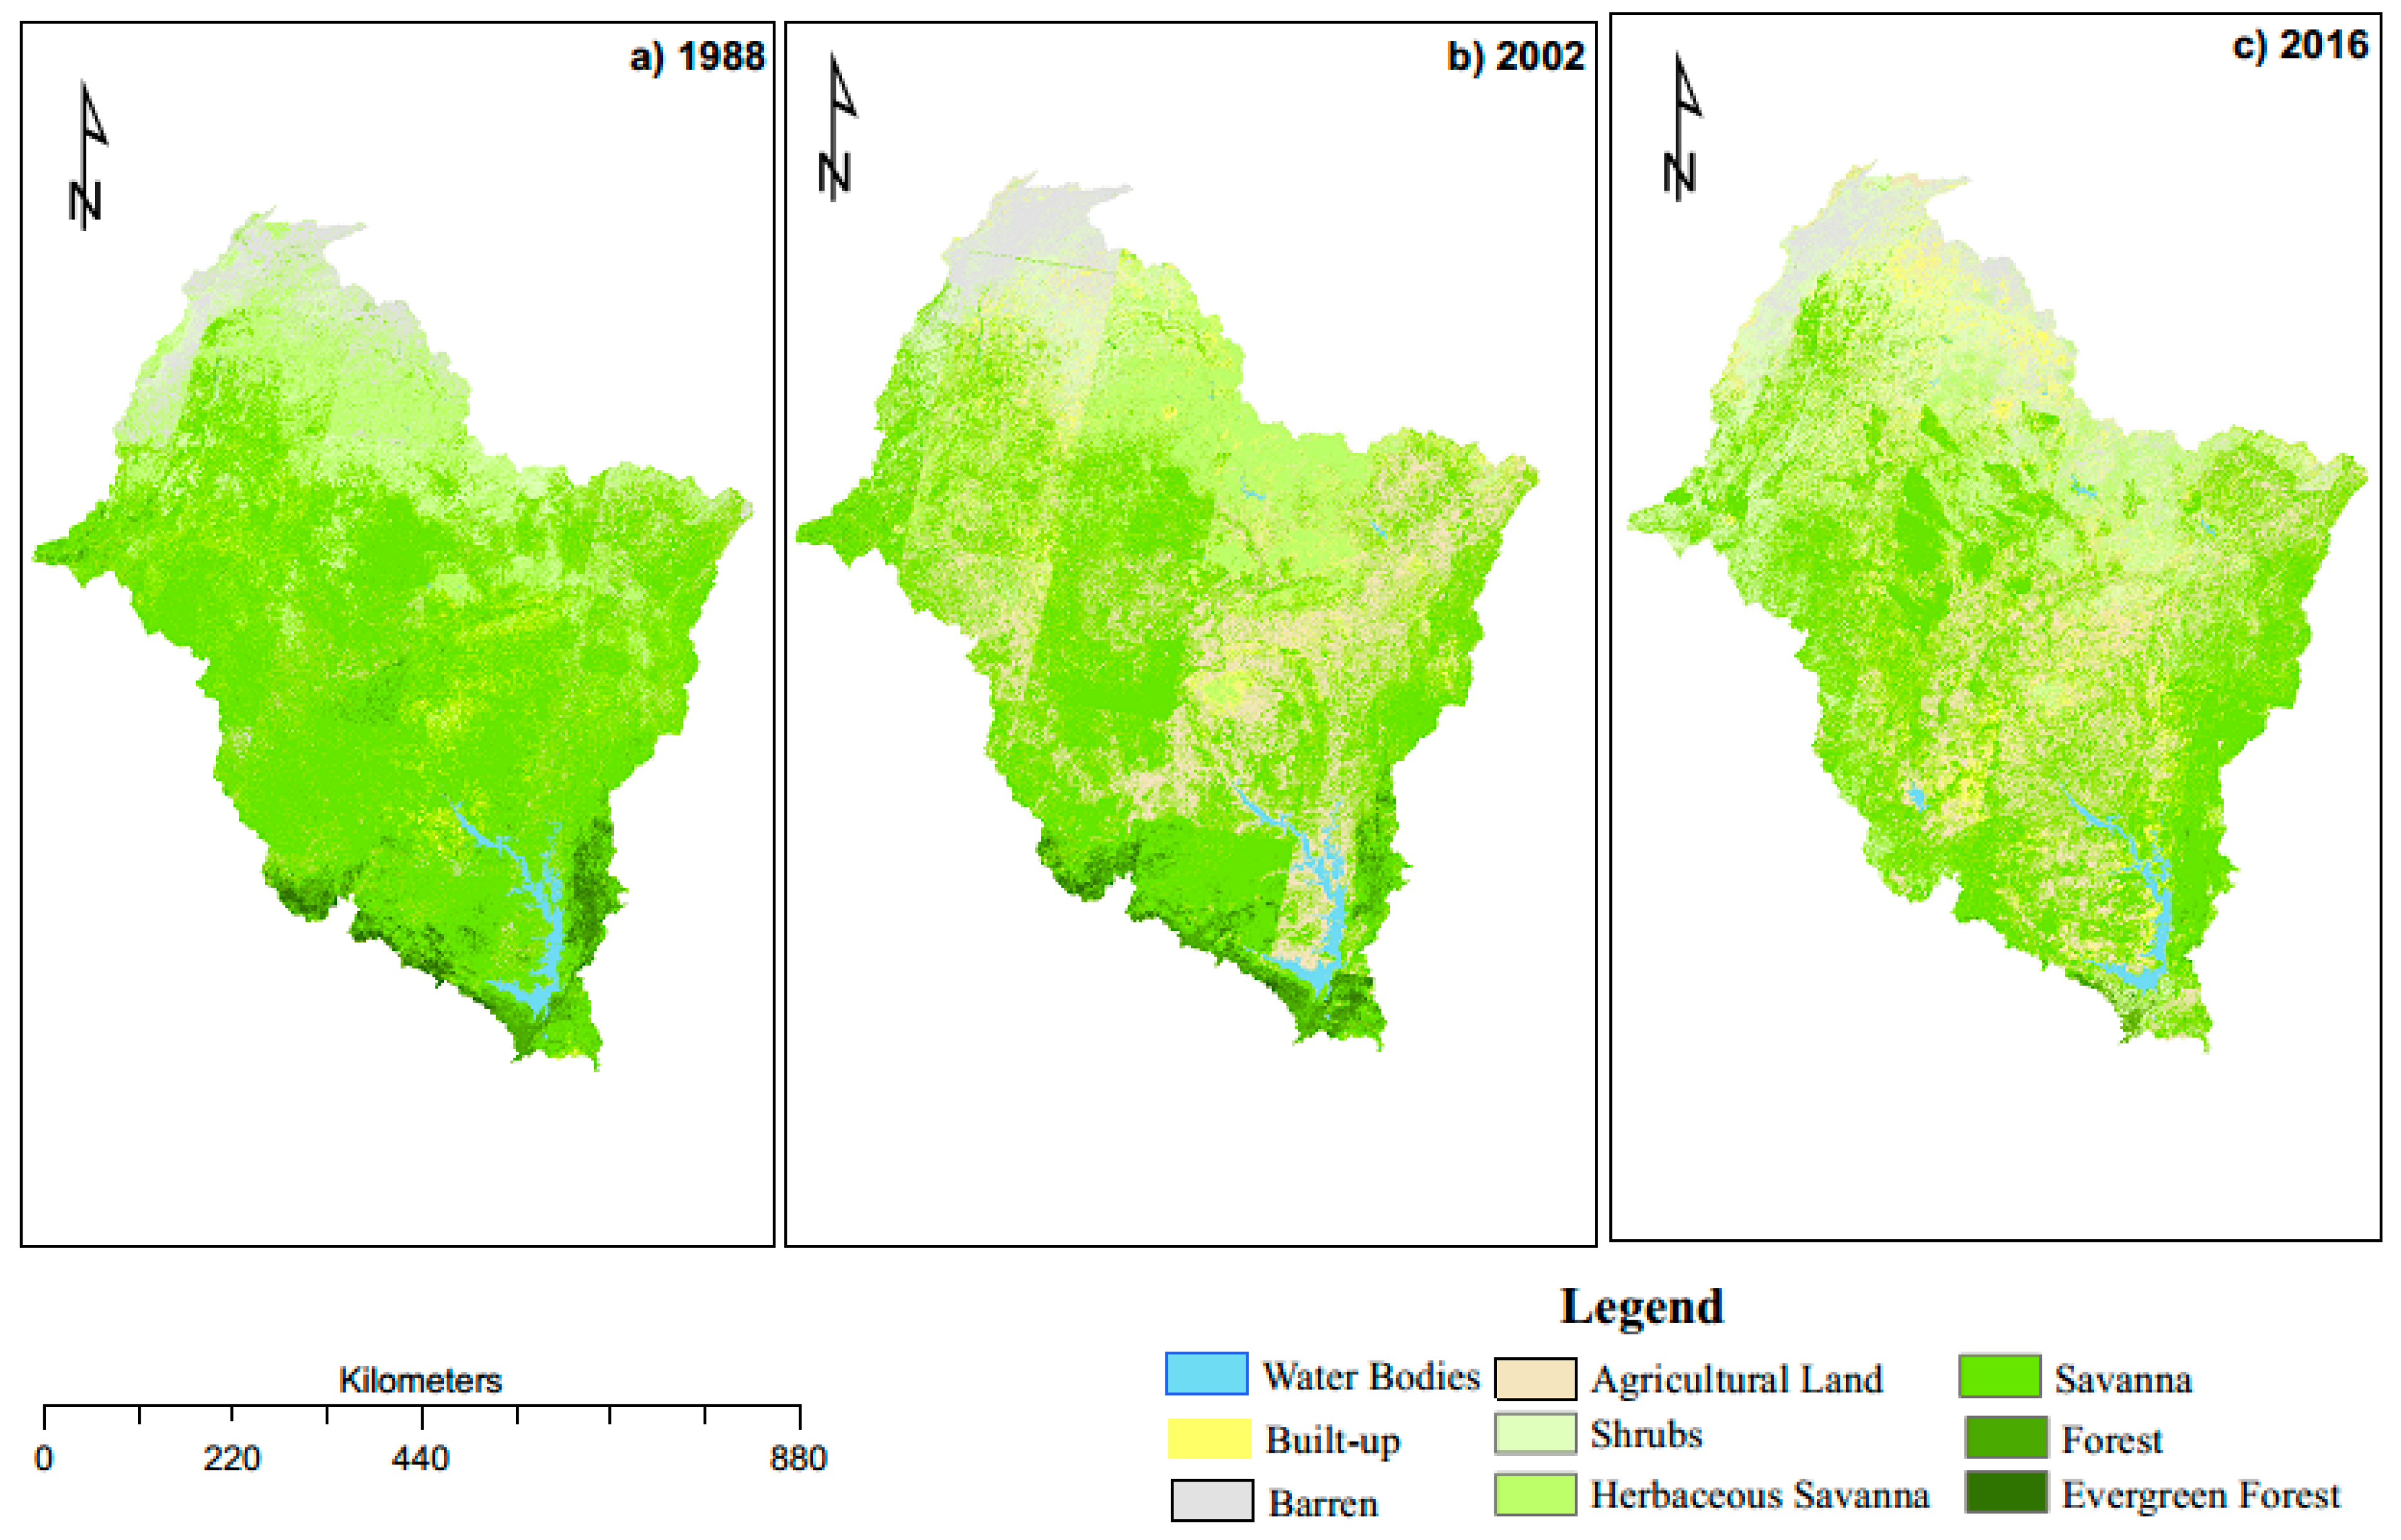
Figure 2,
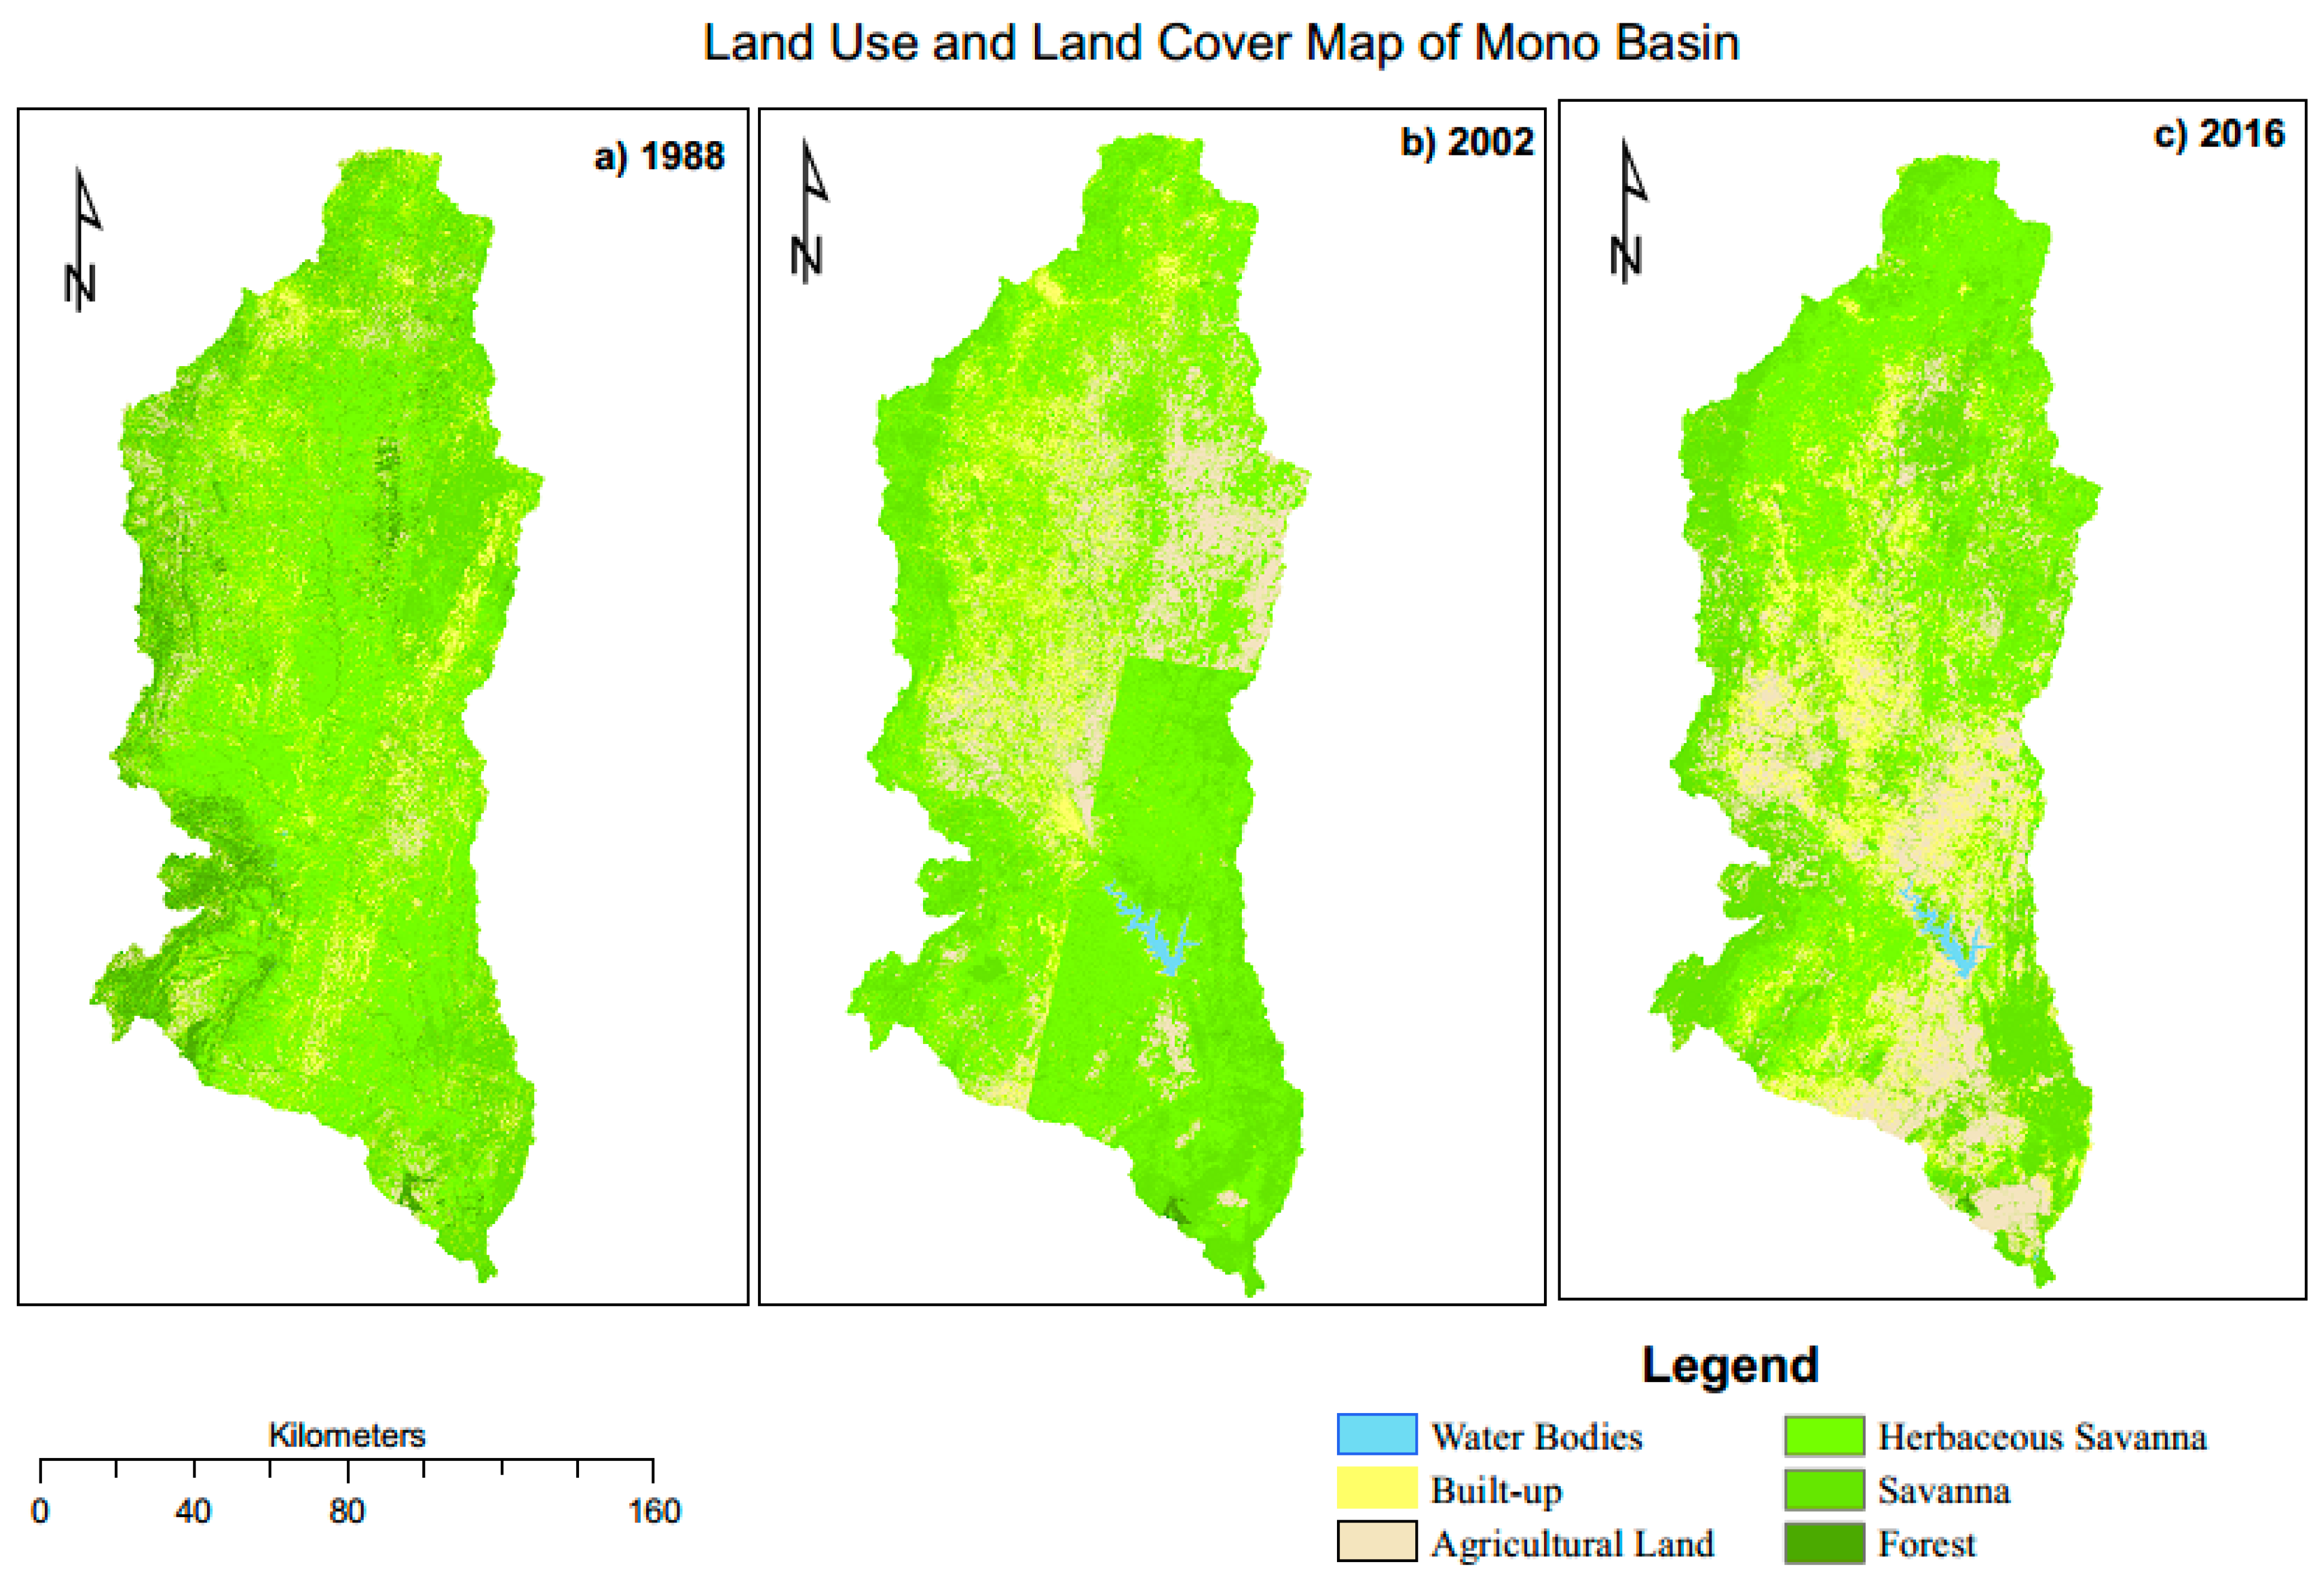
Figure 3 and
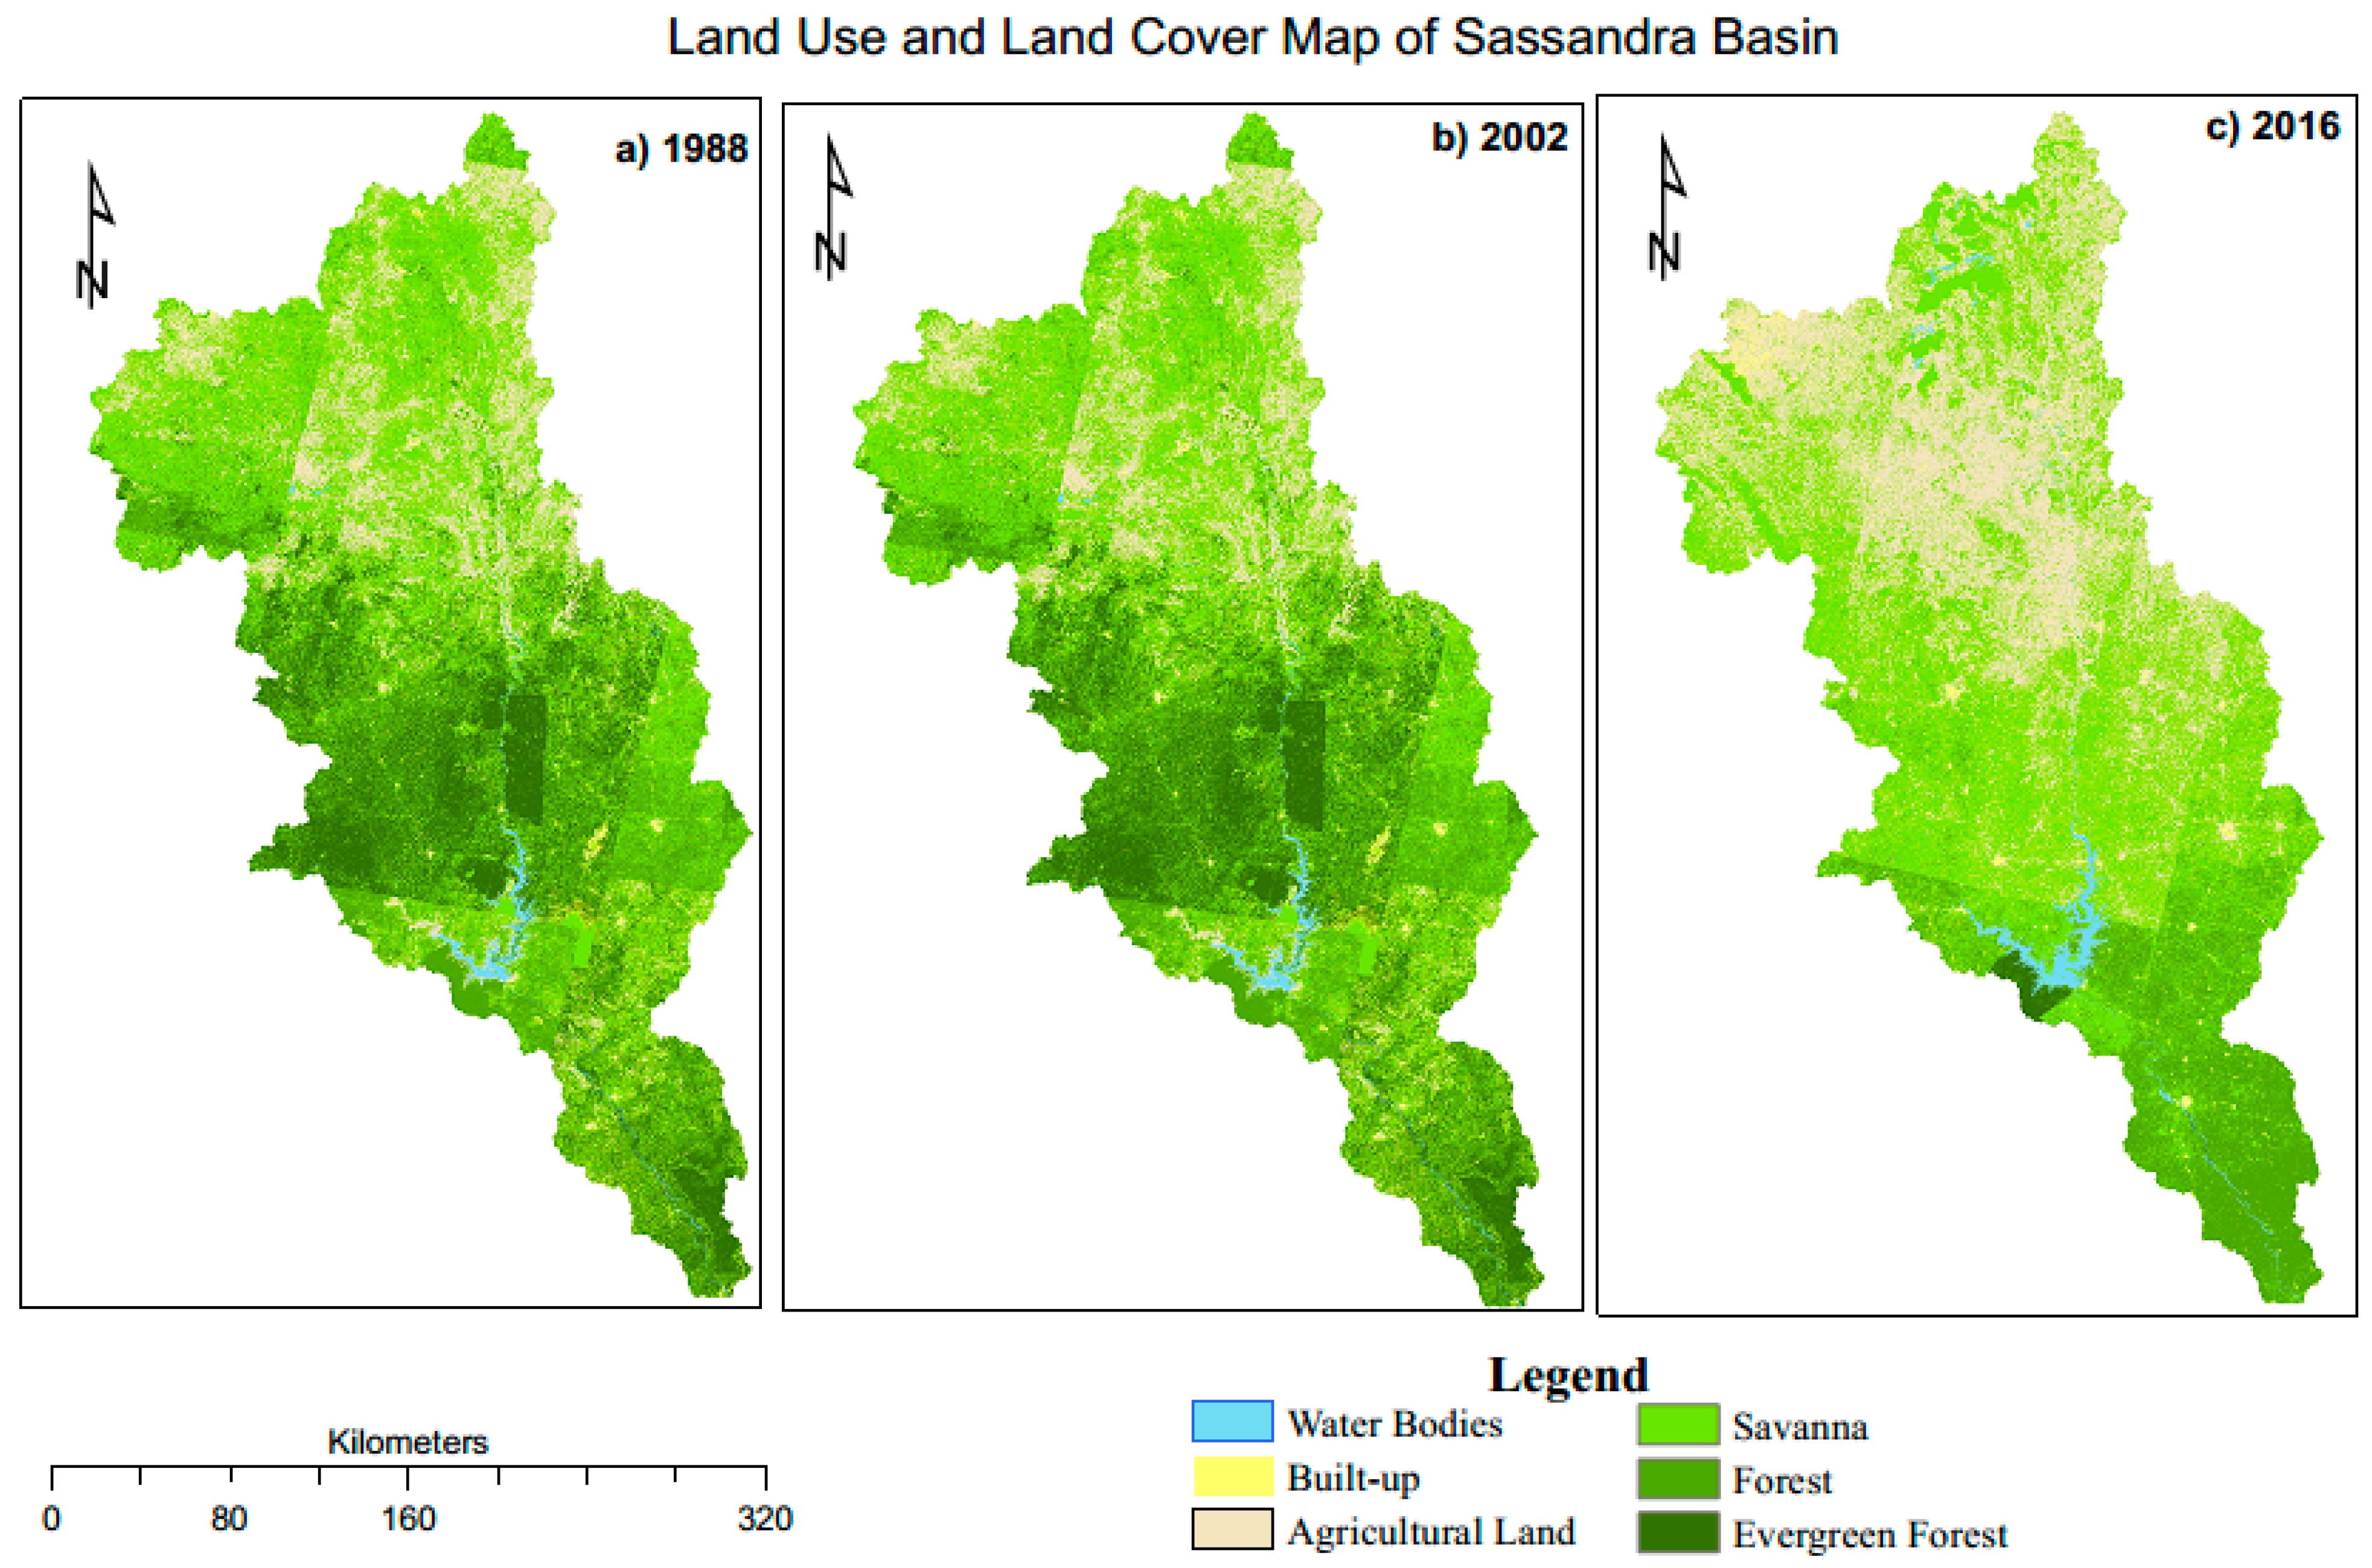
Figure 4 present the maps of land use and land cover changes over Volta, Mono and Sassandra basin, respectively. Each figure presents three maps for 1988, 2002 and 2016 periods.
The evergreen forest and forest cover mainly the south-eastern and south-western part of Volta basin for the years 1988 and 2002. The savanna covers mainly the basin from the south to north while the barren land, shrubs and herbaceous savanna are mainly located in the northern part. The water bodies are also shown mainly at the reservoirs and streamlines locations. The agricultural land is mainly distributed in the central part (
Figure 2).
Figure 3 shows that the western part of Mono basin is covered by forest, while the central part is covered by built-up, agricultural land and herbaceous savanna. The savanna covers the northern and eastern parts.
The southern and central parts of Sassandra basin present evergreen forest and forest cover while the agricultural land and built-up are in northern part (
Figure 4). The savanna is mainly present in the northern part, central to the northern part for the years 1988 and 2002–2016 period, respectively. The water bodies are mainly show at Soubre reservoir, some small dam and stream lines within the basin.
Table 4 quantifies percentage of changes in land use and land cover (LULC) in the three basins which surfaces are 413,520.15 km
2 for Volta, 21,610.39 km
2 for Mono and 68,535.78 km
2 for Sassandra. The change in land cover varies according to the basin and the land use and practices.
For instance, in Volta basin (
Table 4a) the land cover clusters such as water bodies, built-up, agricultural land and shrubs have increased between the three periods 1988–2002, 2002–2016 and 1988–2016. However, all the other land cover clusters, namely, the barren land, savanna, herbaceous savanna and evergreen forest have declined except the forest which has increased in the first period before declining in the last two periods. The decline of barren land areas could be associated with the increase of shrubs. In contrast, this could be some limitation of our model to perform the classification. It may consider some barren land as agricultural and/or built-up in the northern part of Volta basin. The increasing of shrubs for all the periods could be explained in one hand by the fact that the region has been recovered from the droughts of 1980s. In second hand, the increase in shrubs and generally some vegetative clusters could be attributed to the tree plantation resulting from agroforestry practice. The same conclusion was made by Vittek et al., in a previous study for the period 1975–1990 for West Africa overall [
47].
The result reveals that the Mono basin (
Table 4b) land cover presents an increase in built-up, agricultural land and water bodies while the vegetative clusters such as forest, savanna and herbaceous savanna have declined for the three study periods. Nevertheless, the herbaceous savanna and savanna clusters have increased in the 1988–2002 and 2002–2016 periods respectively.
The Sassandra basin (
Table 4c) presents an increasing in water bodies, built-up and agricultural land while the evergreen forest has declined. However, some vegetative areas such as the savanna and the forest have decline in the first period and increased for the last two periods.
Overall, the results from the LULC analysis show that water bodies, built-up and agricultural lands have increased rapidly for all studied basins. Such an increase in water bodies can be explained by the construction of small reservoirs, dugouts and dams within the basins. These basins have received more attention in term of small reservoirs and dugouts construction for irrigation, domestic water supplies and for livestock breeding as well as hydropower plants for electricity generation. Also, the observed increase in built-up and agricultural lands is associated with the increase in urbanized and cultivated areas respectively. In addition, the decline in vegetative areas (herbaceous savanna, savanna, forest and evergreen forest) can be explained by the expansion of agricultural and urbanized areas. In fact, the vegetative areas are being reduced to enlarge the land use areas or in another word, the vegetative areas are replaced by agricultural, built up and water bodies.
Over the world, and particularly in the tropics and subtropics areas, deforestation is attributed to large-scale commercial agriculture, local subsistence agriculture, infrastructure, urban expansion and mining [
48]. During 2000–2010 period in Africa, 8000 km
2, 7000 km
2, 2500 km
2, 2000 km
2 and 500 km
2 of forest are converted per year respectively into commercial agriculture, local agriculture, infrastructure, mining and urban expansion [
48]. According to Food and Agriculture Organization report [
48], in Africa, fuelwood charcoal, timber logging, livestock grazing in forest and uncontrolled fires contribute respectively to 50%, 35%, 10% and 5% of forest degradation.
It was highlighted that the main drivers of land cover change are the excessive use of trees for timber, for biomass energy namely charcoal and wood fires as well as the uncontrolled bushfire phenomenon. Wood fuel accounts for 70% of the Sub-Saharan Africa total energy production [
49] and is one of the main sources of forest and woodland degradation. Due to the increase in population growth rate, and relative price changes of alternate energy sources for cooking, it is expected that the consumption of charcoal will remain at very high levels or even increase in absolute terms over the next decade [
50], thus, woodland and forest degradation could steadily increase. Uncontrolled bushfire, one of the major causes of soil erosion [
51] and livestock pasture destruction could also affect seriously the land cover of each basin. Unfortunately, all the basins in West Africa are exposed to this phenomenon. It has also been highlighted that global croplands, pastures, plantations, and urban areas have expanded in recent decades, accompanied by large increases in energy, water, and fertilizer consumption, along with considerable losses of biodiversity [
52]. West Africa basin is under vegetative area loss due to land use practices explained above. This is confirmed by Vittek et al., [
47] in their study focus on dynamic land cover change in West Africa (1975–1990). They also found out the decreased in all the vegetative clusters.
Lastly, the change in land cover change found is in accord with some previous work in West Africa regions [
51,
53] and especially in Black Volta basin [
6,
7].
4.2. Statistical Analysis of Precipitation Data
The Mann–Kendall test was applied to assess the trend in the precipitation data variation of each location. The statistic indicators of Mann–Kendall test are the
p-value, score (S) or Mann–Kendall statistic, the Z-score, the Kendall tau and their equations were given above. So, the Kendall tau is a measure of correlation; therefore, measures the strength of the relationship between the two variables base on the rank of the data. Whilst, the
p-value measures the significance of the trend and the Z-score is an indicator of the statistical significance of the trend at 95% confidence level. Indeed, at the 2-sided
p-value test the rejection region of a hypothesis is Z-score ≥ 1.96 or Z-score ≤ −1.96. Whilst, the score (S) expresses the magnitude change of the trend (increasing/upward; decreasing/downward). The periods 1979–2000 for Mono basin stations, 1979–2004 and 1979–2008 for Sassandra and Volta basin stations respectively corresponding to the available discharge data period in each basin are considered for the analysis of trends of precipitation (
Table 5).
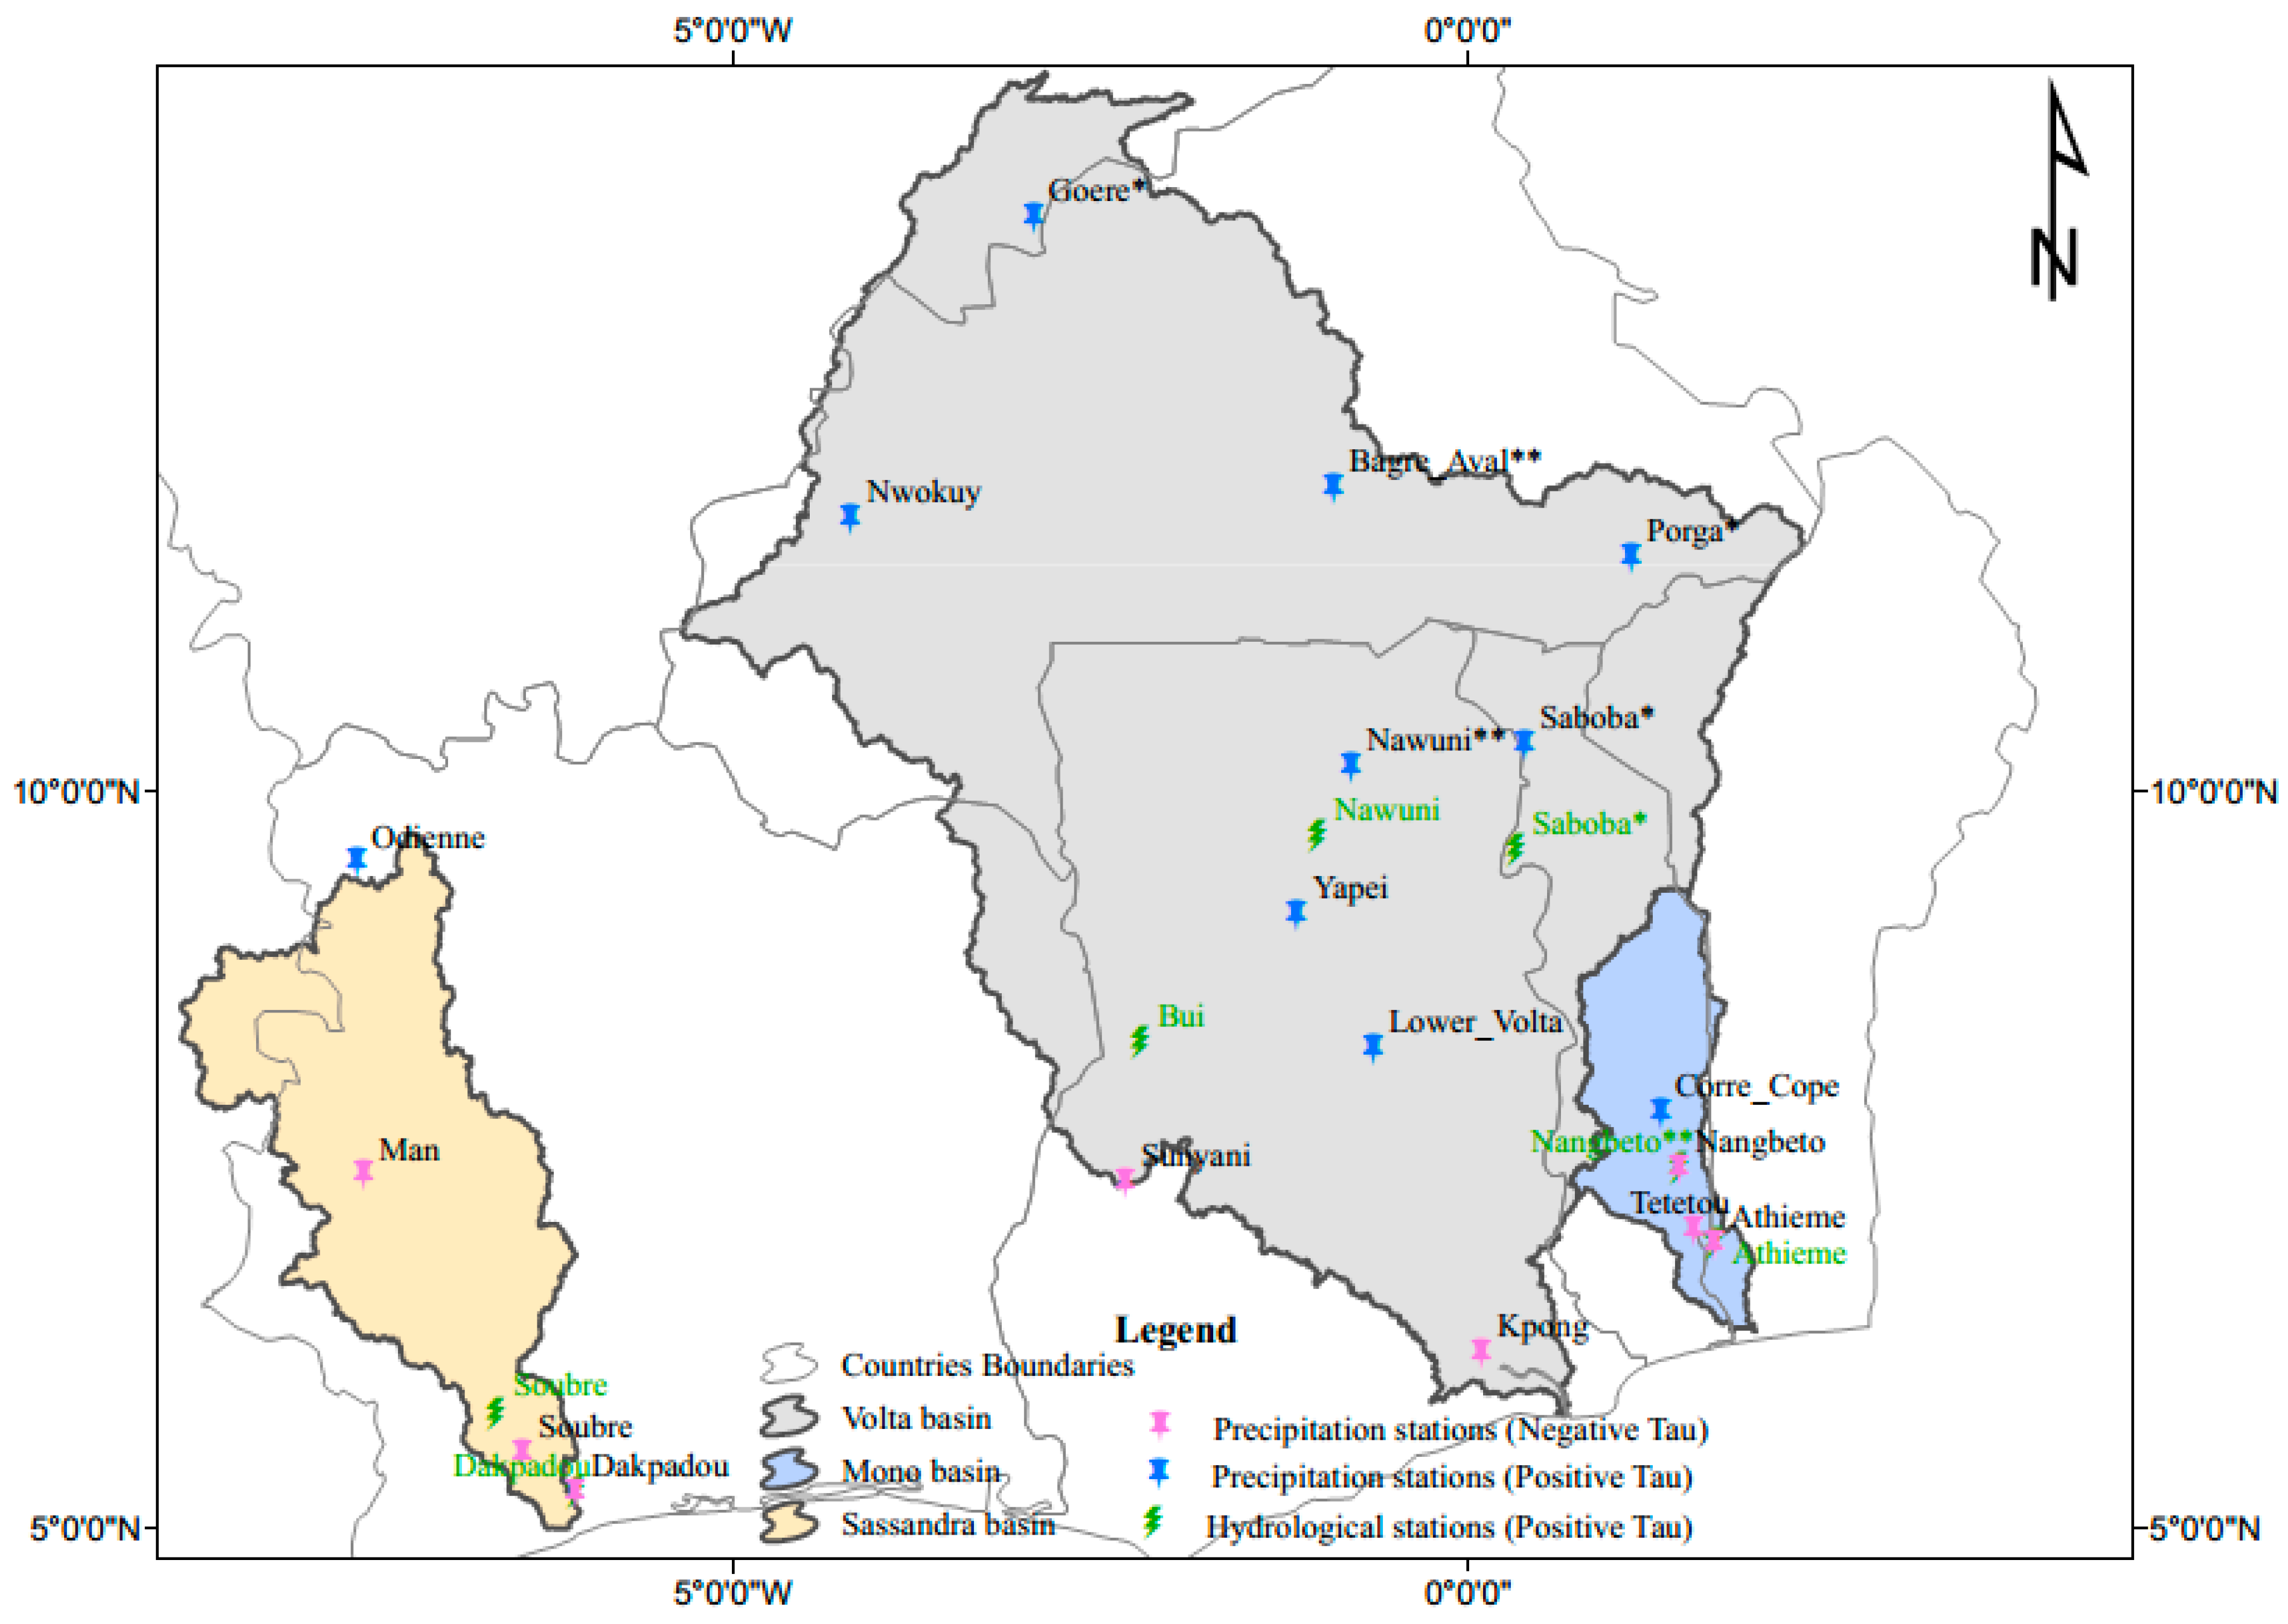
The locations of stations were chosen according to the basin size and available data. Among all the chosen locations, only three stations in the Volta basin (i.e., Goere, Porga and Saboba respectively at the northern part of Black Volta, Northern and southern part of Oti) show a significant upward trend at 95% level of confidence. The p-values of these stations are lower than the (α = 5%) at 95% level of confidence. This is also confirmed by the Z-score values greater than 1.96 which put them in the rejection zone. However, at the 90% level of confidence the Bagre Aval and Nawuni station (White Volta) show a significant upward trend. Though other locations in the Volta basin did not show any trend, the Northern to central locations indicate a positive Mann–Kendall score (S) contrarily to the southern locations (Bui, Kpong and Sunyani).
In the Mono and Sassandra basins, the results of Mann–Kendall test reveal no trend in precipitation. Nevertheless, between 1979 and 2000, the central (Nangbeto) and the southern (Athieme and Tetetou) parts of the Mono basin present a negative Mann–Kendall score (S) contrarily to the northern part (Corre-Cope) of this basin. The same conclusion can be made for Sassandra basin (1979–2004) where the northern part (Odienne) shows a positive Mann–Kendall score while the region from the central (Man) to the southern part (Soubre and Dakpadou) shows a negative one.
Overall the northern part of the three basins presents a positive Mann–Kendall score while the southern part shows the contrary, though they did not present any trend. The Sassandra and Mono basins have not experienced any trend, only Volta basin present a statistically significant trend.
Where data are available, the Mann–Kendall test of the precipitation for the extended period until 2017 (1979–2017) was performed (not shown). There is no major significant difference with results of the first period presented in
Table 5 apart from the Odienne (upward), Man (downward) in Sassandra basin and Sunyani (downward) in Volta basin which present a statistically significant trend for 1979–2017 period. In addition, the Mono basins do not show again any trend during the 1979 to 2017 period.
4.3. Statistical Analysis of Hydrological Data
Figure 5 displays the inter-annual variability of the streamflow within the three considered basins.
The Mann–Kendall test was applied to assess the trend of the hydrological data variation of each station. The same process was followed. We analyzed our data in two times. The first time starts from 1979 (corresponding the start date of precipitation data) to end date of each station and the second time considers the data from 1969 to the end date. For both periods, all the selected hydrological stations of the basin present an increased trend in the discharge. This is confirmed by the positive Mann–Kendall tau and Z-score.
The analysis shows that at 95% confidence level (α = 5%) only Saboba station’s (* in
Table 6 and
Table 7) trend is found to be statistically significant and this is confirmed by the Z-score (2.10884 > 1.96 for in
Table 6 and 2.60479 > 1.96 in
Table 7) that belong to the rejection region of 2-sided
p-value test. This trend is an upward one. However, Nangbeto and Athieme trend (upward) were statistically significant at 90% confidence level for the first period (** in
Table 6) and the second period (** in
Table 7), respectively.
Overall, all the downstream hydrological stations of the basins show an increase trend (non-statistically significant) in discharge during all the two analysis periods except the Saboba station which present statistically significant trend at 95% level of confidence and the Nangbeto and Athieme hydrological stations which show a statistically significant trend of 90% confidence level for the first period (1979–2000) and the second period (1969–2000). The increase in discharge of all selected stations and the statistically significant upward trend of Saboba could be caused by the increase in spatio-temporal distribution of precipitation and/or another non-climatic factor. The spatial distribution trend of precipitation and discharge for considered period in
Table 6 of test are presented in
Figure 6.
Despite the non-statistically significant trend in precipitation observed in Mono basin (1979–2000), the Nangbeto hydrological station shows a statistically significant upward trend at 90% confidence level. Though, the large part of Sassandra basin (1979–2004) presents a downward (non-statistically significant) trend, the Soubre station at the downstream shows an upward trend (non-statistically significant) discharge. This could be due to land cover and land use change.
The present work shows an increased (non-statistically significant) trend in precipitation at the upstream of Bui and Nawuni hydrological stations of Black and White Volta basins respectively. This leads to an increase in trend of discharge at Bui and Nawuni stations. Even though the results reveal an upward trend in both variables (precipitation and discharge), the magnitude of increased in discharge is greater than in precipitation. For instance, the slope of the regression line is lower for rainfall compare to the discharge. In the Oti Volta sub-basin, the Porga and Saboba stations (upstream) show an upward trend in precipitation and discharge, but the two variables are statistically significant only at Saboba station. Also, the magnitude of change upward trend in discharge (slope of 3.187) is greater the one for precipitation (slope 0.18) in Saboba station (1979–2008). This difference in trend and magnitude of precipitation and discharge could be due to land use and land cover change.
These present results confirm previous studies that found out the same trend in discharge at Akosombo station (Lower Volta basin) and at Bui station (Black Volta) for the period of 1970–2011 [
7] [
54]. In the Lower Volta basin (Ghana part), most of the rainfall stations data analyzed has experienced an increased trend as well as Akosombo discharge [
54] but while in the Black Volta basin [
7], several rain-gauges stations present a downward trend in precipitation (except Boura station) while the Bui discharge show an upward trend. Their results also conclude that the land use and land cover change were the probable cause of this difference in trend of precipitation and discharge [
7,
55]. In order to understand the influence of land use and land cover changes, a basic statistical analysis was further processed.
4.4. Basic Statistical Analysis of Precipitation and Discharge
The
Table 8 presents the basic statistic namely the standard deviation (SD), the mean and the coefficient of variation (CV) expressed in percentage of precipitation (P in mm) or of discharge (Q in m
3/s) at monthly and annually scale. The analysis of
Table 8 shows that the discharges have a larger variability (greater CV) than the precipitation at annual and monthly level except some driest months namely December and January in all the basins. The annual precipitation coefficient of variation is lower (10%) in Volta basin while the three hydrological station present a greater coefficient of variation (>35%) 43.6%; 36.51% and 47.43% for Nawuni, Saboba and Bui respectively. In Mono basin, the annual precipitation coefficient of variation is lower (11.5%) while the Nangbeto and Athieme annual discharge coefficient of variation are 37.15 and 46.60% respectively. The annual precipitation coefficient of variation in Sassandra basin is 7.64% and the annual discharge coefficient of variation of Soubre and Dakpadou are respectively 29.41% and 37%. In summary, the annual discharge varies at least three times greatly than the annual precipitation. The same conclusion can also be made for all the month from February to November.
Previous studies confirmed that this large variation in discharge despite the lowest variation in precipitation is mainly due to land use and land cover change. Andreini et al. [
56] showed that the coefficient of variation of runoff from the Volta sub-watersheds is much more variable than rainfall, due to land use. This has been confirmed recently in Black Volta basin with the same statistical analysis [
6] and using Soil and Water Assessment Tool (SWAT) model [
7]. The same conclusion has also been made in Chemoga watershed of Blue Nile basin in Ethiopia [
57] using the coefficient of variation method. It is apparent from the Volta water balance that land use and land cover changes in the uplands of the basin play a pivotal role in determining the future of the basin water resources. The relative hydrological effects of forest changes and climatic variability are largely dependent on the change magnitudes and watershed characteristics [
58]. Some previous work on West Africa basins showed an increase in runoff generation coefficient despite the increase in the number of dams in the basin [
59] due to land use practice [
60]. It has been demonstrated that such basin has loss their soil water hold capacity [
60] and caused of the Sahelian paradox [
61,
62] which consequently result in an increase of flow of the river.
The analysis of land use and land cover change presented above reveals mostly a decrease in vegetative areas and an increase built-up areas, agricultural land, and water bodies. This change in land cover and land use also will affect the water holding capacity of the soil by decreasing the infiltration rate and increasing the runoff generation capacity of the basin. In the Black Volta basin, this increase in land use and land cover changes leads to an increase the discharge at Bui [
6]. This effect combined with climate change can also reduce the underground recharge water capacity as it has been confirmed the decline in underground water recharge of Bandama basin [
63]. Water availability could be at risk with changes of land use and land cover.
However, the land use and land cover changes have an important effect on the catchment runoff generation [
55,
64,
65,
66,
67,
68,
69,
70] and potential evapotranspiration [
6,
71,
72]. Any change in runoff generation coefficient could affect the hydrodynamic of the river. So, the land use and land cover change could affect the hydrodynamic of the river. This has been found in different basins of the region namely Bandama [
63], Senegal [
55,
64], Mono [
25,
65], Sahelo-Sudanian [
61] and elsewhere [
66,
67]. The land use practices as the construction of large dams could have an influence on surrounding climate [
67] and can lead to microclimatic changes [
68]. It has been proved to have high impact on the rainfall [
69] and on climate system [
73,
74] of a given region. The study of Mara river in East Africa region exhibits that the conversion of forests to agriculture and grassland in the basin headwaters is likely to reduce dry season flows and increase peak flows, leading to greater water scarcity at critical times of the year and exacerbating erosion on hillslopes [
75]. The influence of land use and land cover on hydrological dynamic of the river is well documented [
25,
76,
77,
78,
79,
80].
In addition, it is also found that land use and land cover practice in the same basin could be favorable to Bui hydropower plant production under climatic uncertainties [
7]. But the resultant effect of this phenomenon in other regional hydropower plants is not known and need to be investigated. So there is a nexus between land use–climate change–energy productions [
73].
Beside the hydrological dynamic modification of land use [
81,
82], it can also be responsible of global carbon cycle and climate changes; can affect regional climate, water and air quality as well as cause biodiversity decline [
52] and cause some infectious diseases. The land use change can also impact the global and regional climate [
80] through the surface energy budget as well as the carbon cycle [
77,
83].
The land use and land cover change have strong influence on regional hydroclimate [
78], ecosystem and society [
77]. The land use/cover classification over Greater Horn of Africa between 1986–2000 exhibits increased conversion of large portions of forests to agriculture, particularly in Kenya, with land (acreage) under crops increasing from 6.55% in 1986 to almost 18% by the year 2000 [
84]. This change in land use/cover has resulted into a modest reduction in monthly rainfall totals and also may be contributing to notable shifts in moisture convergence zones and centers of rainfall maxima. A decrease in precipitation and an increase in surface temperature around the lake region was shown when surface vegetation cover is converted to agricultural land cover type [
83]. The land use/cover plays important role in climate system of the region.
The changes in land use and land cover vary according to the basin and the land use category. This has a greater impact on the streamflow generation [
81], and thus on water availability for different sectors as well as hydropower plant within the basin and could vary from plant to plant within the same region. Therefore, there is a need of some careful scientific study combining the resultant effect of land use and land cover change on hydrological dynamics of each basin as well as its impacts on each hydropower plant of all the basins in West Africa under climatic uncertainties. Due to the divergent impacts of land use on the environment, it is very important to model how this factor is going to change in the future and what are the plausible effects on all the environmental aspects [
82]. This factor is also very important to be taking into account while simulating climate change [
85].

 ,
, 


