1. Introduction
Estimating groundwater recharge in arid or semiarid regions can be a difficult and complex task. Groundwater recharge in arid and semi-arid areas is dependent on a complex set of spatial and temporal hydrologic parameters and processes dependent on local climate, land surface properties and subsurface characteristics that are extremely difficult to quantify by using conventional methods of analysis [
1]. These difficulties are especially increased in the southeastern Mojave Desert, due to the sparse amount of data that is available in much of this generally undeveloped and expansive region, where large extrapolations are necessary between sparse locations where data are available. The lack of a detailed delineation of subsurface flow pathways is further complicated by the extensive faulting in the region. As such, groundwater recharge estimates for the hydrologic system have varied by more than an order of magnitude between different researchers, highlighting the current uncertainty attached to an important water resource parameter for this arid or semiarid region.
The estimated volume of recharge is a key component in water resources and aquifer management when evaluating the potential impacts of water extraction and recovery in groundwater systems and hydrologically-connected springs. The water in both groundwater and spring flow are controlled by a water balance simply shown by the following equation:
For groundwater, when outflow exceeds inflow, groundwater in storage decreases and groundwater elevations decrease. When inflow exceeds outflow, the reverse is true. When the system is in equilibrium, groundwater levels will generally remain constant. Similarly for spring systems, when outflow exceeds inflow, the spring draws down the source of water and spring flow decreases. When inflow exceeds outflow, the reverse is true for springs also. When spring systems are in equilibrium, spring flow will generally remain constant. Thus, for springs sourced primarily by local recharge, spring flows are temporally well-correlated with precipitation and evapotranspiration patterns.
Thus, for regions such as the southeastern Mojave Desert, where there is a high degree of spatial variability in recharge, the characteristic of a basin being generally in hydrologic balance enables an easier approach to estimating the regional average recharge conditions based on estimating the hydrologic discharge. When using discharge, the components are generally more accurately quantifiable and thus they provide a more reliable assessment of the overall average recharge across the region, based on the ability to reflect the integrated recharge of a larger area, compared to local precipitation gauges and evapotranspiration stations.
This study focuses on a review of the past recharge estimates and associated uncertainties for the southeastern Mojave region, and it considers the results of the observed flow patterns of the springs and recent radiocarbon analyses on selected spring waters, to narrow the range of plausible estimates. The implications of a narrowed set of plausible recharge rates is then discussed in the context of the sustainability of spring flow in this region. Rapid growth and competition for water resources in the Mojave Desert is an ongoing issue and, as with other locations of water resource limitations, this results in a need to balance competing uses and priorities. These include providing water to an expanding population, preserving water-dependent ecological resources, and supplying the expanding water demands of commercial and industrial development, including alternative energy generation facilities.
1.1. Site Description
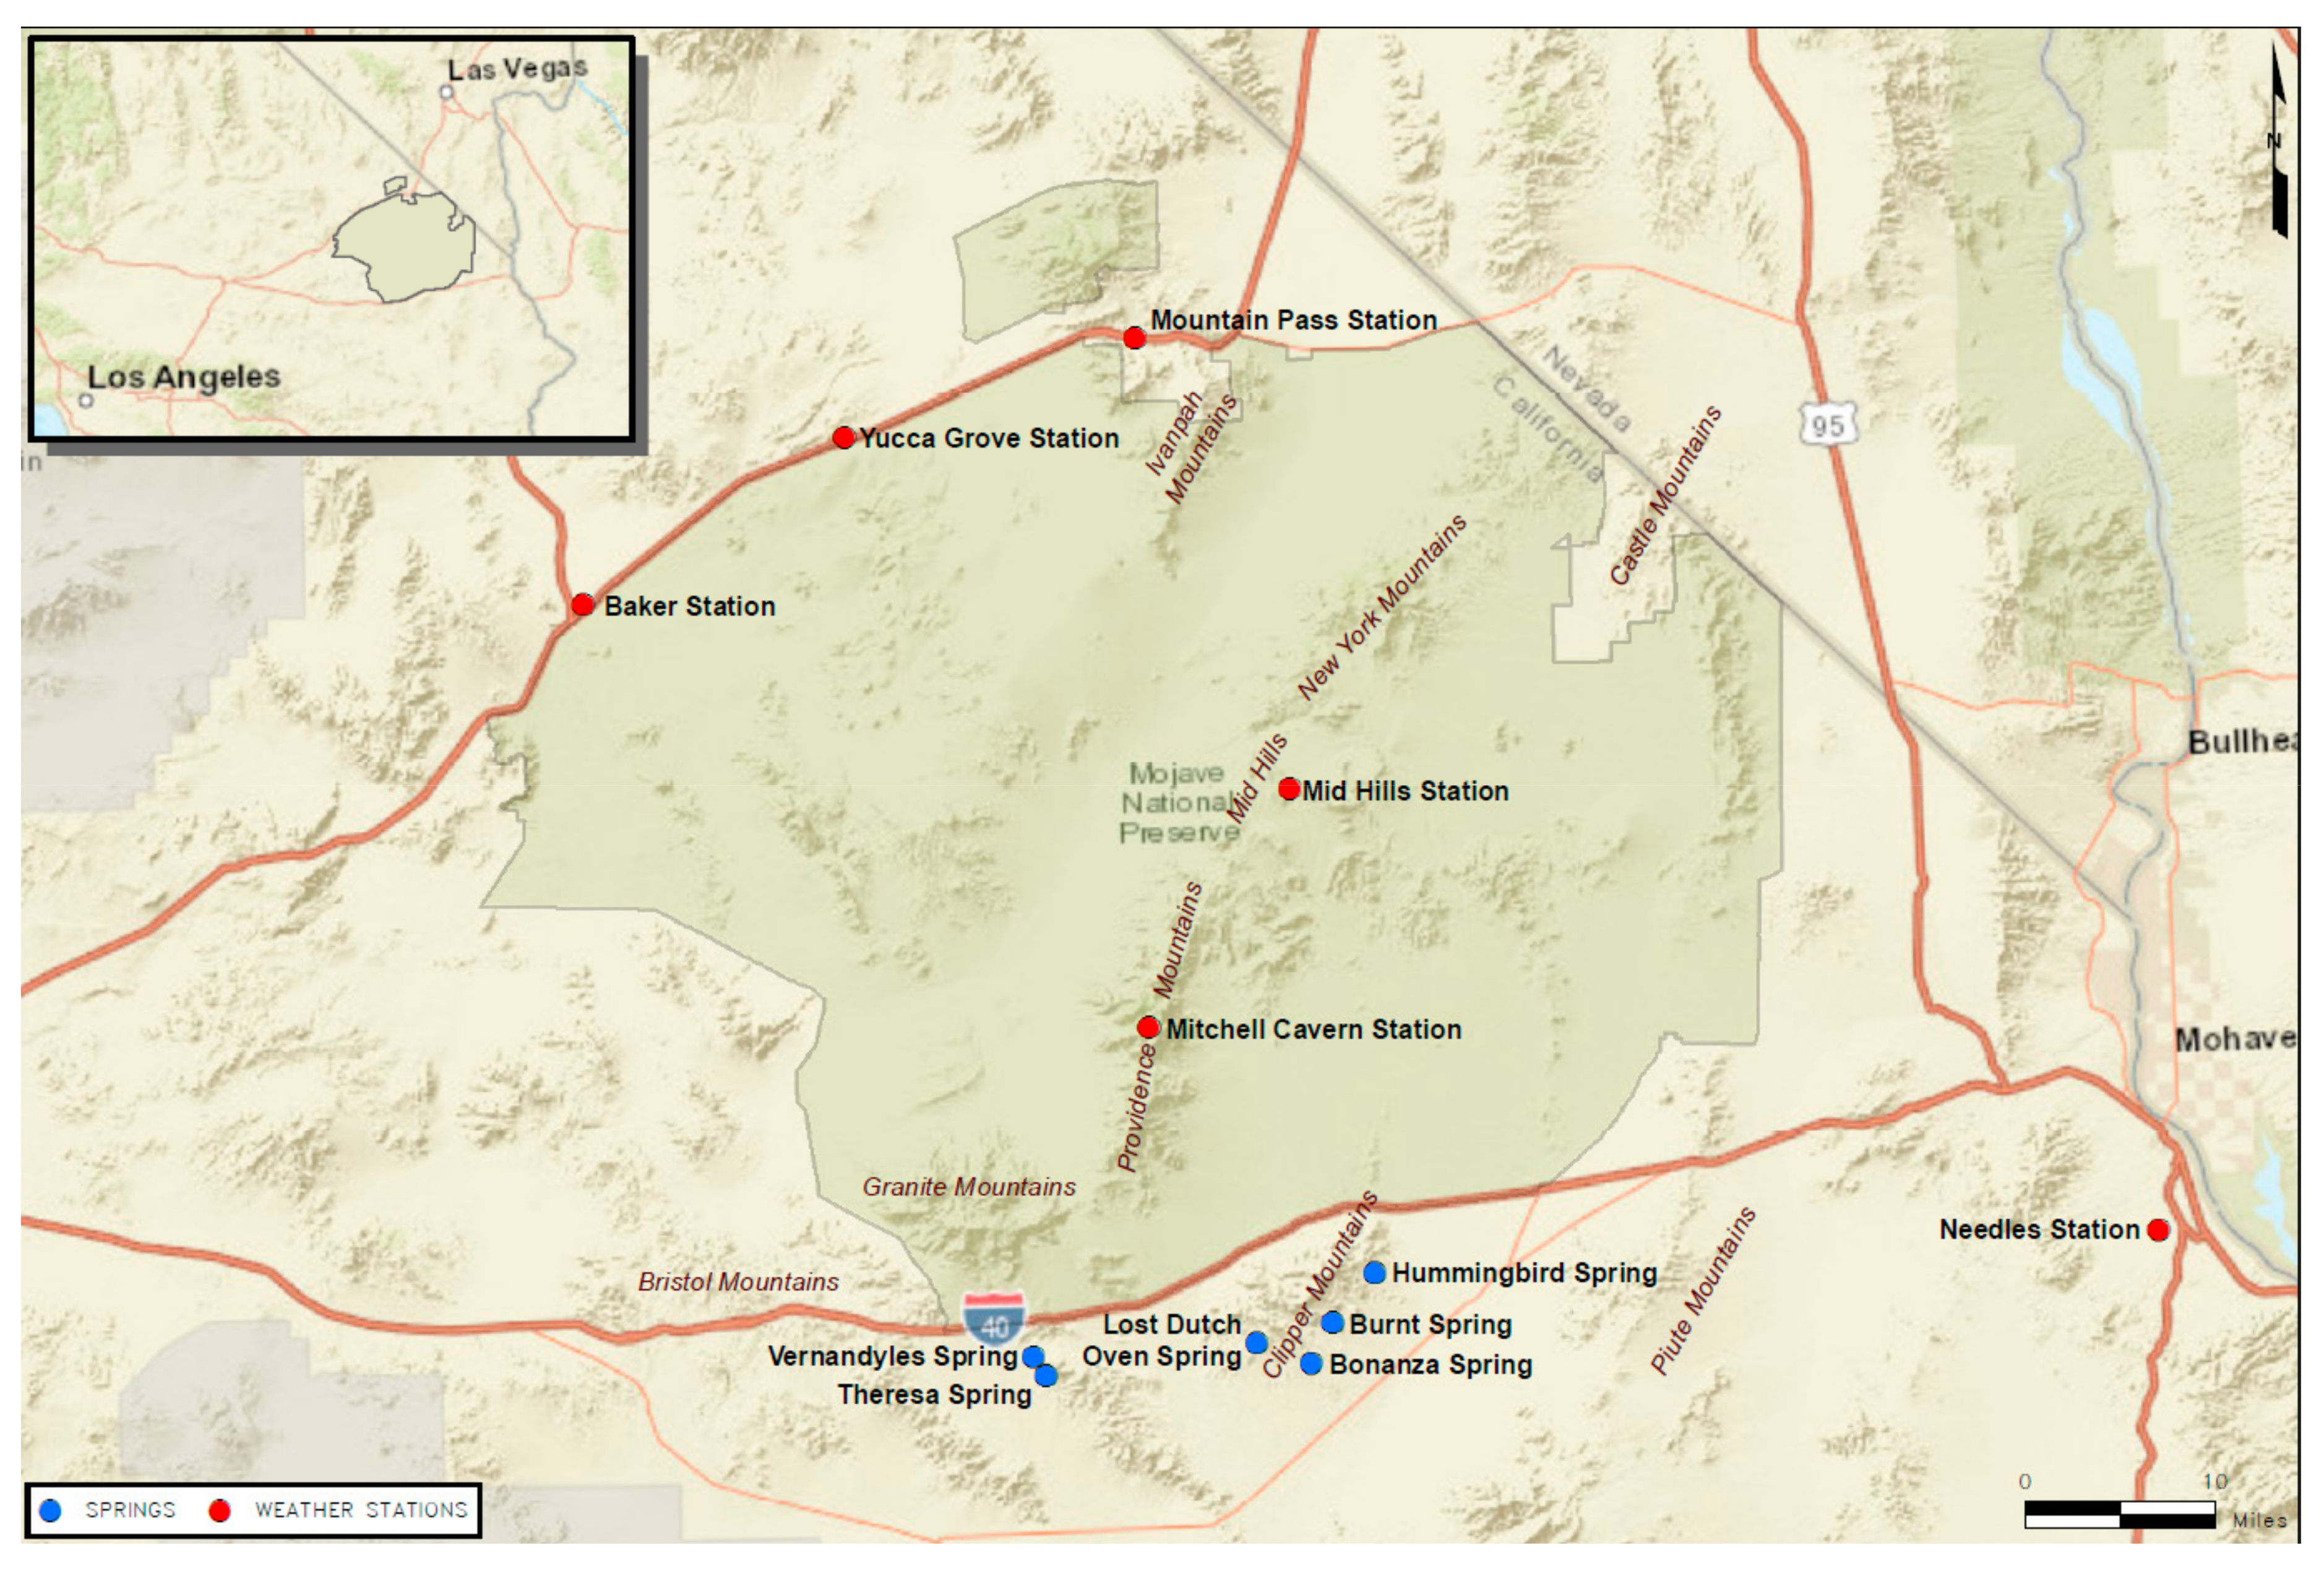
In general, information and data regarding recharge and spring flow in the Mojave Desert is sparse, and the details of the subsurface hydrology of these springs is typically not well understood. The springs considered in this analysis are: Bonanza Spring, Burnt Spring, Hummingbird Spring rise in the Clipper Mountains, and Vernandyles Spring and Theresa Spring rise in the Marble Mountains within the newly established Mojave Trails National Monument, San Bernardino County, California (
Figure 1 and
Table 1).
1.2. Geologic and Hydrogeologic Setting
The area covered in this study spans a substantial portion of the Mojave Desert, a region of isolated mountain ranges separated by expanses of desert plains. Overall, the Mojave Desert forms a wedge-shaped area bounded by the Garlock Fault on the north, the San Andreas Fault (and the north slope of San Bernardino Mountains) on the south, and the Colorado River to the east. The southern edge of the Mojave Desert bounds the Transverse Ranges, an east-west trending series of mountain ranges extending from the Pacific coast to the south-central portion of the Mojave Desert. North of the Garlock Fault, the region is considered to be within the Basin and Range geomorphic province. The Basin and Range is characterized by a roughly linear pattern of north-northwest trending ranges and intervening alluvial valleys, resulting from range-front normal faults and with internal drainage.
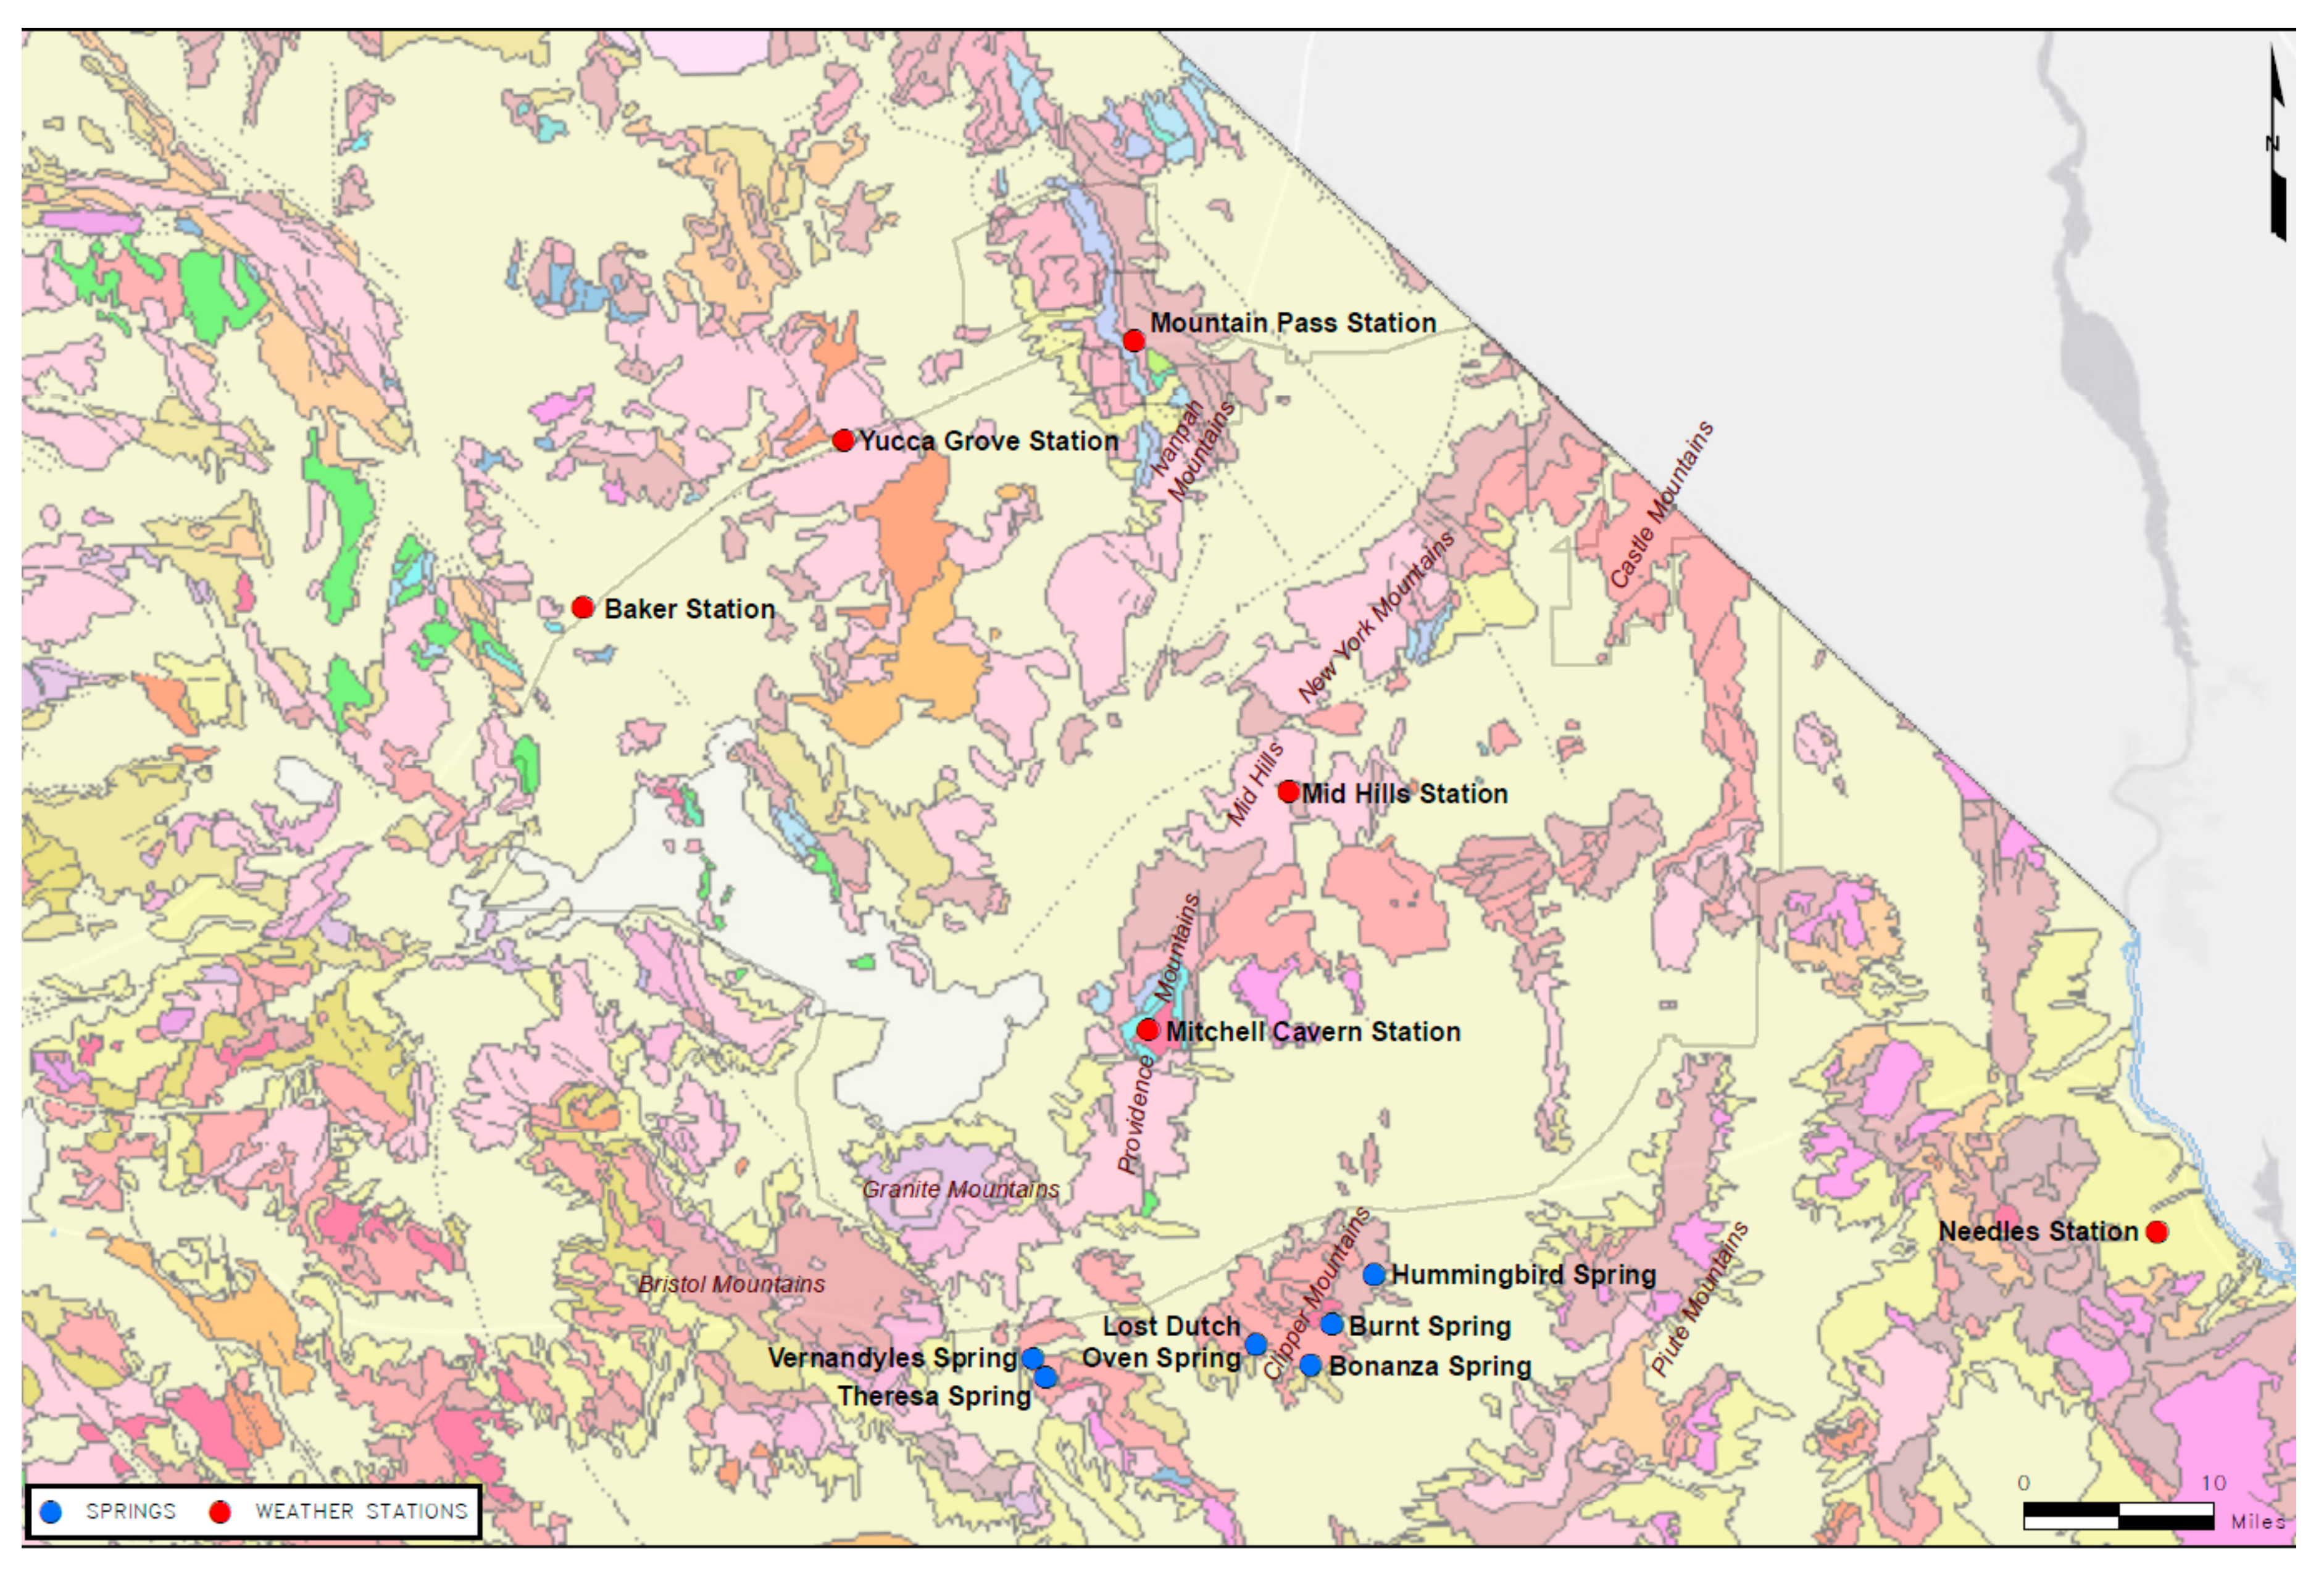
The portion of the Mojave Desert covered in this study includes parts of the east and southeastern Mojave Desert, and a portion of the Colorado Desert in the southeast corner of the study area. This is a geologically diverse area and it falls within the Eastern California Shear Zone, an area of fault-rotated bedrock mountain ranges, elongated along variable orientations, and surrounded by broad alluvial valleys with internal drainage (
Figure 2). The easternmost portion of the study area has drainage to the Colorado River which then flows south toward Mexico. Rock types are variable, with some mountain ranges dominated by intrusive igneous rocks (e.g., Granite Mountains, Old Woman Mountains, Chemehuevi Mountains); and volcanic rocks (e.g., Clipper Mountains), while other ranges are variable in lithology (e.g., the Marble Mountains, which are primarily comprised of volcanic rocks on the north and carbonate sedimentary rocks on the south).
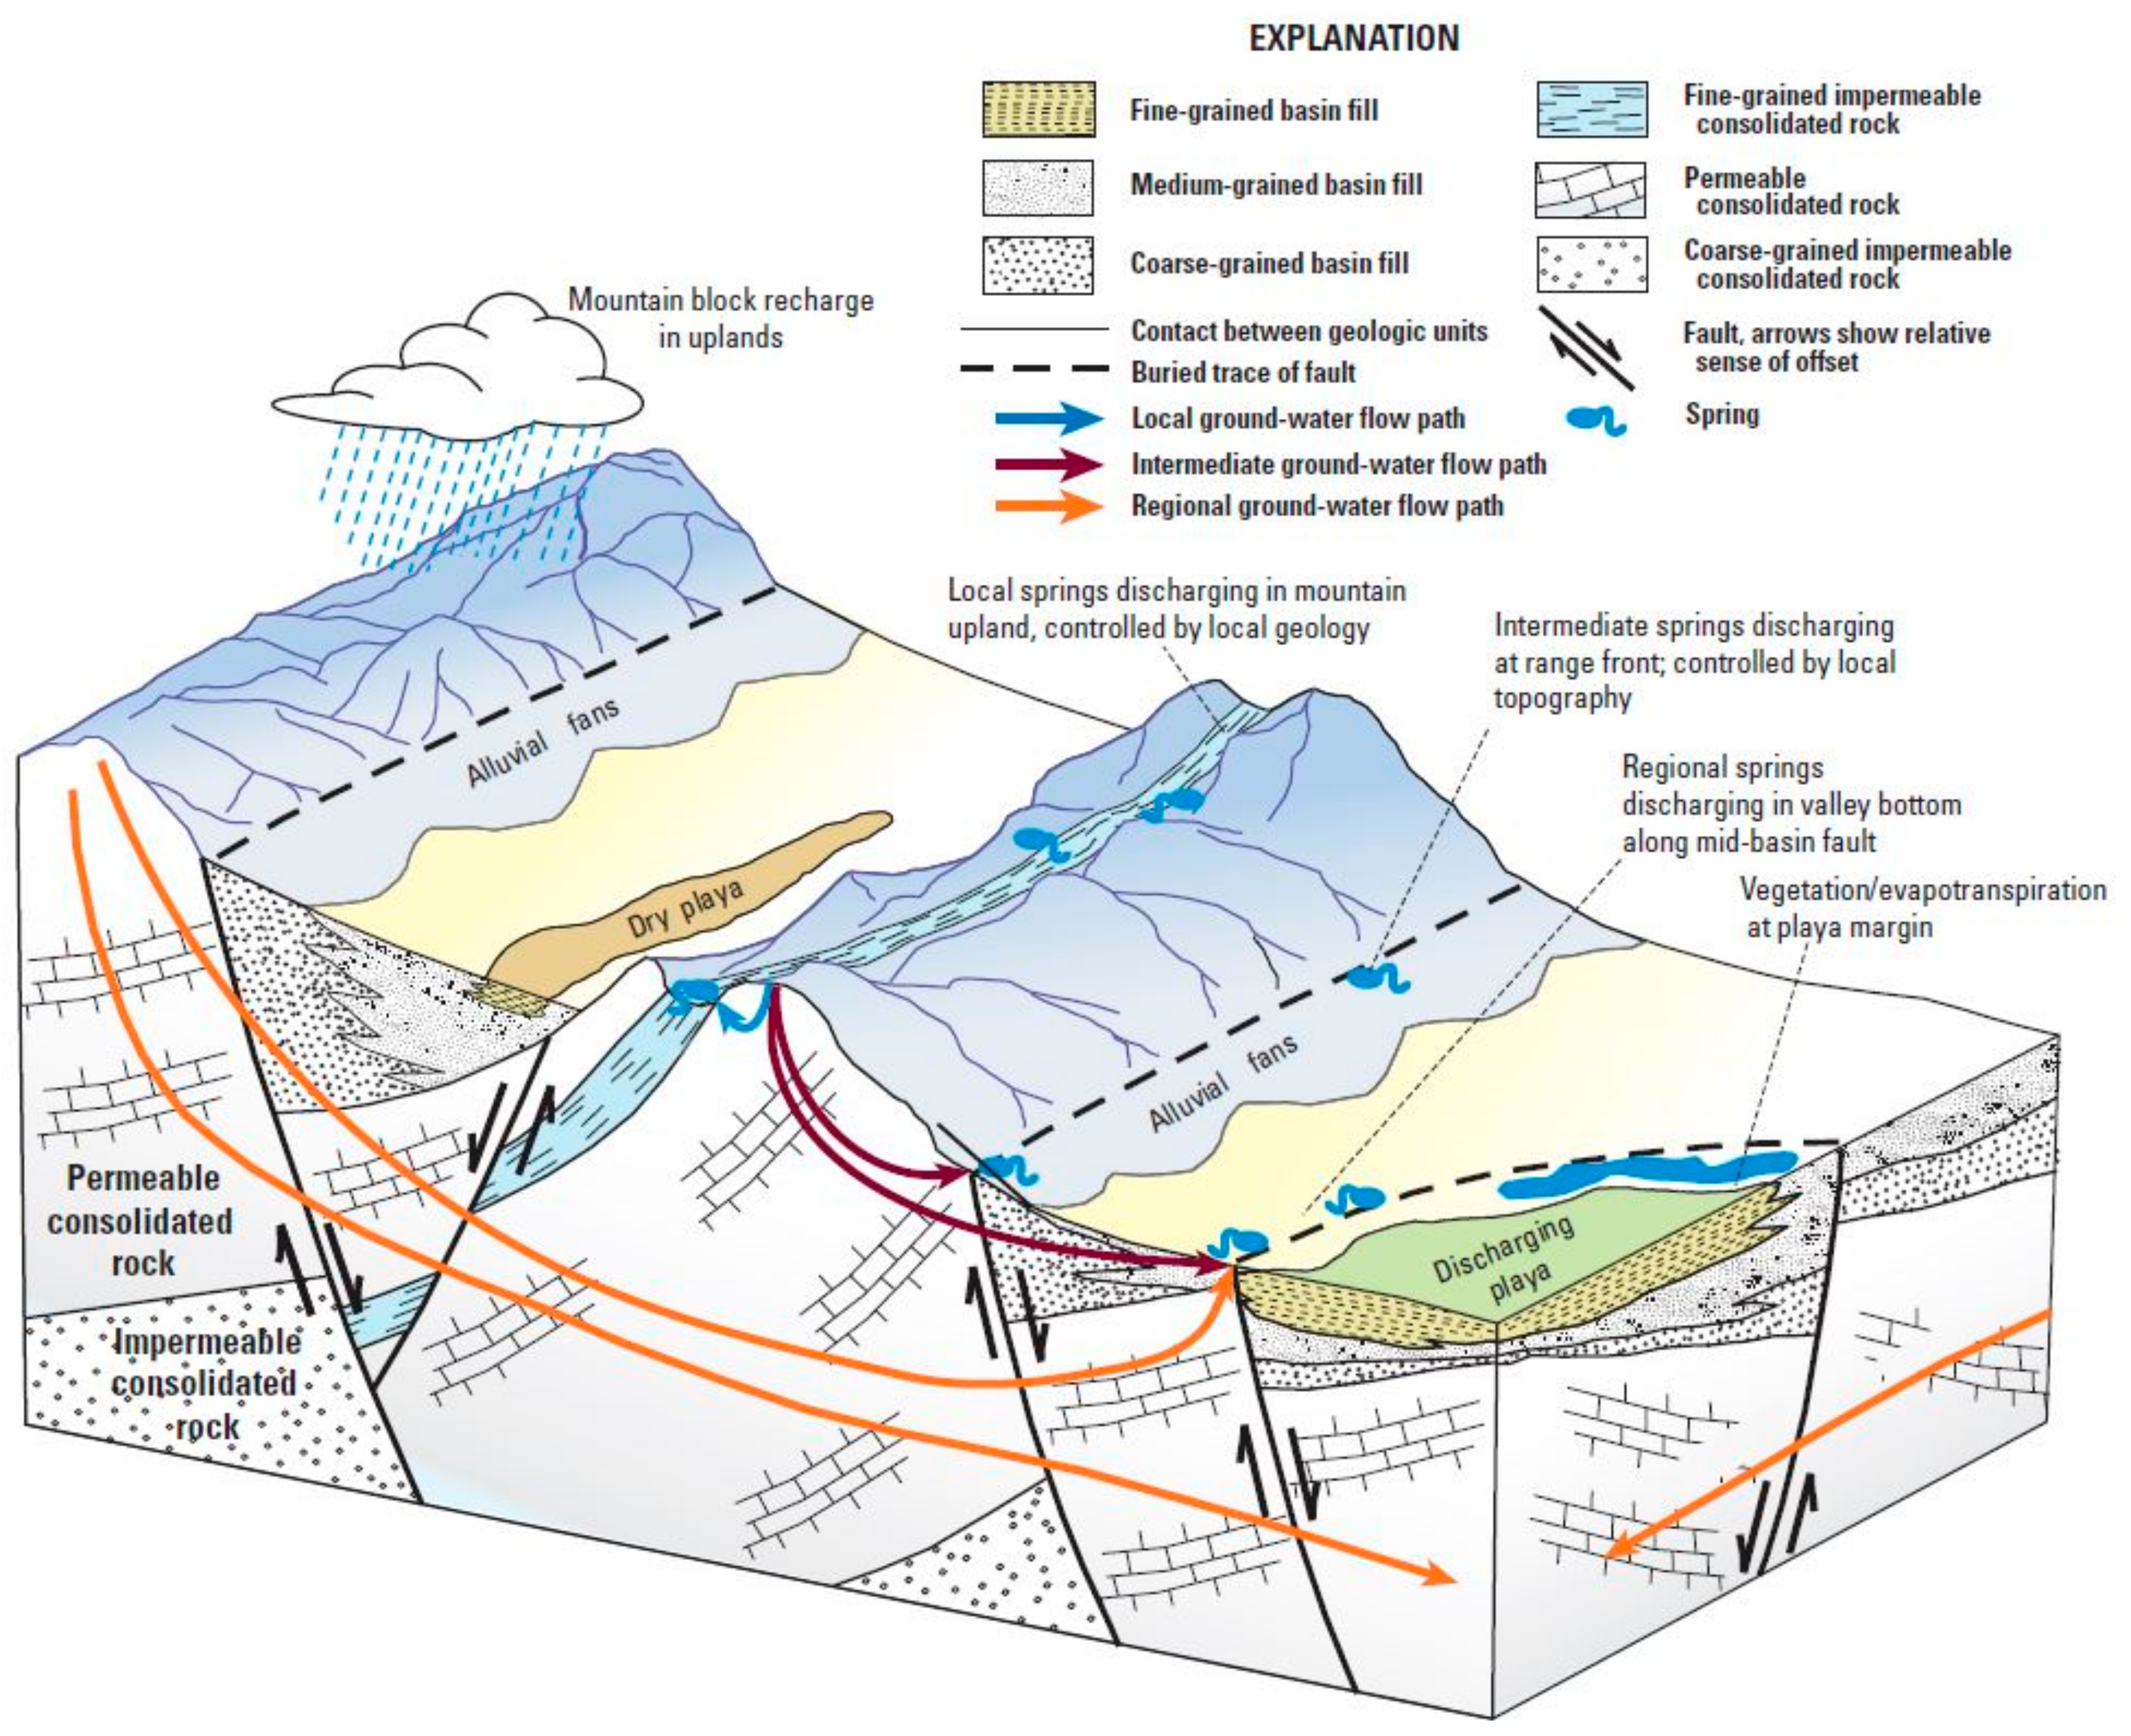
The principal surface water bodies throughout the region include scattered springs and the normally dry playas on the valley floors, which receive water during occasional summer and winter precipitation events that eventually evaporate. Generally, most of the springs in the Mojave Desert are “local” or “perched” springs that are the result of precipitation in their local watershed that percolates into the ground, only to reach the surface where bedrock restrictions to underflow force water to the surface. They are typically located in wash bottoms, or they may form small, intermittent seeps on hillsides. These local springs are wholly dependent on flow within their respective watersheds. There is no recognized planar, perched groundwater-table that extends across ridges and valleys in these desert ranges. Larger, perennial springs may be observed along geologic structures or contacts that are hydrologically connected with regional groundwater systems, including basin-fill aquifers (
Figure 3).
The direction of the groundwater movement usually parallels the slope of the ground surface, from points of recharge in the higher elevations to points of discharge such as springs, or evapotranspiration from the salt-encrusted playas.
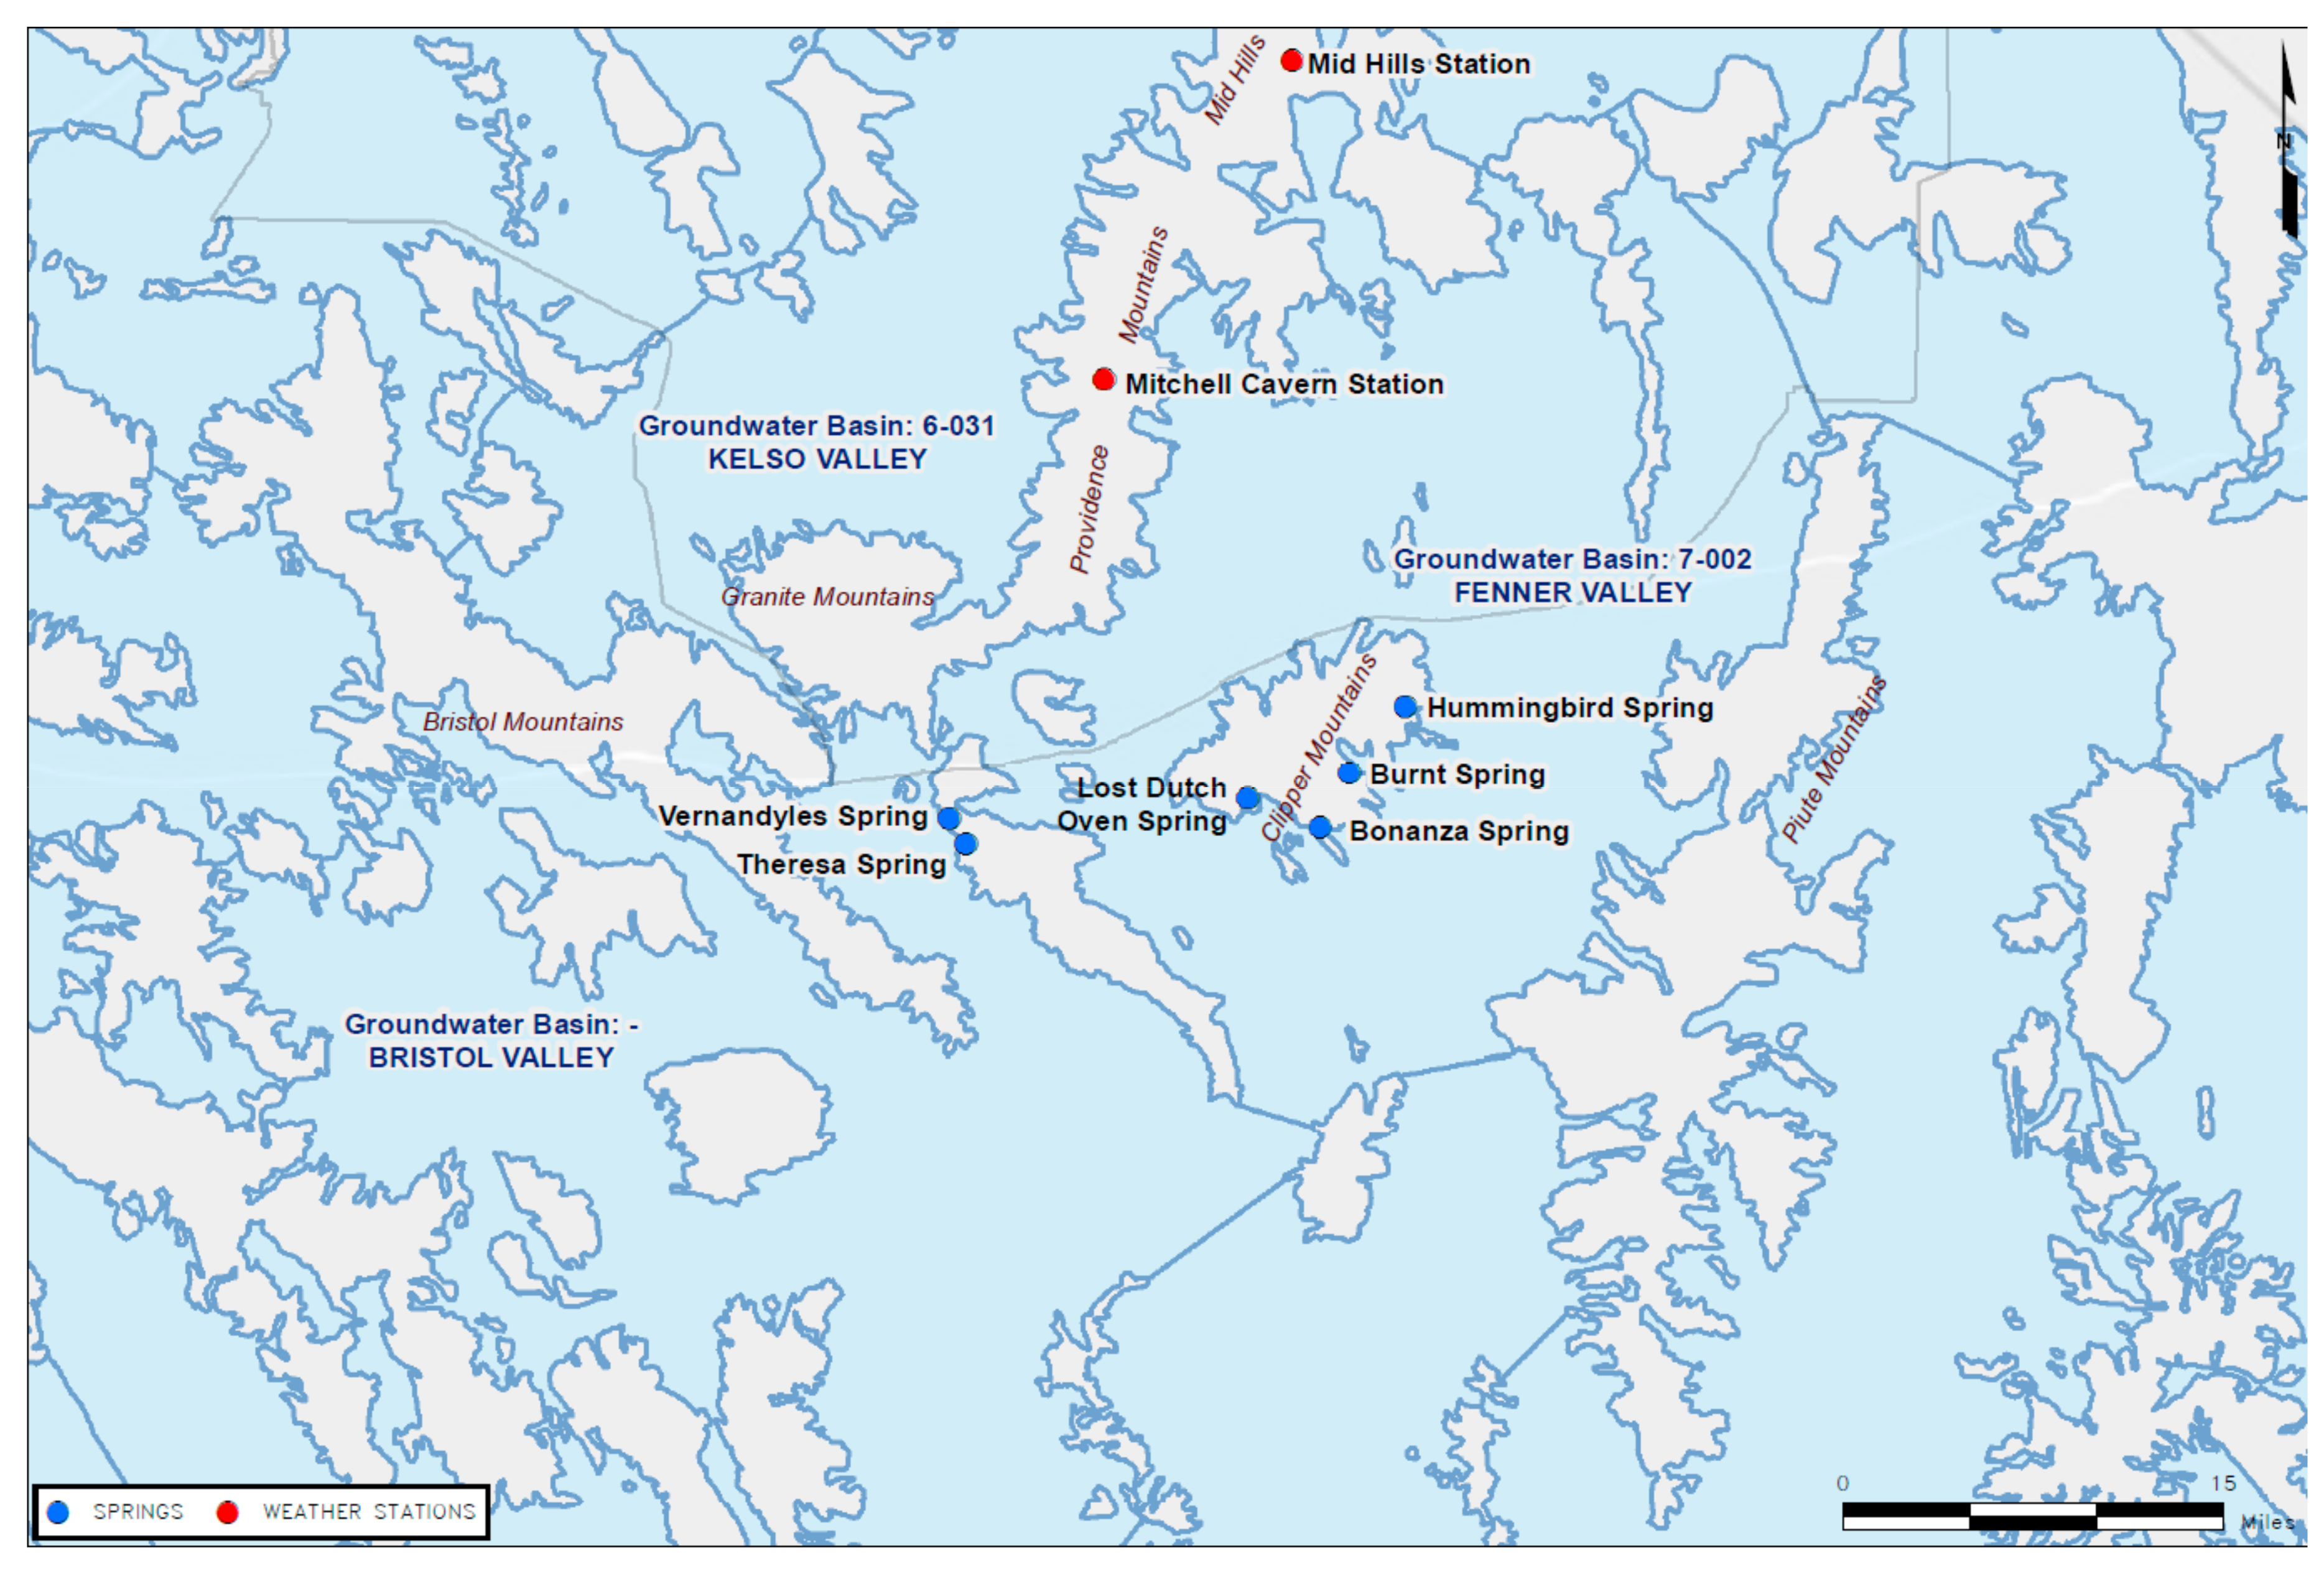
The surface catchment areas of the local watersheds for each of the key springs were evaluated by delineating the topographic ridgelines using Google Earth, and using the Google Earth area tool to calculate the bounded catchment area. The associated surface catchment areas for the springs in this study are approximately 50 acres for Bonanza Spring (and Lower Bonanza Spring), 147 acres for Hummingbird Spring, 963 acres for Burnt Spring, 39 acres for Vernandyles Spring, and 25 acres for Theresa Spring. These spring all are similar in that they are perennial, with Bonanza, Hummingbird, and Burnt Springs lying within the Fenner Valley Groundwater Basin, and Vernandyles and Theresa Springs within the neighboring Bristol Valley Groundwater Basin (
Figure 4). They all have relatively small catchment areas, relative to the broad extent of the larger groundwater basins. Bonanza Spring has previously been identified as being in hydraulic communication with the basin-fill aquifer system surrounding the Clipper Mountains [
2].
3. Results
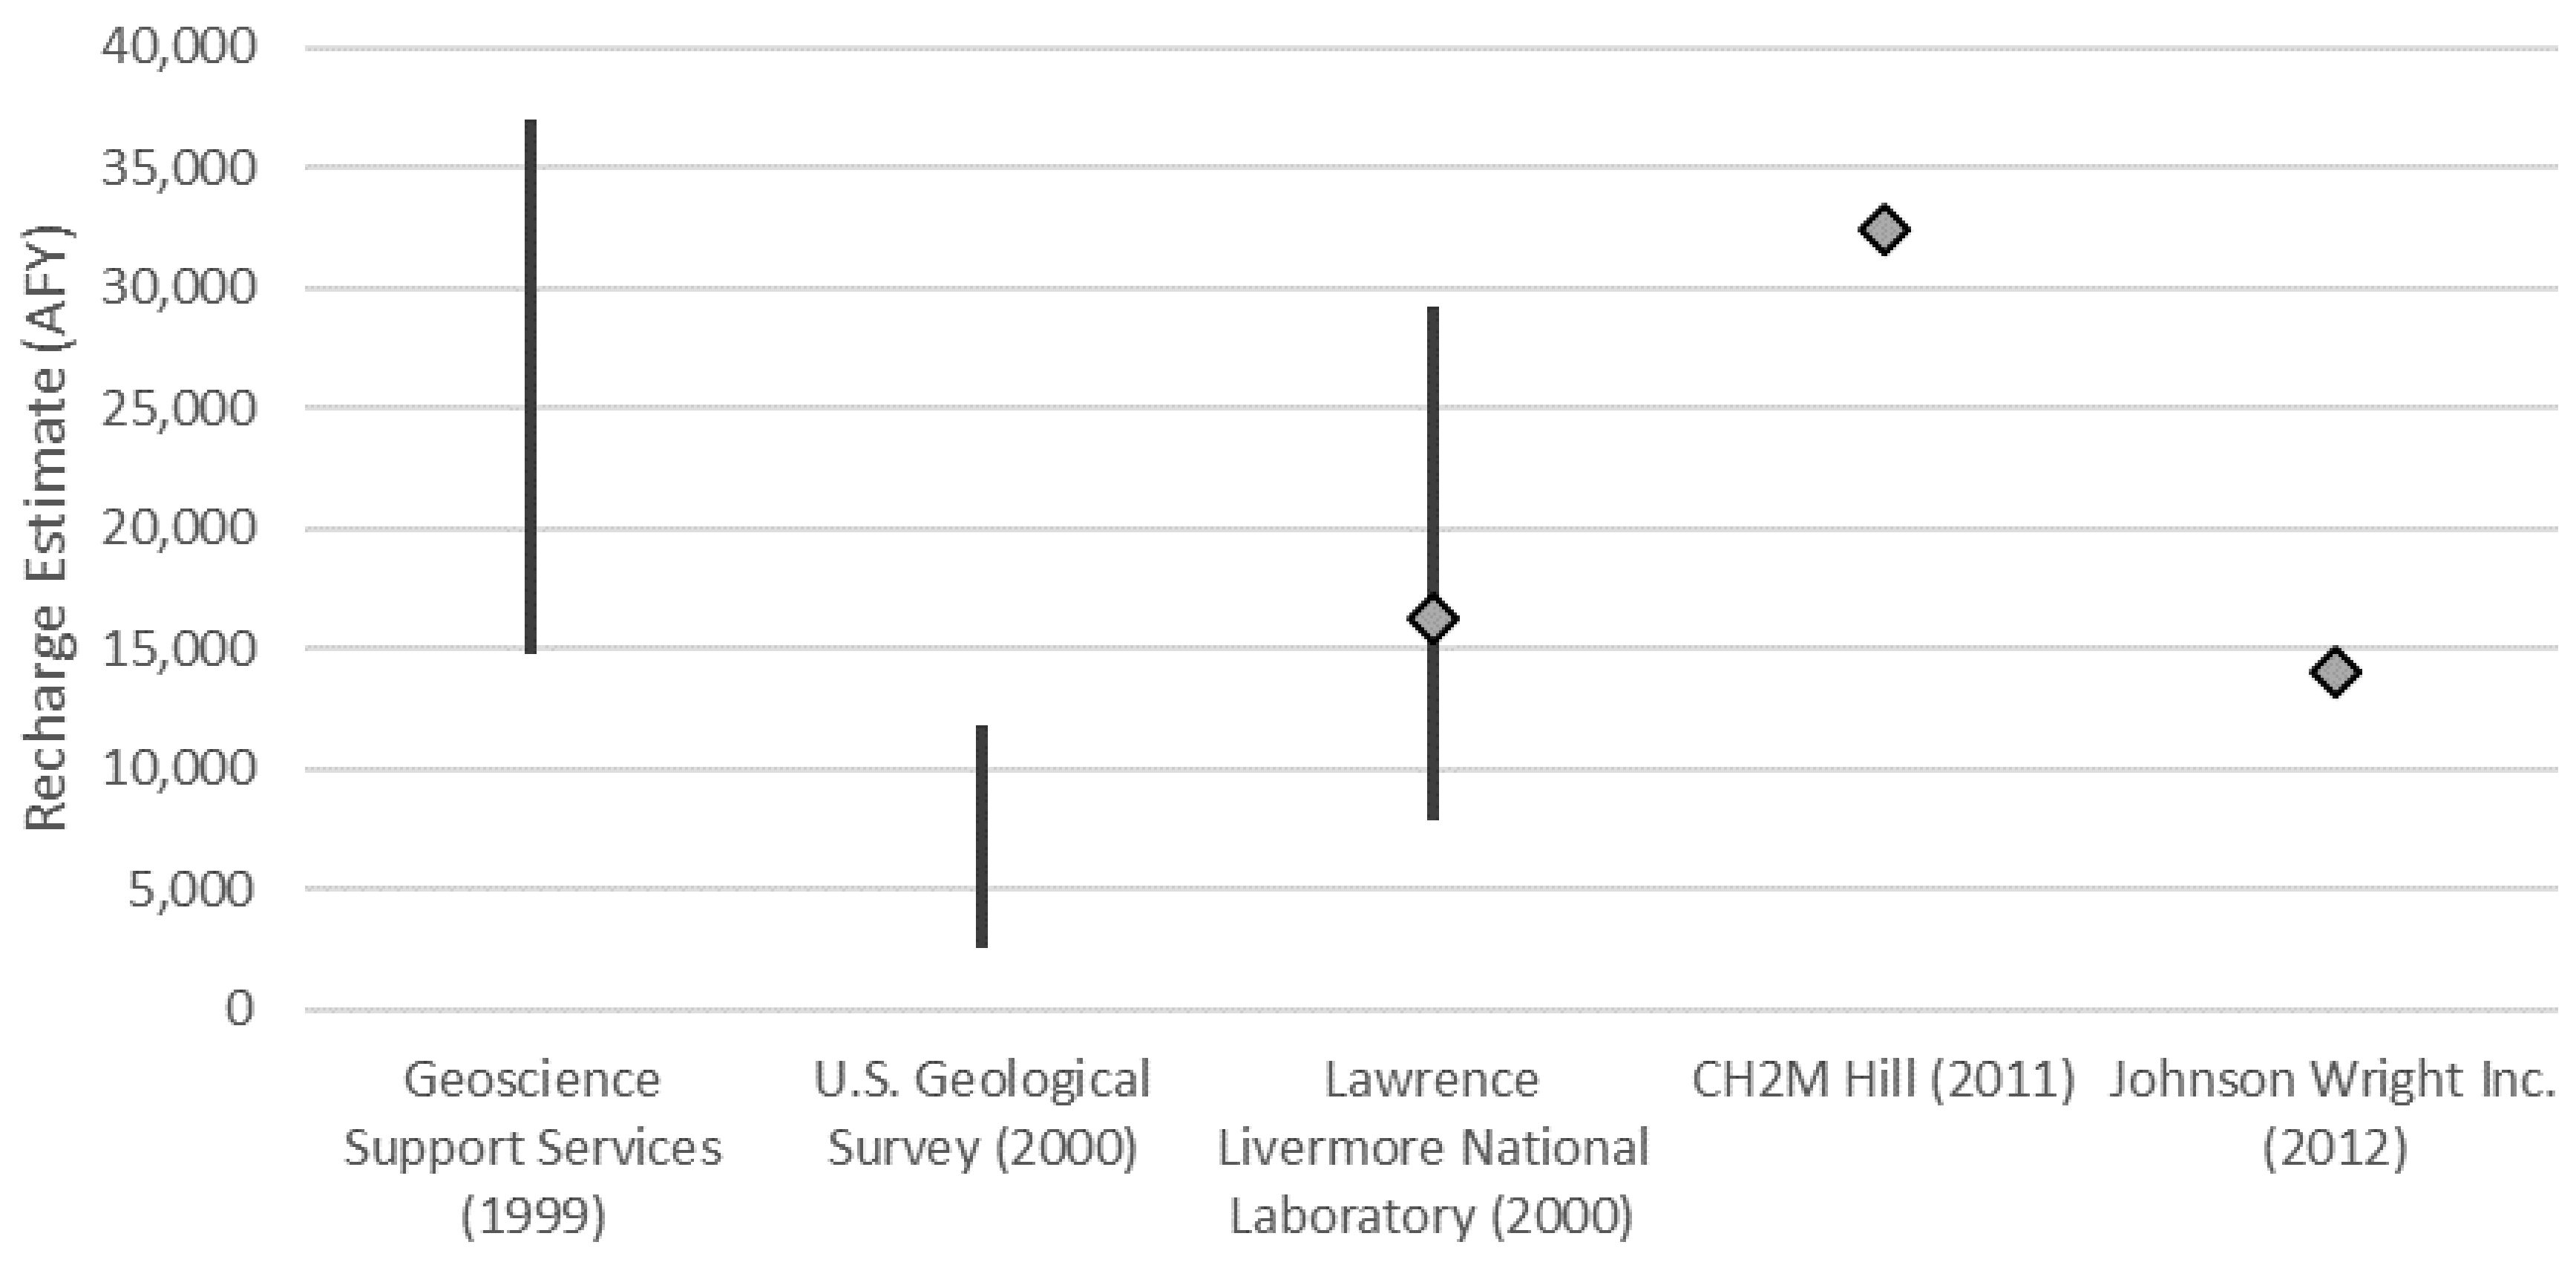
This study evaluates five relatively recent efforts to estimate the recharge in this area: Geoscience Support Services (1999) [
8], U.S. Geological Survey (2000) [
9], Lawrence Livermore National Laboratory (2000) [
10], CH2M Hill (2011) [
11], and Johnson Wright Inc. (2012) [
12]. Older published recharge estimates (greater than 30 years old) were excluded based on the absence of key meteorological stations at the time of their development.
The review of groundwater recharge estimates focused on two key elements: The quality of the precipitation record used in the recharge analyses, and the various recharge estimation methods. Precipitation data records for meteorological stations [
13] within the following climate data networks were reviewed:
Remote Automatic Weather Stations (RAWS)
National Weather Service Coop (NWS Coop)
Natural Resources Conservation Service Snotel (Snotel)
California Data Exchange Center (CDEC)
International Civil Aviation Organization (ICAO)
Desert Research Institute (DRI)
California Irrigation Management Information System (CIMIS)
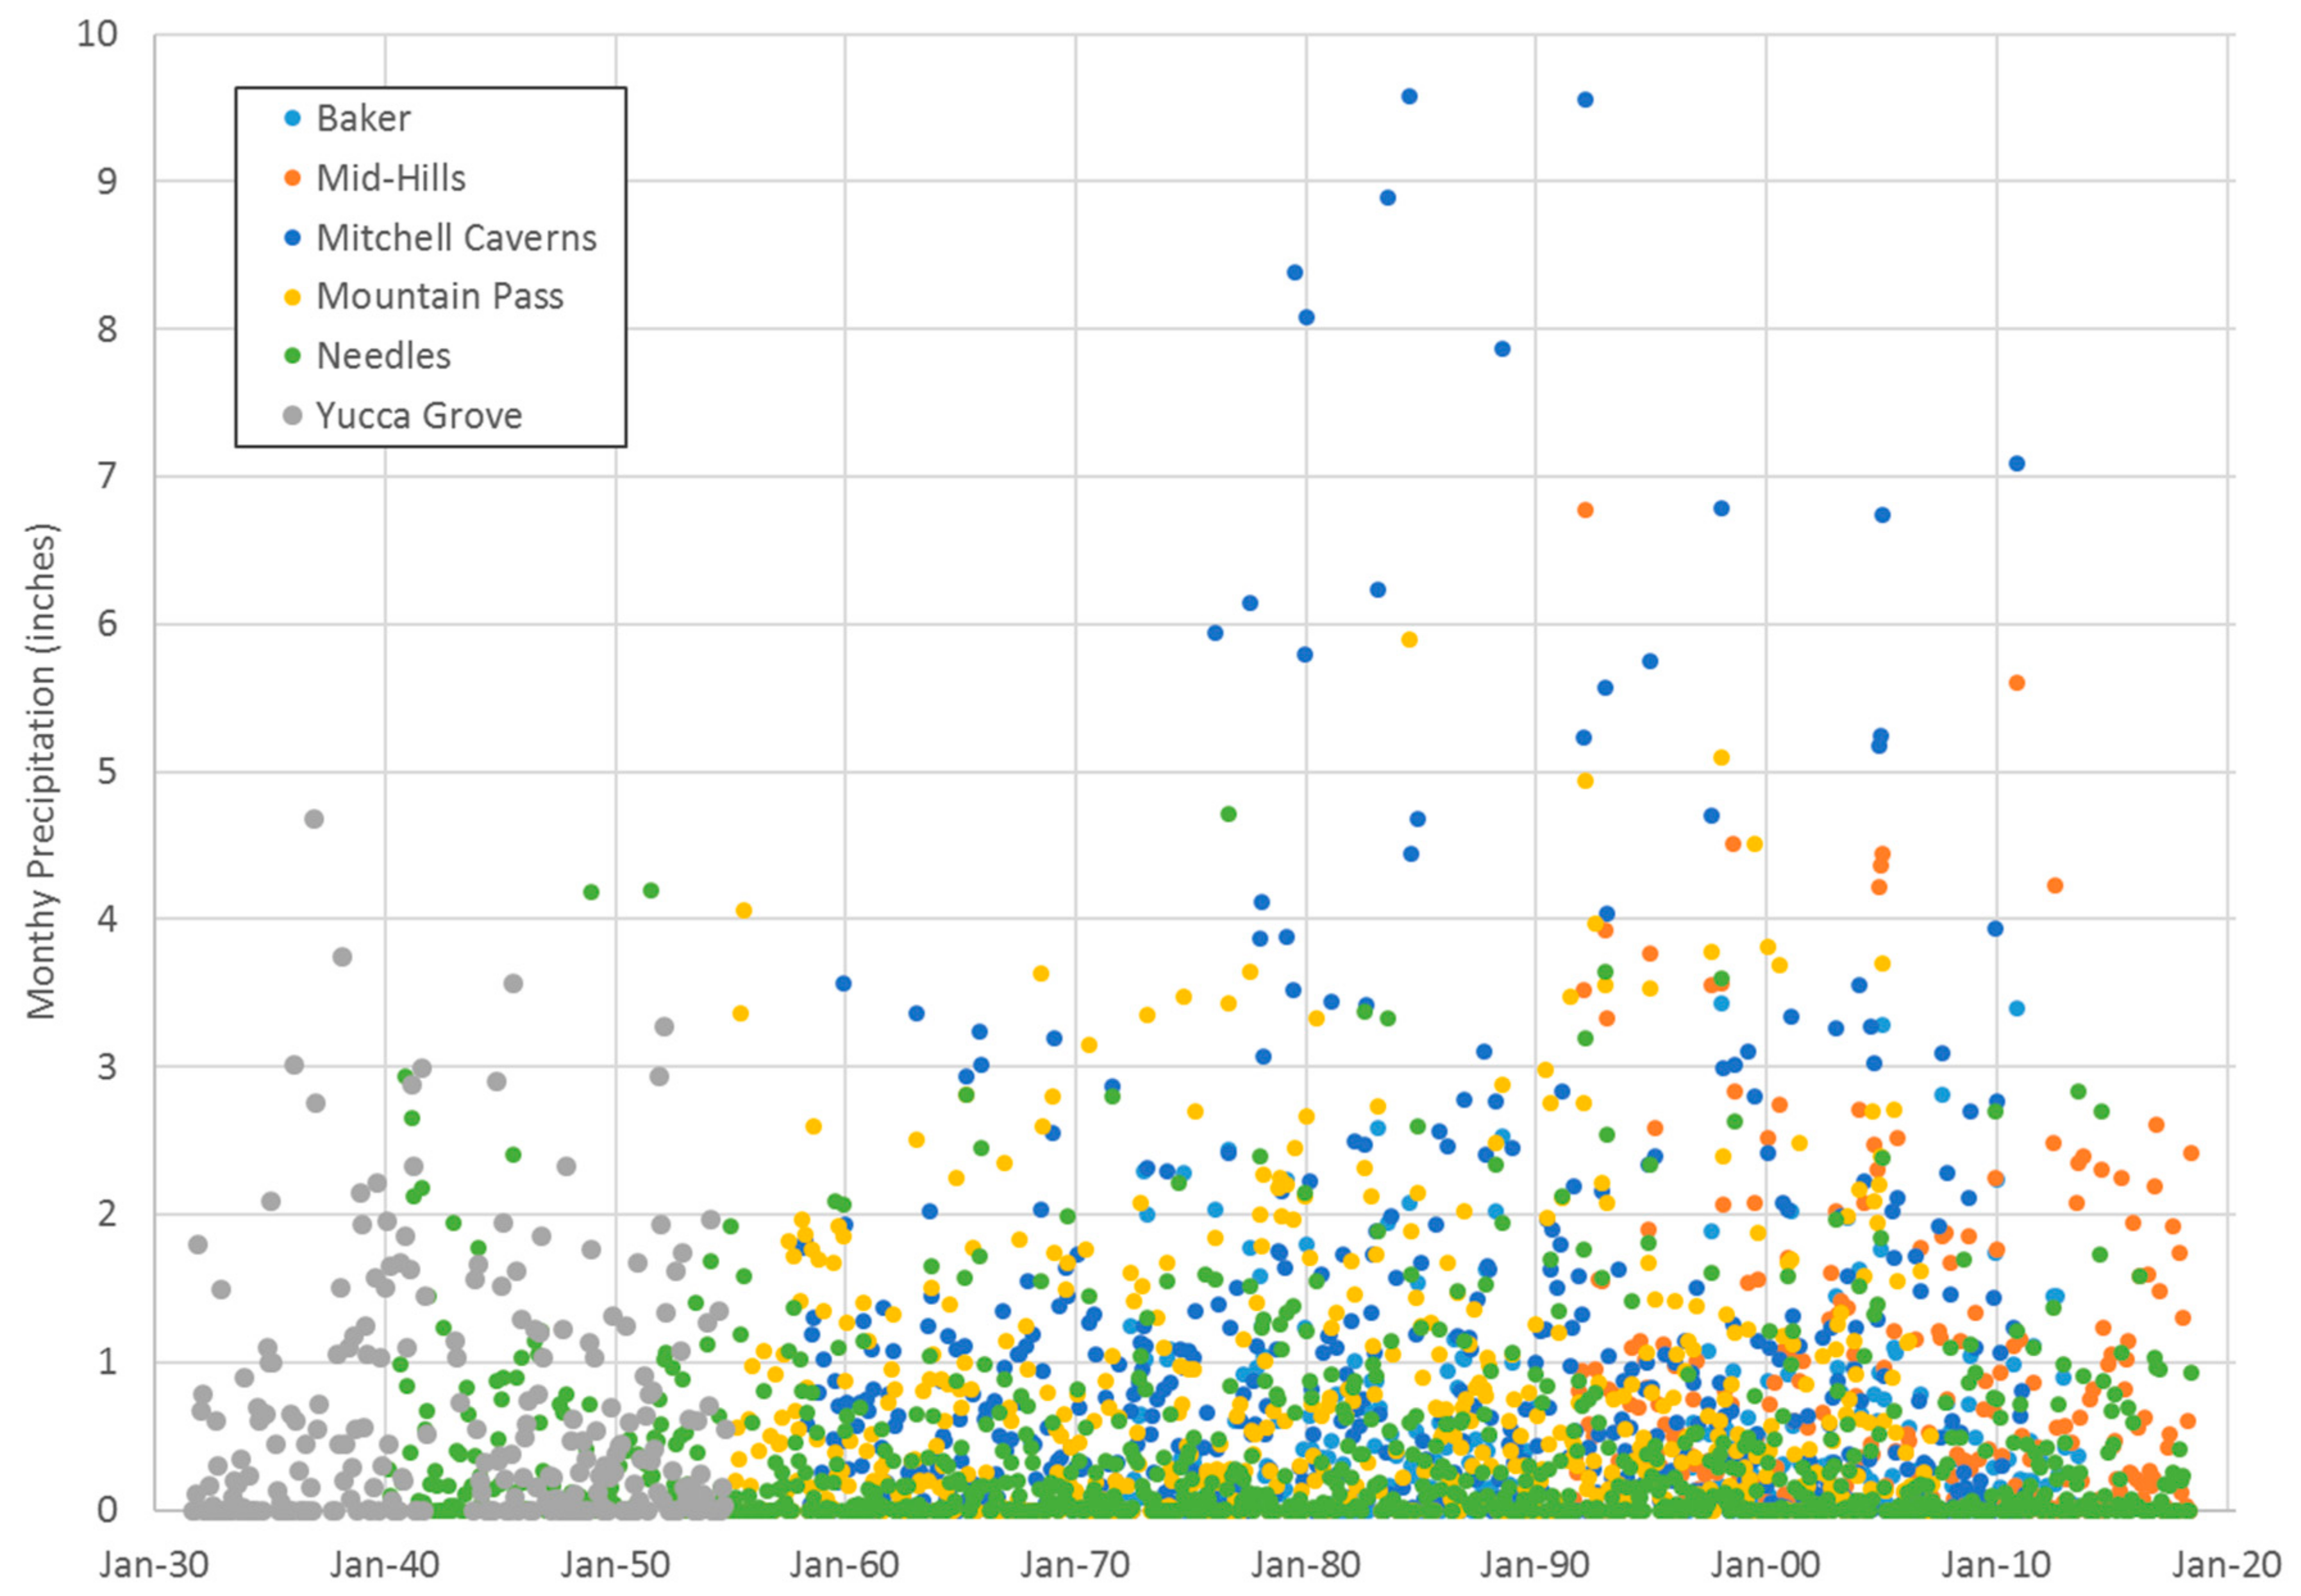
Based on that review, meteorological data was used for six stations within, or adjacent to the study area. These included the Mitchell Caverns, Mid-Hills, Yucca Grove, Mountain Pass, and Baker and Needles stations (see precipitation record for each station shown in
Figure 5). Of these, only Needles and Mid-Hills reported precipitation data from recent years.
3.1. Evaluation of the Historical Precipitation Record
The precipitation record in this arid region general exhibits bi-modal, winter/summer precipitation seasons, noted by multi-decade wet and dry periods—with the period 1976 through to 1998 being the wettest in the Mojave Desert during the 20th century [
14]. Tagestad, et al. (2016) [
15] evaluated the long-term precipitation record for the Mojave Desert as a whole, and statistically identified 30- to 40-year long wet/dry cycles throughout the record. These included an early-century wet period (1905–1946); and mid-century drought (1947–1975); and a later-century wet period (1975–2010). Annual precipitation has generally been below the 1975–2010 average since 2010 (
Figure 5).
Of the networks reviewed, Mitchell Caverns has been the principal station that is used in evaluating precipitation and associated recharge estimates. Mid-Hills Station, which is located approximately 15 miles northeast of the Mitchell Caverns Station, between the Providence Mountains and the New York Mountains, has also been extensively used. It is important to note that the Mid-Hills Station is more than 1000 feet higher in elevation than the Mitchell Caverns Station. Comparing the precipitation records shows that annual precipitation and sub-annual precipitation durations at Mid-Hills Station are less than that at Mitchell Caverns, despite its higher elevation.
At least part of this precipitation vs. elevation difference observed between Mitchell Caverns Station and Mid-Hills Station can be attributed to the isolated nature of heavy monsoonal storms during the summer and early fall, and the effect that topographic relief plays on convection and thunderstorm development. [
16]. Nonetheless, elevation alone does not result in increased precipitations, as the more prominent the mountain mass is above the surrounding plains, the greater the updrafts, and the associated convection in the storm cells result in more precipitation.
As an example of this isolated nature of summer storms, during August 2005, the Mitchell Caverns Station had a total monthly precipitation of more than three inches, while the higher Mid-Hills Station had less than one inch of precipitation. In the case of the Mid-Hills Station the topographic relief of the higher summits are substantially less than at the mountains (Edgar Peak and Clark Mountain) in the Providence—New York Mountains, and Clark Mountains respectively. Precipitation in this region is not only related to elevation but also to topographical relief, hence the inverse precipitation-elevation relationship between the Mitchell Caverns and Mid-Hills stations. This results in a more complex precipitation patterns and relationships than what was previously assumed in most of the previous study’s recharge estimates. This pattern was also discussed by the U.S. Geological Survey in their evaluation of regional recharge [
9].
Additionally, while this region is currently experiencing a new, post-2010 dry period, future climate change in the Mojave region is anticipated to result in hotter and drier conditions [
17], which are expected to have long-term recharge impacts to this region.
3.2. Evaluation of Recharge Estimate Methodologies
A comparison of the recharge estimates resulting from each of the five studies is shown in
Figure 6. While numerical groundwater models are ideal tools to evaluate transient, three-dimensional groundwater issues in that the complexities of the groundwater system can be evaluated in detail, and assumptions of how the groundwater system works can be tested for internal consistency, a brief summary and evaluation of each study’s methodology and result is provided below.
3.2.1. Geoscience Support Services (1999)
Geoscience Support Services, Inc., (GSS) developed a comprehensive watershed model to evaluate recharge within the Bristol, Cadiz and Fenner Watersheds [
8]. The watershed model estimated the groundwater recharge (called recoverable water in the report) as ranging from 14,800 to 37,000 acre-feet per year (AFY). The watershed model was developed based on guidance from the San Bernardino County Hydrology Manual [
18], and by using the construction of an isohyetal map with the inclusion of precipitation records at Mitchell Caverns, Amboy, Needles, Yucca Grove, Kelso, Twentynine Palms, and Mountain Pass. Although GSS did not explicitly note the period of records that were used for each station, the hydrologic analysis within the report used precipitation data from 1975 to 1997, which is entirely within a wet cycle of regional precipitation [
15]. GSS reported that adjustments were made to the precipitation intensity and other site-specific parameters, but the specifics were not detailed.
The GSS watershed model development also required numerous field parameters and these had many assumptions and simplifications, such as: (1) soil characteristics that assumed infiltration characteristics (soil thickness, field capacity, apparent specific gravity, and soil curve number; (2) daily evapotranspiration rate, vegetation density, vegetation interception, and the initial moisture content of the soil. The reports note that these parameters were estimated by field observations, and the model was highly sensitive to field capacity and soil thickness. Although some factors assumed (such as initial soil moisture) can typically vary widely and result in substantial effects in the analysis, few measurements of field indices were detailed.
While desert pavement (wind-polished, closely packed rock fragments that cover a desert surface where wind has removed fine-grained particles, protecting the underlying materials) substantially limits infiltration where it is present [
19] and in the project area provides a surface veneer to alluvial terraces, little discussion of such surfaces were included in the GSS report.
Given the large region of interest in the model and the high spatial variability in these parameters that exists that the model does not attempt to capture, considerable uncertainty is expected for the resulting recharge estimate. A chloride mass balance approach to estimating recharge was used to validate the watershed model; however, multiple assumptions required for a valid analysis (e.g., that the chloride in the groundwater originates solely from precipitation directly on the aquifer, and there is no recycling or concentration of chloride within the aquifer) were known to be violated [
8].
3.2.2. U.S. Geological Survey (2000)
The U.S. Geological Survey (USGS) prepared a preliminary estimate of groundwater recharge using the Maxey–Eakin Method [
9], a commonly used recharge estimation method for the Basin and Range and Mojave Desert regions. The U.S. Geological Survey used two different scales to estimate recharge. The first model used a wide-ranging precipitation model extending far beyond the Bonanza Spring area. The second model focused on area-specific precipitation stations/records. As described above, the period of record for key stations, such as Mitchell Caverns, suffer from both a period of record entirely within a multi-decade wet period, but also from topographic effects on precipitation totals.
The first model (with wide-ranging data) is limited by its inclusion of datasets that are atypical of project area conditions [
10]. The second model reflects the wet period dominant record [
15] given the stations used and that the estimated precipitation vs. elevation relationships are skewed high, largely due to the Mitchell Caverns station, which has received more precipitation than the higher elevation stations (as discussed in Evaluation of Precipitation Record section above).
The first model’s derived recharge estimate to the Fenner, Bristol and Cadiz basins was 2547 AFY. The second model’s estimated recharge estimate to the Fenner, Bristol and Cadiz basins was 11,807 AFY, and given the period of record for the stations used, and the increased precipitation measured at Mitchell Caverns relative to the stations at similar or higher elevations, the long-term recharge is likely less than 11,807 AFY, using this method.
3.2.3. Lawrence Livermore National Laboratory (2000)
Davisson and Rose (2000) [
10] presented a range of groundwater recharge estimates ranging between 7864 AFY to 29,185 AFY. Personal communications [
20] indicate that a best estimate of groundwater recharge based on their work would be an estimate that is closer to their regional precipitation-elevation curve of 16,214 AFY. The 29,185 AFY estimate was a maximum estimate (upper error bound).
As with the USGS recharge evaluation, the Maxey–Eakin analysis conducted by Davisson and Rose was based on a data record during a wetter-than-average period [
15]. Again, based on a long-term average annual precipitation trends, the recharge could be anticipated to be less than predicted. The inclusion of the most recent precipitation data, including those from the Mid-Hills station has the effect of raising the elevation for the 8-inch precipitation contour, which in turn reduces the recharge area and volume of the groundwater recharge to lower than that predicted by both Davisson and Rose [
10] and the U.S. Geological Survey [
9].
3.2.4. CH2M Hill (2011)
A CH2M Hill (2011) Report [
11] included an update of work performed by Geoscience Support Services using the U.S. Geological Survey programs INFIL3.0 and MODFLOW to re-evaluate the estimated groundwater recharge that was previously estimated by Geoscience Support Services (1999). Based on these efforts, the average annual “recoverable” water quantities for the Fenner Watershed area are estimated at 30,191 AFY and 2256 AFY for Orange Blossom Wash (32,447 AFY combined).
CH2M Hill’s report includes a INFIL3.0 model that represents large areas in the region (in the hundreds of square miles) to have identical characteristics. Given the local landscape and the high special variability of surface soil conditions, this assumption does not reflect the realities of the physical conditions, and it thus incorporates substantial generalization and uncertainty to the model results, similar to the previous GSS [
8] analysis. Also, as did the GSS [
8], USGS [
9], and LLNL [
10] recharge estimates, the CH2M Hill [
11] report uses precipitation records from periods that were wetter than the long-term average conditions [
15].
CH2M Hill reported the attempted use of these derived recharge rates in numerical groundwater flow modeling of the region [
21]. The evapotranspiration rate was a calibrated parameter in the reported model, and it allowed for the evapotranspiration rate to vary substantially between recharge scenarios, even though evapotranspiration would be unlikely to change, given that the playa soils would remain unchanged, the climate factors would be unchanged, and assuming that the groundwater levels would be above the extinction depth, allowing evapotranspiration to take place. A more reliable test of the recharge estimate using the numerical model would have been to use a published evapotranspiration rate from salt-encrusted dry lakes, and to calibrate to the recharge.
However, their modeling resulted in the required acceptance of high evapotranspiration rates to calibrate the model. High evapotranspiration rates were necessary in the model to allow for the amount of water to discharge from the Bristol and Cadiz Playas to accommodate the high estimated recharge rate [
12]. CH2M Hill reported the use of evapotranspiration rates greater than 50 ft/year for Cadiz Dry Lake and 20 ft/year for Bristol Dry Lake. These rates are substantially above the pan evaporation rate (nearly five times the pan evapotranspiration rate for Cadiz Dry Lake, and approximately 10 times the U.S. Geological Survey’s evapotranspiration rate from playa soils in Death Valley), and they are unreasonable, which suggests that other model parameters (such as recharge) are also not accurate.
3.2.5. Johnson Wright Inc. (2012)
Johnson Wright Inc. (JWI) (2012) [
12] used a discharge evaluation that was based on more recent evapotranspiration data than what was used in the CH2M Hill analysis. Continuous micrometeorological data collected over a four-year period in Death Valley were used to estimate evapotranspiration rates over the area evaluated [
22]. The JWI analysis resulted in more consistent and generally improved estimates of groundwater discharge than in previous studies [
22]. DeMeo’s resulting midpoint evapotranspiration rate estimates were 0.13 feet per year (ft/yr) for salt-encrusted playa, and 0.15 ft/yr for bare-soil playa. JWI assumed the 0.15 ft/yr evapotranspiration rate resulting in 8947 AFY of evapotranspiration losses from the Bristol and Cadiz playas (based on the area in which evapotranspiration takes place in the CH2M Hill model). Further, adding the estimated annual pumping from the basin of approximately 5000 AFY [
11] and assuming that the basin is in hydrologic balance or that inflow equals outflow, an estimated recharge of approximately 14,000 AFY can be inferred (plus the volume of spring discharge which is likely small in comparison to the total recharge estimate and within the error of the estimate). However, the JWI analysis also should be considered to have a high estimate of recharge, due to the use of a surface evapotranspiration estimate that does not account for the extinction depth and the existing depth to groundwater beneath the playas. Thus, JWI’s high estimated recharge of approximately 14,000 AFY plus spring discharge is similar to the best estimate of Davisson [
9,
20], as calculated from above average periods of precipitation.
3.3. Isotopic Characterisitics of Spring Water at Selected Springs
The recharge estimates can be further assessed based on the radiocarbon characteristics of these perennial springs in the study area. While tritium was not detected in any of the water collected from these perennial springs in the sampling events indicated, which would have been expected if the water was sourced by a recent recharge, a previous sampling collected from Theresa Spring had detectable levels of tritium (1.38 TU). The detection of tritium suggests that, on occasion, Theresa Spring includes a significant amount of source water from more recent recharge, but the recent absence shows that the inclusion of local recharge is likely to be highly seasonal. Based on the results of the
14C analysis, the following apparent water ages (corrected for δ
13C results) were identified (
Table 3):
These radiocarbon results are similar to the radiocarbon results in groundwater in the area presented by Rose [
23] and is consistent with the result of groundwater aging in the Fenner Valley basin-fill aquifer by Davisson [
24]. Radiocarbon ages of water are considered “apparent ages” since waters can dissolve and mix additional radiocarbon-free carbon by chemical reactions with aquifer materials producing a dilution of the original radiocarbon content that results in ages that may be older than actual. Additionally, older waters can mix with more recent recharge and reflect more recent radiocarbon ages compared to the age of some of the source water. Nevertheless, the radiocarbon ages of these perennial spring waters reflect that a substantial portion is sourced from water of the older basin-fill regional groundwater and not recent, local seasonal recharge.
4. Discussion
Given the high degree of spatial and temporal variability, and the vast distances without data, precipitation-driven recharge estimation in the study area are subject to substantial uncertainty resulting from:
Issues associated with the precipitation record, both in the period of the record (higher than average period), and incomplete records;
Local topographic effects on precipitation patterns;
Substantial spatial variability of surface soil and rock characteristics that are not considered in the analyses, which include the data input for those characteristics.
These large uncertainties in the derived recharge values hinder the ability to appropriately assess and manage the water resources in the region.
Alternatively, a more reliable method to evaluate the basin integrated recharge in the Fenner, Cadiz, and Bristol basins based on a numerical groundwater flow model is hampered by the lack of site-specific parameters calibrate to recharge, and the expectation that given the size and complexity of the basin modeling, the results are unlikely to have a single unique solution. A modeling effort with the purpose of estimating recharge would require a detailed sensitivity analysis, and the consideration of potentially multiple conceptual site models to determine a more reliable range of plausible recharge estimates. Such a basin scale hydrologic analysis would benefit from the incorporation of the flows from perennial spring in the model hydrodynamics to evaluate the role of groundwater versus local recharge on flow dynamics. CH2M Hill reported that using a simplistic analytical model for evaluating the connection between the basin-fill aquifer and Bonanza Spring, approximately eight feet of groundwater drawdown appeared to eliminate the surface flow that currently occurs at a relatively constant rate, and which would also be reasonably expected to result in a substantial reduction in the vegetation cover in the riparian area [
11].
The ages derived from the perennial springs in the Fenner and Bristol groundwater basin water are consistent with the sourcing work conducted previously [
1,
24], and the regional nature of groundwater flow discharging at Bonanza Spring. Even without knowing the specific hydrologic pathway, with respect to Burnt Spring, Hummingbird Spring, Vernandyles Spring, and Theresa Spring, this analysis suggests that those waters derive from one of the three following potential sources:
recharge in the upper elevations of the Clipper Mountains which takes approximately 2000–4000 years for that water to reach spring discharge locations;
from a similar basin-fill aquifer source to Bonanza Spring, but with a less tortuous/more permeable path that allows it to travel to the discharge location thousands of years faster;
a mixture of water from the basin-fill aquifer source to the north, and more recent recharge that results in the tritium content being diluted to non-detectable concentrations, and where the radiocarbon ages are composite ages that reflect the apparent age result from the mixing of two distinct sources.
For Scenario 1, the necessary travel times are unreasonably slow. For example, for Bonanza Spring, given the apparent age of 15,500 years, and the short travel path within the catchment area (approximately 1400 ft), the apparent groundwater velocity would be on the order of 10−4 ft/day. This rate would not be sufficient to sustain the spring flow.
For Scenario 2, the discharge from these other perennial springs is lower than would be expected, given Bonanza Spring’s flow rate if they were solely sources from a comparable groundwater formation.
Therefore, the more complex Scenario 3 appears to be most plausible. The age of the water discharged from Bonanza Spring and considering the small catchment area (50 acres) precludes this water from being sourced within that catchment. First, the Maxey-Eakin analysis conducted by Lawrence Livermore Laboratory [
20] indicates that for the mid-elevations of the small catchment above Bonanza Spring (e.g., at an elevation of approximately 680 m or 2230 feet above mean sea level), the recharge rate for the Bonanza Spring catchment would be 0.010 ft/yr. Given that the catchment is volcanic rock and that the Maxey-Eakin Method does not consider surficial soil or rock conditions, and this would result in the same recharge rate for more permeable sandy alluvium present in the area, this recharge rate on a local basis would likely be high. Nevertheless, this recharge rate would only provide a maximum of approximately one-third of the water to account for the discharge at the spring (approximately 10 gallons per minute or 15 AFY). Further, to maintain constant flow would also indicate that recharge remains constant and would not account for the widely varying precipitation seasonally and annually that is measured in the area. As described in the report by Kenny (2018) [
25], the storage in that system conceptualization could only maintain constant flow in the order of a couple of decades during extended dry periods, and thus it cannot account for the approximately 100-year record indicating that such spring flows have minimal observed seasonal changes.
There are springs to the north (up-gradient) of Vernandyles and Theresa Springs at elevations that are higher than either of these springs within the Mojave National Preserve, indicating that Vernandyles and Theresa Springs discharge at elevations that could be fed from a more distant alluvial source that encounters the volcanic rocks from which both Vernandyles and Theresa Springs discharge. The same can be said of the springs in the Clipper Mountains (Bonanza, Burnt and Hummingbird).
Given the existing uncertainties in specific hydrologic flow paths and the recharge estimation, the degree of hydraulic connection between the basin-fill aquifer and these perennial springs, and the expectation of a hotter and dryer climate in this region for the foreseeable future, water resource management would need to use recharge estimates in the basin within the 4000 to 12,000 AFY range (consistent with the range of U.S. Geological Survey [
9] estimates and the lower-end of estimates by LLNL [
10], but lower than the estimates by GSS [
8], CH2M Hill [
11], and JWI [
12]) in order to protect the water resources in the region, until more refined recharge estimates can be determined using the detailed and site-specific modeling approaches described above.
While there are springs observed in this region that are seasonal and that appear to source from local precipitation-driven recharge, the perennial flow and older radiocarbon characteristics of Bonanza Spring, Hummingbird Spring, Burnt Spring, Vernandyles Spring, and Theresa Springs indicate that they are not exclusively sourced from local recharge. Thus, these spring flows, and the ecological community that depends on such flows, are inseparably connected to the regional groundwater and any groundwater management decisions that can impact on this resource.


