Article

Characterization of Temporal and Spatial Variability of Phosphorus Loading to Lake Erie from the Western Basin Using Wavelet Transform Methods

1
Civil and Environmental Engineering Program, Youngstown State University, One University Plaza, Youngstown, OH 44555, USA
2
Department of Bioresource Engineering, McGill University, 21,111 Lakeshore Road, Ste-Anne-de-Bellevue, QC H9X 3V9, Canada
*
Author to whom correspondence should be addressed.
Hydrology 2018, 5(3), 50; https://doi.org/10.3390/hydrology5030050
Submission received: 21 June 2018 / Revised: 19 August 2018 / Accepted: 28 August 2018 / Published: 11 September 2018

Abstract

:
The characterization of temporal and spatial patterns in phosphorus (P) loading in Lake Erie is essential in order to continue monitoring the excessive P condition that comes from the western Lake Erie Basin. This study aims to perform such a characterization using the continuous wavelet transform (CWT) and the discrete wavelet transform (DWT) methods. These wavelet transformations were conducted on streamflow data, TP loads, and soluble reactive phosphorus (SRP) of six stations located near Lake Erie of Northern Ohio. These stations are located near the outlet of Cuyahoga, Grand, Maumee, Vermilion, Raisin, and Sandusky watersheds. Long-term continuous P loading data, in which some dated back to 1970, were used in the analysis. The results obtained from the CWT and DWT approaches were found to complement each other. Streamflow had significant mixed variability at 1, 2, and 4 years. The variability for SRP was limited to 1 and 2 years while the TP variability was only seen at the 1-year scale. It was interesting to find that strong temporal patterns of SRP were observed in most of the watersheds only after the mid-1990s. The CWT wavelet spectra also reflected the land use characteristics of each watershed. For example, the wavelet spectra of surface runoff and TP for the agricultural watersheds (i.e., Raisin, Sandusky, and Maumee Rivers) were similar and characterized by significant variability primarily at the annual scale and at the two to four-year periodicities. The urbanized watershed (i.e., Cuyahoga River) did not show any association between either phosphorus (TP or SRP) with surface runoff and baseflow, which indicates that P in the urbanized watershed was not driven by the flow.

1. Introduction

Lake Erie has a long history of cultural eutrophication, which is mainly due to excessive phosphorus (P) loading from agricultural runoff [1,2] point-source discharges [3,4], invasive mussels, nuisance and harmful algae [5], and internal P loading [6]. Depletion of oxygen is significant due to algal blooms caused by the excess nutrient loading [7,8,9]. Such algal blooms have not only caused environmental and human health problems, but also threatened tourism, fishing industries, and the overall economy.
The implementation of the Great Lake Water Quality Agreement between the US and Canada was successful in achieving significant reductions in P loading [10]. Both countries adopted BMPs [11,12] that resulted in reduced sediment and particulate P, total phosphorus (TP) load [3], TP concentration [13], algal biomass [14], and hypoxia at the bed level [7,15] through the mid-1980s. The target load of 11 × 106 kg was achieved for the first time in 1982 and, since then, the target has been maintained except during extremely wet years. Even though the target load level has been maintained and TP started to decrease as a result of the point-source reduction and the effects of conservation practices, soluble reactive phosphorus (SRP) from several tributaries especially the western basin showed an increase. As a result, Lake Erie tended to be more eutrophic [16], which is indicated by the increase in cyanobacteria since the mid-1990s [17,18].
Since SRP is highly bioavailable [19,20,21], the hypoxia [22,23,24] and algal blooms [6,25] in Lake Erie have increased significantly since the early 1990s. As a result, a record-breaking algal bloom was detected in 2011 due to severe precipitation events and agricultural practices that caused increased SRP [12,17]. The increase in soluble phosphorus content in Lake Erie in recent years has been typically observed during spring rainfall events. The P content in fertilizers used in agricultural lands gets washed off from the field and enters the lake, which is the principal cause of algal blooms in Lake Erie [26].
Initially, more emphasis was given to TP reduction as a part of the Lake Erie eutrophication reduction effort during the mid-1980s (10). Later, emphasis was also placed on SRP [20,27] due to its bioavailable nature [10,19]. This increased the SRP load and resulted in decreased, dissolved oxygen in Lake Erie [24].
A number of studies have been conducted in order to find ways to reduce algal bloom in Lake Erie [17]. Unfortunately, the problem still persists and has deteriorated in recent years especially in the western Lake Erie basin. The sources of P may vary from watershed to watershed, which is reflected in the differences in their nutrient loading patterns.
In light of the above information, this study aims to evaluate the spatial and temporal variability of P loadings both in time and in the frequency domain in the western basin of Lake Erie using data from the upland watersheds. More specifically, this study employed wavelet analysis using both continuous wavelet transform (CWT) and discrete wavelet transform (DWT) approaches to: (1) characterize the P loading in Lake Erie from six watersheds including the Raisin, Maumee, Sandusky, Vermillion, Cuyahoga, and Grand Rivers watersheds, (2) assess the temporal evolution of the different time scales contained in the TP, streamflow, and SRP data, and (3) determine the significant periodicities in the TP, streamflow, and SRP data. By identifying significant periodicities in TP, streamflow, and SRP, one can determine the frequencies that are dominant in these data and study their evolution, which then facilitates the understanding of the dynamics and trends and to potentially determine the causes of certain features and events in the analyzed data. This is especially applicable to the main goal of this study since the wavelet transform (WT) enables the authors to characterize and study the P loading into Lake Erie. To the best of the authors’ knowledge, this is the first study to investigate the time and frequency variation of P loading in Lake Erie from the western basin using historical data.

2. Theoretical Background

2.1. Wavelet Analysis

Wavelet analysis is a spectral-analysis method that uses wavelets as its building block. The main goal in using WT is to find out the time-frequency distribution and how the power evolves over time. A wavelet is a wave function with limited time duration and asymmetrical shape that can be rescaled and translated along the analyzed time series, which localizes important events in the time series [28]. Wavelet analysis has been applied in many studies related to the atmospheric and oceanic sciences and ecological and nutrient modeling [29,30]. These recent studies illustrated and emphasized the advantages of WT—over traditional spectral-analysis method such as the Fourier Transform method—in localizing important features of signals especially those that have non-stationary characteristics at their exact temporal location (e.g., [31,32,33]).
The Wavelet transform decomposes a time series into its time and frequency components to observe the time-frequency distribution between two variables (one dependent and one independent) in order to understand how their relationship evolves over a time period [34]. Data decomposition using WT produces a set of wavelet coefficients, which measure the similarity between the mother wavelet and the different frequencies contained in the analyzed signal. Signal reconstructions are then possible from the wavelet coefficients. Data decomposition using WT can be achieved using CWT or DWT approaches. Signal reconstructions with DWT are relatively simple to accomplish using the inverse filter function of the DWT as the DWT operates on dyadic scales (integer powers of two). On the other hand, signal reconstructions using CWT are more complicated due to the redundancy in the time-scale information inherent in the CWT when it operates on continuous scales [34]. The decomposition of a time series xn using WT can be accomplished using the following function [35].
  Ψ n , s   ( n ) =   1 s   Ψ   ( n n s )  
where s denotes the scaling factor, n is the translation factor, and Ψ ( n ) is the analyzing wavelet.

2.2. Continuous Wavelet Transform (CWT)

The CWT transforms a one-dimensional signal (e.g., time series) into a two-dimensional time and frequency space and also analyzes localized recurrent oscillations. This study used a wavelet function µ0 (n) for any time series xn (n = 0, …, N − 1) for δt time spacing with a zero mean localized in time and frequency space. The choice and selection of the wavelet function depends on the analyzed series. The Morlet wavelet function is considered appropriate for hydrological time series because it strikes a proper balance between time and frequency [34]. The function is defined below.
  ψ 0 ( η ) =   π 1 4 e i w o n e η 2 2  
where η and wo are the non-dimensional time parameter and non-dimensional frequency, respectively. Readers can refer to [34] for detail about the CWT.

2.3. Discrete Wavelet Transform (DWT)

Data decomposition using the DWT approach produces wavelet coefficients that represent variability of events on dyadic scales. The decomposition starts out with the smallest scales and continues to larger scales, doubling in size for each round of iteration. Signal decomposition using DWT produces approximations (As) and details (Ds) coefficients [36,37]. Approximations represent the low frequency components of the data and it is assumed that the trend component is represented in these approximations while Ds represent high-frequency components of the data.
Unlike CWT, data decomposition using DWT does not result in a two-dimensional outcome but is in the form of a time series. This avoids the redundant information inherent in CWT [38,39] and gives a compact representation of the analyzed signal [40]. Wavelet transforms using the DWT approach are expressed below [41].
  Ψ ( j , k ) ( t γ s ) =   1 ( s 0 ) j 2   Ψ   ( t k γ 0 s 0 j s 0 j )  
Ψ represents the mother wavelet, j and k are integers representing the scaling and translation factors of the wavelet, respectively, s 0 is the dilation step whose value is fixed and is greater than 1, and γ0 symbolizes the location variable whose value is greater than zero. For practical reasons and in order to get the dyadic scales position, the values for s0 and γ0 are normally chosen to be 2 and 1, respectively [38,42]. The wavelet coefficients (C) of the DWT can then be calculated using the following equation [41], where scale s = 2j and location γ = 2jk.
  C   ( n , s ) = 1 ( 2 ) s 2   n = 0 N 1 x t Ψ ( t 2 s n )  

3. Methodology

This study used the streamflow and water quality data observed and monitored by the National Center for Water Quality Research (NCWQR) at Heidelberg University: (https://www.heidelberg.edu/academics/research-and-centers/national-center-water-quality-research/tributary-data-download). Three or four samples per day were averaged in order to find the daily P load. The Load estimator (LOADEST) regression method [43] was used to generate these occasional missing daily data using long-term P and streamflow data measured at the same station. To compute the CWT procedures, the codes developed by Torrence and Compo [34] (http://paos.colorado.edu/research/wavelets/) were used. Several modifications in the codes were implemented in order to accommodate the datasets used in the current study. To perform the DWT computation, the multi-level one-dimensional wavelet decomposition option of the MATLAB Wavelet Toolbox was used.

4. Study Area

This study focused on the watersheds contributing to the western basin of Lake Erie. The western basin was selected because (i) it was affected by P loadings mostly compared to the central and eastern basins. The western basin received 60% of the average TP loads while the central and eastern basins received only 30% and 10%, respectively [12], and (ii) watersheds in the western basin did not contribute equally to P loading to Lake Erie. For example, the Maumee and Sandusky Rivers’ contributions were significantly higher when compared to other watersheds. The location of the watersheds is shown in Figure 1 and their detailed land use characteristics including their drainage area is given in Table 1. The watershed such as Maumee, Sandusky, and Vermillion are primarily agricultural watersheds while Cuyahoga is an urbanized watershed and Grand and Raisin are forest and agriculture dominated watersheds, respectively.
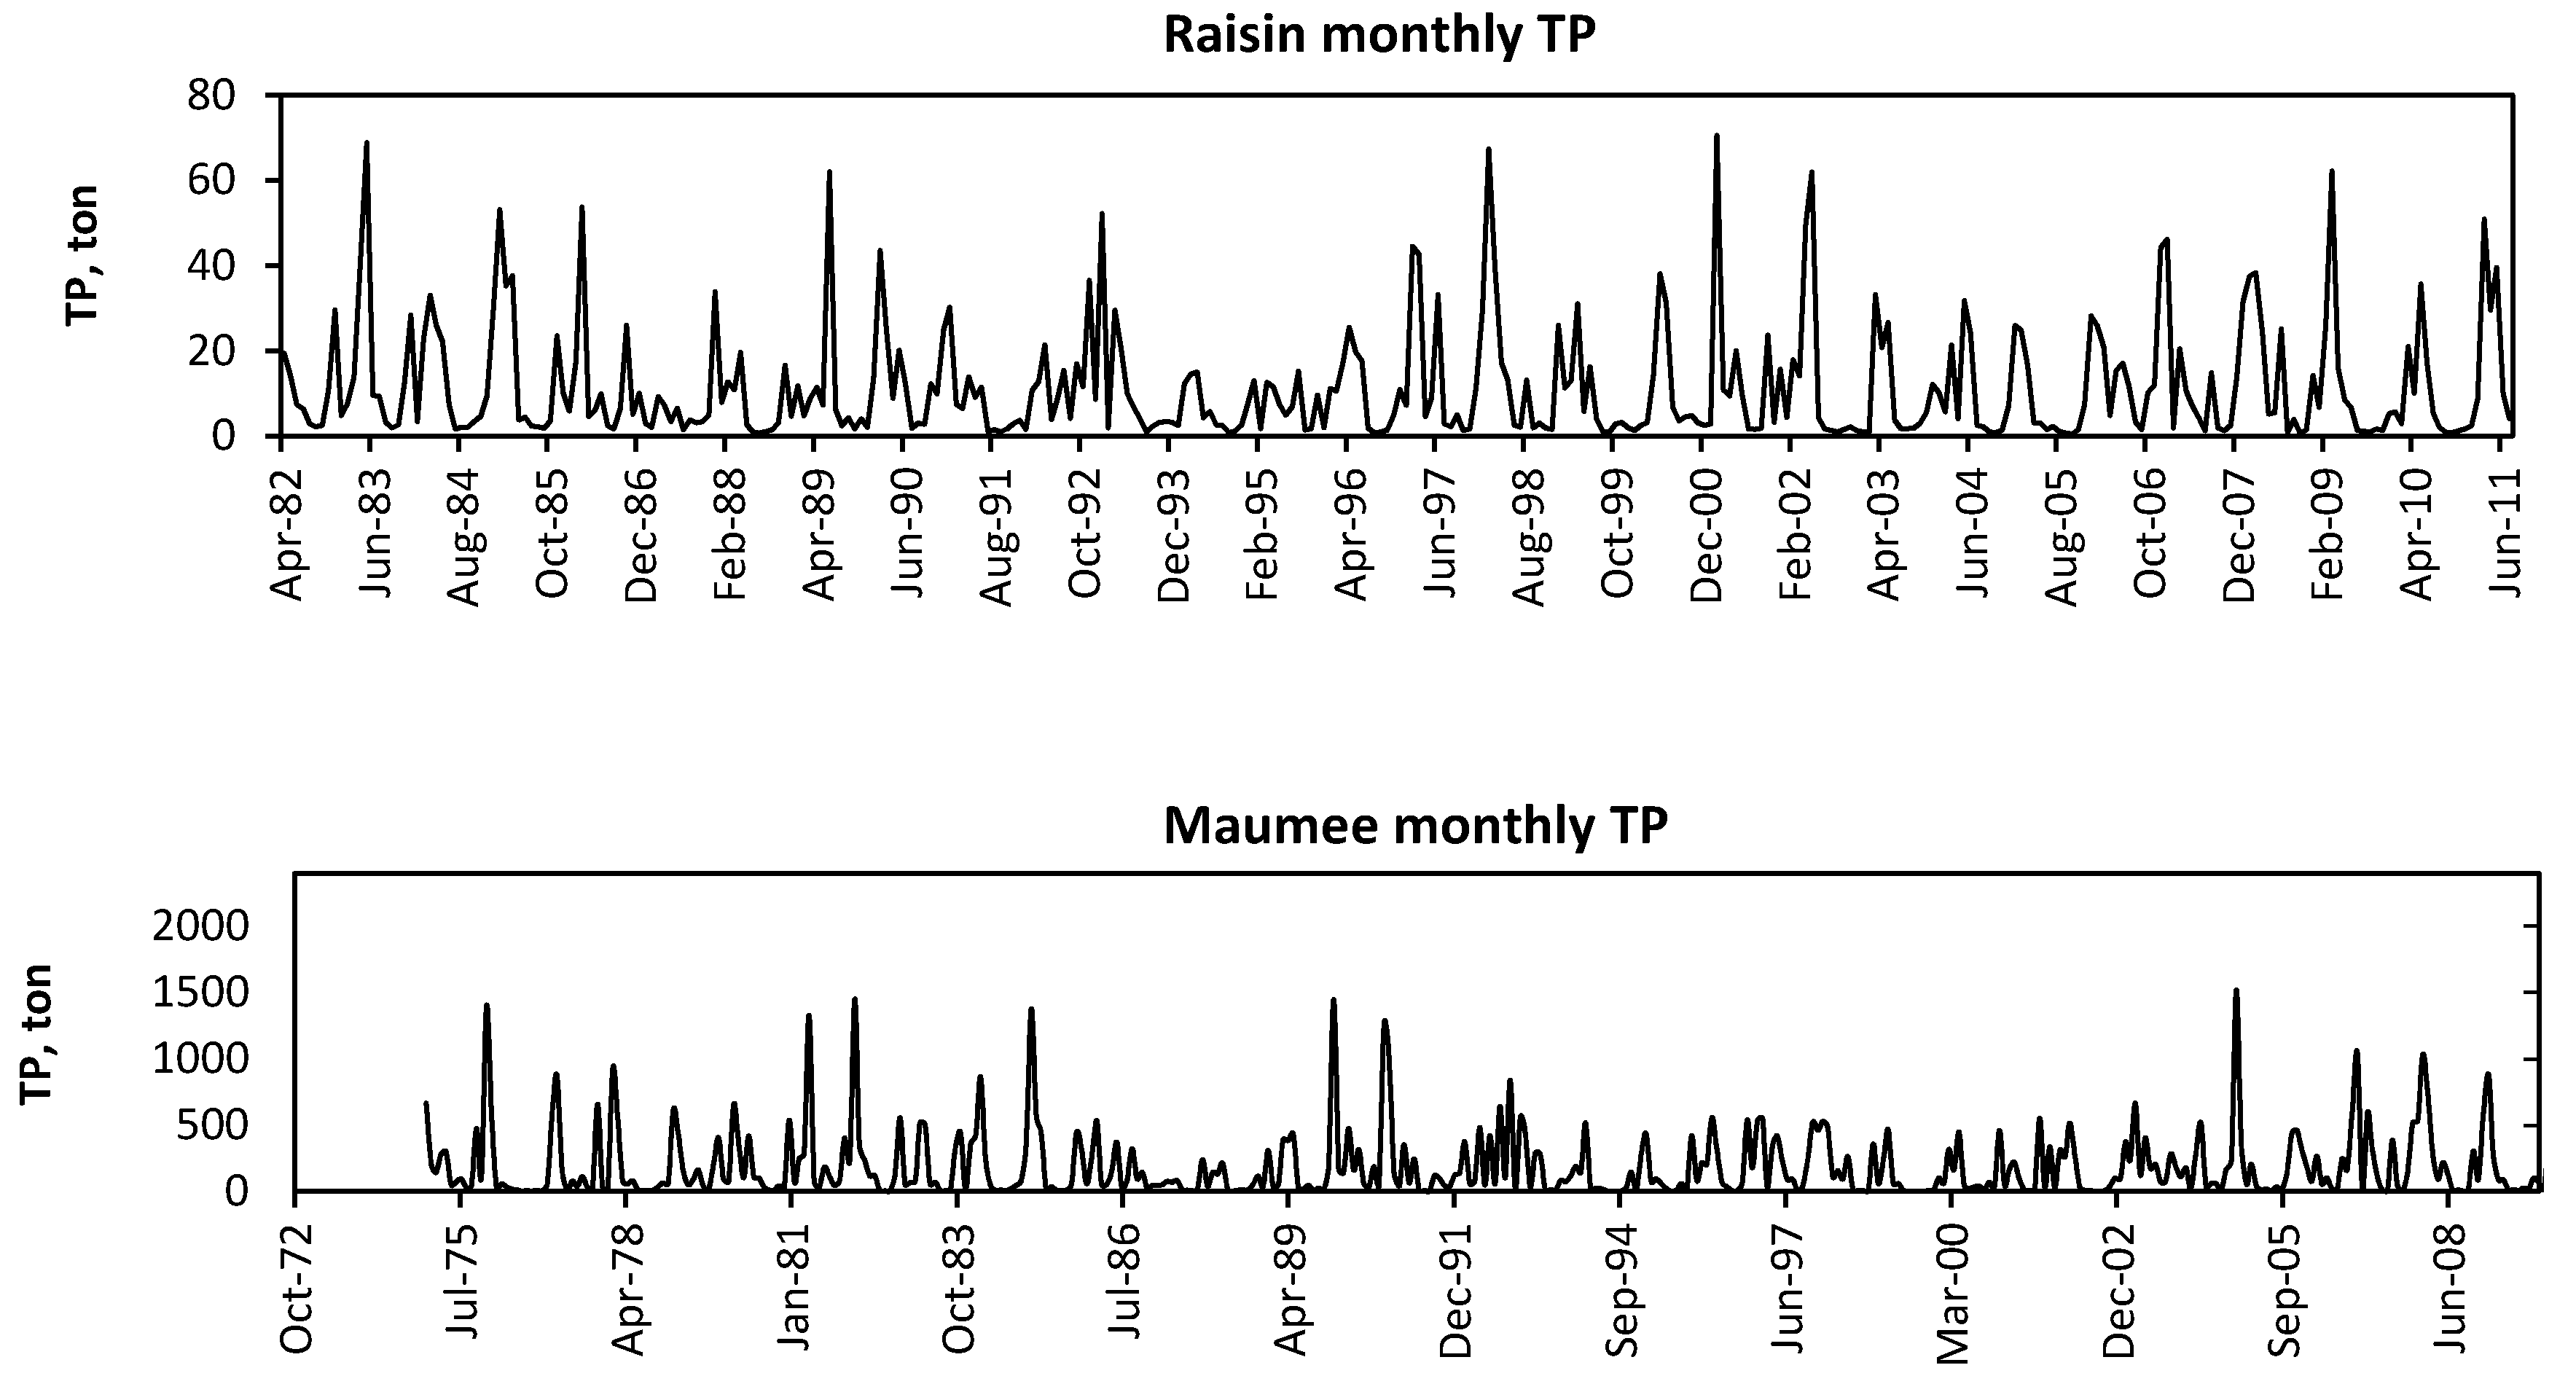
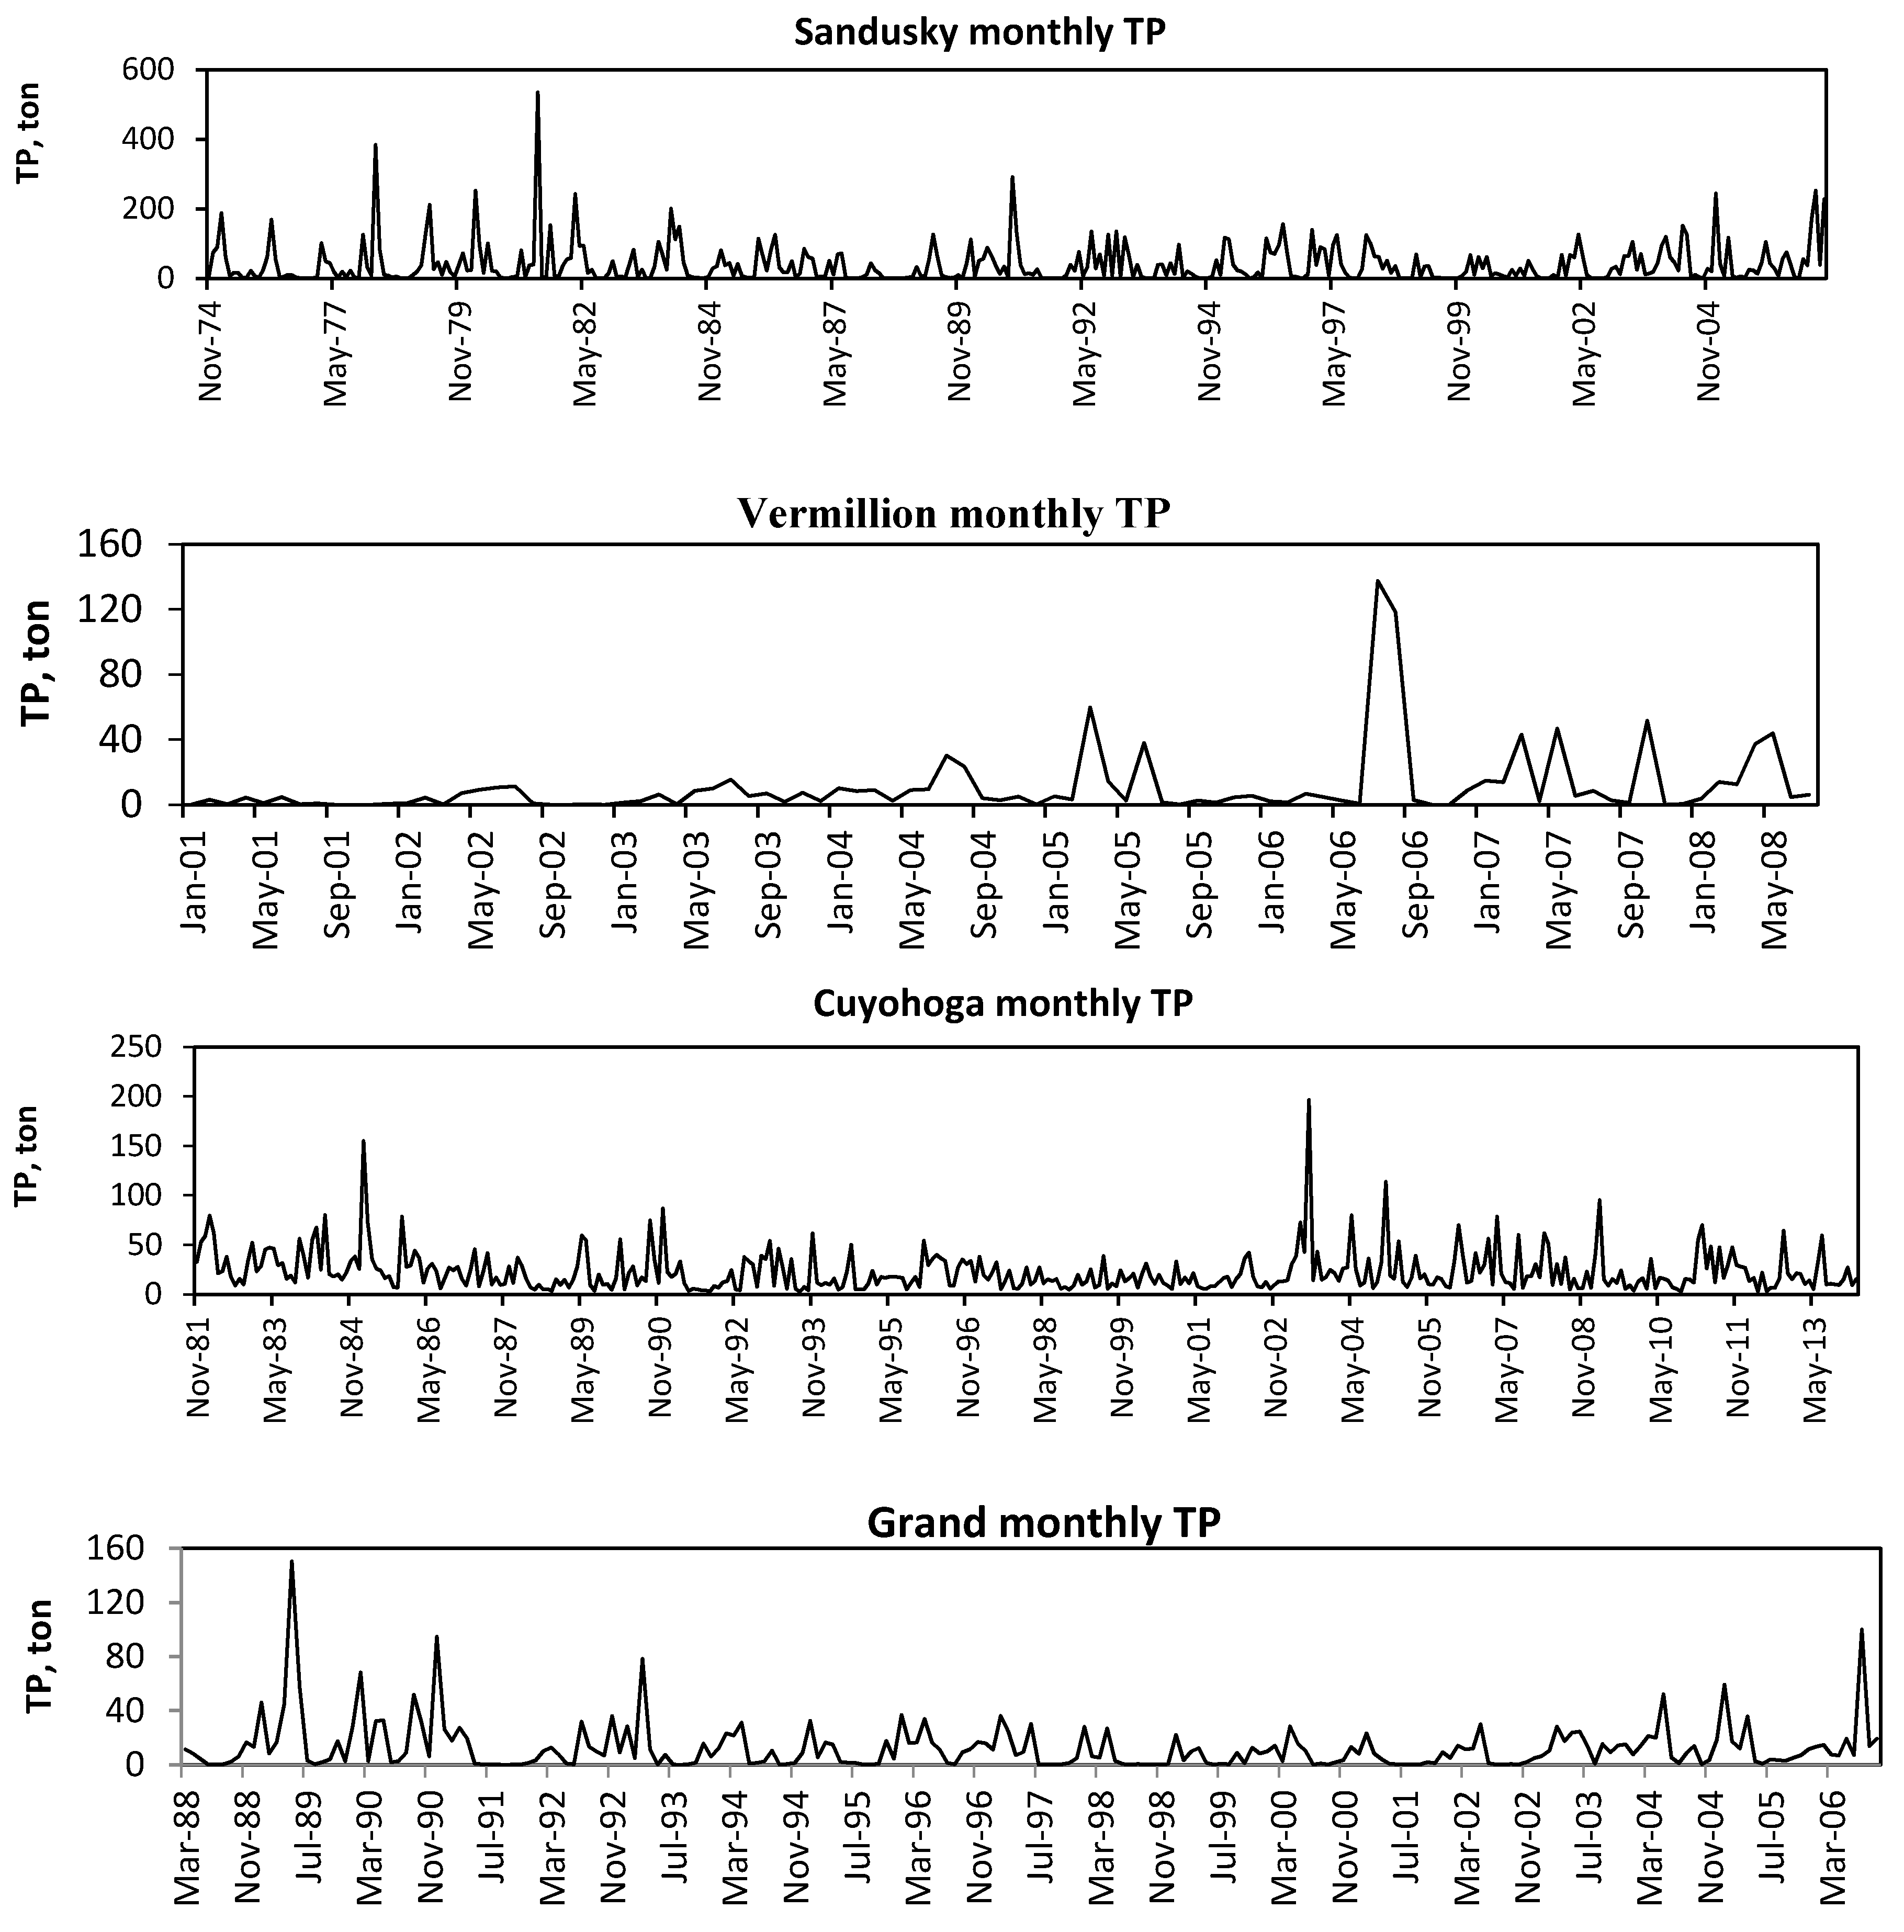
The locations of the six gauging stations used in this study are shown in Figure 1. Data from the United States Geological Survey (USGS) 04208000 in Cuyahoga River at Independence, USGS 04212100 in Grand River near Painesville, USGS 4193500 in Maumee River at Waterville, USGS 04176500 in Raisin River at Monroe, USGS 04198000 in Sandusky River near Fremont, and USGS 04199500 in Vermilion River near Vermilion were used. The monthly time series of TP are shown in Figure 2. Typically, USGS stations have long-term streamflow data. However, for phosphorus, some of the stations (e.g., Maumee) have long-term data since 1974 and some stations have only seven to eight years’ worth of data (e.g., Vermilion). The average daily P loads were used in the wavelet analysis. There were only very few occasional missing records, which were observed for one day or for a short time-period. Since continuous data are needed for wavelet analysis, the LOADEST method was used to fill the data gaps. LOADEST fills missing values by using fits for the regression relationship between the response variable (TP load or SRP) and predictor (streamflow).

4.1. Continuous Wavelet Transform

In this study, CWT was used to decompose daily TP, SRP, and streamflow data individually into all possible scales, which allowed for the analysis of the temporal evolution of the different frequencies contained in the time series. The streamflow data were separated into base flow and surface runoff using an automated web GIS based Hydrograph Analysis Tool, WHAT [44]. The resulting maximum scale depends on the length of each dataset. The global wavelet power spectrum (GWPS) produced from the CWT depicts the estimated true power of each scale.
The Morlet wavelet was used in the CWT computation. This wavelet is commonly used in hydrological studies because it can describe the shape of hydrological and environmental data relatively well [31,45]. One of the advantages that the Morlet wavelet has over other wavelets is that the Morlet wavelet has a better frequency resolution [45]. For example, researcher found that using the Morlet wavelet was better in detecting and localizing various important events in ecological data compared to other wavelets such as the Mexican Hat, Paul, and Daubechies wavelets [45]. Furthermore, since the Morlet wavelet is a complex wavelet, it includes amplitude and phase information. In the time domain, the Morlet wavelet is composed of real and imaginary parts. The real part is a cosine function, which captures the amplitudes of the positive and negative oscillatory part of the analyzed time series and the imaginary part provides the phase modulation of the analyzed signal [34,35,46].
The Morlet wavelet function with a default value of ω0 = 6 was used in all CWT analysis because it gives a good balance between time and frequency localizations [34]. CWT computed the wavelet power spectrum and its amplitude for each of the analyzed time series. The significance level for each wavelet spectrum was tested against the red noise modelled as a univariate lag-1 autoregressive (AR-1) process. The wavelet variance as indicated in the GWPS was computed by incorporating the squared transform coefficients at different scales for all data. The dashed line (in a GWPS graph) shows the area of global wavelet significance, which depicts the 95% confidence limit above the line. The CWT and wavelet power spectra were determined using normalized daily time series.

4.2. Discrete Wavelet Transform

The Daubechies wavelets were used in this present study. For hydrological time series analysis, mother wavelets with compact support and orthogonal condition such as the Daubechies wavelets are among the most frequently used mother wavelet for DWT [47,48,49,50]. These Daubechies have non-zero basis functions over a limited interval as well as full scaling and translational orthonormality properties, which are effective for feature localization or local analysis [51].
For prediction and forecasting purposes, some studies have used L = [Log (N)] to determine the number of decomposition levels where L [the nearest integer to log (N)] is the decomposition level and N is the number of data points in the time series (e.g., [52,53,54]). However, for trend analysis, we have not seen a common guide that can be used to determine the number of decomposition levels. For trend analysis in hydrological and meteorological time series, researchers used the mean relative error and relative error criteria between the approximation and original series to determine the type of mother wavelet and the number of decomposition levels in DWT [55,56].
Each annual TP, flow, and SRP dataset was decomposed into three levels of decomposition using the Daubechies 4 wavelet and zero-padding extension (to deal with the discontinuities at both ends of the data). In the results section below, the A3 represents the approximation component of the third level of decomposition and D represents the detail components of levels 1–3 of the DWT. Therefore, D1, D2, and D3 represent variability at two, four, and eight years, respectively. Since the DWT operates on dyadic scales, it was not able to pick up oscillations of less than two years. Station Vermilion was not decomposed via the DWT because the data for this station were too short.
In this study, the DWT was used to determine the periodicities that could be responsible for trends in the TP, the flow, and the SRP data. Sequential trend lines were graphed (using the Mann-Kendall trend test) on the original data and on the decomposed data (where the Approximation A at the third decomposition level was added to each Detail D component).
The trend lines of the decomposed data, at each level, were then compared to the trend line of the original data. The trend lines of the decomposed data that most resembles the trend of the original data were considered the most influential periodicities for trends [37,41,55,56,57].

5. Results and Discussion

5.1. Wavelet Analysis

5.1.1. Raisin Watershed—Phosphorus

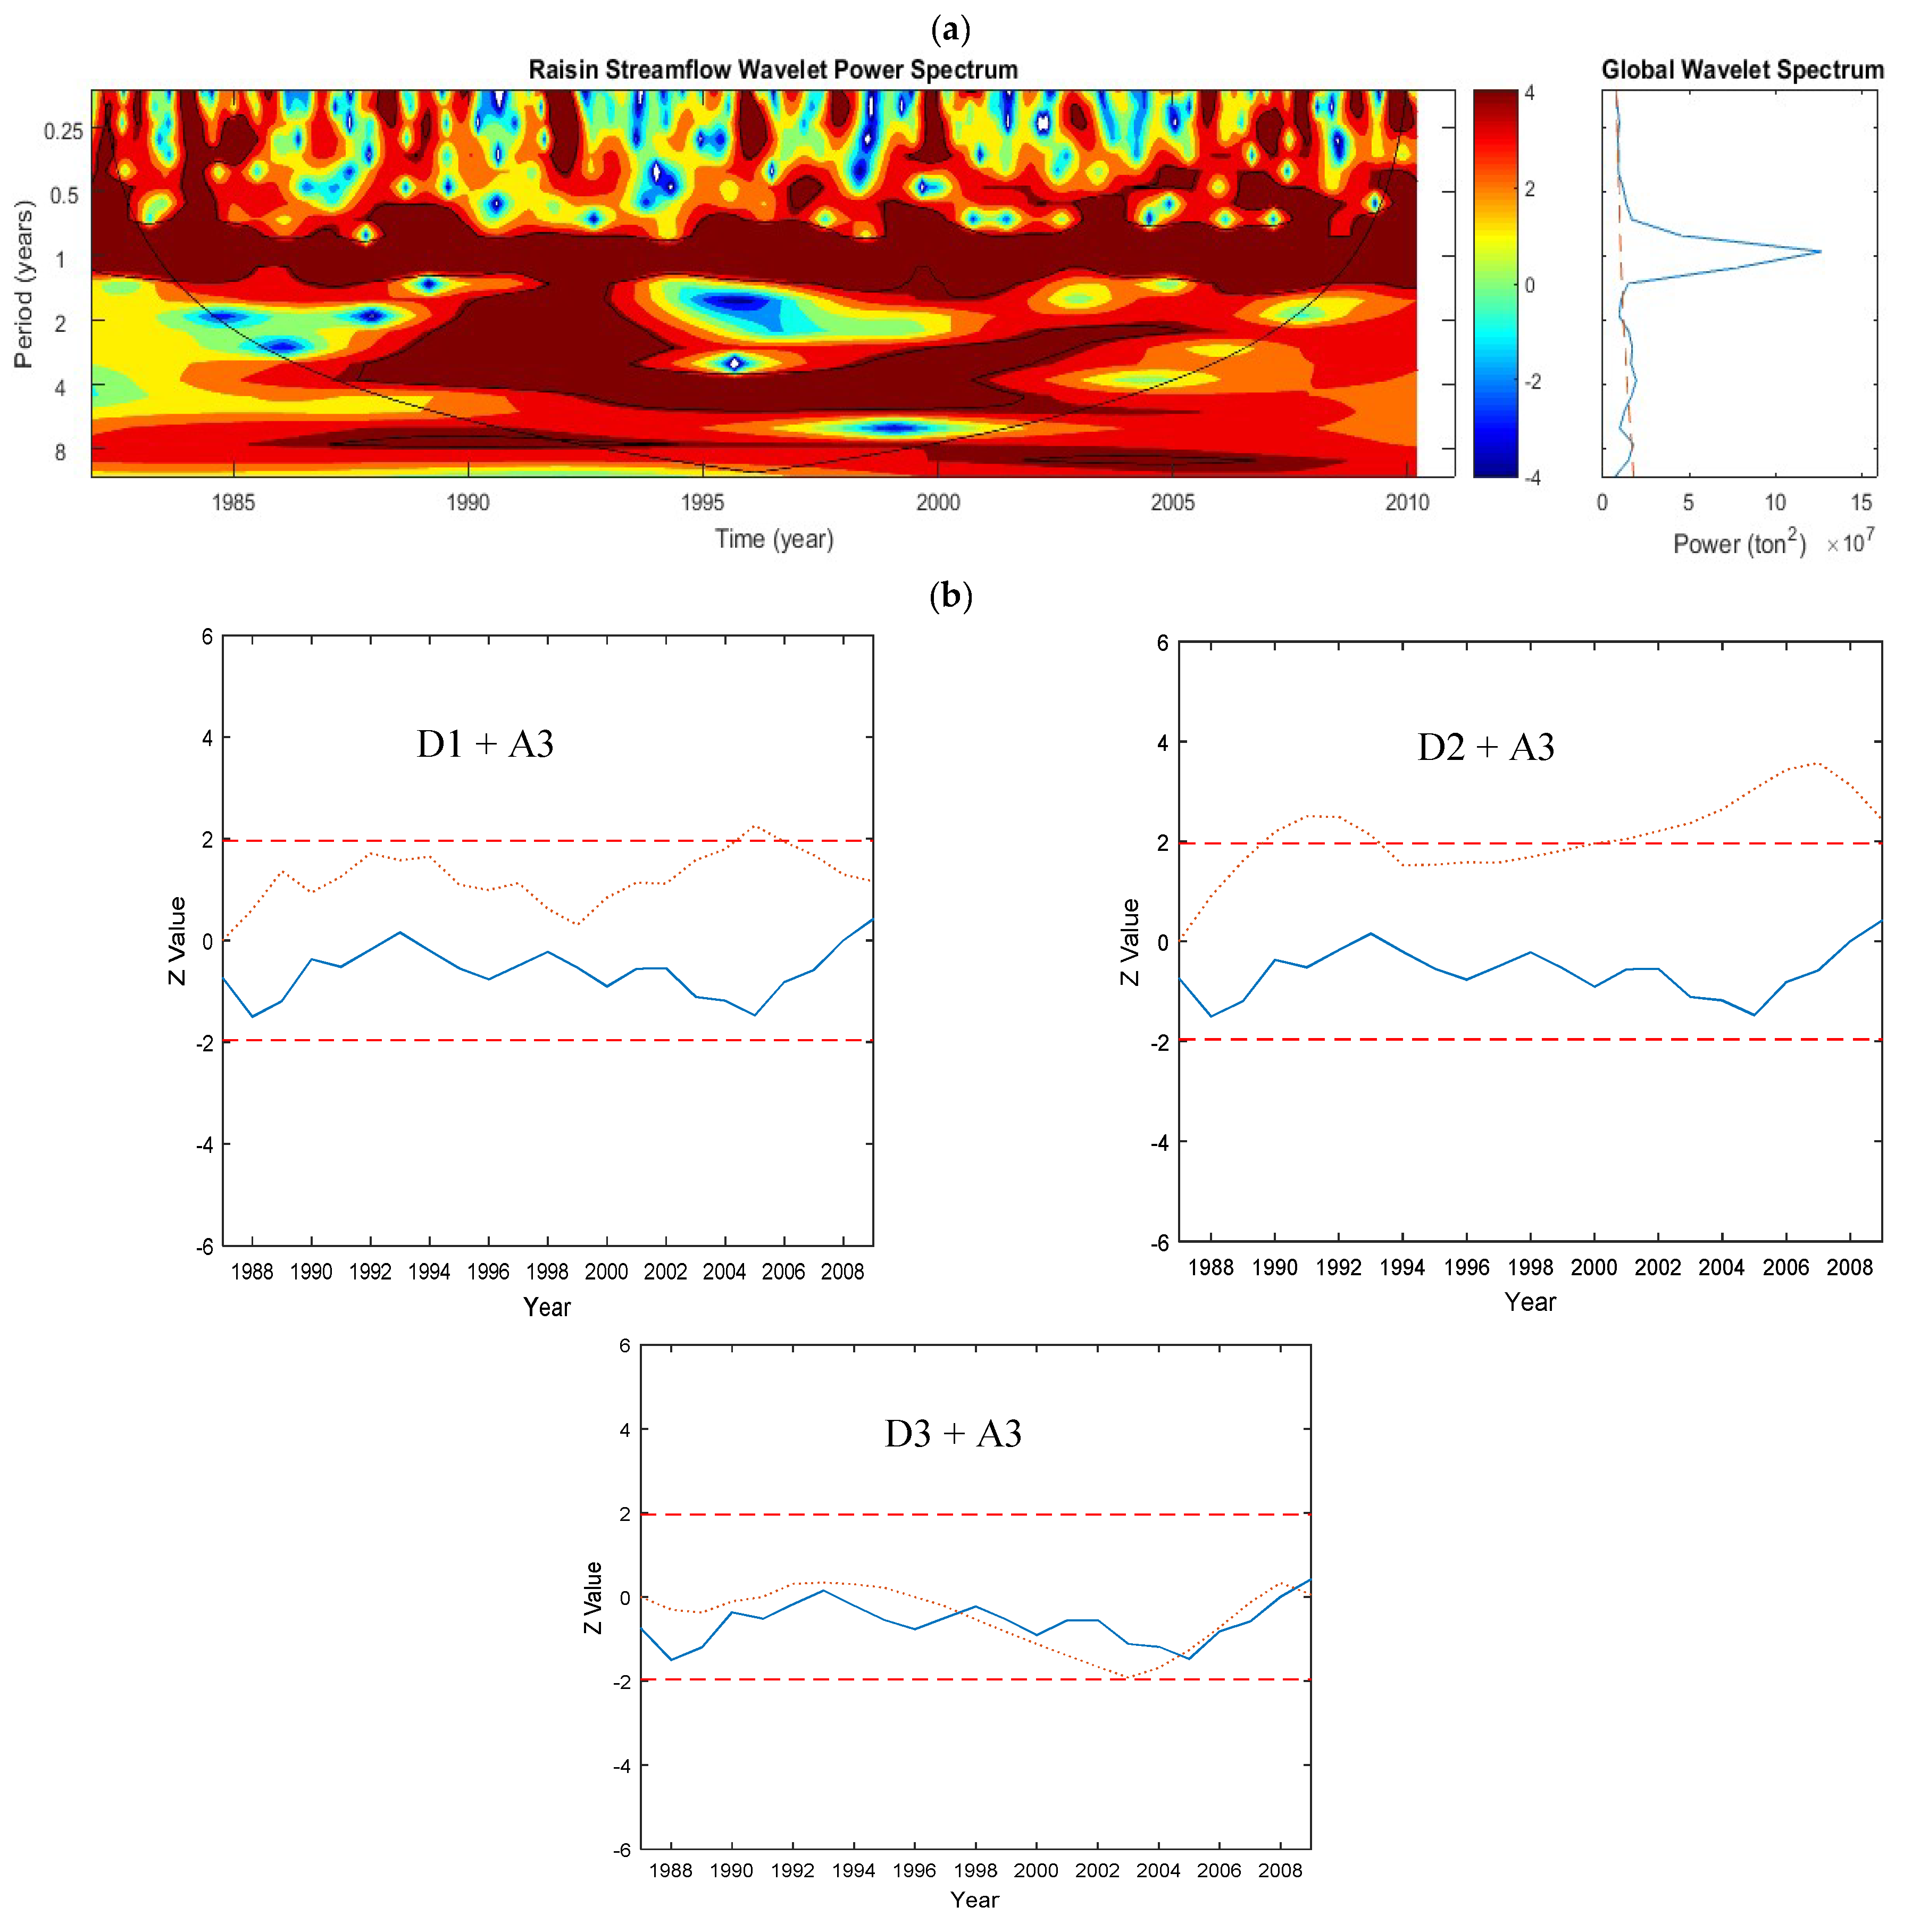
The CWT shows that the one-year frequency variability dominated the time series especially before 1986 and after 1995 (Figure 3a). This implies that the variability of an annual pattern was strong before 1986. It then became weak until 1995 where it became strong again. In addition, the results depicted by DWT show that the 2-year periodicity and the 8-year periodicity also affects the trends in TP (Figure 3b).
The CWT spectrum also detected the 3 to 6 months of variability intermittently within the 1982 to 2002 period. These temporary high-frequency variabilities may be due to the noise since no trend value was significant at any time during the study period (Figure 3b). The four-year variability was detected during the 1996 to 2002 period even though it was not statistically significant over the time-averaged spectrum (as shown in the GWPS, the right panel in Figure 3a). The CWT spectrum of SRP (Figure 4a) reflects significant regions at the one-year scale, which indicates the presence of strong annual variability in SRP. SRP also showed strong variability only after 1996 up to 2010 with periodicities ranging from 6 months to 2 years (Figure 4a). The 2-year periodicity was also reflected in the DWT results (Figure 4b) where this figure showed that the long-term trends of SRP were affected by an event (or a combination of events) that exhibited a 2-year periodicity.

5.1.2. Raisin Watershed—Flow

Based on the CWT results, the 1-year scale was found to be the most dominant periodicity that influenced streamflow variability in the Raisin River. To a lesser extent, the 2-year and 4-year periodicities were also significant (Figure 5a). Raisin River displayed the largest mixed variability extending from 3 months to 4 years. However, the amplitude of the periodicities varied significantly over different periods. Large noisy signals ranging from 1 to 4 years were extensive during 1988 to 1994. It is worthwhile to mention that this variability was not observed for TP during this period (Figure 3a). In fact, this was the period with the lowest TP contribution from this watershed, which indicates that TP variability is not always driven by streamflow.
Surface runoff also had a 1-year (annual) periodicity (figure not shown). The CWT spectra for surface runoff was no more different than TP. The analysis was also conducted using DWT. The result obtained from the sequential trend lines of both the original and the decomposed data via DWT also suggested that the variation of streamflow was no different than TP. One possible reason for such an observation was that TP comprised a major part of sediment phosphorus, which was driven mainly by surface runoff. There was no significant trend value and, according to the trend analysis on the decomposed streamflow data (via DWT), it appeared that the streamflow trends were affected by a longer 8-year periodicity (Figure 5b). The 8-year significance was also visible in the CWT spectrum of Raisin’s flow, but it was located in the cone of influence (COI) area (Figure 5a).
The base flow wavelet power spectrum detected strong continuous annual variability and was mostly consistent with the streamflow variability. Furthermore, the CWT power spectrum of streamflow was strikingly similar to that of the base flow. These observations could suggest that streamflow was mostly driven by the base flow (figure not shown).

5.1.3. Maumee Watershed—Phosphorus

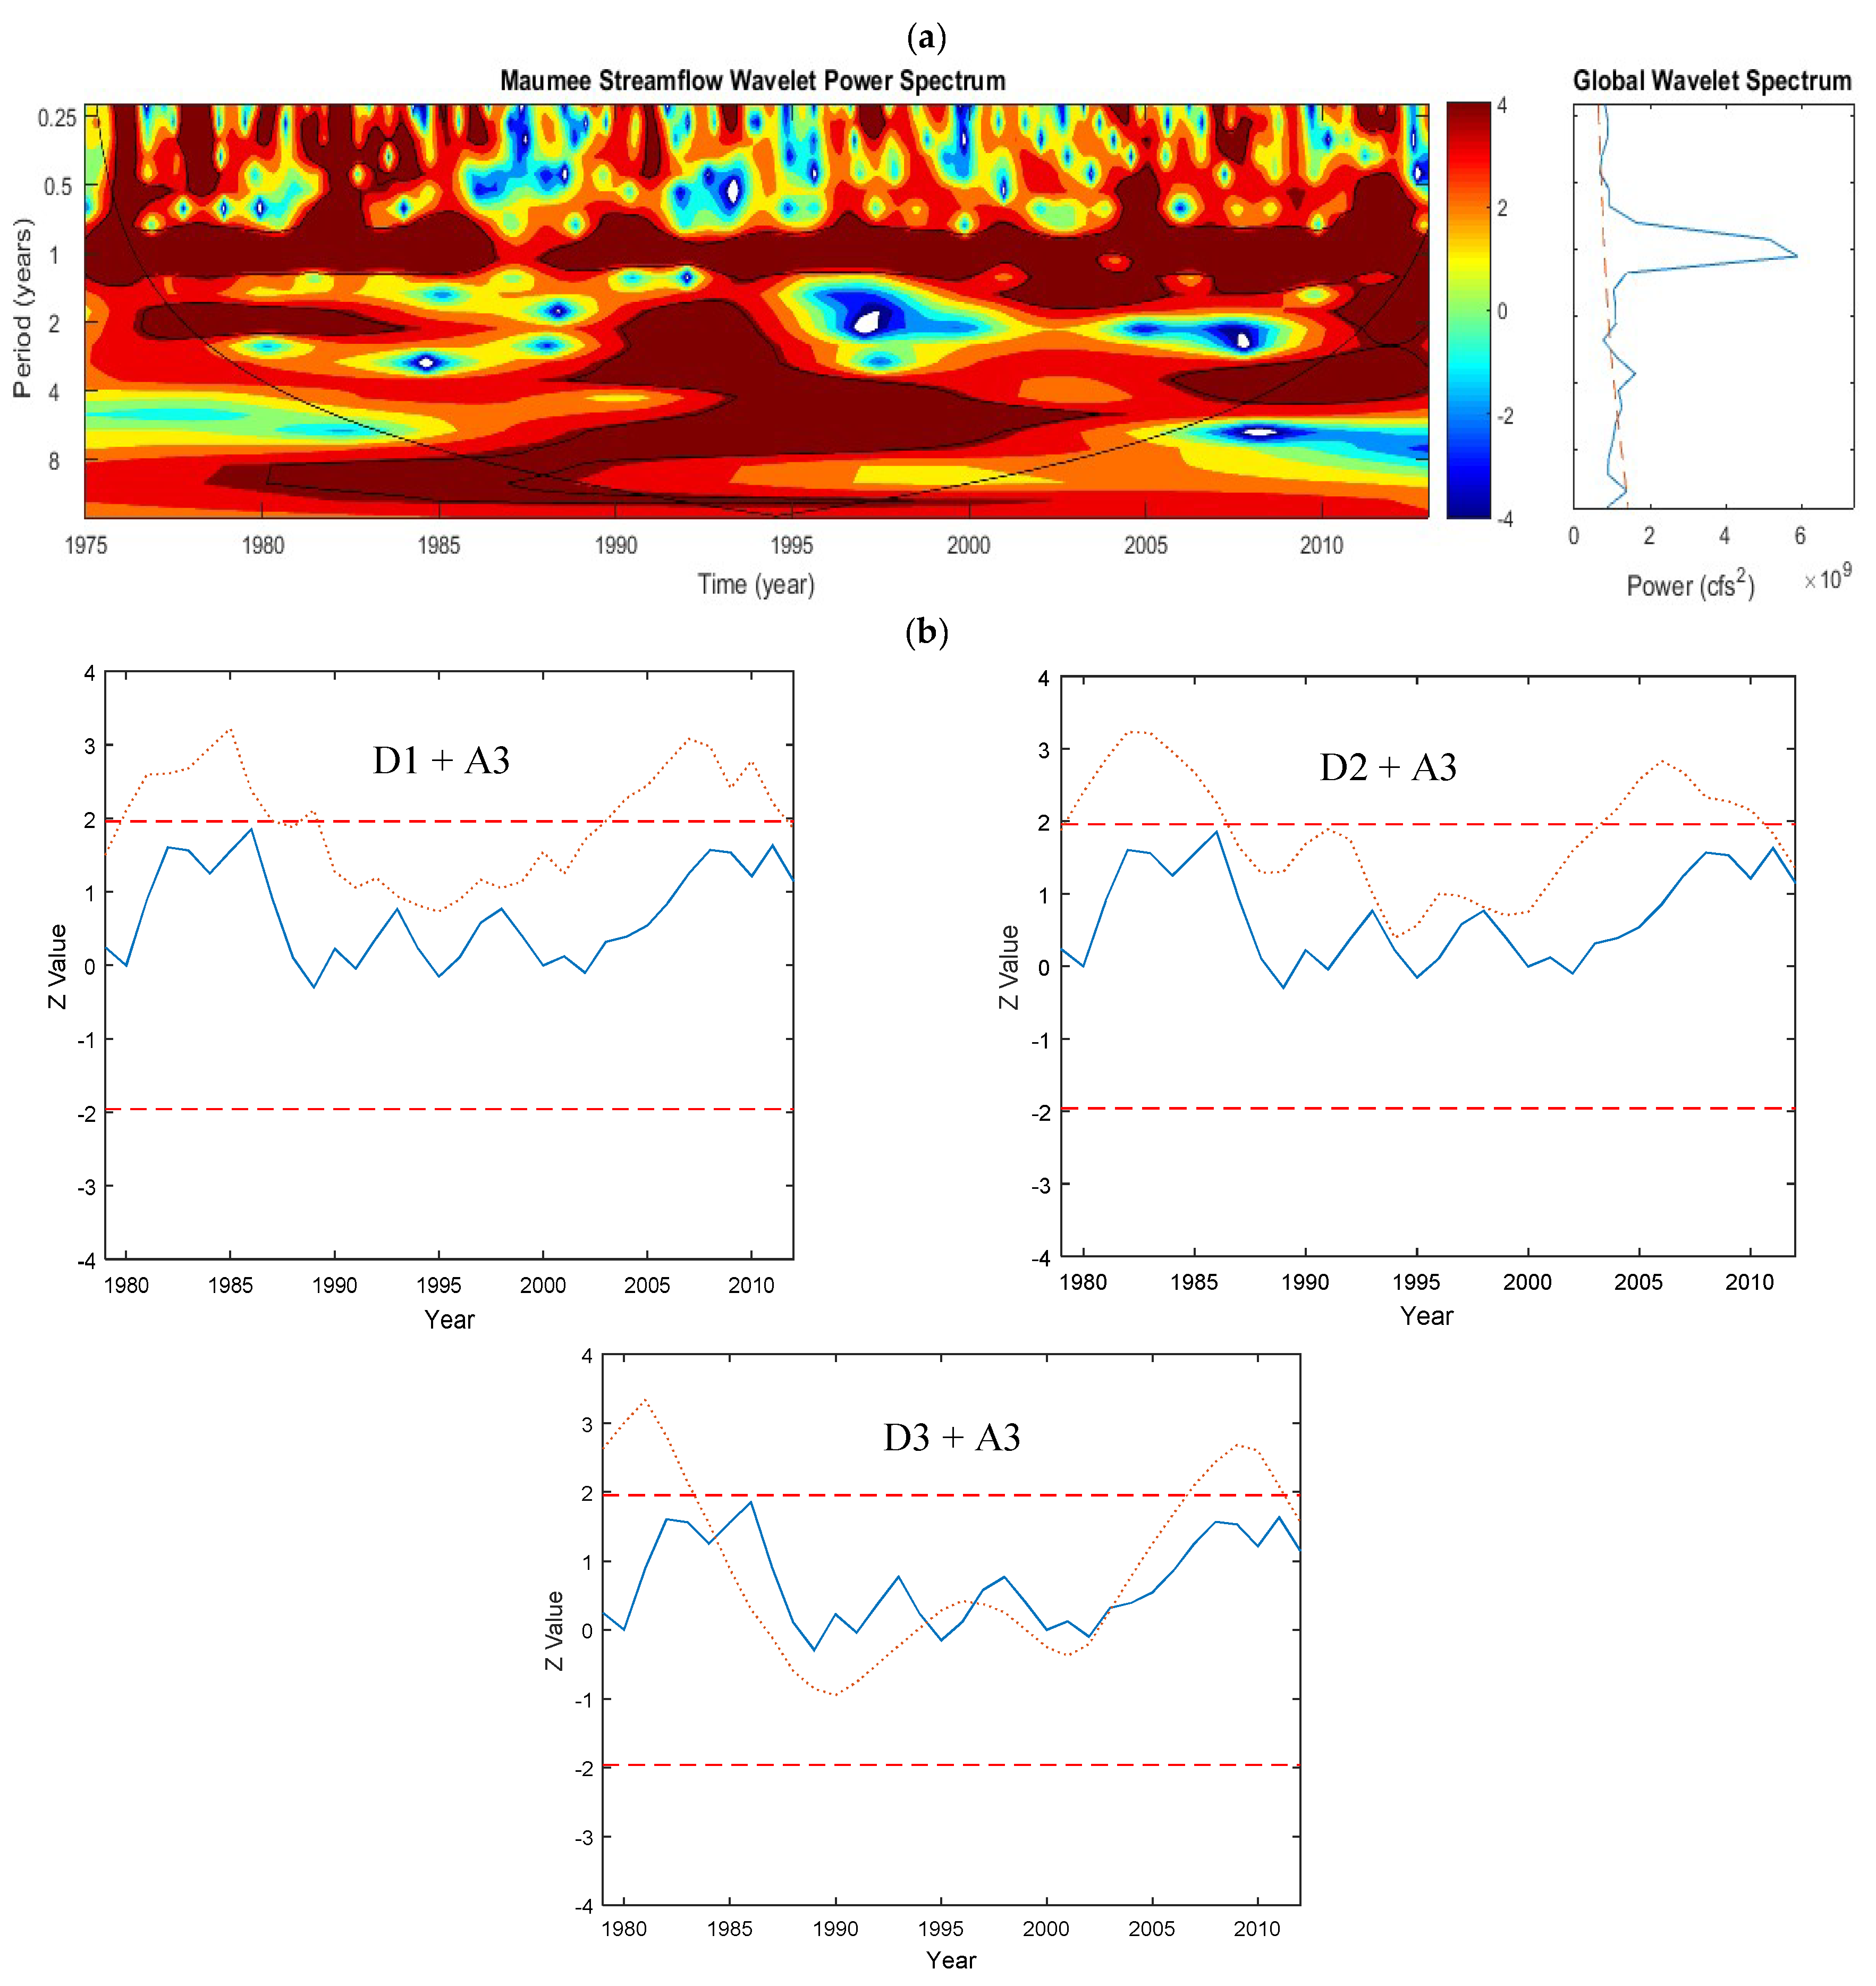
The Maumee River showed noisy signal oscillations ranging from 3 months to 1 year and the 1-year periodicity in TP explained the highest variance over the period of records (Figure 6a). There were, however, frequent cutoffs in the significant regions of the 1-year periodicity. They were seen during the period between 1986 to 1989, 1991 to 1996, and 2000 to 2005. Frequency oscillations at 2, 3 (some parts fell within the COI area), and 8 years were also identified in the CWT (Figure 6a). A significant temporal pattern at the 8-year periodicity was detected from 1986 to the late 1990s. Furthermore, trend analysis via DWT showed that trends in TP in Maumee River were affected by periodicities at 2, 4, and 8 years (Figure 6b).
In the case of SRP, its annual variability (the variance explained by the 1-year periodicity) was significant, which was shown in the GWPS. However, it was not as temporally extensive as observed in TP. The 1-year periodicity in SRP was only dominant up to 1984 and then a relatively long discontinuity was experienced for SRP. Dominant periodicities in SRP were shifted completely post 1995. After 1995, significant variability was seen for the 6-year periodicity and by the end of the data period, significant periodicities were composed of 2, 4, and 6 years (Figure 7a), which indicate that the SRP had increased at a later time. This phenomenon was also seen in the sequential analysis of the SRP data where there was a downward trend prior to 1995. After 1995, the trend shifted upward until the end of the recorded period (Figure 7b). Based on DWT results, trends in SRP were affected by periodicities at 2 and 8 years (Figure 7b). The 8-year periodicity detected in CWT was inside the COI. The annual variability detected in TP was more continuous than that of SRP, which indicates that TP in the Maumee River was more correlated with flow than SRP. The results from both CWT and DWT were able to depict the non-stationary characteristics of P loading and an increasing pattern of SRP especially after 1995. In this study, one can see the advantageous features of using wavelet analysis. Significant periodic oscillations extracted from CWT and their temporal evolution in combination with the trend analysis via DWT allowed for the detection patterns of temporal changes in hydrological and water quality parameters. In other words, using WT enables one to assess the evolution of various time-frequency scales contained in a time series, which could be difficult when only using simple or linear correlation methods.

5.1.4. Maumee Watershed—Flow

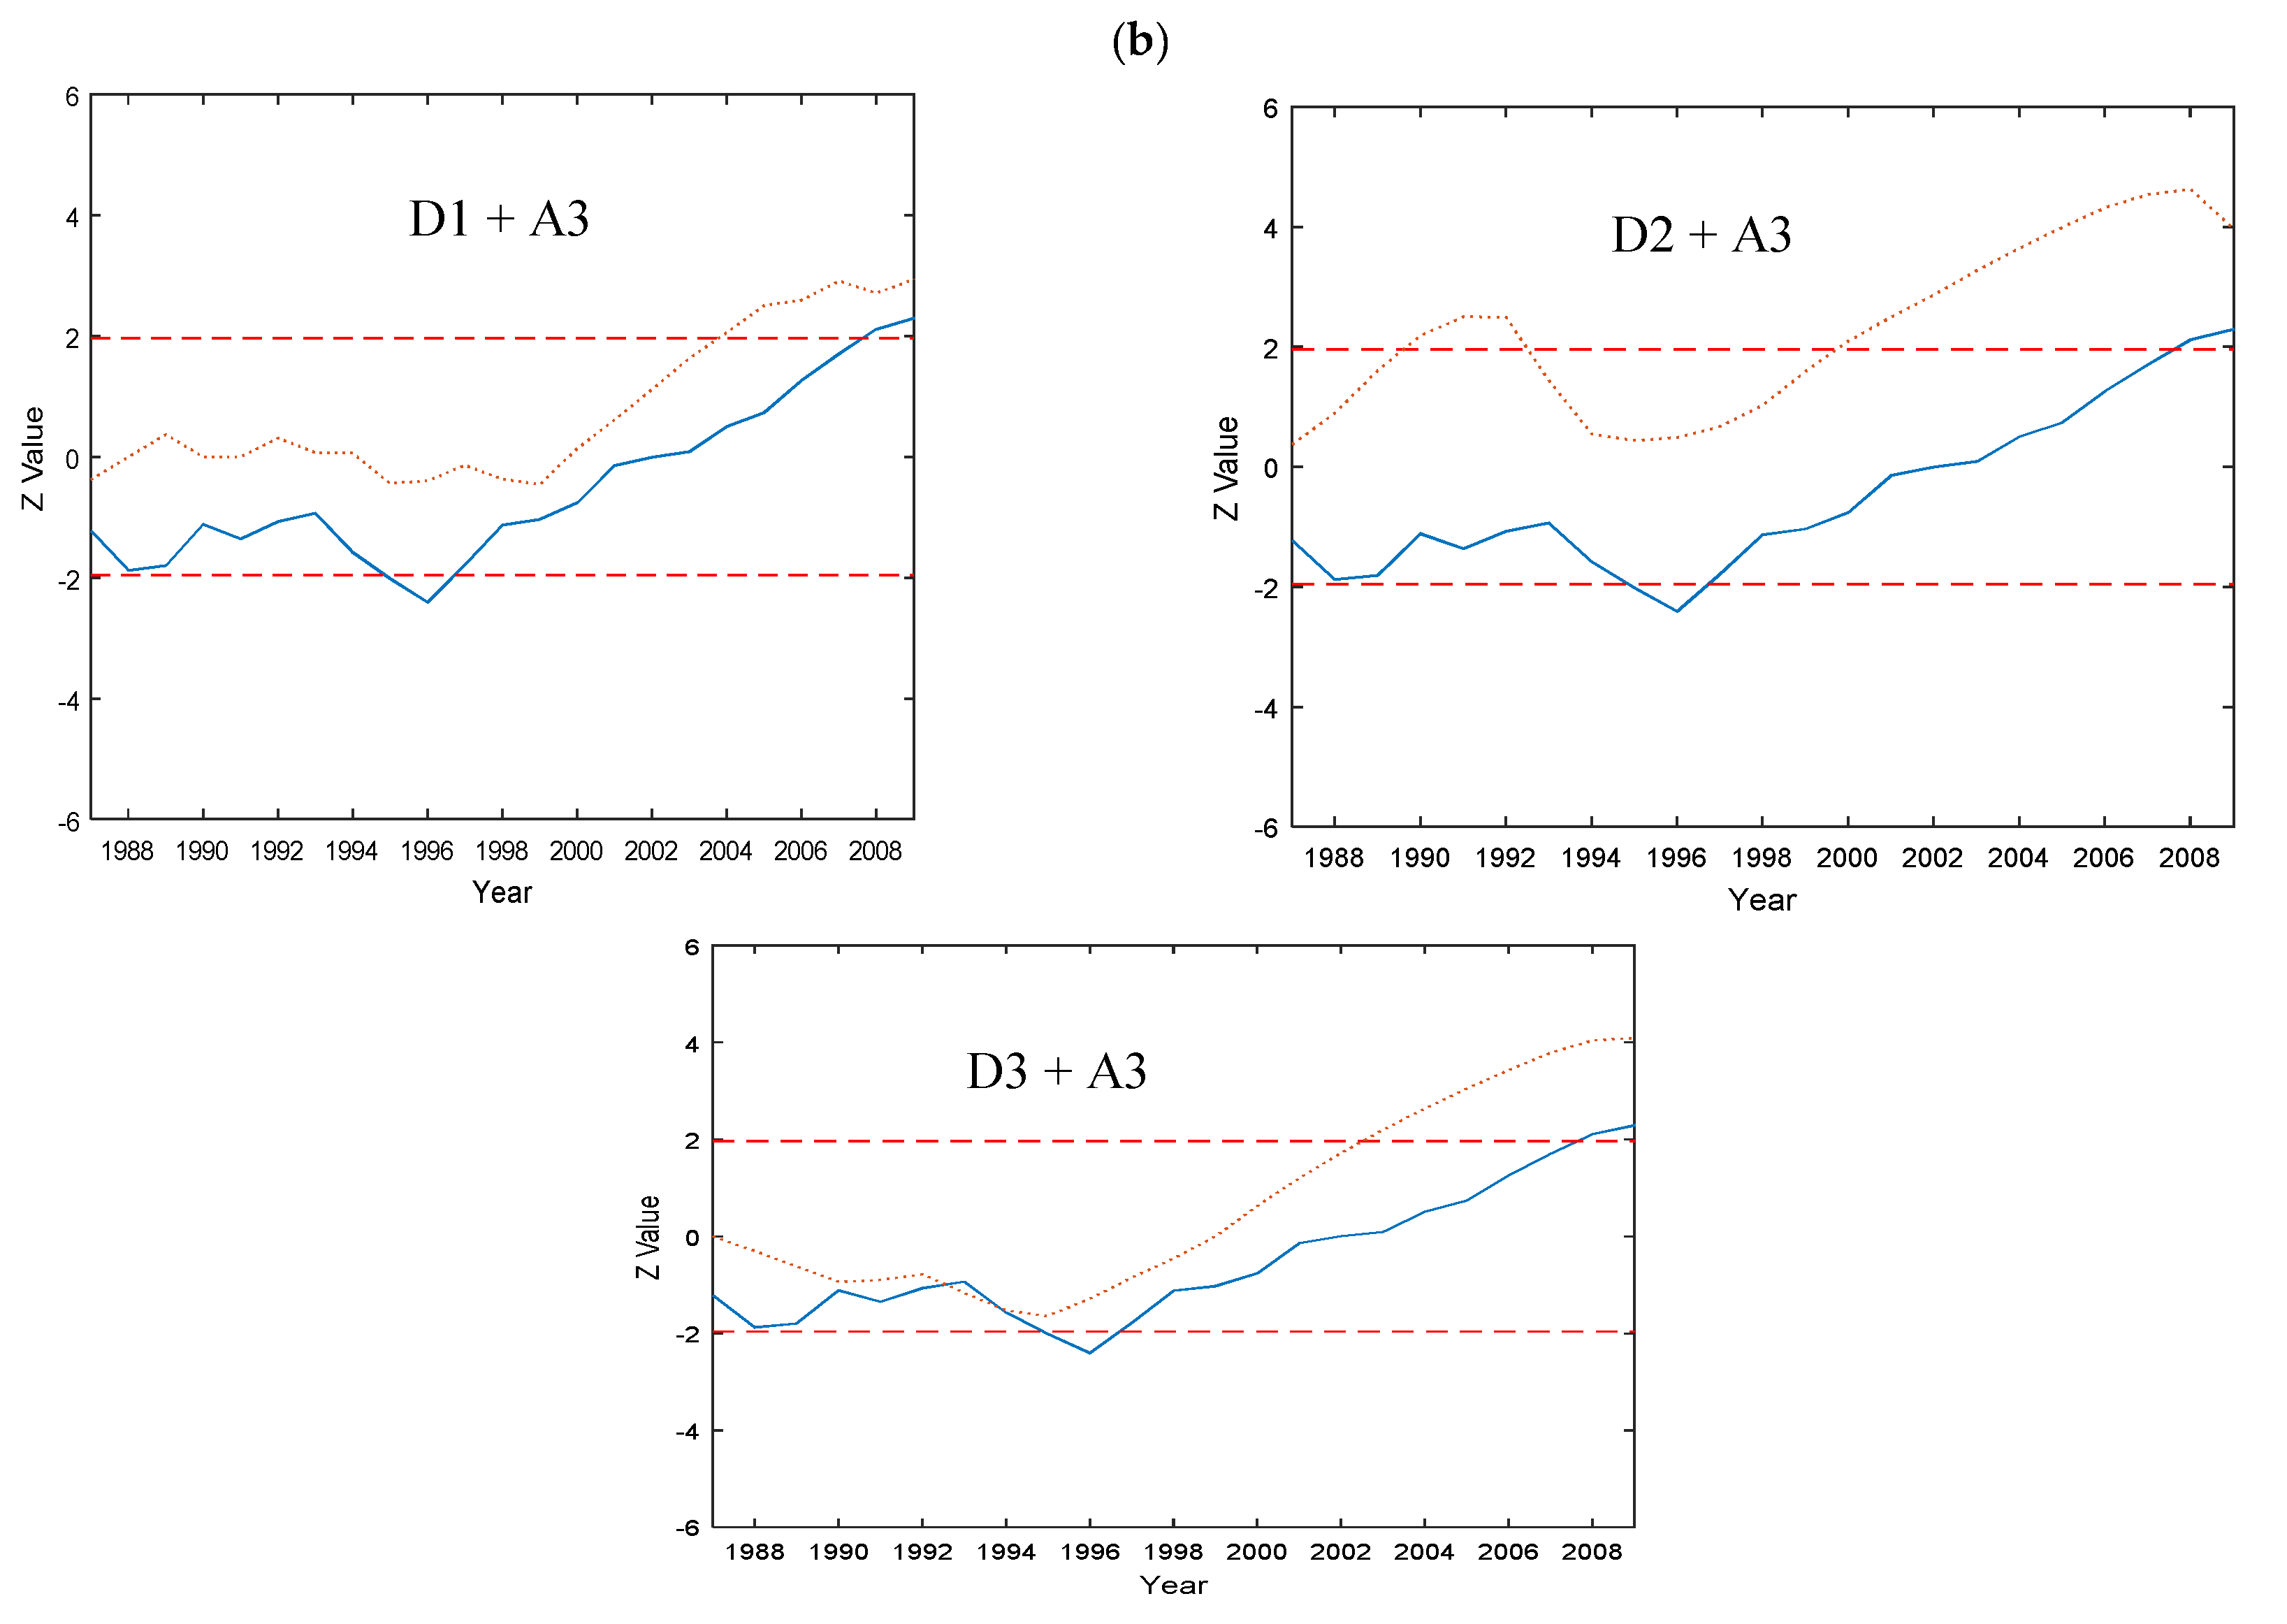
Similar to the Raisin River, the streamflow variability pattern at the Maumee River was more analogous to TP and quite different from SRP (Figure 8a). The variability in flow in Maumee River was continuously dominated by the 1-year periodicity (Figure 8a), which could be associated with the seasonality factor of the streamflow such as spring events. This annual variability was not captured in the results obtained using DWT (Figure 8b) because the first scale obtained using DWT is 21 years (based on the dyadic scale). Significant variability was detected at 6 months (especially from 1975 to 1985) and 6 years (continuously from 1988 to 2002). In addition to the 1-year scale, the GWPS showed that the periodicity at around 4 years was also significant but with smaller variance (Figure 8a, right panel). The GWPS showed that the 4-year periodicity was significant but had a smaller variance (Figure 8a, right panel). Similarly, based on the DWT results, it appeared that the trends in streamflow were also influenced by the 4-year periodicity and more strongly by the 8-year periodicity (Figure 8b).
A common period of significant variability detected during 1988 to 1995 for both the streamflow (Figure 8a) and TP (Figure 6a), which may be an indication that TP was primarily driven by streamflow during this period. In addition, significant mixed variability of TP tended to end after 1998, which indicated that TP started decreasing in the late 1990s (Figure 6a). This was also observed in the sequential trend analysis of TP where, after the late 1990s, the trend values of TP were mainly negative compared to the many positive trend values prior to 2000.
The wavelet spectrum of the surface runoff was very similar to that of TP where annual variability primarily dominated except for the period from the early 1990s to the early 2000s where the 4-year and 5-year periodicities were dominant (figure not shown). This might be an indication that TP was mostly driven by surface runoff because particulate phosphorus (which is mostly driven by surface runoff) is a major component of TP. Lastly, the base flow wavelet spectrum was also analogous to streamflow variability (figure not shown).

5.1.5. Sandusky Watershed—Phosphorus

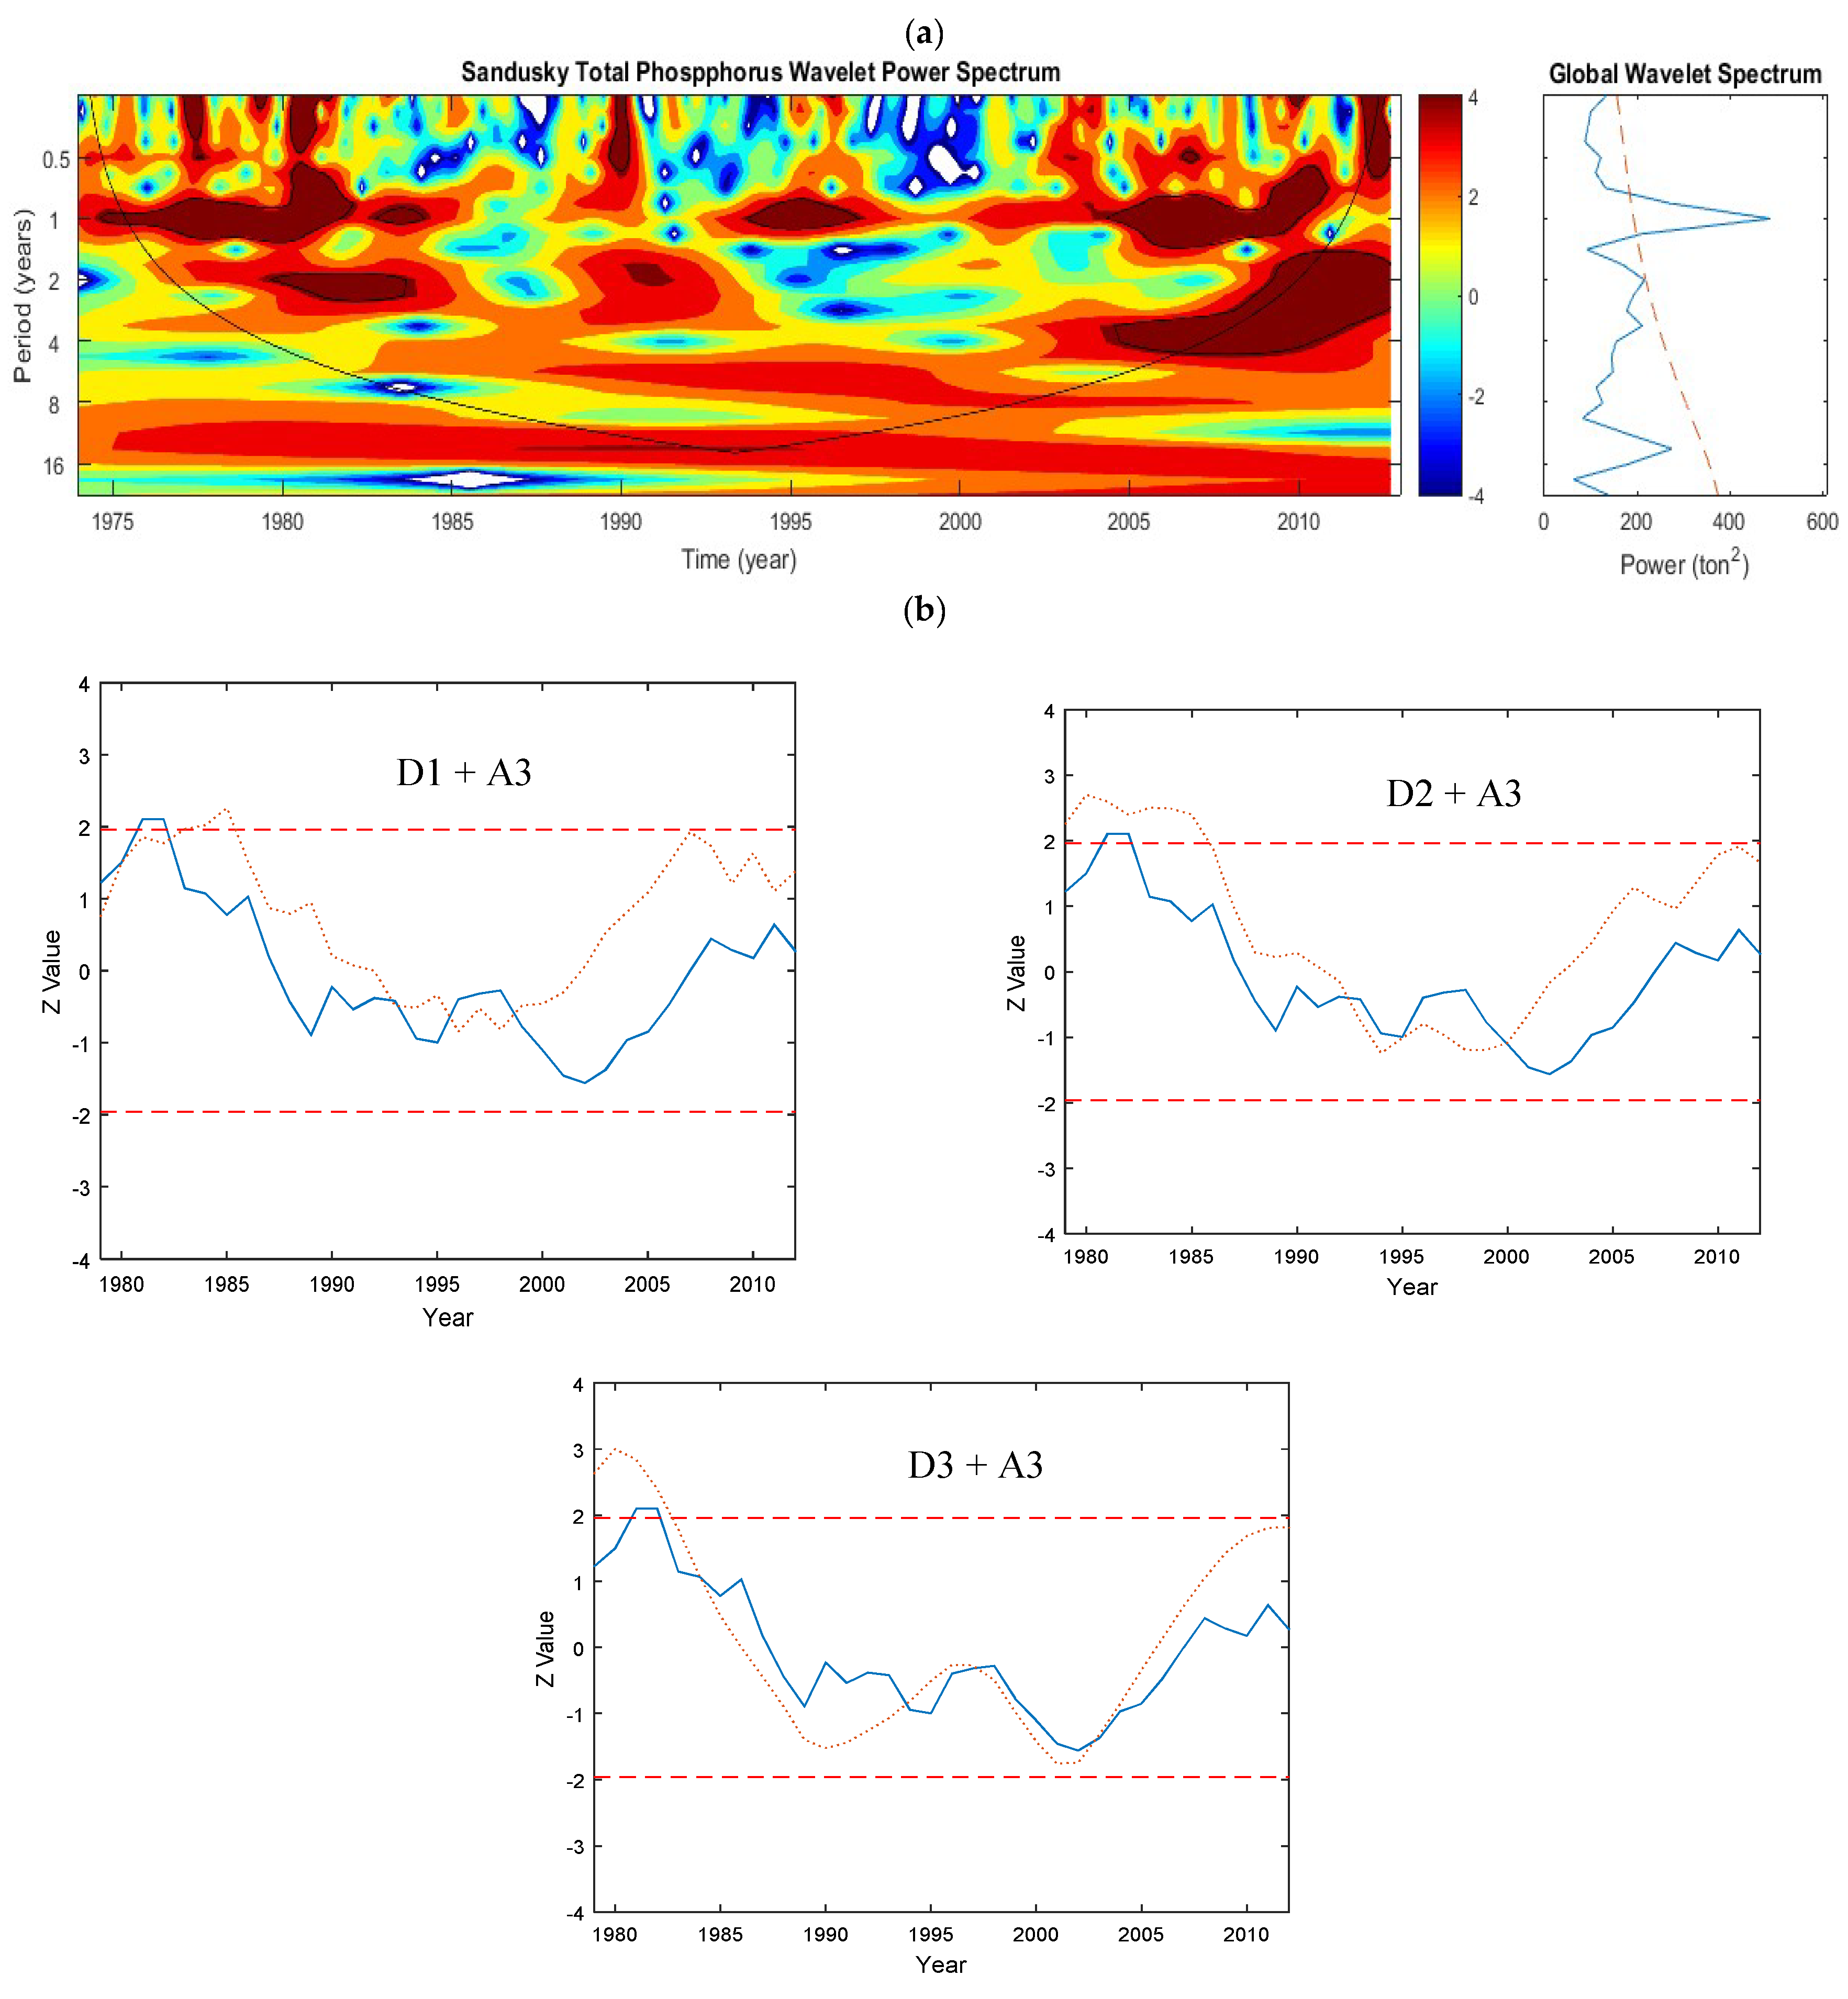
The CWT spectrum and GWPS showed that the variability of the 1-year periodicity was the dominant mode and described the highest amount of variance in TP (Figure 9a). However, the region of significance for the 1-year periodicity was not continuous but was rather sporadic. During 1983–1989, 1991–1995, and 1998–2003, there were frequent cut offs (Figure 9a), which suggests that the contribution of TP in the Sandusky River watershed was relatively minimal during these periods. It was previously indicated in previous studies [58] that TP started to decrease after the 1990s. Based on trend analysis of the original and decomposed data (via DWT), it also appeared that none of the periodicities strongly affected the trends in TP in Sandusky River (Figure 9b). From around 1983 until the early 2000s, it appeared that the 8-year periodicity explained the trend well, but, after that, it seemed that none of the periodicities obtained from the DWT (2, 4, and 8 years) was able to explain the trend in TP (Figure 9b).
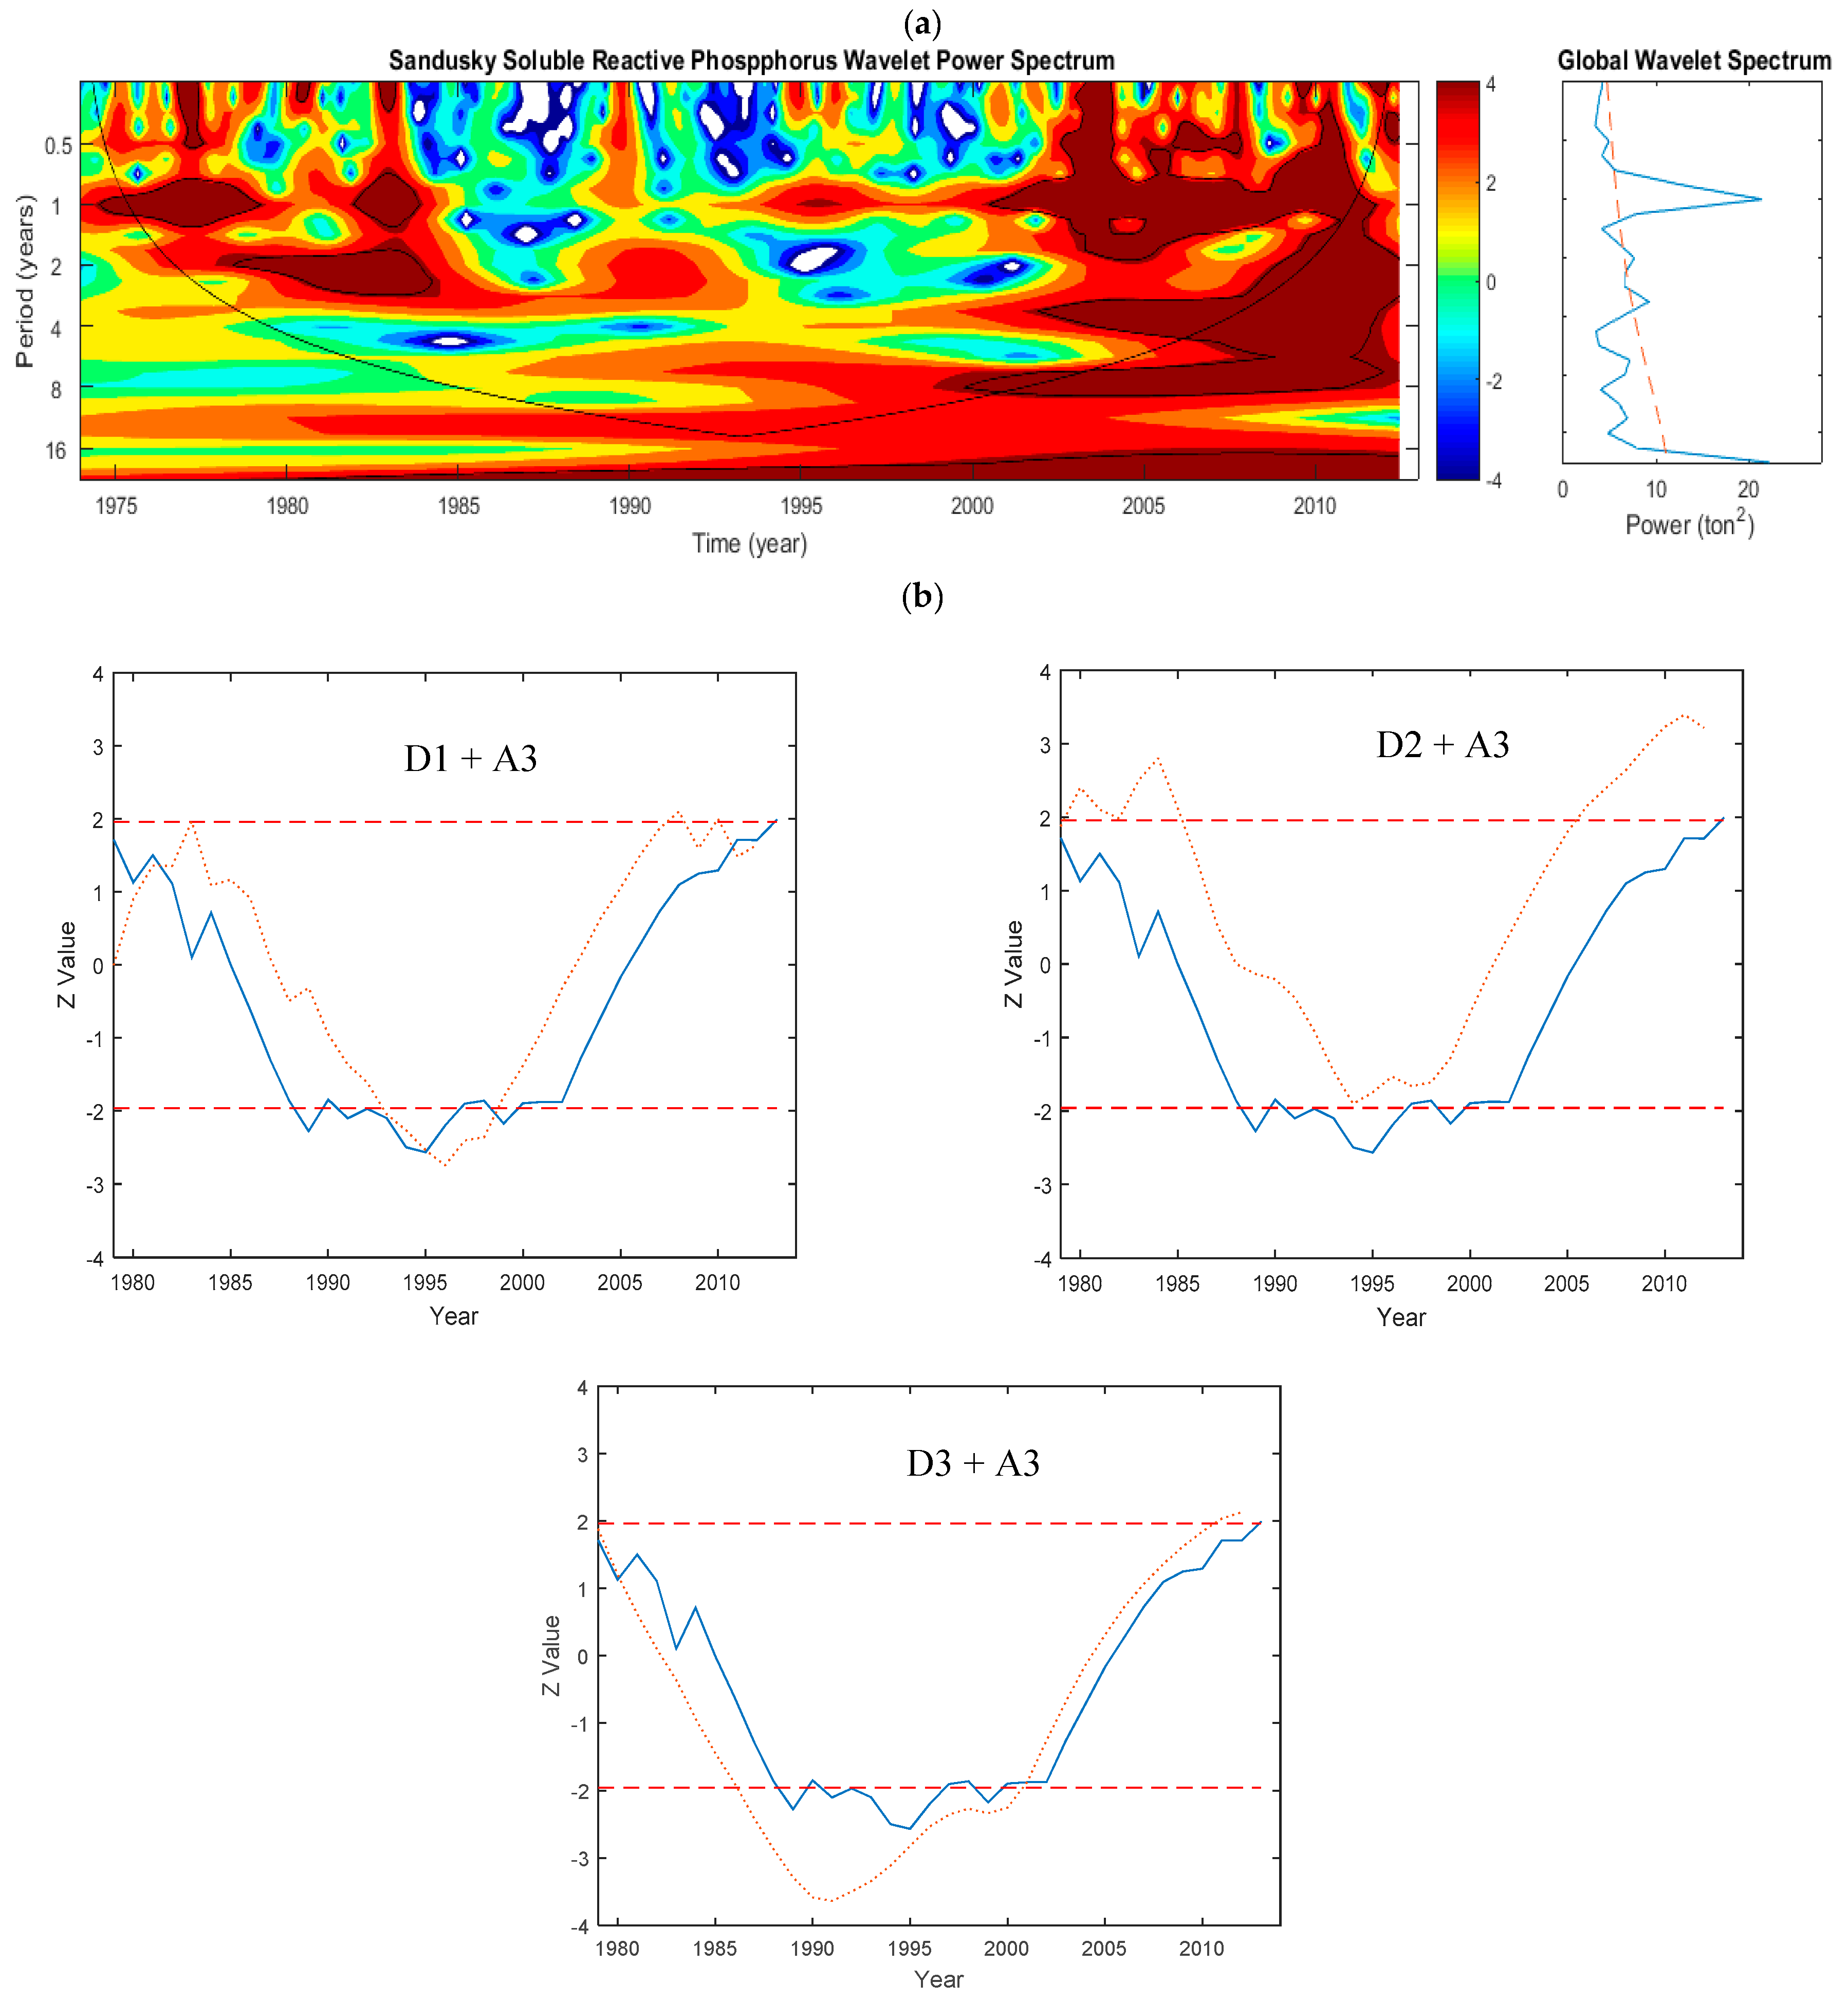
The CWT spectrum of SRP (Figure 10a) was similar to TP in the Sandusky watershed. In contrast, the sequential trend graphs of the annual TP and SRP obtained for the original data and the decomposed data via DWT (Figure 10b) were quite different. No strong temporal pattern was detected for SRP between 1984 and 1999, but, before 1984, mixed significant temporal patterns at periodicities of 6 months, 1 year, and 2 years were detected (Figure 10a). In addition, after 2002, significant periodicities at 6 months, 1 year, and 4 years were detected. The GWPS indicated that the 1-year periodicity explained the largest proportion of the variance in the TP time series. Based on the trend analysis of the SRP original and decomposed data via DWT (Figure 10b), the 2-year and especially the 8-year periodicities appeared to be the components that best explained the trends in the SRP of the Sandusky watershed. The trend value for the SRP is significant (Z = 1.98, α = 5%) (Table 2). The trend was decreasing until the early 1990s and it stayed significantly negative until just prior to 2000. Results from both CWT and DWT approaches showed that the variability of SRP was significant after 2000 in the Sandusky watershed and there was an increase in SRP after this period.

5.1.6. Sandusky Watershed—Flow

The results of CWT analysis showed that the 1-year periodicity consistently dominated streamflow but significant temporal patterns containing periodicities of 1, 2, 4, and 6 years were also detected (Figure 11a). According to the DWT results, trends in streamflow could be best explained by the 2-year and 8-year periodicities (Figure 11b). The DWT results also showed that there were similarities in the sequential trend lines of annual streamflow (Figure 11b) and TP (Figure 9b).
Base flow using CWT showed significant mixed variability at periodicities of 1 year, 2 years, and 4 years, which were very similar to streamflow (figure not shown). The wavelet power spectrum of surface runoff was analogous to TP wavelet power spectrum where the 1-year periodicity predominated and a few significant areas at the 2-year periodicity were observed.

5.1.7. Vermilion Watershed—Phosphorus

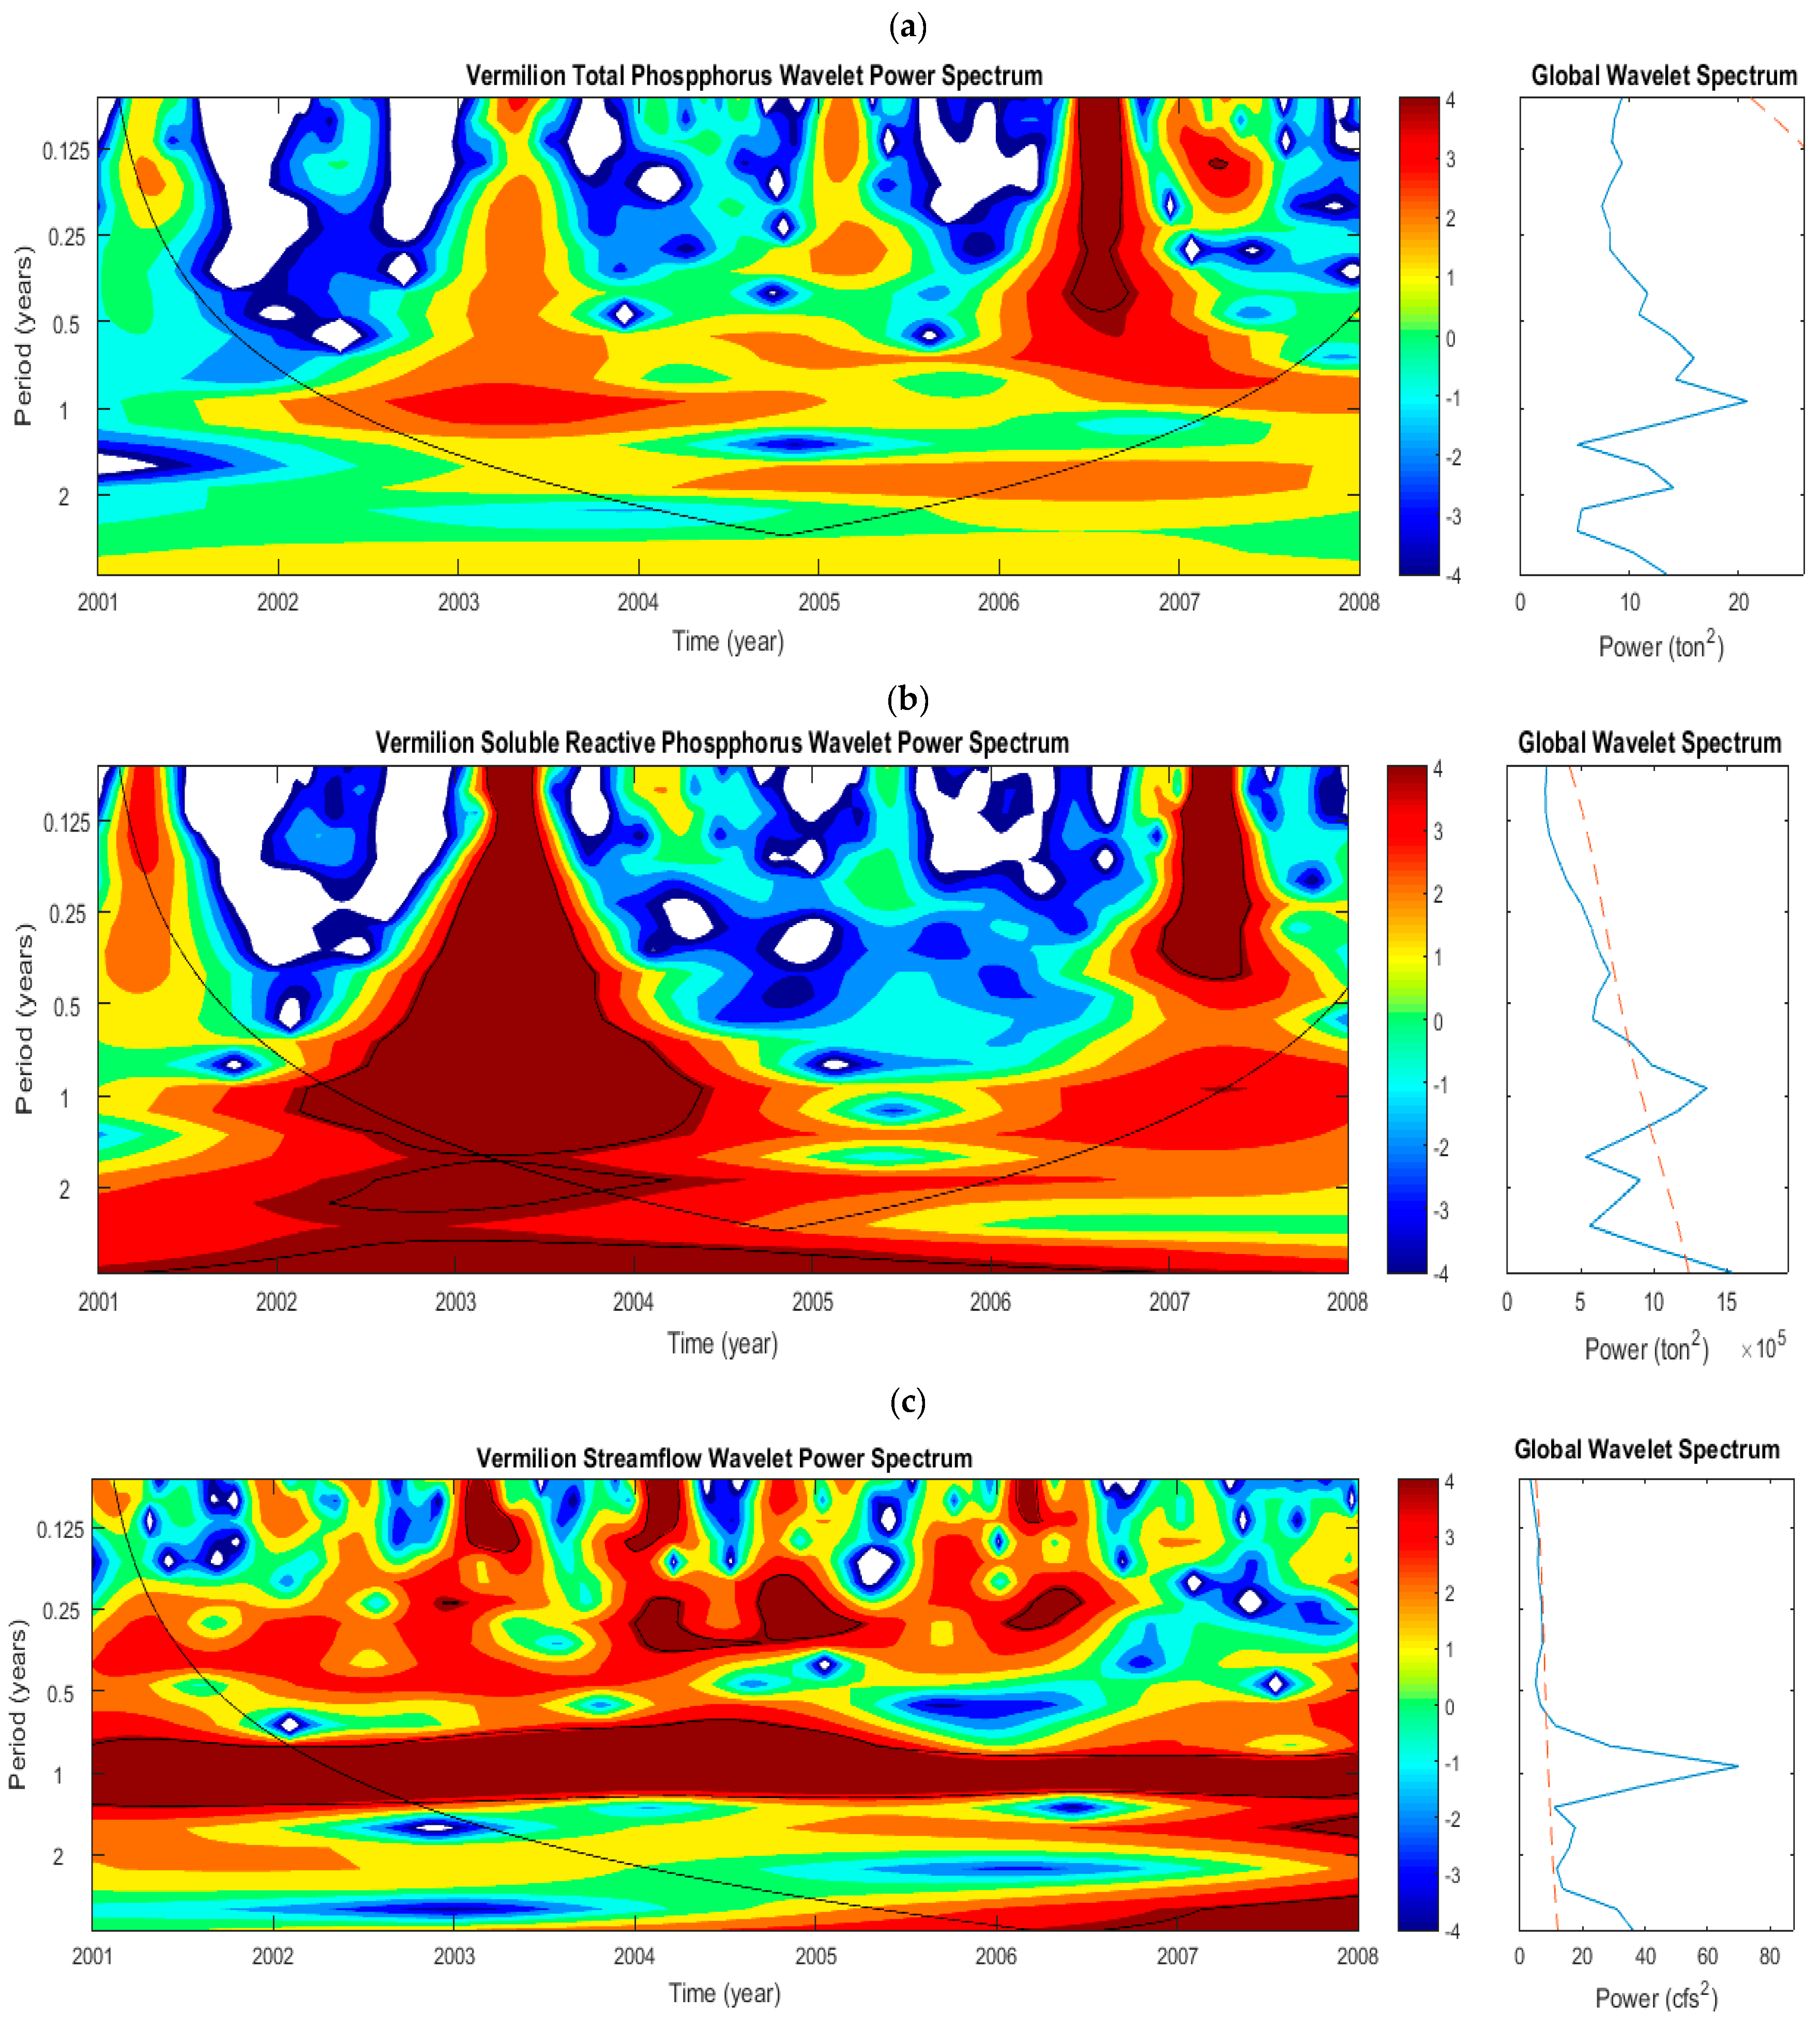
The CWT spectrum of P indicated that the variability in TP was influenced by periodicities ranging from 3 months to 1 year, but it is limited to short-term fluctuations that persisted only from 2006 to 2007 (Figure 12a). No significant variance that could explain the overall variability was detected in the GWPS. The CWT spectrum of TP also indicated that there were no dominant annual patterns present in TP. However, short-term fluctuations of SRP loading persisted for a few years with a large, noisy signal apparent from 2002 to 2004 (Figure 12b). The time-averaged spectrum depicted that the 1-year periodicity explained most of the overall SRP variability in this watershed. Since the available data were short for this river, the DWT analysis was not performed. As a result, in this study, the Vermilion watershed provides limited information on Lake Erie’s P loading variability.

5.1.8. Vermilion Watershed—Flow

The CWT spectrum of streamflow in the Vermilion watershed showed that significant annual variability persisted throughout the recorded period (Figure 12c). Similarly, significant 1-year periodicity was detected in the base flow for the entire period of data recorded (figure not shown) but the CWT spectrum of surface runoff did not depict any significant variability.

5.1.9. Cuyahoga Watershed—Phosphorus

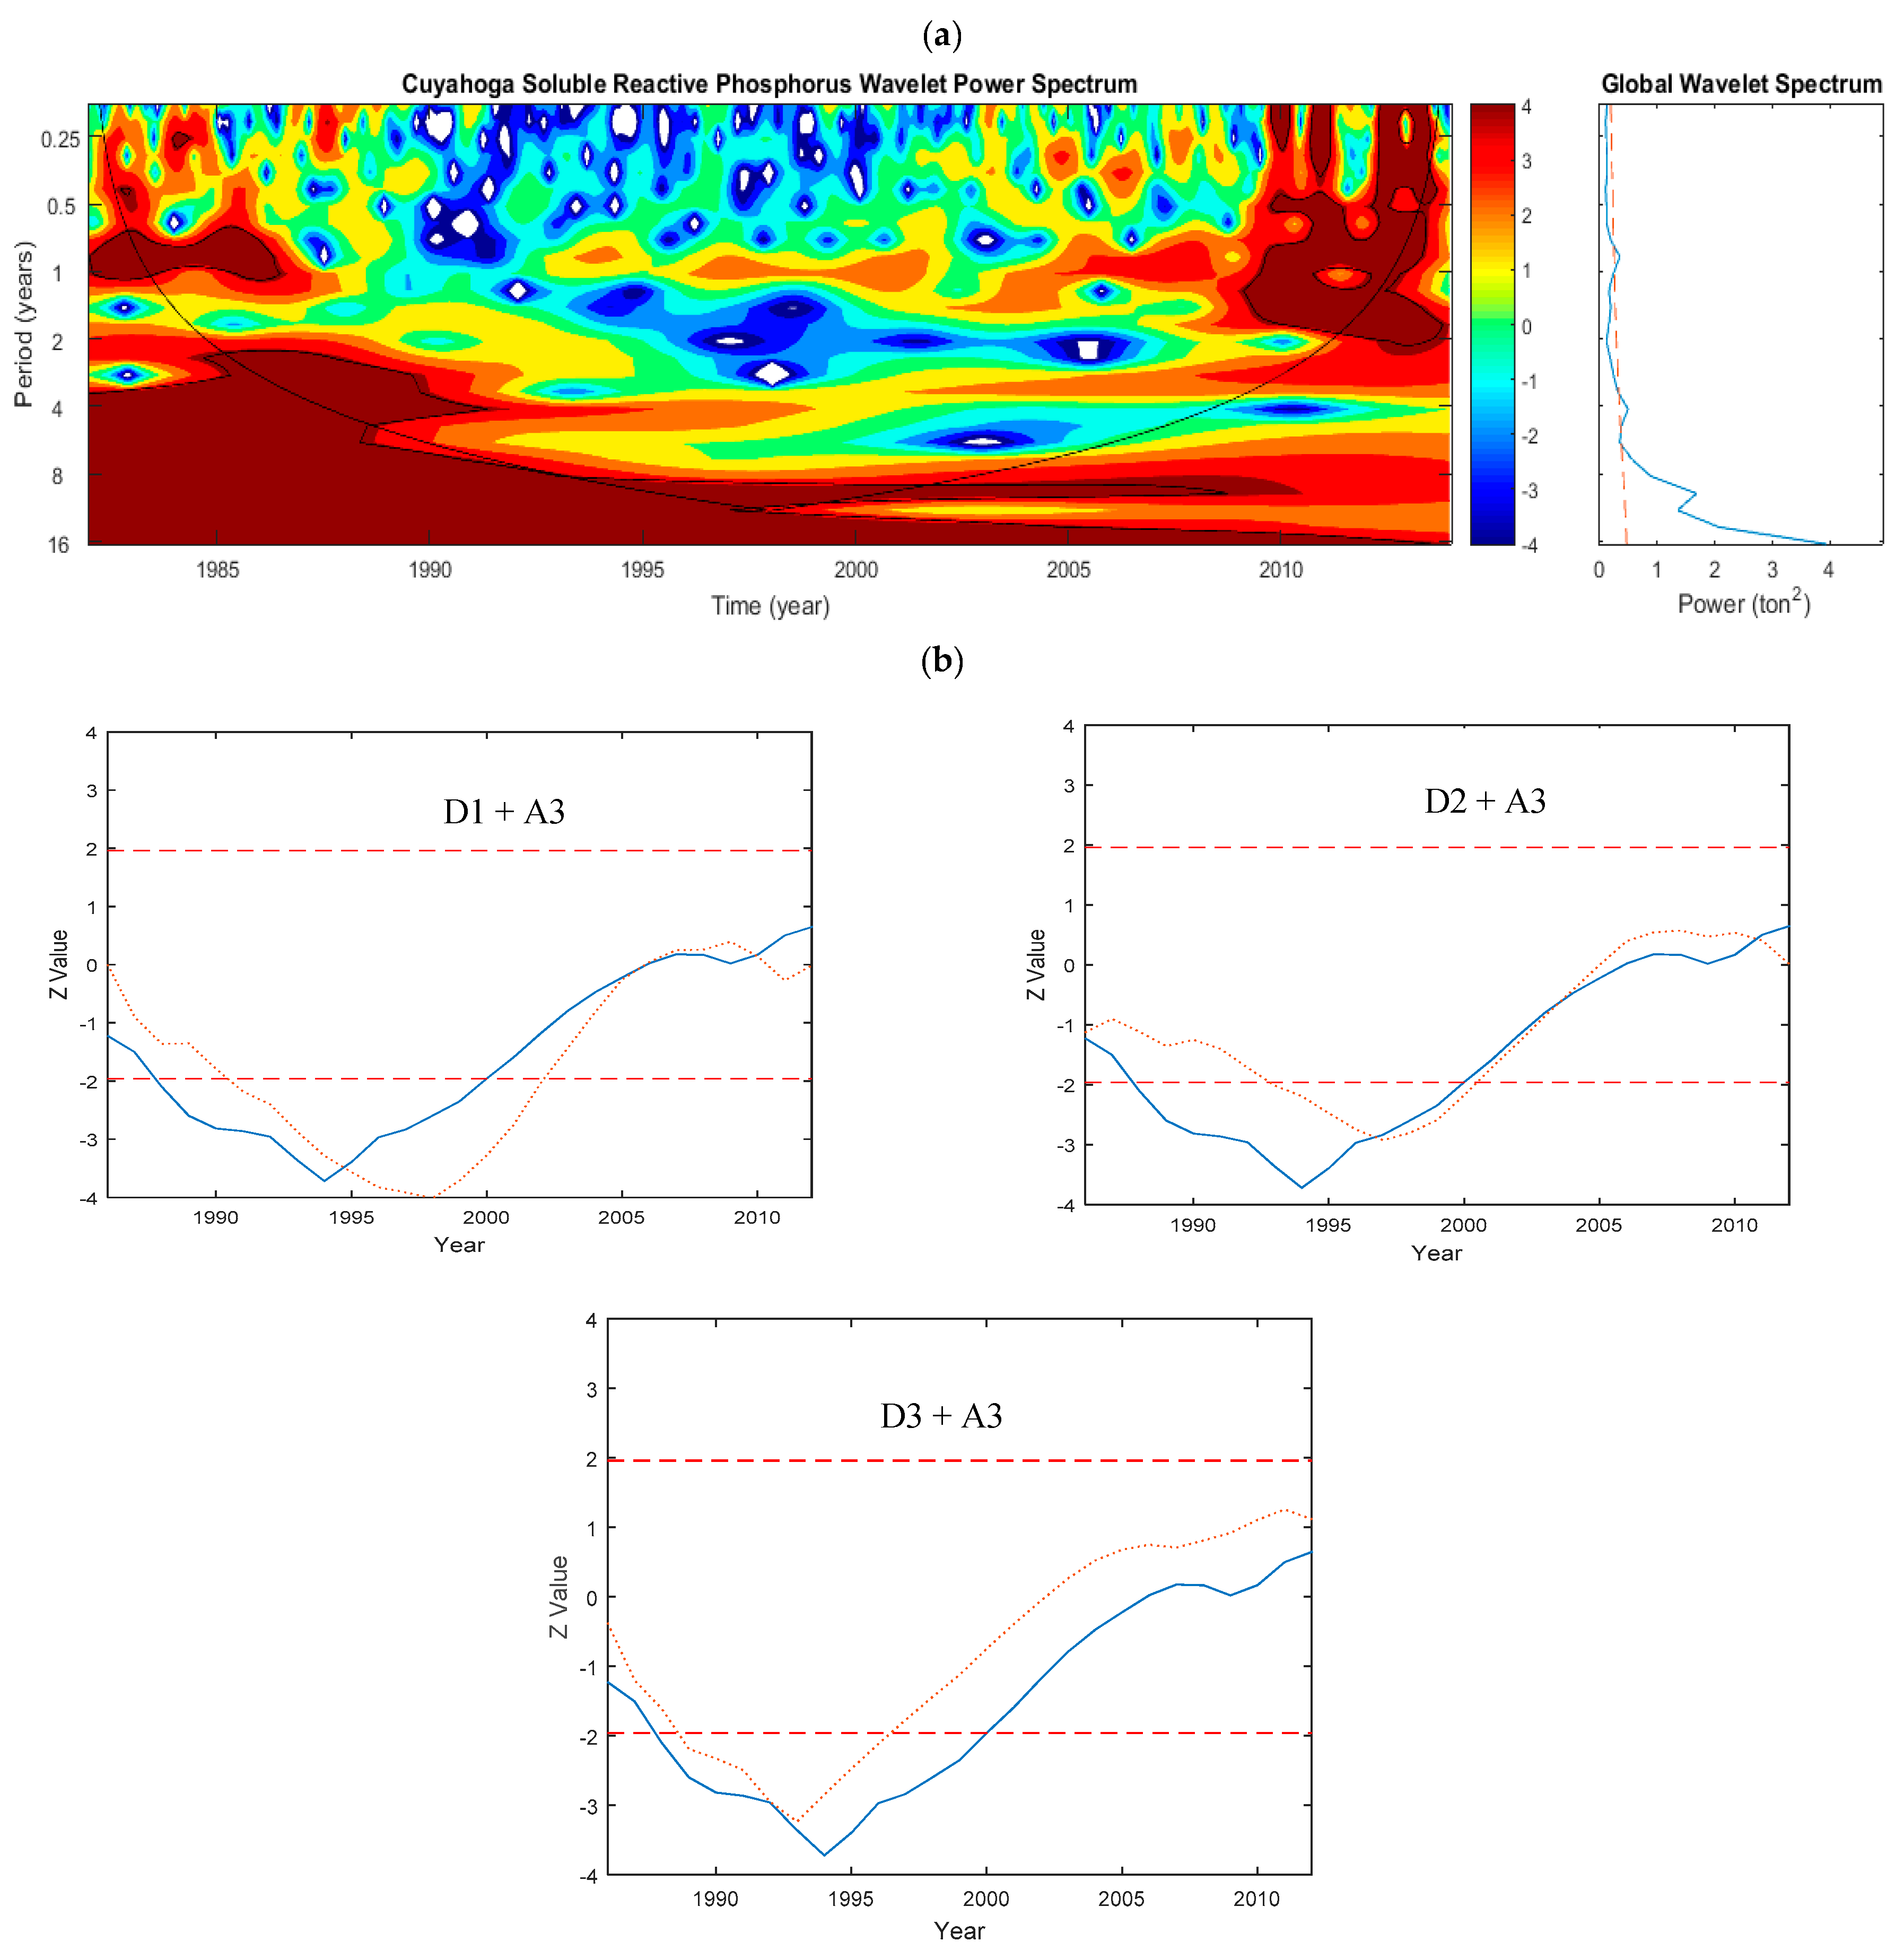
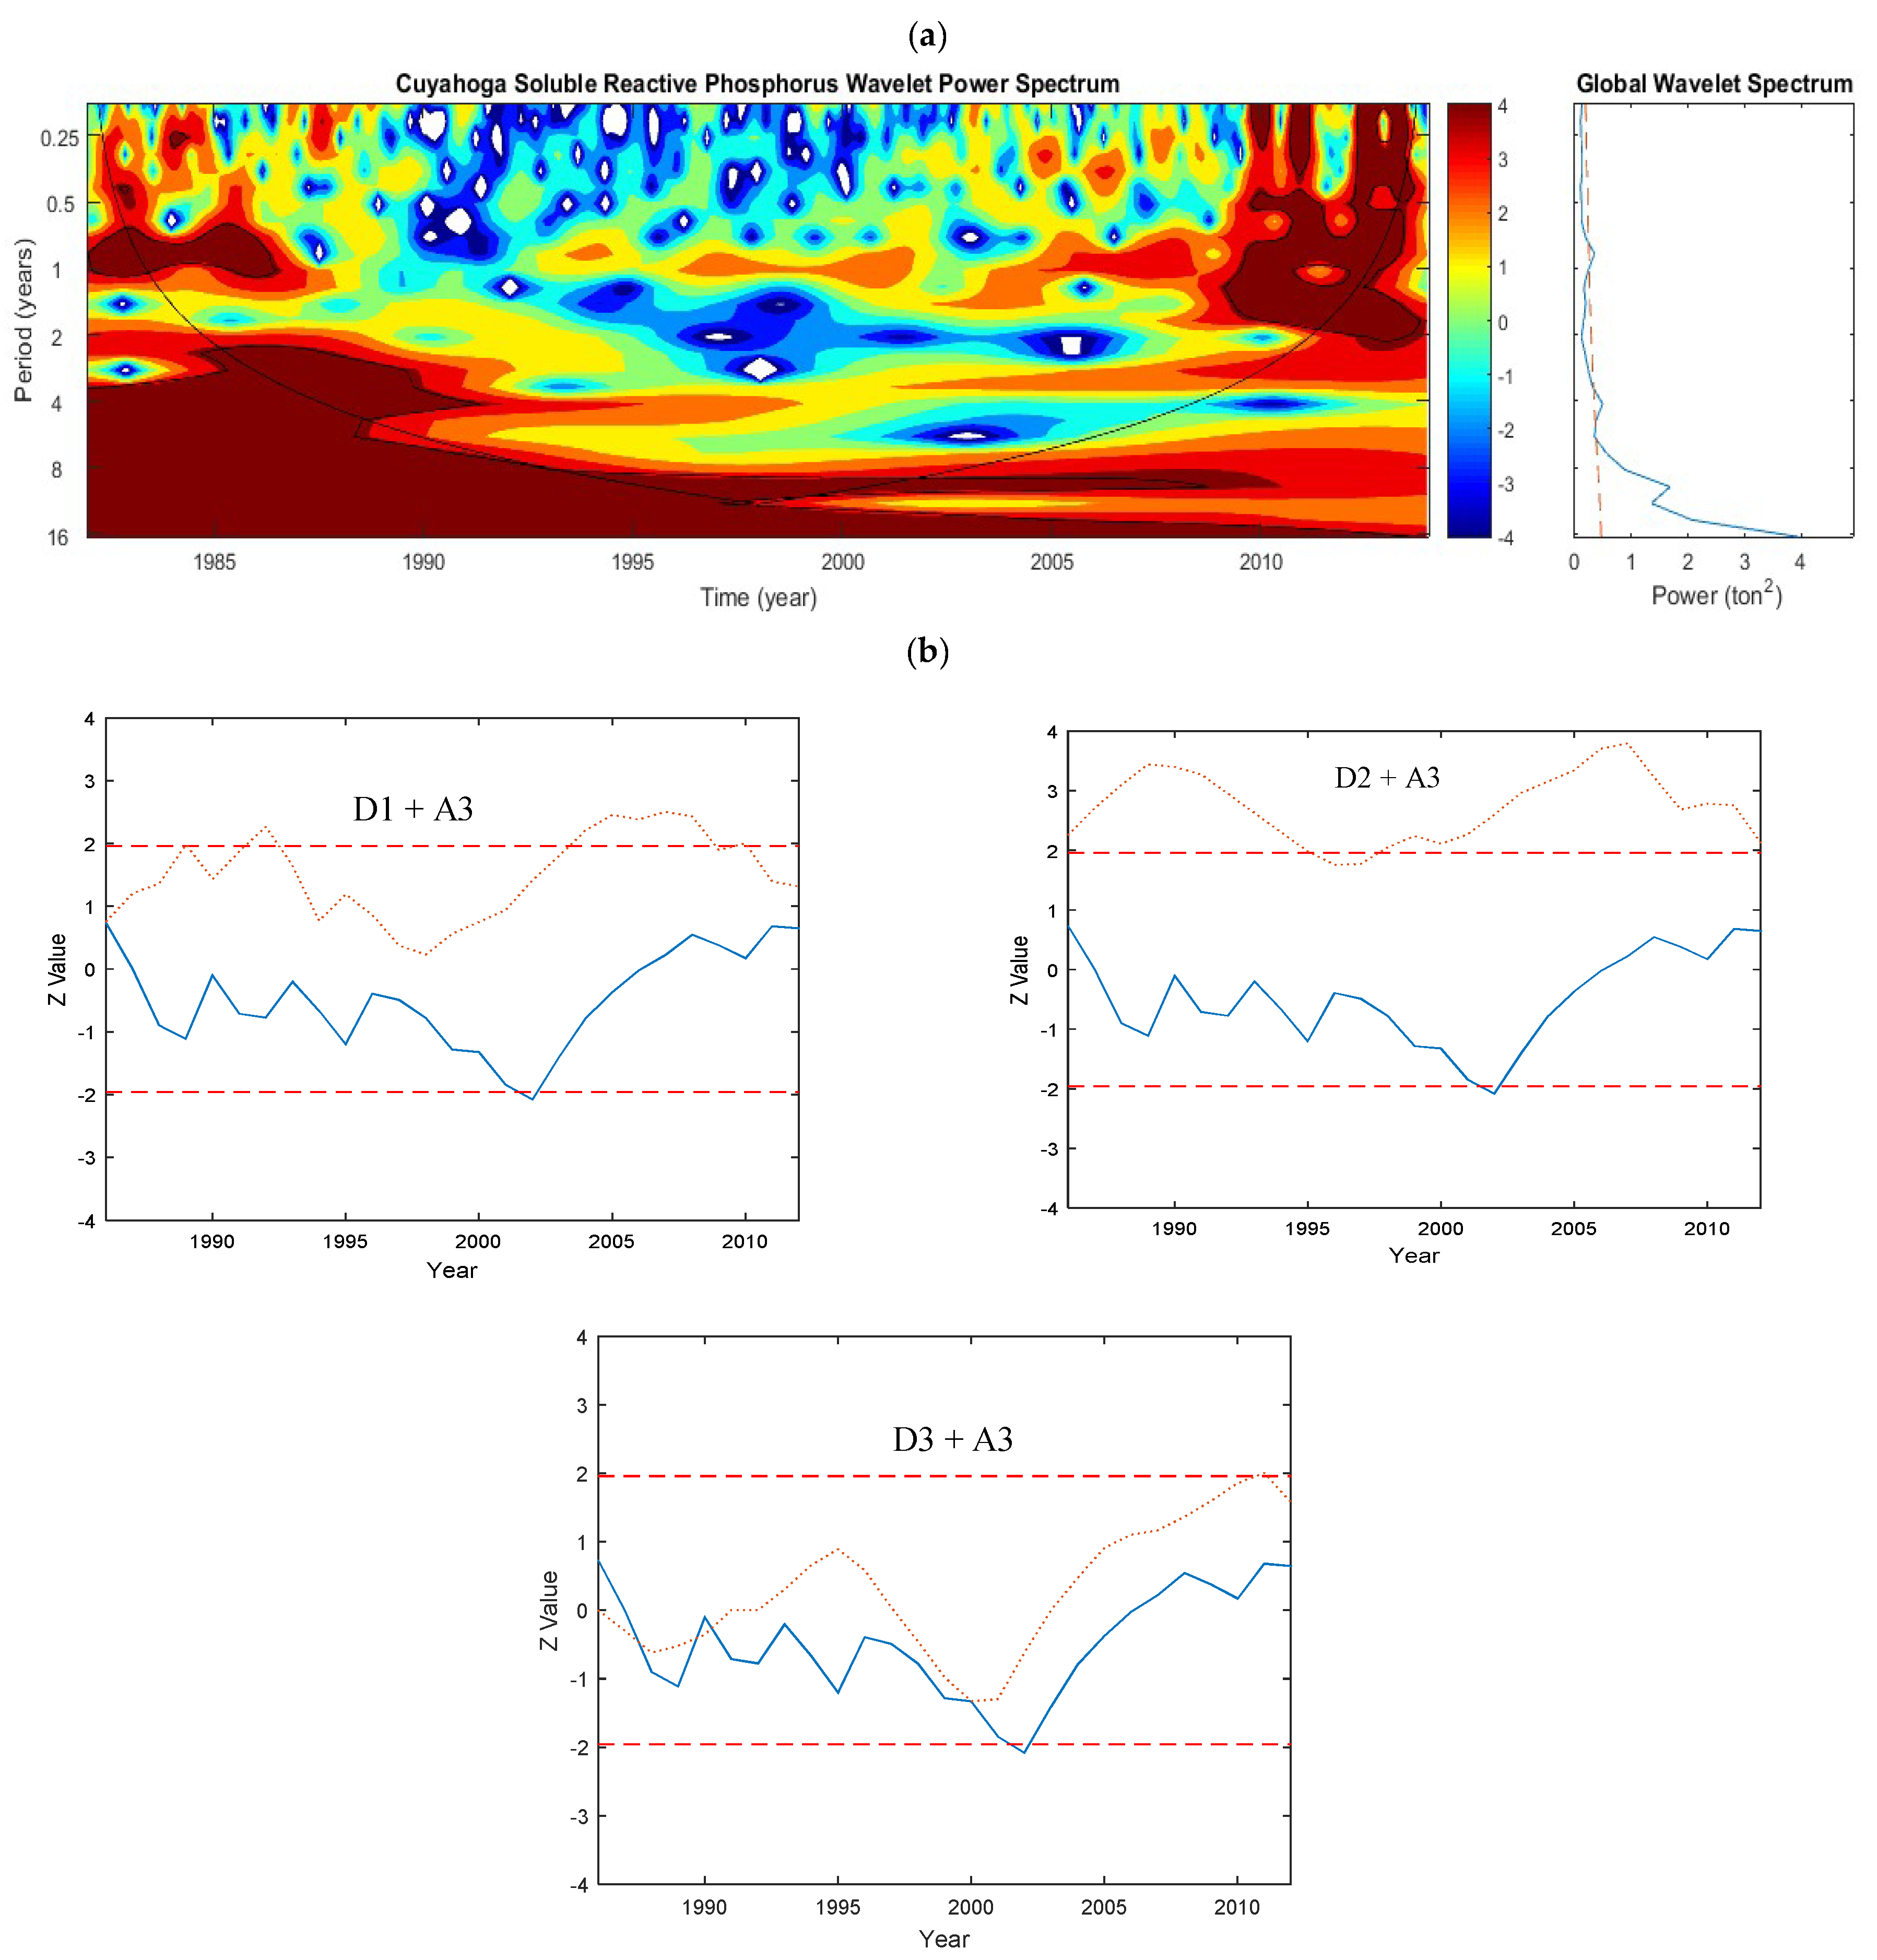
In contrast to other watersheds, there was no significant annual temporal pattern in the Cuyahoga River except for a few areas during 1985 and from 2003 to 2005 (Figure 13a). Although in the GWPS, periodicity around 12 years showed the highest estimated power, none of the periodicity significantly explained the variance in the P data. The sequential trend analysis of the original and decomposed data via DWT (Figure 13b) showed that there was an increasing TP trend after around 1994 and it seemed to be best explained by the 2-year and 4-year periodicities. The CWT spectrum of SRP indicated that it did not exhibit any temporal patterns between 1991 and 2009 (Figure 14a) and significant variability at 2 years was detected for the periods before 1991 and after 2009. The sequential trends were located where the TP and SRP sequential trends of the Cuyahoga River had similar behavior (Figure 13b and Figure 14b, respectively). The Cuyahoga watershed is mostly composed of urbanized areas that have many wastewater treatment plants, which contributes P through the effluents. The P loading in this watershed seems to not be associated with rainfall/streamflow and is mainly due to the contribution from these treatment facilities.

5.1.10. Cuyahoga Watershed—Flow

It was seen in the CWT spectrum of streamflow that it had a high variability that is significantly affected by periodicities after 1 year, 2 years, 4 years, and 8 years (Figure 15a). All of them had a significant power, which is depicted in the GWPS (Figure 15a). Furthermore, the GWPS shows that most of the variance in flow is explained by periodicities at (in descending order): 1 year, around 4 years, and 8 years. However, based on the trend analysis of original streamflow and decomposed data via DWT (Figure 15b), it appeared that streamflow trends were best explained by the 8-year periodicity. The 2-year and 4-year periodicities did not appear to be effective components for explaining the trends in Cuyahoga’s streamflow. While TP had no significant frequency variability, the streamflow had strong and continuous temporal patterns, which were also significantly higher when compared to other watersheds. Again, as indicated above, TP may not be strongly correlated with streamflow in all conditions.
The CWT spectrum of the surface runoff showed that there was no significant variability (figure not shown). Similar to other watersheds, significant variability in the base flow was detected at periodicities after 1 year, 4 year, and 6 years (figure not shown). For this watershed, TP and SRP were not found to be significantly associated with surface runoff and base flow. Since this is an urbanized watershed, this finding is not surprising.

5.1.11. Grand Watershed—Phosphorus

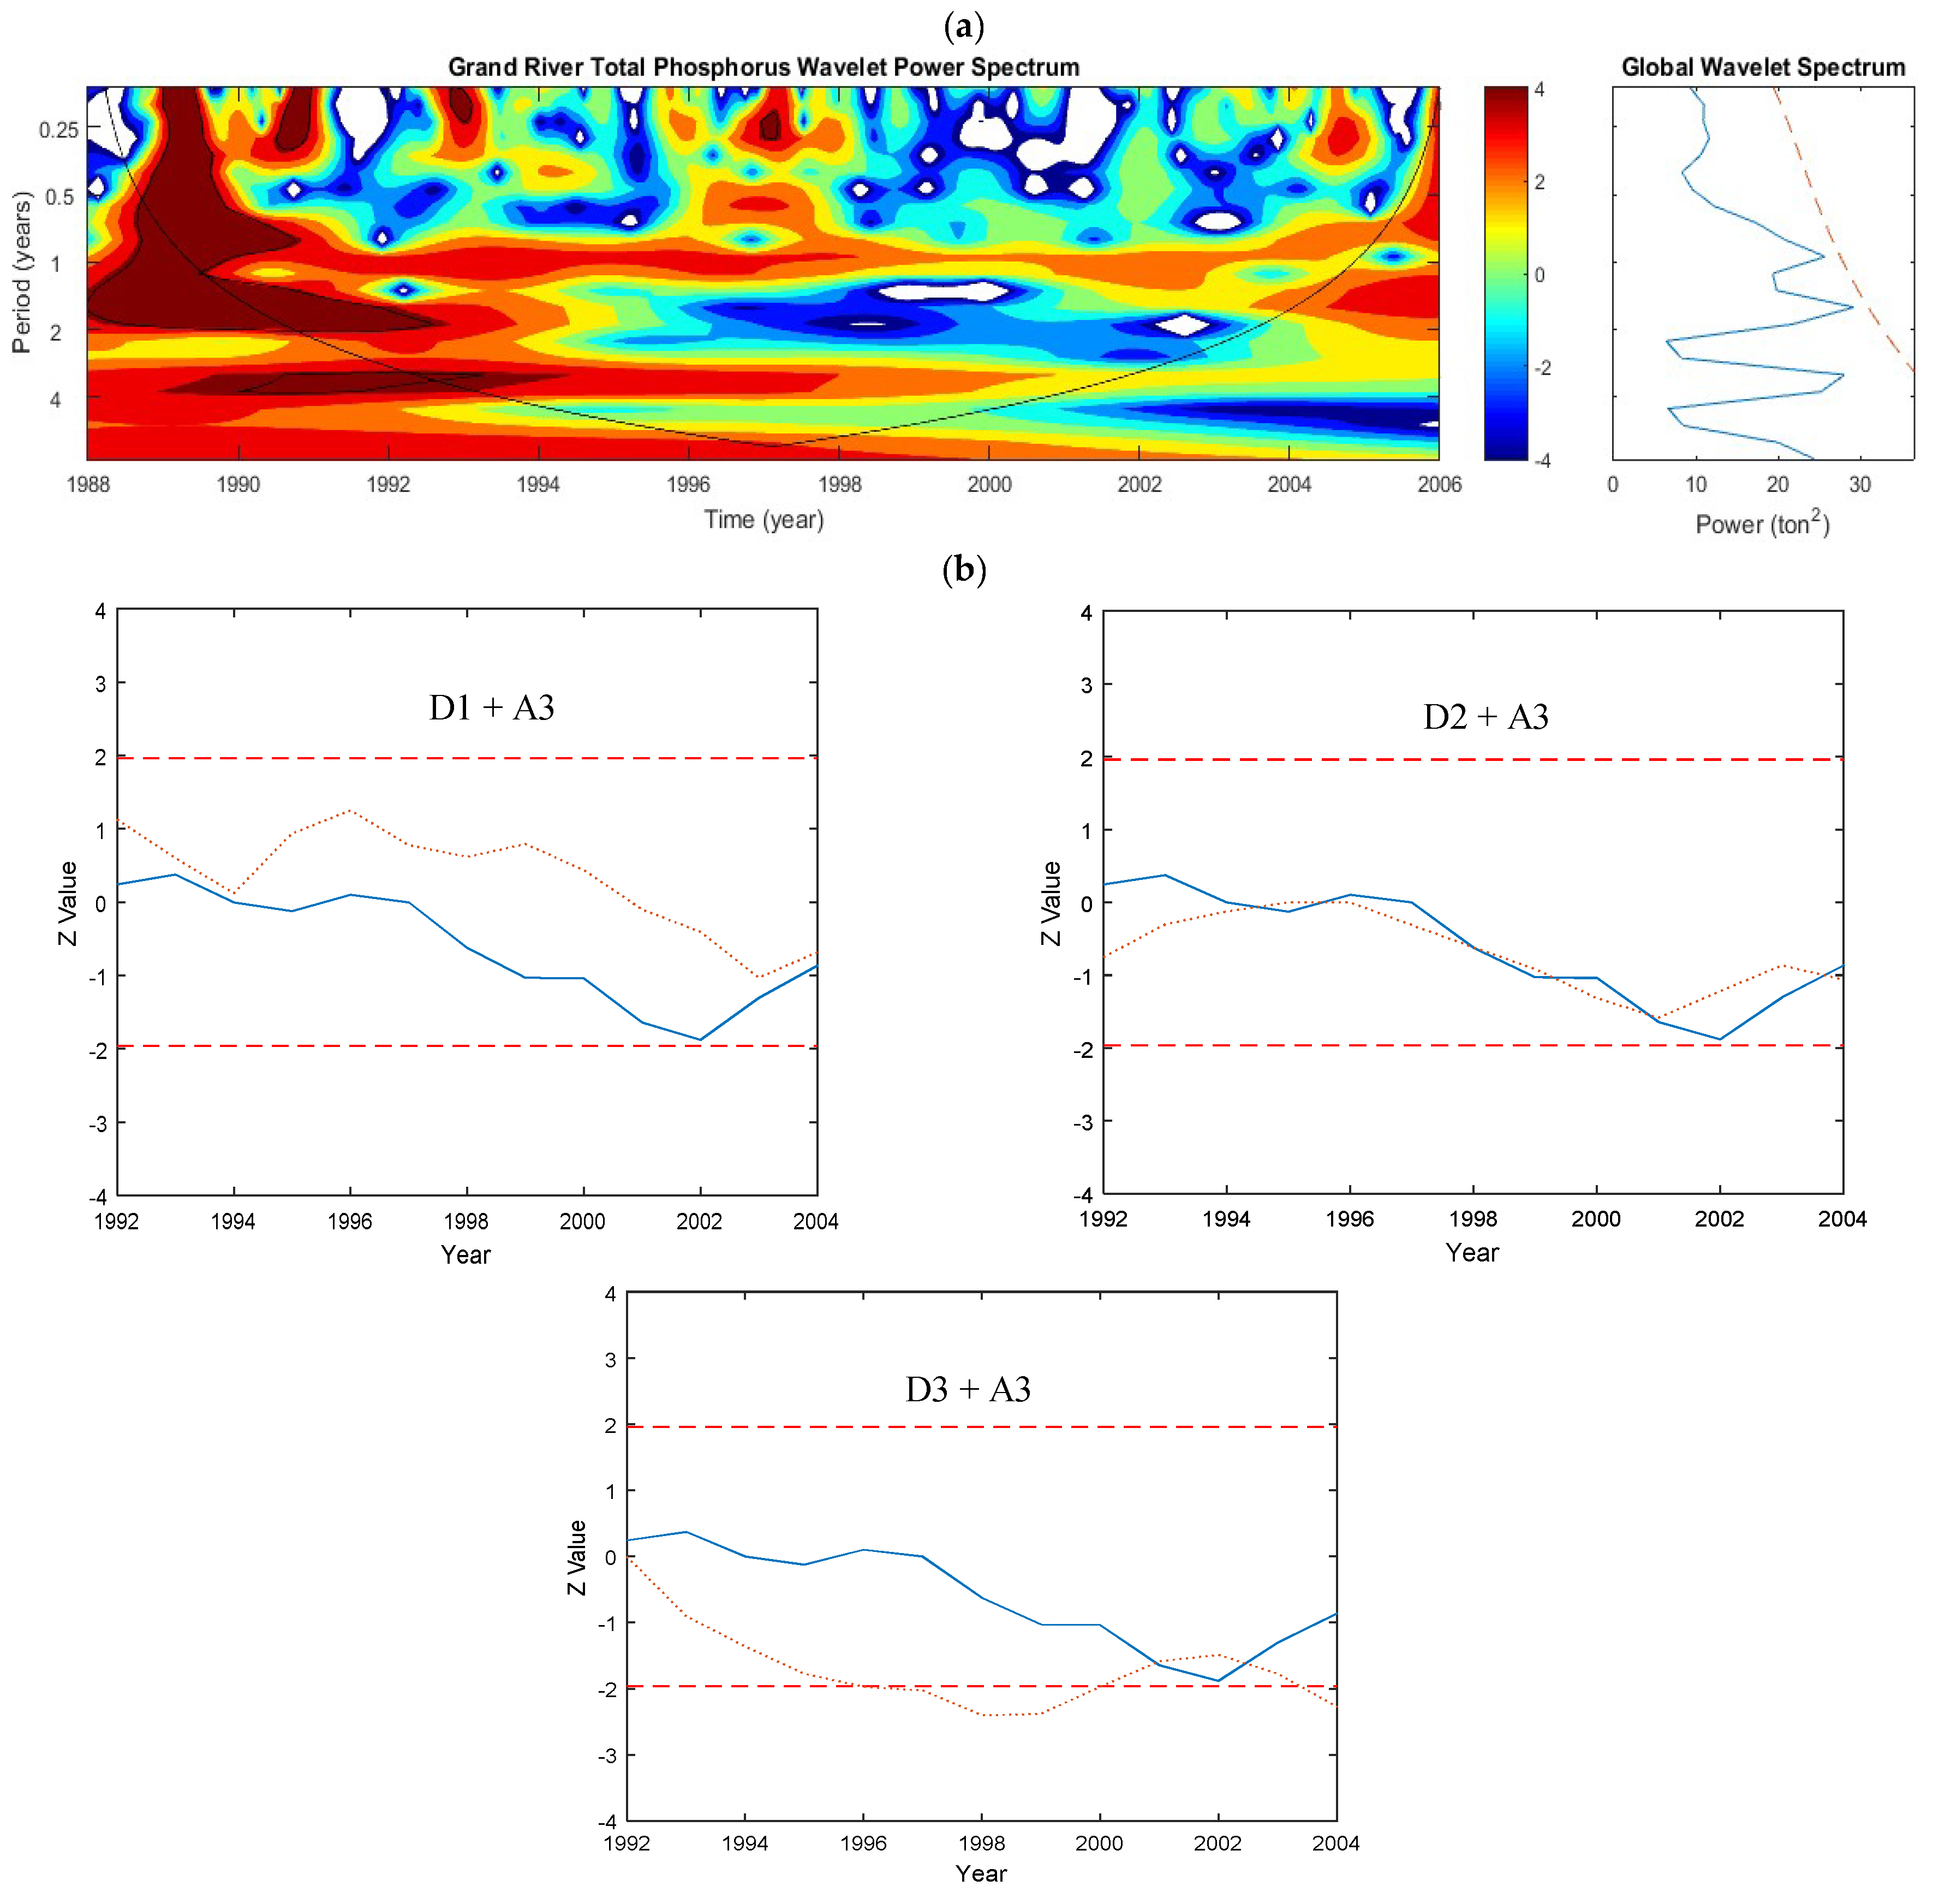
According to the CWT result, this study did not find much difference in the variability of TP loading between the Cuyahoga River (Figure 15a) and the Grand River (Figure 16a). There was not much of a temporal pattern in the TP of Grand River except at the beginning of the data period from 1988 to 1993 (Figure 16a). The TP trend decreased until around 2002 and then it started to increase again. Since the time series data for the Grand River were available only from 1988, we could not detect the pattern before 1988. Even though the time series revealed high variability in the annual scale, it was not significant enough to explain the variability contained in the TP since the GWPS did not show any periodicities that were significant at the 95% confidence interval that would explain most of the overall variability in this River (Figure 16a).
For SRP, CWT showed that significant variability of SRP was mostly seen for the 1-year and 4-year periodicities, but they only started from 1996 onwards (which is also consistent with results of the trend analysis showing an increase in SRP after 1995 (Figure 17a). The GWPS indicated that the 1-year and 4-year periodicities explained most of the SRP variance. The 1-year and 4-year variability had different amplitudes especially during the later years, which indicates that the time series showed non-stationary characteristics particularly during those later years. Based on the trend analysis results obtained in the original and decomposed SRP data (via DWT), only the 8-year periodicity seemed to affect the trend in annual SRP data in the Grand River (Figure 17b). Since DWT is not able to reveal the 1-year variability, it could not show the variation of the annual scale, which is observed in the results of CWT. Figure 17b also revealed that there is a significant increasing SRP trend (Z = 2.35, α = 5%), which is shown in Table 2. The increasing trends were visible around the mid-1990s.

5.1.12. Grand Watershed—Flow

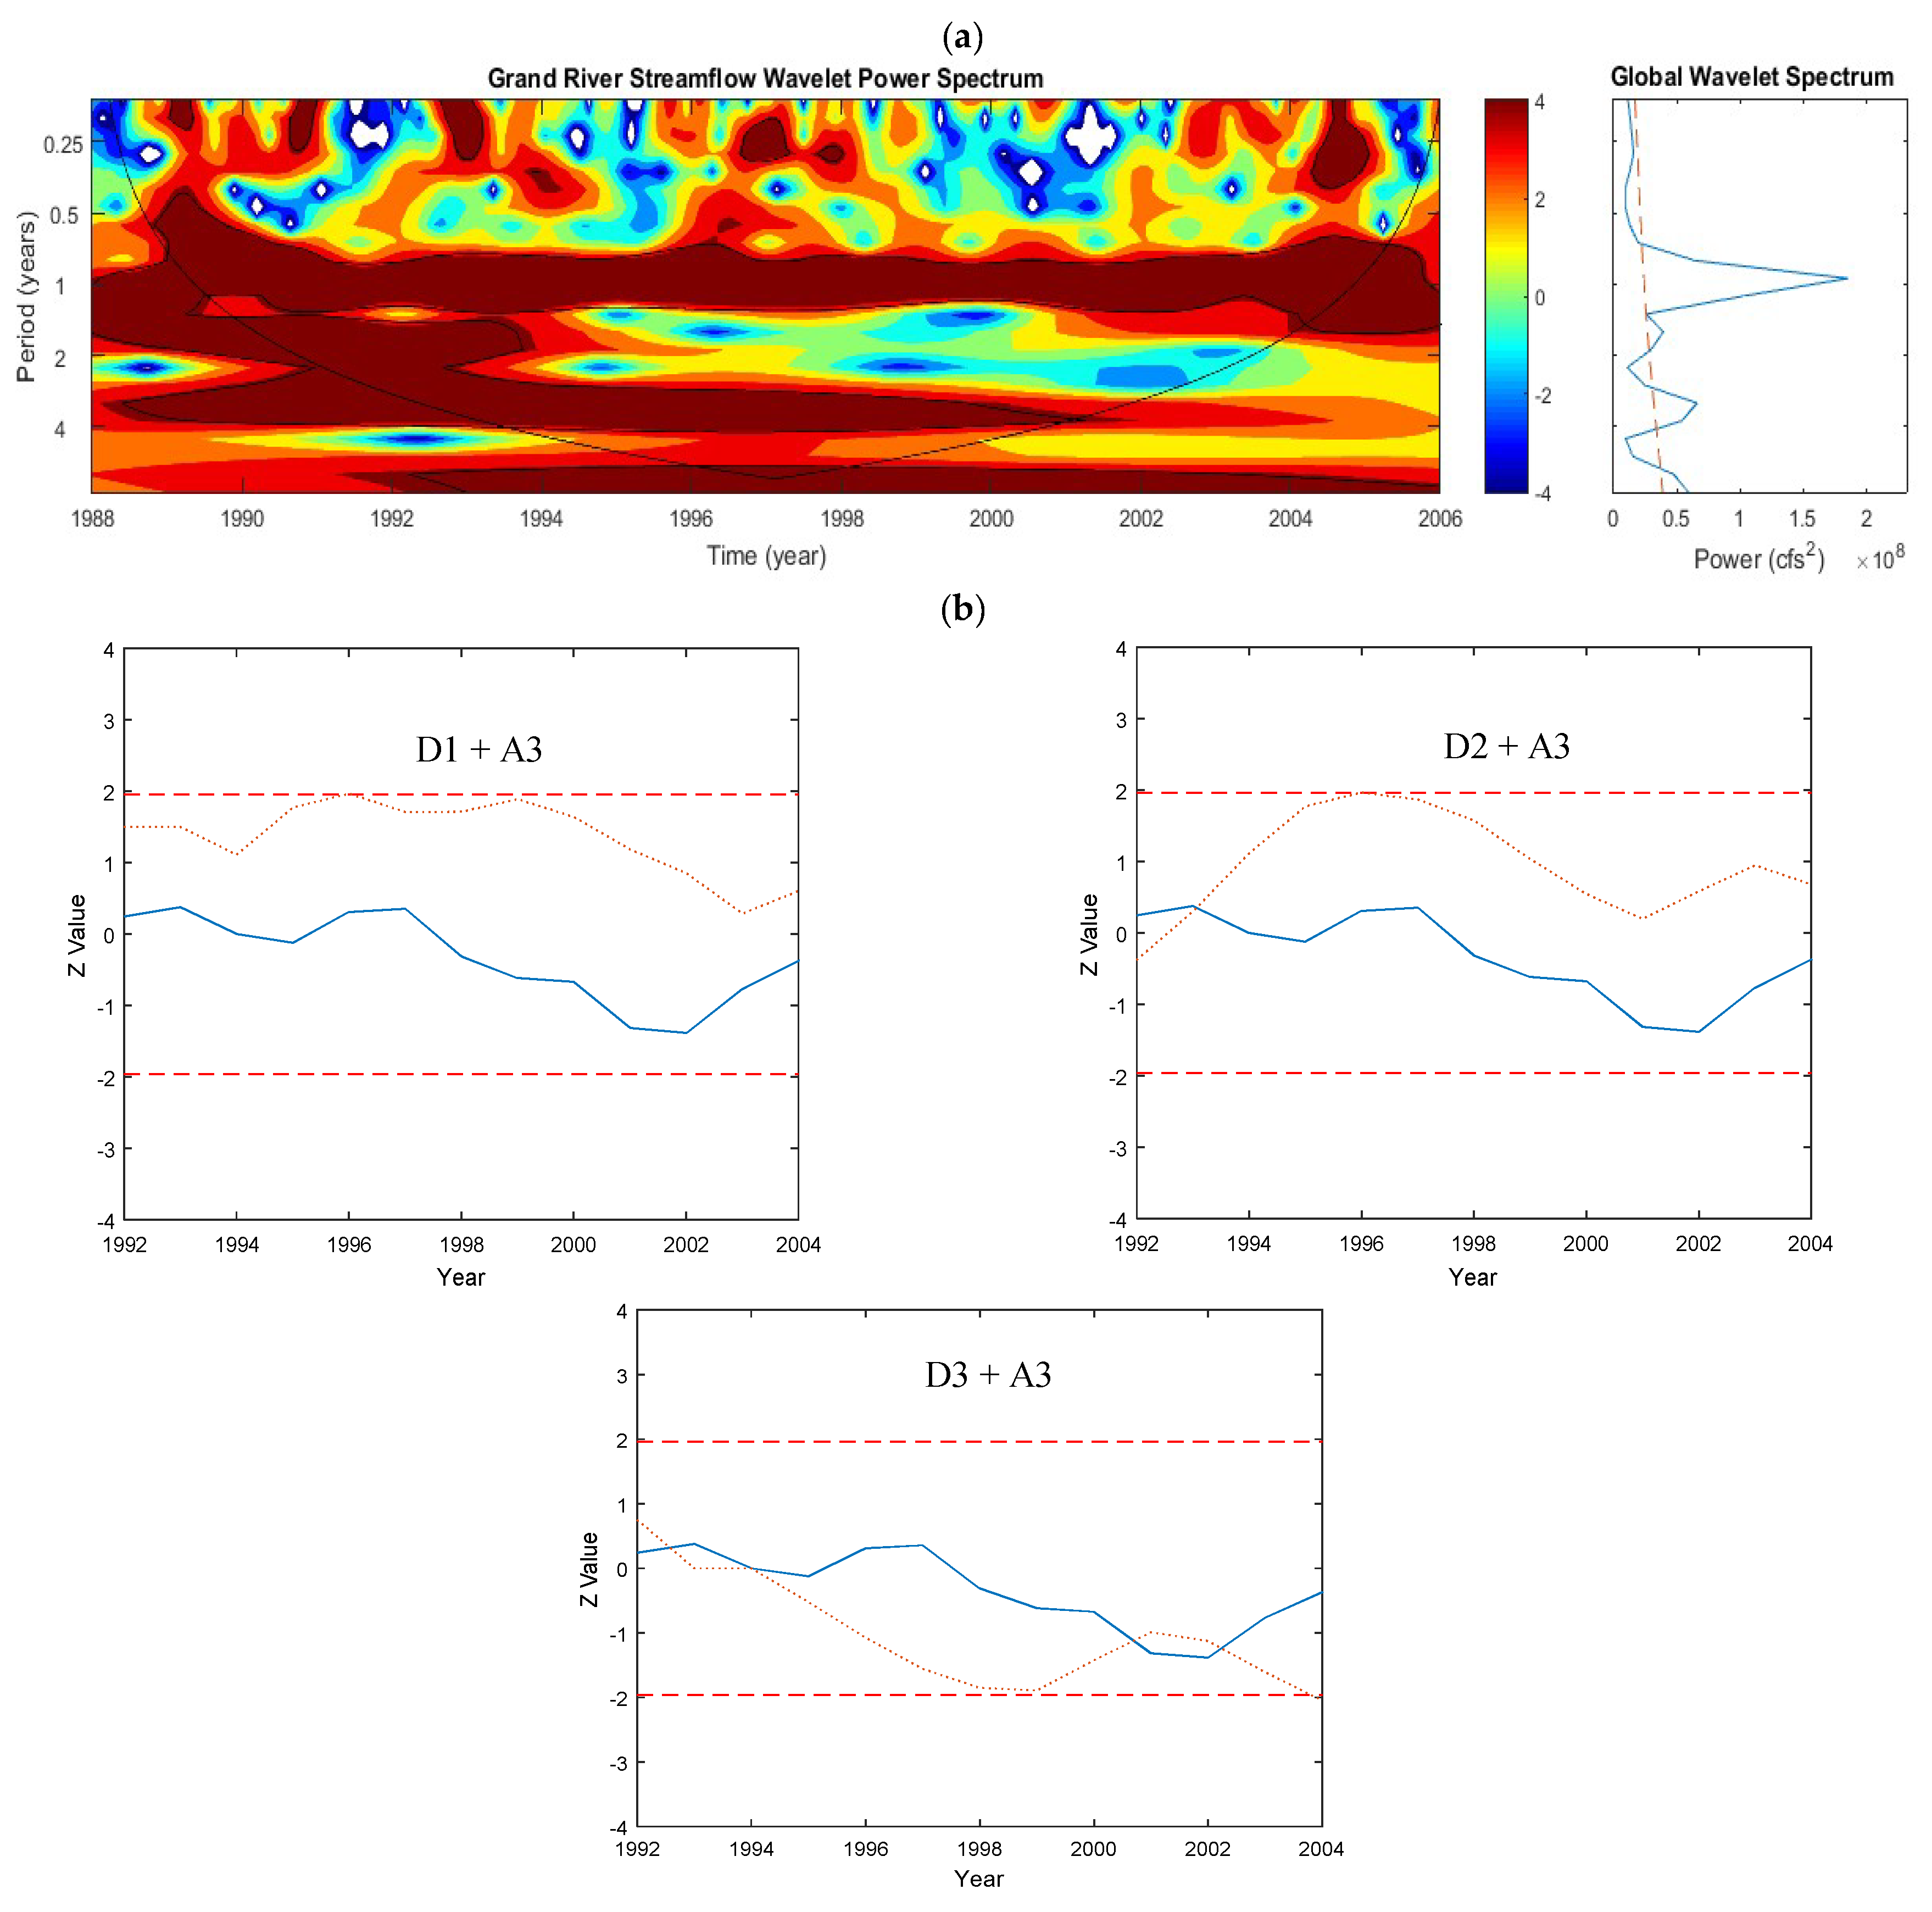
According to the CWT analysis, significant variability was not only observed for the 1-year periodicity but was also observed for the 2-year and 4-year periodicities. However, the 2-year frequency oscillation ended in 1994 and the 4-year frequency oscillation continued until 2001 (Figure 18a). Similar to other watersheds above, the 1-year variability also explained most of the variance in flow. The 2-year and 4-year oscillations were also significant but did not account for much of the variance (Figure 18a). In contrast, based on the trend analysis on the original streamflow and decomposed data through DWT (Figure 18b), periodicities between 2 and 8 years were not effective in describing the streamflow trend. In addition, since DWT does not pick up the 1-year variability, it could not show the variation of the annual scale. The variability of the 1-year periodicity observed in the CWT spectrum and GWPS was very high and consistent throughout the data period and, as a result, it may have concealed the effect of other lower-frequency components that might have also affected the trends but were less prominent.
The CWT spectrum of the surface runoff wavelet spectrum indicated the strong continuous annual variability in addition to the 4-year periodicities from the years 1990 to 1997 (figure not shown). However, there was no variability detected in TP during this period, which indicates that P was not driven by streamflow during this period. Since the Grand River is categorized as forested watershed, it was likely that sediment P was not present in a significant amount because sediment P is typically associated with agricultural watersheds. Even though consistent temporal variability was detected in the surface runoff and streamflow, temporal patterns in TP were not detected in the Grand River.
Similarly, the CWT spectrum of the base flow indicated significant variability at the 1-year and 4-year periodicities (figures not shown). Significant variability detected for the SRP was seen for periodicities at 1 year and 4 years and they occurred from 1996 onwards. This was also consistent with the results of the sequential MK analysis showing that there was an increase in SRP after the mid-1990s (Figure 17b). The CWT spectrum of the base flow in the Grand River was consistent with the wavelet power spectrum of the SRP. Surface runoff variability was limited to the annual periodicity after 1997 and there was no significant variability detected at the 4-year periodicity (figure not shown). However, significant variability was mixed for the baseflow. Both 1-year and 4-year periodicities were detected, which were similar to the variability of the streamflow (figure not shown). This indicated that the increase in SRP agreed with the increasing trend of flow even though the trend analysis showed that TP was decreasing [58].

6. Summary and Conclusions

In this study, wavelet analysis was found to be a useful approach in exploring the temporal patterns of flow, TP, and SRP in various watersheds, which are located in the western part of the Lake Erie Basin. Even though two different approaches of CWT and DWT were used in the analysis, they complimented each other in studying the time-frequency evolution of the hydrological and water quality parameters. This study found that the CWT approach was useful in loosening the time-varying characteristics of the water quantity and quality parameters included. The DWT approach was useful in determining the dominant periodic components that could potentially explain the trends contained in flow and P in those watersheds.
The annual variability was found to be significant in most of the CWT spectra. The variation at the annual scale could be partly related to the seasonality factor such as spring flow events that are typical around the study area. Using DWT to analyze annual data, however, could not reveal the yearly variability due to the dyadic-grid arrangement of the DWT approach where the first scale of the output was 2 years. Hence, utilizing both CWT and DWT approaches is effective in facilitating the understanding of the trends and temporal variability of the different hydrological parameters that contribute to the trophic status of Lake Erie.
The significant trends detected were for SRP in the Raisin, Sandusky, and Grand Rivers. Both CWT and DWT indicated an increasing pattern in SRP after the mid-1990s. Typically, trends of TP were much more similar to that of the flow compared to that of the SRP, which suggests that flow had a strong influence on TP in the western part of the Lake Erie Basin.
Phosphorus from the agricultural watershed was mostly correlated with flow particularly in the agricultural watersheds similar to wavelet power spectra between TP and flow. However, this was not seen for the urbanized and forested watersheds. Similarities in the temporal patterns between flow and TP in agricultural watersheds found in this study supports what has normally been seen in the agricultural setting that P was mostly driven by flow.
Overall, stronger and more consistent temporal patterns were detected for streamflow and surface runoff compared to TP and SRP. Although the temporal patterns of flow were mostly affected by the annual periodicity, variability at 2 to 4 years was also relatively strong. For TP and SRP, the patterns were mostly limited to the annual periodicity but had frequent discontinuities. One of the reasons of not getting the distinct periodicity could be due to the limited data availability in some of the watersheds. In summary, the results obtained in this study are generalized below.
  • The annual periodicity was highly significant and it contains the largest proportion of the variance of the time series. However, the variance varied considerably among the different sites.
  • In addition to the annual periodicity, significant periodicities at higher scales were also revealed especially when long-term data were used. For the Maumee River, the 2-year and 8-year periodicities were also significant and, for the Sandusky River, the 2-year periodicity was significant. Periodicity of 2 and 8 year for Maumee River indicated the significant loading from Maumee River.
  • The annual pattern of P loading was continuously significant for most sites. However, it was not significant in Grand and Cuyahoga Rivers.
Overall, this research demonstrated that wavelet analysis serves as a useful tool in investigating the behavior of the predominant hydrological processes such as those that affect the P loading in the western Lake Erie Basin. Further usage of such information can be applied more generally in various model developments as part of management strategies to tackle the eutrophication problems in the basin. In the future, readers can use long-term datasets and wavelet analysis for a better assessment in other catchments.

Author Contributions

S.S. conceptualized the research and selected the tools and analytic method. N.S. collected the data and helped in processing the data and preparing draft. D.N. conducted the Discrete Wavelet Transform method and helped in writing and editing the manuscript. S.S. prepared the final draft.

Funding

This research received no external funding.

Conflicts of Interest

The authors declare no conflicts of interest

References

  1. Forster, D.L.; Richards, R.P.; Baker, D.B.; Blue, E.N. EPIC modeling of the effects of farming practice changes on water quality in two Lake Erie watersheds. J. Soil Water Conserv. 2000, 55, 85–90. [Google Scholar]
  2. Strickland, T.; Fisher, L.; Korleski, C. Ohio Lake Erie Phosphorus Task Force Final Report; Ohio Environmental Protection Agency, Division of Surface Water: Columbus, OH, USA, 2010.
  3. Dolan, D.M. Point source loadings of phosphorus to Lake Erie: 1986–1990. J. Great Lakes Res. 1993, 19, 212–223. [Google Scholar] [CrossRef]
  4. Dolan, D.M.; McGunagle, K.P. Lake Erie total phosphorus loading analysis and update: 1996–2002. J. Great Lakes Res. 2005, 31, 11–22. [Google Scholar] [CrossRef]
  5. Vanderploeg, H.A.; Nalepa, T.F.; Jude, D.J.; Mills, E.L.; Holeck, K.T.; Liebig, J.R.; Grigorovich, I.A.; Ojaveer, H. Dispersal and emerging ecological impacts of Ponto-Caspian species in the Laurentian Great Lakes. Can. J. Fish. Aquat. Sci. 2002, 59, 1209–1228. [Google Scholar] [CrossRef]
  6. Conroy, J.D.; Edwards, W.J.; Pontius, R.A.; Kane, D.D.; Zhang, H.; Shea, J.F.; Richey, J.N.; Culver, D.A. Soluble nitrogen and phosphorus excretion of exotic freshwater mussels (Dreissena spp.): Potential impacts for nutrient remineralisation in western Lake Erie. Freshw. Biol. 2005, 50, 1146–1162. [Google Scholar] [CrossRef]
  7. Bertram, P.E. Total phosphorus and dissolved oxygen trends in the central basin of Lake Erie, 1970–1991. J. Great Lakes Res. 1993, 19, 224–236. [Google Scholar] [CrossRef]
  8. Makarewicz, J.C.; Bertram, P. Evidence for the restoration of the Lake Erie ecosystem. Bioscience 1991, 41, 216–223. [Google Scholar] [CrossRef]
  9. Rosa, F.; Burns, N.M. Lake Erie central basin oxygen depletion changes from 1929–1980. J. Great Lakes Res. 1987, 13, 684–696. [Google Scholar] [CrossRef]
  10. De Pinto, J.V.; Young, T.C.; McIlroy, L.M. Great Lakes water quality improvement. Environ. Sci. Technol. 1986, 20, 752–759. [Google Scholar] [CrossRef] [PubMed]
  11. Bosch, N.S.; Evans, M.A.; Scavia, D.; Allan, J.D. Interacting effects of climate change and agricultural BMPs on nutrient runoff entering Lake Erie. J. Great Lakes Res. 2014, 40, 581–589. [Google Scholar] [CrossRef]
  12. Scavia, D.; Allan, J.D.; Arend, K.K.; Bartell, S.; Beletsky, D.; Bosch, N.S.; Brandt, S.B.; Briland, R.D.; Daloğlu, I.; DePinto, J.V. Assessing and addressing the re-eutrophication of Lake Erie: Central basin hypoxia. J. Great Lakes Res. 2014, 40, 226–246. [Google Scholar] [CrossRef]
  13. Ludsin, S.A.; Kershner, M.W.; Blocksom, K.A.; Knight, R.L.; Stein, R.A. Life after death in Lake Erie: Nutrient controls drive fish species richness, rehabilitation. Ecol. Appl. 2001, 11, 731–746. [Google Scholar] [CrossRef]
  14. Shea, M.A.; Makarewicz, J.C. Production, biomass, and trophic interactions of Mysis relicta in Lake Ontario. J. Great Lakes Res. 1989, 15, 223–232. [Google Scholar] [CrossRef]
  15. Charlton, M.N.; Milne, J.E.; Booth, W.G.; Chiocchio, F. Lake Erie offshore in 1990: Restoration and resilience in the central basin. J. Great Lakes Res. 1993, 19, 291–309. [Google Scholar] [CrossRef]
  16. Murphy, T.P.; Irvine, K.; Guo, J.; Davies, J.; Murkin, H.; Charlton, M.; Watson, S.B. New microcystin concerns in the lower Great Lakes. Water Qual. Res. J. Can. 2003, 38, 127–140. [Google Scholar] [CrossRef]
  17. Michalak, A.M.; Anderson, E.J.; Beletsky, D.; Boland, S.; Bosch, N.S.; Bridgeman, T.B.; Chaffin, J.D.; Cho, K.; Confesor, R.; Daloğlu, I. Record-setting algal bloom in Lake Erie caused by agricultural and meteorological trends consistent with expected future conditions. Proc. Natl. Acad. Sci. USA 2013, 110, 6448–6452. [Google Scholar] [CrossRef] [PubMed] [Green Version]
  18. Stumpf, R.P.; Wynne, T.T.; Baker, D.B.; Fahnenstiel, G.L. Interannual variability of cyanobacterial blooms in Lake Erie. PLoS ONE 2012, 7, e42444. [Google Scholar] [CrossRef] [PubMed]
  19. Pinto, M.R.; De Santis, R.; D’alessio, G.; Rosati, F. Studies on fertilization in the ascidians: Fucosyl sites on vitelline coat of Ciona intestinalis. Exp. Cell Res. 1981, 132, 289–295. [Google Scholar] [CrossRef]
  20. Richards, R.; Baker, D.; Crumrine, J.; Stearns, A. Unusually large loads in 2007 from the Maumee and Sandusky Rivers, tributaries to Lake Erie. J. Soil Water Conserv. 2010, 65, 450–462. [Google Scholar] [CrossRef] [Green Version]
  21. Vanderploeg, H.A.; Ludsin, S.A.; Ruberg, S.A.; Höök, T.O.; Pothoven, S.A.; Brandt, S.B.; Lang, G.A.; Liebig, J.R.; Cavaletto, J.F. Hypoxia affects spatial distributions and overlap of pelagic fish, zooplankton, and phytoplankton in Lake Erie. J. Exp. Mar. Biol. Ecol. 2009, 381, S92–S107. [Google Scholar] [CrossRef]
  22. Burns, N.M.; Rockwell, D.C.; Bertram, P.E.; Dolan, D.M.; Ciborowski, J.J. Trends in temperature, Secchi depth, and dissolved oxygen depletion rates in the central basin of Lake Erie, 1983–2002. J. Great Lakes Res. 2005, 31, 35–49. [Google Scholar] [CrossRef]
  23. Grimberg, A.; Coleman, C.M.; Burns, T.F.; Himelstein, B.P.; Koch, C.J.; Cohen, P.; El-Deiry, W.S. p53-Dependent and p53-independent induction of insulin-like growth factor binding protein-3 by deoxyribonucleic acid damage and hypoxia. J. Clin. Endocrinol. Metab. 2005, 90, 3568–3574. [Google Scholar] [CrossRef] [PubMed]
  24. Rucinski, D.K.; Beletsky, D.; DePinto, J.V.; Schwab, D.J.; Scavia, D. A simple 1-dimensional, climate based dissolved oxygen model for the central basin of Lake Erie. J. Great Lakes Res. 2010, 36, 465–476. [Google Scholar] [CrossRef]
  25. Bridgeman, T.B.; Penamon, W.A. Lyngbya wollei in western Lake Erie. J. Great Lakes Res. 2010, 36, 167–171. [Google Scholar] [CrossRef]
  26. Smith, D.R.; Francesconi, W.; Livingston, S.J.; Huang, C.-H. Phosphorus losses from monitored fields with conservation practices in the Lake Erie Basin, USA. Ambio 2015, 44, 319–331. [Google Scholar] [CrossRef] [PubMed] [Green Version]
  27. Richards, R.P. Trends in sediment and nutrients in major Lake Erie tributaries, 1975–2004. Lake Erie Lakewide Manag. Plan. 2006, 22. [Google Scholar]
  28. Yuan, H.; Liu, T.; Szarkowski, R.; Rios, C.; Ashe, J.; He, B. Negative covariation between task-related responses in alpha/beta-band activity and BOLD in human sensorimotor cortex: An EEG and FMRI study of motor imagery and movements. Neuroimage 2010, 49, 2596–2606. [Google Scholar] [CrossRef] [PubMed]
  29. Cazelles, B.; Chavez, M.; Berteaux, D.; Ménard, F.; Vik, J.O.; Jenouvrier, S.; Stenseth, N.C. Wavelet analysis of ecological time series. Oecologia 2008, 156, 287–304. [Google Scholar] [CrossRef] [PubMed]
  30. Sharma, S.; Srivastava, P. Teleconnection of Instream Total Organic Carbon Loads with El Niño Southern Oscillation (ENSO), North Atlantic Oscillation (NAO), and Pacific Decadal Oscillation (PDO). Trans. ASABE 2016. [Google Scholar] [CrossRef]
  31. Labat, D. Recent advances in wavelet analyses: Part 1. A review of concepts. J. Hydrol. 2005, 314, 275–288. [Google Scholar] [CrossRef]
  32. Sleziak, P.; Hlavčová, K.; Szolgay, J. Advantages of a time series analysis using wavelet transform as compared with a Fourier analysis. Slovak J. Civ. Eng. 2015, 23, 30–36. [Google Scholar] [CrossRef]
  33. Wright, A.; Walker, J.P.; Robertson, D.E.; Pauwels, V.R.N. A comparison of the discrete cosine and wavelet transforms for hydrologic model input data reduction. Hydrol. Earth Syst. Sci. 2017, 21, 3827–3838. [Google Scholar] [CrossRef] [Green Version]
  34. Torrence, C.; Compo, G.P. A practical guide to wavelet analysis. Bull. Am. Meteorol. Soc. 1998, 79, 61–78. [Google Scholar] [CrossRef]
  35. Lau, K.; Weng, H. Climate signal detection using wavelet transform: How to make a time series sing. Bull. Am. Meteorol. Soc. 1995, 76, 2391–2402. [Google Scholar] [CrossRef]
  36. Bruce, L.M.; Koger, C.H.; Li, J. Dimensionality reduction of hyperspectral data using discrete wavelet transform feature extraction. IEEE Trans. Geosci. Remote Sens. 2002, 40, 2331–2338. [Google Scholar] [CrossRef]
  37. Partal, T. Wavelet transform-based analysis of periodicities and trends of Sakarya basin (Turkey) streamflow data. River Res. Appl. 2010, 26, 695–711. [Google Scholar] [CrossRef]
  38. Daubechies, I. Ten Lectures on Wavelets; SIAM: New Delhi, India, 1992. [Google Scholar]
  39. Percival, D.B. Analysis of Geophysical Time Series Using Discrete Wavelet Transforms: An Overview. In Nonlinear Time Series Analysis in the Geosciences; Springer: Berlin, Germany, 2008; pp. 61–79. [Google Scholar]
  40. Kulkarni, J. Wavelet analysis of the association between the southern oscillation and the Indian summer monsoon. Int. J. Climatol. 2000, 20, 89–104. [Google Scholar] [CrossRef]
  41. Partal, T.; Küçük, M. Long-term trend analysis using discrete wavelet components of annual precipitations measurements in Marmara region (Turkey). Phys. Chem. Earth Parts A/B/C 2006, 31, 1189–1200. [Google Scholar] [CrossRef]
  42. Mallat, S.G. A theory for multiresolution signal decomposition: The wavelet representation. IEEE Trans. Pattern Anal. Mach. Intell. 1989, 11, 674–693. [Google Scholar] [CrossRef]
  43. Runkel, R.L.; Crawford, C.G.; Cohn, T.A. Load Estimator (LOADEST): A FORTRAN Program for Estimating Constituent Loads in Streams and Rivers (No. 4-A5); USGS Publications: Reston, VA, USA, 2004.
  44. Lim, K.J.; Engel, B.A.; Tang, Z.; Choi, J.; Kim, K.S.; Muthukrishnan, S.; Tripathy, D. Automated Web GIS Based Hydrograph Analysis Tool, WHAT 1. JAWRA J. Am. Water Resour. Assoc. 2005, 41, 1407–1416. [Google Scholar] [CrossRef]
  45. Mi, X.; Ren, H.; Ouyang, Z.; Wei, W.; Ma, K. The use of the Mexican Hat and the Morlet wavelets for detection of ecological patterns. Plant Ecol. 2005, 179, 1–19. [Google Scholar] [CrossRef]
  46. Kravchenko, V.O.; Evtushevsky, O.M.; Grytsai, A.V.; Milinevsky, G.P. Decadal variability of winter temperatures in the Antarctic Peninsula region. Antarct. Sci. 2011, 23, 614–622. [Google Scholar] [CrossRef] [Green Version]
  47. De Artigas, M.Z.; Elias, A.G.; de Campra, P.F. Discrete wavelet analysis to assess long-term trends in geomagnetic activity. Phys. Chem. Earth Parts A/B/C 2006, 31, 77–80. [Google Scholar] [CrossRef]
  48. Vonesch, C.; Blu, T.; Unser, M. Generalized Daubechies wavelet families. IEEE Trans. Signal Process. 2007, 55, 4415–4429. [Google Scholar] [CrossRef]
  49. Budu, K. Comparison of wavelet-based ANN and regression models for reservoir inflow forecasting. J. Hydrol. Eng. 2014, 19, 1385–1400. [Google Scholar] [CrossRef]
  50. Chen, Y.; Guan, Y.; Shao, G.; Zhang, D. Investigating trends in streamflow and precipitation in Huangfuchuan Basin with wavelet analysis and the Mann-Kendall Test. Water 2016, 8, 77. [Google Scholar] [CrossRef]
  51. Shoaib, M.; Shamseldin, A.Y.; Melville, B.W. Comparative study of different wavelet based neural network models for rainfall-runoff modeling. J. Hydrol. 2014, 515, 47–58. [Google Scholar] [CrossRef]
  52. Nourani, V.; Alami, M.T.; Aminfar, M.H. A combined neural-wavelet model for prediction of Ligvanchai watershed precipitation. Eng. Appl. Artif. Intell. 2009, 22, 466–472. [Google Scholar] [CrossRef]
  53. Tiwari, M.K.; Chatterjee, C. Development of an accurate and reliable hourly flood forecasting model using wavelet–bootstrap–ANN (WBANN) hybrid approach. J. Hydrol. 2010, 394, 458–470. [Google Scholar] [CrossRef]
  54. Liu, Z.; Zhou, P.; Zhang, Y. A Probabilistic Wavelet–Support Vector Regression Model for Streamflow Forecasting with Rainfall and Climate Information Input. J. Hydrol. 2015, 16, 2209–2229. [Google Scholar] [CrossRef]
  55. Nalley, D.; Adamowski, J.; Khalil, B. Using discrete wavelet transforms to analyze trends in streamflow and precipitation in Quebec and Ontario (1954–2008). J. Hydrol. 2012, 475, 204–228. [Google Scholar] [CrossRef]
  56. Nalley, D.; Adamowski, J.; Khalil, B.; Ozga-Zielinski, B. Trend detection in surface air temperature in Ontario and Quebec, Canada during 1967–2006 using the discrete wavelet transform. Atmos. Res. 2013, 132, 375–398. [Google Scholar] [CrossRef]
  57. Araghi, A.; Baygi, M.M.; Adamowski, J.; Malard, J.; Nalley, D.; Hasheminia, S. Using wavelet transforms to estimate surface temperature trends and dominant periodicities in Iran based on gridded reanalysis data. Atmos. Res. 2015, 155, 52–72. [Google Scholar] [CrossRef]
  58. Charlton, M.; Vincent, J.; Marvin, C.; Ciborowski, J.; Status of Nutrients in the Lake Erie Basin. Prepared by the Lake Erie Nutrient Science Task Group for the Lake Erie Lakewide Managment Plan, Windsor, Ontario. Available online: https://www.epa.gov/sites/production/files/2015-10/documents/status-nutrients-lake-erie-basin-2010-42pp.pdf (accessed on 10 September 2018).
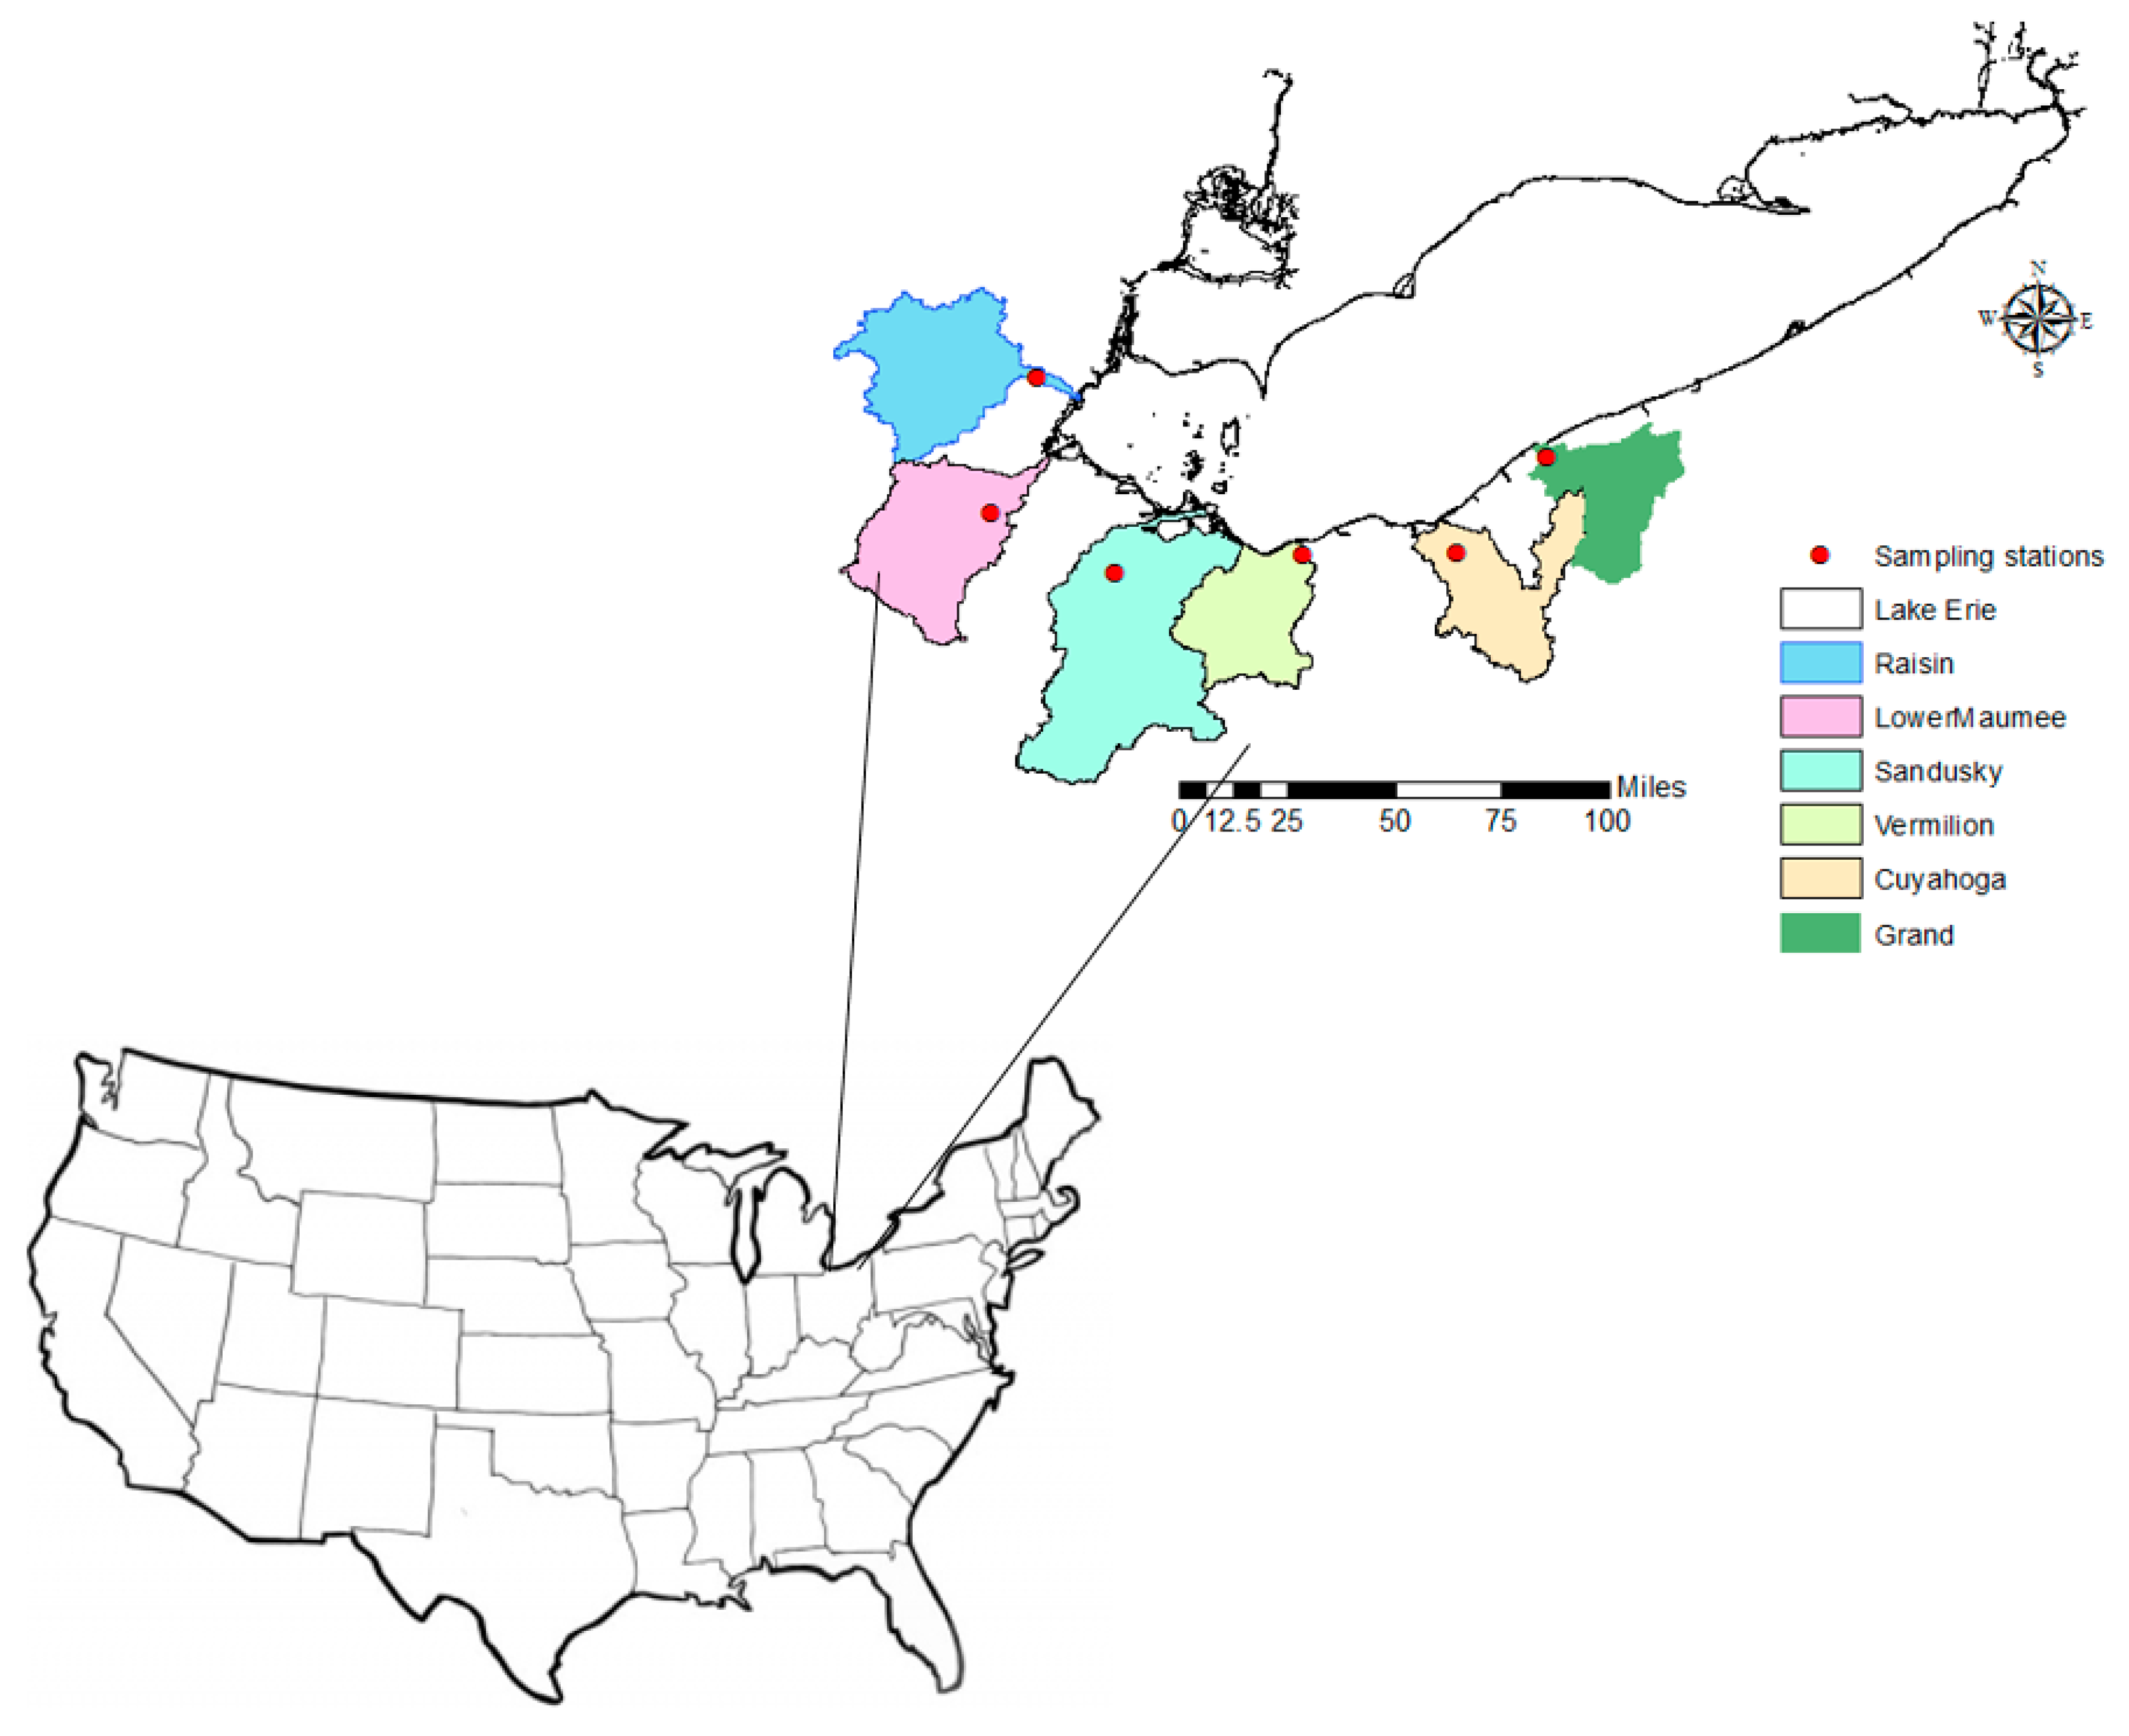
Figure 1. The locations of the sampling stations in Cuyahoga, Grand, Maumee, Vermilion, Raisin, and Sandusky watersheds.
Hydrology 05 00050 g001
Figure 2. Monthly total phosphorus (TP) loading of the six watersheds used in the study.
Hydrology 05 00050 g002aHydrology 05 00050 g002b
Figure 3. Raisin River: (a) Wavelet power spectrum of daily total phosphorus (TP), (b) Plots of the sequential Mann–Kendall analyses on the Details (with added Approximation component) of the annual TP data. The top and bottom dashed lines are ±1.96, which are the confidence limits of the MK test using α = 5%. The solid and dotted lines show the sequential MK values for the original data and the Detail components, respectively. For this TP data, the D1 (2 years) and D3 (8 years) components were the most dominant periodicities for the trend.
Hydrology 05 00050 g003
Figure 4. Raisin River: (a) Wavelet power spectrum of daily soluble reactive phosphorus (SRP), (b) Plots of the sequential Mann–Kendall analyses on the Details (with added Approximation component) of the annual SRP data. The top and bottom dashed lines are ±1.96, which are the confidence limits of the MK test using α = 5%. The solid and dotted lines show the sequential MK values for the original data and the Detail components, respectively. For this SRP data, the D1 (2 years) component was the most dominant periodicity for trend.
Hydrology 05 00050 g004aHydrology 05 00050 g004b
Figure 5. Raisin River: (a) Wavelet power spectrum of daily Streamflow. (b) Plots of the sequential Mann–Kendall analyses on the Details (with added Approximation component) of the annual streamflow data. The top and bottom dashed lines are ±1.96, which are the confidence limits of the MK test using α = 5%. The solid and dotted lines show the sequential MK values for the original data and the Detail components, respectively. For this streamflow data, the D3 (8 years) component was the most dominant periodicity for trend.
Hydrology 05 00050 g005
Figure 6. Maumee River: (a) Continuous wavelet transform of the daily total phosphorus (TP). (b) Plots of the sequential Mann–Kendall analyses on the Details (with added Approximation component) of the annual TP data. The top and bottom dashed lines are ±1.96, which are the confidence limits of the MK test using α = 5%. The solid and dotted lines show the sequential MK values for the original data and the Detail components, respectively. For this TP data, the D1 (2 years), D2 (4 years), and D3 (8 years) components were the most dominant periodicities for the trend.
Hydrology 05 00050 g006
Figure 7. Maumee River: (a) Continuous wavelet transform of the daily soluble reactive phosphorus (SRP). (b) Plots of the sequential Mann–Kendall analyses on the Details (with added Approximation component) of the annual SRP data. The top and bottom dashed lines are ±1.96, which are the confidence limits of the MK test using α = 5%. The solid and dotted lines show the sequential MK values for the original data and the Detail components, respectively. For this SRP data, the D1 (2 years) and D3 (8 years) components were the most dominant periodicities for this trend.
Hydrology 05 00050 g007
Figure 8. Maumee River: (a) Continuous wavelet transform on a daily basis. (b) Plots of the sequential Mann–Kendall analyses on the Details (with added Approximation component) of the annual streamflow data. The top and bottom dashed lines are ±1.96, which are the confidence limits of the MK test using α = 5%. The solid and dotted lines show the sequential MK values for the original data and the Detail components, respectively. For this streamflow data, the D2 (4 years) and D3 (8 years) components were the most effective periodic oscillation.
Hydrology 05 00050 g008
Figure 9. Sandusky River: (a) Wavelet power spectrum of the daily total phosphorus (TP). (b) Plots of the sequential Mann–Kendall analyses on the Details (with added Approximation component) of the annual TP data. The top and bottom dashed lines are ±1.96, which are the confidence limits of the MK test using α = 5%. The solid and dotted lines show the sequential MK values for the original data and the Detail components, respectively. For this TP data, until the early 2000s, the D3 (8 years) components was the most dominant periodicity for this trend.
Hydrology 05 00050 g009
Figure 10. Sandusky River: (a) Continuous wavelet transform of daily soluble reactive phosphorus (SRP). (b) Plots of the sequential Mann–Kendall analyses on the Details (with added Approximation component) of the annual SRP data. The top and bottom dashed lines are ±1.96, which are the confidence limits of the MK test using α = 5%. The solid and dotted lines show the sequential MK values for the original data and the Detail components, respectively. For this SRP data, the D3 (8 years) component was the most dominant periodicity for this trend.
Hydrology 05 00050 g010
Figure 11. Sandusky River: (a) Continuous wavelet transform of the daily streamflow. (b) Plots of the sequential Mann–Kendall analyses on the Details (with added Approximation component) of the annual streamflow data. The top and bottom dashed lines are ±1.96, which are the confidence limits of the MK test using α = 5%. The solid and dotted lines show the sequential MK values for the original data and the Detail components, respectively. For this streamflow data, the D1 (2 years) and D3 (8 years) components were the most dominant periodicity for this trend.
Hydrology 05 00050 g011
Figure 12. Continuous wavelet power spectrum of (a) daily total phosphorus, (b) soluble reactive phosphorus, and (c) streamflow for the Vermilion River.
Hydrology 05 00050 g012
Figure 13. Cuyahoga River: (a) Continuous wavelet spectrum of daily total phosphorus (TP). (b) Plots of the sequential Mann–Kendall analyses on the Details (with added Approximation component) of the annual TP data. The top and bottom dashed lines are ±1.96, which are the confidence limits of the MK test using α = 5%. The solid and dotted lines show the sequential MK values for the original data and the Detail components, respectively. For this TP data, the D1 (2 years) and D2 (4 years) components were the most dominant periodicities for this trend.
Hydrology 05 00050 g013
Figure 14. Cuyahoga River: (a) Continuous wavelet transform of daily soluble reactive phosphorus (SRP). (b) Plots of the sequential Mann–Kendall analyses on the Details (with added Approximation component) of the annual SRP data. The top and bottom dashed lines are ±1.96, which are the confidence limits of the MK test using α = 5%. The solid and dotted lines show the sequential MK values for the original data and the Detail components, respectively. For this SRP data, the D1 (2 years) and D2 (4 years) components were the most dominant periodicities for this trend.
Hydrology 05 00050 g014
Figure 15. Cuyahoga River: (a) Continuous wavelet spectrum of daily streamflow. (b) Plots of the sequential Mann–Kendall analyses on the Details (with added Approximation component) of the annual streamflow data. The top and bottom dashed lines are ±1.96, which are the confidence limits of the MK test using α = 5%. The solid and dotted lines show the sequential MK values for the original data and the Detail components, respectively. For this streamflow data, the D3 (8 years) component was the most dominant periodicity for this trend.
Hydrology 05 00050 g015
Figure 16. Grand River: (a) Continuous wavelet power spectrum of daily total phosphorus (TP). (b) Plots of the sequential Mann–Kendall analyses on the Details (with added Approximation component) of the annual TP data. The top and bottom dashed lines are ±1.96, which are the confidence limits of the MK test using α = 5%. The solid and dotted lines show the sequential MK values for the original data and the Detail components, respectively. For this TP data, the D2 (4 years) component was the most dominant periodicity for this trend.
Hydrology 05 00050 g016
Figure 17. Grand River: (a) Continuous wavelet transform of daily soluble reactive phosphorus (SRP). (b) Plots of the sequential Mann–Kendall analyses on the Details (with added Approximation component) of the annual SRP data. The top and bottom dashed lines are ±1.96, which are the confidence limits of the MK test using α = 5%. The solid and dotted lines show the sequential MK values for the original data and the Detail components, respectively. For this SRP data, the D3 (8 years) component was the most dominant periodicity for this trend.
Hydrology 05 00050 g017
Figure 18. Grand River: (a) Continuous wavelet transform of daily streamflow. (b) Plots of the sequential Mann–Kendall analyses on the Details (with added Approximation component) of the annual streamflow data. The top and bottom dashed lines are ±1.96, which are the confidence limits of the MK test using α = 5%. The solid and dotted lines show the sequential MK values for the original data and the Detail components, respectively. For this streamflow data, the D1 (2 years) and D2 (4 years) components were the most dominant periodicity for this trend.
Hydrology 05 00050 g018
Table 1. Land use classification of the watershed.
NameWatershed Area (km2)Land Use Distribution (%)
Agriculture (Row Crops)Grassland (Pasture)ForestUrban/ResidentialOther
Raisin27645019101110
Maumee16,9957566103
Sandusky3678784981
Vermillion69473-25-2
Cuyahoga209591235386
Grand182625134499
Table 2. The Mann–Kendall values of the original and DWT annual data of the total phosphorus, streamflow, and soluble reactive phosphorus. Each DWT is composed of the D (details) components (D1–D3), the approximation (A3), and a set of combinations of the Ds and their respective A3. The most effective periodic components for trends are indicated in bold.
DataRaisin RiverMaumee RiverSandusky RiverCuyahoga RiverGrand River
Total phosphorus
Original−0.18−0.480.681.05−0.45
D1−0.06−0.220.020.150.61
D2−0.53−0.130.68−1.05−0.23
D3−0.260.731.160.66−0.15
A33.14 *−0.732.03 *−0.79−1.36
D1 + A30.6101.380.34−0.68
D2 + A31.360.061.670.18−1.06
D3 + A30.73−0.451.811.25−2.27 *
Soluble reactive phosphorus
Original2.51 *0.361.98 *0.962.35 *
D10.06−0.5−0.050.280
D2−0.060.040.6−0.660.38
D3−0.53−0.480.390.5−1.36
A34.33 *1.222.54 *−0.965.08 *
D1 + A32.94 *1.041.65−0.023.33 *
D2 + A33.97 *1.883.22 *0.023.11 *
D3 + A34.09 *1.222.13 *1.122.65 *
Streamflow
Original0.411.211.520.570
D10.14−0.27−0.290.050.3
D20.340.270.560.210.22
D3−0.610.220.650.6−1.29
A31.761.841.521.480.23
D1 + A31.171.861.431.310.61
D2 + A32.43 *1.352.13 *2.12 *0.68
D3 + A30.061.571.481.57−2.05 *
* Indicates significant trend values at α = 5.