Abstract
Across the globe, station-based meteorological data are analyzed to estimate the rate of change in precipitation. However, in sparsely populated regions, like Mongolia, stations are few and far between, leaving significant gaps in station-derived precipitation patterns across space and over time. We combined station data with the observations of herders, who live on the land and observe nature and its changes across the landscape. Station-based trends were computed with the Mann–Kendall significance and Theil–Sen rate of change tests. We surveyed herders about their observations of changes in rain and snowfall amounts, rain intensity, and days with snow, using a closed-ended questionnaire and also recorded their qualitative observations. Herder responses were summarized using the Potential for Conflict Index (PCI2), which computes the mean herder responses and their consensus. For one set of stations in the same forest steppe ecosystem, precipitation trends were similar and decreasing, and the herder-based PCI2 consensus score matched differences between stations. For the other station set, trends were less consistent and the PCI2 consensus did not match well, since the stations had different climates and ecologies. Herder and station-based uncertainties were more consistent for the snow variables than the rain variables. The combination of both data sources produced a robust estimate of climate change uncertainty.
1. Introduction
In regions with low population densities, the number and spacing of meteorological stations is often sparse [1,2]. Station timeseries are often discontinuous or inconsistent [3,4], and data may not be representative of conditions in the surrounding area [5]. Even in locations where terrain and climate are considered homogeneous, there can be significant differences in the climate trends observed among relatively closely spaced stations [6,7]. Such factors can complicate the interpretation of station observations, especially when an evaluation of the long-term trends is needed to study climate change [8].
In many areas, Indigenous Knowledge Systems (IKS) are a critical source of information [9,10,11,12,13,14,15,16]. IKS are those held by indigenous peoples that are based in place, time, and embedded relationships with the culture and environment, and are socially transmitted from one generation to the next [14,17,18]. Similar to physical science disciplines or knowledge systems, IKS have unique ways and methods of knowing, validating, and legitimizing themselves [19,20,21]. IKS can provide insight into climatic and hydrologic changes over time [3,8,22,23,24,25,26,27,28], especially in areas where there are limited station data [29,30,31,32,33,34].
The integration of IKS and physical science is multilayered, complex, and nuanced [35], and the communication of climate change can be difficult [36]. In Mongolia, scientists have integrated IKS with their research through conversations and surveys with herders [34,37,38,39,40]. Both culture and language are important considerations when interpreting IKS, since survey data were primarily collected in Mongolian and translated into English. They were then translated back into Mongolia to verify the original translation. General observations from herders have revealed that precipitation is decreasing and water resources are drying up [29,30,33]. Statistical analysis of the limited station data available from the north-central parts of Mongolia complement herder observations [30,33,41]. A gridded coarse resolution of 0.5 degrees latitude and longitude, including temperature and precipitation data showed similar longer 50-year (1963–2012) and shorter 20-year (1993 to 2012) trends [2].
Recent efforts across the nearby Three-River Headwaters Region [42] used the same dataset [43] as Venable et al. [2] to highlight spatial patterns in precipitation trends and some correlations with elevation over a 54-year period (1961–2014). However, while the temporal variation was similar between the spatial dataset and the station data, the spatial dataset [43] underestimated the amount of precipitation by almost half, compared to the station data [42]. In the adjacent region of Yunnan, China, precipitation trends derived from interpolated station data were not well correlated with land cover changes, possibly due to the coarse resolution of the remotely sensed land cover data [44]. The resolution discrepancies identified in refs. [42,44] provide further impetus for the combination of herder and station observations.
We recognize that each knowledge system holds innate value, and we aimed to integrate data from physical science and indigenous knowledge systems to benefit both local stakeholders and scientists. We therefore combined herder observations with station-based data to estimate the variability in precipitation trends across several ecozones in central Mongolia. We applied the Potential for Conflict Index (PCI2) to determine the amount of disagreement or, inversely, the consensus [45,46] among herder observations to define herder-based uncertainties of change, i.e., herder observed precipitation trends. We analyzed station data using standard trend tools, namely, the Mann–Kendall significance test and Theil–Sen slope or rate of change [47]. We used differences in rate of change to define the station-based uncertainty.
The term “uncertainty” has a variety of definitions. For example, climate change uncertainty has been assessed in India [48] and East Asia [49] by comparing the differences among multiple gridded climate datasets. However, since these gridded datasets (used in [48,49]) are all derived, at least in part, through an interpolation of many of the same gauge data using terrain characteristics, the estimated differences [49] are actually a sensitivity analysis rather than an uncertainty assessment [50]. In this paper, two different datasets were used to evaluate uncertainty. We estimated the differences from a station-based analysis over two different areas of central Mongolia. These station-based uncertainties were compared to the uncertainty estimated from IKS data, and we quantitatively tested where such uncertainties agree and where they do not. The objectives of this paper are (1) to illustrate a novel application of PCI2 to present an agreement among herders’ hydroclimatic knowledge and observations, called a consensus; (2) to combine and compare individual station-based precipitation trends to the PCI2 mean and consensus scores from the herders’ observations; and (3) to use the herders’ observations to estimate the uncertainty of the precipitation trends from the station analysis.
2. Study Site
The Khangai region of west-central Mongolia covers about 10% (~150,000 km2) of the country and supports 9% (260,000 people) of the country’s population [51] (Figure 1). This study focused on four soums (counties) in two aimags (provinces) that are divided by the Khangai Mountains: the two Northern soums of Ikh-Tamir [52] and Undur-Ulaan in Arkhangai aimag and the two Southern soums of Jinst [53] and Bayantsagaan in Bayankhongor aimag (Figure 1). Four meteorological stations were used: Erdenemandal and Tsetserleg in the north, and Bayankhongor and Khoriult in the south. The first three stations had a 50-year period of record, while Khoriult’s period of record was 35 years [41]. Meteorological observations were summarized with daily time steps [4,41]. The two Northern stations are in the Forest-Steppe ecozone, while Bayankhongor and Khoriult are in the Steppe and Desert-Steppe ecozones, respectively [54].
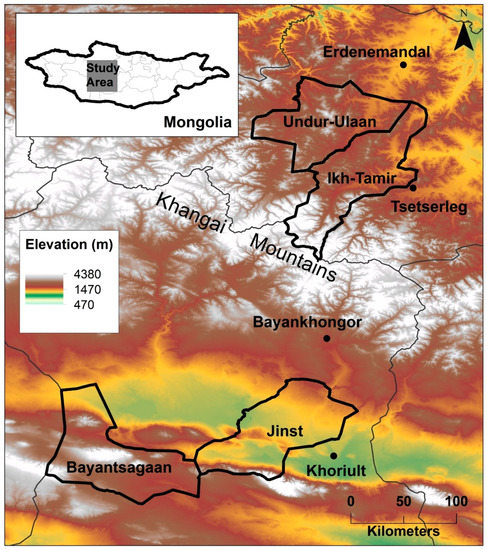
Figure 1.
Location map of central Mongolia for the Northern soums of Ikh-Tamir and Undur-Ulaan in Akhangai aimag, and Southern soums of Jinst and Bayaantsagaan in Bayankhongor aimag. The nearest corresponding meteorological measurement stations are Erdenemandal and Tsetserleg in the north and Bayankhongor and Khoruilt in the south.
3. Methods
3.1. Station Trends
Time series of daily meteorological data were obtained for the four study stations from the Mongolian Institute of Meteorology, Hydrology and the Environment. Precipitation was measured manually using a non-weighing gauge fitted with a Tretyakov shield; measurements were made daily or, in recent years, sub-daily, and summed to daily values. We applied a quality control procedure to check for anomalous and missing data and to remove obvious outlier values [4]. We considered values that fell more than 4.0 standard deviations from the mean to be outliers [43] and were deemed to be of poor quality. The most common errors detected were related to decimal point conversions from commas in the original datasets. A year of data was considered complete when fewer than 15 days of record were missing or of poor quality. No further discrimination was needed since periods of missing data were usually continuous and a month or more in length. The entire period of record up to 50 years was used for each station (Figure 2a–d). The same quality control procedure was used for the daily temperature data, except that an outlier was considered to be 3.0 standard deviations from the mean.
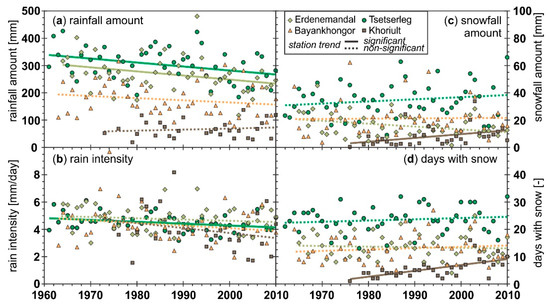
Figure 2.
Time series and trends for water year (1 October to 30 September) (a) rainfall amounts; (b) rainfall intensity; (c) snowfall amounts; and (d) days with snow at the four study stations from 1961 to 2010.
Snow generally begins to fall in October each year, so annual summaries were computed for each year using the period from 1 October through 30 September, also called the water year. For each day, precipitation was identified as snowfall or rainfall using a daily average threshold air temperature of 4 degrees Celsius. This method was applied from that developed for a long-term analysis of meteorological data from Walden, Colorado [55]. Walden is a cold, semi-arid rangeland with a similar climate to the Mongolian study area. The annual precipitation data were divided into rainfall and snowfall amounts, and the number of days of each precipitation phase was totaled per year. Rain intensity was computed as the rainfall per day, as sub-daily data were not available for the period of record [34]. No adjustments were made to amend the possible low biases in measuring snowfall due to gauge undercatch and associated errors [56], as it was assumed that wind conditions did not change over the study period [57].
Station trends were analyzed using the Mann–Kendall significance test [58,59] and the Theil–Sen rate of change [60,61]. These are non-parametric statistical analyses that are not biased by outliers or missing data [47]. A significance level of p < 0.05 was used, though all rates of change were computed, since it is important to analyze slope and direction (increase vs. decrease), regardless of significance.
3.2. Herder Observations
We administered a closed-ended, Likert-type questionnaire [62] about observations of precipitation change to 20 individual households in Ikh-Tamir and 17 in Jinst, followed by an additional open-ended discussion. Households were randomly selected in each study location. Respondents’ ages ranged from 30 to 78 years old, and each had at least 15 years of herding experience. The period of focus for hydro-climate changes was for herders to compare recent conditions to the period when they were in their 20s. The survey focused on herder observations of hydro-climatic change [33]; the results presented herein are from questions related specifically to changes in precipitation.
The herder responses to the surveys were given on a five-point scale (large decrease (a), decrease (b), no change (c), increase (d), large increase (e)) for each question and recoded to a scale of −2 (large decrease) to +2 (large increase) (Figure 3). The precipitation questions and their possible responses are given in Table 1. We audio-recorded the open-ended discussion during survey administration to assess additional observations of change by herders [33]. These interviews were audio-recorded in Mongolian, and then translated and transcribed into English by Sukh [33].
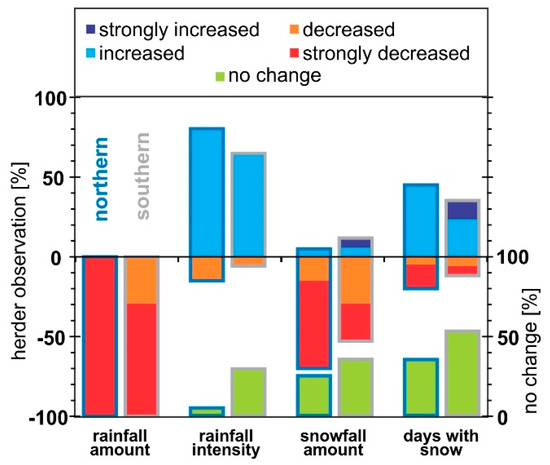
Figure 3.
Summary of the herder observations with Northern and Southern soums responses in the blue and grey boxes, respectively. Note that no change is illustrated on the right y-axis.

Table 1.
The setup of the four survey questions administered to the herders used in this paper, relating to (i) rainfall amount, (ii) rainfall intensity, (iii) snowfall amount, and (iv) snowfall frequency. The responses (a) through (e) were recoded to a scale of −2 to +2.
The narratives of the survey were analyzed using thematic analysis [63,64]. Thematic analyses involve searching for common themes emerging from the qualitative data, i.e., the herders’ narratives. This process involves reflexive iteration of the data, where complex patterns and themes become the categories for analyses. Narratives were read and reread to ensure that themes were grounded in the original data. The data were used to supplement the closed-ended questions (Table 1).
3.3. Uncertainty from Herder Data
We applied the PCI2 to analyze herders’ observations of precipitation change and the consensus herders had for their observations. The original PCI was developed to understand and relate human dimension findings with natural resource management concerns, including conflict among natural resource users [45,65]. The second generation of this statistic (PCI2) ranges from 0 to 1. PCI2 results are displayed as bubble graphs showing the amount of consensus, or agreement, for a given management scenario [66]. The center of the bubble represents the mean rating, i.e., central tendency, as plotted on the y-axis (Figure 4). Consensus is displayed by bubble size, indicating the extent of potential conflict, or inverse, consensus, regarding the acceptability of a particular subject, i.e., degree of dispersion (Figure 4). A PCI2 of 1 corresponds to a scenario with no consensus and the greatest potential for conflict [46]. This occurs when survey responses are equally divided between two extreme values on a response scale (Figure 3). A PCI2 of 0 illustrates all answers on one side of the response scale, suggesting complete consensus [41]. Readers are referred to Appendix A for the computation of the PCI2 index, and ref. [46] for specific details on its computation.
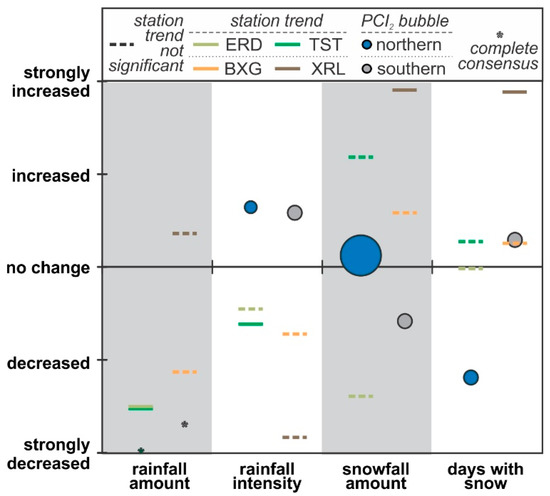
Figure 4.
Change in precipitation amounts (rainfall, snowfall), rainfall intensity, and occurrence (days with snow) from station data with significant trends shown as solid lines and herder observations given as the Potential for Conflict Index (PCI2). Non-significant trends are presented as dashed lines. The center of the PCI2 bubble displays the mean herder observation on the y-axis, while the PCI2 bubble size is the amount of consensus or disagreement (i.e., larger bubble = more disagreement and smaller bubble = less disagreement). The station trends were scaled based on the maximum rates of change and are presented using three-digit codes: ERD is Erdenemandal and TST is Tsetserleg, both representing the Northern soums; BXG is Bayankhongor and XRL is Khoriult, both representing the Southern soums.
3.4. Data Integration and Comparison
Trends were scaled per variable to the mean PCI2 range (−2 to +2) for the four stations using the maximum station rate of change rounded to the next largest whole number (Figure 4). For example, the largest significant trend in rainfall amount was a decrease of 1.5 mm per year and a scaling factor of 2 mm per year was used. Station trends were added to the PCI2 plot with an indication of significance per station variable (Figure 4). This integrated plot enabled a comparison of station and herder observations of change. Due to the sparsity of station data in central Mongolia, the absolute difference in the scaled station trends was compared to the PCI2 consensus (Figure 5). Where a general agreement existed between the two datasets, the PCI2 consensus values were divided by the station trend scaling factor to provide an estimate of the uncertainty of the station trends (Table 2).
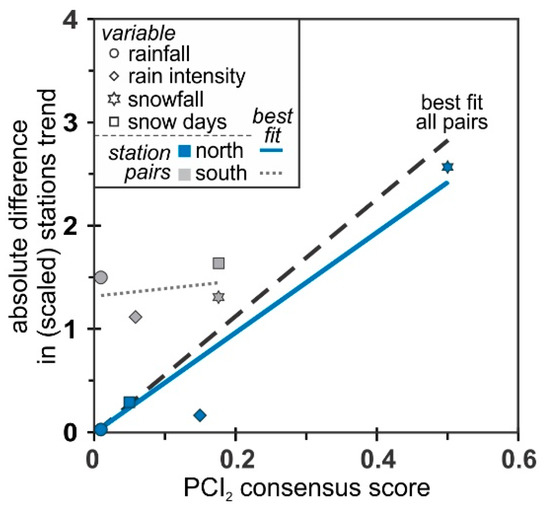
Figure 5.
Comparison of the absolute differences between stations within an aimag versus the herder PCI2 consensus score. The linear best fit for the Northern (solid blue) and all station pairs (dashed black) was fit through the origin, but the Southern (dotted grey) line was not.
Table 2.
Estimates of precipitation uncertainty for the four variables, summarizing the individual station rates of change, station mean, and difference per aimag (north and south), and herder-based uncertainty from the PCI2 consensus scores (Figure 4), scaled to the range of precipitation values. Significant station trends at the p < 0.05 level are denoted with an asterisk.
4. Results
Precipitation trends derived from station data varied for the period from 1961 to 2010 (Figure 2a–d). There was a significant decrease in rainfall at the two Northern stations (Figure 2a) and a decrease at Bayankhongor that was not significant, while Khoriult saw a non-significant increase in rainfall (Figure 2a). All stations saw a decrease in the average rain intensity, but it was only significant at Erdenemandal in the north (Figure 2b). The amount of snowfall (Figure 2c) and days with snow (Figure 2c) increased at three stations, but at Erdenemandal, they both decreased. In the south, Khoriult saw a significant increase in the snowfall amount and number of days with snow (Figure 2c,d).
All herders stated that they observed a decrease in rainfall, with all herders in the north and most herders in the south observing strong decreases (Figure 3). Most herders observed an increase in rainfall intensity with a few seeing a decrease, while others—5% in the north and 27% in the south—observed no change in rain intensity. Herder observations of snow were mixed, with more than 50% in both regions stating that they saw a decrease, but some saw an increase, while a number saw no change. Some saw fewer days with snow while a larger percentage saw more snow days—35% and 53%, in the north and south, respectively, saw no change (Figure 3).
There is complete consensus among the herders for the observation of rainfall (PCI2 = 0), but less consensus for the remaining variables, with the least consensus, or the largest PCI2 bubbles, for the snowfall amount (Figure 4). For rainfall in the south, one station (Bayankhongor or BXG in Figure 4) was similar to the herders’ observations, but the other Southern station was not (Khoriult) (Figure 4). Rainfall intensities showed opposite trends between herder and station observations with herders observing an increase, while the stations all showed a decrease. For snowfall, results in the north were divergent, with one station increasing and the other decreasing and herders mostly agreeing that there has been no change (Figure 3). In the south, herder observations involved a decrease in snowfall and were opposite to the station-based results of an increasing amount (Figure 4). Northern herders’ observations were opposite to station observations for rain days compared to snow days (Figure 4).
The trends at individual stations only matched the mean herder score for 1 of the 16 station variables, specifically, days with snow at Bayankhongor (Figure 4). Since the station pairs were more than 100 km apart, the differences between station trends were compared to the PCI2 consensus scores (Figure 5). These compared well (dashed black line in Figure 5), with the exception of the amount of rainfall in the south and the rain intensity at both locations. As shown in Figure 4, Khoriult station has an increasing trend in rainfall amount, while all herders observed a decrease; the other southern station, Bayankhongor, saw a decrease (Figure 5 and Table 2). Removal of this point from the analysis did not change the slope but provided a better fit between the herder and station observations. The correlation between the herder consensus and difference in station trends was poor for all variables (Figure 5), but it was moderate for rain intensity, amount of snowfall, and frequency at the Southern stations (Table 2). The correlation was better for the Northern stations (Figure 5 and Table 2).
5. Discussion
5.1. Station–Herder Observation Correlation
In the north, there were better correlations between the variables where there was the greatest uncertainty in the station data and greatest lack of consensus in the herder observations (Figure 5, Table 2). In the south, there was less variation in uncertainty among variables for stations, but the herder consensus did vary, and thus, the slope of the comparison between station and herder observations approached zero (Figure 5). It is possible that this north versus south difference exists since the north stations and herder soums are in the same ecozone, while the two south stations and herder soums are in different ecozones (Figure 1). The Northern stations have similar climates in terms of rainfall (Figure 2a), snowfall (Figure 2c), and temperature [30,39], while in the south, Khoriult is much drier (Figure 2a,c) and warmer than Bayankhongor.
In both areas, the station- and herder-based uncertainties were more similar for snow than rain (Table 2). Since the winters in Mongolia are cold, snow accumulates throughout the winter with mid-season melt rarely occurring. Therefore, snowpack is present throughout the winter and is more obvious to herders than cumulative rainfall. The presence of large amounts of snow or related winter disaster events (dzud) directly affects herders [67] and is another indicator of snow accumulation depending on the dzud type.
Other research has found a slight increasing trend in the number of days with precipitation in Northern Mongolia and the mountain regions [68,69], and our results showed more days with snow (Figure 2d). Trends in days with rain were not computed as this question was not asked of the herders. It is possible that some of the results may have yielded different responses if the questions had been designed with the PCI2 [45,46] as the preferred method of analysis, and multiple questions could have been used to triangulate results.
5.2. Herder Insight
Discussions with herders provided insight that added information regarding changes to the Mongolian climate. Herders from both soums commented on their concerns about changes in the amount of precipitation, patterns, timing, and magnitude over the past decades [29,33,34]. Most herders noted a significant decline in rainfall (Figure 3), matching a decrease observed at both north stations and at Bayankhongor in the south (Figure 2a). Herders stated that previously, they had received a “longer and softer rainfall” (also reported by ref. [34]). In the north, they stated that in recent years, the duration of rainfall has become shorter and lasts only a few hours with high intensity and low infiltration into the soil. The herders reported that “20 years ago, we had a long duration of rain which lasted 3 or 4 days and we did not have any dry clothes (deel traditional clothing) to wear and hardly found dry trees to make fire for cooking at that time.” One herder in Jinst said, “… in the summer of 2009, rainfall occurred only in May and less rain than previous which caused prolonged drought during the summer and animal did not gain enough weight.” Many of the herders said, “generally, summers were very dry here [with] hardly any rain in recent years”.
Marin [36] noted that the herders identified both hard and soft rain. In our analysis, 80% of Northern and 65% of Southern herders observed more intense rain (Figure 3) which was observed with low infiltration. For example, Ikh-Tamir herders stated, “… in the past few years, short and intense rainfall has occurred which produced high runoff and did not saturate the soil moisture. Previously, rainfall duration was longer with soft rain and it’s enough to saturate soil moisture and affect good quality grass growing.”
Herders’ conversations always consisted of detailed information [33] connected to weather elements, including changes in precipitation, extreme events, and water resources that were noted in their migration areas [29,34,67]. Changing and variable precipitation patterns, intensity, and rising temperatures are key factors of increased climate unpredictability and extreme events [70]. This potentially affects drought and dzud occurrence in Mongolia which directly impacts herders’ livelihoods [71].
Herders must also consider inter-annual variability in climate, as it influences their planning and management practices as a part of living in this type of environment [33]. This variability includes the occurrence of extreme events [38] which require real-time mitigation efforts [67]. Herders must also adapt to change over time [39,40]. While only five of the 16 precipitation trends were significant (Figure 2a–d), we focused on the change over time in terms of trends as it is integrated with IKS.
5.3. Linking Datasets
This paper explored the linkage of IKS and station observations of changes in precipitation in an area where data are sparse (Figure 1). The Mann–Kendall significance test [58,59] and Theil–Sen rate of change [60,61] have been used extensively to investigate climate change [6,7,42,44], including for studies across Mongolia [2,4,30,33,40,41]. The PCI2 method [46] has not had extensive application to date [45,65] with limited use of IKS [66]. This paper is the first combination of the Theil–Sen slope method for analyzing station observation change with consensus from IKS estimated by PCI2. While the data used in this analysis were limited (Figure 1) and only four variables were examined (Figure 2), combining these disparate datasets shows promise (Figure 5) and can be applied to larger datasets [40].
In data-sparse regions, like Mongolia, examining individual and group knowledge is crucial for understanding why certain actions among pastoralists create different exposures and sensitivities to harm [67]. From a climate perspective, everything changes [72], and thus herders’ actions are driven by their observations of climate and its changes. They must contend with what precipitation falls, since it sustains the growth of pasture plants on which their livestock and livelihoods depend. This reliance on natural processes leads them to observe and record quantitative and qualitative characteristics of a large number of climate variables [38]. Nomadic pastoralists’ experience and knowledge of weather and climate can influence their management strategies to reduce vulnerability to extremes and, in a broader sense, to adverse climate changes [73], but their observations may be incongruent with instrumentation records. This disparity may result in decisions that are not well-suited for the actual observed conditions being made. This paper tried to evaluate the synergy between the herder and measurement station observations with a view towards identifying the consensus and uncertainty of the two systems.
IKS’ have an empirical basis and are used to understand and predict climate variables and environmental events that shape the livelihoods or even determine the survival of individuals [10]. IKS’ have other additional benefits and applications: to improve scientific research, to improve resource management and allocation, and to provide better information on ecohydroclimatic processes [20,74,75]. Studies [38,76] have shown remarkable correlations between these observations and instrumental records [77], while some showed a stronger correlation for one variable over others. Hou et al. [32], for example, showed a strong correlation for temperature but not precipitation from herders in Inner Mongolia (China).
Indigenous Knowledge Systems can be used to support climate change monitoring [3,8,24,25,28,78] and provide valuable sources of information regarding natural resources and environmental change [14,23,38,79,80,81]. Studies have compared IKS and physical science to show how the involvement of local people and their understanding and observations can contribute to improved climate change analysis [22,82]. We highlight that IKS can be more than just complementary to station-based analyses [8,46]. The uncertainty estimated from IKS and meteorological observations (Figure 5 and Table 2) can be more robust than using either method alone [50].
5.4. Data Considerations
The station trends computed herein represent a point in space, but even in homogeneous terrains, station trends may not be spatially consistent [6,7]. This work also used a perspective on herder observations (indigenous knowledge) through a range of time periods to evaluate change. For the pairs of stations shown, the Northern stations were more similar than the Southern stations (Figure 2 and Table 2). This is due, in part, to a difference in the length of record which can affect trends [39]. All station records started in the early 1960s, except that of Khoriult which started in the early 1970s (Figure 2). The age of the herders varied from 30 to 78; in the north, the mean age was 53 (median of 48), while in the south, it was 47 (median of 46). Thus, herders considered climate change over several decades. However, the trends observed here (Figure 2) were similar over shorter time periods (also seen by [2,39]). Future investigations should be more specific with the length of record that the herders are asked to consider [39,40].
Spatial analyses created from interpolating station data [48,49] provide coarse scale climate trends [2,42], but in areas such as Mongolia, there are few meteorological stations [4]. Historically, areas with sparse populations have greater distances between stations [1,43] due to the lack of people and funding needed to perform the manual observations. Only within the past few decades have automated stations become standard; however, in Mongolia, meteorological data are still primarily collected manually. With few stations at higher elevations, and with more variable terrain, there is less consistency among spatial datasets [49], resulting in less robust analyses and a disconnect between point measurements from meteorological stations and global spatial datasets, even when the latter are at a resolution of 8 km [44].
Various global spatial datasets, e.g., ref. [43], have a monthly time scale [48] that cannot be used to estimate details such as changes in the precipitation phase [55], providing an impetus for making spatial estimates of uncertainty in climate trends using herder observations (Figure 5 and Table 2). Thus, in a data sparse region like Mongolia, herder observations can help in the assessment of climate change at a finer resolution (Figure 5 and Table 2). To complement this, observational data are not only becoming more available at finer spatial resolutions, they are also becoming more available at finer temporal resolutions. For example, sub-daily resolution rainfall data collected over recent years have been successfully correlated to long station daily station data to evaluate herders’ observations of changes in rainfall intensity in Northern Mongolia [34].
An issue with precipitation trend analyses is the difficulty with estimating the snowfall amount. In particular, the undercatch of solid precipitation due to wind effects on the gauge produces a low bias. Zhang et al. [56] provided a method for correcting daily precipitation values due to biases, including undercatch, but it requires wind speed data. Unfortunately, such data are only available for the last 10 to 15 years of records [2]. Bias from snow undercatch may be reduced as most of the precipitation in Mongolia occurs seasonally as rainfall rather than snowfall (Figure 2a,c). Further, in some climates, the amount of snow that is not caught by a precipitation gauge due to wind is often comparable to losses due to sublimation and redistribution [83]. Herder observations of snowfall quantities are most likely based on snow amounts on the ground; thus, the balance between snowfall gauge undercatch and snowpack losses may provide a better comparison to IKS than bias-corrected station data [56], even when there is a temporal disconnect in the time step of meteorological data [84]. This same method was used by Fassnacht et al. [7].
Finally, there may be a variety in herders’ interpretation of meteorological conditions and sharing information, so this should be considered when writing survey questions [11,13,21,25,66,84]. The different “ways of knowing” can also inform how station data are analyzed [46]. These considerations could result in improved surveys that elicit herders’ observations and more directly integrate physical science and indigenous knowledge systems, especially considering the use of the PCI2 method in the analysis. Survey findings could then prove to be more useful for local stakeholders and scientists, such as helping inform when best to move a herd or tracking climate change and its impacts.
6. Conclusions
We applied the Potential for Conflict Index 2 (PCI2) tool to analyze herder observations of climate change, specifically changes in precipitation, from an area in central Mongolia. This is the first such application of the PCI2 that not only illustrates mean herder observations and their consensus but combines results with station-based precipitation trends. Station-based precipitation trends showed some similarity with herders’ observations. Herders’ observations based on the PCI2 consensus were used to estimate the uncertainty of precipitation trends from station analyses, with better matches for the two snow variables than the rain variables. The two Northern stations that were in the same ecozone were a better match to the herder data than the pair of Southern stations that were in different ecozones. In this work, two datasets from different sources were combined to produce a robust estimate of uncertainty to overcome the spatial disparity of the stations used to estimate the precipitation trends. This integration of Indigenous Knowledge Systems and meteorological observations could produce useful information for Mongolian herders for land management strategies and when planning for adaptations to climate change.
Author Contributions
Conceptualization, S.R.F., A.M.A., N.B.H.V., S.T. and M.E.F.-G.; Methodology, S.R.F., A.M.A., S.T., N.B.H.V., M.E.F.-G., M.J.L. and B.B.; Data Collection, S.T. and B.B.; Data Curation, M.J.L.; Translation by S.T.; Translation review by B.B.; Writing-Original Draft Preparation, S.R.F., A.M.A., N.B.H.V. and S.T.; Writing-Review & Editing, S.R.F., A.M.A., N.B.H.V., M.E.F.-G., A.K.D.P., M.K., M.J.L., S.T. and B.B.; Visualization, S.R.F. and N.B.H.V.; Supervision, S.R.F.; Project Administration, M.E.F.-G.; Funding Acquisition, M.E.F.-G., S.R.F., M.J.L. and B.B.
Funding
This research was funded by the National Science Foundation Dynamics of Coupled Natural and Human Systems (CNH) Program (entitled Does Community-Based Rangeland Ecosystem Management Increase Coupled Systems’ Resilience to Climate Change in Mongolia?) award number BCS-1011801. The herder data were collected through contributions from the Center for Collaborative Conservation at Colorado State University, and the World Bank award number 7155627 (entitled Understanding Resilience in Mongolian Pastoral Social-Ecological Systems: Adapting to Disaster Before, During and After the 2010 Dzud).
Acknowledgments
We thank the herder groups in the soums of Ikh-Tamir and Undur-Ulaan in the Akhangai aimag and in the soums of Jinst and Bayaantsagaan in Bayankhongor aimag for their participation in the survey. Their responses were crucial for this research and their discussions provided further invaluable insight into climate change in the region. We thank the Mongolian Institute of Meteorology, Hydrology and the Environment for providing the meteorological data used in this analysis. We also thank Jerry Vaske of Colorado State University for making the PCI2 code available at: https://sites.warnercnr.colostate.edu/jerryv/.
Conflicts of Interest
The authors declare no conflict of interest. The funders had no role in the design of the study; in the collection, analyses, or interpretation of data; in the writing of the manuscript, and in the decision to publish the results.
Appendix A. Computation of the Potential for Conflict Index 2 (PCI2)
Vaske et al. [46] provides the full details of the PCI2 formulation. This appendix summarizes its key computations.
Herder observations (e.g., Figure 3) were all recoded to scores of −2 to +2 (Table 1). The PCI2 considers responses in the same direction but with different magnitudes not to be in conflict. We assumed that there was no conflict with the neutral response (Equation (A2) in [41]). For example, the following were not considered to be in conflict, i.e., in consensus: in the Southern soums 6% of herders said snowfall amounts strongly increased (+2) and another 6% said that snowfall amounts increased (+1), while 35% said they saw no change (0) (Figure 3). Therefore, the distance between two responses (dx,y) for two responses (rx and ry) were only computed between any negative response and any positive response as
where the sign is the sign for a positive or negative number (+ or −) for the response (r). For a scale with i values (we used 5), the PCI2 index was computed as
where nk is the number of respondents at each scale value, nh is the number of respondents at other scale values, dk,h is the distance between respondents, dmax is the maximum distance between extreme values, nt is the number of respondents, and Z is 0 when nt is an even number, and Z is 1 when nt is an odd number.
dx,y = (|(rx) − sign(ry)| − 1) if sign(rx) ≠ sign(ry)
otherwise dx,y = 0
otherwise dx,y = 0
References
- Shiklomanov, A.I.; Lammers, R.B.; Vörösmarty, C.J. Widespread decline in hydrological monitoring threatens Pan-Arctic Research. EOS Trans. Am. Geophys. 2002, 83, 13–17. [Google Scholar] [CrossRef]
- Venable, N.B.H.; Fassnacht, S.R.; Hendricks, A.D. Spatial changes in climate across Mongolia. In Proceedings of the Trans-Disciplinary Research Conference: Building Resilience of Mongolian Rangelands, Ulaanbaatar, Mongolia, 9–10 June 2015; Fernández-Giménez, M.E., Batkhishig, B., Fassnacht, S.R., Wilson, D., Eds.; Nutag Action and Research Institute: Ulaanbaatar, Mongolia, 2015; pp. 73–79. [Google Scholar]
- Klein, J.A.; Hopping, K.A.; Yeh, E.T.; Nyima, Y.; Boone, R.B.; Galvin, K.A. Unexpected climate impacts on the Tibetan Plateau: Local and scientific findings of delayed summer. Glob. Environ. Chang. 2014, 28, 141–152. [Google Scholar] [CrossRef]
- Venable, N.B.H. Trends and Tree-Rings: An Investigation of the Historical and Paleo Proxy Hydroclimate Record of the Khangai Mountain Region of Mongolia. Ph.D. Thesis, Colorado State University, Fort Collins, CO, USA, 2016; 419p. [Google Scholar]
- Meromy, L.; Molotch, N.P.; Link, T.E.; Fassnacht, S.R.; Rice, R. Subgrid variability of snow water equivalent at operational snow stations in the western United States. Hydrol. Process. 2013, 27, 2383–2400. [Google Scholar] [CrossRef]
- Pielke Sr, R.A.; Stohlgren, T.; Schell, L.; Parton, W.; Doesken, N.; Redmond, K.; Moeny, J.; McKee, T.; Kittel, T.G.F. Problems in evaluating regional and local trends in temperature: An example from eastern Colorado, USA. Int. J. Climatol. 2002, 22, 421–434. [Google Scholar] [CrossRef]
- Fassnacht, S.R.; Cherry, M.L.; Venable, N.B.H.; Saavedra, F. Snow and albedo climate change impacts across the United States Northern Great Plains. Cryosphere 2016, 10, 329–339. [Google Scholar] [CrossRef]
- Alexander, C.; Bynum, N.; Johnson, E.; King, U.; Mustonen, T.; Neofotis, P.; Oettlé, N.; Rosenzweig, C.; Sakakibara, C.; Shadrin, V.; et al. Linking indigenous and scientific knowledge of climate change. Bioscience 2011, 61, 477–484. [Google Scholar] [CrossRef]
- Fernández-Giménez, M.E. The role of ecological perception in indigenous resource management: A case study from the Mongolian forest-steppe. JSTOR 1993, 33, 31–46. [Google Scholar]
- Huntington, H. Using Traditional Ecological Knowledge in science methods and applications. Ecol. Appl. 2000, 10, 1270–1274. [Google Scholar] [CrossRef]
- Ajibade, L.T. In search for methodology for the collection and evaluation of farmers’ indigenous environmental knowledge in developing countries. Indilinga Afr. J. Indig. Knowl. Syst. 2003, 2, 99–113. [Google Scholar]
- Flanagan, C.; Laituri, M. Local cultural knowledge and water resource management in the Wind Rivers Indian Reservation. Environ. Manag. 2004, 33, 262–270. [Google Scholar] [CrossRef] [PubMed]
- Barnhardt, R.; Kawagley, A.O. Indigenous knowledge systems and Alaska Native ways of knowing. Anthropol. Educ. Q. 2005, 36, 8–23. [Google Scholar] [CrossRef]
- Berkes, F. Sacred Ecology, 3rd ed.; Routledge: New York, NY, USA; London, UK, 2012; 392p. [Google Scholar]
- Jiri, O.; Mafongoya, P.L.; Chivenge, P. Indigenous knowledge systems, seasonal ‘quality’ and climate change adaptation in Zimbabwe. Clim. Res. 2015, 66, 103–111. [Google Scholar] [CrossRef]
- Soropa, G.; Gwatibaya, S.; Musiyiwa, K.; Rusere, F.; Mavima, G.A.; Kasasa, P. Indigenous knowledge systems weather forecasts as a climate change adaptation strategy in small farming systems of Zimbabwe: Case study of Murehwa, Tsholotsho and Chiredzi districts. Afr. J. Agric. Res. 2015, 10, 1067–1075. [Google Scholar] [CrossRef]
- Laituri, M.; Harvey, L.E. Bridging the space between indigenous ecological knowledge and New Zealand conservation management using GIS. In Nature Conservation: The Role of Networks; Craig, J., Ed.; Surrey Beatty and Sons: Chipping Norton, Australia, 1995. [Google Scholar]
- Bohensky, E.L.; Maru, Y. Indigenous Knowledge, Science, and Resilience: What Have We Learned from a Decade of International Literature on Integration? Ecol. Soc. 2011, 16. [Google Scholar] [CrossRef]
- Laituri, M. Ensuring access to GIS for marginal populations. In Community Participation and Geographic Information Systems; Craig, W.J., Howard, T.M., Weiner, D., Eds.; Taylor & Francis: London, UK, 2002; pp. 270–282. [Google Scholar]
- Laituri, M. GIS and Indigenous Knowledge. In The SAGE Handbook of GIS and Society; Nyerges, T., Coucleis, H., McMaster, R., Eds.; Sage Publications, Ltd.: Thousand Oaks, CA, USA, 2011; Chapter 11. [Google Scholar]
- Tengö, M.; Brondizio, E.S.; Elmqvist, T.; Malmer, P.; Spierenburg, M. Connecting Diverse Knowledge Systems for Enhanced Ecosystem Governance: The Multiple Evidence Base Approach. Ambio 2014, 43, 579–591. [Google Scholar] [CrossRef] [PubMed]
- Huntington, H.; Callaghan, T.; Fox, S.; Krupnik, I. Matching traditional and scientific observations to detect environmental change: A discussion on Arctic terrestrial ecosystem. Ambio 2004, 13, 18–23. [Google Scholar]
- Gearheard, S.; Pocernich, M.; Stewart, R.; Sanguya, J.; Huntington, H. Linking Inuit knowledge and meteorological station observations to understand changing wind patterns at Clyde River, Nunavut. Clim. Chang. 2010, 100, 267–294. [Google Scholar] [CrossRef]
- Crate, S.A. Climate change and ice dependent communities: Perspectives from Siberia and Labrador. Polar J. 2012, 2, 61–75. [Google Scholar] [CrossRef]
- Crona, B.; Wutich, A.; Brewis, A.; Gartin, M. Perceptions of climate change: Linking local and global perceptions through a cultural knowledge approach. Clim. Chang. 2013, 119, 519–531. [Google Scholar] [CrossRef]
- Simelton, E.; Quinn, C.H.; Batisani, N.; Dougill, A.J.; Dyer, J.C.; Fraser, E.D.G.; Mkwambisi, D.; Sallu, S.; Stringer, L.C. Is rainfall really changing? Farmers’ perceptions, meteorological data, and policy implications. Clim. Dev. 2013, 5, 123–138. [Google Scholar] [CrossRef]
- Wheeler, S.; Zuo, A.; Bjornlund, H. Farmers’ climate change beliefs and adaptation strategies for a water scarce future in Australia. Glob. Environ. Chang. 2013, 23, 537–547. [Google Scholar] [CrossRef]
- Ayanlade, A.; Radeny, M.; Morton, J.F. Comparing smallholder farmers’ perception of climate change with meteorological data: A case study from southwestern Nigeria. Weather Clim. Extrem. 2017, 15, 24–33. [Google Scholar] [CrossRef]
- Sternberg, T. Environmental challenges in Mongolia’s dryland pastoral landscape. J. Arid Environ. 2008, 72, 1294–1304. [Google Scholar] [CrossRef]
- Fassnacht, S.R.; Sukh, T.; Fernández-Giménez, M.; Batbuyan, B.; Venable, N.B.H.; Laituri, M.; Adyabadam, G. Local understanding of hydro-climatic changes in Mongolia. In Cold Region Hydrology in a Changing Climate (Proceedings of Symposium H02 Held during IUGG2011 in Melbourne, Australia, July 2011); IAHS: Wallingford, UK, 2011; Volume 346, pp. 120–129. [Google Scholar]
- Fosu-Mensah, B.Y.; Vlek, P.L.; MacCarthy, D. Farmers’ perception and adaptation to climate change: A case study of Sekyedumase district in Ghana. Environ. Dev. Sustain. 2012, 14, 495–505. [Google Scholar] [CrossRef]
- Hou, X.Y.; Han, Y.; Li, F.Y. The perception and adaptation of herdsmen to climate change and climate variability in the desert steppe region of northern China. Rangel. J. 2012, 34, 349–357. [Google Scholar] [CrossRef]
- Sukh, T. Local Understanding of Hydro-Climate Changes in Mongolia. Master’s Thesis, Colorado State University, Fort Collins, CO, USA, 2012. [Google Scholar]
- Goulden, C.E.; Mead, J.; Horwitz, R.; Goulden, M.; Nandintsetseg, B.; McCormick, S.; Boldgiv, B.; Petraitis, P.S. Interviews of Mongolian herders and high resolution precipitation data reveal an increase in short heavy rains and thunderstorm activity in semi-arid Mongolia. Clim. Chang. 2016, 136, 281–295. [Google Scholar] [CrossRef]
- La Frenierre, J.; Mark, B.G. Detecting Patterns of Climate Change at Volcán Chimborazo, Ecuador, by Integrating Instrumental Data, Public Observations, and Glacier Change Analysis. Ann. Am. Assoc. Geogr. 2017, 107, 979–997. [Google Scholar] [CrossRef]
- Somerville, R.C.J.; Hassol, S.J. Communicating the science of climate change. Phys. Today 2011, 64, 48–53. [Google Scholar] [CrossRef]
- Fernández-Giménez, M.E. The Role of Mongolian Nomadic Pastoralists’ Ecological Knowledge in Rangeland Management. Ecol. Appl. 2000, 10, 1318–1326. [Google Scholar] [CrossRef]
- Marin, A. Rider under storms: Contributions of nomadic herders observations to analyzing climate change in Mongolia. Glob. Environ. Chang. 2010, 20, 162–176. [Google Scholar] [CrossRef]
- Bruegger, R.A.; Jigjsuren, O.; Fernández-Giménez, M.E. Herder Observations of Rangeland Change in Mongolia: Indicators, Causes, and Application to Community-Based Management. Rangel. Ecol. Manag. 2014, 67, 119–131. [Google Scholar] [CrossRef]
- Fernández-Giménez, M.E.; Angerer, J.P.; Allegretti, A.; Fassnacht, S.R.; Byamba, A.; Chantsallkham, J.; Reid, R.; Venable, N.B.H. Integrating Herder Observations, Meteorological Data and Remote Sensing to Understand Climate Change Patterns and Impacts across an Eco-Climatic Gradient in Mongolia. In Proceedings of the Trans-Disciplinary Research Conference: Building Resilience of Mongolian Rangelands, Ulaanbaatar, Mongolia, 9–10 June 2015; pp. 228–234. [Google Scholar]
- Venable, N.B.H.; Fassnacht, S.R.; Adyabadam, G.; Tumenjargal, S.; Fernández-Giménez, M.E.; Batbuyan, B. Does the length of station record influence the warming trend that is perceived by Mongolian Herders near the Khangai Mountains? Pirineos 2012, 167, 71–88. [Google Scholar] [CrossRef]
- Shi, H.Y.; Li, T.J.; Wei, J.H. Evaluation of the gridded CRU TS precipitation dataset with the point raingauge records over the Three-River Headwaters region. J. Hydrol. 2017, 548, 322–332. [Google Scholar] [CrossRef]
- Harris, I.; Jones, P.D.; Osborn, T.J.; Lister, D.H. Updated high-resolution grids of monthly climatic observations—The CRU TS3.10 Dataset. Int. J. Climatol. 2014, 34, 623–642. [Google Scholar] [CrossRef]
- Shi, H.; Chen, J. Characteristics of climate change and its relationship with land use/cover change in Yunnan Province, China. Int. J. Climatol. 2018, 38, 2520–2537. [Google Scholar] [CrossRef]
- Vaske, J.J.; Needham, M.D.; Newman, P.; Manfredo, M.J.; Petchenick, J. Potential for conflict index: Hunters’ responses to chronic wasting disease. Wildl. Soc. Bull. 2006, 34, 44–50. [Google Scholar] [CrossRef]
- Vaske, J.J.; Beaman, J.; Barreto, H.; Shelby, L.B. An extension and further validation of the potential for conflict index. Leisure Sci. 2010, 32, 240–254. [Google Scholar] [CrossRef]
- Gilbert, R.O. Statistical Methods for Environmental Pollution Monitoring; John Wiley & Sons: New York, NY, USA, 1987; 320p. [Google Scholar]
- Prakash, S.; Mitra, A.; Momin, I.; Rajagopal, E.; Basu, S.; Collins, M.; Turner, A.G.; Rao, K.A.; Ashok, K. Seasonal intercomparison of observational rainfall datasets over India during the southwest monsoon season. Int. J. Climatol. 2015, 35, 2326–2338. [Google Scholar] [CrossRef]
- Kim, J.; Park, S.K. Uncertainties in calculating precipitation climatology in East Asia. Hydrol. Earth Syst. Sci. 2016, 20, 651–658. [Google Scholar] [CrossRef]
- Nearing, G.S.; Gupta, H.V. Ensembles vs. Information Theory: Supporting Science under Uncertainty. Front. Earth Sci. 2018, 12, 1–8. [Google Scholar] [CrossRef]
- National Statistical Office of Mongolia. Mongolia National Census 2010 Provisional Results; National Statistical Office of Mongolia: Ulaanbaatar, Mongolia, 2011.
- Dorligsuren, D.; Batbuyan, B.; Bulgamaa, D.; Fassnacht, S.R. Lessons from a Territory-based Community Development Approach in Mongolia: Ikh-tamir Pasture User Groups. In Restoring Community Connections to the Land: Building Resilience through Community-Based Rangeland Management in China and Mongolia; Fernández-Giménez, M.E., Wang, X., Baival, B., Klein, J., Reid, R., Eds.; CABI Press: Wallingford, UK, 2011; Chapter 9; 260p. [Google Scholar]
- Baival, B.; Oyuntulkhuur, B.; Altanzul, T.; Fernández-Giménez, M.E. A case study of community-based rangeland management in Jinst Soum, Mongolia. In Restoring Community Connections to the Land: Building Resilience through Community-Based Rangeland Management in China and Mongolia; Fernández-Giménez, M.E., Wang, X., Baival, B., Klein, J., Reid, R., Eds.; CABI Press: Wallingford, UK, 2011; Chapter 6; 260p. [Google Scholar]
- Finch, C. Mongolia’s Wild Heritage: Biological Diversity, Protected Areas, and Conservation in the Land of Chingis Khan, Mongolian Ministry of Nature and Environment. United Nations Development Programme-Global Environment Facility, and World Wide Fund for Nature; Avery Press: Boulder, CO, USA, 1996; 42p. [Google Scholar]
- Fassnacht, S.R.; Venable, N.B.H.; Khishigbayar, J.; Cherry, M.L. The Probability of Precipitation as Snow Derived from Daily Air Temperature for High Elevation Areas of Colorado, United States, Cold and Mountain Region Hydrological Systems under Climate Change: Towards Improved Projections (Proceedings of Symposium H02, IAHS-IAPSO-IASPEI Assembly, Gothenburg, Sweden, July 2013); IAHS: London, UK, 2013; Volume 360, pp. 65–70. [Google Scholar]
- Zhang, Y.; Ohata, T.; Yang, D.; Davaa, G. Bias correction of daily precipitation measurements for Mongolia. Hydrol. Process. 2004, 18, 2991–3005. [Google Scholar] [CrossRef]
- Hoover, J.D.; Doesken, N.; Elder, K.; Laituri, M.; Liston, G.E. Temporal Trend Analyses of Alpine Data Using North American Regional Reanalysis and In Situ Data: Temperature, Wind Speed, Precipitation, and Derived Blowing Snow. J. Appl. Meteorol. Climatol. 2014, 53, 676–693. [Google Scholar] [CrossRef]
- Mann, H.B. Nonparametric tests against trend. Econometrica 1945, 13, 245–259. [Google Scholar] [CrossRef]
- Kendall, M.G.; Gibbons, J.D. Rank Correlation Methods, 5th ed.; Edward Arnold, a Division of Hodder and Stoughton: London, UK, 1990. [Google Scholar]
- Theil, H. A rank-invariant method of linear and polynomial regression analysis, I, II, III. Proc. R. Neth. Acad. Sci. 1950, 53, 386–392, 521–525, 1397–1412. [Google Scholar]
- Sen, P.K. Estimates of the regression coefficient based on Kendall’s tau. J. Am. Stat. Assoc. 1968, 63, 1379–1389. [Google Scholar] [CrossRef]
- Likert, R. A Technique for the Measurement of Attitudes. Arch. Psychol. 1932, 140, 1–55. [Google Scholar]
- Auerbach, C.F.; Silverstein, L.B. Qualitative Data: An Introduction to Coding and Analysis; New York University Press: New York, NY, USA, 2003; 216p. [Google Scholar]
- Fereday, J.; Muir-Cochrane, E. Demonstrating rigor using thematic analysis: A hybrid approach of inductive and deductive coding and theme development. Int. J. Qual. Methods 2006, 5, 80–92. [Google Scholar] [CrossRef]
- Manfredo, M.J.; Vaske, J.J.; Teel, T.L. The potential for conflict index: A graphic approach to practical significance of human dimensions research. Hum. Dimens. Wildl. 2003, 8, 219–228. [Google Scholar] [CrossRef]
- Allegretti, A.M.; Vaske, J.J. Normative Beliefs of Fishermen in the Galapagos Marine Reserve. In Proceedings of the Northeastern Recreation Research Symposium, Bolton Landing, NY, USA, 11–13 April 2010; pp. 91–97. [Google Scholar]
- Fernández-Giménez, M.E.; Batkhishig, B.; Batbuyan, B. Cross-boundary and cross-level dynamics increase vulnerability to severe winter disasters (dzud) in Mongolia. Glob. Environ. Chang. 2012, 22, 836–851. [Google Scholar] [CrossRef]
- Nandintsetseg, B.; Greene, J.S.; Goulden, C.E. Trends in extreme daily precipitation and temperature near Lake Hovsgol, Mongolia. Int. J. Climatol. 2007, 27, 341–347. [Google Scholar] [CrossRef]
- Dagvadorj, D.; Natsagdorj, L.; Dorjpurev, J.; Namkhainyam, B. Mongolia: Assessment Report on Climate Change; Ministry of Nature, Environment and Tourism: Ulanbaatar Mongolia, 2009. [Google Scholar]
- Davi, N.; Jacoby, G.; Arrigo, D.; Baatarbileg, N.; Jinbao, L.; Curtis, A. A tree-ring based drought index reconstruction for far-western Mongolia. Int. J. Climatol. 2009, 29, 1508–1514. [Google Scholar] [CrossRef]
- Gong, D.; Wang, S. Severe summer rainfall in China associated with enhanced global warming. Clim. Res. 2000, 16, 51–59. [Google Scholar] [CrossRef]
- Kilmister, I.F.; Burston, M.; Campbell, P.; Taylor, P. Love Me Forever; Track 6 on 1916; WTG/Epic: New York, NY, USA, 1991. [Google Scholar]
- Speranza, C.I.; Kiteme, B.; Ambenje, P.; Wiesmann, U.; Makali, S. Indigenous Knowledge related to climate variability and change: Insights from Droughts in Semi-Arid Areas of Former Makueni District, Kenya. Clim. Chang. 2010, 100, 295–315. [Google Scholar] [CrossRef]
- Brooke, L.F. The participation of indigenous peoples and the application of their environmental and ecological knowledge in the Arctic Environmental Protection Strategy. In Proceedings of the Inuit Circumpolar Conference, Ottawa, ON, Canada, 28–30 March 2017. [Google Scholar]
- Inglis, J.T. Traditional Ecological Knowledge: Concepts and Cases; Canadian Museum of Nature: Ottawa, ON, Canada, 1993. [Google Scholar]
- West, C.T.; Roncoli, C.; Quattara, F. Local perception and regional climate trends on the central Plateau of Burkina Faso. Land Degrad. Dev. 2008, 19, 289–304. [Google Scholar] [CrossRef]
- Wakie, T.; Evangelista, P.; Laituri, M.J. Assessing the distribution and impacts of Prosopis juliflora through participatory approaches. Appl. Geogr. 2016, 66, 132–143. [Google Scholar] [CrossRef]
- Li, X.; Wang, Z.; Hou, Z.; Liu, Z.; Yin, Y.; Ding, Y.; Hu, J. Herders’ perception of climate change does not always fit with actual climate change. Rangel. J. 2014, 36, 557–564. [Google Scholar]
- Herman-Mercer, N.M.; Matkin, E.; Laituri, M.J.; Toohey, R.C.; Massey, M.; Elder, K.; Schuster, P.F.; Mutter, E.A. Changing times, changing stories: Generational differences in climate change perspectives from four remote indigenous communities in Subarctic Alaska. Ecol. Soc. 2016, 21, 28. [Google Scholar] [CrossRef]
- Nakashima, D.; Roué, M. Indigenous knowledge, peoples and sustainable practice. In Social and Economic Dimensions of Global Environmental Change of the Encyclopedia of Global Environmental Change; Timmerman, P., Ed.; John Wiley & Sons Ltd.: New York, NY, USA, 2002; Volume 5, pp. 314–324. [Google Scholar]
- Hoover, J.; Leisz, S.; Laituri, M. Comparing and combining Landsat Satellite Imagery and Participatory Data to Access Land-Use and Land-Cover Changes in a Coastal Village in Papua New Guinea. Hum. Ecol. 2017, 45, 251–264. [Google Scholar] [CrossRef]
- Nichols, T.; Berkes, F.; Jolly, D.; Snow, N.B. Climate change and sea ice: Local observations from the Canadian Western Arctic. Arctic 2004, 57, 68–79. [Google Scholar] [CrossRef]
- Fassnacht, S.R. Estimating Alter-shielded gauge snowfall undercatch, snowpack sublimation, and blowing snow transport at six sites in the coterminous United States. Hydrol. Process. 2004, 18, 3481–3492. [Google Scholar] [CrossRef]
- Fassnacht, S.R. Data time step to estimate snowpack accumulation at select United States meteorological stations. Hydrol. Process. 2007, 21, 1608–1615. [Google Scholar] [CrossRef]


© 2018 by the authors. Licensee MDPI, Basel, Switzerland. This article is an open access article distributed under the terms and conditions of the Creative Commons Attribution (CC BY) license (http://creativecommons.org/licenses/by/4.0/).