Continuous Modeling of the Mkurumudzi River Catchment in Kenya Using the HEC-HMS Conceptual Model: Calibration, Validation, Model Performance Evaluation and Sensitivity Analysis
Abstract
:1. Introduction
2. Materials and Methods
2.1. Datasets
2.2. Software
2.3. HEC-HMS Model Application
- TLAG = lag time (h).
- L = hydraulic length of the watershed (ft.).
- Y = watershed slope (%).
- S = maximum retention in the watershed (mm) as defined by:S = 25400/CN − 254
- CN = SCS curve number for the watershed
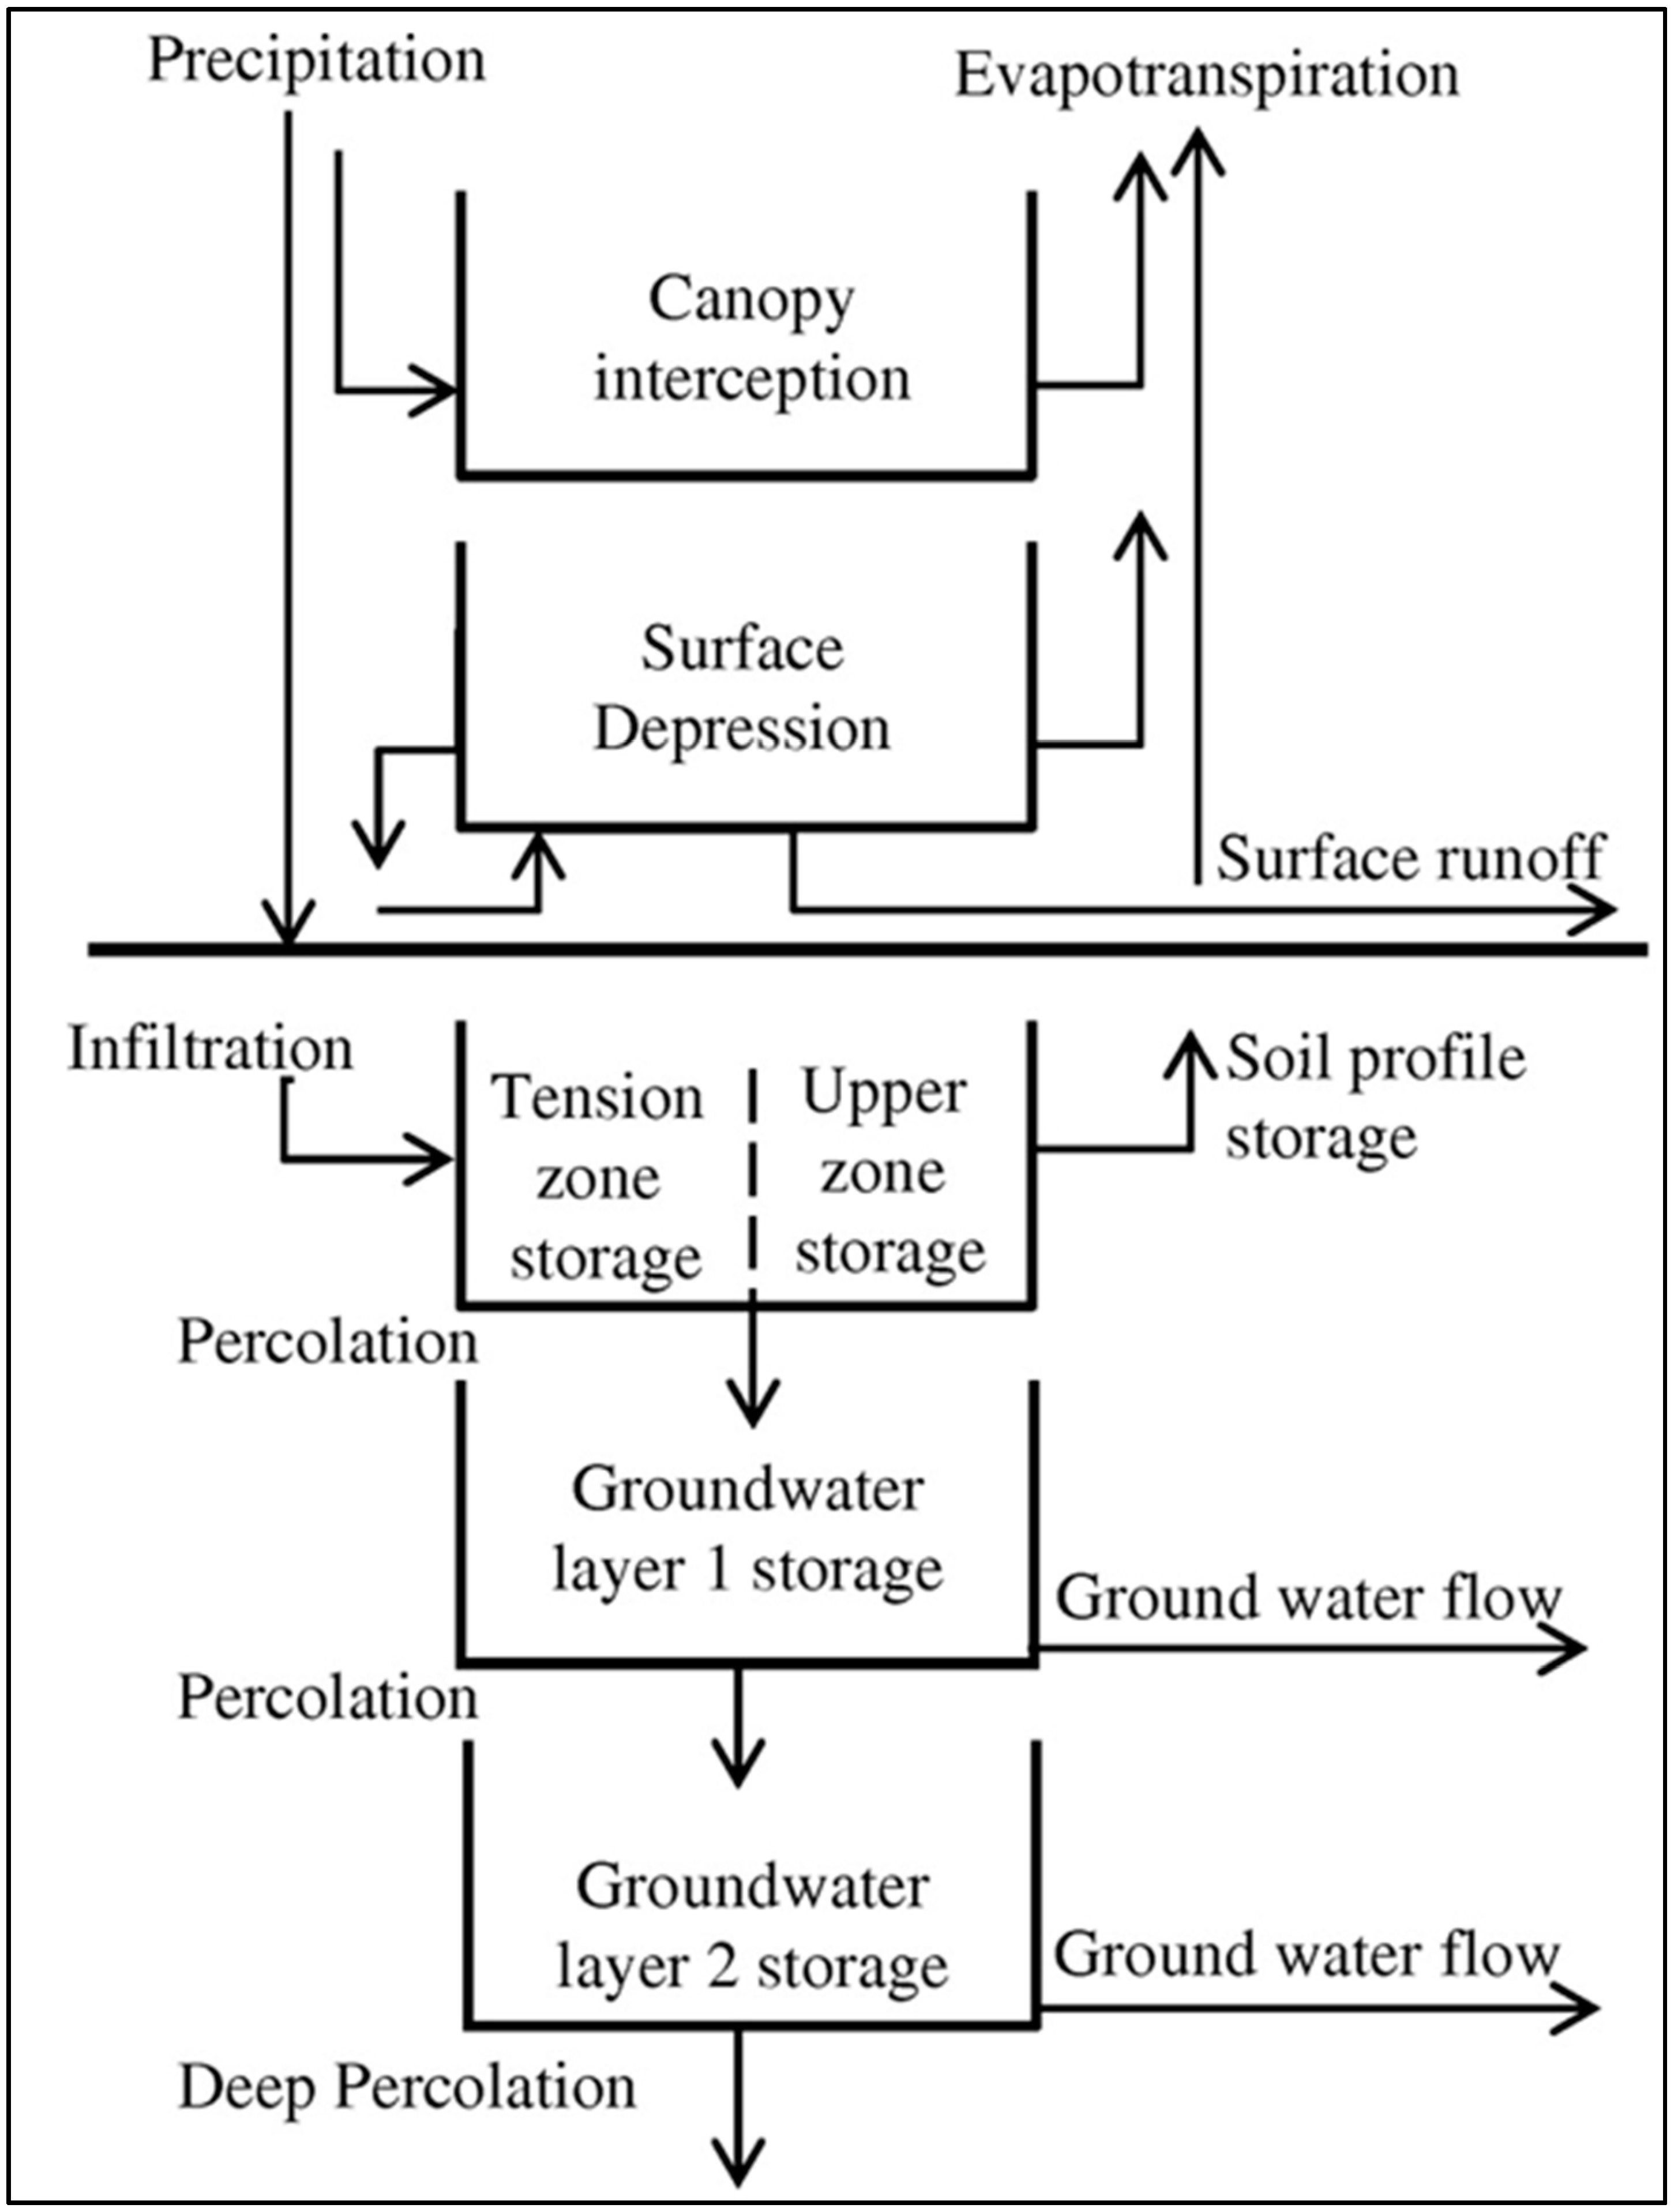
- Groundwater 1 initial (m3/s): initial base flow at the beginning of the simulation for the first layer of groundwater.
- Groundwater 1 coefficient (h): the response time of the sub-basin as specified in the SMA model.
- Groundwater 1 reservoir is used so that the base flow is routed through several sequential reservoirs. The base flow is attenuated when the number of reservoirs is increased.
2.4. Calibration and Validation
2.5. Model Performance Evaluation
- The Percentage Error in Volume (PEV)where Volo, Vols are the observed and simulated volumes, respectively.
- The percentage Error in Peak Flow (PEPF)where Qo(peak), Qs(peak) are the observed and simulated flows, respectively.
- The Coefficient of correlation (R2)where Oi, Si are the observed and simulated flows at time i, respectively; and Ō, are the average observed and simulated flows during the calibration period, respectively.
- 4.
- The dimensionless statistic: index of agreement (d) given by:
- 5.
- The dimensionless statistic: Nash-Sutcliffe model Efficiency [19] given by:
- 6.
- The absolute error index represented by the Root Mean Squared Error (RMSE)—standard deviation ratio (RSR) of observations given by:
2.6. Sensitivity Analysis
3. Results
3.1. Calibration and Validation
3.2. Model Performance Evaluation
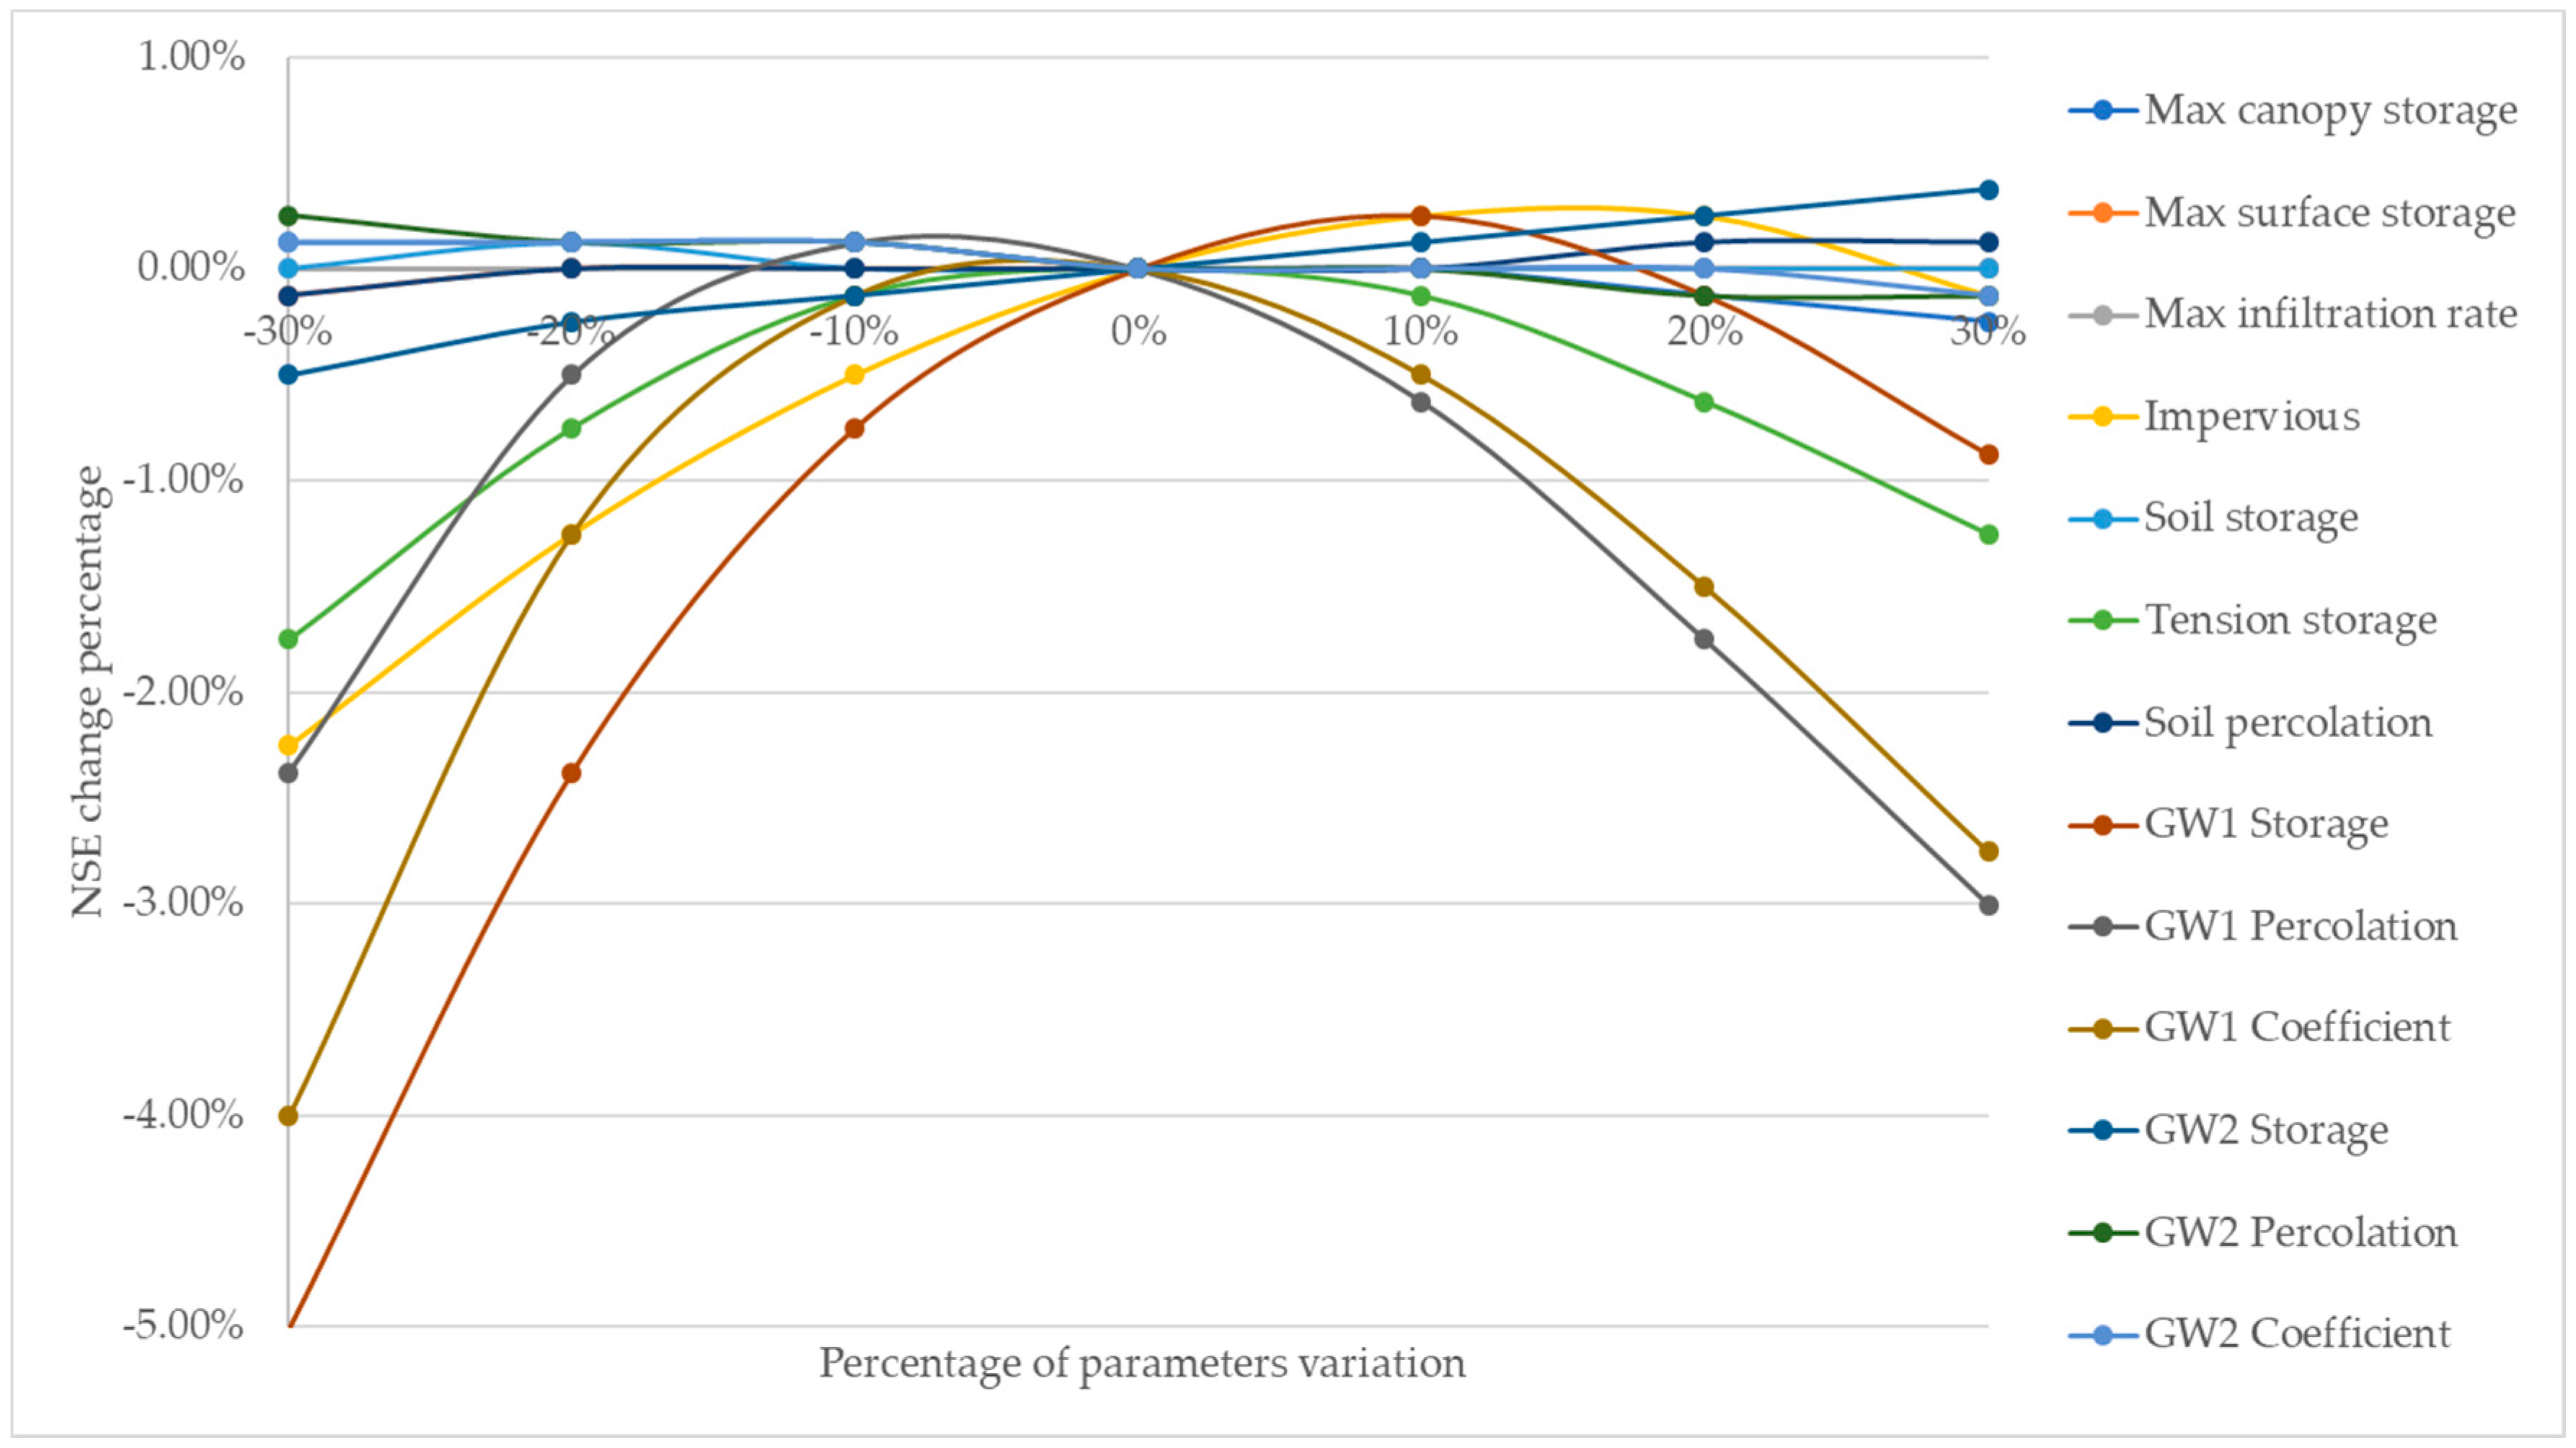
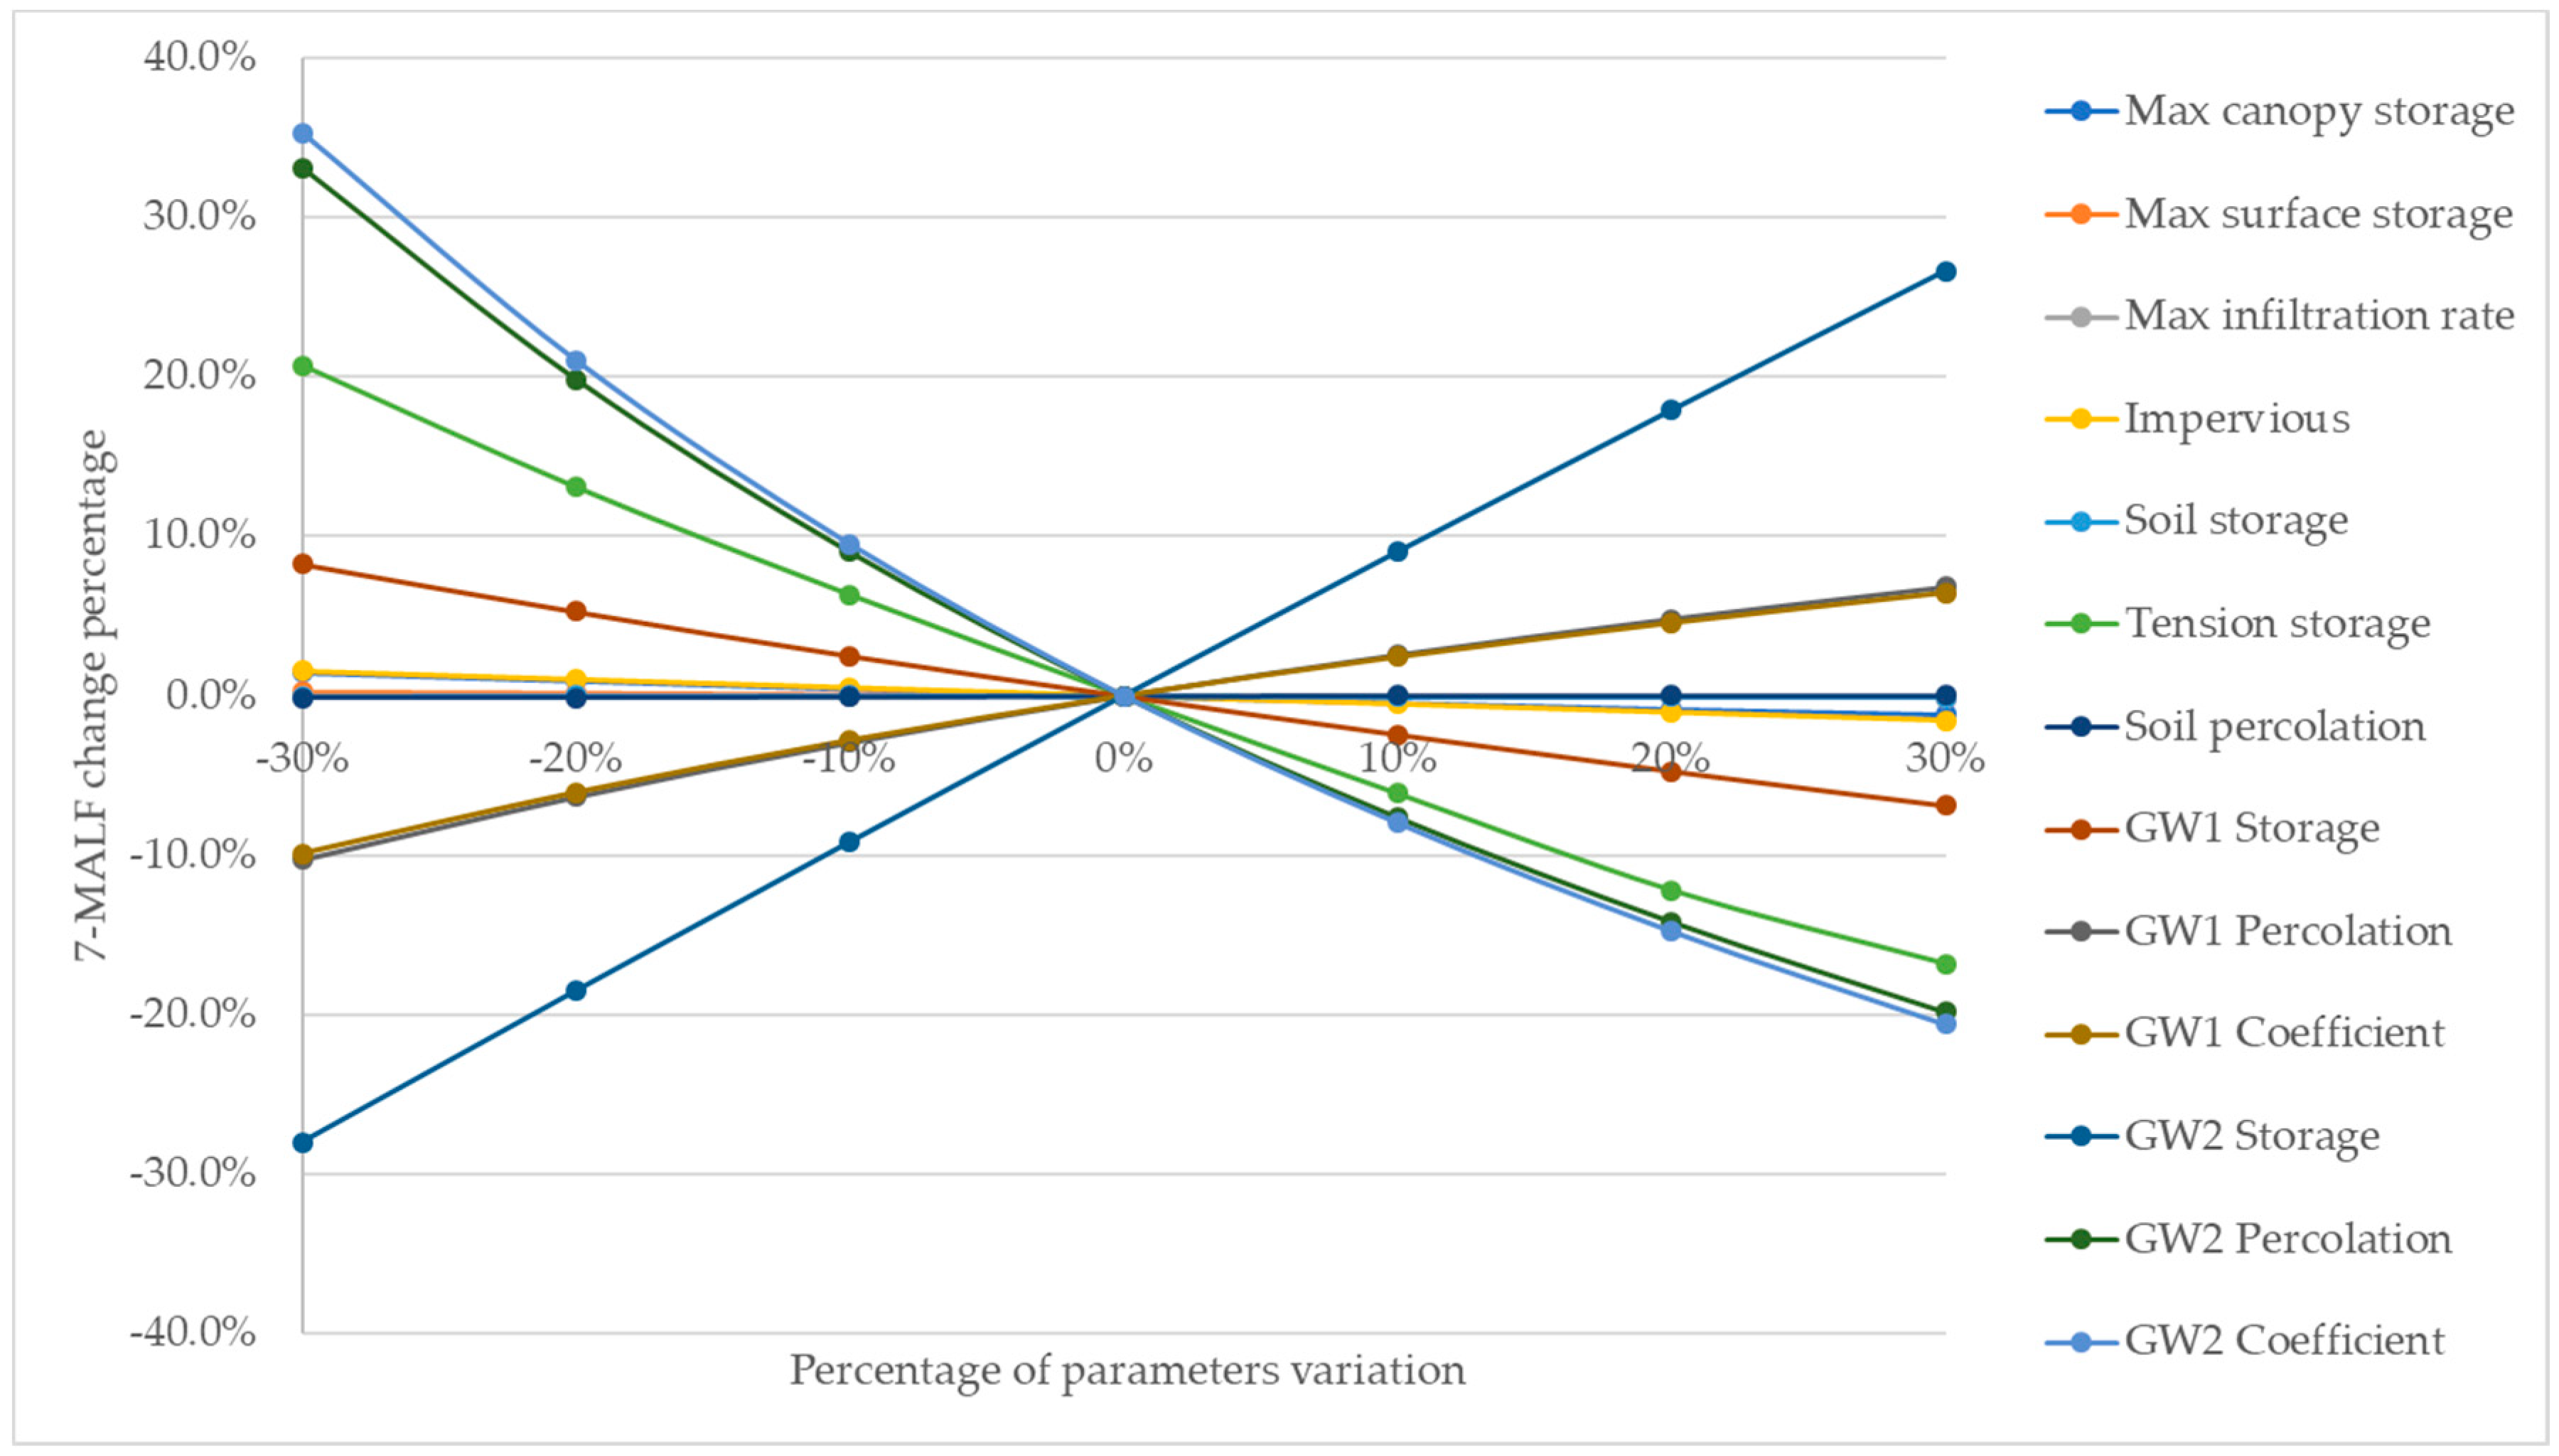
3.3. Sensitivity Analysis
4. Discussion
5. Conclusions
Author Contributions
Funding
Acknowledgments
Conflicts of Interest
References
- Feldman, A.D. Hydrologic Modeling System HEC-HMS: Technical Reference Manual; US Army Corps of Engineers: Washington, DC, USA, 2000; 145p.
- Biondi, D.; Freni, G.; Iacobellis, V.; Mascaro, G.; Montanari, A. Validation of hydrological models: Conceptual basis, methodological approaches and a proposal for a code of practice. Phys. Chem. Earth 2012, 42–44, 70–76. [Google Scholar] [CrossRef]
- Katuva, J.M. Water Allocation Assessment: A Study of Hydrological Simulation on Mkurumudzi River Basin. Ph.D. Thesis, University of Nairobi, Nairobi, Kenya, 2014. [Google Scholar]
- Zotarelli, L.; Dukes, D.; Romero, C.C.; Migliaccio, K.W.; Kelly, T. Step by Step Calculation of the Penman-Monteith Evapotranspiration (FAO-56 Method); University of Florida: Gainesville, FL, USA, 2015. [Google Scholar]
- Zhang, J.; Li, Q.; Gong, H.; Li, X.; Song, L.; Huang, J. Hydrologic Information Extraction Based on Arc Hydro Tool and DEM. In Proceedings of the 2010 International Conference on Challenges in Environmental Science and Computer Engineering, Wuhan, China, 6–7 March 2010. [Google Scholar]
- Fleming, M. Continuous Hydrologic Modeling with HMS: Parameter Estimation and Model Calibration and Validation. Master’s Thesis, Tennessee Technological University, Cookeville, TN, USA, 2002. [Google Scholar]
- Holberg, J. Tutorial on Using HEC-GeoHMS to Develop Soil Moisture Accounting Method Inputs for HEC-HMS; Purdue University: West Lafayette, IN, USA, 2014. [Google Scholar]
- Saxton, K.E.; Willey, P.H. The SPAW Model for Agricultural Field and Pond Hydrologic Simulation. In Watershed Models; CRC Press: Boca Raton, FL, USA, 2005. [Google Scholar]
- Singh, W.R.; Jain, M.K. Continuous Hydrological Modeling using Soil Moisture Accounting Algorithm in Vamsadhara River Basin, India. J. Water Resour. Hydraul. Eng. 2015, 4, 398–408. [Google Scholar] [CrossRef]
- Scharffenberg, W.A. Hydrologic Modeling System HEC-HMS—User’s Manual (ver. 4.0); USACE: Davis, CA, USA, 2013.
- Mockus, V.; Hjelmfelt, A.T. Estimation of Direct Runoff from Storm Rainfall. In Part 630 Hydrology National Engineering Handbook; United States Department of Agriculture: Washington, DC, USA, 2004; Chapter 10. [Google Scholar]
- USDA-SCS. Urban Hydrology for Small Watersheds; Technical Release No. 55 (TR-55); United States Department of Agriculture: Washington, DC, USA, 1986.
- Clapp, R.B.; Hornberger, G.M. Empirical Equations for Some Soil Hydraulic Properties. Water Resour. Res. 1978, 14, 601–604. [Google Scholar] [CrossRef]
- Mathews, J.H.; Fink, K.K. Nelder-Mead method. In Numerical Methods Using MATLAB; Pearson: London, UK, 2004; pp. 430–437. [Google Scholar]
- Legates, D.R.; Mccabe, G.J. Evaluating the Use of “Goodness-of-Fit” Measures in Hydrologic and Hydroclimatic Model Validation Evaluating the use of “goodness-of-fit” measures in hydrologic and hydroclimatic model validation. Water Resour. Res. 1999, 35, 233–241. [Google Scholar] [CrossRef]
- Moriasi, D.N.; Arnold, J.G.; Van Liew, M.W.; Bingner, R.L.; Harmel, R.D.; Veith, T.L. Model Evaluation Guidelines for Systematic Quantification of Accuracy in Watershed Simulations. ASABE 2007, 50, 885–900. [Google Scholar] [CrossRef]
- Waseem, M.; Mani, N.; Andiego, G.; Usman, M. A Review of Criteria of Fit for Hydrological Models. Int. Res. J. Eng. Technol. 2017, 4, 1765–1772. [Google Scholar]
- Zhong, X.; Dutta, U. Engaging Nash-Sutcliffe Efficiency and Model Efficiency Factor Indicators in Selecting and Validating Effective Light Rail System Operation and Maintenance Cost Models. J. Traffic Transp. Eng. 2015, 3, 255–265. [Google Scholar] [CrossRef]
- Nash, J.E.; Sutcliffe, J.V. River Flow Forecasting Through Conceptual Models Part I—A Discussion of Principles. J. Hydrol. 1970, 10, 282–290. [Google Scholar] [CrossRef]
- Ghoraba, S.M. Hydrological modeling of the Simly Dam watershed (Pakistan) using GIS and SWAT model. Alex. Eng. J. 2015, 54, 583–594. [Google Scholar] [CrossRef]
- Wałęga, A.; Rutkowska, A.; Policht-latawiec, A. Sensitivity of Beta and Weibull Synthetic Unit Hydrographs to Input Parameter Changes. Pol. J. Environ. Stud. 2014, 23, 221–229. [Google Scholar]
- Maidmend, D.; Hoogerwerf, T. Parameter Sensitivity in Hydrologic Modeling; Technical Report; The University of Texas at Austin: Austin, TX, USA, 2002. [Google Scholar]
- McCuen, R.H. Modeling Hydrologic Change, Statistical Methods; CRC Press Company, Ed.; Lewis Publishers: Boca Raton, FL, USA, 2003. [Google Scholar]
- Fleming, M.; Neary, V. Continuous Hydrologic Modeling Study with the Hydrologic Modeling System. J. Hydrol. Eng. 2004, 9, 175–183. [Google Scholar] [CrossRef]
- Ouedraogo, I.; Sang, J.; Home, P. Hec-Hms Model for Runoff Simulation in Ruiru Reservoir Watershed. Am. J. Eng. Res. 2017, 6, 1–7. [Google Scholar]

| Year | Annual Rainfall (mm) | Annual Observed Flow (mm) | Runoff Coefficients | Rainy Days |
|---|---|---|---|---|
| 1988 | 887.59 | 41.31 | 0.05 | 130 |
| 1999 | 1394.1 | 175.23 | 0.13 | 92 |
| 1990 | 837.63 | 78.00 | 0.09 | 108 |
| 1991 | 1200.5 | 151.92 | 0.13 | 125 |
| 1992 | 1024.08 | 104.04 | 0.10 | 128 |
| 1993 | 900.79 | 66.60 | 0.07 | 92 |
| 1994 | 1868.87 | 335.01 | 0.18 | 113 |
| 1995 | 1203.9 | 244.34 | 0.20 | 111 |
| Type of Vegetation | Canopy Interception (mm) |
|---|---|
| General Vegetation | 1.270 |
| Grasses and Deciduous Trees | 2.032 |
| Trees and Coniferous Trees | 2.540 |
| Description | Slope (%) | Surface Storage (mm) |
|---|---|---|
| Paved Impervious Areas | NA | 3.18–6.35 |
| Flat, Furrowed Land | 0–5 | 50.8 |
| Moderate to Gentle Slopes | 5–30 | 6.35–12.70 |
| Steep, Smooth Slopes | >30 | 1.02 |
| Canopy | Initial canopy storage (%) |
| Maximum canopy storage (mm) | |
| Crop coefficient | |
| Surface | Initial surface storage (%) |
| Maximum surface storage (mm) | |
| SMA | Soil (%) |
| Groundwater 1 (%) | |
| Groundwater 2 (%) | |
| Max infiltration rate (mm/h) | |
| Impervious (%) | |
| Soil storage (mm) | |
| Tension storage (mm) | |
| Soil percolation (mm/h) | |
| GW 1 storage (mm) | |
| GW 1 percolation (mm/h) | |
| GW 1 coefficient (h) | |
| GW 2 storage (mm) | |
| GW 2 percolation (mm/h) | |
| GW 2 coefficient (h) |
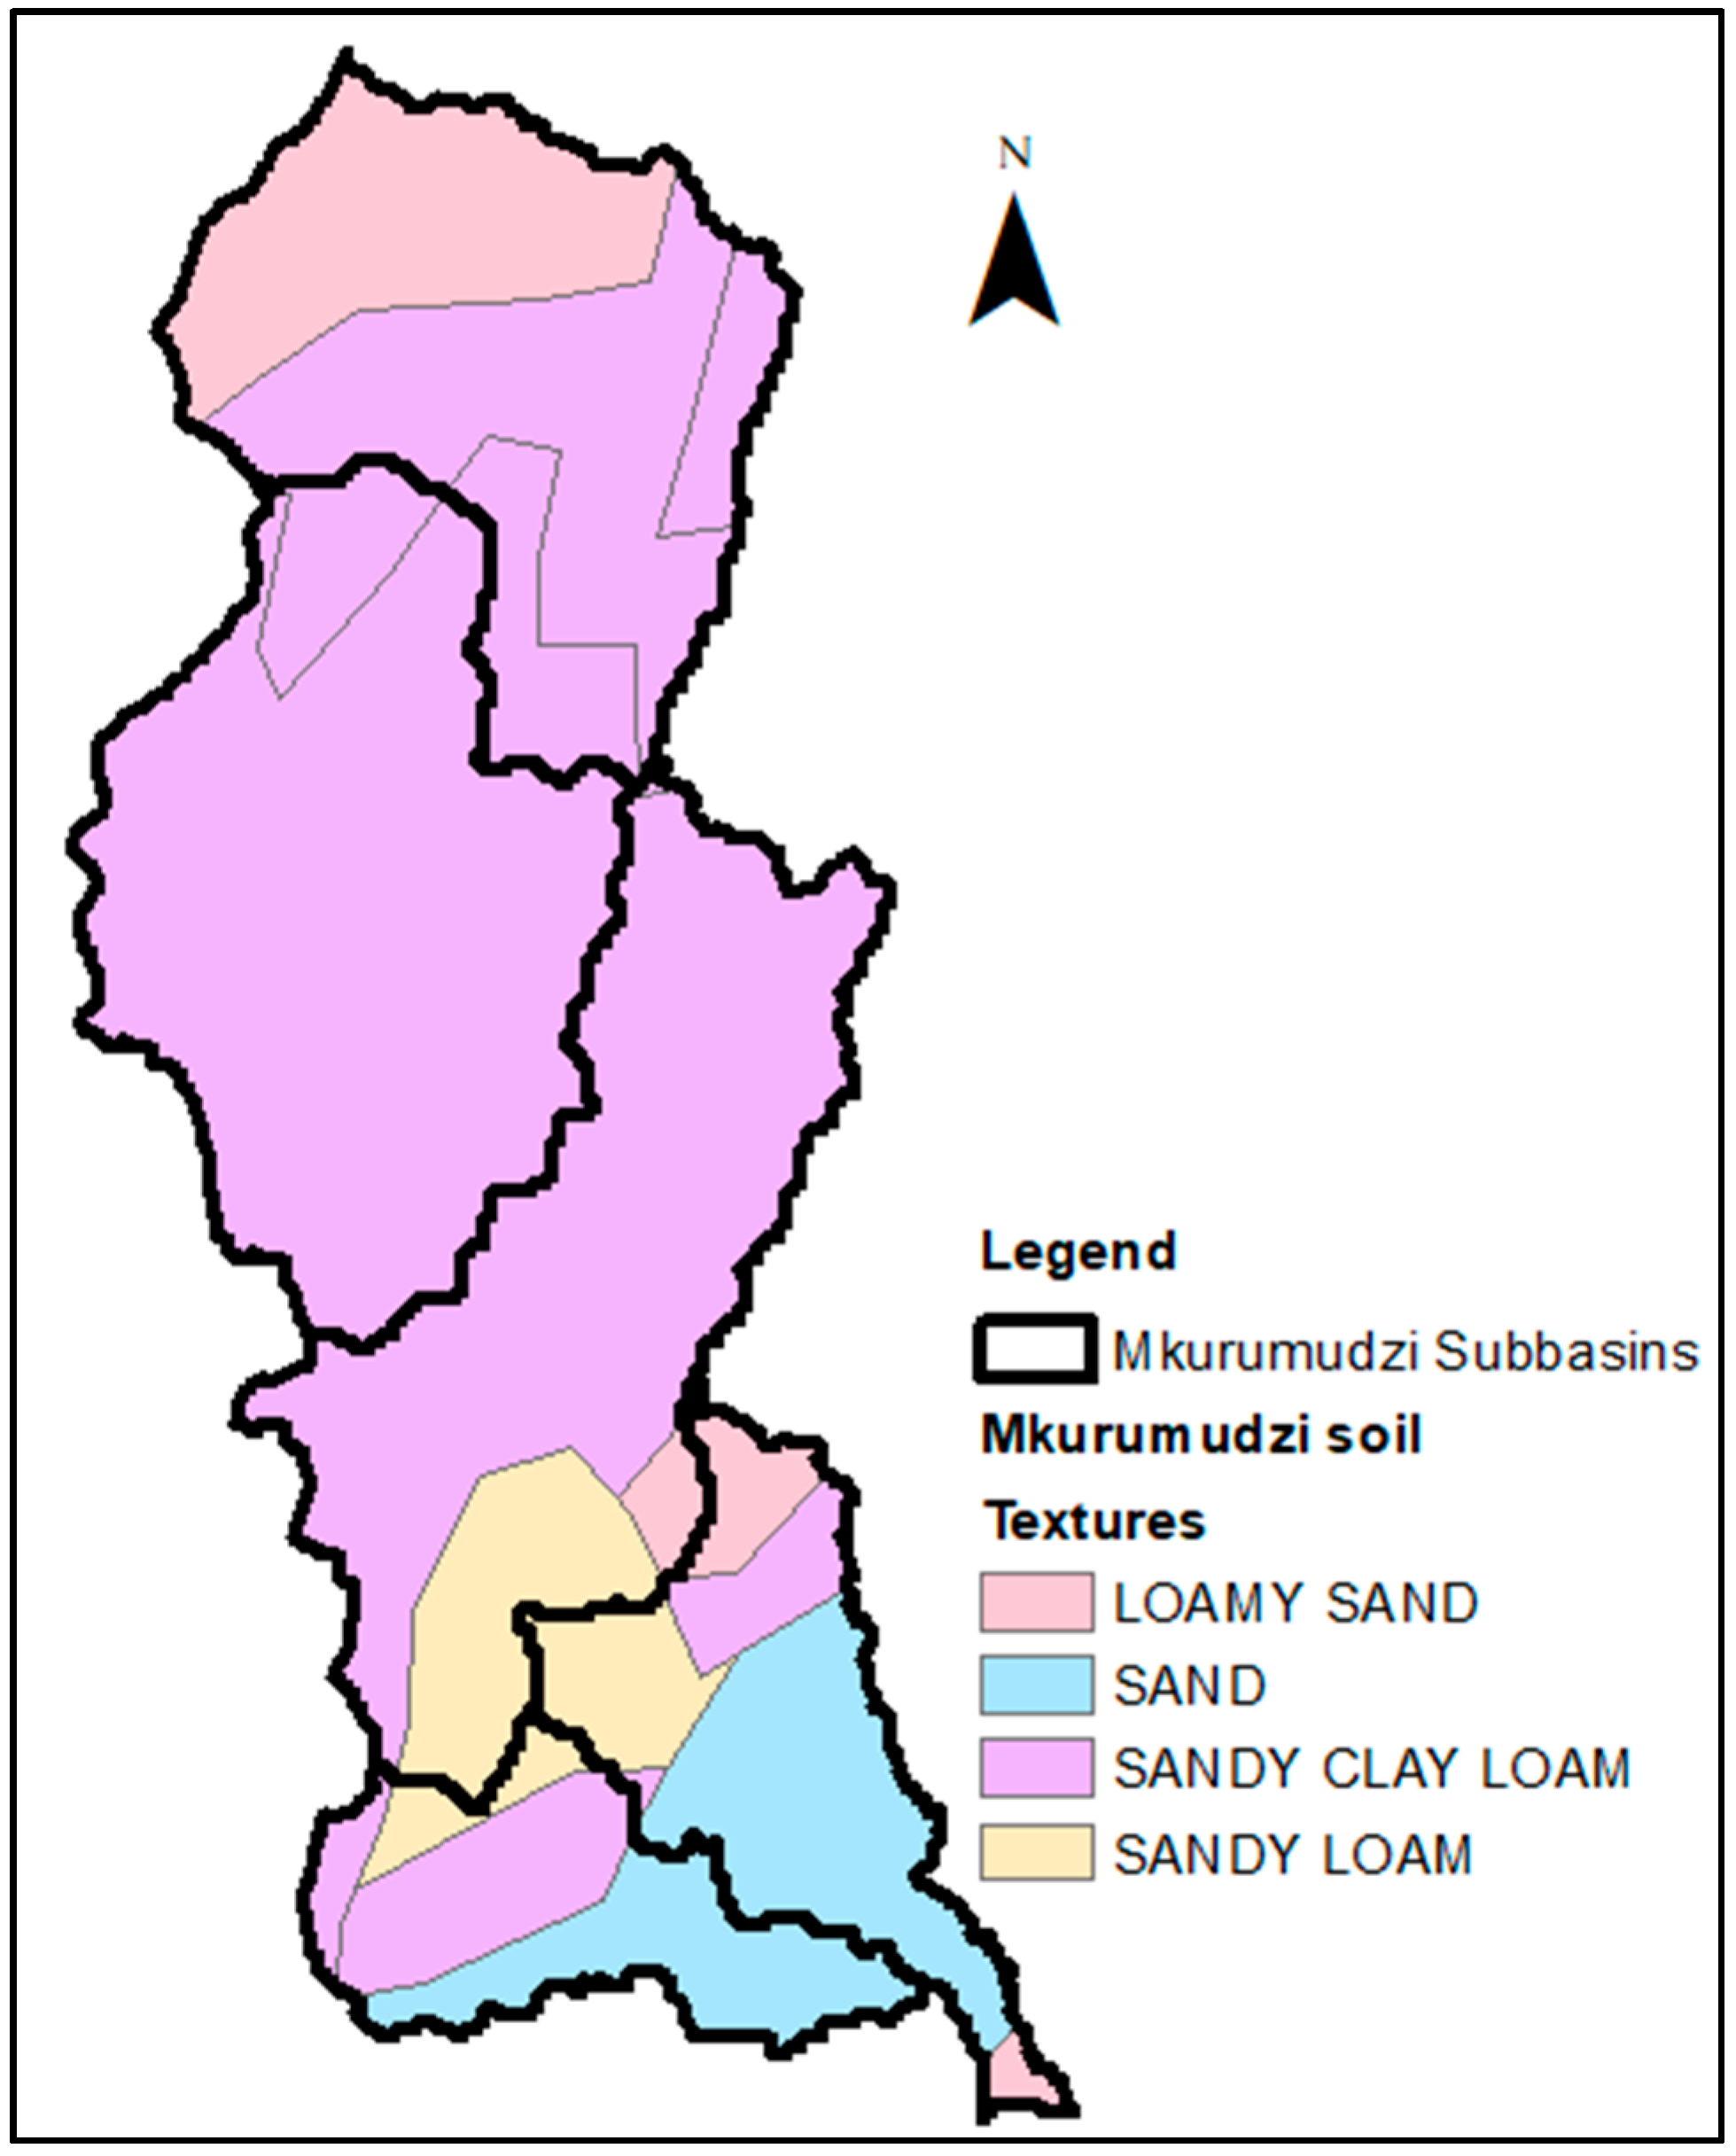
| Sub Basins/Area (km2) | Soils | Percentage (%) | Slope (%) | Texture | Saturated Hydraulic Conductivity (cm/h) | Bulk Density (kg/dm3) | Porosity (cm3/cm3) | |
|---|---|---|---|---|---|---|---|---|
| Code | Name | |||||||
| M1 (31.8) | ACf | Ferric Acrisol | 20.0 | 11.3 | Sandy Clay Loam | 0.43 | 1.40 | 0.398 |
| RGd | Dystric Regosol | 44.0 | Sandy Clay Loam | 0.43 | 1.41 | 0.398 | ||
| FRx | Xanthic Ferrasol | 36.0 | Loamy Sand | 6.11 | 1.19 | 0.437 | ||
| M2 (37.16) | ACf | Ferric Acrisol | 93.0 | 8.4 | Sandy Clay Loam | 0.43 | 1.41 | 0.398 |
| RGd | Dystric Regosol | 7.0 | Sandy Clay Loam | 0.43 | 1.19 | 0.398 | ||
| M3 (42.32) | ACf | Ferric Acrisol | 78.8 | 7.9 | Sandy Clay Loam | 0.43 | 1.41 | 0.398 |
| RGd | Dystric Regosol | 0.2 | Sandy Clay Loam | 0.43 | 1.19 | 0.398 | ||
| FRx | Xanthic Ferrasol | 3.1 | Loamy Sand | 6.11 | 1.40 | 0.437 | ||
| ALh | Haplic Alisol | 17.9 | Sandy Loam | 2.59 | 1.40 | 0.453 | ||
| M4 (22) | ACf | Ferric Acrisol | 7.8 | 4.7 | Sandy Clay Loam | 0.43 | 1.41 | 0.398 |
| ARo | Ferralic Arenosol | 47.5 | Sand | 21.00 | 1.56 | 0.437 | ||
| ALh | Haplic Alisol | 10.8 | Sandy Loam | 2.59 | 1.40 | 0.453 | ||
| FRh | Haplic Ferrasol | 33.9 | Sandy Clay Loam | 0.43 | 1.41 | 0.398 | ||
| M5 (16) | ACf | Ferric Acrisol | 0.2 | 5.0 | Sandy Clay Loam | 0.43 | 1.41 | 0.398 |
| FRh | Haplic Ferrasol | 13.8 | Sandy Clay Loam | 0.43 | 1.41 | 0.398 | ||
| FRx | Xanthic Ferrasol | 10.4 | Loamy Sand | 6.11 | 1.40 | 0.437 | ||
| ARo | Ferralic Arenosol | 54.5 | Sand | 21.00 | 1.56 | 0.437 | ||
| ALh | Haplic Alisol | 17.7 | Sandy Loam | 2.59 | 1.40 | 0.453 | ||
| LVf | Ferric Luvisol | 3.4 | Loamy Sand | 6.11 | 1.39 | 0.437 | ||
| SI. No. | Performance Rating | PEPF (%) | R2 | d |
|---|---|---|---|---|
| 1 | Very good | <15 | 0.75 to 1 | 0.90 to 1.00 |
| 2 | Good | 15 to 30 | 0.65 to 0.75 | 0.75 to 0.90 |
| 3 | Satisfactory | 30 to 40 | 0.50 to 0.65 | 0.50 to 0.75 |
| 4 | Unsatisfactory | >40 | <0.50 | <0.5 |
| SI. No. | Performance Rating | NSE | PEV (%) |
|---|---|---|---|
| 1 | Very good | 0.75 to Unity | <±10 |
| 2 | Good | 0.65–0.75 | ±10–±15 |
| 3 | Satisfactory | 0.50–0.65 | ±15–±25 |
| 4 | Unsatisfactory | <0.50 | >±25 |
| Parameters | Sub-Basins | |
|---|---|---|
| M1 | M2 | |
| Max canopy storage (mm) | 2.5 | 2.5 |
| Max surface storage (mm) | 30 | 30 |
| Max infiltration rate (mm/h) | 18.415 | 18.415 |
| Impervious (%) | 5 | 5 |
| Soil storage (mm) | 150 | 150 |
| Tension storage (mm) | 90 | 90 |
| Soil percolation (mm/h) | 10 | 10 |
| GW1 storage (mm) | 85 | 85 |
| GW1 percolation (mm/h) | 1.98 | 1.98 |
| GW1 coefficient (h) | 111 | 111 |
| GW2 storage (mm) | 200 | 200 |
| GW2 percolation (mm/h) | 1.35 | 1.35 |
| GW2 coefficient (h) | 1000 | 1000 |
| Years | PEV (%) | PEPF (%) | R2 | d | NSE | RSR |
|---|---|---|---|---|---|---|
| 1988 | 1.8% | 11.9% | 0.75 | 0.92 | 0.75 | 0.50 |
| 1989 | 18.2% | 11.3% | 0.77 | 0.94 | 0.76 | 0.49 |
| 1990 | 16.0% | 27.5% | 0.87 | 0.96 | 0.86 | 0.37 |
| 1991 | 16.1% | 5.0% | 0.81 | 0.96 | 0.79 | 0.45 |
| 1992 | 15.6% | 11.2% | 0.76 | 0.92 | 0.75 | 0.50 |
| 1993 | 2.9% | 19.5% | 0.62 | 0.89 | 0.60 | 0.63 |
| 1994 | 23.6% | 46.3% | 0.68 | 0.91 | 0.65 | 0.59 |
| 1995 | 49.4% | 24.1% | 0.52 | 0.81 | 0.45 | 0.74 |
| Calibration | 8.2% | 10.8% | 0.80 | 0.94 | 0.80 | 0.46 |
| Validation | 21.7% | 46.1% | 0.67 | 0.88 | 0.65 | 0.62 |
| Legend |
| Very Good |
| Good |
| Satisfactory |
| Unsatisfactory |
| Rank | Parameter | Average Elasticity Ratio |
|---|---|---|
| 1 | GW 1 percolation (mm/h) | 0.39 |
| 2 | GW 1 coefficient (h) | 0.39 |
| 3 | GW 1 storage (mm) | 0.39 |
| 4 | Tension storage (mm) | 0.29 |
| 5 | Impervious (%) | 0.22 |
| 6 | GW 2 percolation (mm/h) | 0.14 |
| 7 | GW 2 coefficient (h) | 0.11 |
| 8 | GW 2 storage (mm) | 0.08 |
| 9 | Max canopy storage (mm) | 0.06 |
| 10 | Max surface storage (mm) | 0.01 |
| 11 | Soil storage (mm) | 0.00 |
| 12 | Soil percolation (mm/h) | 0.00 |
| 13 | Max infiltration rate (mm/h) | 0.00 |
| Rank | Parameter | Average Elasticity Ratio |
|---|---|---|
| 1 | Impervious (%) | 0.33 |
| 2 | GW 1 storage (mm) | 0.27 |
| 3 | GW 1 percolation (mm/h) | 0.23 |
| 4 | GW 1 coefficient (h) | 0.23 |
| 5 | Tension storage (mm) | 0.20 |
| 6 | Soil percolation (mm/h) | 0.04 |
| 7 | Soil storage (mm) | 0.04 |
| 8 | Max canopy storage (mm) | 0.03 |
| 9 | Max surface storage (mm) | 0.03 |
| 10 | GW 2 storage (mm) | 0.01 |
| 11 | GW 2 percolation (mm/h) | 0.01 |
| 12 | GW 2 coefficient (h) | 0.00 |
| 13 | Max infiltration rate (mm/h) | 0.00 |
| Rank | Parameter | Average Elasticity Ratio |
|---|---|---|
| 1 | GW 1 storage (mm) | 0.07 |
| 2 | GW 1 coefficient (h) | 0.06 |
| 3 | GW 1 percolation (mm/h) | 0.06 |
| 4 | Impervious (%) | 0.04 |
| 5 | Tension storage (mm) | 0.03 |
| 6 | GW 2 storage (mm) | 0.01 |
| 7 | Max canopy storage (mm) | 0.01 |
| 8 | GW 2 percolation (mm/h) | 0.01 |
| 9 | Soil percolation (mm/h) | 0.00 |
| 10 | GW 2 coefficient (h) | 0.00 |
| 11 | Max surface storage (mm) | 0.00 |
| 12 | Soil storage (mm) | 0.00 |
| 13 | Max infiltration rate (mm/h) | 0.00 |
| Rank | Parameter | Average Elasticity Ratio |
|---|---|---|
| 1 | GW 2 coefficient (h) | 0.91 |
| 2 | GW 2 storage (mm) | 0.90 |
| 3 | GW 2 percolation (mm/h) | 0.85 |
| 4 | Tension storage (mm) | 0.63 |
| 5 | GW 1 percolation (mm/h) | 0.28 |
| 6 | GW 1 coefficient (h) | 0.28 |
| 7 | GW 1 storage (mm) | 0.25 |
| 8 | Impervious (%) | 0.05 |
| 9 | Max canopy storage (mm) | 0.04 |
| 10 | Max surface storage (mm) | 0.01 |
| 11 | Soil percolation (mm/h) | 0.00 |
| 12 | Soil storage (mm) | 0.00 |
| 13 | Max infiltration rate (mm/h) | 0.00 |
| Rank | Parameter | Average Elasticity Ratio |
|---|---|---|
| 1 | Impervious (%) | 0.21 |
| 2 | GW 2 percolation (mm/h) | 0.20 |
| 3 | GW 2 coefficient (h) | 0.18 |
| 4 | GW 2 storage (mm) | 0.17 |
| 5 | GW 1 coefficient (h) | 0.09 |
| 6 | GW 1 percolation (mm/h) | 0.05 |
| 7 | Tension storage (mm) | 0.04 |
| 8 | GW 1 storage (mm) | 0.04 |
| 9 | Max canopy storage (mm) | 0.01 |
| 10 | Max surface storage (mm) | 0.00 |
| 11 | Max infiltration rate (mm/h) | 0.00 |
| 12 | Soil storage (mm) | 0.00 |
| 13 | Soil percolation (mm/h) | 0.00 |
© 2018 by the authors. Licensee MDPI, Basel, Switzerland. This article is an open access article distributed under the terms and conditions of the Creative Commons Attribution (CC BY) license (http://creativecommons.org/licenses/by/4.0/).
Share and Cite
Ouédraogo, W.A.A.; Raude, J.M.; Gathenya, J.M. Continuous Modeling of the Mkurumudzi River Catchment in Kenya Using the HEC-HMS Conceptual Model: Calibration, Validation, Model Performance Evaluation and Sensitivity Analysis. Hydrology 2018, 5, 44. https://doi.org/10.3390/hydrology5030044
Ouédraogo WAA, Raude JM, Gathenya JM. Continuous Modeling of the Mkurumudzi River Catchment in Kenya Using the HEC-HMS Conceptual Model: Calibration, Validation, Model Performance Evaluation and Sensitivity Analysis. Hydrology. 2018; 5(3):44. https://doi.org/10.3390/hydrology5030044
Chicago/Turabian StyleOuédraogo, Wendso Awa Agathe, James Messo Raude, and John Mwangi Gathenya. 2018. "Continuous Modeling of the Mkurumudzi River Catchment in Kenya Using the HEC-HMS Conceptual Model: Calibration, Validation, Model Performance Evaluation and Sensitivity Analysis" Hydrology 5, no. 3: 44. https://doi.org/10.3390/hydrology5030044
APA StyleOuédraogo, W. A. A., Raude, J. M., & Gathenya, J. M. (2018). Continuous Modeling of the Mkurumudzi River Catchment in Kenya Using the HEC-HMS Conceptual Model: Calibration, Validation, Model Performance Evaluation and Sensitivity Analysis. Hydrology, 5(3), 44. https://doi.org/10.3390/hydrology5030044


