Article

Application of Multi-Isotopes and Geochemical Modeling for Delineating Recharge and Salinization Sources in Dahab Basin Aquifers (South Sinai, Egypt)

Hydrogeochemistry Department, Water Resources and Desert Soil Division, Desert Research Center, Cairo 11753, Egypt
Hydrology 2018, 5(3), 41; https://doi.org/10.3390/hydrology5030041
Submission received: 2 June 2018 / Revised: 26 June 2018 / Accepted: 30 June 2018 / Published: 4 August 2018

Abstract

:
The Dahab watershed comprises three aquifers; the alluvial Quaternary, the Early Cambrian sandstone, and the fractured Pre-Cambrian basement aquifers. The Dahab watershed is located in the southeastern part of the arid Sinai Peninsula, where low precipitation and groundwater over-exploitation deteriorate the groundwater quality in the alluvial coastal plain aquifer located downstream. Multi-isotopes including δ18O and δ2H, 87Sr/86Sr, δ81Br and δ11B coupled with groundwater geochemistry were utilized to assess the recharge source(s), water-rock interaction, and seawater mixing to aid sustainable groundwater management strategies. Br and Cl concentrations, used to measure groundwater salinity, were low in the upstream groundwater, while higher concentrations were observed in the deep drilled wells located downstream, in the main well field. The δ18O and δ2H isotopes were depleted in the upstream aquifers, but enriched in the shallow coastal aquifer, indicating slight evaporation and seawater intrusion. Higher mean values of 87Sr/86Sr and δ81Br were observed in the fresh groundwater from high in the watershed (87Sr/86Sr = 0.707716 and δ81Br = +2.05‰), while lower mean values were observed in the saline groundwater located downstream in the main well field (87Sr/86Sr = 0.706631 and δ81Br = +0.11‰). The cumulative mass balance mixing curves and the geochemical NETPATH model confirm the change of groundwater quality from the upper to lower watershed caused by the leaching and evaporation processes, as well as mixing with seawater. The corrected 14C age dating and stable isotopes show that the Quaternary and Pre-Cambrian basement aquifers contain modern groundwater, while the Early Cambrian aquifer holds paleo-groundwater, which has received considerable recharge from recent precipitation. The mixing ratiosin the Quaternary coastal aquifer range between 5% and 13% seawater to 95% and 87% fresh groundwater, respectively. These results indicate that future groundwater withdrawal must be well managed in order to limit further salinization. Groundwater withdrawal from the Quaternary coastal aquifer must be below the natural average recharge in order to be sustainable.

1. Introduction

The Dahab watershed is located in the Southeastern Sinai Peninsula, part of an arid coastal zone where scarce rainfall and high summer temperatures dominate the climate (Figure 1). The alluvial coastal plain aquifer located at the base of the Dahab watershed is the main water source for desalination plants in the Dahab capital city. The coastal plain aquifers are considered to be the main source of freshwater. However, groundwater over-exploitation of semi-arid to arid coastal aquifers in Southern Europe, Northern African, the Middle East, and Eastern China leads to inland encroachment and/or vertical upconing of the salt/fresh water interface, causing groundwater salinization [1,2,3,4,5,6]. A mixing with seawater by about 2–3% makes freshwater unsuitable for drinking and marginal for agriculture and irrigation [7]. In the Dahab coastal aquifer, groundwater overexploitation began in 1982 through eight production wells drilled by the Sinai Development Authority, in the main well field [8]. In recent years, groundwater over-withdrawal in the South Sinai Peninsula and the Dahab alluvial aquifers has resulted in seawater intrusion and severe groundwater salinization [9,10,11,12]. The groundwater processed in desalination plants is considered one of the main sources of fresh water for Dahab city. The total withdrawal rate from coastal intake drilled wells used for feeding these desalination plants exceeds 25,000 m3/day [13], which is considered substantial. Historical records of groundwater salinity in the main well field low in the Dahab watershed show variations from 1000–3000 mg/L in recent decades because of poorly managed groundwater withdrawal (Figure 2 and Figure 3).
This research used multi-isotope tracers in conjunction with groundwater geochemistry to determine sustainable recharge source(s) for different aquifers, and evaluate processes affecting the quality of groundwater in the Dahab watershed. The distribution of fresh and saline groundwater in coastal aquifers reflects previous hydrogeological environment, and long-term geological and recent anthropogenic processes affecting groundwater quality [14,15,16]. Groundwater geochemistry and stable isotopes (δ18O, δ2H, 87Sr/86Sr, 11B) have been used to determine groundwater recharge and flow paths in assessing historic and current geochemical processes that deteriorate groundwater quality in arid regions [12,17,18,19,20,21]. In addition, stable isotopes (δ18O and δ2H) are considered water management tools [22,23,24], and are used to understand evaporation, precipitation, and mixing processes [25,26]. Strontium isotopes (87Sr/86Sr) do not exhibit fractionation by common natural processes, accordingly, they have been utilized to provide valuable insights of groundwater recharge sources, mixing proportions, and degree of water–rock interaction [27,28,29,30]. Boron isotopes have been used for identification and migration of contaminants in groundwater [31,32]. Fresh groundwater recharge from an area of different altitude in a watershed has different isotopic signatures than seawater and other saline waters, thus the mixtures will have ratios intermediate to the two end members [12,33]. Combining δ11Br and δ81Br isotopes can provide detailed information on the processes affecting groundwater salinization in coastal aquifers a [34,35]. The approach used in this study to aid groundwater resource sustainability in the Dahab watershed are applicable to similar hydrogeological settings located in semi-arid and arid environments throughout the world.

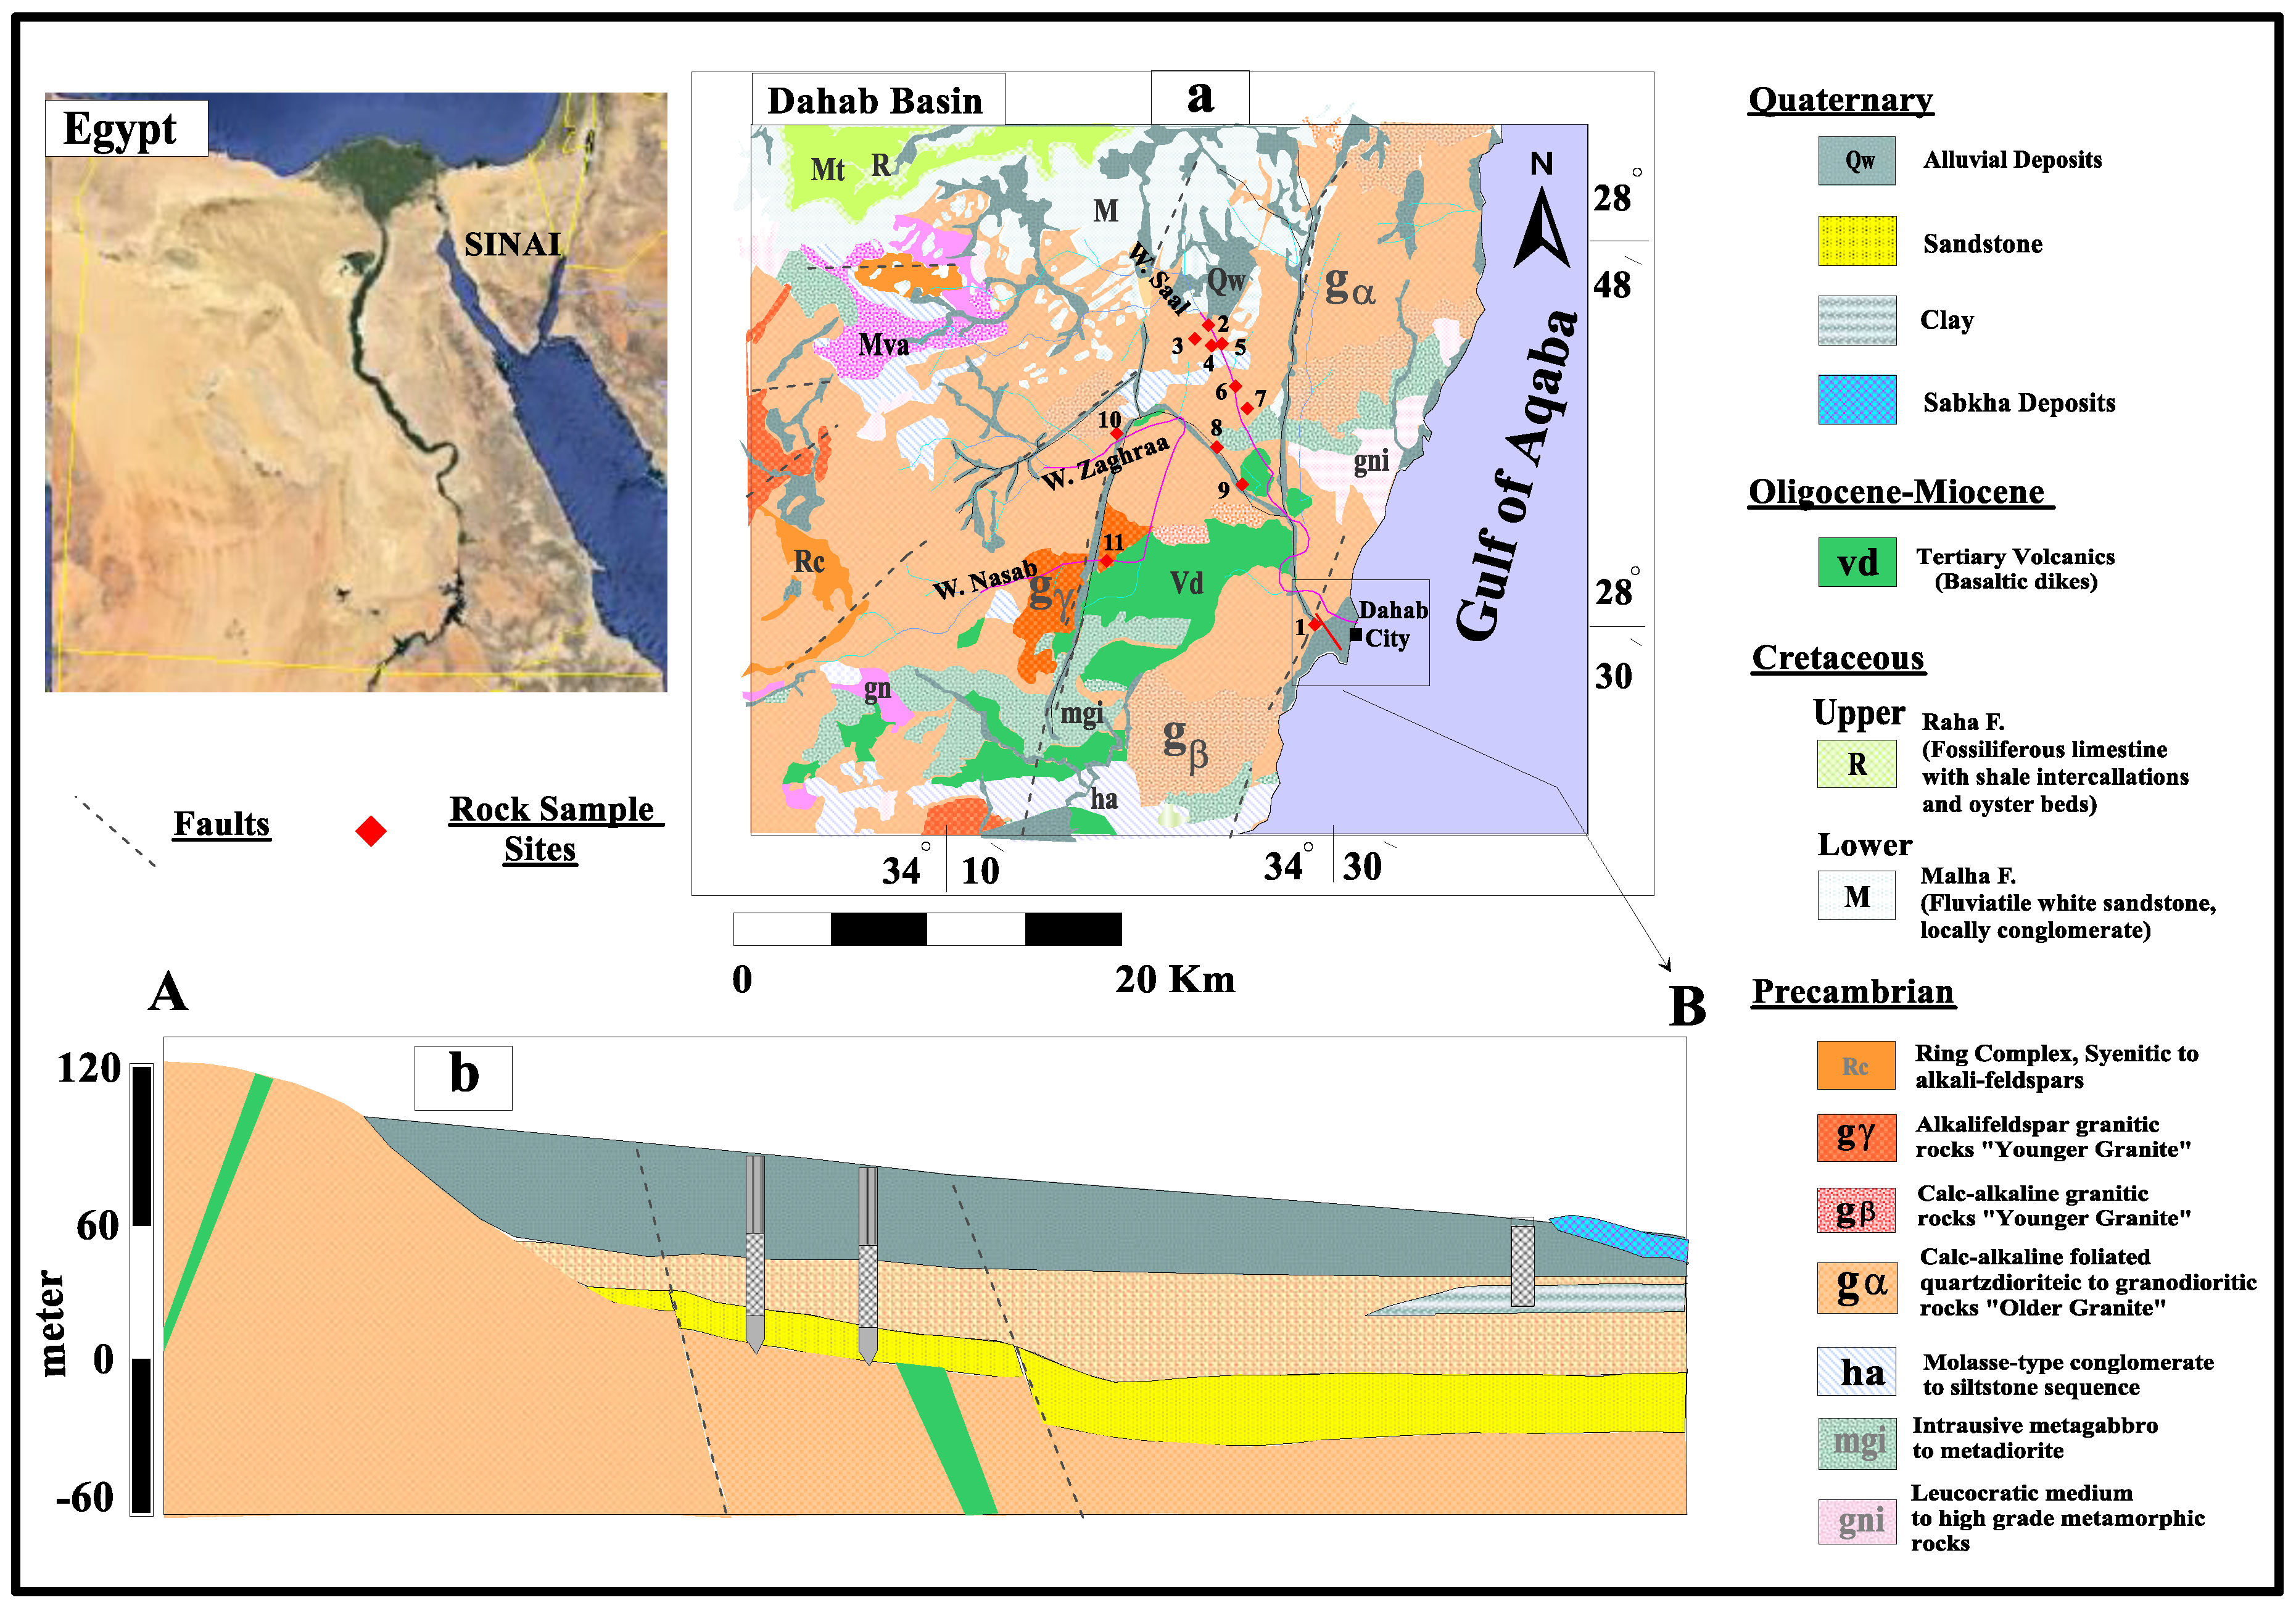
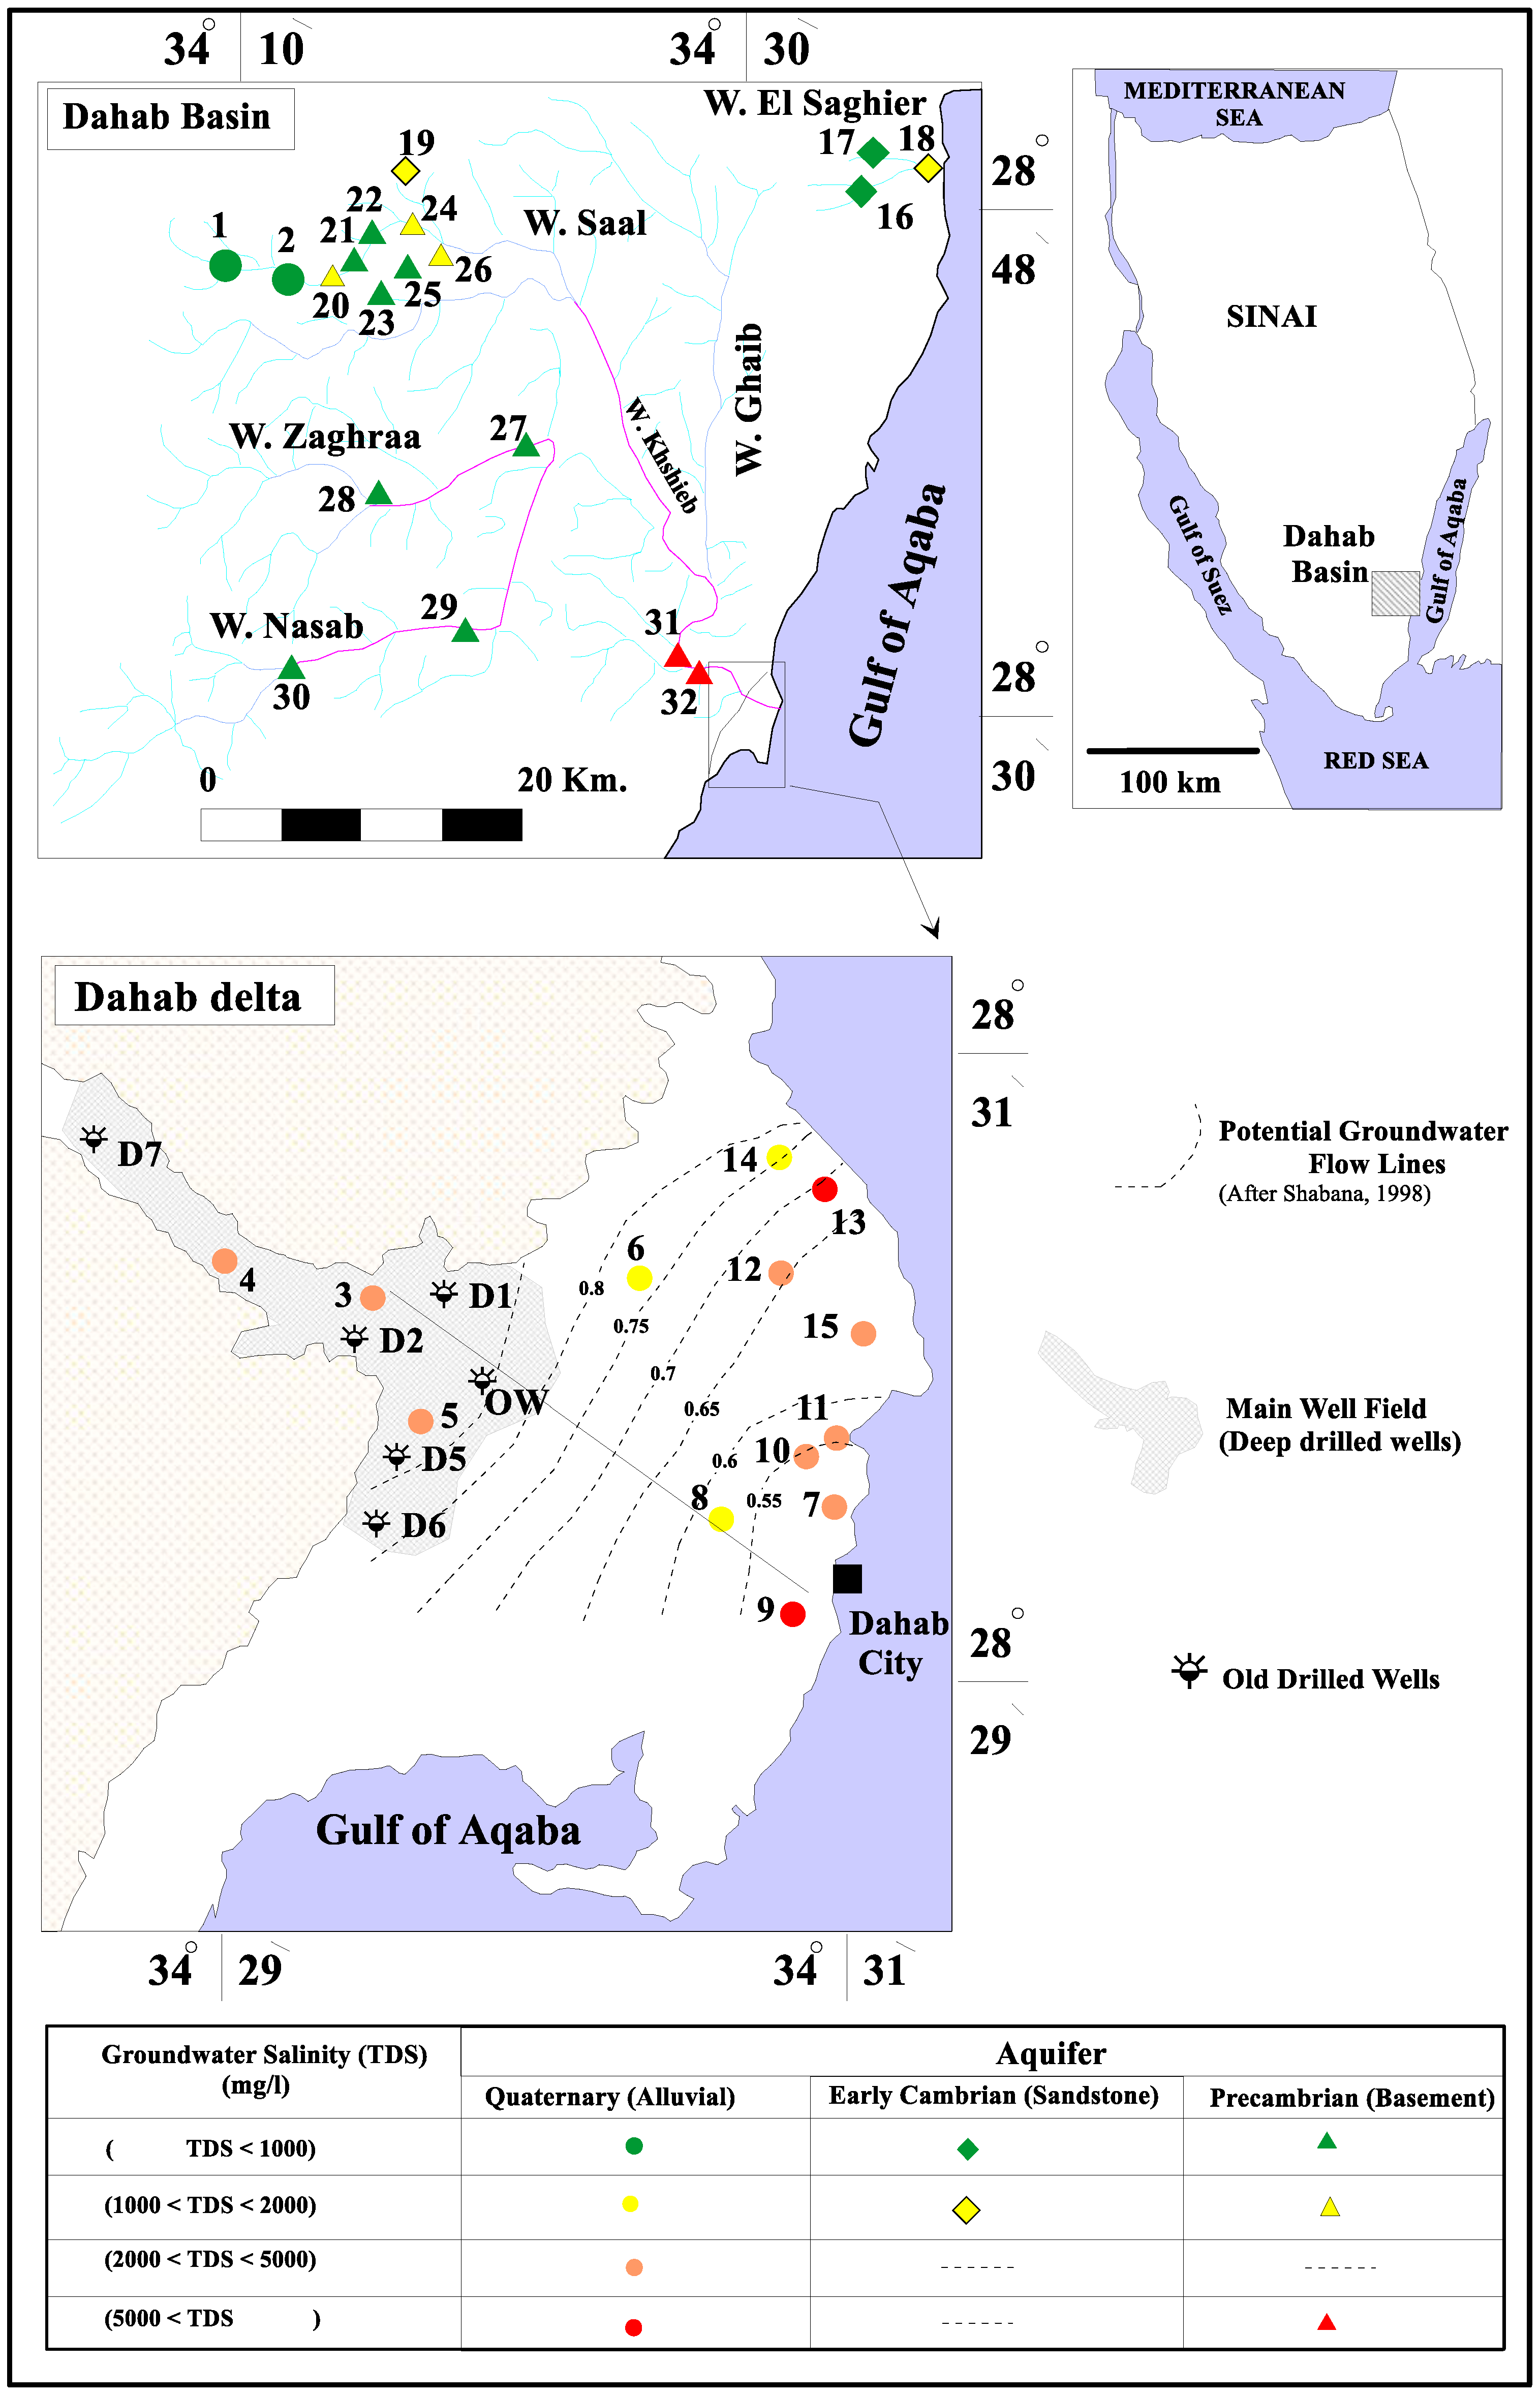
2. The Study Area, Geology, and Hydrogeology

The Dahab basin (Figure 1) drains east toward the Gulf of Aqaba and is considered to be one of the most important watershed systems in the South Sinai Peninsula. It is a primary source of water for Dahab City residents and tourists. The watershed covers an area of about 2100 m2 and is comprised of five main sub-basins: Wadi Ghaib, Wadi Khshieb, Wadi Saal, Wadi Zaghraa, and Wadi EL Nasab (Figure 1). The topography of the Dahab basin is characterized by steep gradients, increasing the flooding probability in the lowlands [36].
The Dahab watershed is characterized by high rugged mountains built mainly of Precambrian to Quaternary rocks [37]. The basement complex of the watershed is comprised of metamorphic and igneous rocks (Figure 1 and Figure 2). The metamorphic rocks outcrop upgradient in the Saal and Zaghraa sub-basins and are differentiated into metasediment, metavolcanic, and metagabbroic intruded by not metamorphic igneous rocks [38,39,40]. These igneous rocks are represented by felsic and mafic plutonites of Precambrian age intruded by acidic post-granitic and Oligocene-Miocene basic dike swarms [41,42,43]. The granitic rocks are widespread in the Saal, Zaghraa, and EL Nasab sub-basins [44,45]. These are divided into older and younger granitoids [46,47]. The mineral compositions of these granitic rocks are mainly quartz, plagioclase, microcline, orthoclase, and biotite. The weathering and alteration of these rocks show feldspars strongly argillized to clay minerals, biotite altered to chlorite, and sausurization of plagioclase and orthoclase minerals (Figure 1, Table S1).
The sedimentary rock of Cambrian age locally outcrops at Hedek area in the main channel of the Saghier basin located in the northern part of the Dahab watershed and include the Araba and Naqous Formations [48,49,50]. The Araba Formation of Early Cambrian age is formed primarily of thick-bedded medium to fine-grained sandstone with iron oxides and clay sheet intercalations [50]. The Naqous Formation (Late Cambrian) overlies the Araba Formation and is made up of friable deposits of quartzitic fine-grained with clay intercalations [47,51,52].
The Quaternary deposits consist of erosional products of sedimentary and igneous rocks located high in the Dahab watershed. These deposits cover the stream channels with variable thicknesses ranging between a few meters up to 60 m in the delta area [47,53,54]. They are composed mainly of boulders of carbonate and igneous rocks with fine to coarse sands embedded in a silty and clayey matrix [8]. The sedimentary successions are distributed in the northern part of the Dahab and El-Saghier watersheds (Figure 1). Dahab watershed contains three main aquifers: the Quaternary, Early Cambrian, and Precambrian. They are recharged by flash floods when the area receives heavy winter storms and through infiltration of precipitation high on the mountain block [55,56]. The Dahab catchment receives an average annual rainfall of about 76 mm/year [57], and the potential evaporation exceeds 2400 mm/year [58].

3. Methodology

3.1. Field and Laboratory Work

Water samples were collected from 7 drilled wells and 25 hand-dug wells (Table S2) in June 2014. Samples were filtered through a 0.45 µm filter and collected in glass bottles for both geochemical and isotopic analyses. The pH and electrical conductivity (EC) were measured in the field. Electrical conductivity was measured with AD-410 ADWA model; pH was measured with AD-11 ADWA model. Meters were calibrated twice daily during the field campaign.
The dissolved major-ion analyses, including anions (Cl and SO4) and cations (Ca, Mg, Na, and K), were conducted at the Desert Research Center, Water Central Laboratory, Cairo, Egypt, using ion chromatography (Dionex, ICS-1100). The carbonate and bicarbonate were determined by the standard analytical methods [59,60]. For analytical quality control, each sample was run in duplicate and standards were verified for each sample. The Error   % = [ Cations Anions ] / [ Cations + Anions ] was less than 5%. Stable isotopic analyses for δ18O and δ2H were analyzed in the Nevada Stable Isotope Laboratory, following the methods of [61] for δ2H and [62] for δ18O. The δ18O and δ2H results were reported in per mil (‰) according to the Vienna Standard Mean Ocean Water VSMOW referenceand the uncertainty of δ2H was ±1‰ and ±0.1‰ for δ18O (1 standard deviation). The 87Sr/86Sr analysis was conducted using thermal ionization mass spectroscopy with an analytical precision value of (±0.0001) [63]. δ11B isotope values were determined at the Texas A&M University. The dissolved inorganic carbon (DIC) stable isotopic ratio (13C/12C) was determined using the Finnigan Mat, Delta Plus XL IRMS system, with a precision value of ±0.3‰ at the IT2 Isotope Tracer Technologies located in Waterloo, Canada. The 14C analyses were conducted at the University of Arizona, accelerator and mass spectrometry laboratory; the results were reported in percent modern carbon (pmc) with an uncertainty of ±0.4 pmc. δ81Br was analyzed at Isotope Tracer Technologies (IT2) (Table S2). The δ81Br isotope was determined using the method described in [64]. The analyses were performed on CH3Br with a precision of 0.1‰ for both isotopes. Mineralogy was identified by examination of rock thin-sections using polarized light microscopy in the mineralogical laboratory at the University of Nevada Reno.

3.2. Water–Rock Reaction Modeling

The NETPATH geochemical model has been widely used for understanding processes that account for chemical and isotopic changes and groundwater flow paths [65]. The observed variations in chemistry, along with the groundwater flow path between initial and final water, can be simulated using the NETPATH inverse model. The model outcomes obtained for water–rock interactions, mixing, and evaporation is limited by the available mineral, chemical, and the isotopic data of δ 13C and 14C [66,67]. The known mineral phases in the aquifer matrix of the study area and the major-ion concentrations of the groundwater (Table 1) have been used for the NETPATH models. Halite, gypsum, and silica are observed in the alluvial deposits, particularly the Sabkha deposits, so they were included as phases in the model. The carbonate boulders are dominated in the Dahab delta aquifer, so calcite and dolomite were included in the model phases [8]. Mineral phases for the igneous mafic and felsic rocks were obtained from thin section investigations of rock samples collected from the basement rocks of the watershed. Plagioclase, anorthite, chlorite, and microcline are dominant minerals in the basement rock outcrops in the watershed and they are also embedded as boulders and cobbles downstream in the alluvial deposits (Table S2). Clay sheets are present in the sediments, so the clay minerals, including montmorillonite and illite, were also included as phases in the model. The cation exchange of calcium with sodium in clay minerals has also been considered in the model simulation.

4. Results and Discussion

4.1. Groundwater Chemistry

The historical records of groundwater salinity in the main well field (sites D1, D2, D5, D6, and OW) show extreme variations starting from 1982 to 2007 (Figure 1 and Figure 2). The average groundwater salinity for the deep drilled wells located in the main well field has increased from 2230 mg in 1986 to 3300 mg/L in 2007 [9,68] because of variations in annual precipitation and flooding, as well as upwelling of deep saline groundwater caused by over-pumping [69]. The groundwater chemistry data collected from 32 groundwater wells are shown in Table S1 and represented in Figure 2 and Figure 4. In 2007, the groundwater salinity ranged from 562 mg/L upstream (site 1) to 14,156 mg/L downstream (site 31) (Table S1, Figure 1). Groundwater samples collected from the three different aquifers were classified into four groups according to the groundwater salinity (A, B, C, and D). Group A had groundwater salinity less than 1000 mg/L (sites 1, 2, 16, 17, 21, 22, 23, 25, 27, 28, 29, and 30). Group B had groundwater salinity ranging from 1000 to 2000 mg/L (sites 6, 8, 14, 19, 20, 24, and 26). The samples of Group A and Group B were mainly located high in the Dahab watershed. Group C had a salinity range of 2000 to 5000 mg/L, and Group D had groundwater salinity more than 5000 mg/L. Most of the groundwater samples representing Group C and D were located low in the basin at the delta (sites 3, 4, 5, 7, 9, 10, 11, 12, 13, 15, 31, and 32). The Br and Cl ions have been used as indicators to determine salinization origin and mixing fractions with seawater [70,71,72,73].
Additionally, ionic relationships are commonly used to evaluate the recharge and salinization sources in coastal aquifers [11,74]. Figure 4 shows the logarithmic plots of the total dissolved solids (Figure 4a), concentrations of major ions (Figure 4b–e), and Sr (Figure 4f) versus Bromide. It is clear that the groundwater of Group A and Group B have low major ion concentrations and groundwater salinity. The data plot close to the rainwater sample, on the evolution groundwater trend line extended between the rainwater sample and the high saline groundwater sample represented by site 13, indicating replenishments and recharge from meteoric water from annual precipitation (Figure 4a). The slightly elevated salinity, Sr, and other ions characterizing the Group B, were mainly attributed to evaporation processes, as well as leaching and dissolution of clay sheets in the delta and silicate minerals from the granitic rocks from the upstream of the watershed (Table S2). This indicates that the water/rock interaction was the main factor controlling groundwater salinization of Group A and Group B.
Group C and Group D had relatively higher bromide, salinity, and major ion concentrations and they plot closer to the seawater sample, indicating possible seawater intrusion. Two samples belonging to Group D, which tap the granitic basement aquifer located downstream, had higher salinity and lower bromide concentrations, which may indicate extensive evaporation.
The major-ion chemistry of groundwater in the Dahab watershed is shown in the Piper trilinear diagram in Figure 5 [75]. On the basis of the major-ions, the different groundwater samples were classified into four chemical water types: Na–Cl, Ca–Na–HCO3, Ca–Mg–Cl, and Ca–Cl. Twenty groundwater samples, most of them belonging to Group A and Group B groundwaters, were classified in the sodium–chloride water (Na–Cl) type. Ten of these samples were tapped from the downstream Quaternary aquifer, while the others were tapped from the granitic basement rocks located upstream. The sodium–chloride water type resulted by leaching of granitic rocks rich in sodium ions as a result of weathering processes in this arid region. One groundwater sample (site 22) located in the upstream watershed of the Saal sub-basin fell into the sodium bicarbonate (Na–HCO3) water type, indicating it was recently recharged from annual precipitation.
Seven groundwater samples, most of them belonging to Group C and D, were represented in the calcium–chloride (sites 3, 5, 31, and 32) and magnesium–chloride (sites 10, 11, and 15) water types. Five groundwater samples tapped from the Quaternary aquifer near the Gulf of Aqaba shore line indicate cation exchange processes, where Na ions are exchanged with Ca and Mg as a result of seawater intrusion. The other two groundwater samples (sites 31 and 32) tapped from the basement aquifer in the El Nasab and Zaghra sub-basin indicated dissolution of basaltic dike, which act as a barrier for groundwater entrapments.

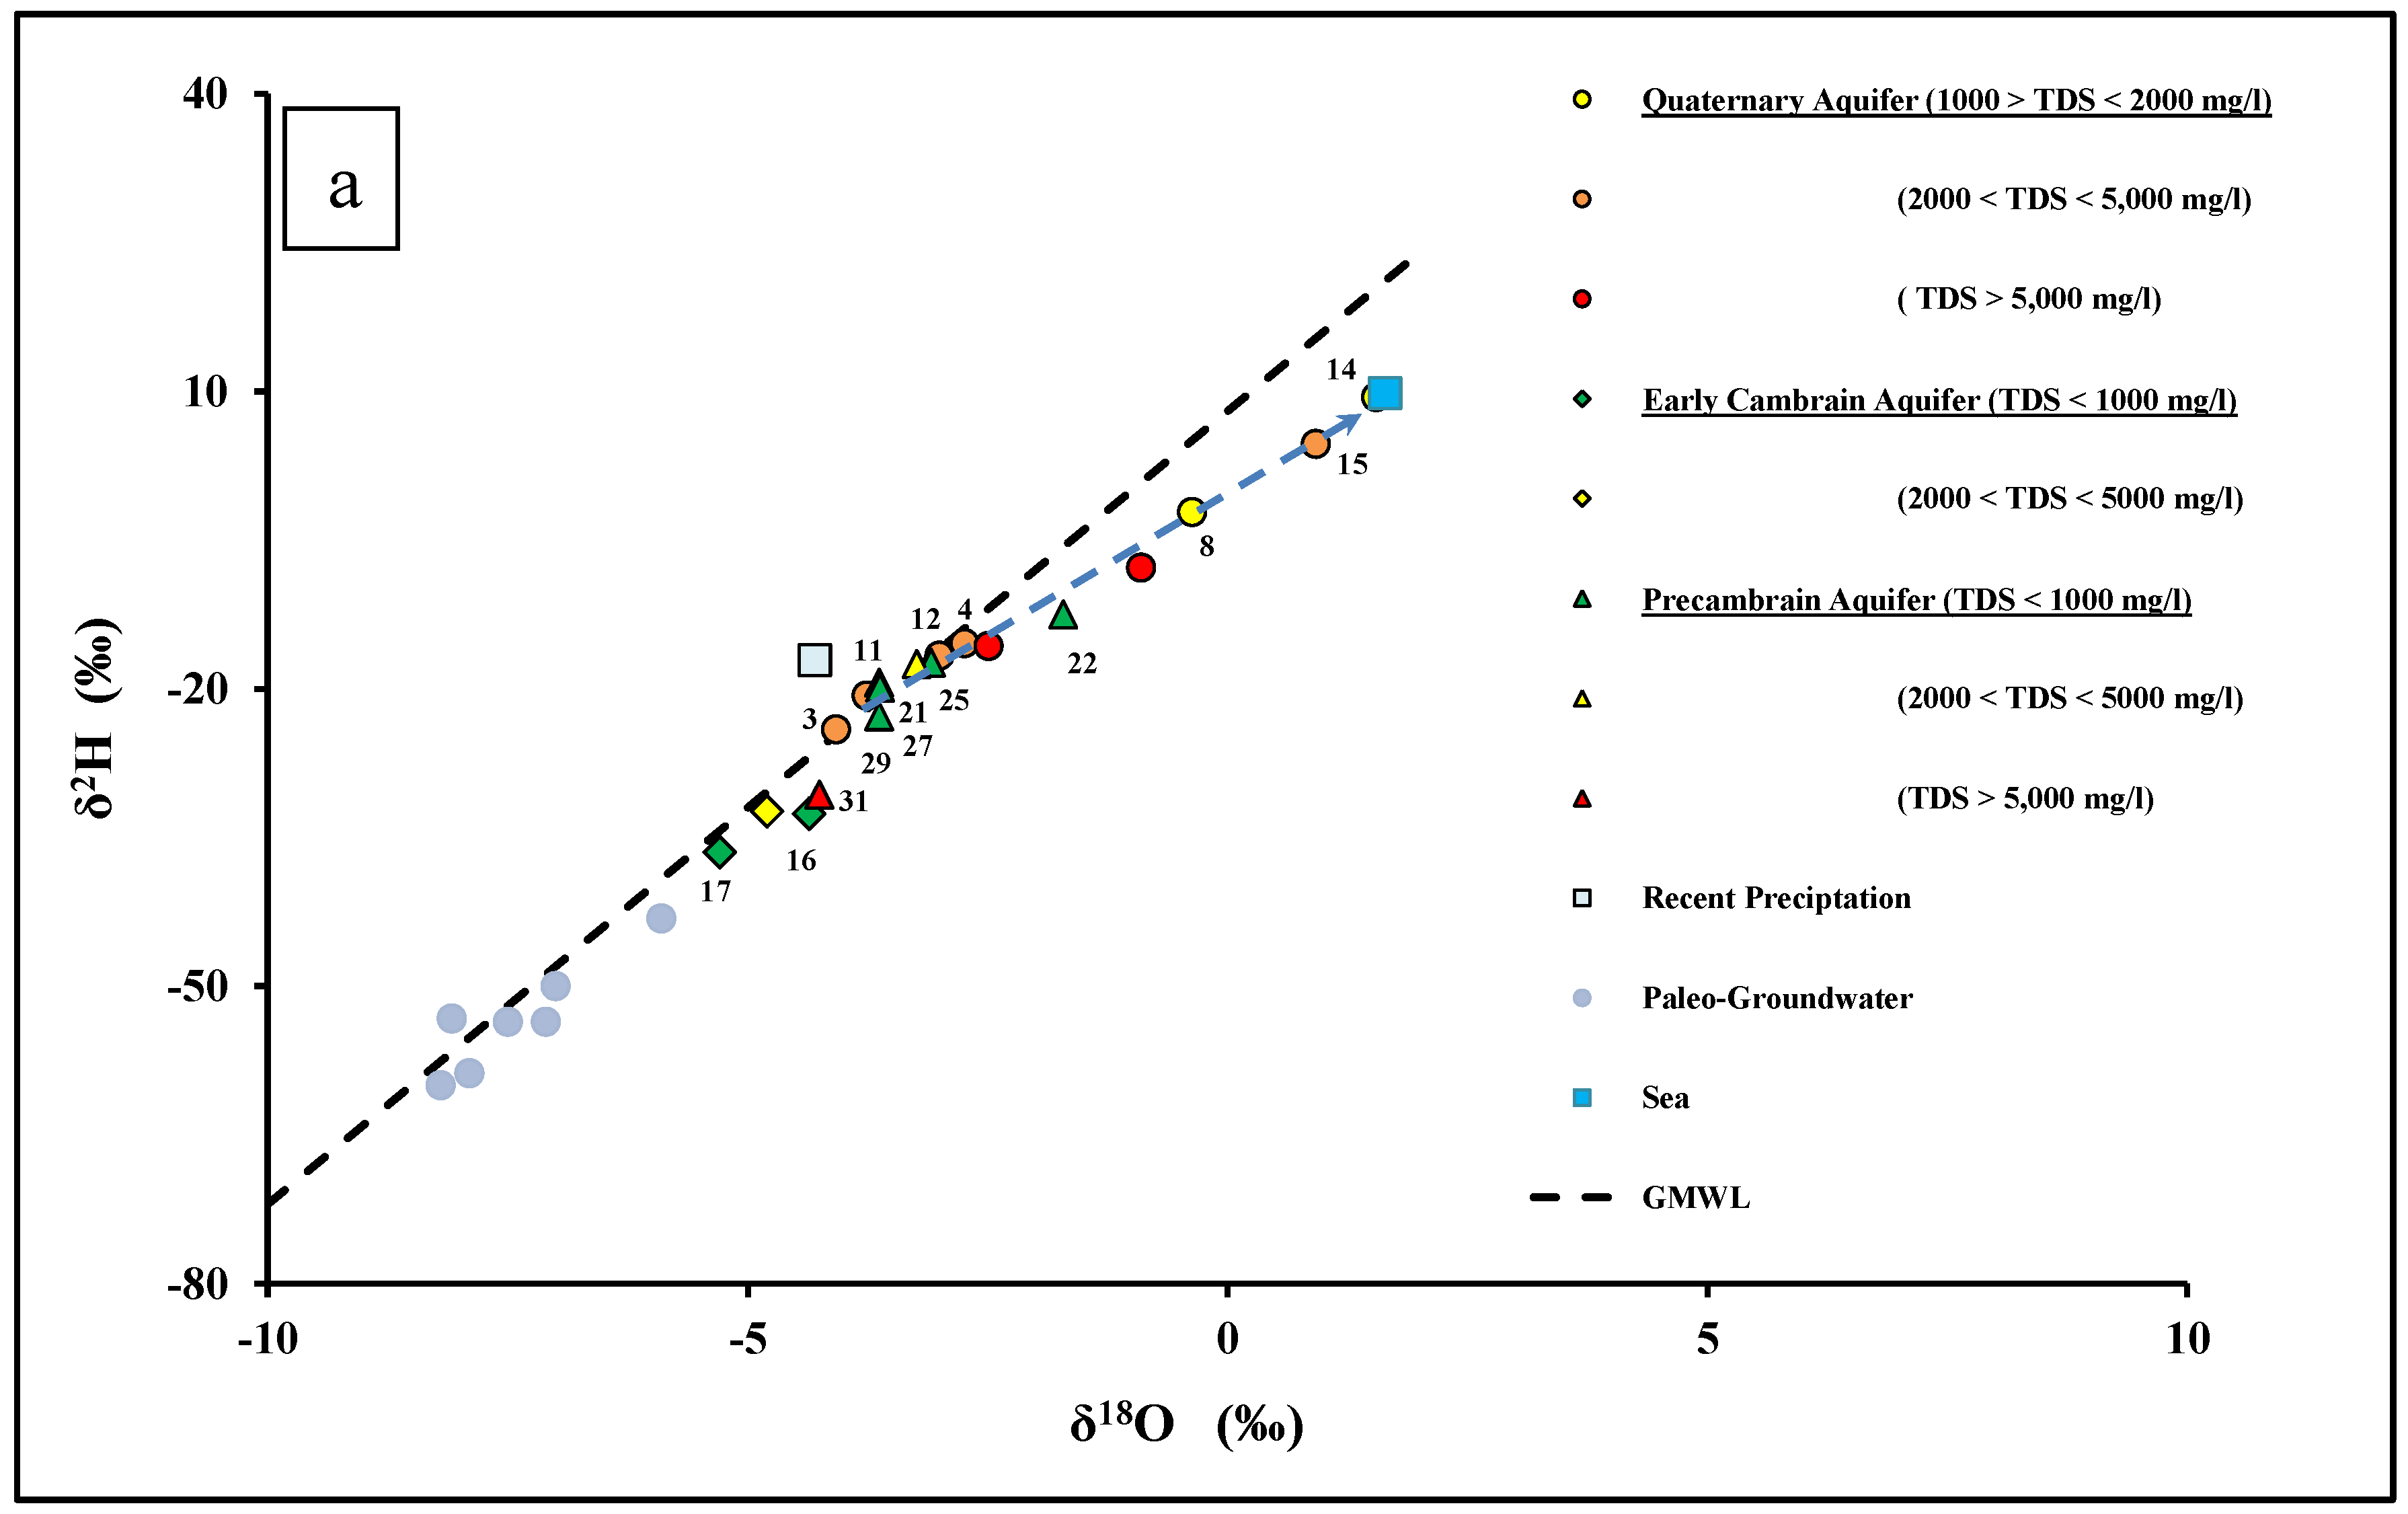
4.2. Sources of Groundwater Recharge

Oxygen and hydrogen isotopes of the water molecule are ideal and widely used tracers to understand the hydrogeological processes such as precipitation, groundwater recharge, and basin hydrology. Importantly, they are not involved in geochemical reactions and are sensitive to physical processes such as groundwater mixing and evaporation [25,76].
The isotopic composition of groundwater in the Dahab watershed shows great variations. The δ18O in the groundwater samples ranged from −5.29‰ (site 17) to +1.55‰ (site 14), and the δ2H ranged from −36.5‰ (site 17) to 9.4‰ (site 14). In general, the isotopically depleted groundwater samples are from higher altitudes in the Dahab watershed, where elevation attains a maximum of 1250 m above mean sea level (Figure 6a).
The isotopic signatures of groundwater in the Early Cambrian sandstone aquifer in the El-Saghier sub-basin and upstream in the Dahab watershed had the lowest δ2H and δ18O values. In Figure 6a,b, these isotopic values are from the shallow and deep groundwater wells of the Early Cambrian aquifer plot between recent precipitation and the paleo-groundwater of Sinai. The paleo-groundwater aquifers in Sinai have lower δ2H and δ18O values, which is typical for Saharan groundwaters [77,78]. Paleo-aquifers in Sinai and the Northern Sahara were replenished with strongly convective rainfall of humid episodes during the Holocene [79,80]. Globally, it has been observed that deep aquifers dominated by fossil water may contain a detectable level of recent contaminants, which points to recent meteoric recharge [81]. Similarly, groundwaters in the Early Cambrian aquifers seems to be a mixture of the recent meteoric water and paleo-groundwaters.
Specifically, the Early Cambrian aquifer receives recent recharge from the precipitation of monsoonal air masses, originating from the Indian Ocean, which are isotopically depleted relative to the weighted mean value of local precipitation in the Sinai [29,58,84,85].
Groundwater wells located upstream in the Precambrian granitic aquifer of the Saal (sites 21, 22, 24, and 25), Zaghra (site 27), and El Nasab (site 29) basins have lower δ18O and δ2H values, and plot close to the global meteoric water line (GMWL) [83]. This groundwater has isotopic signatures that are similar to the weighted mean average of local precipitation in the hyper-arid zone of Southeast and Eastern Sinai [12,69,86,87], and they also had lower bromide concentrations (Figure 6a,b). These data indicate that the main source of groundwater recharge for the Precambrian basement aquifers was from recent precipitation. However, groundwater samples located downstream in the Dahab delta have higher δ18O and δ2H values. The heavier isotopes isotopic composition measured at sites 8, 14, 15, and 22 indicate that this groundwater has experienced evaporation from shallow groundwater in an arid climate, according to Rayleigh distillation [25]. However, the heavier isotopic composition detected at sites 3, 4, 9, 11, 12, and 13 were mainly caused by mixing with seawater (δ18O = 1.64‰), as evidenced by these samples typically having relatively high bromide, chloride, and salinity.

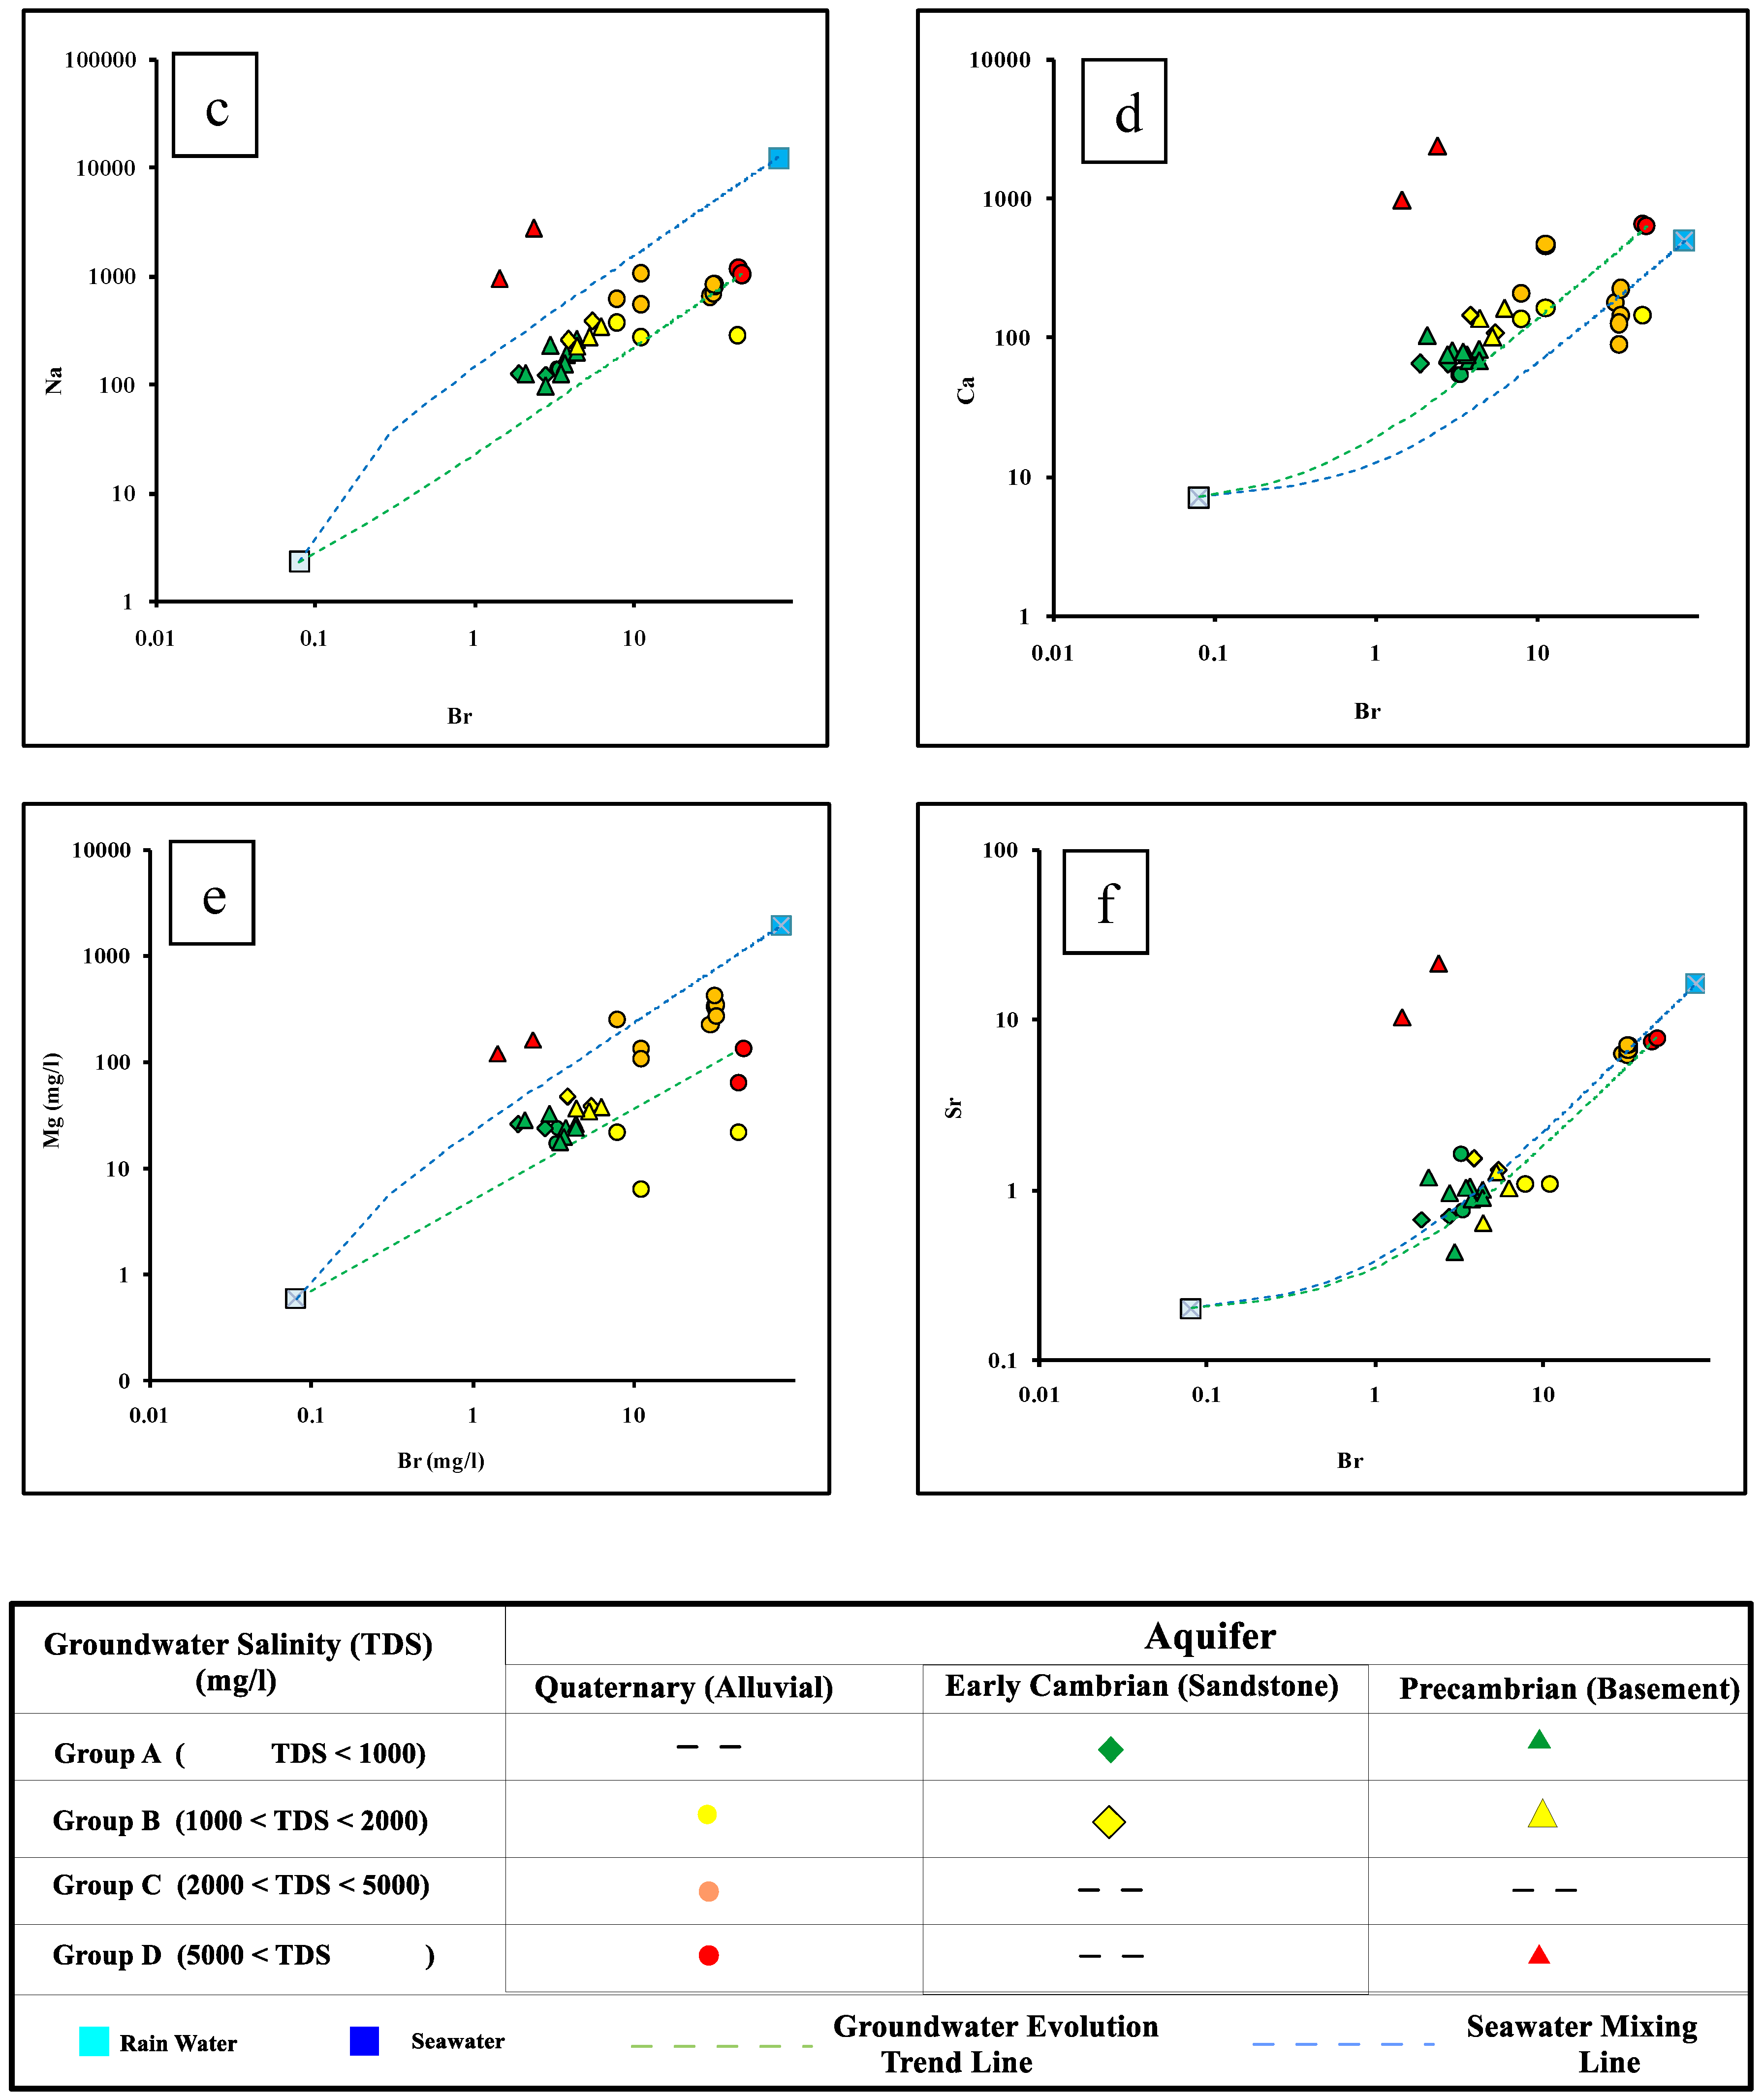
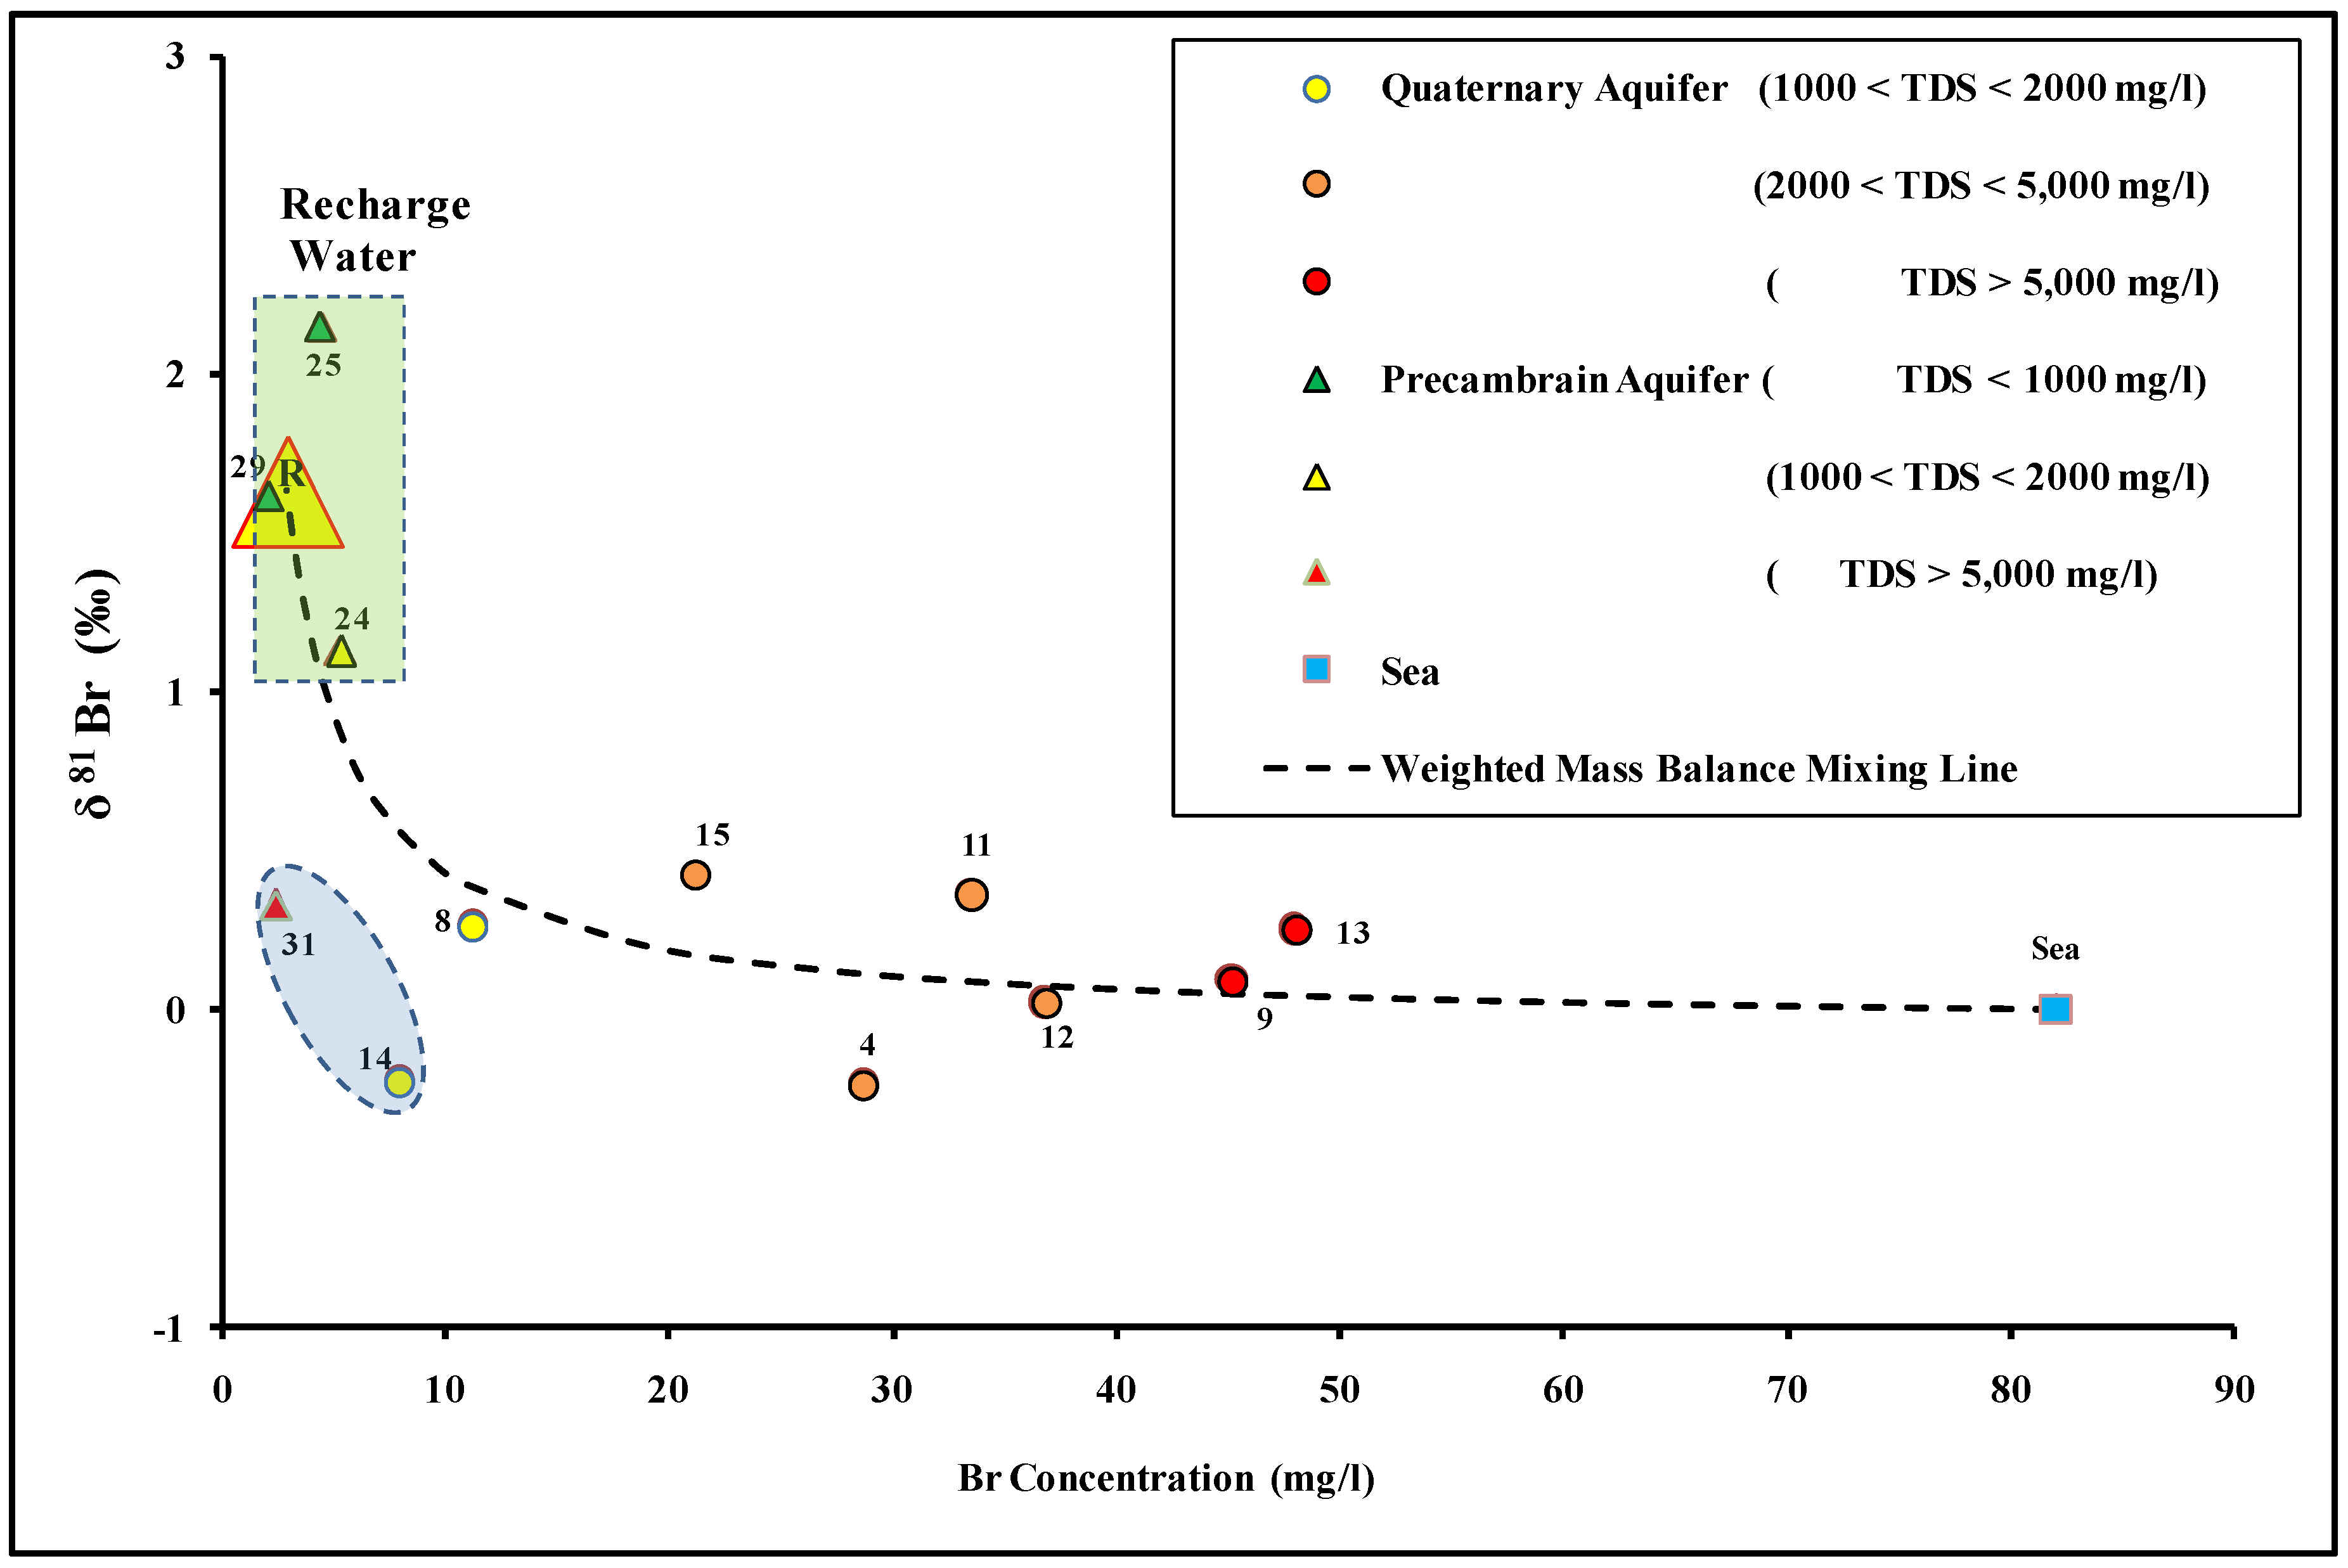
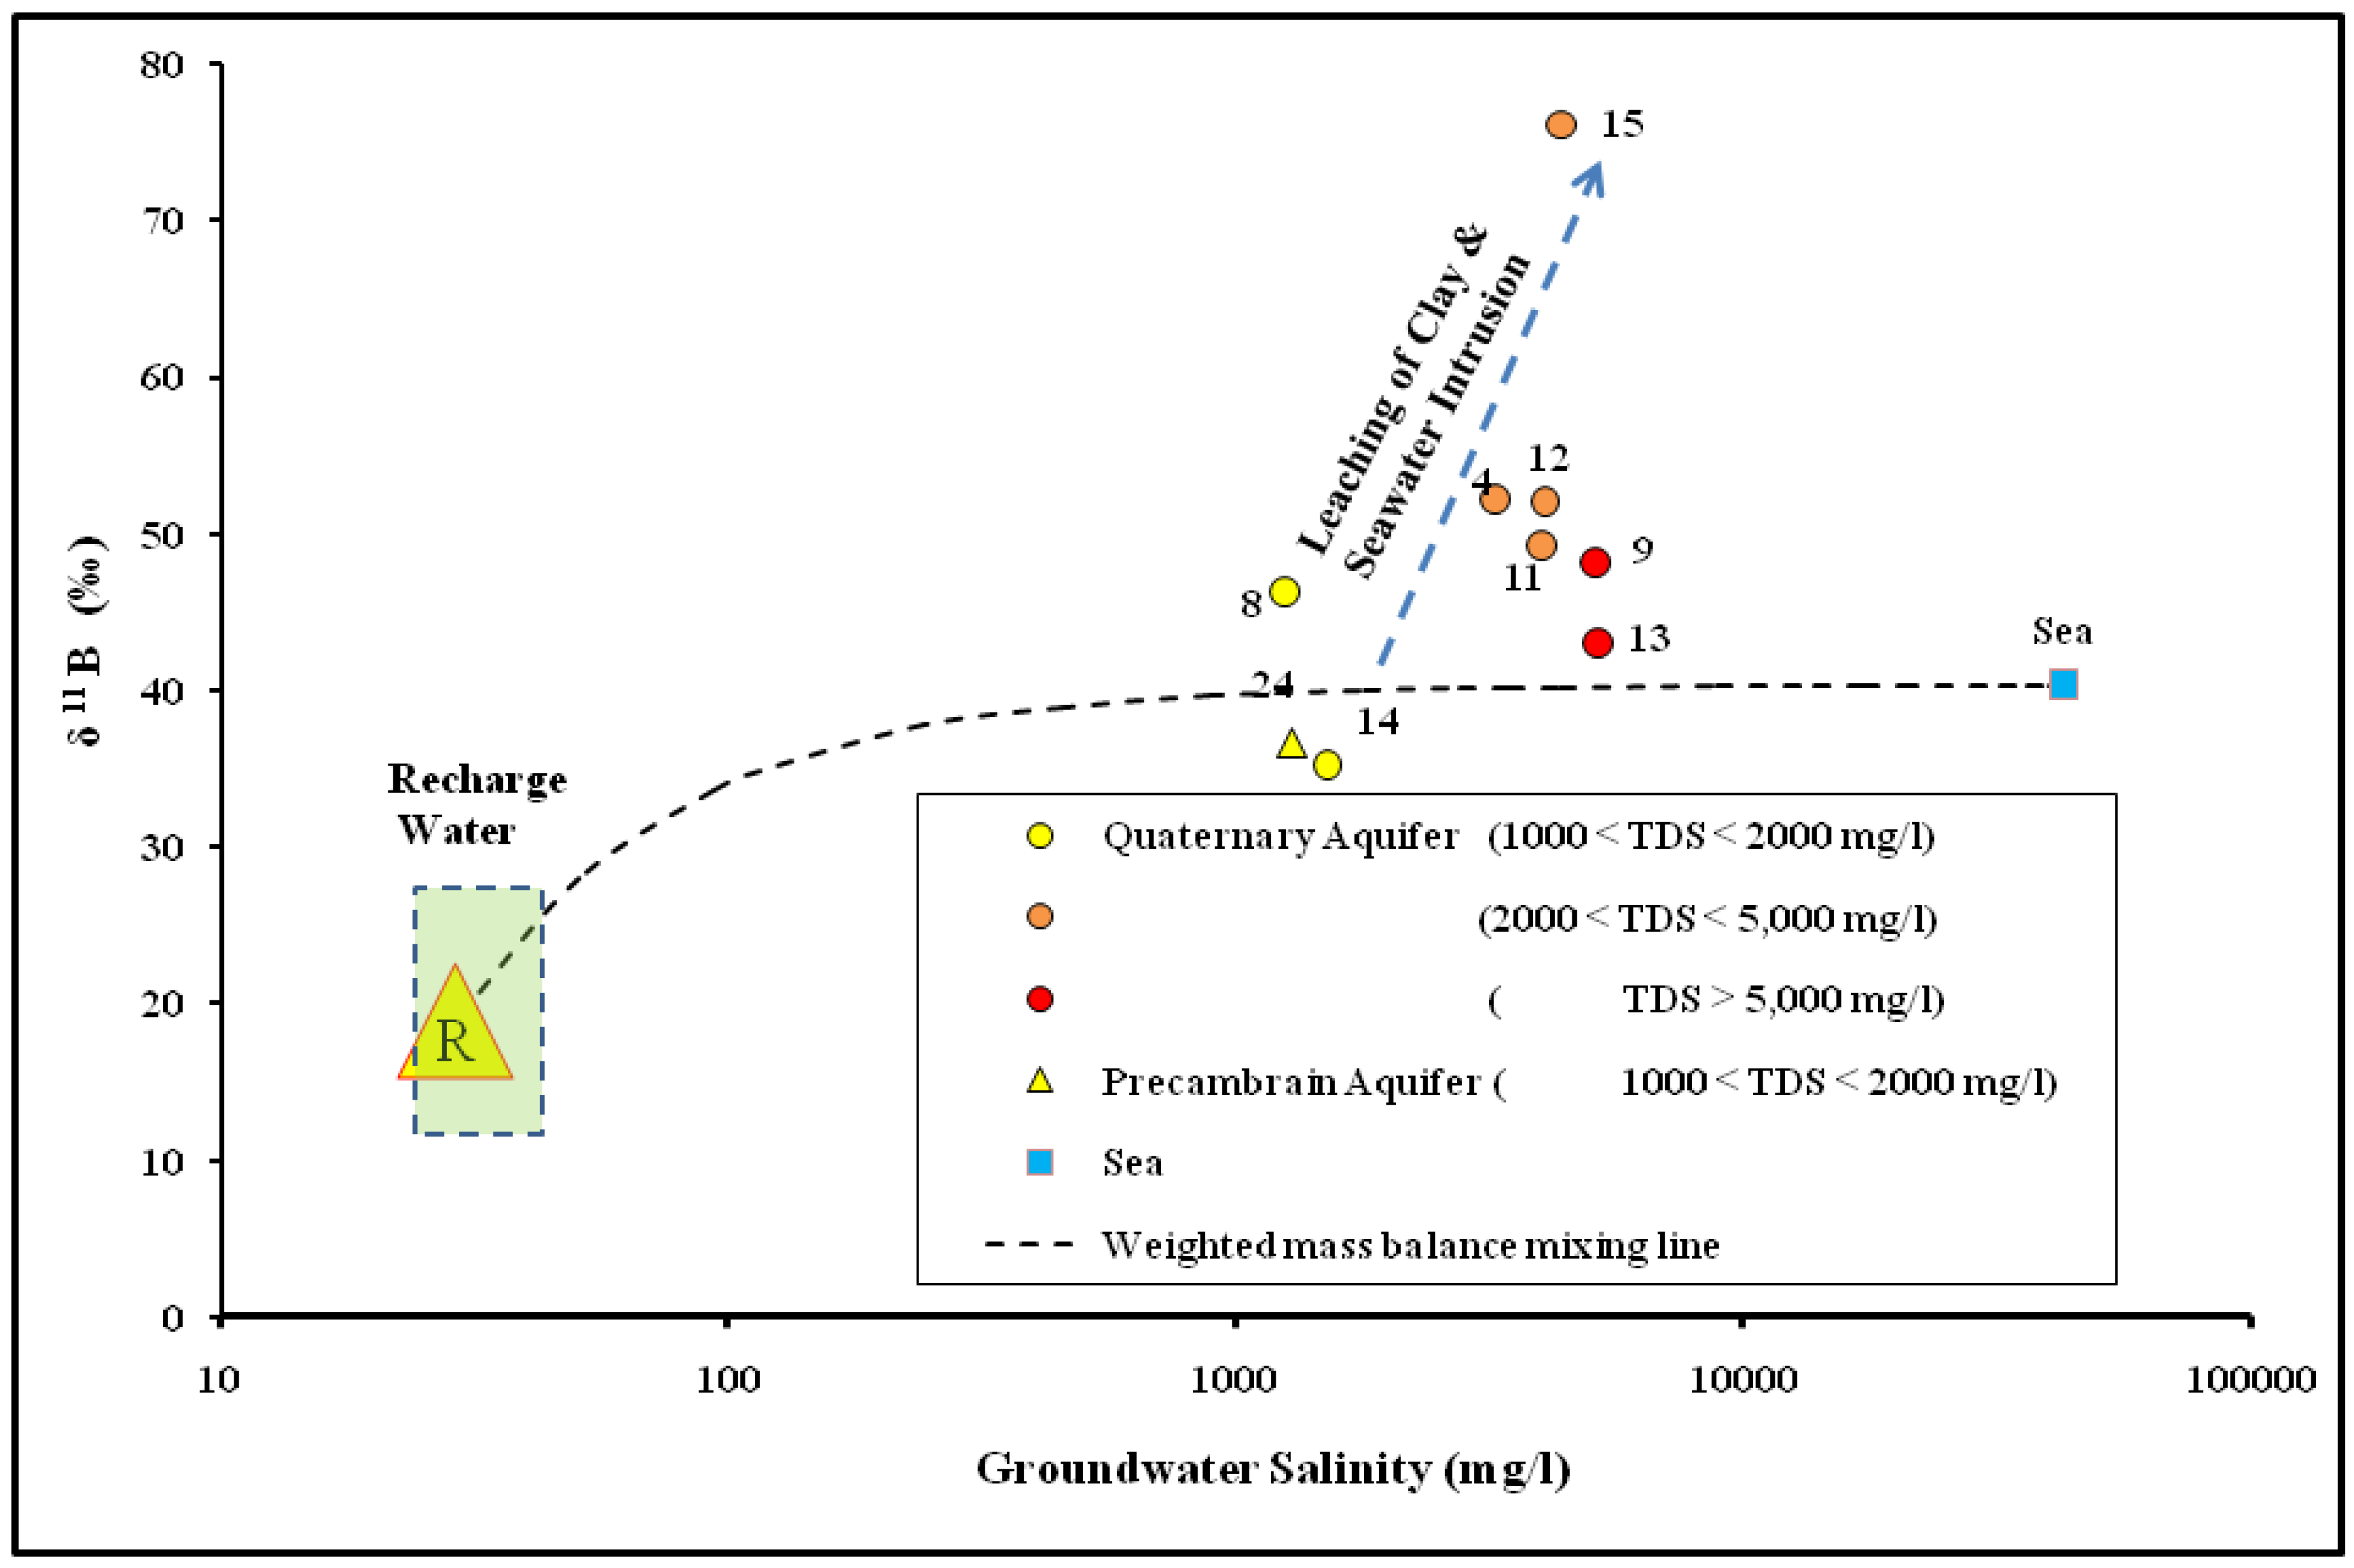
4.3. The Genesis of Groundwater Salinization

The bromine isotope has been used to demonstrate the seawater intrusion in coastal aquifers [12,88]. In this study, the δ81Br isotopic values in groundwater range between −0.24‰ (site 14) and + 2.15‰ (site 25). The groundwater samples taken from upstream in the Dahab watershed had enriched δ81Br isotopic signatures (sites 24, 25, 29, and 31) with a mean value of +2.05%. Meanwhile, the groundwater samples taken downstream in the Dahab delta (sites 4, 8, 9, and 11–15 inclusive) had depleted δ81Br isotopic signatures with a mean value of +0.11‰. The mass balance mixing lines have been used previously to indicate the water–rock interactions and assess the mixing between different end members [12,30,89]. Recharged water from upstream in the Dahab watershed was used for representative end members in the solute-weighted mass balance equations. Bromide is considered a good conservative tracer in groundwater that shows a progressive increase with groundwater salinity. Therefore, it can be a good indicator for groundwater salinization. The average bromide concentrations (mg/L) and δ81Br isotopic signatures (‰) of sites 24, 25, and 29, which were estimated to represent the recharge water (R), have been estimated to come from the upstream watershed of Dahab Basin (site R, Figure 7).
Most of the groundwater samples located downstream in the Dahab delta (except for sites 14 and 31) plot on the mass balance mixing lines extended from the average recharge water and seawater sample. This indicated that mixing with seawater is the main source of groundwater salinization in the Dahab delta. Meanwhile, the groundwater sample sites 14 and 31 have low bromide concentration and are depleted with the bromide isotopic signatures, which may be related to a third end member characterized by a low δ81Br isotopic signatures. The δ11B isotope, in conjunction with the groundwater salinity, was used to confirm the groundwater salinization source. Boron behaves as a conservative tracer in groundwater [90] and the δ11B isotope has been used to determine the source of groundwater salinization [28,34,91,92,93]. The δ11B isotope in Dahab basin groundwater ranged between 35.2‰ (site 14) and 76.1‰ (site 15). In Figure 8, the higher δ11B ratios are detected downstream in Dahab delta, while lower isotopic signatures are mostly detected upstream (site 24) and in low saline groundwater (site 14).
Groundwater samples were located in the downstream plot near the modern seawater, which is considered the main source for groundwater salinization in the Dahab delta. The higher δ11B recorded at sites 4, 8, 9, 11, 12, and 15 can be explained by the open system equilibrium fractionation process between seawater and high clay content that dominates the Dahab delta. In clay-rich coastal aquifers, 10B is adsorbed to the clay minerals, and progressively becomes extremely enriched with the δ11B [34,91,92,95,96].

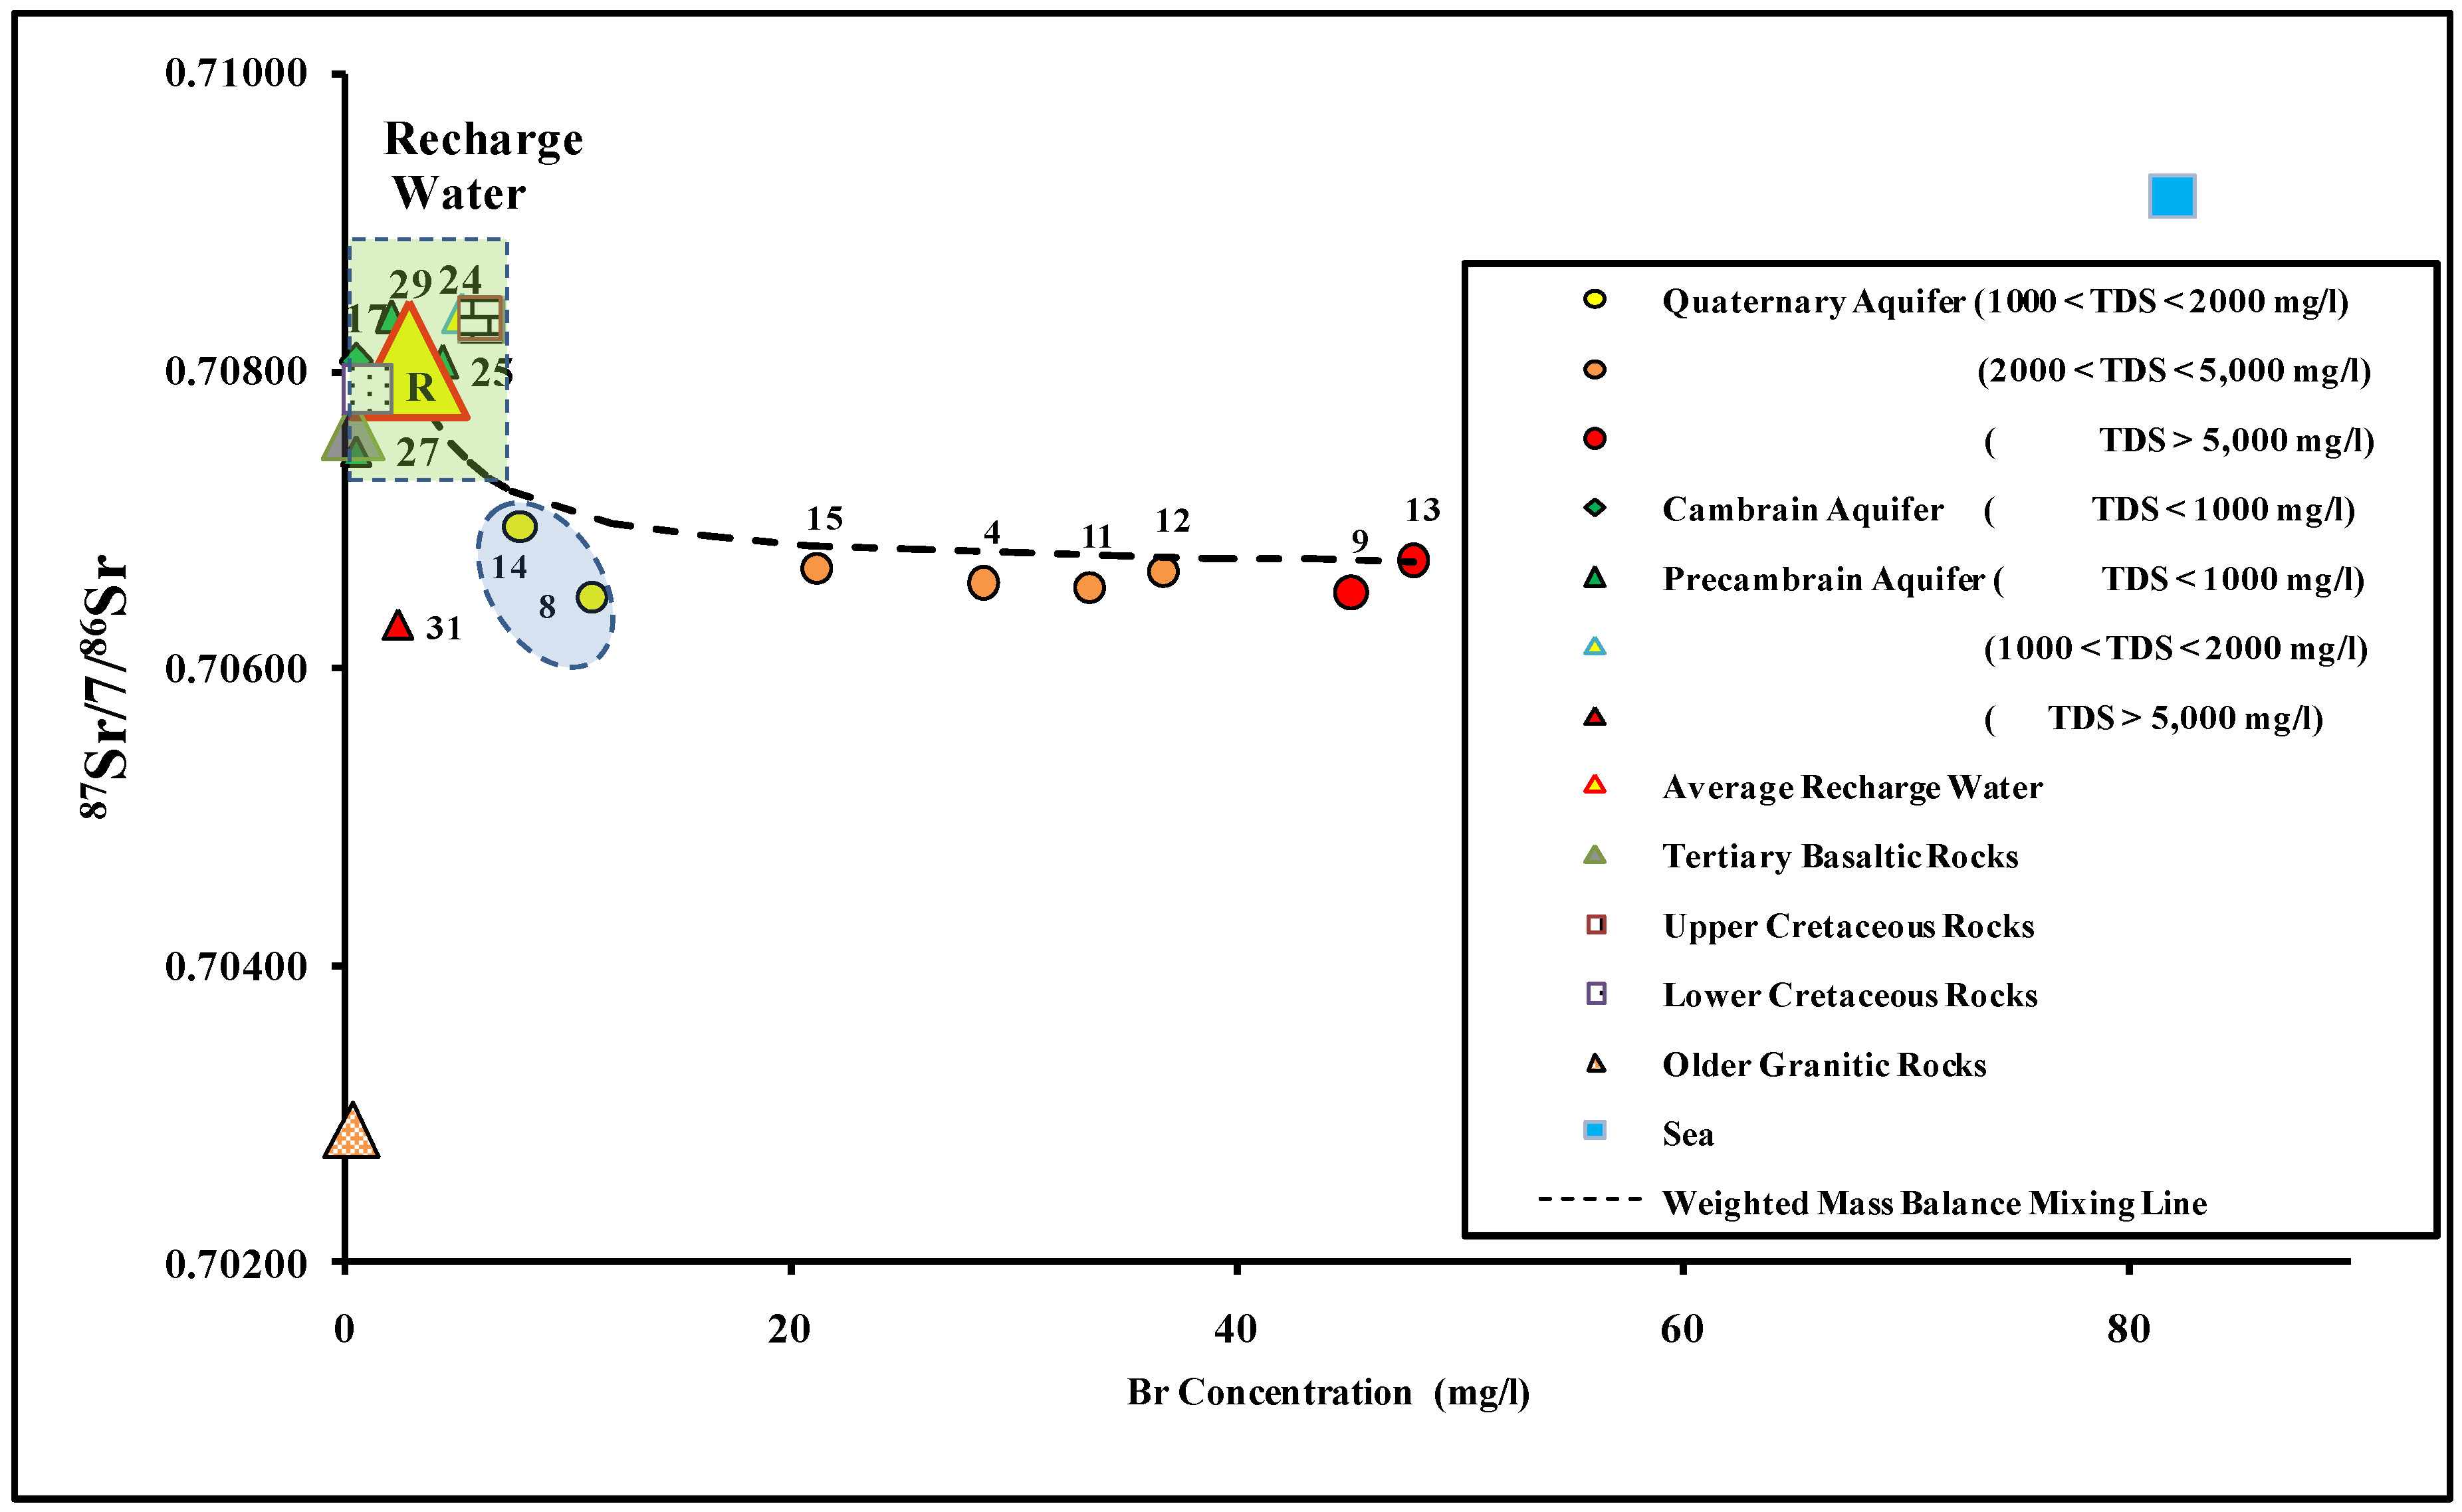
4.4. 87Sr/86Sr as an Indicator for Water–Rock Interaction

The 87Sr/86Sr isotopic ratio has been used to determine water–rock interactions, groundwater recharge sources, and mixing with seawater [97,98]. In groundwater samples of the Dahab catchment, the 87Sr/86Sr isotopic ratio ranged from 0.70630 (site 31) to 0.70839 (site 24). The strontium isotopic ratio in all groundwater samples falls into two distinct sets. The first set represents samples taken upstream, tapped from the basement aquifers. These samples have an average strontium isotope ratio of 0.707716 (n = 5 samples). The groundwater located upstream had relatively high values of the 87Sr/86Sr isotopic ratio, reflecting the water–rock interaction with the upper Cretaceous sandstone (87Sr/86Sr = 0.70835) outcrops, which form the main catchment [12]. The second set represents groundwater samples collected downstream from the Quaternary alluvial aquifer. These samples had an average 87Sr/86Sr isotopic value of 0.706631. The relatively low 87Sr/86Sr isotopic ratios fell within the range of strontium isotope in the older granitic rock (87Sr/86Sr = 0.70290) embedded in the clastic alluvial deposits and the volcanic basaltic sheets (87Sr/86Sr = 0.70760) that intrude the alluvial aquifer deposits located downstream (Figure 3b or Figure 9). In Figure 9, all groundwater samples were plotted between the three end members: the average recharge water from high in the watershed (R), the older granitic rocks, and seawater. Additionally, the groundwater samples plotted on the weighted mass balance mixing line between the average recharge water (R) and site 13, which has higher groundwater salinity as a result of seawater intrusion. Groundwater sample sites 8 and 31 deviate slightly from the mixing line trend between the recharge water and sample number 13, because of the great extent of water–rock interaction with the older granitic rocks embedded in the aquifer matrix.

4.5. Inverse Geochemical and Mixing Model

Water chemistry and isotopic data and rock forming minerals of the aquifer matrix have been used in the NETPATH model to account for the geochemical reactions and/or mixing with different waters [25,65]. In the Dahab watershed, groundwater in the basement and Quaternary aquifers flow from up-basin to down-basin [50,99], where stable isotopes δ18O and δ2H show that most groundwater in the upstream watershed has not undergone evaporation and plots close to the meteoric recharge water (Figure 6a,b). Therefore, the NETPATH model was run to simulate the mass-balance transport only through the water–rock interaction processes without evaporation or mixing. For a valid water–rock interaction model simulation, the precipitation or dissolution amount of any mineral phase should not exceed 15 (mmol/L) along the proposed flow path. An exception was made in case of modeling saline groundwater, where the differences of mineral constraint component concentrations in initial and final waters exceeded the 15 mmol/L. The NETPATH results for the groundwater located in the upper Dahab watershed suggest dissolution of calcite, gypsum, halite, plagioclase, anorthite, and microcline as groundwater flows toward the down gradient of the Dahab watershed. Additionally, calcite, dolomite, chalcedony, and illite are precipitated, with some cation exchange, where sodium in the aquifer matrix exchanges with calcium in groundwater, and vice versa (Table 2).
The NETPATH model, running from site 21 to site 22, showed slight evaporation, which was consistent with the stable isotope results shown in Figure 6. The obtained mineral saturation indices (SI) values were consistent with the mineral phase changes calculated by NETPATH in Table S3. Groundwater in the Quaternary aquifer of the delta at sites 8 and site 14 showed that evaporation from the initial recharge water comes from the watershed represented by site 21. The NETPATH results suggested the dissolution of halite, plagioclase, anorthite, and chlorite, while clay minerals (montmorillonite and illite) and dolomite were dissolved with some cation exchange, where calcium in groundwater replaces sodium in clay minerals in the aquifer matrix. The estimated evaporation factors (Ev) by the model were 3.8 at site 8 and 4.9 at site 14, and were consistent with the chloride concentration ratios between initial and final water.
The NETPATH model accounted for the mass balance transfer through water–rock interaction and estimated the seawater mixing ratios at the coast in six wells, as previously indicated by stable isotopes, δ81Br, and δ11B isotopes. The model results showed the dissolution of gypsum, microcline, and chlorite, and the precipitation of calcite, dolomite, and clay minerals with cation exchange. NETPATH also showed mixing of dilute groundwater from well 21, located in the upper Dahab watershed, with 5% to 11% of seawater.

4.6. Corrected Age Dating 14C Model

NETPATH has also been used to correct age dating of groundwater [29,65,66]. δ13C and 14C were analyzed in four groundwater samples for the purpose of correcting age in the different aquifers of the Dahab basin: one sample from the upper watershed (site 21), representing the Precambrian aquifer; one sample from the Dahab delta (site 4), representing the Quaternary aquifer; and two samples (sites 16 and 19) from the Saghier sub-basin, representing the Early Cambrian aquifer. Well site 21, located highest in the Dahab catchment, had low groundwater salinity, the most negative δ13C values, and the highest 14C pmc (Table S1 and Table 3). Therefore, site 21 was used as the initial source in the model for estimating groundwater ages. The NETPATH corrected age dating model was calibrated by changing the value of the isotopic exchange of dissolution of calcite minerals until the modeled (computed) δ13C (pmc) matched the observed value in each sample. The calibrated NETPATH model results showed that groundwater in the Quaternary and Precambrian aquifers have a corrected 14C age that is modern, so they contain recent meteoric recharge received from the mountains of the watershed. Groundwater from the Cambrian aquifers had a 14C corrected age of 2723 years (Table 3). It is important to note that the average groundwater ages determined by geochemical tracers may be vulnerable to an error when mixing of younger and old water occurs. Therefore, older groundwater in the Cambrian aquifer may be influenced by paleo-groundwater mixed with a recent groundwater recharge.

5. Conclusions

This study examined the chemistry and the stable isotopic composition of groundwater in the Dahab watershed of the Southern Sinai Peninsula. Groundwater salinity, hydro-geochemistry, and stable isotopes exhibit regular variation from the upper basin down to the coast. Groundwater samples located in the upper portion of the Dahab watershed contained fresh to brackish water and had Cl–Na and HCO3–Na water types, while groundwater located low in the basin was mainly brackish to saline waters and had Cl–Ca and Cl–Mg water types. The groundwater high in the watershed had a lower salinity and depleted isotopic signatures of δ18O and δ2H that are similar to rainwater. Groundwater in the Dahab delta was primarily derived from the upgradient and evolved from water–rock interactions and considerable percentage mixing with seawater. The stable isotopes δ18O and δ2H indicate that recent precipitation is the main source of groundwater recharge for the Quaternary and Precambrian aquifers, and mixing with seawater and water–rock interaction are considered the main salinization source for coastal groundwater. The groundwater in the Cambrian aquifer is a mixture of paleo-water and recent precipitation. Groundwater from the upper watershed was mainly enriched with the Sr and Br isotopes, whereas the down-gradient groundwater was mainly depleted because of mixing with seawater and various geochemical processes, including water–rock interaction, that may cause significant isotopic fractionation. The geochemistry and multi-isotope results suggest that the primary source of recharge to the Dahab delta is the subsurface inflow from the upstream mountains of the watershed study area. The 14C age dating indicates the groundwater in the Cambrian aquifer may be influenced by paleo-groundwater mixed with a recent groundwater recharge. The groundwater currently pumped from the Dahab watershed is being replenished by recent recharge. This resource can be managed in a more sustainable way by pumping less than what is recharged on an average annual basis.

Supplementary Materials

The Tables S1–S3 are available online at https://www.mdpi.com/2306-5338/5/3/41/s1.

Funding

This research received no external funding.

Acknowledgments

The authors would like to acknowledge the support of the Isotope Tracer and Technologies Inc. (IT2) for conducting Sr and Br isotope analyses. Also, the authors are grateful to Randy Bassett for conducting the Boron isotope (δ11B) analysis, and Simon Poulson, at the Department of Geological Sciences and Engineering, University of Nevada, Reno, for conducting the stable isotopic analyses. The authors also thank Sean Thomas for supplementary assistant with the edits and language.

Conflicts of Interest

The authors declare no conflict of interest.

References

  1. Sherif, M.M.; Singh, V.P. Saltwater Intrusion. In Hydrology of Disasters; Water Science and Technology Library Series; Kluwer Academic Publishers: Alphen aan den Rijn, The Netherlands, 1996; pp. 269–319. [Google Scholar]
  2. Bear, J.; Cheng, A.H.-D.; Sorek, S.; Ouazar, D.; Herrera, I. Seawater Intrusion in Coastal Aquifers—Concepts, Methods and Practices; Springer: Berlin, Germany, 1999; ISSN 0924-6118. [Google Scholar]
  3. Gaaloul, N. GIS-Based Numerical Modeling of Aquifer Recharge and Salt Water Intrusion in Arid South Eastern Tunisia. J. Hydrol. Eng. 2012, 19, 777–789. [Google Scholar] [CrossRef]
  4. Gnanachandrasamy, G.; Ramkumar, T.; Venkatramanan, S.; Chung, S.Y.; Vasudevan, S. Identification of saline water intrusion in part of Cauvery deltaic region, Tamil Nadu, Southern India: Using GIS and VES methods. Mar. Geophys. Res. 2016, 37, 113–126. [Google Scholar] [CrossRef]
  5. Eissa, M. Integrative management of saltwater intrusion in poorly-constrained semiarid coastal aquifer at Ras El-Hekma, Northwestern Coast, Egypt. Groundw. Sustain. Dev. 2018, 6, 57–70. [Google Scholar] [CrossRef]
  6. Zhao, Q.; Su, X.; Kang, B.; Zhang, Y.; Wu, X.; Liu, M.A. Hydrogeochemistry and multi-isotope (Sr, O, H, and C) study of groundwater salinity origin and hydrogeochemcial processes in the shallow confined aquifer of northern Yangtze River downstream coastal plain, China. Appl. Geochem. 2017, 86, 49–58. [Google Scholar] [CrossRef]
  7. Paniconi, C.; Khalifi, I.; Lecca, G.; Giacomeli, A.; Tarhouni, J. Modeling and Analysis of Seawater Intrusion in the Coastal Aquifer of Eastern Cap-Bon. Tunisia. Transp. Porous Media 2001, 43, 3–28. [Google Scholar] [CrossRef]
  8. El-Kiki, M.F.; Eweida, E.A.; El Refeai, A.A. Hydrogeology of the Aqaba rift border province. In Proceedings of the 3rd Conference of the Geology and Sinai Development, Ismailia, Egypt, 1992; pp. 91–100. [Google Scholar]
  9. El-Refeai, A.A. Water Resources of Southern Sinai Egypt Geomorphological and Hydrogeological Studies. Ph.D. Thesis, Faculty of Science Cairo University, Cairo, Egypt, 1992; 357p. [Google Scholar]
  10. Awwad, R.A.; Olsthoorn, T.N.; Zhou, Y.; Uhlenbrook, S.; Smidt, E. Optimum Pumping-Injection System for Saline Groundwater Desalination in Sharm El Sheikh; Water Mill Working Paper No. 11; Water Mill: Lexington, MA, USA, 2008; 21p. [Google Scholar]
  11. Isawi, H.; El-Sayed, M.H.; Eissa, M.; Shouakar-Stash, O.; Shawky, H.; Abdel Mottaleb, M.S. Integrated geochemistry, isotopes, and geostatistical techniques to investigate groundwater sources and salinization origin in the Sharm EL-Shiekh Area, South Sinia, Egypt. Water Air Soil Pollut. 2016, 227, 151. [Google Scholar] [CrossRef]
  12. Eissa, M.A.; Thomas, J.M.; Pohll, G.; Shouakar-Stash, O.; Hershey, R.L.; Dawoud, M. Groundwater recharge and salinization in the arid coastal plain aquifer of the Wadi Watir delta, Sinai, Egypt. Appl. Geochem. 2016, 71, 48–62. [Google Scholar] [CrossRef]
  13. Missimer, T.M.; Ghaffour, N.; Abdullah, H.A.D.; Rachman, R.; Maliva, R.G.; Amy, G. Subsurface intakes for seawater reverse osmosis facilities: Capacity limitation, water quality improvement, and economics. Desalination 2013, 322, 37–51. [Google Scholar] [CrossRef]
  14. Edmunds, W.M. Renewable and non-renewable groundwater in semi-arid and arid regions. Dev. Water Sci. 2003, 50, 265–280. [Google Scholar]
  15. Vengosh, A.; Kloppmann, W.; Marie, A.; Livshitz, Y.; Gutierrez, A.; Bana, M.; Guerrot, C.; Pankratov, I.; Ranan, H. Sources of salinity and boron in Gaza Strip: Natural contaminant flow in southern Mediterranean Coastal aquifer. Water Res. 2005, 41, W01013. [Google Scholar] [CrossRef]
  16. Bennetts, D.A.; Webb, J.A.; Stone, D.J.M.; Hill, D.M. Understanding the salinization process for groundwater in an area of south-eastern Australia, using hydrochemical and isotopic evidence. J. Hydrol. 2006, 323, 178–192. [Google Scholar] [CrossRef]
  17. Issar, A.; Gilad, D. Groundwater flow system in the arid crystalline province of southern Sinai. Hydrol. Sci. J. 1982, 27, 309–325. [Google Scholar] [CrossRef]
  18. Edmunds, W.M.; Walton, N.R.G. A geochemical and isotopic approach torecharge evaluation in semi-arid zones, past and present. In Arid-ZoneHydrology, Investigations with Isotope Techniques; International Atomic Energy Agency: Vienna, Austrian, 1980; pp. 47–68. [Google Scholar]
  19. Simmers, I. Natural groundwater recharge estimation in (semi-)arid zones; some state of-the-art observations. In Sahel Forum on the State-of the-Art of Hydrology and Hydrogeology in the Arid and Semi-Arid Areas of Aji-Ica; Stout, G.E., Demissie, M., Eds.; UNESCO: New York, NY, USA, 1990; pp. 373–386. [Google Scholar]
  20. Edmunds, W.M.; Gaye, C.B. Estimating the spatial variability of groundwater recharge in the Sahel using chloride. J. Hydrol. 1994, 156, 47–59. [Google Scholar] [CrossRef]
  21. Edmunds, W.M. Characterization of groundwaters in semi-arid and arid zones using minor elements. In Groundwater Quality; Nash, H.G., McCall, J., Eds.; Chapman & Hall: London, UK, 1995; pp. 19–30. [Google Scholar]
  22. Gat, J.R.; Mazor, E.; Tzur, Y. The stable isotope composition of mineral waters in the Jordan Rift Valley, Israel. J. Hydrol. 1969, 76, 334–352. [Google Scholar] [CrossRef]
  23. Gammonsa, C.H.; Poulsonb, S.R.; Pellicoria, D.A.; Reedc, P.J.; Roeslera, A.J. The hydrogen and oxygen isotopic composition of precipitation, evaporated mine water, and river water in Montana, USA. J. Hydrol. 2006, 328, 319–330. [Google Scholar] [CrossRef]
  24. Guay, B.E.; Eastoe, C.J.; Bassett, R.; Long, A. Identifying sources of groundwater in the lower Colorado River Valley, USA, with δ18O, δD, and 3H: Implications for river water accounting. J. Hydrogeol. 2006, 14, 146–158. [Google Scholar] [CrossRef]
  25. Clark, I.D.; Fritz, P. Environmental Isotopes in Hydrogeology; Lewis Publishers: Boca Raton, FL, USA, 1997. [Google Scholar]
  26. Mook, G.W. Environmental Isotopes in the Hydrological Cycle; IHP-V Technical Document in Hydrology No. 39 VI; UNESCO: Paris, France, 2001. [Google Scholar]
  27. Albarede, F.; Michard, A. Evidence for slowly changing 87Sr/86Sr in runoff from freshwater limestones of southern France. Chem. Geol. 1987, 64, 55–65. [Google Scholar] [CrossRef]
  28. Casanova, J.; Negrel, P.H.; Kloppmann, W.; Aranyossy, J.F. Origin of deep saline groundwaters in the Vienne granitoids (France). Geofluids 2001, 1, 91–101. [Google Scholar] [CrossRef]
  29. Eissa, M. Groundwater Resource Sustainability in Wadi Watir Watershed, Sinai, Egypt. Ph.D. Thesis, Hydrogeology University of Nevada, Reno, NV, USA, August 2012. UMI Number: 3539186. [Google Scholar]
  30. Faure, G. Principles of Isotope Geology, 2nd ed.; Wiley: New York, NY, USA, 1986. [Google Scholar]
  31. Davidson, G.R.; Bassett, R.L. Application of boron isotopes identifying contaminants such as fly ash leachate in groundwater. Environ. Sci. Technol. 1993, 27, 172–176. [Google Scholar] [CrossRef]
  32. Quast, K.W.; Lansey, K.; Arnold, R.; Bassett, R.L.; Rincon, M. Boron Isotopes as an Artificial Tracer. Groundwater 2006, 44, 453–466. [Google Scholar] [CrossRef]
  33. Du, Y.; Ma, Y.; Chen, L.; Shan, H.; Xiao, C.; Lu, Y.; Liu, C.; Cai, H. Genesis of salinized groundwater in Quaternary aquifer system of the coastal plain, Laizhou Bay, China: Geochemical evidence, especially from bromine stable isotope. Appl. Geochem. 2015, 59, 155–165. [Google Scholar] [CrossRef]
  34. Vengosh, A.; Chivas, A.R.; McCulloch, M.T.; Starisnky, A.; Kolodny, Y. Boron isotope geochemistry of Australian salt lakes. Geochim. Cosmochim. Acta 1991, 55, 2591–2606. [Google Scholar] [CrossRef]
  35. Stotler, R.L.; Frape, S.K.; Shouakar-Stash, O. An isotopic survey of d81Br and d37Cl of dissolved halides in the Canadian and Fennos Canadian Shields. Chem. Geol. 2010, 274, 38–55. [Google Scholar] [CrossRef]
  36. Sherif, M.M. The Nile Delta Aquifer in Egypt. In Theory and Application of Transport in Porous Media; Kluwer Academic Publishers: Dordrecht, The Netherlands, 1999; pp. 559–590. [Google Scholar]
  37. Surour, A.A.; EL-Kammar, A.A.; Arafa, E.H.; Korany, H.M. Dahab stream sediments, southeastern Sinai, Egypt: A potential source of Gold, magnetite, and zircon. J. Geochem. Explor. 2003, 77, 25–43. [Google Scholar] [CrossRef]
  38. Soliman, F.A. Geology of WadiSa’al Area with Special Emphasis of Metamorphism and Tectonics, Central Sinai of Egypt. Ph.D. Thesis, Faculty of Science, Suez Canal University, Ismailia, Egypt, 1 January 1986; 240p. [Google Scholar]
  39. Hassen, I.S.; Ibrahim, S.K.; El Emer, P.M. Evolution and origin of the metavolcanics at WadiSaâl area, south Sinai, Egypt. Ann. Geol. Surv. Egypt 2004, 27, 61–78. [Google Scholar]
  40. Hassan, O.A.; Ahmed, M.H.; Arafat, S.M. Environmental land use/land cover use change detection in coastal zones of the Gulf of Aqaba, Egypt, using multi-temporal Landsat imagery. Egypt. J. Remote Sens. Space Sci. 2005, 8, 21–38. [Google Scholar]
  41. El-Sheshtawy, Y.A.; Aly, M.M.; Ahmed, A.M. Geochemistry and tectonic environments of the granite-pegmatite dikes around Wadi El-Markh area, Sinai, Egypt. Mansoura Sci. Bull. 1988, 15, 205–226. [Google Scholar]
  42. Wassif, N.A. Palaeomagnetism and opaque mineral oxides of some basalt from west central Sinai, Egypt. Geophys. J. Int. 1991, 104, 319–330. [Google Scholar] [CrossRef]
  43. El-Metwally, A.A.; El-Assay, I.E.; Essawy, M.A.; El-Mowafy, A.A. Petrological, structural and geochemical studies on the basement rocks of Gabal Um Zariq-Wadi Kid area, southeastern Sinai, Egypt. Egypt. J. Geol. 1999, 43, 147–180. [Google Scholar]
  44. Egyptian Geological Survey and Mining Authority (EGSMA). Geological Map of South Sinai Scale 1:250,000; Egyptian Geological Survey Annal; Egyptian Geological Survey and Mining Authority: Cairo, Egypt, 1994.
  45. CONOCO. Geological Map of Egypt, (Scale 1:500,000); Conoco Continental Oil Company: Houston, TX, USA, 1987. [Google Scholar]
  46. Khalifa, I.H.; Soliman, F.A.; Ibrahim, S.K.; El-Bialy, M.Z. Petrological and petrochemical characteristics of some old granites in South Sinai. In Proceedings of the 7th Conference of Sinai for Development, Ismailia, Egypt, June 2004; pp. 81–92. [Google Scholar]
  47. Omran, A.; Hahn, M.; Hochschild, V.; El-Rayes, A.; Geriesh, M. Lithological Mapping of Dahab Basin, South Sinai, Egypt, Using ASTER Data; PFG Photogrammetrie, Fernerkundung, Geoinformation; Springer: Heidelberg, Germany, 2012; pp. 711–726. [Google Scholar]
  48. Hassan, A.A. A new Carboniferous occurrence in the Abu Durba, Sinai, Egypt. In Proceedings of the 6th Arabian Petroleum Conference, Baghdad, Iraq, 6–13 March 1967; Volume 2. [Google Scholar]
  49. Said, R. Explanatory Notes to Accompany the Geological Map of Egypt; Ministry of Industry, Petroleum, and Mineral Wealth, Geological Survey of Egypt and Mining Authority: Cairo, Egypt, 1971; 123p.
  50. Shabana, A.R. Geology of Water Resources in Some Catchments Areas Draining in the Gulf of Aqaba, Sinai-Egypt. Ph.D. Thesis, Faculty of Science Ain Shams University, Cairo, Egypt, September 1998; 246p. [Google Scholar]
  51. Issawi, B.; Jux, U. Contribution on the stratigraphy of the Paleozoic rocks in Egypt. Geol. Surv. Egypt 1982, 64, 28. [Google Scholar]
  52. Abdel-Rahman, I.F. Physical and chemical characteristics of silica sand deposits of Wadi Watir region, Sinai. Acta Miner. Petrogr. Szeged 2002, 43, 79–83. [Google Scholar]
  53. El-Shazly, E.M.; Abddel-Hady, M.A.; El-Ghawaby, M.A.; El-Kassas, I.A.; ElShazly, M.M. Geology of Sinai Peninsula from ERTS-1 Satellite Images; Remote Sensing Research Project, Academy of Scientific Research and Technology: Cairo, Egypt, 1974; p. 20. [Google Scholar]
  54. Eyal, M.; Bartov, Y.; Shimron, A.E.; Bentor, Y.K. Sinai Geologic Map, Scale 1: 500,000; Contour interval 10 gammas, based on four separate surveys; Institute for Petroleum Research and Geophysics, and Ministry of Energy and Infrastructure, Administration for Research in Earth Sciences: Holon, Israel, 1980. [Google Scholar]
  55. El Rayes, A. Hydrogeological Studies of Saint Katherine Area, South Sinai, Egypt. Master’s Thesis, Suez Canal University, Ismailia, Egypt, January 1992; p. 95. [Google Scholar]
  56. Japan International Cooperation Agency (JICA); Water Resources Research Institute (WRRI). South Sinai Groundwater Resources Study in the Arab The Republic of Egypt; Main Report; Pacific Consultants International: Tokyo, Japan, 1999.
  57. Greenwood, N. A Physical Geography of the Sinai Peninsula; University of Texas Press: Austin, TX, USA, 1997; ISBN 78-0-292-72799-1. [Google Scholar]
  58. Abd El Samei, S.G.; Sadek, M.A. Groundwater recharge and flow in the lower Cretaceous Nubian sandstone aquifer in the Sinai Peninsula, using isotopic techniques and hydrochemistry. Hydrogeol. J. 2001, 9, 378–389. [Google Scholar]
  59. Rainwater, F.H.; Thatcher, L.L. Methods for Collection and Analysis of Water Samples; U.S. Geological Survey Water Supply; Paper 1454; USGS: Washington, DC, USA, 1960.
  60. Fishman, M.J.; Friedman, L.C. Methods for determination of inorganic substances in water and fluvial sediments, U.S. Geological Survey Book 5, Chapter A1. Open-File Report 84:85–495 Denver Colorado U.S.A. for hydrogen isotope analysis. Anal. Chem. 1985, 63, 910–912. [Google Scholar]
  61. Morrison, J.; Brockwell, T.; Merren, T.; Fourel, F.; Phillips, A.M. On-line high-precision stable hydrogen isotopic analyses on nanoliter water samples. Anal. Chem. 2001, 73, 3570–3575. [Google Scholar] [CrossRef] [PubMed]
  62. Epstein, S.; Mayeda, T.K. Variations of 18O content of waters from natural sources. Geochim. Cosmochim. Acta 1953, 4, 213–224. [Google Scholar] [CrossRef]
  63. McNutt, R.H.; Frape, S.K.; Fritz, P.; Jones, M.G.; MacDonald, I.M. The 87Sr/86Sr values of Canadian shield brines and fracture minerals with applications to groundwater mixing, fracture history, and geochronology. Geochim. Cosmochim. Acta 1990, 54, 202–215. [Google Scholar] [CrossRef]
  64. Shouakar-Stash, O.; Frape, S.K.; Drimmie, R.J. Determination of bromine stable isotopes using continuous-flow isotope ratio mass spectrometry. Anal. Chem. 2005, 77, 4027e4033. [Google Scholar] [CrossRef] [PubMed]
  65. Plummer, L.N.; Prestemon, E.C.; Parkhurst, D.L. NETPATH: An interactive code for interpreting NET geochemical reactions from chemical and isotopic data along a flow PATH. In Proceedings of the International Symposium on Water-Rock Interaction 7th Park City Utah, Rotterdam, Balkema, 9–23 July 1992; Kharaka, Y., Maest, A.S., Eds.; pp. 239–242. [Google Scholar]
  66. Hershey, R.L.; Heilweil, V.M.; Gardner, P.; Lyles, B.; Earman, S.; Thomas, J.; Lundmark, K.W. Ground-Water Chemistry Interpretations Supporting the Basin and Range Regional Carbonate-Rock Aquifer System (BARCAS) Study, Eastern Nevada and Western Utah; DHS Publication No. 41230; Desert Research Institute, Nevada System of Higher Education: Reno, NV, USA; US Geological Survey: Reston, VA, USA, 2007.
  67. Chung, Y.S. Hydrogeochemical Processes of Groundwater Using Multivariate Statistical Analyses and Inverse Geochemical Modeling in Samrak Park of Nakdong River Basin, Korea. In Proceedings of the EGU General Assembly Conference Abstracts, Vienna, Austria, 12–17 April 2015. [Google Scholar]
  68. Said, M.M. Geochemistry of Groundwater in Coastal Areas, South Sinai, Egypt. Ph.D. Thesis, Faculty of Science, Ain Shams University, Cairo, Egypt, September 2004; 820p. [Google Scholar]
  69. Eissa, M.A.; Thomas, J.M.; Hershey, R.L.; Dawoud, M.I.; Pohll, G.; Gomaa, M.A.; Kamal, A.D. Geochemical and isotopic evolution of groundwater in the Wadi Watir Watershed, Sinai Peninsula, Egypt. Environ. Earth Sci. J. 2013. [Google Scholar] [CrossRef]
  70. Carpenter, A.B. Origin and chemical evolution of brines in sedimentary basins. In Proceedings of the SPE Annual Fall Technical Conference and Exhibition, Houston, TX, USA, 1–3 October 1978. [Google Scholar]
  71. Alcala, F.J.; Custodio, E. Using the Cl/Br ratio as a tracer to identify the origin of salinity in aquifers in Spain and Portugal. J. Hydrol. 2008, 359, 189–207. [Google Scholar] [CrossRef]
  72. Katz, B.G.; Eberts, S.M.; Kauffman, L.J. Using Cl/Br ratios and other indicators to assess potential impacts on groundwater quality from septic systems: A review and examples from principal aquifers in the United States. J. Hydrol. 2010, 397, 151–166. [Google Scholar] [CrossRef]
  73. Vengosh, A. Salinization and saline environments. Environmental geochemistry. In Treatise in Geochemistry, 2nd ed.; Sherwood Lollar, B., Ed.; Elsevier: New York, NY, USA, 2014; Volume 9, pp. 325–378. [Google Scholar]
  74. Barbecot, F.; Marlin, C.; Gibert, E.; Dever, L. Hydrochemical and isotopic characterization of the Bathonian and Bajocian coastal aquifer of the Caen area (northern France). Appl. Geochem. 2000, 15, 791–805. [Google Scholar] [CrossRef]
  75. Piper, A.M. A graphic procedure in the geochemical interpretation of water analysis. Am. Geophys. Union Trans. 1953, 25, 914–923. [Google Scholar] [CrossRef]
  76. Dansgaard, W. Stable Isotopes in Precipitation; Wiley: Hoboken, NJ, USA, 1964; Volume 16, pp. 436–468. [Google Scholar]
  77. Gat, J.R.; Gonfiantini, R. Stable Isotope Hydrology Deuterium and Oxygen-18 in the Water Cycle; Technical Reports Series No 210; IAEA: Vienna, Austria, 1981. [Google Scholar]
  78. Herczeg, A.L.; Dogramaci, S.S.; Leaney, F.W.J. Origin of dissolved salts in a large, semi-arid groundwater system: Murray Basin, Australia. Marine Freshw. Res. 2001, 52, 41–52. [Google Scholar] [CrossRef]
  79. Rosenthal, E.; Zilberbrand, M.; Livshitz, Y. The hydrochemical evolution of brackish groundwater in central and northern Sinai (Egypt) and in the western Negev (Israel). J. Hydrol. 2007, 337, 294–314. [Google Scholar] [CrossRef]
  80. Edmunds, W.M.; Wright, E.P. Groundwater recharge and palaeoclimate in the Sirte and Kufra basins, Libya. J. Hydrol. 1979, 40, 215–241. [Google Scholar] [CrossRef]
  81. Jasechko, S.; Perrone, D.; Cardenas, B.; Ferguson, G.; Gleeson, T.; Luijendijk, E.; McDonnell, J.; Taylor, R.; Wada, Y.; Kirchner, J. Global aquifers dominated by fossil groundwaters but wells vulnerable to modern contamination. Nat. Geosci. 2017, 10, 425–429. [Google Scholar] [CrossRef] [Green Version]
  82. Eissa, M.; Thomas, J.M.; Pohll, G.M.; Hershey, R.L.; Dahab, K.; Dawoud, M.; Gomaa, M.; El Shiekh, A. Groundwater resource sustainability in the WadiWatir delta, Gulf of Aqaba. Hydrogeol. J. 2013, 21, 1833–1851. [Google Scholar] [CrossRef]
  83. Craig, H. Isotopic variations in meteoric waters. Science 1961, 133, 1702–1703. [Google Scholar] [CrossRef] [PubMed]
  84. Abd El-Samei, S.G. Isotopic and Hydrochemical Studies on the Groundwater of Sinai Peninsula. Dissertation, Ain Shams University, Cairo, Egypt, 1995. [Google Scholar]
  85. Salem, W.M.; Sadek, M.A. Groundwater recharge and salinity evolution at Wadi El-ain and El-saghier basin, Gulf of Aqaba province, Sinai, Egypt. Isot. Radiat. Res. 2003, 35, 431–454. [Google Scholar]
  86. Anker, Y. Evolution of the Carbonate System in the Hyper-Arid Environment—Central Arava Area, Israel, and Its Implications for 14C-dating. Master’s Thesis, Hebrew University, Jerusalem, Israel, 19 March 2003. (In Hebrew, English Abstract). [Google Scholar]
  87. IAEA & WISER. Water Isotope System for Data Analysis, Visualization, and Electronic Retrieval. WISER Version 0.7. 2008. Available online: https://websso.iaea.org (accessed on 1 May 2013).
  88. Shouakar-Stash, O.; Alexeev, S.V.; Frape, S.K.; Alexeeva, L.P.; Drimmie, R.J. Geochemistry and stable isotope signatures, including chlorine and bromine isotopes, of the deep groundwaters of the Siberian Platform, Russia. Appl. Geochem. 2007, 22, 589–605. [Google Scholar] [CrossRef]
  89. Clark, I. Groundwater Geochemistry and Isotopes; CRC Press: Boca Raton, FL, USA, 2015. [Google Scholar]
  90. Barth, S. 11B/10B variations of dissolved boron in a freshwater–seawater mixing plume (Elbe Estuary, North Sea). Mar. Chem. 1998, 62, 1–14. [Google Scholar] [CrossRef]
  91. Vengosh, A.; Kolodny, Y.; Starisnky, A.; Chivas, A.R.; McCulloch, M.T. Coprecipitation and isotopic fractionation of boron in modem biogenic carbonates. Geochim. Cosmochim. Acta 1991, 55, 2901–2910. [Google Scholar] [CrossRef]
  92. Vengosh, A.; Starisnky, A.; Kolodny, Y.; Chivas, A.R. Boron isotope geochemistry as a tracer for the evolution of brines and associated hot springs from the Dead Sea. Geochim. Cosmochim. Acta 1991, 55, 1689–1695. [Google Scholar] [CrossRef]
  93. Negrel, P.H.; Casanova, J.; Kolppman, W.; Aranyossy, J.F. A combined isotopic tool box for the investigation of water-rock interaction: An overview of Sr, B, O, H isotopes and U-series in deep groundwaters from the Vienne granitoid (France). Water Rock Interact. 2002, 40, 1–38. [Google Scholar]
  94. Miyata, Y.; Takayuki, T.; Amakawa, H.; Uemastu, M.; Yoshiyuki, N. Boron isotope variations in the atmosphere. Tellus 2000, 52, 1057–1065. [Google Scholar] [CrossRef]
  95. Palmer, M.R.; Spivack, A.J.; Edmond, J.M. Temperature and pH controls over isotopic fractionation during adsorption of boron on marine clay. Geochim. Cosmochim. Acta 1987, 51, 2319–2323. [Google Scholar] [CrossRef]
  96. Kloppmann, W.; Petelet-Giraud, E.; Guerrot, C.; Cary, L.; Pauwels, H. Extreme boron isotope ratios in groundwater. Procedia Earth Planet. Sci. 2015, 13, 296–300. [Google Scholar] [CrossRef]
  97. McNutt, R.H.; Frape, S.K.; Fritz, P. Strontium isotopic composition of some brines from the Precambrian shield of Canada. Chem. Geol. Isot. Geosci. 1984, 2, 205–215. [Google Scholar] [CrossRef]
  98. Lyons, W.B.; Tyler, S.W.; Gaudette, H.E.; Long, D.T. The use of strontium isotopes in determining groundwater mixing and brine fingering in a playa spring zone, Lake Tyrrell, Australia. J. Hydrol. 1995, 167, 225–239. [Google Scholar] [CrossRef]
  99. Issar, A.; Nativ, R.; Karnieli, A.; Gat, J.R. Isotopic evidence of the origin of groundwater in arid zones. In Isotope Hydrology; International Atomic Energy Agency: Vienna, Austria, 1984; pp. 85–104. [Google Scholar]
Figure 1. (a) Geological map of the Dahab watershed study area; (b) geological cross section A–B.
Hydrology 05 00041 g001
Figure 2. Location map of the Dahab basin study area.
Hydrology 05 00041 g002
Figure 3. Historical record of groundwater salinity in the main well field of the Dahab delta (1986 to 1990). Site locations for these wells are indicated in Figure 2.
Hydrology 05 00041 g003
Figure 4. Logarithmic diagrams of ion relationships in groundwater of the Dahab watershed. The logarithmic plots of (a) Total dissolved solids (be) concentrations of major ions and (f) Sr versus Bromide.
Hydrology 05 00041 g004aHydrology 05 00041 g004b
Figure 5. PiperTrilinear diagram of groundwater samples tapped from different aquifers in Dahab watershed.
Hydrology 05 00041 g005
Figure 6. (a) δ18O versus δ2H for groundwater of the Dahab watershed. The rain isotopic value is the amount of weighted mean average from [29,82]; and global meteoric water line after [83]. The paleo-groundwater isotopic data are from [78,79]. (b) δ18O versus bromide for groundwaters in the Dahab watershed.
Hydrology 05 00041 g006aHydrology 05 00041 g006b
Figure 7. δ81Br plotted versus bromide concentrations values of the groundwater in the Dahab watershed.
Hydrology 05 00041 g007
Figure 8. δ11Br versus groundwater salinity of the groundwater in the Dahab watershed. The average δ11Br in rainwater is after [94].
Hydrology 05 00041 g008
Figure 9. 87Sr/86Sr versus bromide concentrations values of the groundwater in the Dahab watershed.
Hydrology 05 00041 g009
Table 1. Constraints, phases, and parameters used in NETPATH models for the El-Dabaa Area.
ConstraintsPhasesProcesses
Calcium, Carbon, Magnesium, Potassium, Sodium Sulfur, Chloride(±) Calcite, (±) Dolomite, (±) Gypsum, (+) Halite (NaCl), (−) Silica, (+) Plagioclase, (+) Microcline, (+) Chlorite (−) Na-Montmorillonite, (−) illite, (−) Mafic Montmorillonite, (±) Exchange(Evaporation and/or Mixing)
Note: (±) Dissolution and precipitation, (+) Dissolution only, (−) Precipitation only.
Table 2. Mineral Saturation indices for phases in NETPATH geochemical models. Positive values indicate over saturation; negative values indicate under saturation.
No.CalciteDolomiteGypsumSilicaCalcedonyPlgAnMclnMicaChlrtMontIllite
30.07−0.13−1.64−0.660.21−3.380.216.771.960.271.39
4−0.37−0.38−0.98−0.710.15−3.930.026.59−2.231.691.24
80.06−1.02−1.59−0.710.15−3.760.005.86−6.061.010.46
90.480.23−0.94−0.590.27−3.160.446.67−3.361.881.34
11−0.44−0.23−1.39−0.760.10−4.14−0.086.537−1.711.531.16
120.060.48−1.11−0.650.21−3.730.196.64−1.231.791.38
130.410.412−0.56−0.97−0.13−3.96−0.546.01−4.320.810.38
140.04−0.46−1.36−0.630.24−3.720.567.02−5.871.891.41
15−0.140.52−0.98−0.830.03−4.39−0.216.02−0.190.860.73
210.971.79−1.41−0.740.12−4.15−0.674.63−0.552.30−0.16
220.150.10−1.35−0.6100.25−0.840.976.5−1.580.981.16
240.480.76−1.14−0.89−0.03−4.390.386.00−2.340.060.40
250.310.41−1.40−0.640.23−3.981.156.65−1.590.871.21
270.16−0.02−1.36−0.700.17−4.010.567.06−5.421.431.26
28−0.03−0.46−1.26−0.750.11−4.13−0.955.11−4.730.990.04
290.250.20−1.21−0.610.26−3.751.097.51−4.931.931.79
300.380.50−1.41−0.700.16−4.030.976.54−1.890.711.04
310.15−0.58−0.40−0.660.20−2.910.597.20−3.812.051.60
Rain−3.72−8.27−3.47−1.39−0.52−9.62----−32.02−1.47--
Sea−0.250.42−0.55−1.27−0.41−4.80−0.286.55−0.95−0.950.46
Table 3. NETPATH modeling results (mmol/L) for the El-Dabaa Area. Positive values mean the phase is going into solution, while negative values mean the phase is being removed from the solution.
BasinAquiferInitial (Site1)Final WaterCarbon Isotopic Exchange (mmol/L)13C14CAge (year)
Computed (‰)Observed (‰)Computed (pmc)Observed (pmc)
UpstreamDahab WatershedQuaternary2144.3−5.936.026.637Moden Water
DownstreamDahabDeltaEarly Cambrian21195.4−5.35−5.4030.642Moden Water
21161.8−8.36−8.4051.4337.02723

