Article

Farmers’ Responses to Changing Hydrological Trends in the Niger Basin Parts of Benin

by
Ganiyu Titilope Oyerinde
1,*,
Emmanuel Agnidé Lawin
2 and
Ayo J. Odofin
3
1
Deaprtment of Soil Science, Faculty of Agriculture, University of Abuja, Abuja 905101, Nigeria.
2
Laboratory of Applied Hydrology, National Water Institute, University of Abomey-Calavi, Abomey-Calavi BP 2008, Benin
3
Department of Soil Science, Federal University of Technology, Minna 920262, Nigeria
*
Author to whom correspondence should be addressed.
Hydrology 2017, 4(4), 52; https://doi.org/10.3390/hydrology4040052
Submission received: 6 October 2017 / Revised: 7 November 2017 / Accepted: 10 November 2017 / Published: 11 November 2017
(This article belongs to the Special Issue Climatic Change Impact on Hydrology)

Abstract

:
Sub-Saharan Africa is highly vulnerable to climate change given its low capacities of resilience to the enormous challenges climate change will pose. Research aimed at evaluating changes in hydrological trends and methods of adaptation was conducted in the Niger Basin parts of Benin at the peak of the rainy season in the year 2012. Rainfall and river discharge were analyzed from 1950–2010 in order to generate patterns of changes in the region. Structured questionnaires were used to evaluate the perceptions of 14 farming communities on climate-related issues and their methods of adaptations. Mann-Kendall and Pettit trend analyses were conducted for rainfall and river discharge. The findings indicated that significant decreases characterized rainfall and river discharge in the period of study. Flash flood was considered the major challenge faced in the region according to more than 90% of crop, animal, and fish farmers. Aside from that, decrease in water availability was identified as an additional challenge. Irrigation, diversification, water treatment, drainage, small dams, and dikes were reported as the common adaptation mechanisms in the catchments. This study will help in designing sustainable adaptation mechanisms to abrupt changes in the hydrology of the region.

1. Introduction

Climate change in Sub-Saharan Africa will bring high flooding with adverse effects on agriculture, sea level increases in coastal cities, public health, and food security [1]. Rising global temperature is expected to enhance the intensification of the hydrological cycle, resulting in severer dry seasons and wetter rainy seasons, and subsequently heightened risks of more frequent floods and drought [2]. Changing climate will have significant impacts on the availability and accessibility of water, both qualitatively and quantitatively. Sylla et al. [3] projected a more pronounced increase in the intensity of very wet rainfall events in West Africa at the end of the 21st century. In drier regions, a slight rise in temperatures leads to greater loss of moisture, exacerbating soil moisture drought and desertification [4]. Drought leads to decreased water availability and water quality for populations in many water-scarce regions, particularly in the semi-arid regions of West Africa. When less precipitation and higher temperatures occur simultaneously, the availability of water resources is reduced even further while evaporation is increased, leading to a vicious cycle. This has led to the occurrence of long periods of drought, which are predicted to become more widespread in the future [4].
The Niger River Basin has been under concurrent influence of changes in climate. Precipitation is highly variable spatially and temporarily in the basin [5]. The future pattern of projected stream flow and extremes are unclear and associated with large uncertainties in the Niger Basin [6]. The study of Aich et al. [7] emphasized the danger of increasing catastrophic floods in some catchments of the Niger River Basin. This will aggravate the challenges of reported floods on rural farmers at the peak of the rainy season in the Niger Basin parts of Benin [8].The evidence of current and future flooding reported in the Niger Basin in Benin [7,8,9] readdresses the need for the development of sustainable coping strategies for changing hydrological trends.
Rural farmers have always managed their resources and livelihoods in the face of limited resources [10], as well as challenging environmental and socioeconomic conditions. They respond to climate change influence in creative ways, using traditional knowledge and new technologies to find solutions that may help society in coping with the impending changes [11]. The scientific agreement that climate change is happening and will continue well into the future regardless of the effectiveness of mitigation measures [12] has warranted the need to understand how local farmers have coped with variability in water resources under climate change in order to guide strategies for adaptation in the future. Consequently, this paper evaluates impacts and responses to hydrological changes in the Niger Basin parts of Benin; with the broad aim of using the view of local people to ameliorate hydrological challenges in the Basin. The main aim of the study was achieved through the following specific objectives:
  • Evaluation of hydrological trends in the Niger Basin parts of Benin;
  • Assessment of perceptions and local adaptation mechanisms to the hydrological changes.

2. Materials and Methods
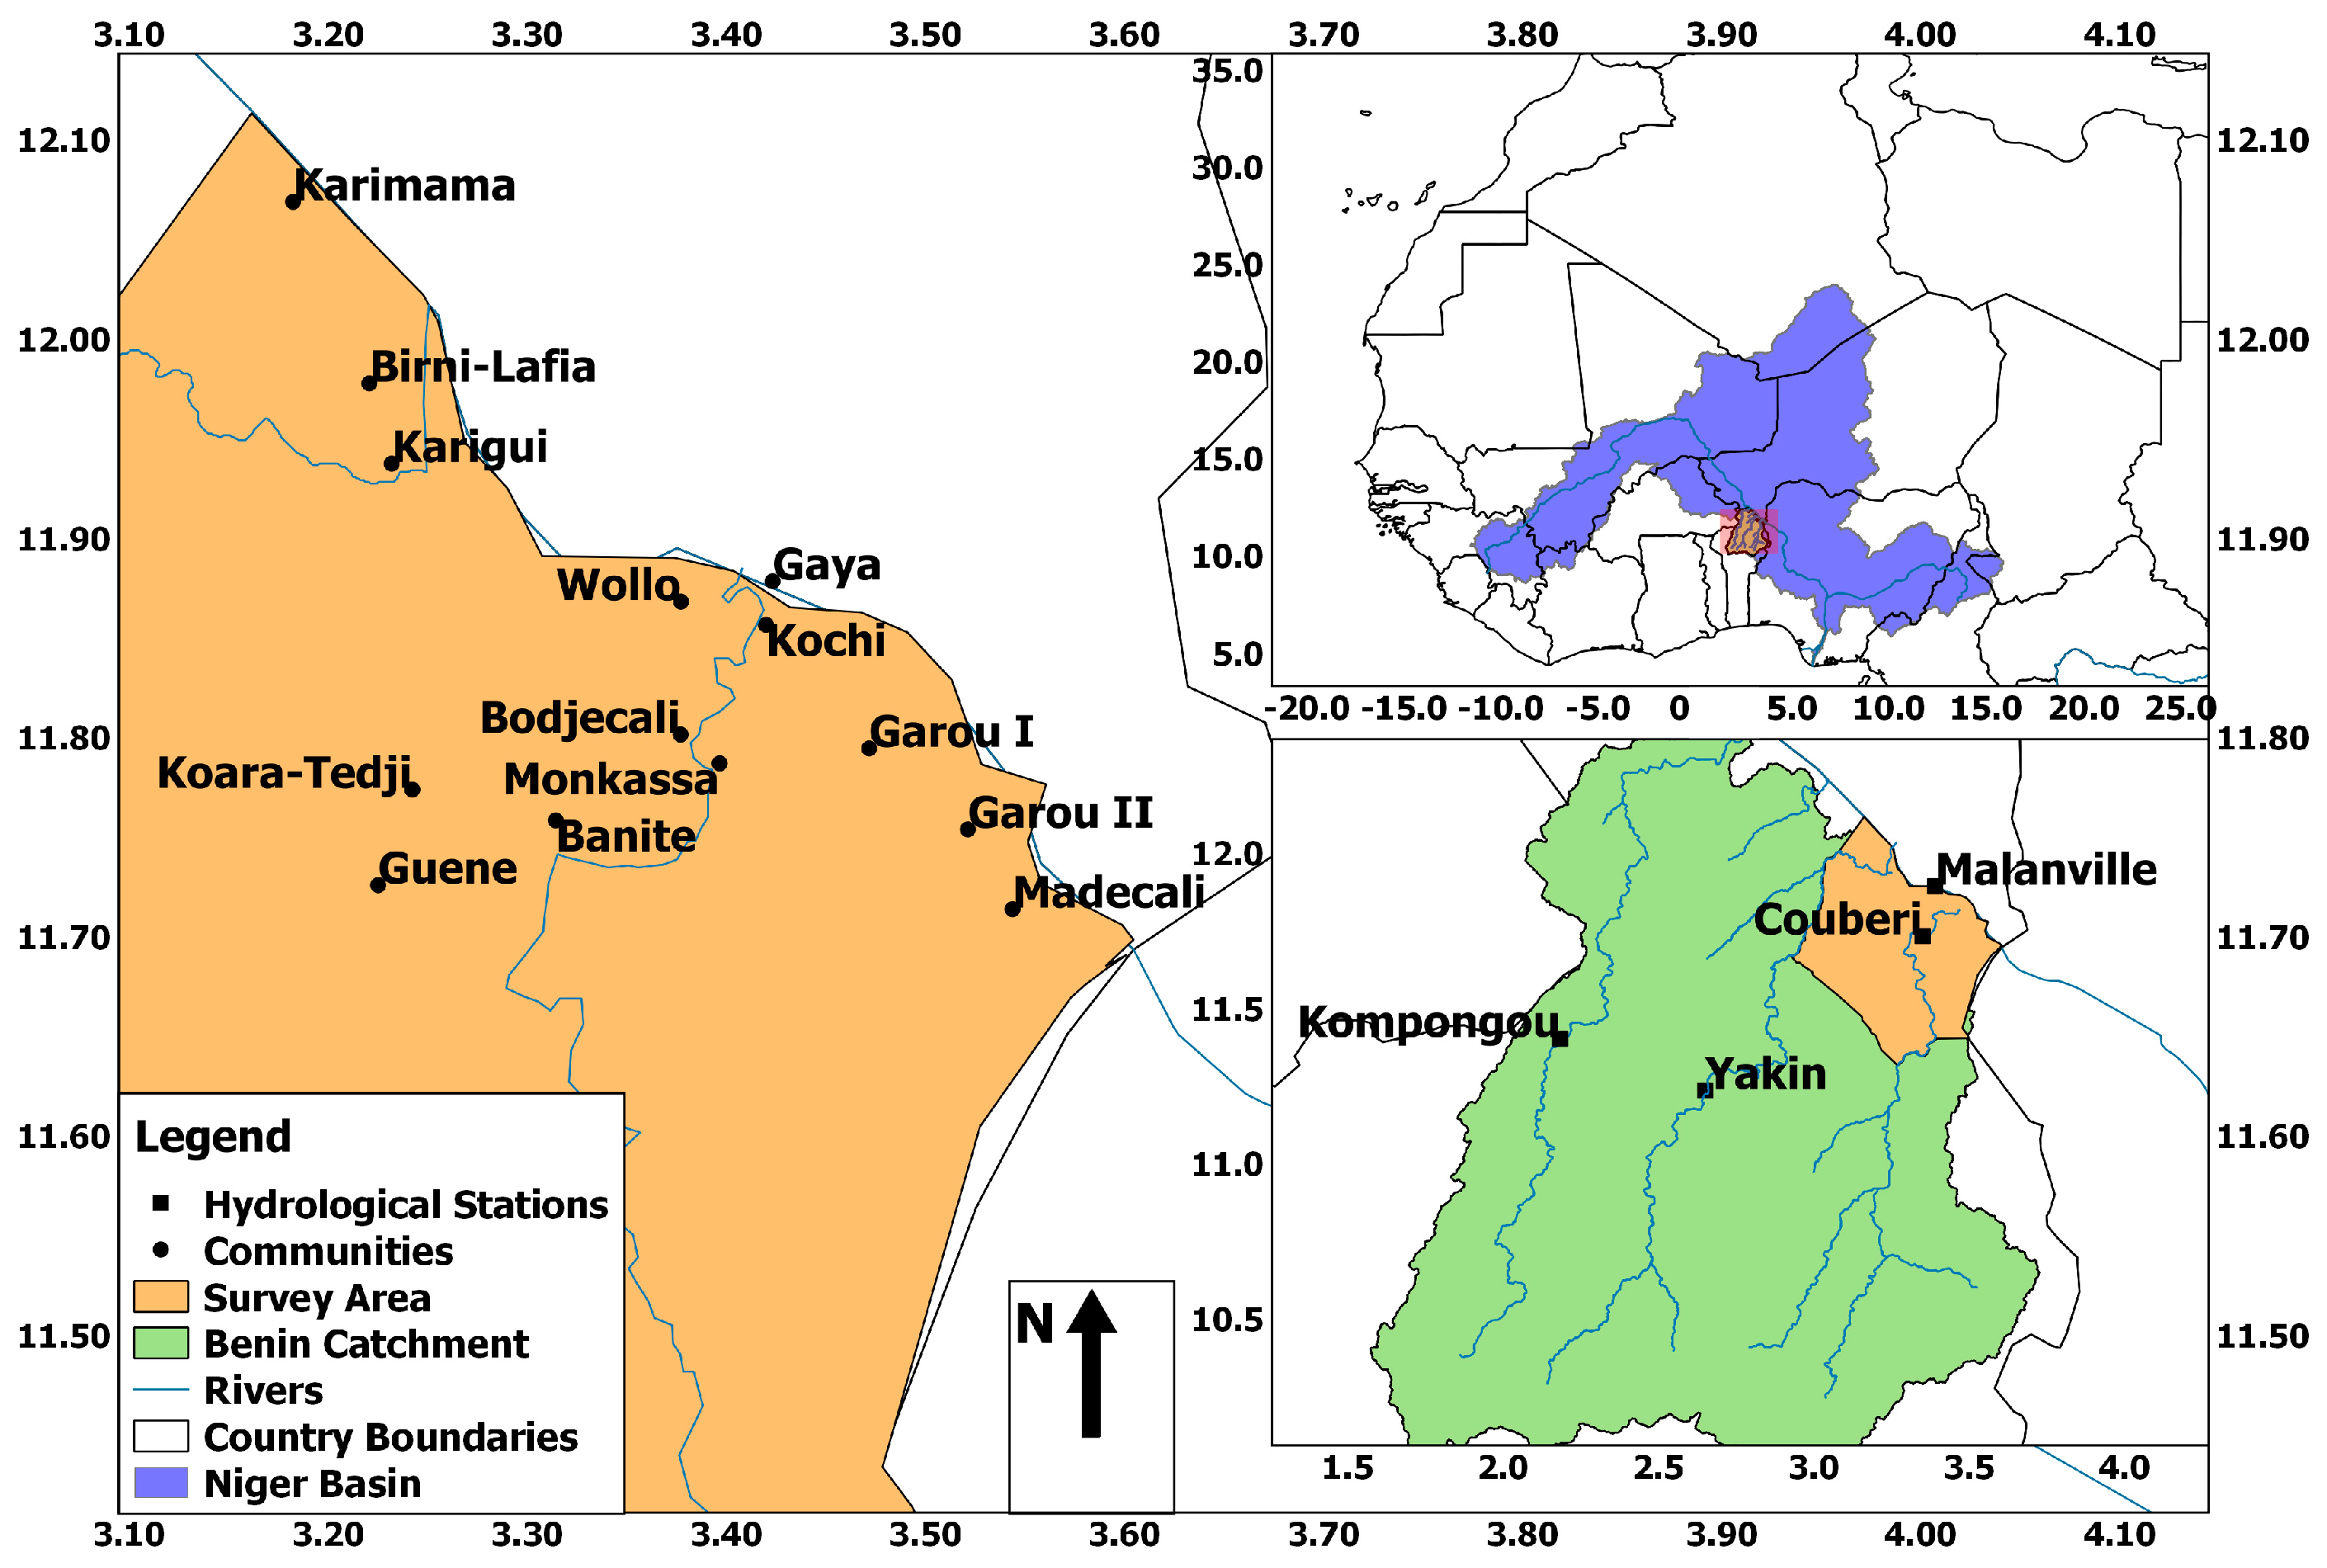
2.1. Study Area

The Niger Basin includes an area of 2.27 million km2, with 50% active drainage area (parts of the basin where flowing water contributes to the outlet discharge [13]) [14]. The Benin portion of the Basin (Figure 1) is generally considered to be one of the sub basins of the Niger that is most affected by freshwater variability [9]. Precipitation is very variable spatially and temporarily in the basin. The river dried up for several weeks at Malanville Hydrological Station (Figure 1) in 1985 as a result of low rainfall and runoff in 1984 [8,15]. Annual precipitation is concentrated in a single season from the middle of April to October. In the dry season, a Sahelian northeast trade wind, which brings cool and dry conditions, covers the whole basin. The highest temperatures of about 46 °C are experienced from March to April, while the lowest temperatures (about 16 °C) are observed in December and January, with an annual temperature mean of about 28 °C [8]. Precipitation amounts show wide variations from one year to another, as well as within the year. Apart from the variability of the annual and seasonal rainfalls, the extremes of precipitation result in floods and droughts at different times and sometimes within the same year [8].

2.2. Data Collection

Table 1 and Figure 1 present the location of meteorological and hydrological stations. Data were collected from 1950 to 2010 in order to unveil long-term fluctuations in hydrological trends of the region. Socioeconomic data were collected through field survey with well-structured, pretested questionnaires in Malanville and parts of Karimama commune (Figure 1) in September 2012. The questionnaire contained 26 sets of questions related to the socioeconomic characteristics of the respondents, their perceptions on climatic variability, the occurrence of extreme hydrological events, and local adaptation strategies used in the past two decades. In total, 120 respondents were covered in the survey. The respondents were selected from 14 different communities, well distributed along major water bodies, using stratified random sampling (Figure 1). Respondents were selected from each community based on size of the population domiciled in it.

2.3. Data Analysis

2.3.1. Spatial Analysis

Decadal average rainfall was computed from 1950–2010 for available meteorological stations in and around the basin (Table 1). The spatial distribution of the rainfall was computed with Kriging. Inter decadal rainfall distribution maps were generated with universal Kriging [16,17]. Kriging is part of geostatistics that are used for the mapping of surfaces from limited sample data [16].According to Kumar (2007), it uses observations Z x , at locations x i to estimate the values Z o at the point x o that has no observation. Kriging assumes that variable Z could be written as a total deterministic component m x (trend) and a stochastic component R x as:
Z x = m x + R x
The deterministic component m x is the anticipated value of the regionalized value of variable Z at location x , i.e.,
m x = E [ Z x ]
In simple kriging, the mean m x is assumed to be constant across the field of interest, i.e., m x = m c o n s t a n t , while for universal kriging, the mean is presumed to have functional dependence on spatial location. This can be approximated by a model of the form:
m x = l = 1 k a l f l ( x )
where a l is the l t h coefficient to be estimated from the data; f l is the l t h basic function of spatial coordinates that describes the drift. Random component R(x) is presumed to be intrinsic, that is, for any vector h, the increment R(x + h) − R(x) has an expectation of zero and a finite variance that is independent of point x. The variance of the increment is defined in the new function called the semivariogram, and is experimentally computed with the estimator;
γ ( h ) = 1 2 N ( h ) i = 1 N ( h ) [ R ( x i ) R ( x i + h ) ] 2
where N(h) implies number of experimental pairs separated by vector h. The kriging estimate can be calculated as:
z x 0 * = i = 1 N λ i z x i
where z x 0 * is the estimated value at x 0 ; z x i are the observed values at points x i ; N is the sample size and λ i are the weights chosen for x i .
The variogram was fitted automatically with the ‘autoKrige’ function embedded in the ‘automap’ package in the R programing environment [18]. This function returns the best fit model by iterating over the different variogram models.

2.3.2. Trend Analysis

To analyze for increasing/decreasing trends of rainfall and river discharge, the Mann-Kendall test was employed. The Mann-Kendall test evaluates the relative magnitudes of data and is widely used in hydrology [12,19].The advantage of this test is that the data need not comply with any particular distribution. The data values are assessed as an ordered time series. Each value of the data is compared to the subsequent data values. The Mann-Kendall statistic (S) was computed as:
S = k = 1 n 1 j = k + 1 n s i g n ( x j x k )
s i g n ( x j x k ) = { 1   i f   x j x k > 0 0   i f   x j x k = 0 1   i f   x j x k < 0
where x j and x k are the annual values in years j and k, respectively and n is the number of years.
Mann-Kendall normalized statistics Z was computed from variance of S as described in N’tcha M’po et al. [12].The trend was dignified as ‘no trend’ when the change is not significant, and as an increasing or a decreasing trend’ when S is positive or negative, respectively.
To evaluate the difference between cumulative distribution function before and after a time instant (K), the Pettit test was applied. The Pettit test detects any significant change in the mean value in a time series [20]. The non-parametric Pettit rank test was reported to have good capabilities in handling outliers [19,21]. The significance of the analyzed trends in the dataset was tested at probability level p ≤ 0.05 to show 99.5% experimental precision.
River discharge were aggregated into 20 years of daily climatologies for the periods of 1951–1970, 1971–1990, and 1991–2010, and then compared. Socioeconomic data were analyzed with SPSS and Microsoft Excel. Frequencies of responses was computed and reported as percentages.

3. Results

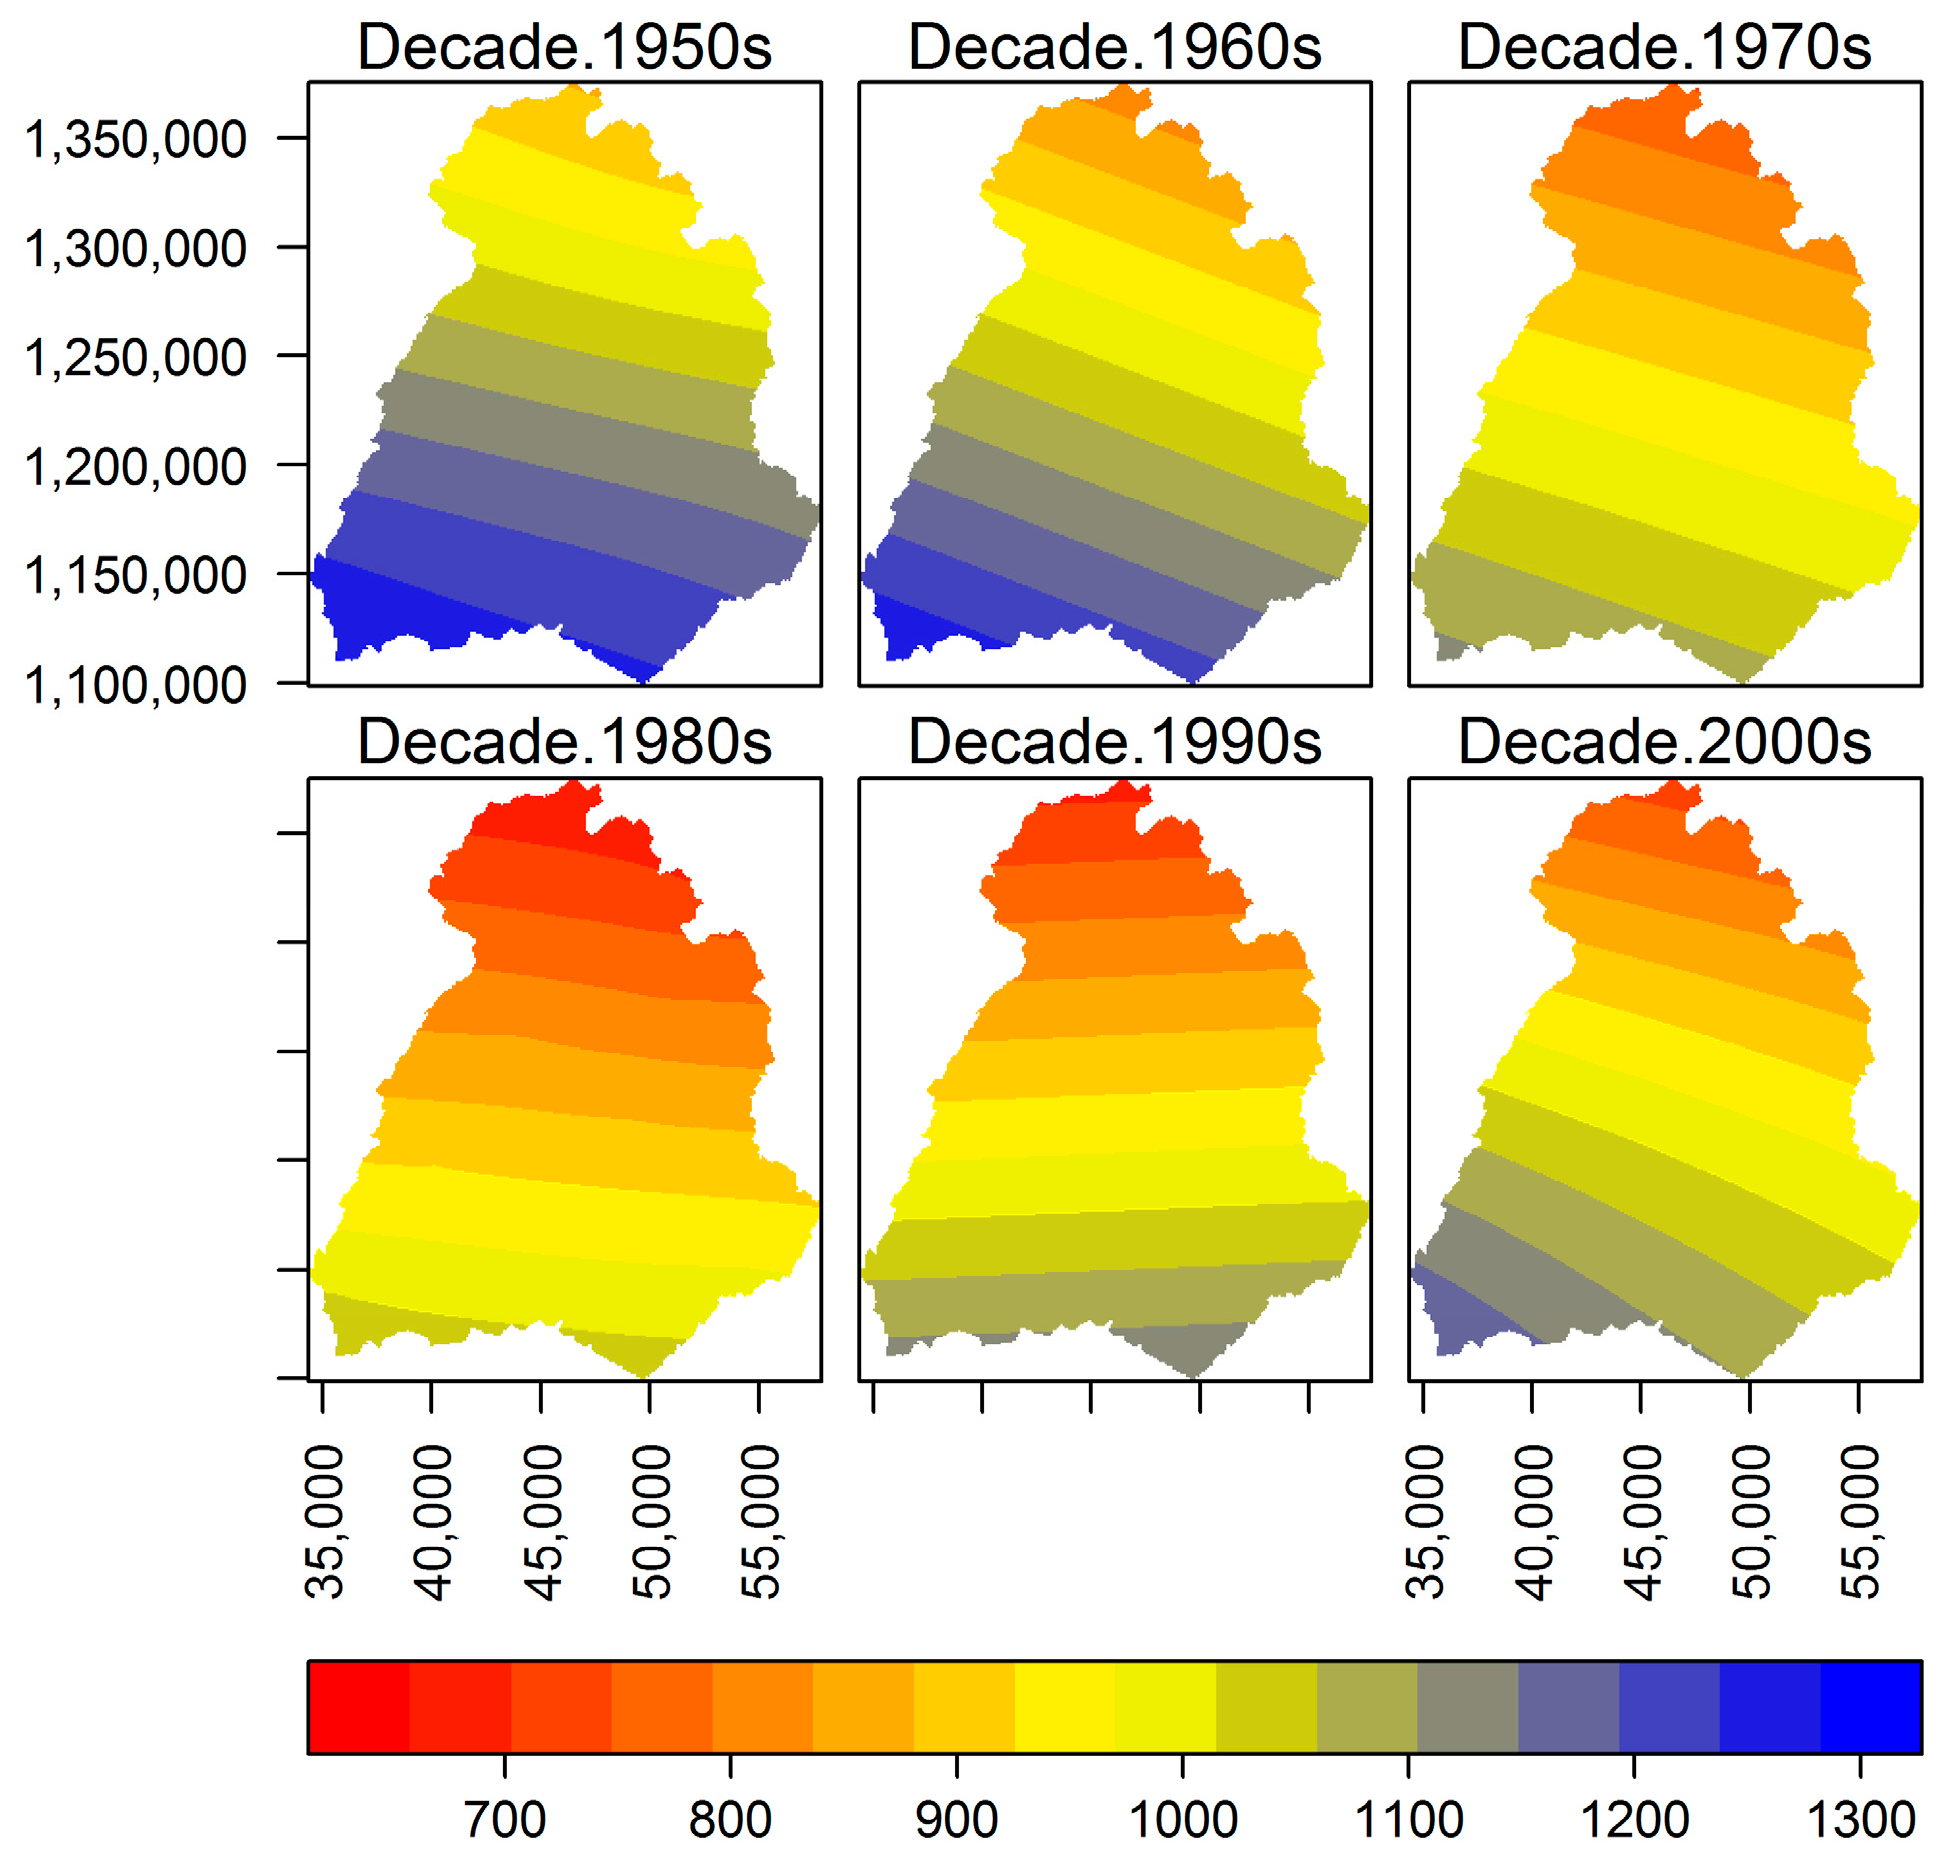
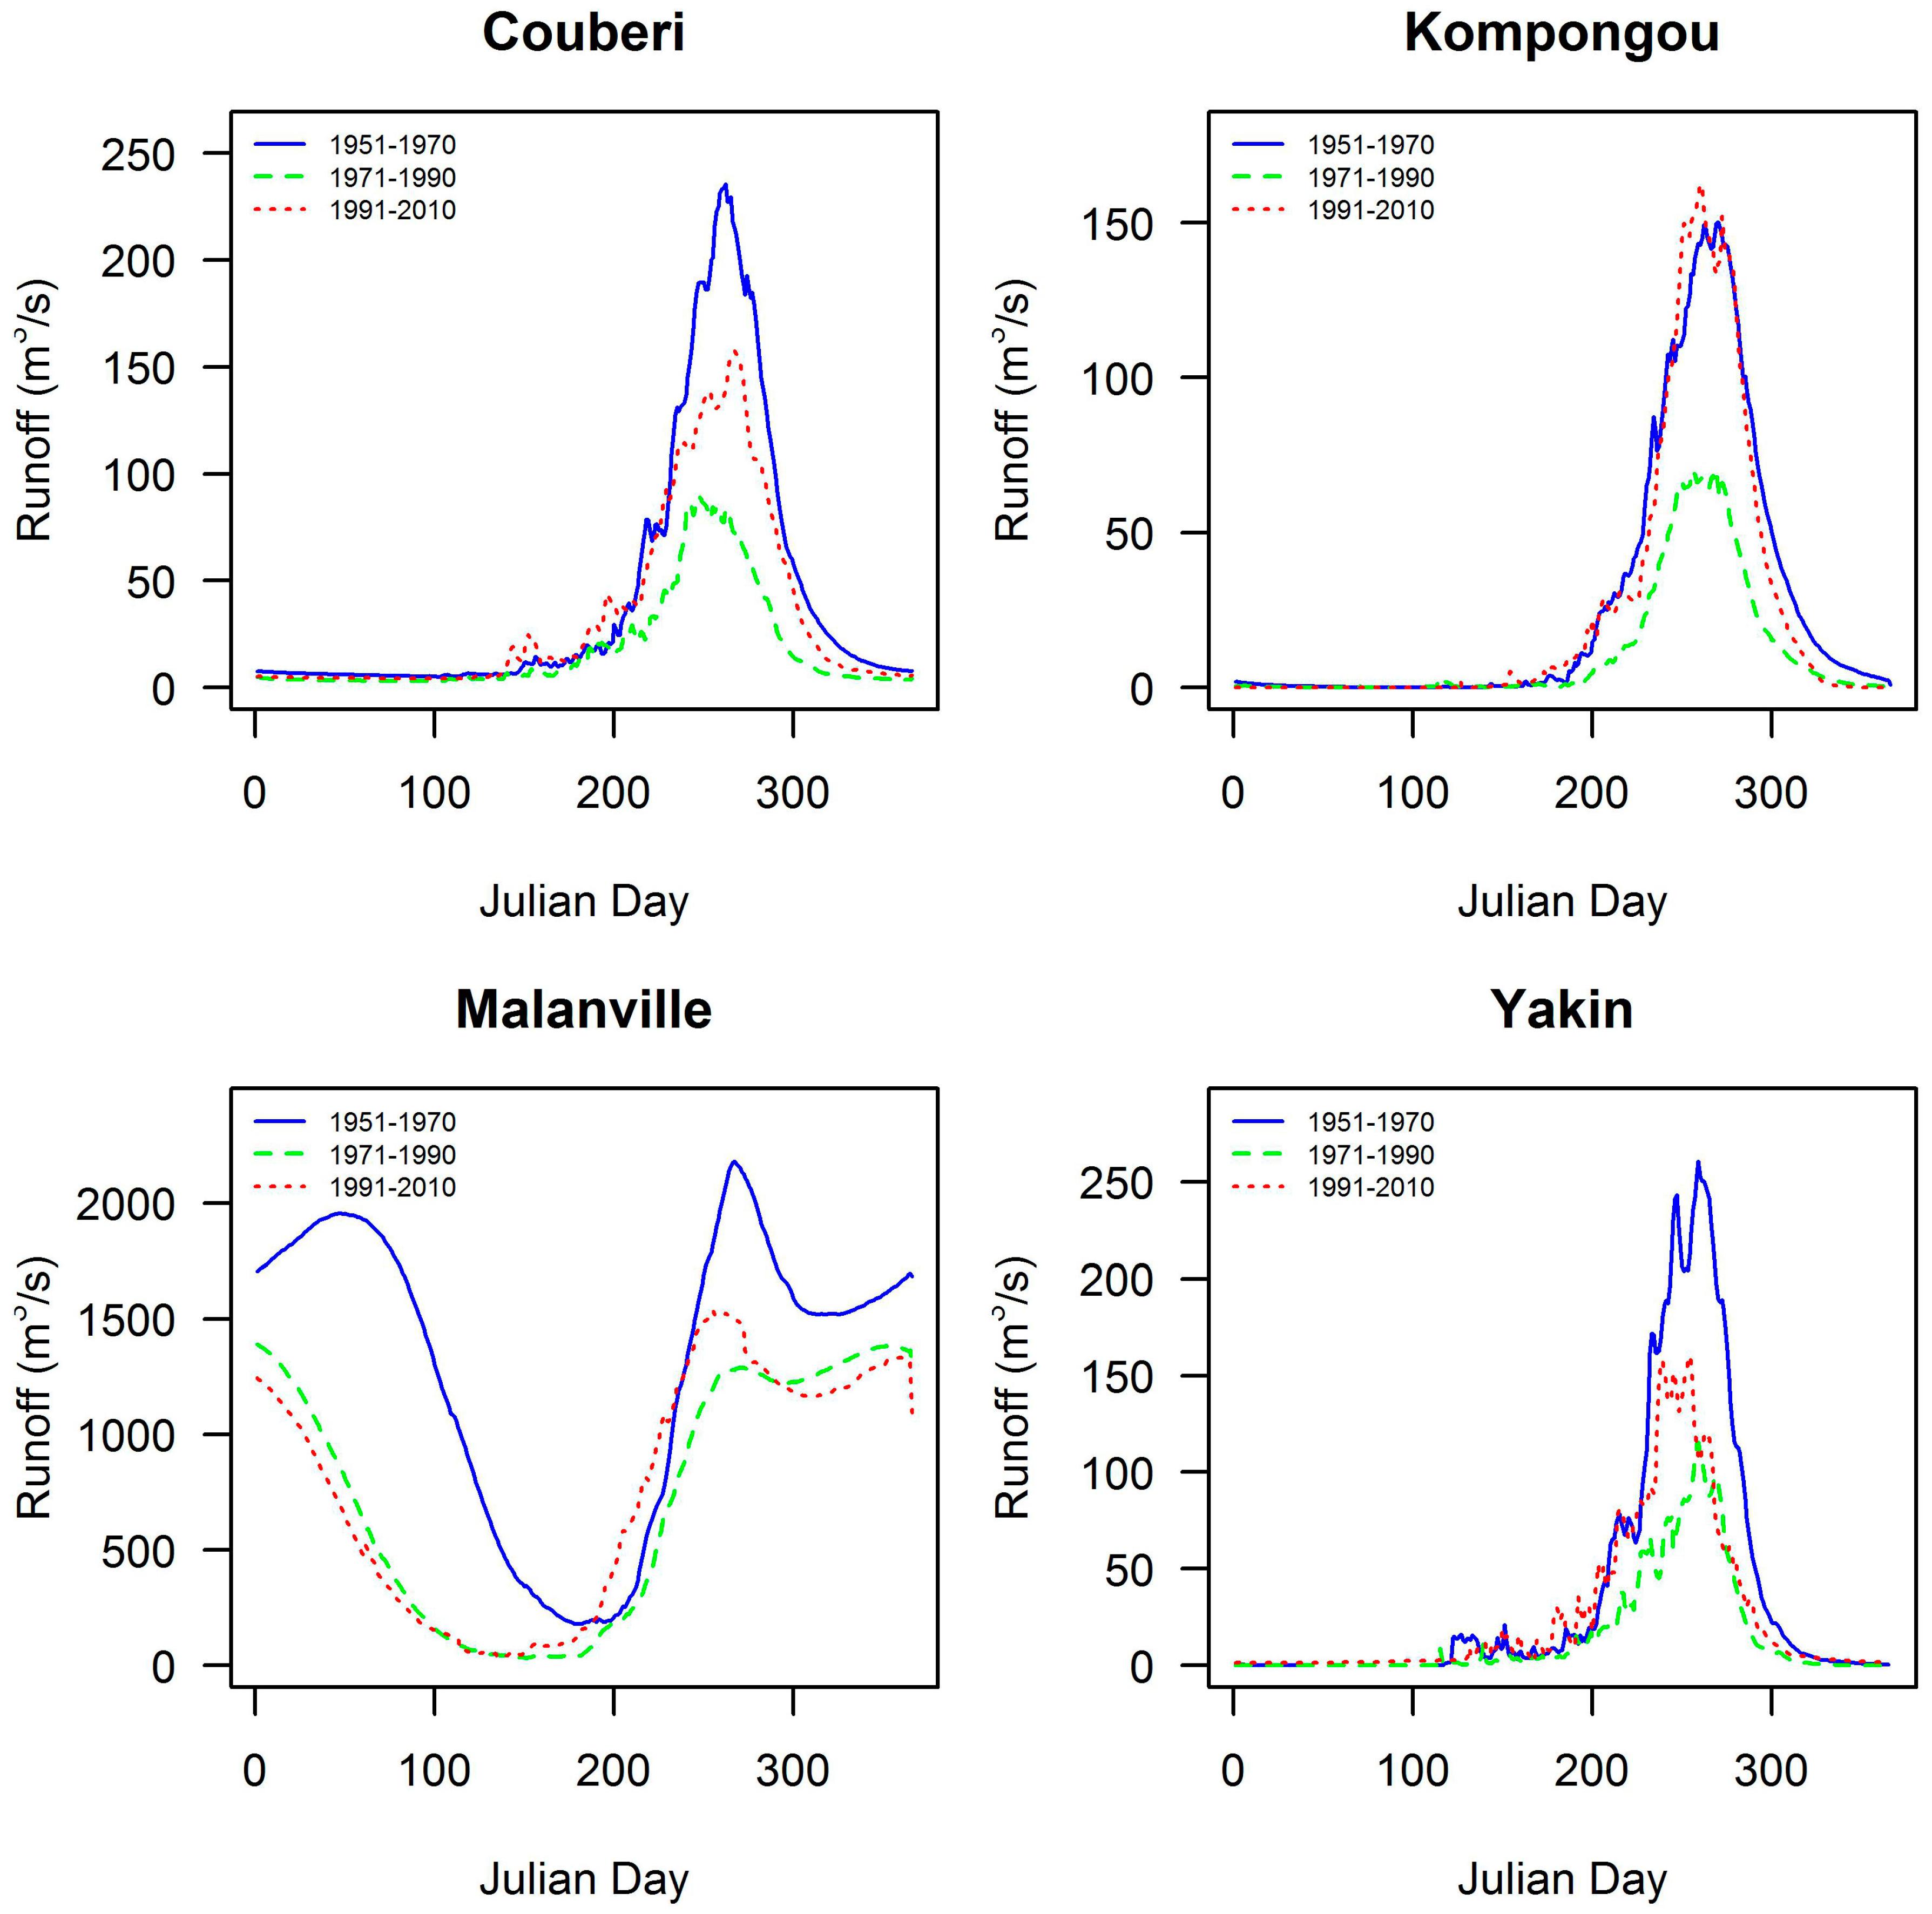
3.1. Hydro-Climatic Trends

Nine high rainfall regimes were identified from 1950–1959 (Decade1950s) which ranged from 900 mm–1300 mm and were distributed across the latitudinal gradient (Figure 2). The lowest rainfall regime was produced in high latitudes, while the highest rainfall signal was in the lowest latitude. In the following decade (Decade1960s; 1960–1969), a new dry rainfall regime (800 mm) was introduced at the top of the catchment through the gradual southward shift of higher rainfall regimes. However, abrupt changes were observed in the period of 1970–1979 (Decade1970s), with the disappearance of high rainfall signals of 1200 mm and 1300 mm and the introduction of 700 mm rainfall patterns. The same trend observed from 1970–1979 was conveyed into the period of 1980–1989 (Decade1980s), with more severe reduced rainfall marked by the disappearance of the 1100 mm rainfall signal in the southern part of the basin. From 1990–1999 (Decade1990s), there was a re-introduction of rainfall signal 1100 mm in the southern parts of the basin. There was also the re-appearance of 1200 mm rainfall regime in the last decade, 2000–2009 (Decade2000s).
Results of temporal statistical trends are presented in Table 2. None of the evaluated rainfall and discharge stations showed significant increasing trends. Eleven rainfall stations witnessed significant (p ≤ 0.05) decreasing trends, while two river discharge stations experienced significant decreasing trends. Climatological discharge evolutions presented in Figure 3 reveal that discharge was lowest during the period of 1971–1990 in the four evaluated stations. This was followed by the period of 1991–2010 at Couberi, Yakin, and Malanville, where the period of 1951–1970 was the highest. However, the highest discharge peak at Kompongou was during the 1991–2010 decades, followed by the period of 1951–1970.

3.2. Local Perceptions and Adaptations

Table 3 presents the socioeconomic characteristics and local perceptions of rural communities in Malanville. Sixty-one percent (61%) are crop farmers, 21% engage in animal husbandry, 11% are fish farmers, and 7% engage in others activities. Three hydrological indicators (rainfall, runoff, and floods) were used to evaluate the perceptions of the local populations (Table 3). The perception of higher rainfall was disclosed by more than 90% of all considered economic classes; over 80% of all farmers’ groups disclosed greater runoff, and the fact that flooding has been more rampant than past periods was highlighted by more than 80% of all farm classes.
The adaptation methods employed by farmers are indicated in Table 4. Investigation of soil and water conservation mechanisms indicated that over 80% of all activity classes deployed water treatment such as the application of chlorine, while more than 60% of animal and fish farmers engaged in measures of flood control. Agroforestry and land reclamation was mostly embraced by crop farmers, while the use of water storage was generally low in the study area. Farmers respond to drought mainly by using alternative water supplies, diversification, and the use of genetically improved accessions in their production. Crop farmers utilized small water ponds and the reduction of farm size. In order to combat the extremities of flood, more than 80% of all activity classes diversified into other sources of income until the recession of the flood, while the use of a dam/dike, drainage, abandoning production land, and protection were more embraced by fish and animal farmers.

4. Discussion

High inter-decadal rainfall variability was observed in the basin with clear differences in observed signals in different parts. Regions of higher latitudes were characterized by lower rainfall signals, which made them highly susceptible to drought, while lower latitudes experienced higher rainfall. This follows the rainfall distribution pattern in West Africa, which is a result of the dynamics of the Inter Tropical Convergence Zone (ITCZ) [22]. ITCZ follows the surface heating associated with the displacement of the overhead position of the sun. Equatorial regions experience two rainfall seasons, whereas regions poleward experience one rainfall season. The clear dry spatial pattern observed in the basin in 1970s and 1980s was a result of about a 150- to 250-km southward shift in isohyetal lines observed in the whole Niger Basin, which was attributed to global climate change [23]. Climate change was also responsible for the observed low river discharge in this period. The statistically significant decreasing trends in rainfall and runoff observed shows that the basin had not recovered from the drought, although the current annual rainfall and runoff is not as high as it was in the 1950s. This trend of decrease had been projected to continue to mid-century based on a study conducted at an adjacent catchment [12].The higher recent high runoff pattern at Kompongou station was due to unsustainable land-use management and rapid population growth leading to a process called the ‘Sahelian Paradox’ [24]. The Sahelian paradox is an observed runoff increase despite low rainfall. The same event was reported in other catchments such as Nakanbe (Burkina Faso) and Sirba (Niger) [25] and it represents an important challenge for modeling water availability in the basin. The paradox is also linked to recently reported flooding by local farmers, which can be attributed to the rapidly increasing population at the coastline of the rivers.
There is high agreement between the perceptions of the rural populations and the trends observed in scientific findings. This is in line with the study of Oyerinde et al. [8], who indicated the strong intelligence of the local population which, if adequately employed, may enhance sustainable adaptation to climate change in the region. Significant impacts of climate change were observed through the perception of increase in the occurrence and intensity of flood and drought in the basin. This was, however, reported to have different perceived impacts on different economic activities. The only generally accepted method of water conservation is local level treatment of water, which is necessary due to inadequate potable water supplies. Other methods include flood control, which was disclosed to be very important for fish and animal farmers, especially when they stay at the river banks with their animals. Agroforestry is attributed to the crop farmers in order to derive additional income from economic trees and soil conservation. Land reclamation is used by crop farmers to regain lost farmland after the recession of a flood. Water storage is generally low in the study area due to the availability of perennial river networks which could aid the communities during long dry spells. This was further emphasized in their declaration of seeking alternative water supplies to rainfall in order to ameliorate the effects of drought. Other declared methods of adaptation to drought such as diversification and the use of genetically improved accessions for production. A popularly deployed method of adaptation to flood is diversification to other activities until the recession of water from flooded areas occurred. Other methods include the use of dams/dikes, drainage, abandoning production land, and the protection of properties.

5. Conclusions

This study revealed that the Niger Basin areas of Benin have been characterized by significant decreases in rainfall and runoff since 1950. There was high agreement between the local perception of hydrological indicators and observed scientific findings. This indicates the strong intelligence of the local population, which may be explored to devise sustainable measures of adaptation to climate and hydrological change in the region. The most prominent adaptation mechanisms in the basin are: irrigation, diversification, water treatment, drainage, small dams, and dikes. These adaptation practices, if explored and improved substantially, will enhance sustainable adaptation to expected future hydrological changes in the Niger Basin parts of Benin. However, since most of the analyses presented in this study are based on annual data, there may be some deviations in the time of occurrences of extreme events. Further research should evaluate means of improving these locally adopted adaptation methods as well as assess the shift in the timing of occurrence of extreme events under climate change in the study region.

Acknowledgments

The survey was funded by the German Ministry of Education and Research (BMBF) through the West African Science Service Center on Climate Change and Adapted Land Use (WASCAL; www.wascal.org), that supports the Graduate Research Program Climate Change and Water Resources at the University of Abomey-Calavi. We thank the Benin Hydro and Meteorological services for providing the hydro-meteorological data.

Author Contributions

Socioeconomic survey was conducted by Ganiyu Titilope Oyerinde and Ayo J. Odofin. All graphics and tables were made by Ganiyu Titilope Oyerinde and Emmanuel Agnidé Lawin. All authors contributed to the writing of the manuscript.

Conflicts of Interest

The authors declare no conflict of interest.

References

  1. Reyer, C.P.O.; Rigaud, K.K.; Fernandes, E.; Hare, W.; Serdeczny, O.; Schellnhuber, H.J. Turn down the heat: regional climate change impacts on development. Reg. Environ. Chang. 2017, 17, 1563–1568. [Google Scholar] [CrossRef]
  2. Schewe, J.; Heinke, J.; Gerten, D.; Haddeland, I.; Arnell, N.W.; Clark, D.B.; Dankers, R.; Eisner, S.; Fekete, B.M.; Colón-González, F.J.; et al. Multimodel assessment of water scarcity under climate change. Proc. Natl. Acad. Sci. USA 2014, 111, 3245–3250. [Google Scholar] [CrossRef] [PubMed] [Green Version]
  3. Sylla, M.B.; Giorgi, F.; Pal, J.S.; Gibba, P.; Kebe, I.; Nikiema, M. Projected Changes in the Annual Cycle of High Intensity Precipitation Events over West Africa for the Late 21st Century. J. Clim. 2015. [Google Scholar] [CrossRef]
  4. Field, C.B.; Barros, V.R.; Dokken, D.J.; Mach, K.J.; Mastrandrea, M.D.; Bilir, T.E.; Chatterjee, M.; Ebi, K.L.; Estrada, Y.O.; Genova, R.C.; et al. (Eds.) IPCC Summary for policymakers. In Climate Change 2014:Impacts, Adaptation, and Vulnerability, Part A: Global and Sectoral Aspects; Contribution of Working Group II to the Fifth Assessment Report of the Intergovernmental Panel on Climate Change; Cambridge University Press: Cambridge, UK; New York, NY, USA, 2014; pp. 1–32. [Google Scholar]
  5. Oyebande, L.; Odunuga, S. Climate change impact on water resources at the transboundary level in West Africa: the cases of the Senegal, Niger and Volta basins. Open Hyrol. J. 2010, 4, 163–172. [Google Scholar] [CrossRef]
  6. Aich, V.; Liersch, S.; Vetter, T.; Huang, S.; Tecklenburg, J.; Hoffmann, P.; Koch, H.; Fournet, S.; Krysanova, V. Comparing impacts of climate change on streamflow in four large African river basins. Hydrol. Earth Syst. Sci. 2014, 4, 1305–1321. [Google Scholar] [CrossRef] [Green Version]
  7. Aich, V.; Liersch, S.; Vetter, T.; Fournet, S.; Andersson, J.C.M.; Calmanti, S.; van Weert, F.H.A.; Hattermann, F.F.; Paton, E.N. Flood projections within the Niger River Basin under future land use and climate change. Sci. Total Environ. 2016, 562, 666–677. [Google Scholar] [CrossRef] [PubMed]
  8. Oyerinde, G.T.; Hountondji, F.C.C.; Wisser, D.; Diekkrüger, B.; Lawin, A.E.; Odofin, A.J.; Afouda, A. Hydro-climatic changes in the Niger basin and consistency of local perceptions. Reg. Environ. Chang. 2015, 15, 1627–1637. [Google Scholar] [CrossRef]
  9. Badou, D.F.; Kapangaziwiri, E.; Diekkrüger, B.; Hounkpè, J.; Afouda, A. Evaluation of recent hydro-climatic changes in four tributaries of the Niger River Basin (West Africa). Hydrol. Sci. J. 2016, 62, 1–14. [Google Scholar] [CrossRef]
  10. Møller, L.R.; Drews, M.; Larsen, M.A.D. Simulation of Optimal Decision-Making Under the Impacts of Climate Change. Environ. Manag. 2017, 60, 104–117. [Google Scholar] [CrossRef] [PubMed]
  11. Salick, J.; Byg, A. Indegenous Peoples and Climate Change; University of Oxford and Missouri Botanical Garden May: Oxford, UK, 2007. [Google Scholar]
  12. N’Tcha M’Po, Y.; Lawin, E.; Yao, B.; Oyerinde, G.; Attogouinon, A.; Afouda, A. Decreasing Past and Mid-Century Rainfall Indices over the Ouémé River Basin, Benin (West Africa). Climate 2017, 5, 74. [Google Scholar] [CrossRef]
  13. Kotlyakov, V.M.; Komarova, A.I. Elsevier’s Dictionary of Geography; North Holland: Amsterdam, The Netherlands, 2007; ISBN 10: 0-444-51042-7. [Google Scholar]
  14. KfW Adaptation to Climate Change in the Upper and Middle Niger River Basin. Available online: http://ccsl.iccip.net/niger_river_basin.pdf (accessed on 12 February 2017).
  15. Legesse, D.; Vallet-Coulomb, C.; Gasse, F. Hydrological response of a catchment to climate and land use changes in Tropical Africa: Case study south central Ethiopia. J. Hydrol. 2003, 275, 67–85. [Google Scholar] [CrossRef]
  16. Gaikwad, N.; Sawant, R. Analyzing Kriging method and creating an application using Kriging. In Proceedings of the 2016 IEEE International Conference on Cloud Computing and Big Data Analysis ICCCBDA, Chengdu, China, 5–7 July 2016; pp. 171–176. [Google Scholar]
  17. Kumar, V. Optimal contour mapping of groundwater levels using universal kriging—A case study. Hydrol. Sci. J. 2007, 52, 1038–1050. [Google Scholar] [CrossRef]
  18. R Development Core Team R: A Language and Environment for Statistical Computing. Available online: http://www.r-project.org (accessed on 13 August 2015).
  19. Verstraeten, G.; Poesen, J.; Demarée, G.; Salles, C. Long-term (105 years) variability in rain erosivity as derived from 10-min rainfall depth data for Ukkel (Brussels, Belgium): Implications for assessing soil erosion rates. J. Geophys. Res. Atmos. 2006, 111, 1–11. [Google Scholar] [CrossRef]
  20. Královec, V. Trend analysis of rainfall-runoff regimes in selected headwater areas of the Czech Republic. J. Hydrol. Hydromech. 2011, 36–50. [Google Scholar] [CrossRef]
  21. Pettitt, A.N. A Non-Parametric Approach to the Change-Point Problem. Appl. Stat. 1979, 28, 126. [Google Scholar] [CrossRef]
  22. Lucio, P.; Molion, L.; Valadão, C.; Conde, F.; Ramos, A.; MLD, M. Dynamical outlines of the rainfall variability and the ITCZ role over the West Sahel. Atmos. Clim. Sci. 2012, 2, 337–350. [Google Scholar] [CrossRef]
  23. Inger, A.; Ousmane, D.; Martha, J.-H.; Jean-Claude, O. The Niger River Basin: A Vision for Sustainable Management; Golitzen, K.G., Ed.; The World Bank: Washington, DC, USA, 2005; ISBN 9780821362037. [Google Scholar]
  24. Amogu, O.; Descroix, L.; Yéro, K.S.; Le Breton, E.; Mamadou, I.; Ali, A.; Vischel, T.; Bader, J.-C.; Moussa, I.B.; Gautier, E.; et al. Increasing River Flows in the Sahel? Water 2010, 2, 170–199. [Google Scholar] [CrossRef]
  25. Descroix, L.; Mahé, G.; Lebel, T.; Favreau, G.; Galle, S.; Gautier, E.; Olivry, J.-C.; Albergel, J.; Amogu, O.; Cappelaere, B. Spatio-temporal variability of hydrological regimes around the boundaries between Sahelian and Sudanian areas of West Africa: A synthesis. J. Hydrol. 2009, 375, 90–102. [Google Scholar] [CrossRef]
Figure 1. Map of Niger Basin of Benin with sampled communities.
Hydrology 04 00052 g001
Figure 2. Decadal spatial rainfall (mm/year) variability in Niger Basin, Benin (1951–2010).
Hydrology 04 00052 g002
Figure 3. Multi-decadal changes in river discharge in the Niger Basin areas of Benin.
Hydrology 04 00052 g003
Table 1. List of meteorological stations considered in the study and their respective Universal Transverse Mercator (UTM) coordinates.
S/NStation NamesLatitude (UTM)Longitude (UTM)
1Karimama519,9531,333,932
2Malanville543,5651,311,841
3Alfakoara507,2721,265,738
4Banikoara438,1581,249,211
5Kandi492,7201,230,723
6Kerou401,6221,197,696
7Tanguieta310,3771,174,123
8Kouande355,8371,142,565
9Natitingou322,9721,140,872
10Birni337,4081,103,935
11Ina470,7711,101,739
12Nikki521,9241,098,048
13Kalale541,9731,138,607
14Bembereke463,4911,127,544
15Djougou353,7281,072,531
16Partago379,2701,054,009
17Okpara470,7281,046,457
18Parakou456,0771,033,573
19Segbana576,4901,208,697
20Niamey409,8431,490,703
21Oaugadougou336,9081,365,713
22Sokoto730,3511,388,299
23Yelwa658,6651,164,379
Table 2. Results of the Mann-Kendall and Pettit tests for rainfall and river discharge.
Station/StatisticsMann-KendallPettit
SZpTrendKpn
Rainfall
Karimama−432.00−2.680.01Decreasing19810.0161
Malanville−431.00−2.680.01Decreasing19710.0161
Alfakoara−148.00−0.910.36No Trend19770.3261
Banikoara−374.00−2.320.02Decreasing19730.0261
Kandi−319.00−1.980.05Decreasing19800.0561
Kerou−251.00−1.560.12No Trend19700.0461
Tanguieta−121.00−0.750.46No Trend19760.1361
Kouande−450.00−2.790.01Decreasing19710.0161
Natitingou−448.00−2.780.01Decreasing19700.0161
Birni−156.00−0.960.33No Trend19700.0361
Ina−388.00−2.410.02Decreasing19700.0161
Nikki−102.00−0.630.53No Trend19690.2261
Kalale−429.00−2.660.01Decreasing19700.0361
Bembereke−378.00−2.350.02Decreasing19710.0161
Djougou−14.00−0.080.94No Trend19730.5961
Partago−88.00−0.540.59No Trend19800.2761
Okpara−152.00−0.940.35No Trend19690.1561
Parakou−44.00−0.270.79No Trend19691.0461
Segbana−430.00−2.670.01Decreasing19720.0161
Niamey−169.00−1.360.17No Trend19680.0951
Ouagadougou−584.00−3.630.01Decreasing19770.0161
Sokoto60.000.510.61No Trend19900.2049
Yelwa82.001.060.29No Trend19910.1837
River Discharge
Couberi−233.00−1.880.06No Trend19720.0151
Kompongou−102.00−1.640.10No Trend19720.1232
Malanville−605.00−4.910.01Decreasing19710.0151
Yakin−278.00−3.110.01Decreasing19700.0141
Table 3. Percentage perceptions of hydrological changes at Malanville.
Socioeconomics of Respondents
Economic ActivitiesCrop Production61.0
Animal Husbandry21.0
Fisheries11.0
Others7.0
Hydrological Variability
CropAnimalFish
Rainfall
Higher98.097.595.0
Lower1.02.55.0
Unchanged1.00.00.0
Runoff
Higher92.0100.085.0
Lower1.80.05.0
Unchanged6.10.010.0
Flood
Higher89.080.085.0
Lower3.00.010.0
Unchanged8.020.05.0
Table 4. Percentage of farmers adopting adaptation mechanisms to hydrological changes.
VariablesCropAnimalFish
Soil and Water Conservation Mechanisms
Water storage17.020.05.0
Flood control39.062.065.0
Water treatment84.092.080.0
Agroforestry63.030.040.0
Soil amendment52.013.020.0
Reclamation57.027.040.0
Mulching18.028.045.0
Irrigation92.092.090.0
Drought
Alternative water/irrigation95.0100.0100.0
Diversification95.0100.0100.0
Genetic improvement92.088.085.0
Abandon48.050.071.0
Migration65.063.071.0
Water pond81.038.057.0
Reduction71.050.057.0
Management64.050.042.0
Flood
Drainage54.075.085.0
Dam/dike41.075.071.0
Abandon55.075.071.0
Diversification82.0100.085.0
Protection44.075.071.0

