
Flash Flood Prediction by Coupling KINEROS2 and HEC-RAS Models for Tropical Regions of Northern Vietnam


Abstract
:1. Introduction
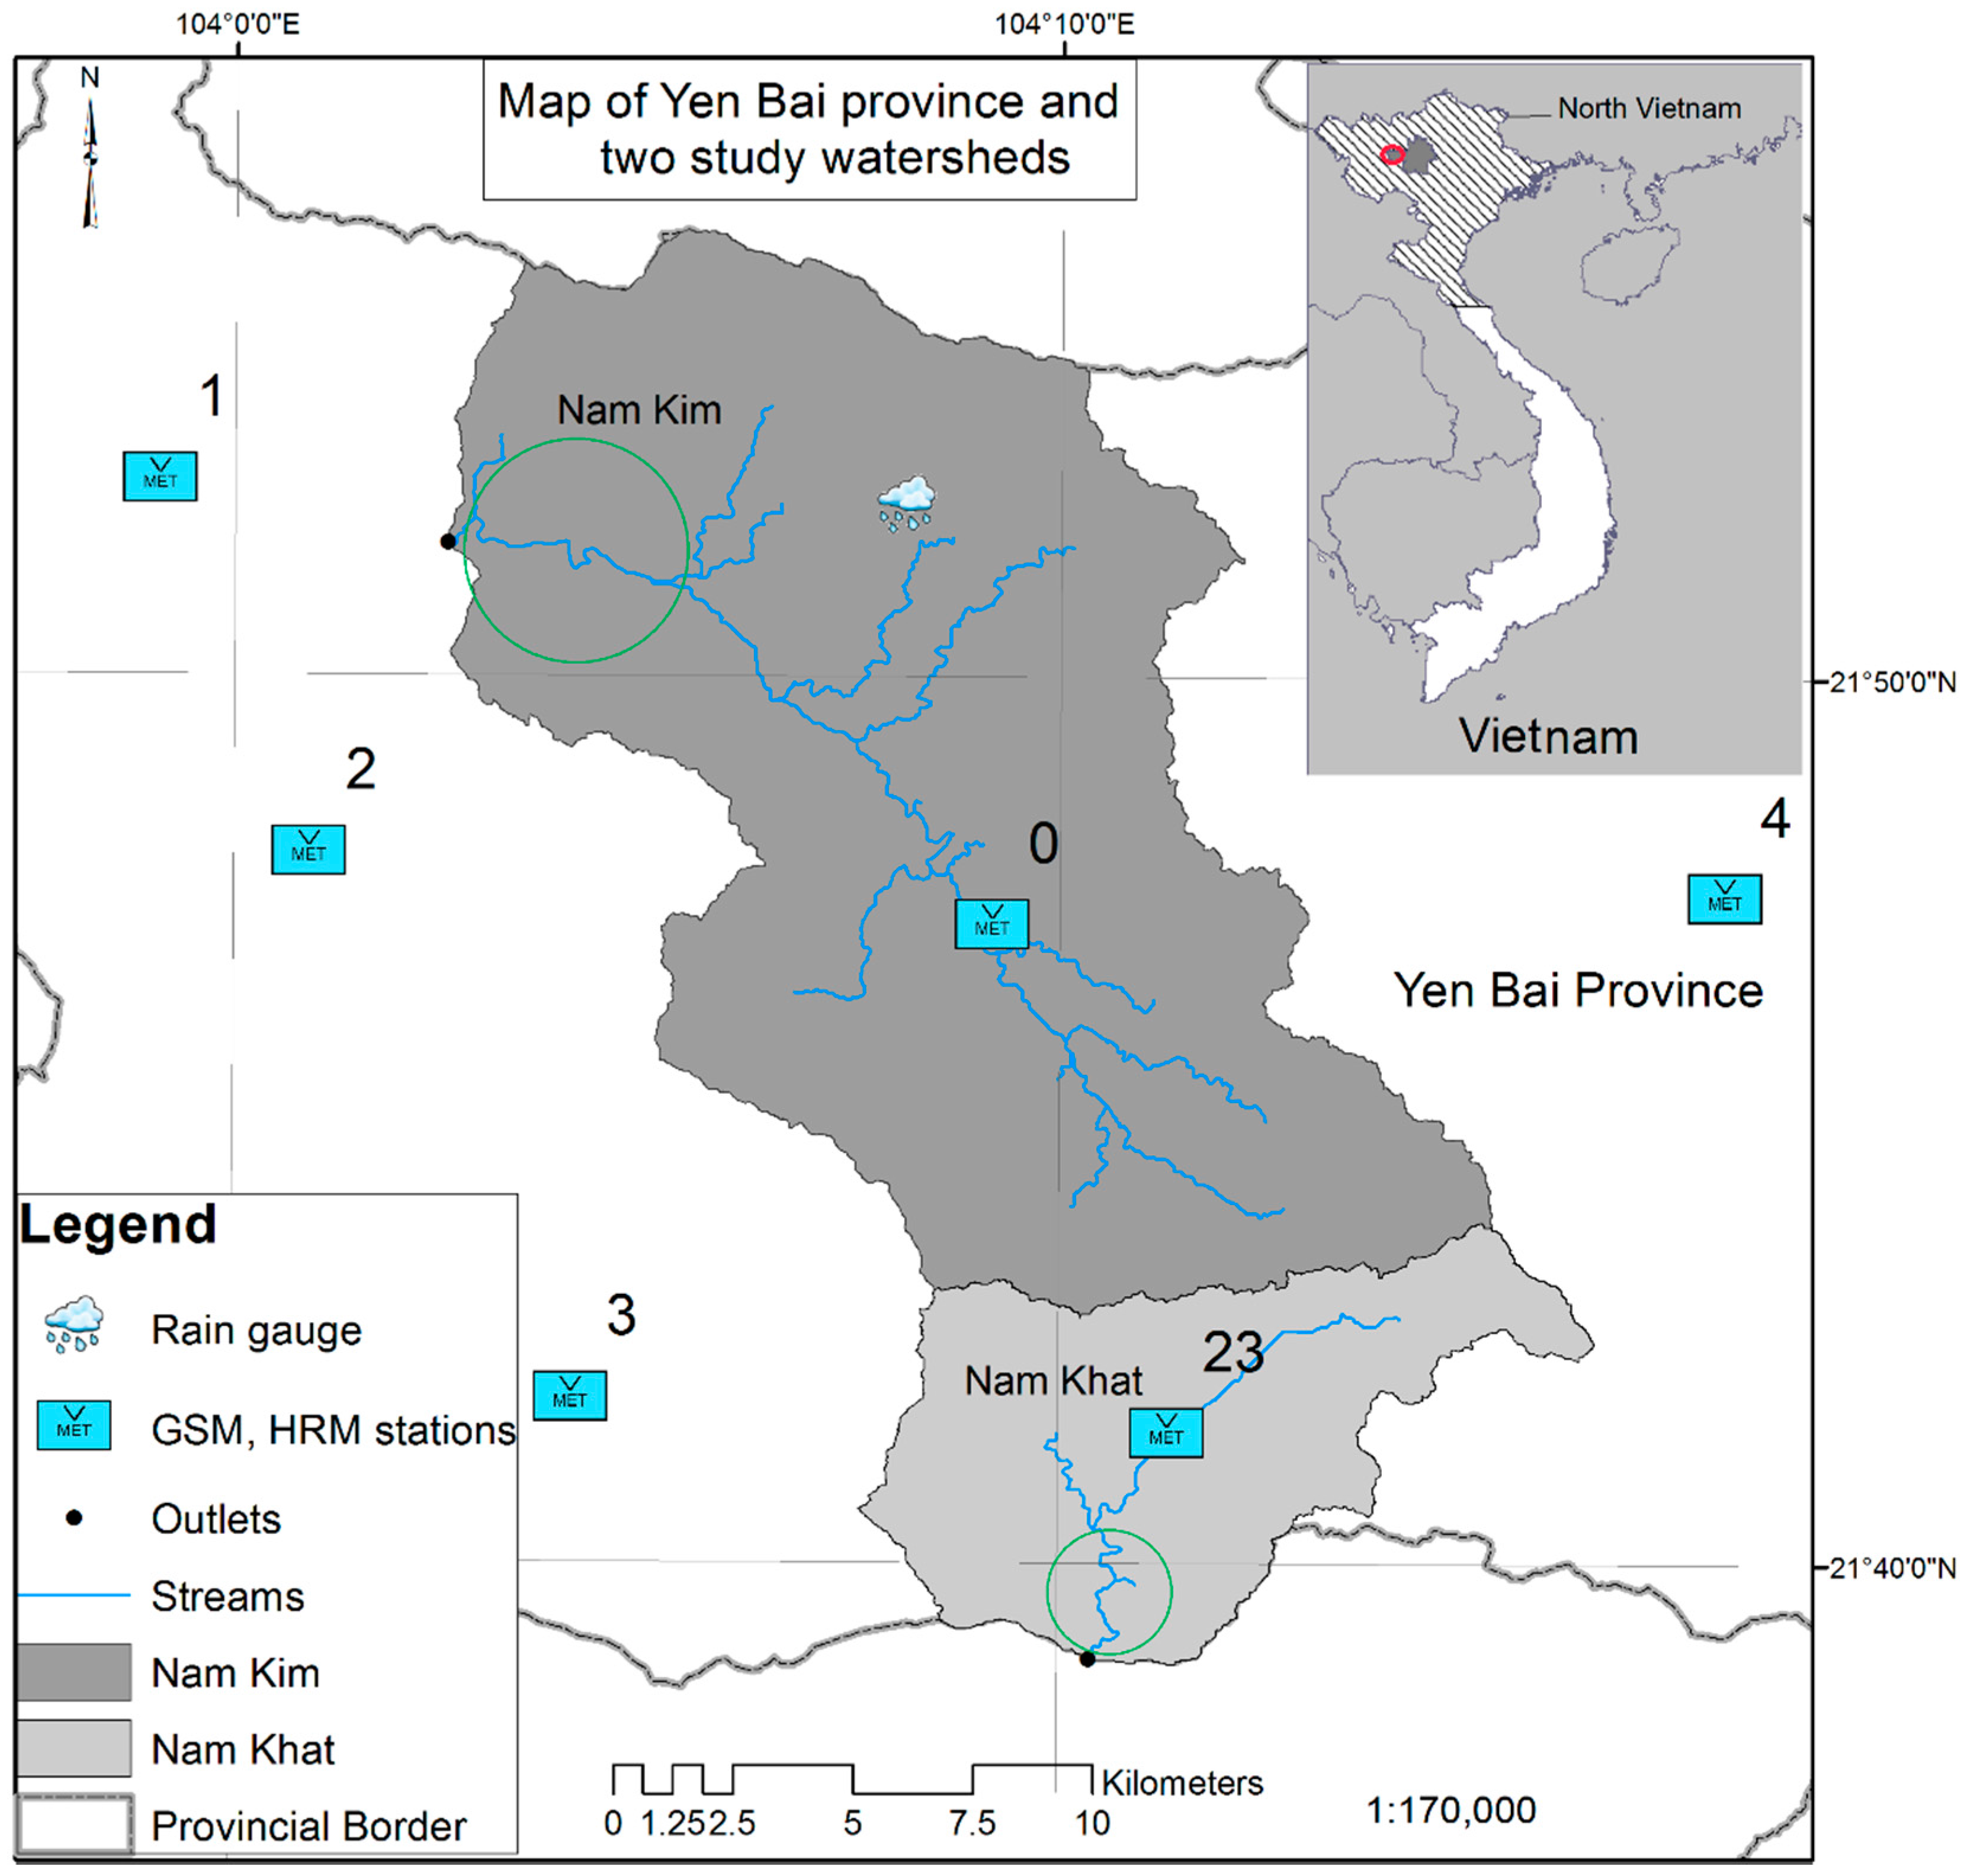
2. Study Site

3. Methodology and Materials
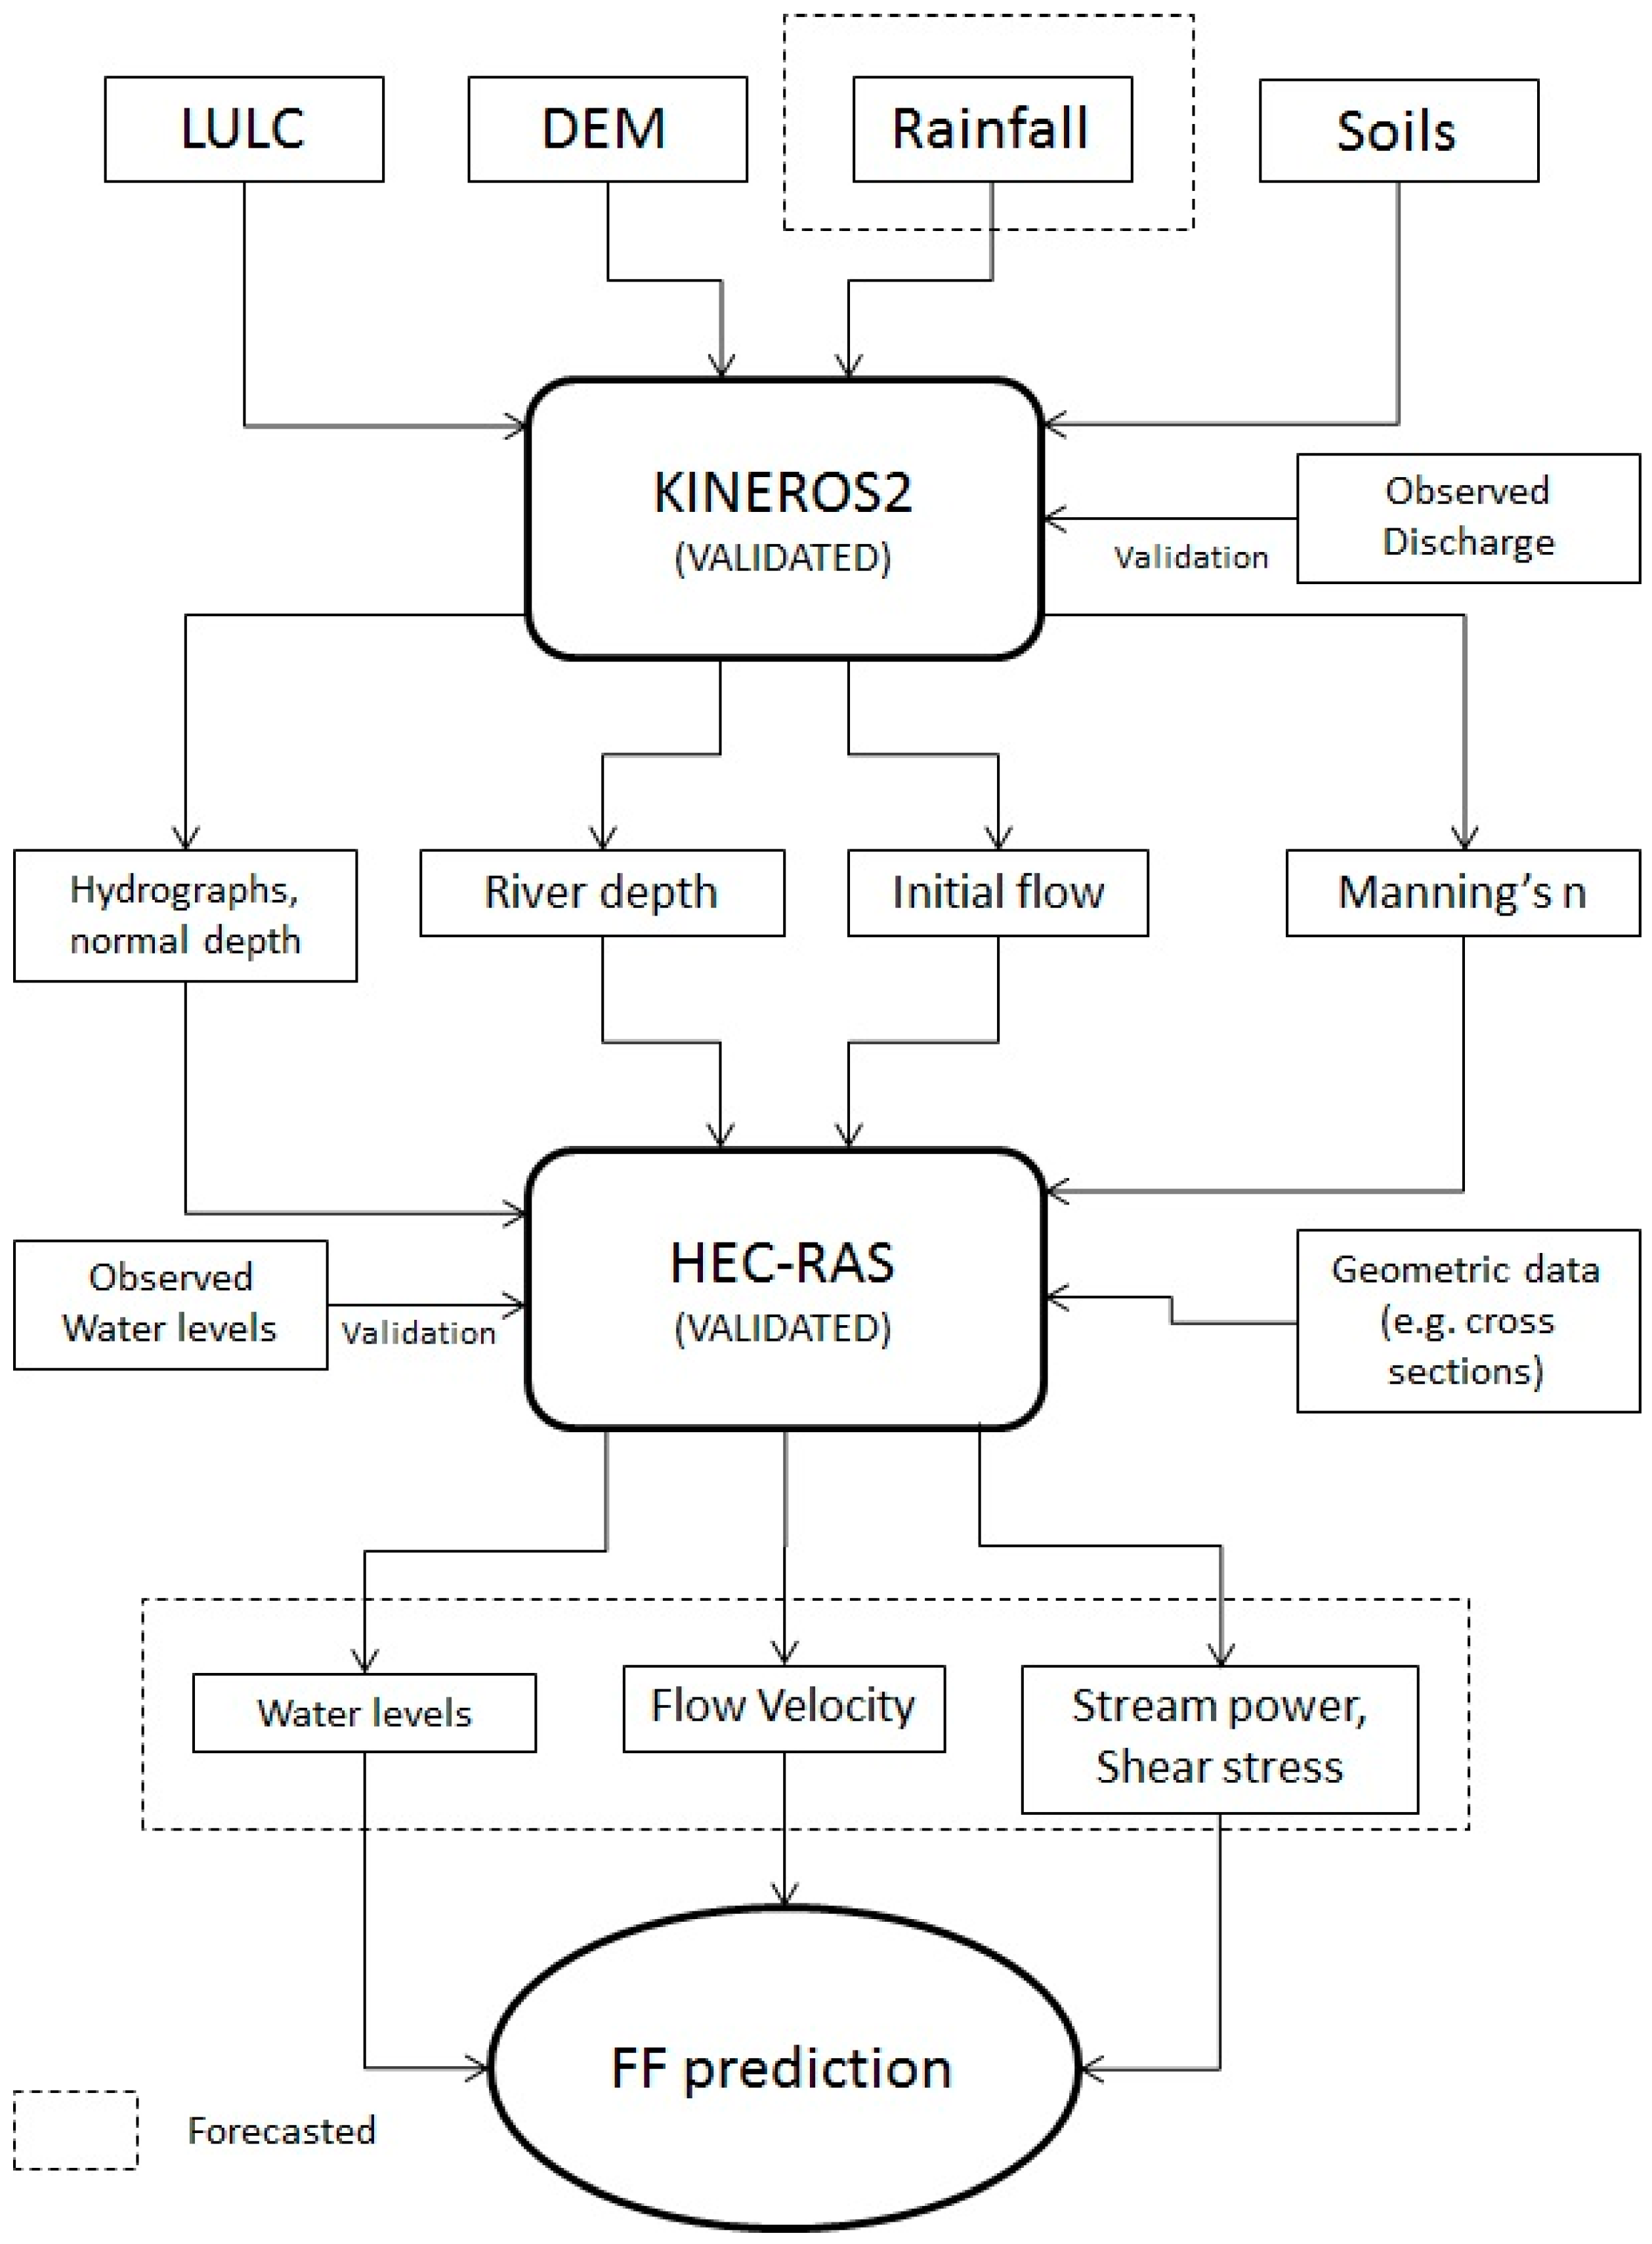
3.1. Study Flow Chart
3.2. Model Description
3.2.1. KINEROS2

3.2.2. The HEC-RAS
3.3. Coupling of KINEROS2 and HEC-RAS
3.4. Calibration and Validation for KINEROS2 and HEC-RAS
3.5. Data for KINEROS2
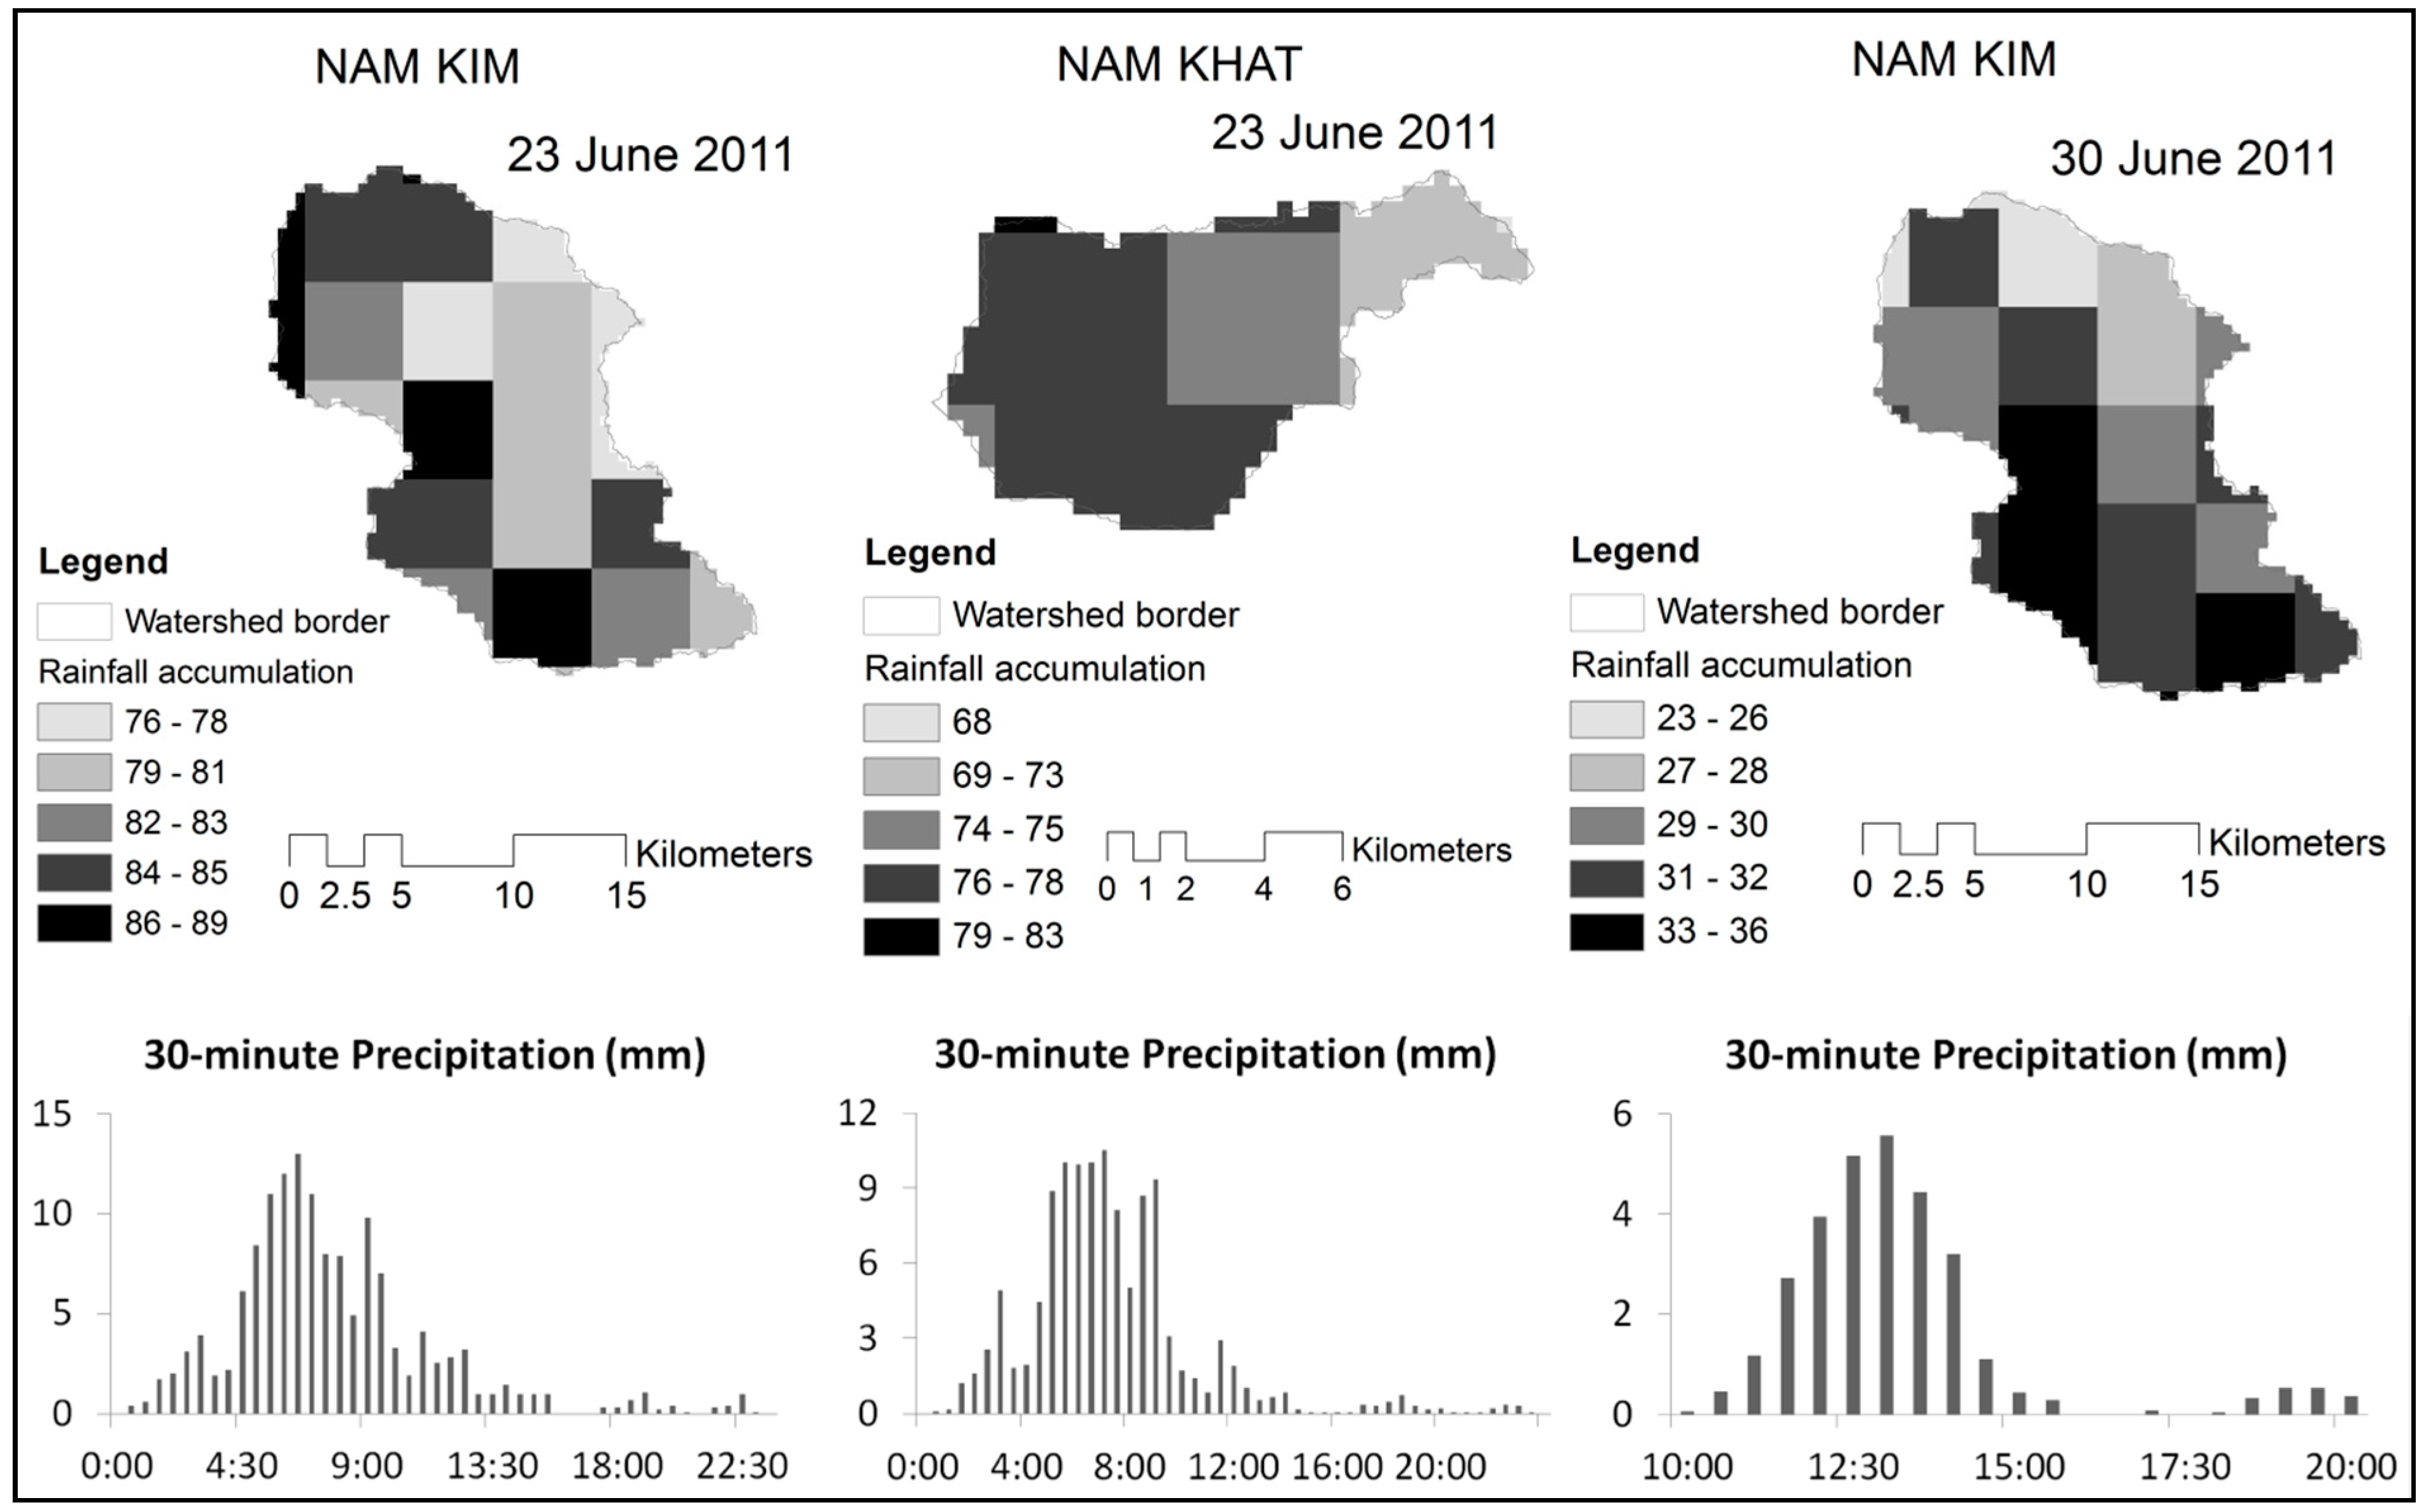
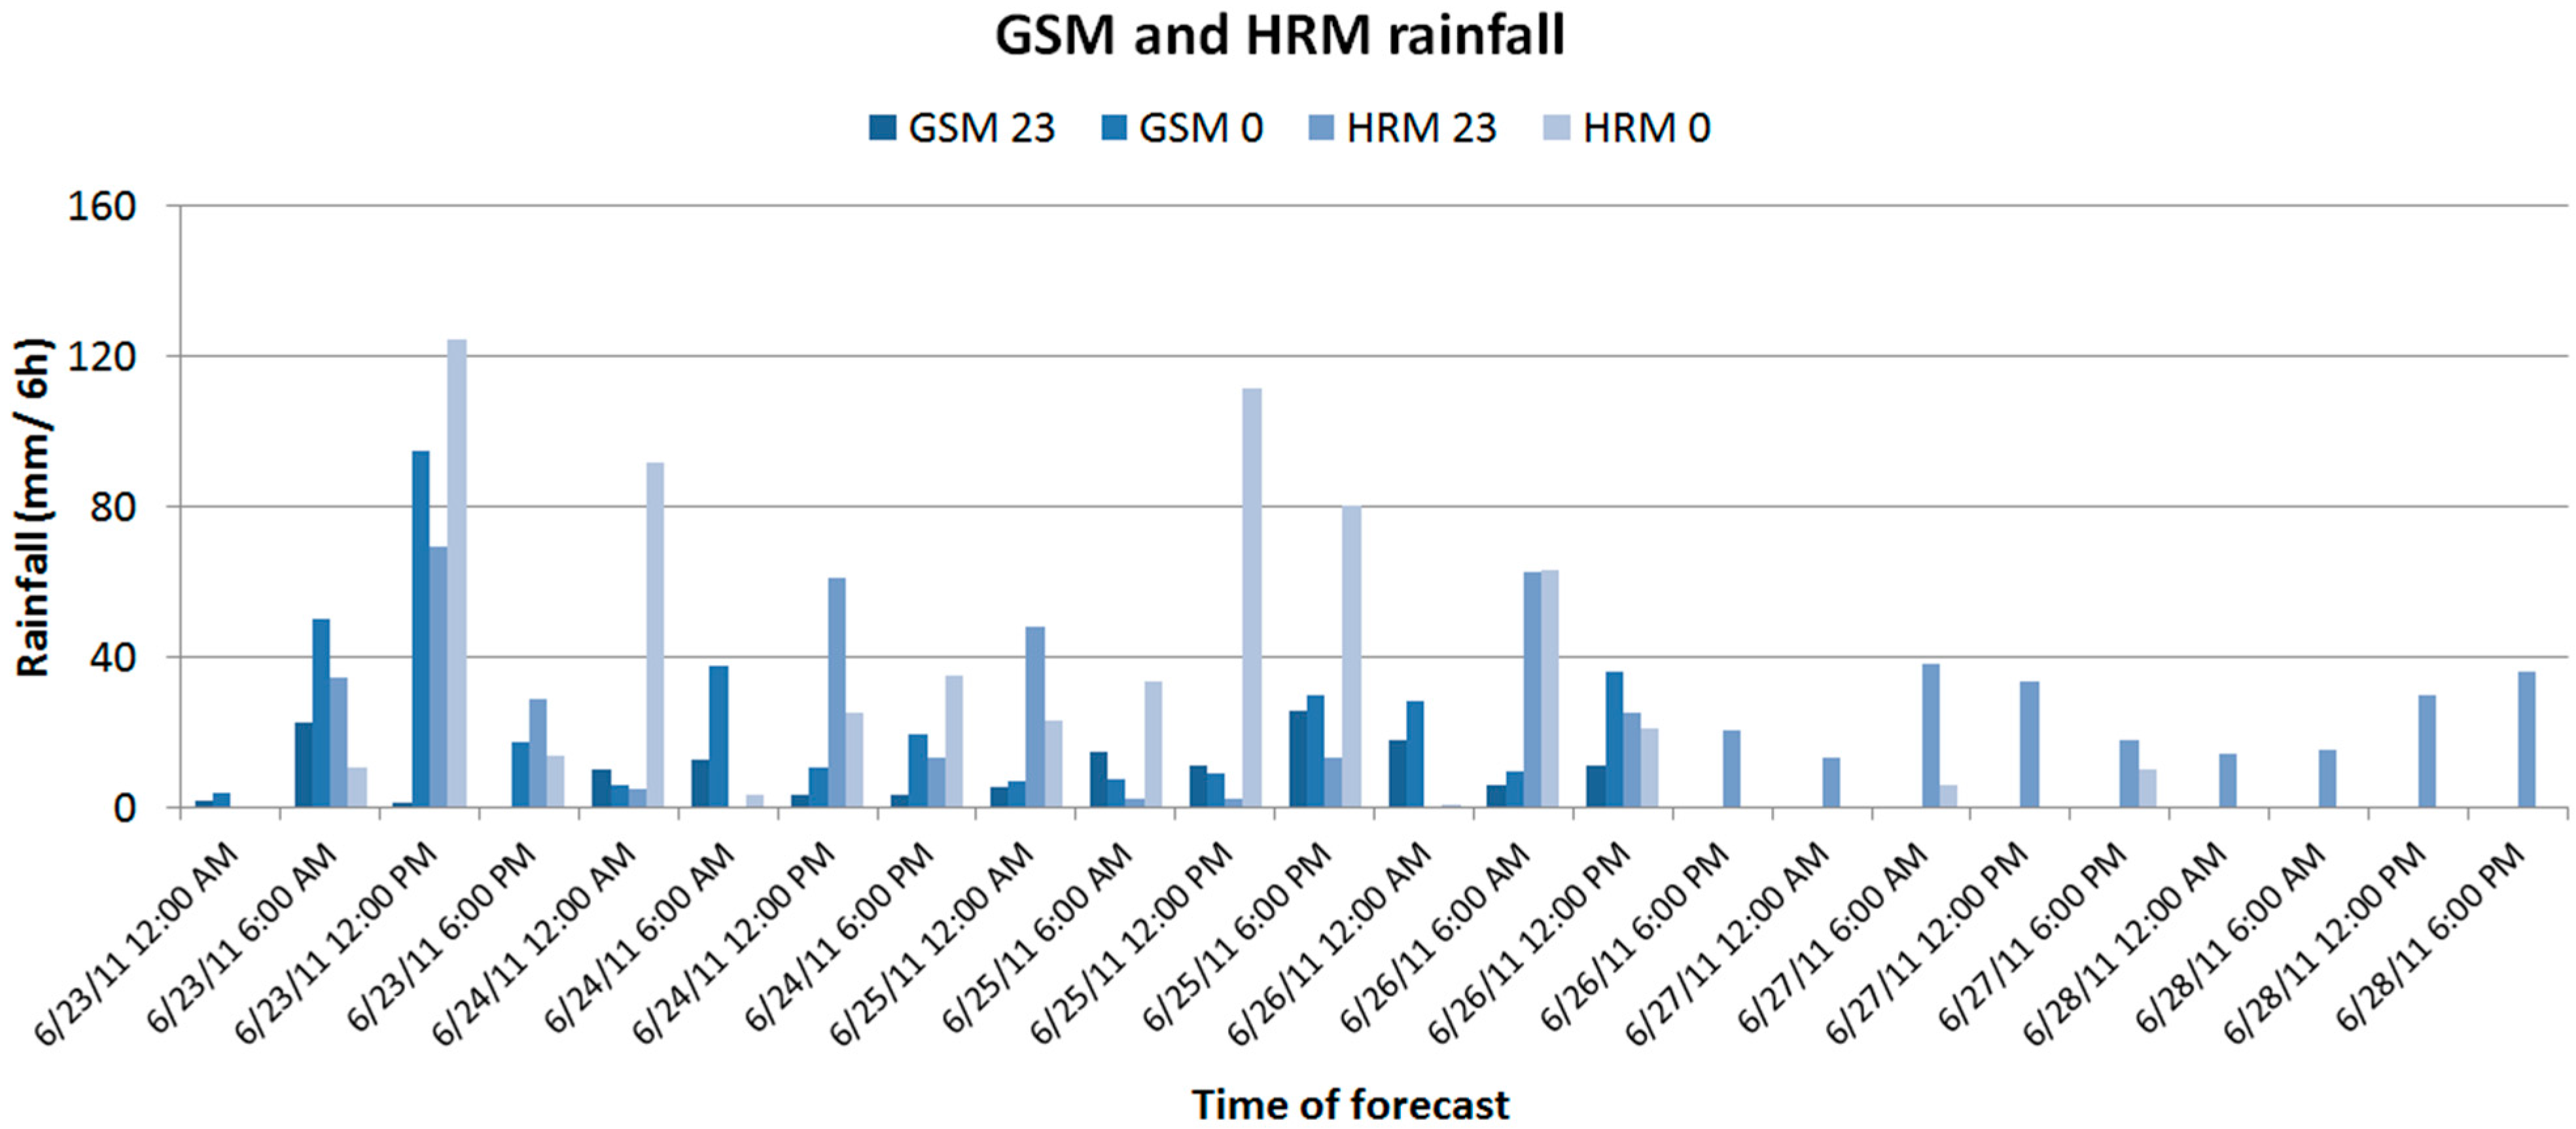
3.5.1. Rainfall
3.5.2. Land Use, Digital Elevation Model, Soil and Discharge Data
3.6. Data for HEC-RAS
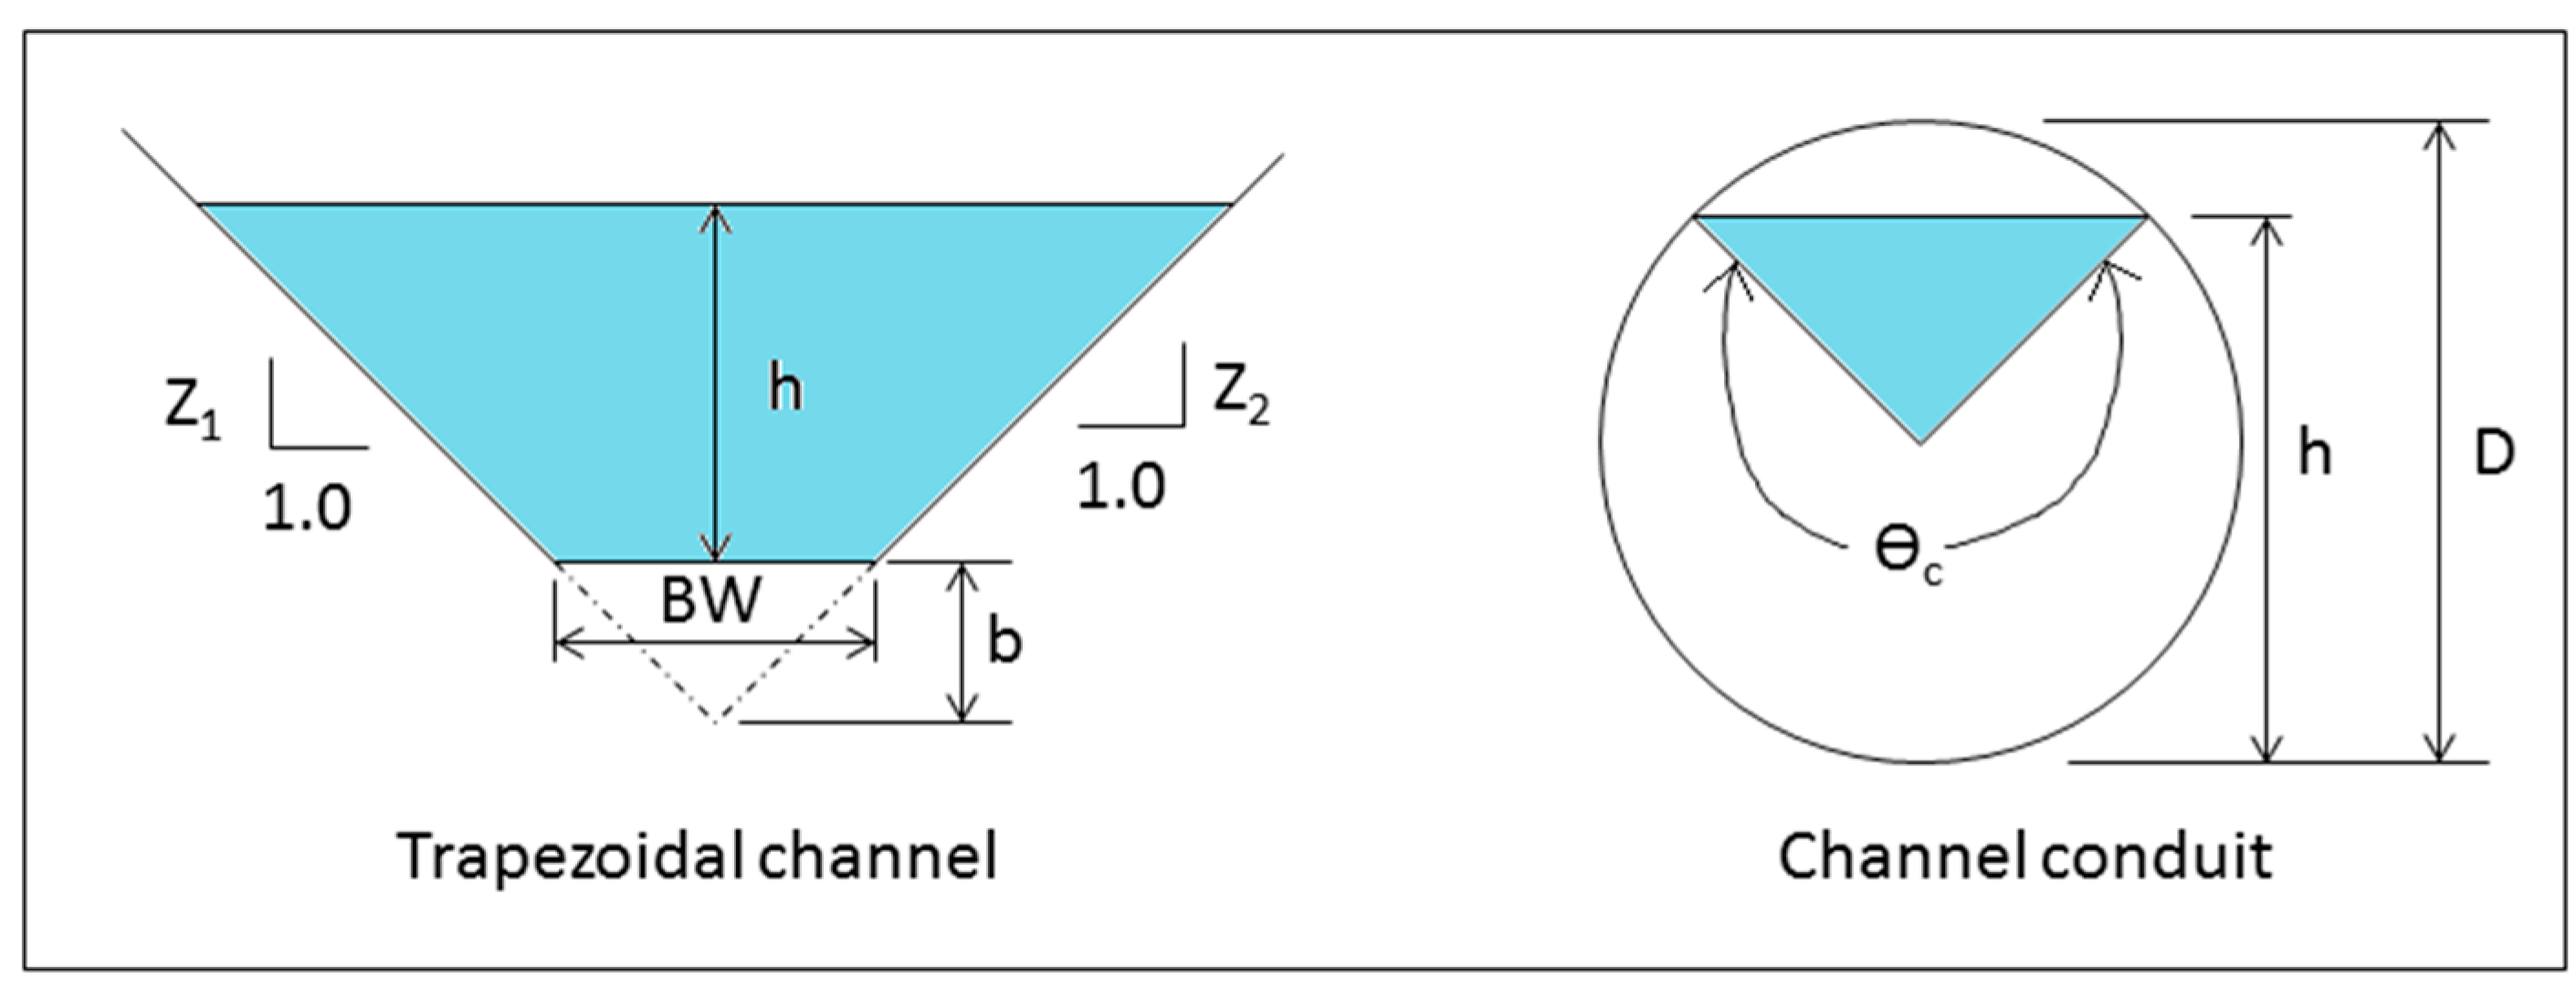
3.6.1. Geometric Data

| River Stations | Min Chl Elevation (m) | W.S. Elevation (m) | E.G. Elevation (m) | E.G. Slope (m/m) | Flow Area (m2) | Top Width (m) |
|---|---|---|---|---|---|---|
| 101 | 904.2 | 907.0 | 907.4 | 0.0014 | 121.3 | 53.3 |
| 102 | 903.4 | 906.0 | 906.9 | 0.0043 | 85.4 | 53.6 |
| 103 | 901.0 | 903.9 | 906.1 | 0.0089 | 54.0 | 31.2 |
| 104 | 899.3 | 903.4 | 903.7 | 0.0007 | 155.0 | 56.3 |
| 105 | 899.5 | 902.8 | 903.4 | 0.0021 | 90.1 | 34.7 |
| 106 | 898.8 | 901.9 | 903.0 | 0.0040 | 67.9 | 26.4 |
| 107 | 899.3 | 901.7 | 902.2 | 0.0022 | 101.4 | 46.8 |
| 108 | 898.5 | 900.6 | 901.9 | 0.0075 | 67.8 | 44.3 |
| 109 | 896.9 | 899.2 | 900.3 | 0.0053 | 70.5 | 38.4 |
| 110 | 896.0 | 897.8 | 898.7 | 0.0066 | 76.3 | 52.7 |
| 111 | 893.8 | 896.3 | 899.6 | 0.0188 | 51.3 | 39.9 |
| 112 | 890.7 | 892.4 | 893.9 | 0.0109 | 57.8 | 37.5 |
| 113 | 888.0 | 889.5 | 891.8 | 0.0269 | 46.8 | 45.1 |
| 114 | 880.6 | 883.5 | 884.6 | 0.0044 | 69.2 | 30.6 |
| 115 | 880.4 | 882.6 | 883.3 | 0.0039 | 83.9 | 45.0 |
| 116 | 879.0 | 882.7 | 882.9 | 0.0004 | 195.6 | 61.0 |
| River Stations | Min Chl Elevation (m) | W.S. Elevation (m) | E.G. Elevation (m) | E.G. Slope (m/m) | Flow Area (m2) | Top Width (m) |
|---|---|---|---|---|---|---|
| 101 | 1250.5 | 1252.5 | 1253.1 | 0.0184 | 62.2 | 34.7 |
| 102 | 1247.2 | 1249.5 | 1250.0 | 0.0229 | 65.0 | 44.2 |
| 103 | 1245.4 | 1246.8 | 1247.6 | 0.0239 | 54.6 | 42.1 |
| 104 | 1239.3 | 1243.2 | 1244.1 | 0.0186 | 53.1 | 20.3 |
| 105 | 1236.9 | 1240.2 | 1241.0 | 0.0173 | 63.6 | 36.3 |
| 106 | 1235.1 | 1237.9 | 1238.4 | 0.0194 | 70.3 | 36.0 |
| 107 | 1233.9 | 1236.0 | 1236.6 | 0.0152 | 67.9 | 48.6 |
| 108 | 1228.1 | 1232.7 | 1233.4 | 0.0189 | 66.9 | 24.0 |
| 109 | 1226.2 | 1230.5 | 1231.2 | 0.0136 | 68.7 | 26.2 |
| 110 | 1223.8 | 1228.0 | 1229.2 | 0.0198 | 50.5 | 18.6 |
| 111 | 1220.1 | 1224.1 | 1225.3 | 0.0164 | 46.9 | 16.8 |
| 112 | 1216.0 | 1220.1 | 1220.8 | 0.0126 | 63.7 | 28.4 |
3.6.2. On-Site Measured River Discharge and Water Levels
3.7. Regionalization Technique
4. Results and Discussion
4.1. Model Calibration and Validation
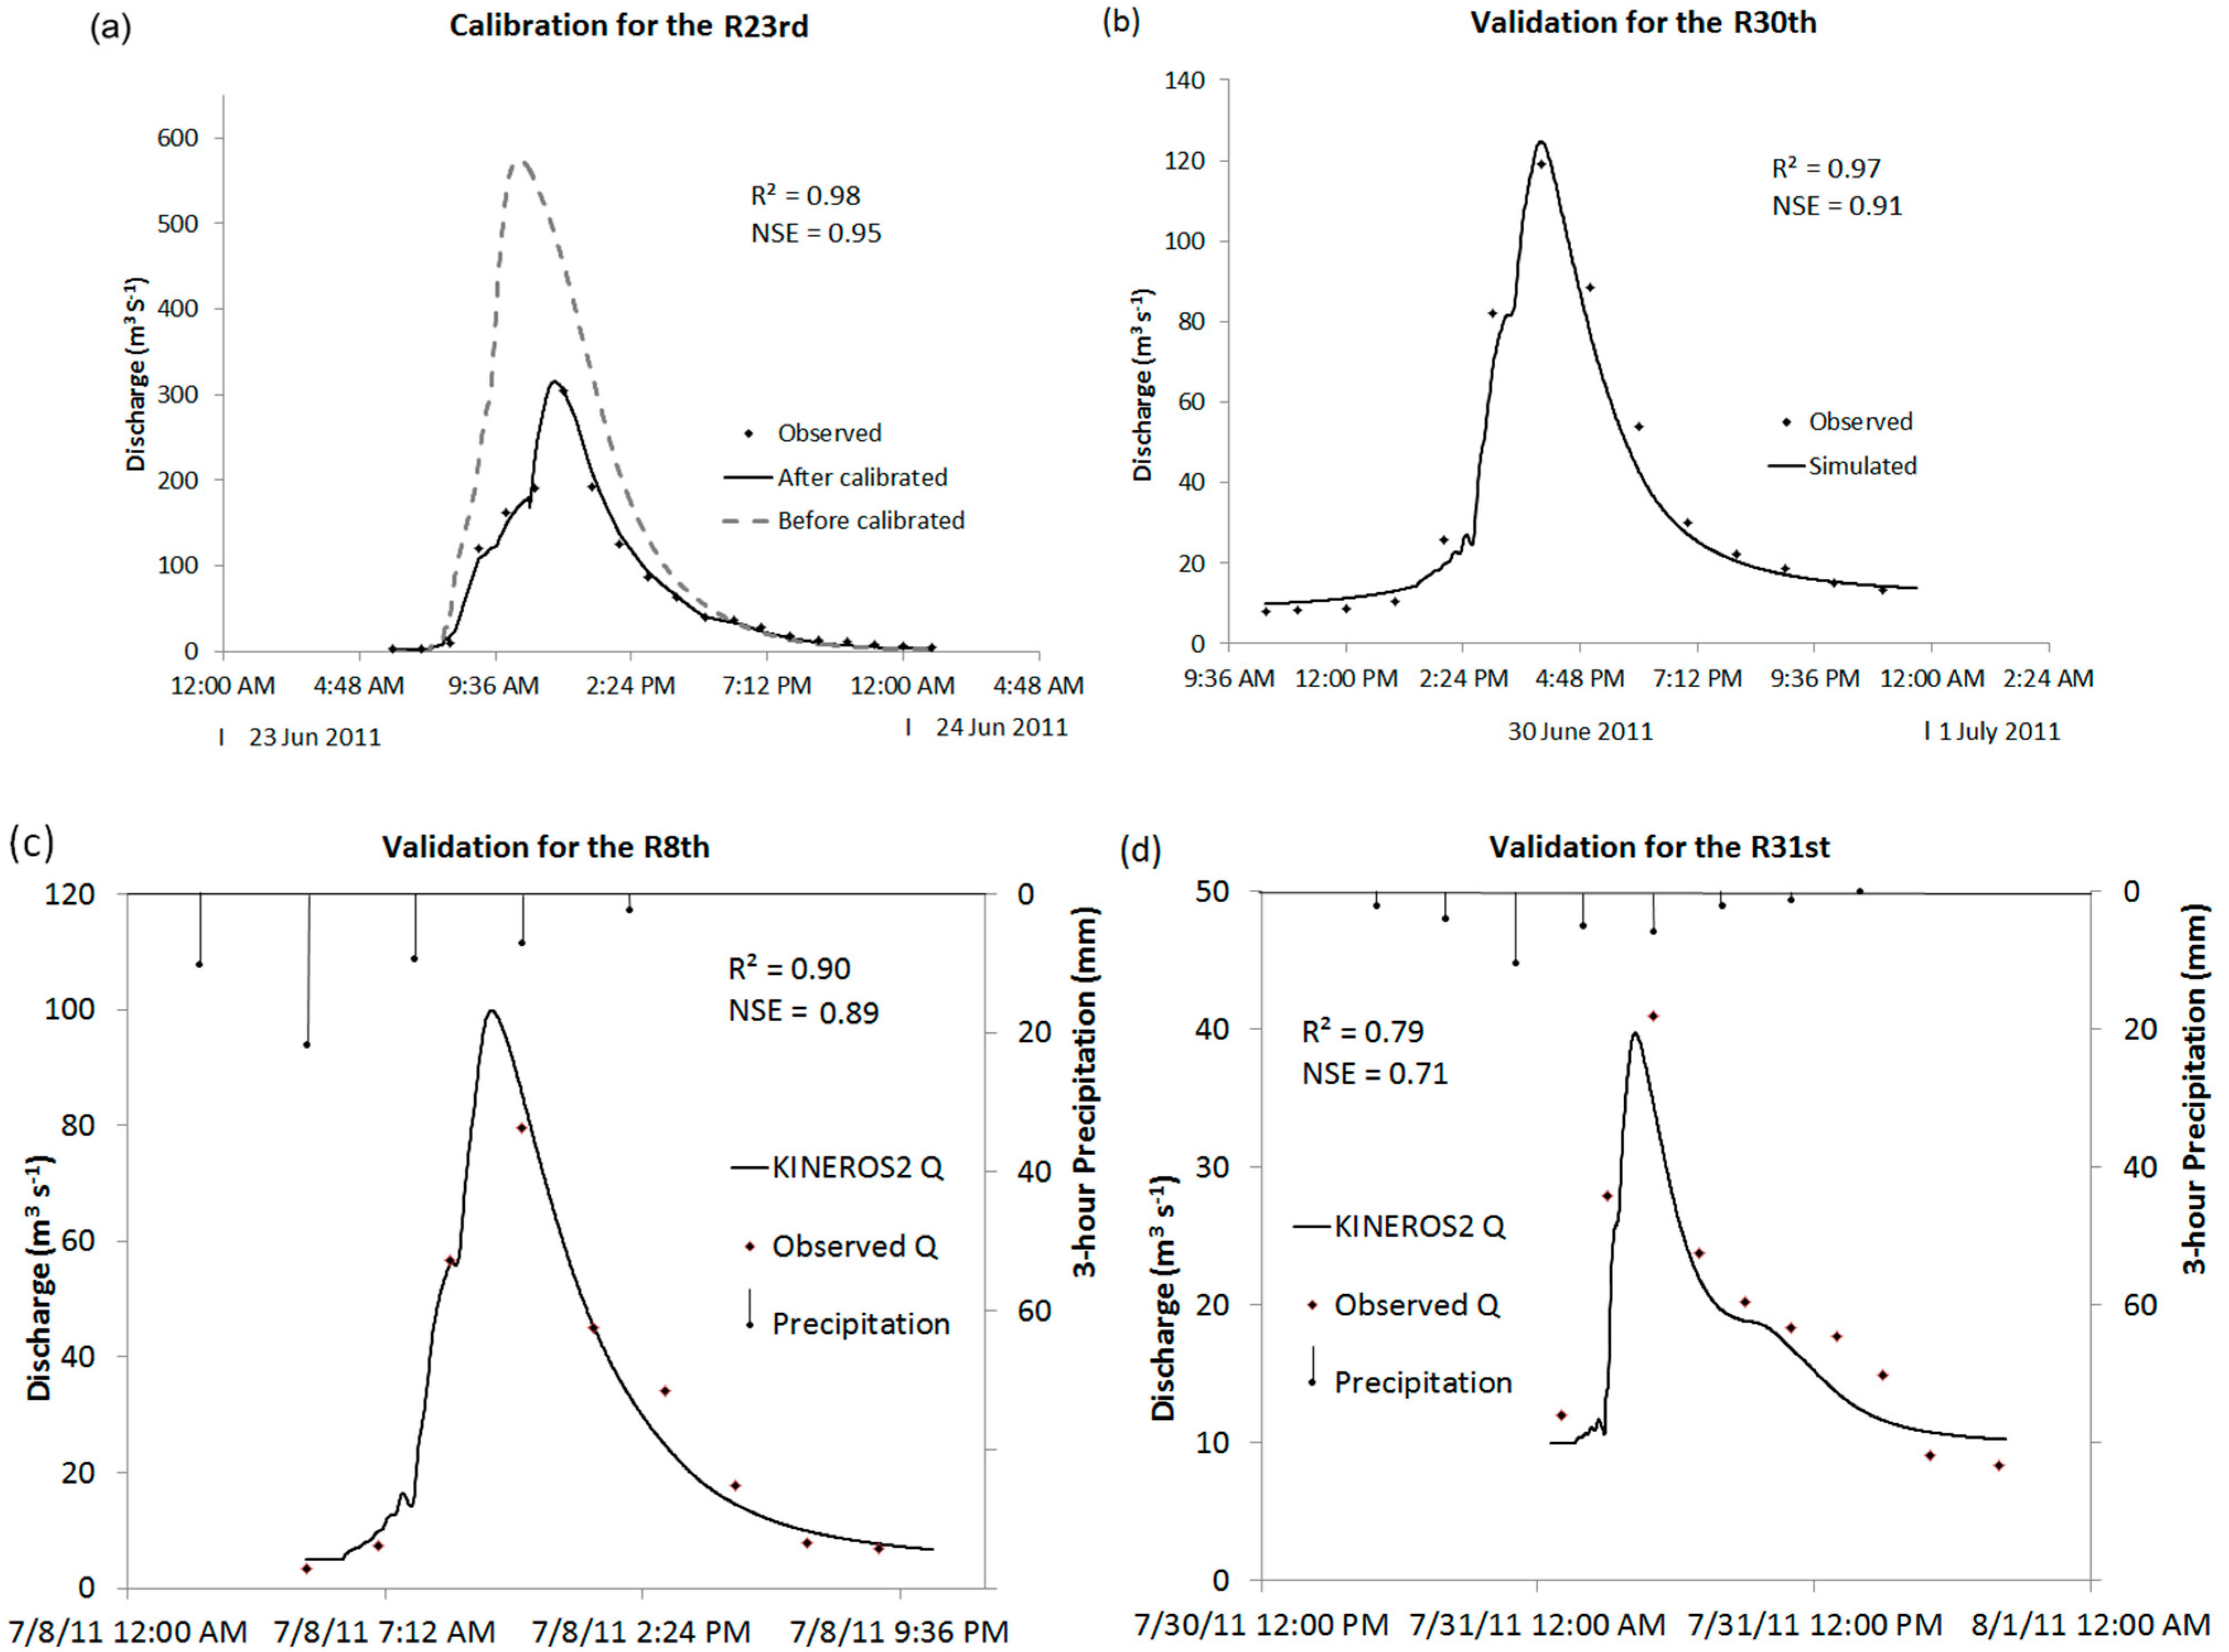
4.1.1. KINEROS2

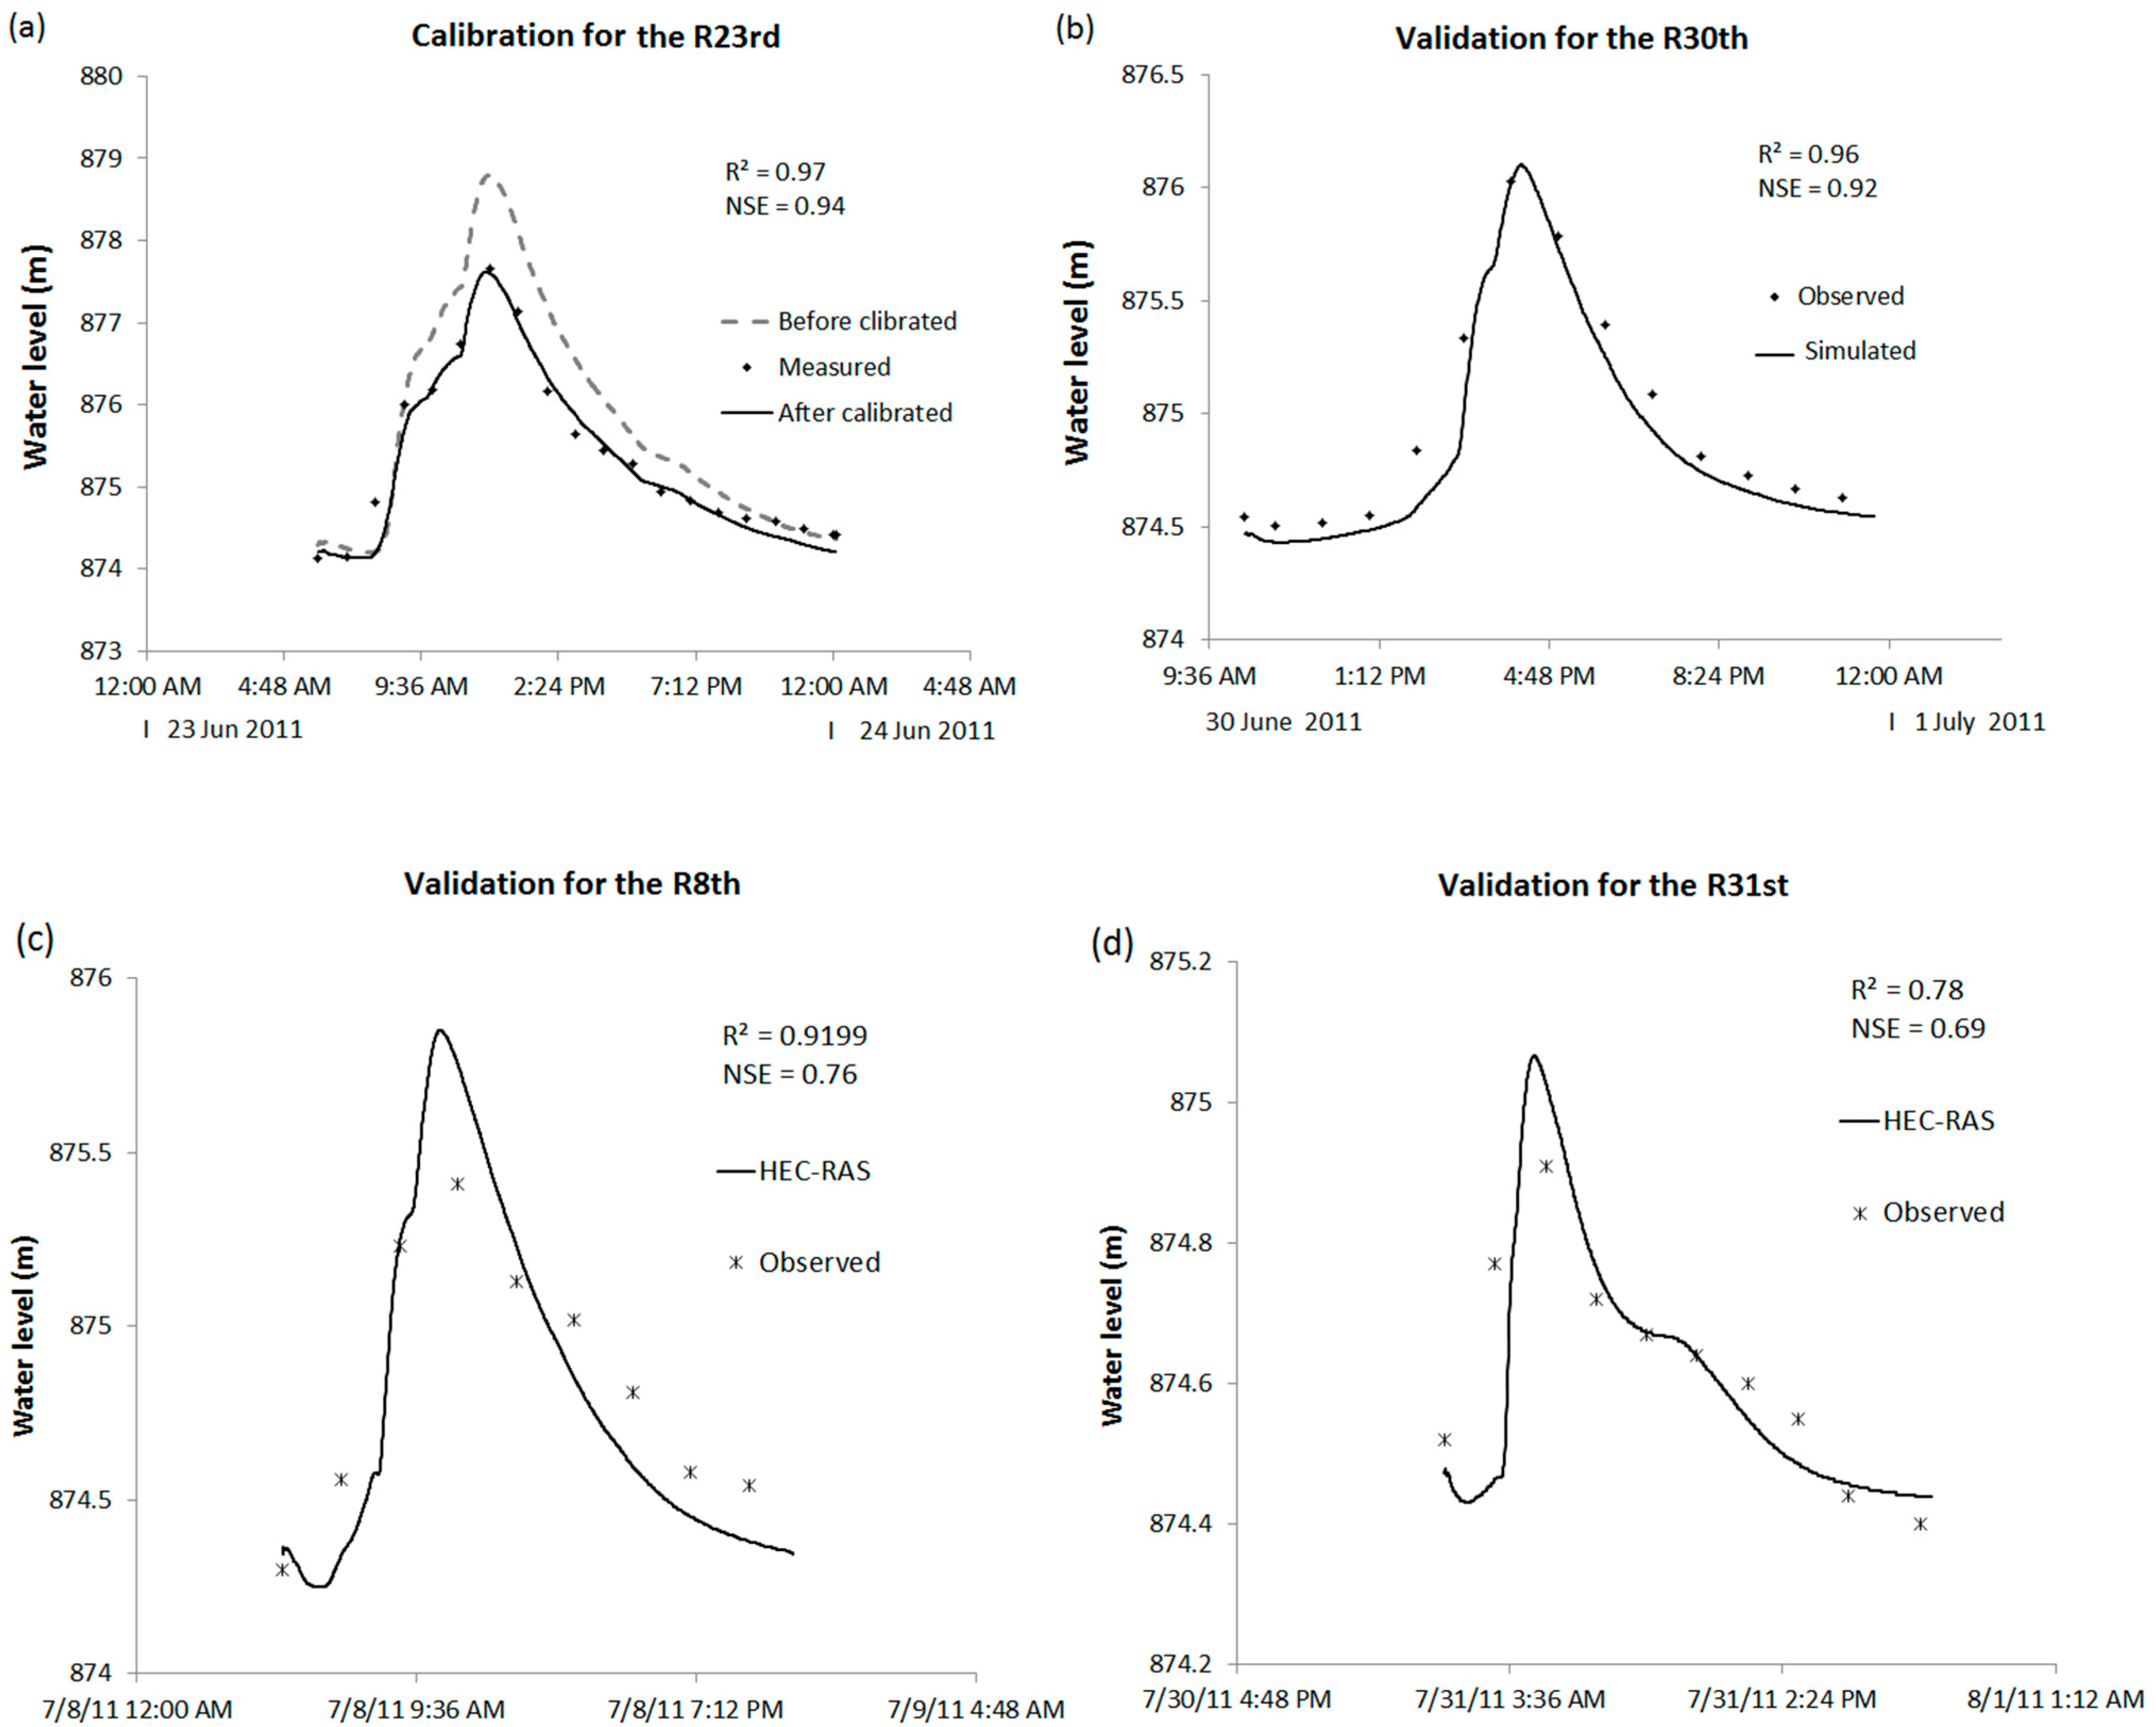
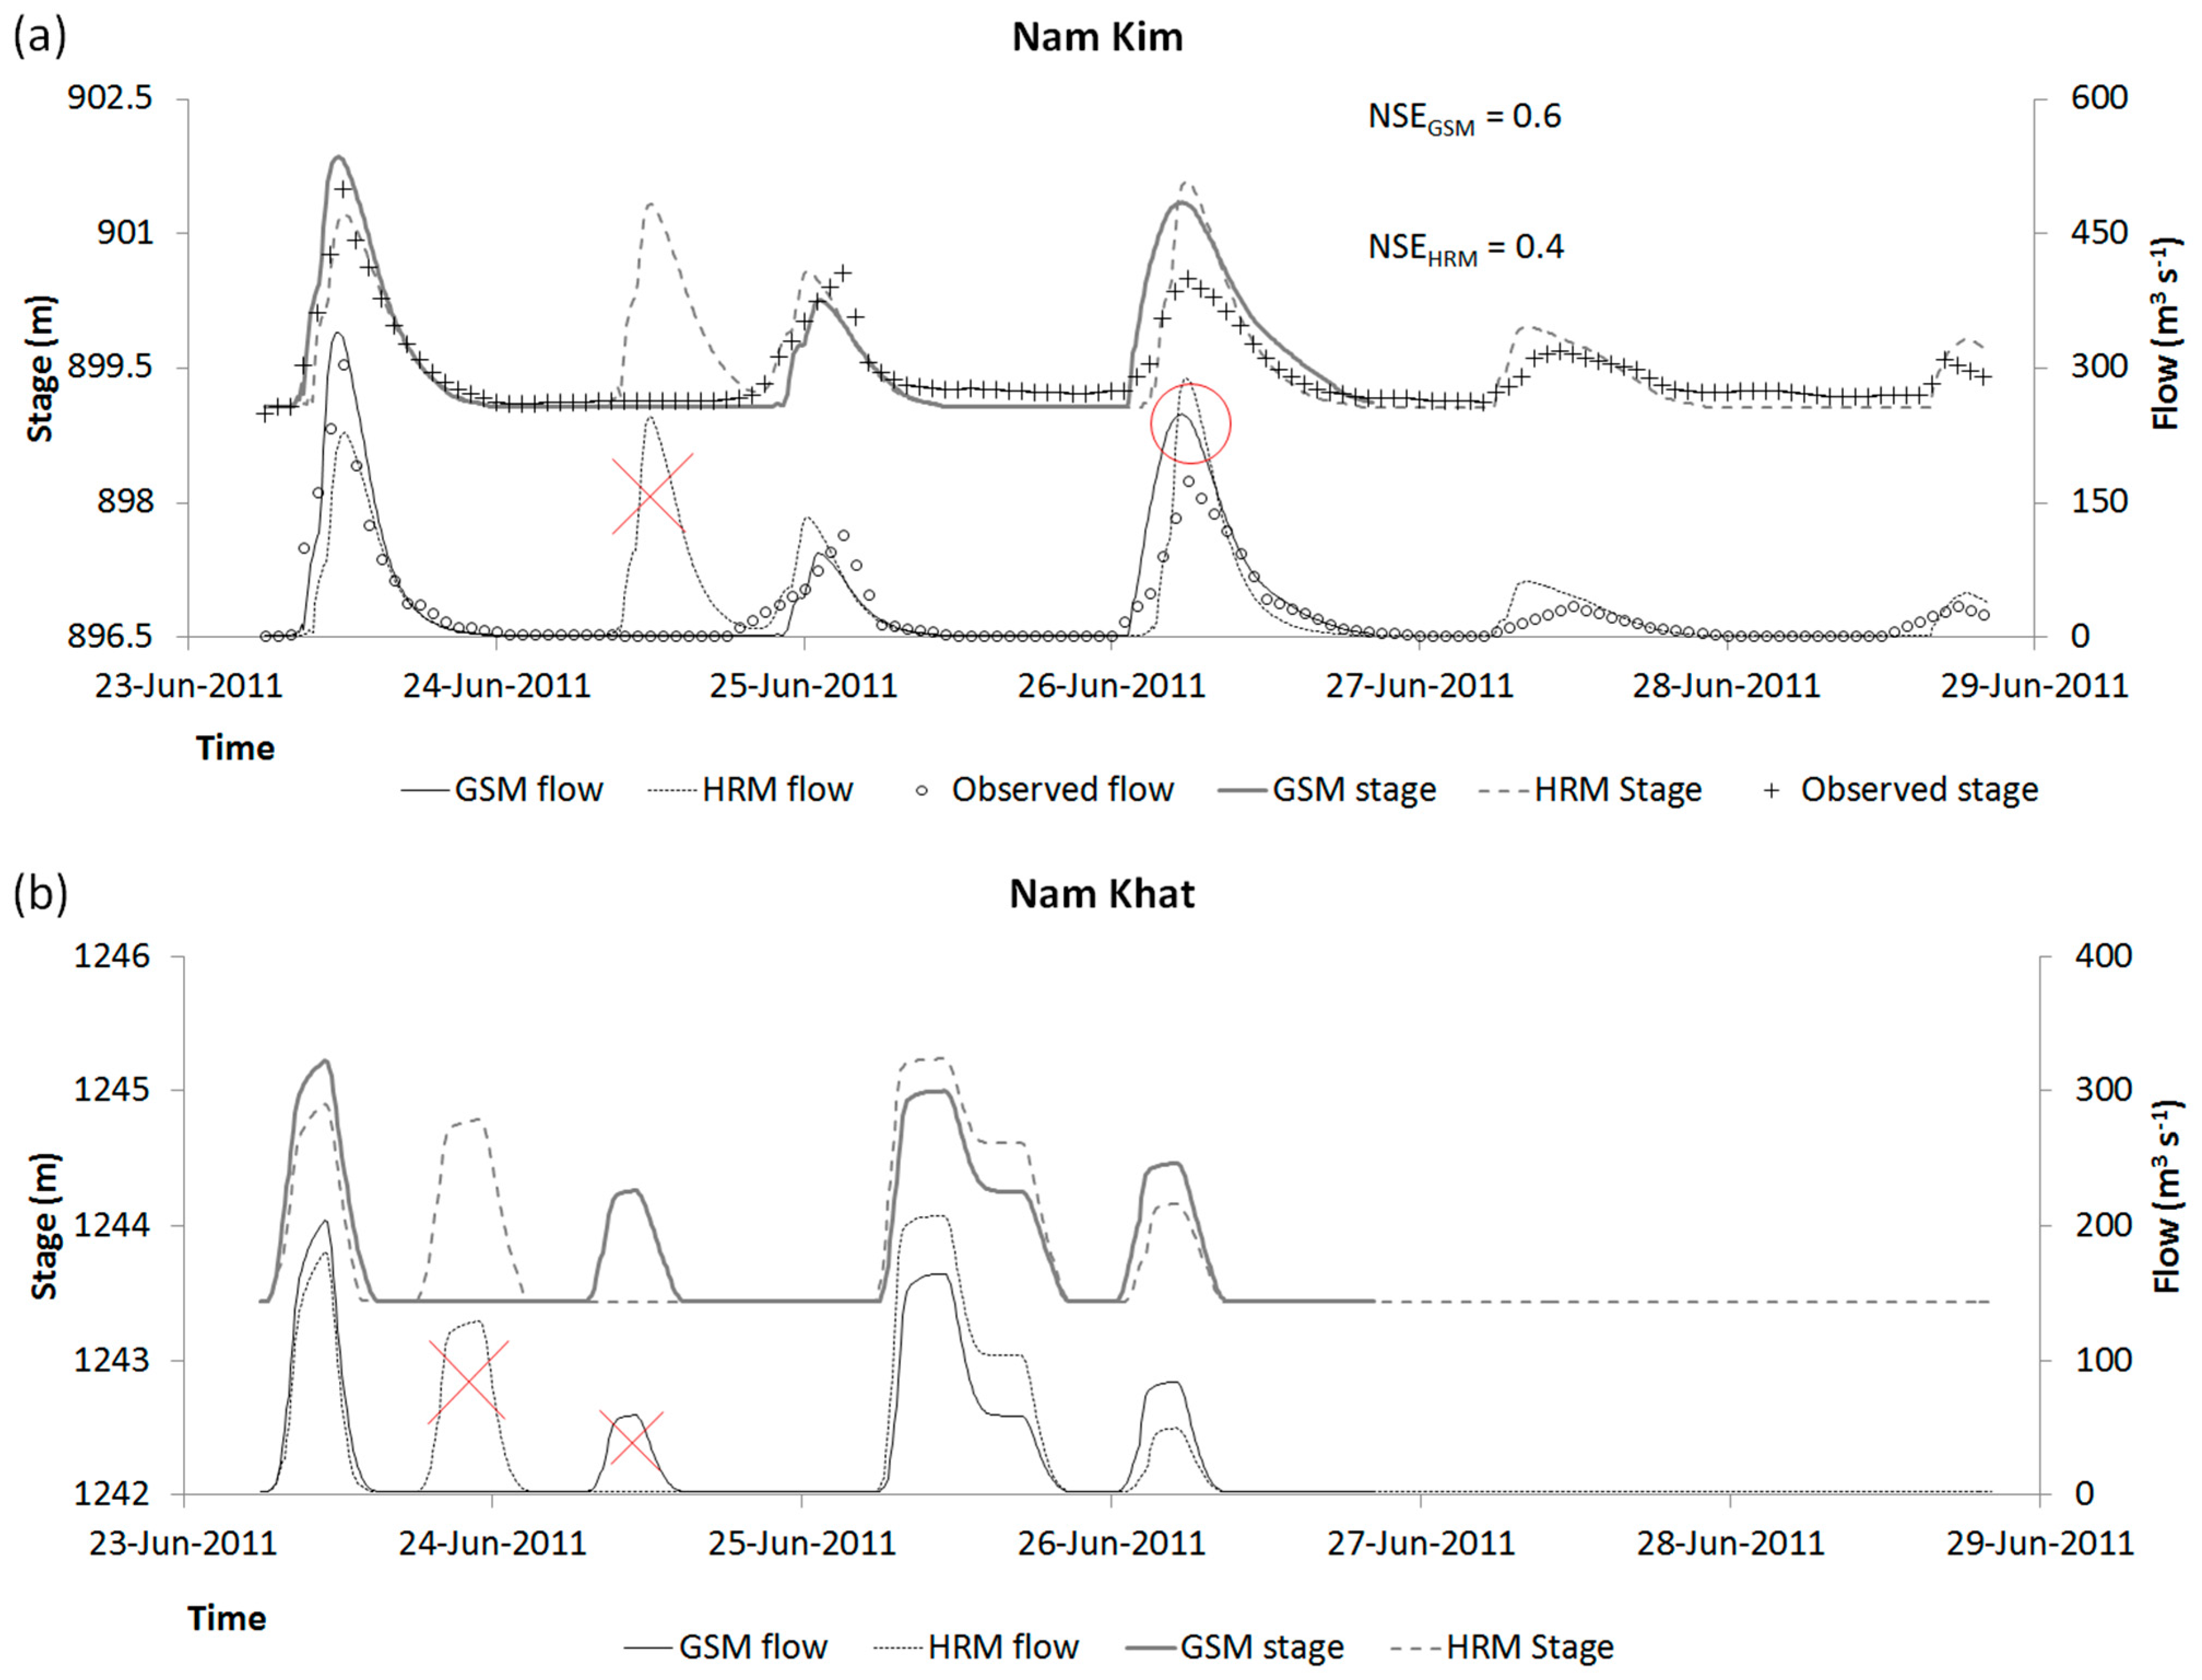
4.1.2. HEC-RAS

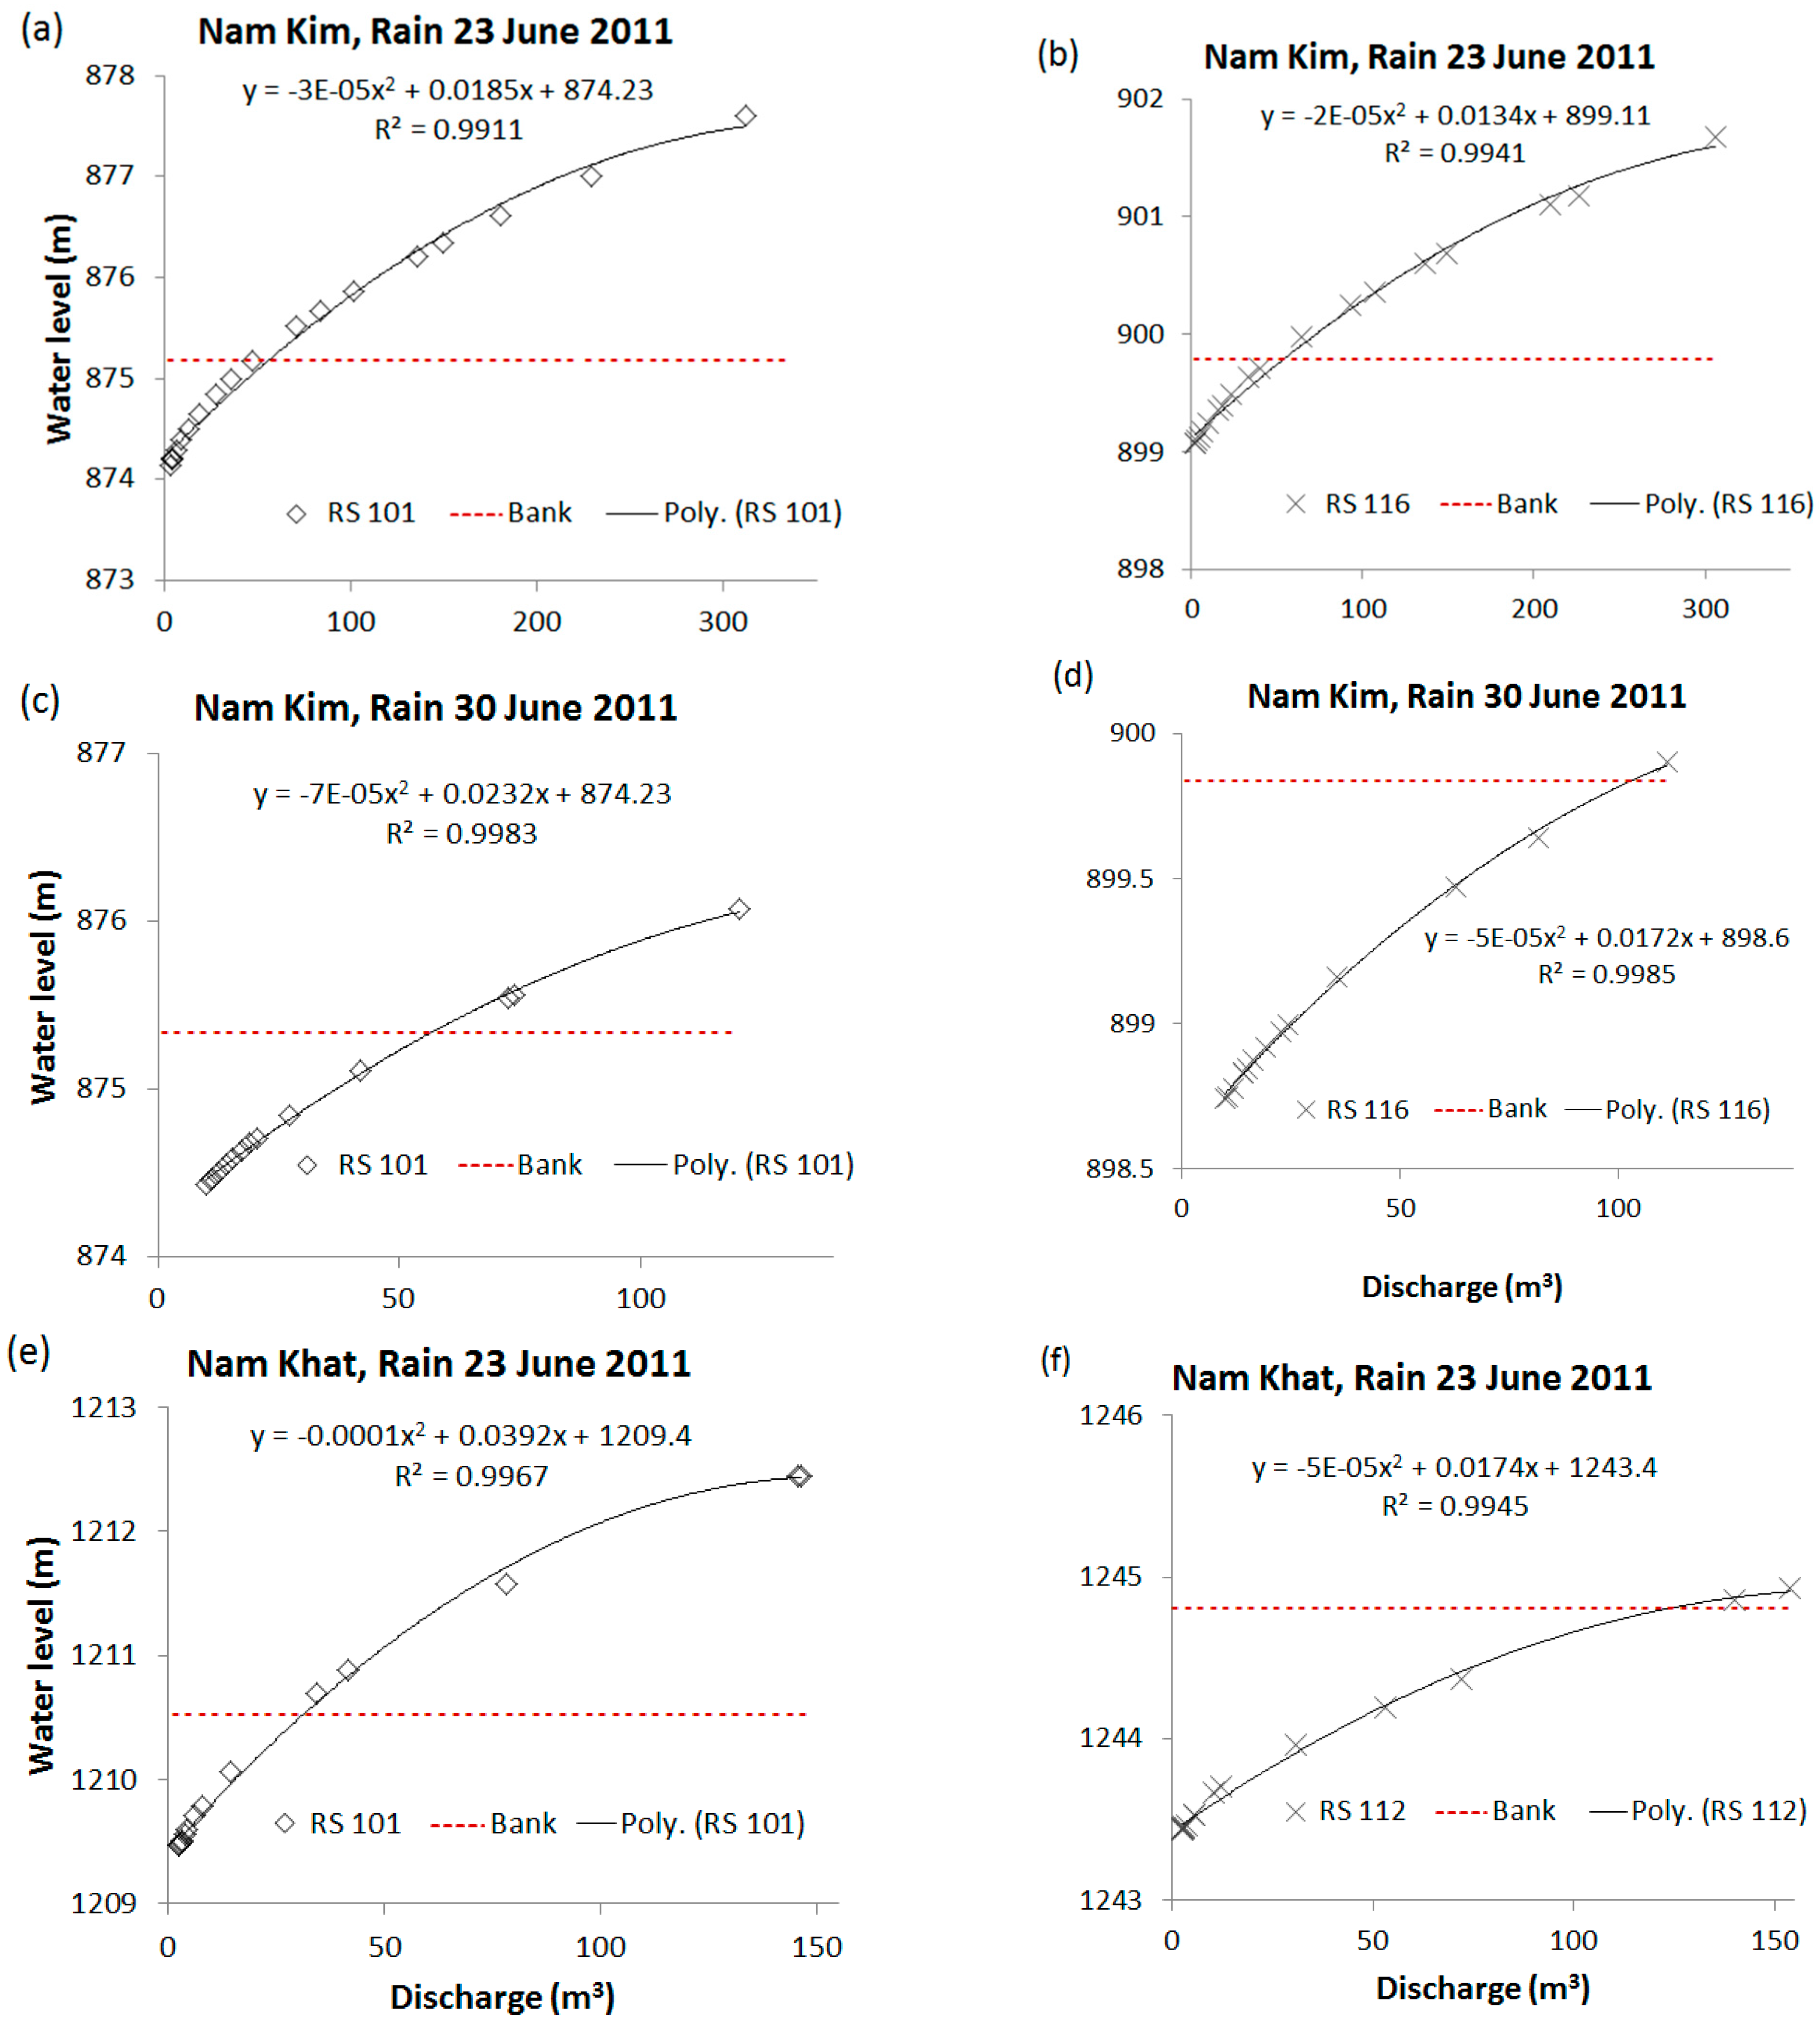
4.2. Relationship between HEC-RAS Discharge and Water Level

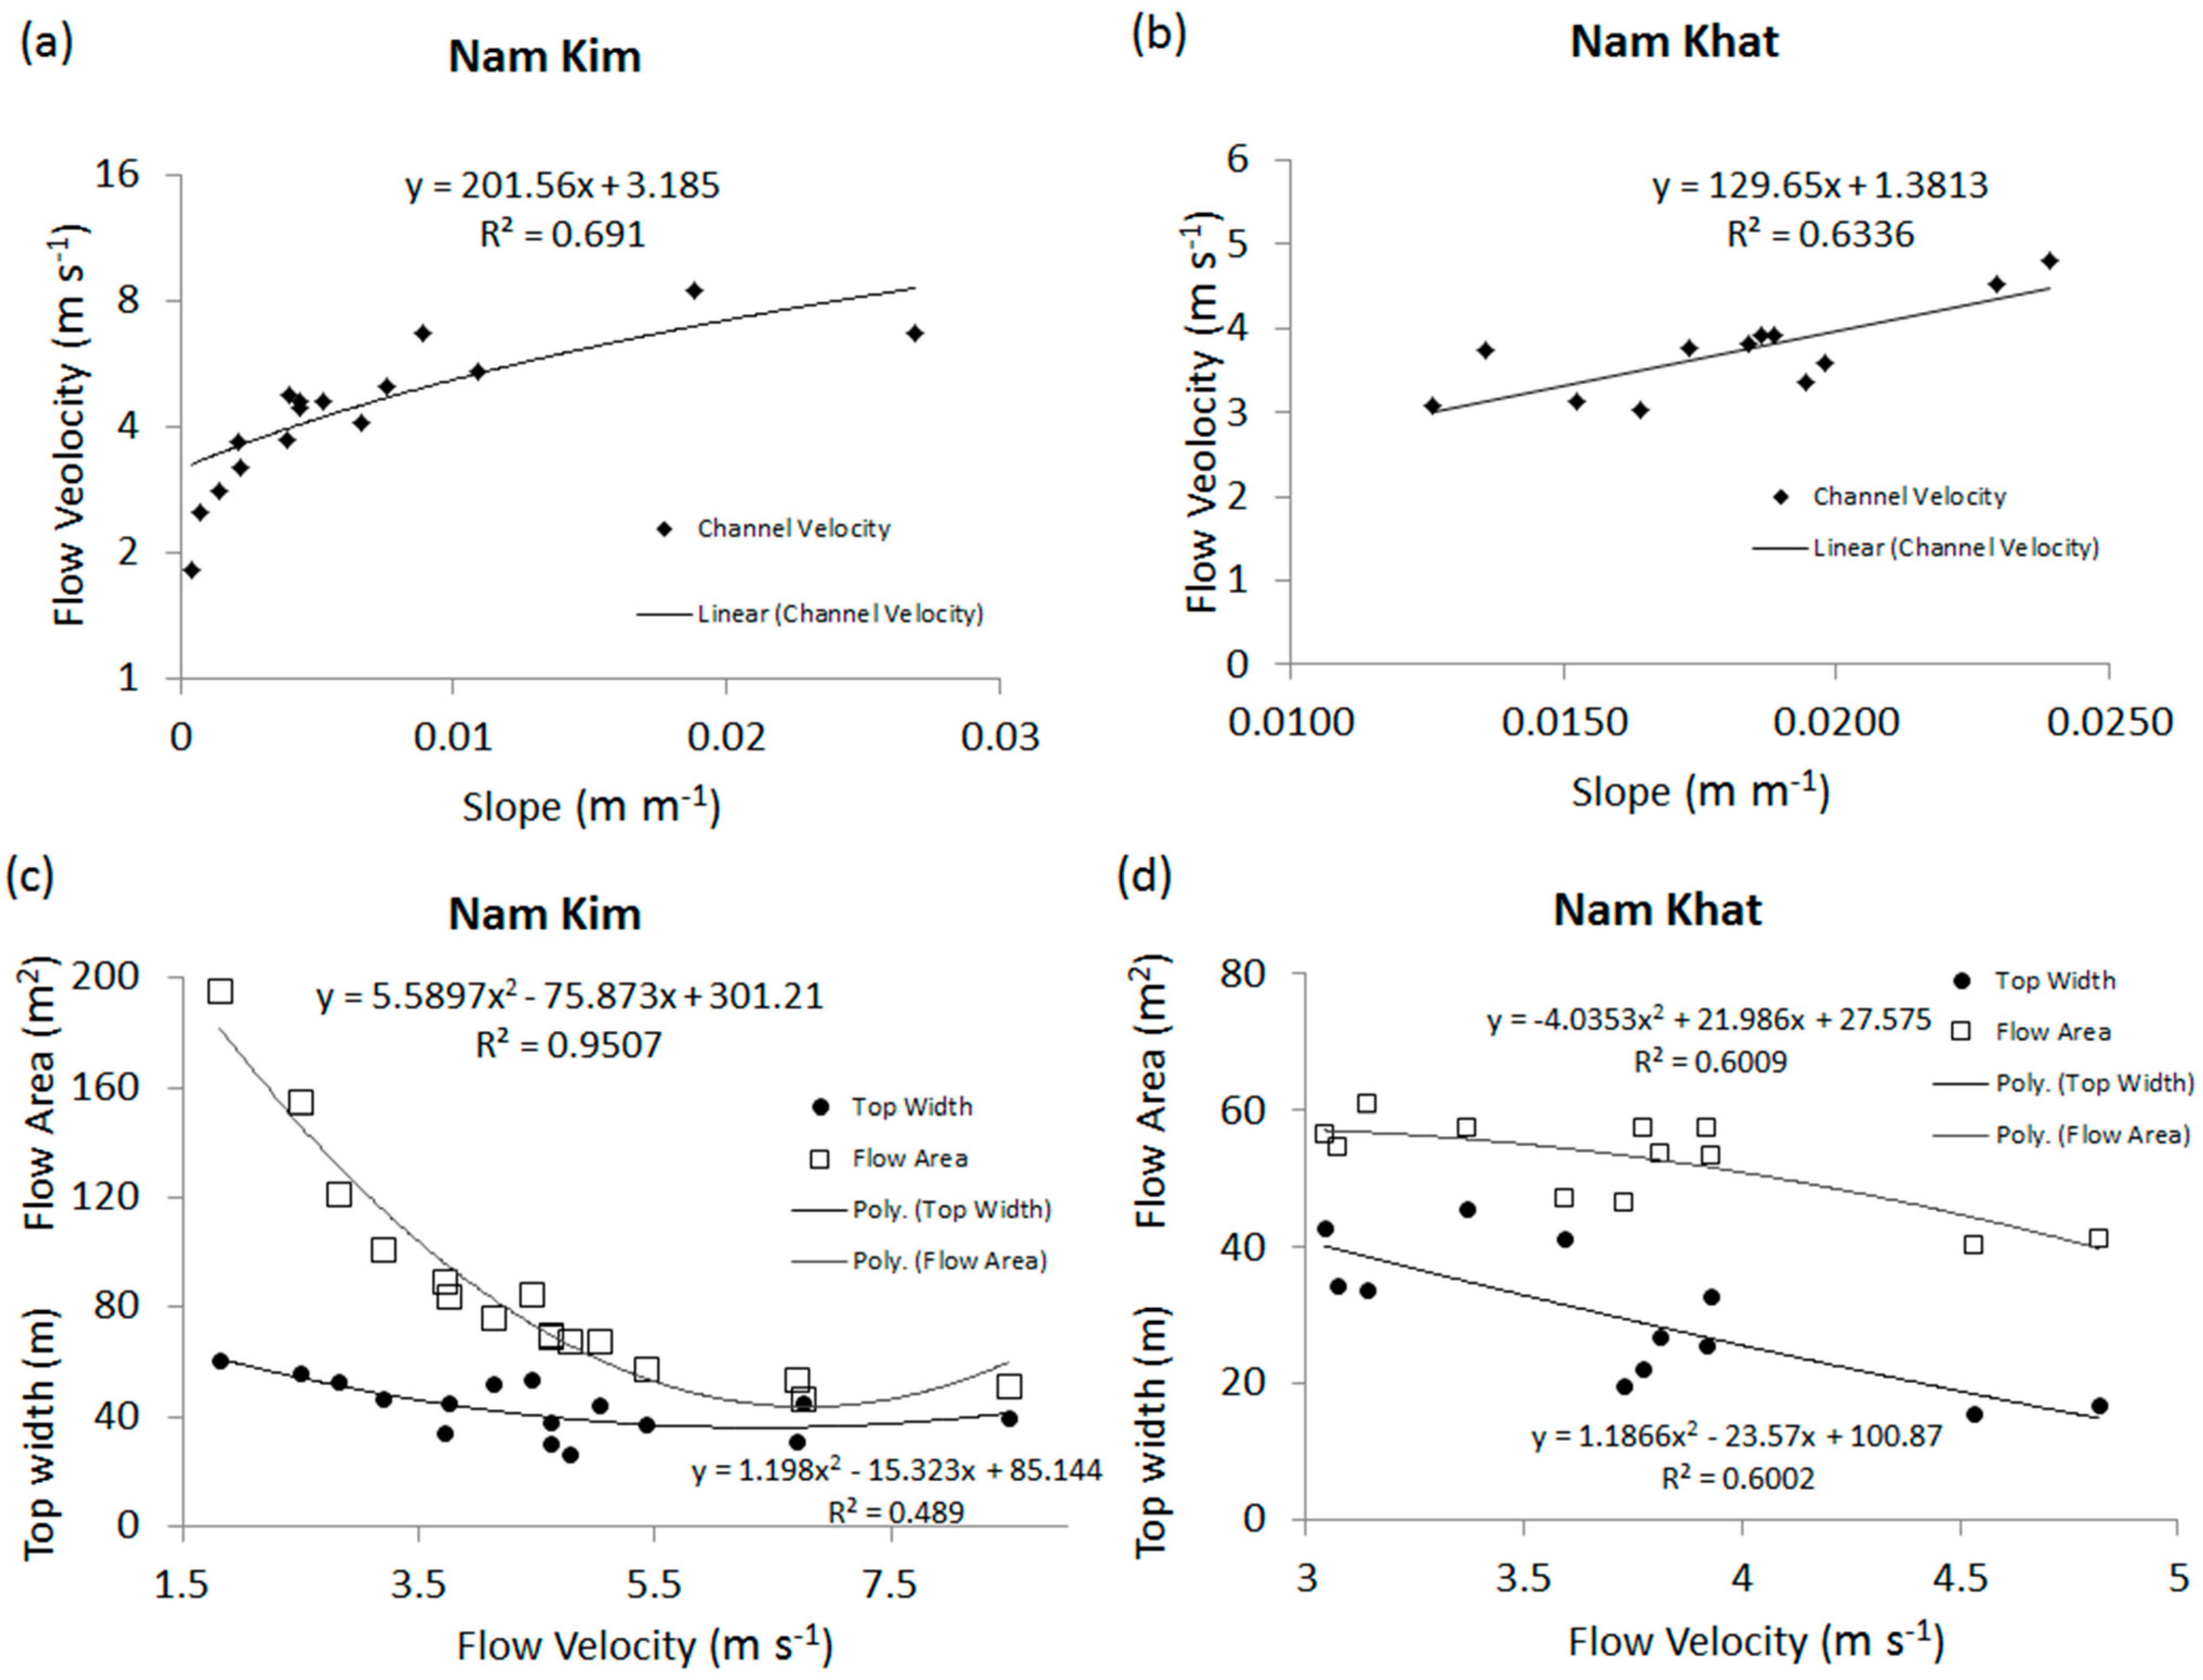
4.3. Relationship between HEC-RAS Flow Velocity, Channel Slope and Top Width
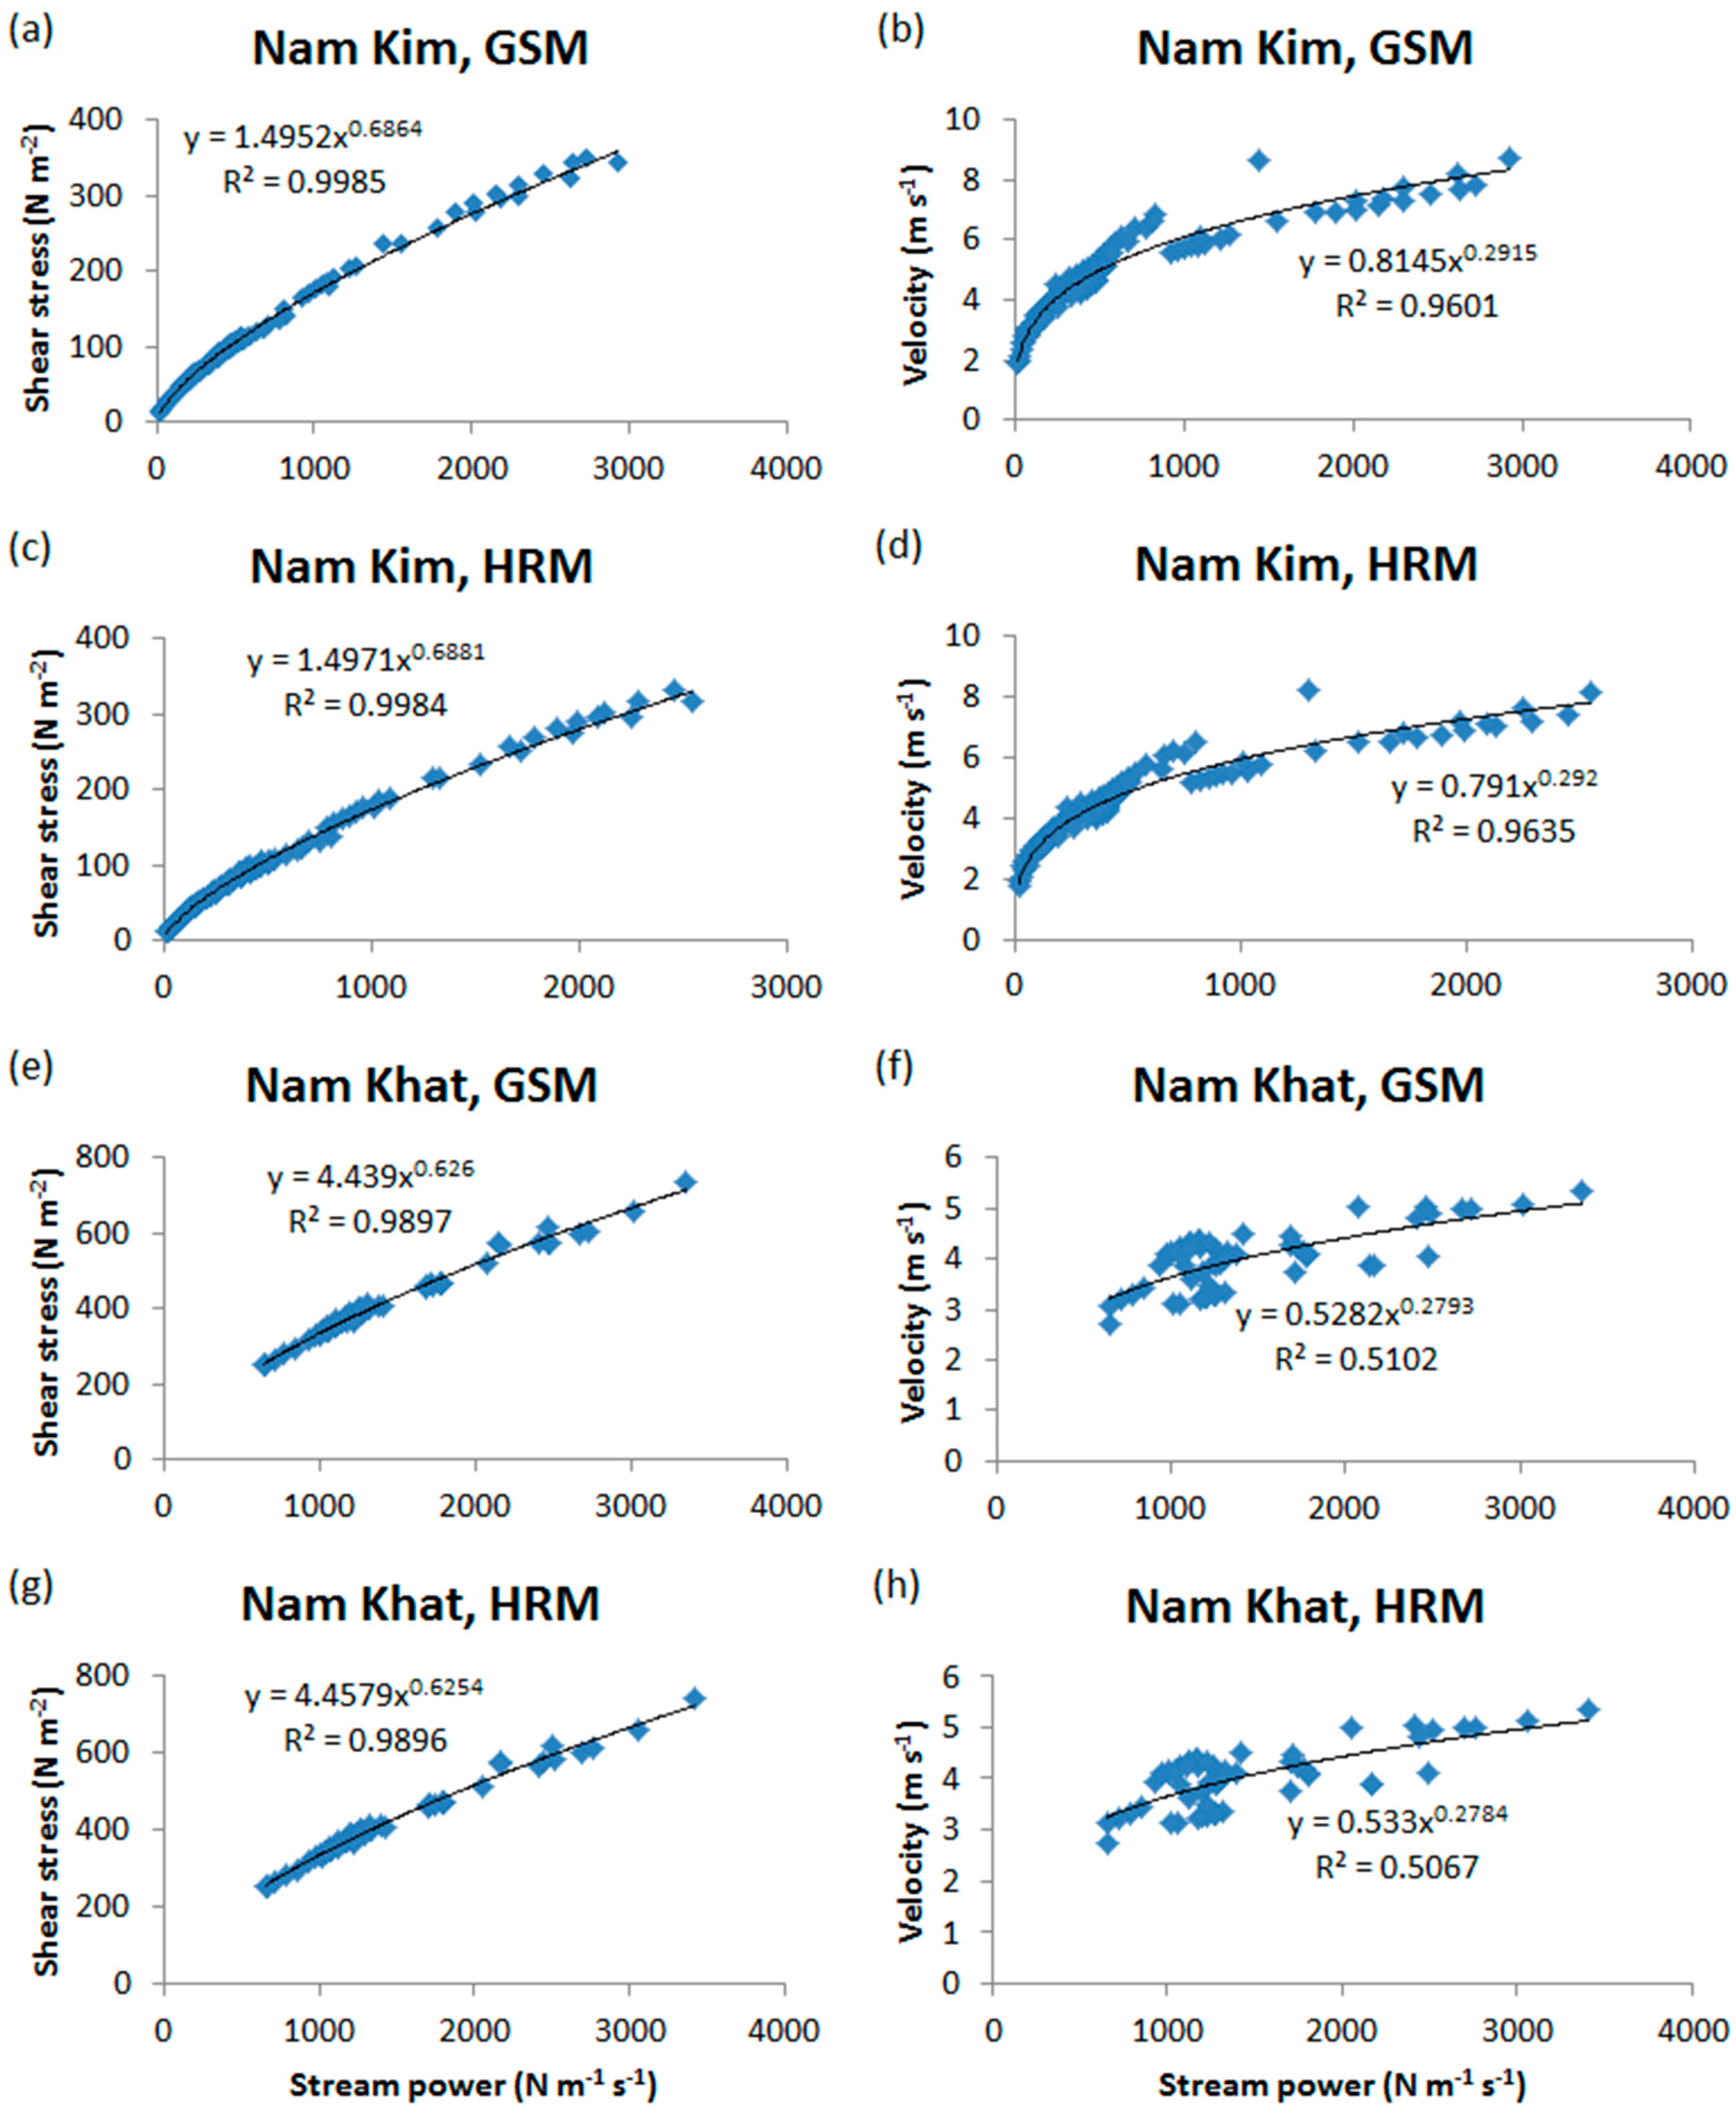
4.4. HEC-RAS Modelling Stream Power and Shear Stress Compared to FV
| Watershed\RS | 101 | 102 | 103 | 104 | 105 | 106 | 107 | 108 | 109 | 110 | 111 | 112 | 113 | 114 | 115 | 116 | |
|---|---|---|---|---|---|---|---|---|---|---|---|---|---|---|---|---|---|
| Nam Kim | Power (N·m−1·s−1) | 19 | 257 | 411 | 1794 | 858 | 1370 | 380 | 404 | 507 | 138 | 416 | 175 | 37 | 807 | 239 | 77 |
| Nam Khat | 1131 | 2159 | 2072 | 865 | 844 | 995 | 707 | 1037 | 1500 | 1856 | 1056 | 1070 | |||||
| Nam Kim | Shear (N·m−2) | 12.0 | 69.3 | 91.5 | 269.5 | 159.2 | 225.6 | 93.0 | 91.4 | 110.5 | 44.8 | 90.6 | 50.5 | 18.2 | 139.8 | 66.2 | 30.0 |
| Nam Khat | 370.4 | 530.6 | 520.7 | 302.1 | 294.6 | 348.2 | 261.9 | 337.4 | 422.9 | 531.9 | 363.2 | 355.5 | |||||
| Nam Kim | Velocity (m·s−1) | 1.8 | 3.8 | 4.6 | 6.8 | 5.4 | 8.5 | 4.1 | 4.6 | 5.0 | 3.2 | 4.8 | 3.7 | 2.5 | 6.7 | 4.5 | 2.8 |
| Nam Khat | 3.8 | 4.5 | 4.8 | 3.9 | 3.8 | 3.4 | 3.1 | 3.9 | 3.7 | 3.6 | 3.0 | 3.1 | |||||
4.5. HEC-RAS Forecast Flood Stage and Discharge

4.6. HEC-RAS Forecast Channel Velocity, Flow Power and Shearing Force
5. Summary and Conclusions
Acknowledgments
Author Contributions
Conflicts of Interest
References
- Ruiz-Villanueva, V.; Díez-Herrero, A.; Stoffel, M.; Bollschweiler, M.; Bodoque, J.M.; Ballesteros, J.A. Dendrogeomorphic analysis of flash floods in a small ungauged mountain catchment (Central Spain). Geomorphology 2010, 118, 383–392. [Google Scholar] [CrossRef]
- Zanon, F.; Borga, M.; Zoccatelli, D.; Marchi, L.; Gaume, E.; Bonnifait, L.; Delrieu, G. Hydrological analysis of a flash flood across a climatic and geologic gradient: The September 18, 2007 event in Western Slovenia. J. Hydrol. 2010, 394, 182–197. [Google Scholar] [CrossRef]
- Seo, D.; Lakhankar, T.; Mejia, J.; Cosgrove, B.; Khanbilvardi, R. Evaluation of Operational National Weather Service Gridded Flash Flood Guidance Over the Arkansas Red River Basin. JAWRA 2012. [Google Scholar] [CrossRef]
- Masoud, A.A. Runoff modeling of the wadi systems for estimating flash flood and groundwater recharge potential in Southern Sinai, Egypt. Arab. J. Geosci. 2011, 4, 785–801. [Google Scholar] [CrossRef]
- Rozalis, S.; Morin, E.; Yair, Y.; Price, C. Flash flood prediction using an uncalibrated hydrological model and radar rainfall data in a Mediterranean watershed under changing hydrological conditions. J. Hydrol. 2010, 394, 245–255. [Google Scholar] [CrossRef]
- Vietnam Assessment Report on Climate Change (VARCC). Available online: http://www.unep.org/pdf/dtie/VTN_ASS_REP_CC.pdf (accessed on 16 November 2015).
- Tao, J.; Barros, A.P. Prospects for flash flood forecasting in mountainous regions—An investigation of Tropical Storm Fay in the Southern Appalachians. J. Hydrol. 2013, 506, 69–89. [Google Scholar] [CrossRef]
- Naulin, J.P.; Payrastre, O.; Gaume, E. Spatially distributed flood forecasting in flash flood prone areas: Application to road network supervision in Southern France. J. Hydrol. 2013, 486, 88–99. [Google Scholar] [CrossRef]
- Villarini, G.; Krajewski, W.F.; Ntelekos, A.A.; Georgakakos, K.; Smitn, J.A. Towards probabilistic forecasting of flash floods: The combined effects of uncertainty in radar-rainfall and flash flood guidance. J. Hydrol. 2010, 394, 275–284. [Google Scholar] [CrossRef]
- Committee to Assess NEXRAD Flash Flood Forecasting Capabilities at Sulphur Mountain, California; Board on Atmospheric Sciences and Climate; Division on Earth and Life Studies; National Research Council. Flash Flood Forecasting over Complex Terrain: With an Assessment of the Sulphur Mountain NEXRAD in Southern California; The National Academies Press: Washington, DC, USA, 2005. [Google Scholar]
- Vincendon, B.; Ducrocq, V.; Dierer, S.; Kotroni, V.; Le Lay, M.; Milelli, M.; Quesney, A.; Saulnier, G.M.; Rabuffetti, D.; Bouilloud, L.; et al. Flash flood forecasting within the PREVIEW project: Value of high-resolution hydrometeorological coupled forecast. Meteorol. Atmos. Phys. 2009, 103, 115–125. [Google Scholar] [CrossRef]
- Montz, B.E.; Gruntfest, E. Flash flood mitigation: Recommendations for research and applications. Glob. Environ. Chang. B Environ. Hazards 2002, 4, 15–22. [Google Scholar] [CrossRef]
- Vinet, F. Geographical analysis of damage due to flash floods in southern France: The cases of 12–13 November 1999 and 8–9 September 2002. Appl. Geogr. 2008, 28, 323–336. [Google Scholar] [CrossRef]
- Yates, D.N.; Warner, T.T.; Leavesley, G.H. Prediction of a flash flood in complex terrain. Part II: A comparison of flood discharge simulations using rainfall input from radar, a dynamic model, and an automated algorithmic system. J. Appl. Meteorol. 2000, 39, 815–825. [Google Scholar] [CrossRef]
- Abderrezzak, K.E.; Paquier, A.; Mignot, E. Modelling flash flood propagation in urban areas using a two-dimensional numerical model. Nat. Hazards 2009, 50, 433–460. [Google Scholar] [CrossRef]
- Volkmann, T.H.M.; Lyon, S.W.; Gupta, H.V.; Troch, P.A. Multicriteria design of rain gauge networks for flash flood prediction in semiarid catchments with complex terrain. Water Resour. Res. 2010, 46, W11554. [Google Scholar] [CrossRef]
- Snell, S. A Flash Flood Prediction Model for Rural and Urban Basins in New Mexico; WRRI Technical Completion Report; New Mexico Water Resources Research Institute: Las Cruces, NM, USA, 2002. [Google Scholar]
- Javelle, P.; Fouchier, C.; Arnaud, P.; Lavabre, J. Flash flood warning at ungauged locations using radar rainfall and antecedent soil moisture estimations. J. Hydrol. 2010, 394, 267–274. [Google Scholar] [CrossRef]
- Reed, S.; Schaake, J.; Zhang, Z.Y. A distributed hydrologic model and threshold frequency-based method for flash flood forecasting at ungauged locations. J. Hydrol. 2007, 337, 402–420. [Google Scholar] [CrossRef]
- Norbiato, D.; Borga, M.; Dinale, R. Flash flood warning in ungauged basins by use of the flash flood guidance and model-based runoff thresholds. Meteorol. Appl. 2009, 16, 65–75. [Google Scholar] [CrossRef]
- Liu, W.C.; Wu, C.Y. Flash flood routing modeling for levee-breaks and overbank flows due to typhoon events in a complicated river system. Nat. Hazards 2011, 58, 1057–1076. [Google Scholar] [CrossRef]
- Unkrich, C.L. Real-time Flash Flood Forecasting Using Weather Radar and Distributed Rainfall-Runoff Model. In Proceedings of the 2nd Joint Federal Interagency Conference, Las Vegas, NV, USA, 27 June–1 July 2010.
- Morin, E.; Jacoby, Y.; Navon, S.; Bet-Halachmi, E. Towards flash-flood prediction in the dry Dead Sea region utilizing radar rainfall information. Adv. Water Resour. 2009, 32, 1066–1076. [Google Scholar] [CrossRef]
- Younis, J.; Anquetin, S.; Thielen, J. The benefit of high-resolution operational weather forecasts for flash flood warning. Hydrol. Earth Syst. Sci. 2008, 12, 1039–1051. [Google Scholar] [CrossRef]
- Wardah, T.; Abu Bakar, S.H.; Bárdossy, A.; Maznorizan, M. Use of geostationary meteorological satellite images in convective rain estimation for flash-flood forecasting. J. Hydrol. 2008, 356, 283–298. [Google Scholar] [CrossRef]
- Youssef, A.M.; Pradhan, B.; Hassan, A.M. Flash flood risk estimation along the St. Katherine road, southern Sinai, Egypt using GIS based morphometry and satellite imagery. Environ. Earth Sci. 2011, 62, 611–623. [Google Scholar] [CrossRef]
- Borga, M.; stoffel, M.; Marchi, L.; Marra, F.; Jakob, M. Hydrogeomorphic response to extreme rainfall in headwater systems: Flash floods and debris flows. J. Hydrol. 2014, 518, 194–205. [Google Scholar] [CrossRef]
- Krzysztofowicz, R. Probabilistic flood forecast: Exact and approximate predictive distributions. J. Hydrol. 2014, 517, 643–651. [Google Scholar] [CrossRef]
- Georgakakos, K.P. On the design of national, real-time warning systems with capability for site-specific, flash-flood forecasts. Bull. Am. Meteorol. Soc. 1986, 67, 1233–1239. [Google Scholar] [CrossRef]
- Ntelekos, A.A.; Georgakakos, K.P.; Krajewski, W.F. On the Uncertainties of Flash Flood Guidance: Toward Probabilistic Forecasting of Flash Floods. J. Hydrometeorol. 2006, 7, 896–915. [Google Scholar] [CrossRef]
- Estupina-Borrell, V.; Dartus, D.; Ababou, R. Flash flood modeling with the MARINE hydrological distributed model. Hydrol. Earth Syst. Sci. 2006, 3, 3397–3438. [Google Scholar] [CrossRef]
- Quintero, F.; Sempere-Torres, D.; Berenguer, M.; Baltas, E. A scenario-incorporating analysis of the propagation of uncertainty to flash flood simulations. J. Hydrol. 2012, 460, 90–102. [Google Scholar] [CrossRef]
- Yatheendradas, S.; Wagener, T.; Gupta, H.; Unkrich, C.; Goodrich, D.; Schaffner, M.; Stewart, A. Understanding uncertainty in distributed flash flood forecasting for semiarid regions. Water Resour. Res. 2008. [Google Scholar] [CrossRef]
- Nash, J.E.; Sutcliffe, J.V. River flow forecasting through conceptual models 1: A discussion of principles. J. Hydrol. 1970, 10, 282–290. [Google Scholar] [CrossRef]
- Mudd, S.M. Investigation of the hydrodynamics of flash floods in ephemeral channels: Scaling analysis and simulation using a shock-capturing flow model incorporating the effects of transmission losses. J. Hydrol. 2006, 324, 65–79. [Google Scholar] [CrossRef]
- Gupta, H. Development of a Site-Specific Flash Flood Forecasting Model for the Western Region; Final Report for COMET Proposal Entitled; University of Arizona: Tucson, AZ, USA, 2006. [Google Scholar]
- U.S. Department of Commerce. Advanced Hydrologic Prediction Services—Concept of Services and Operations; U.S. Department of Commerce: Washington, DC, USA, 2002.
- Kourgialas, N.N.; Karatzas, G.P.; Nikolaidis, N.P. Development of a thresholds approach for real-time flash flood prediction in complex geomorphological river basins. Hydrol. Process. 2012, 26, 1478–1494. [Google Scholar] [CrossRef]
- Anh, P.T.Q.; Gomi, T.; MacDonald, L.H.; Mizugaki, S.; Khoa, P.V.; Furuichi, T. Linkages among land use, macronutrient levels, and soil erosion in northern Vietnam: A plot-scale study. Geoderma 2014, 232–234, 352–362. [Google Scholar] [CrossRef]
- Ranzi, R.; Le, T.H.; Rulli, M.C. A RUSLE approach to model suspended sediment load in the Lo river (Vietnam): Effects of reservoirs and land use changes. J. Hydrol. 2012, 422–423, 17–29. [Google Scholar] [CrossRef]
- Smith, R.E.; Goodrich, D.; Woolhiser, D.A.; Unkrich, C.L. KINEROS—A kinematic runoff and erosion model. In Computer Models of Watershed Hydrology; Singh, V.P., Ed.; Water Resources Publications: Highlands Ranch, CO, USA, 1995; p. 1130. [Google Scholar]
- Smith, R.E.; Goodrich, D.C.; Unkrich, C.L. Simulation of selected events on the Catsop catchment by KINEROS2: A report for the GCTE conference on catchment scale erosion models. Catena 1999, 37, 457–475. [Google Scholar] [CrossRef]
- Woolhiser, D.A.; Smith, R.E.; Goodrich, D.C. KINEROS: A Kinematic Runoff and Erosion Model: Documentation and User Manual; ARS-77; Agricultural Research Service (ARS): Washington, DC, USA, 1990. [Google Scholar]
- Brunner, G.W.; United States Army Corps of Engineers; Institute for Water Resources (U.S.); Hydrologic Engineering Center (U.S.). HEC-RAS River Analysis System: Hydraulic Reference Manual, Version 4.1 January 2010; US Army Corps of Engineers: Davis, CA, USA, 2010. [Google Scholar]
- Horritt, M.S.; Bates, P.D. Evaluation of 1D and 2D numerical models for predicting river flood inundation. J. Hydrol. 2002, 268, 87–99. [Google Scholar] [CrossRef]
- Shames, I.H. Mechanics of Fluids; McGraw-Hill Book Company: New York, NY, USA, 1962. [Google Scholar]
- Brunner, G.W.; United States Army Corps of Engineers; Institute for Water Resources (U.S.); Hydrologic Engineering Center (U.S.). HEC-RAS, River Analysis System: Hydraulic Reference Manual, Version 3.1 November 2002; US Army Corps of Engineers: Davis, CA, USA, 2002. [Google Scholar]
- Blöschl, G. Rainfall–runoff modelling of ungauged catchments. In Encyclopedia of Hydrological Sciences; Anderson, M.G.E., Ed.; John Wiley & Sons: Chichester, UK, 2005; pp. 2061–2080. [Google Scholar]
- Krishnamurti, T.N.; Bedi, H.S.; Hardiker, V.M.; Ramaswamy, L. An Introduction to Global Spectral Modeling, 2nd ed.; Atmospheric and Oceanographic Sciences Library; Springer: Berlin, Germany, 2006. [Google Scholar]
- Majewski, D. HRM—User’s Guide for the HRM with the SSO Scheme; Vrs. 2.5 and Higher; Deutscher Wetterdienst, Press and Public Relations: Offenbach, Germany, 2009. [Google Scholar]
- Centre for Resources and Environment, National Institute of Agricultural Planning and Projection (NIAPP). Yen Bai Soil Map Report; NIAPP: Hanoi, Vietnam, 1996. [Google Scholar]
- Vietnam National Centre for Hydro-Meteorological Forecasting (NCHMF). Available online: http://www.nchmf.gov.vn/web/vi-VN/71/29/45/Default.aspx (accessed on 7 March 2014).
- Makungo, R.; Odiyo, J.O.; Ndiritu, J.G.; Mwaka, B. Rainfall–runoff modelling approach for ungauged catchments: A case study of Nzhelele River sub-quaternary catchment. Phys. Chem. Earth 2010, 35, 596–607. [Google Scholar] [CrossRef]
- Marchi, L.; Borga, M.; Preciso, E.; Gaume, E. Characterisation of selected extreme flash floods in Europe and implications for flood risk management. J. Hydrol. 2010, 394, 118–133. [Google Scholar] [CrossRef]
- Lumbroso, D.; Gaume, E. Reducing the uncertainty in indirect estimates of extreme flash flood discharges. J. Hydrol. 2012, 414–415, 16–30. [Google Scholar] [CrossRef]
- Rodriguez, L.B.; Cello, P.A.; Vionnet, C.A.; Goodrich, D. Fully conservative coupling of HEC-RAS with MODFLOW to simulate stream–aquifer interactions in a drainage basin. J. Hydrol. 2008, 353, 129–142. [Google Scholar] [CrossRef]
- Klimes, J.; Benešová, M.; Vilímek, V.; Bouška, P.; Rapre, A.C. The reconstruction of a glacial lake outburst flood using HEC-RAS and its significance for future hazard assessments: An example from Lake 513 in the Cordillera Blanca, Peru. Nat. Hazards 2014, 71, 1617–1638. [Google Scholar] [CrossRef]
- Sarhadi, A.; Soltani, S.; Modarres, R. Probabilistic flood inundation mapping of ungauged rivers: Linking GIS techniques and frequency analysis. J. Hydrol. 2012, 458–459, 68–86. [Google Scholar] [CrossRef]
- Versini, P.A. Use of radar rainfall estimates and forecasts to prevent flash flood in real time by using a road inundation warning system. J. Hydrol. 2012, 416, 157–170. [Google Scholar] [CrossRef]
- Pekarova, P.; Svoboda, A.; Miklánek, P.; Škoda, P.; Halmová, D.; Pekár, J. Estimating Flash Flood Peak Discharge in Gidra and Parna Basin: Case Study for the 7–8 June 2011 Flood. J. Hydrol. Hydromech. 2012, 60, 206–216. [Google Scholar] [CrossRef]
- Looper, J.P.; Vieux, B.E. An assessment of distributed flash flood forecasting accuracy using radar and rain gauge input for a physics-based distributed hydrologic model. J. Hydrol. 2012, 412, 114–132. [Google Scholar] [CrossRef]
- Alfieri, L.; Thielen, J.; Pappenberger, F. Ensemble hydro-meteorological simulation for flash flood early detection in southern Switzerland. J. Hydrol. 2012, 424, 143–153. [Google Scholar] [CrossRef]
- Carpenter, T.M.; Sperfslage, J.A.; Georgakakos, K.P.; Sweeney, T.; Fread, D.L. National threshold runoff estimation utilizing GIS in support of operational flash flood warning systems. J. Hydrol. 1999, 224, 21–44. [Google Scholar] [CrossRef]
- Ancona, M.; Corradi, N.; Dellacasa, A.; Delzanno, G.; Dugelay, J.L.; Federici, B.; Gourbesville, P.; Guerrini, G.; la Camera, A.; Rosso, P.; et al. On the Design of an Intelligent Sensor Network for Flash Flood Monitoring, Diagnosis and Management in Urban Areas Position Paper. Procedia Comput. Sci. 2014, 32, 941–946. [Google Scholar] [CrossRef]
- El-Magd, I.A.; Hermas, E.; Bastawesy, M.E. GIS-modelling of the spatial variability of flash flood hazard in Abu Dabbab catchment, Red Sea Region, Egypt. Egypt. J. Remote Sens. Space Sci. 2010, 13, 81–88. [Google Scholar] [CrossRef]
- Servat, E.; Dezetter, A. Rainfall-runoff modelling and water resources assessment in northwestern Ivory Coast. Tentative extension to ungauged catchments. J. Hydrol. 1993, 148, 231–248. [Google Scholar] [CrossRef]
- Boughton, W.; Chiew, F. Estimating runoff in ungauged catchments from rainfall, PET and the AWBM model. Environ. Model. Softw. 2007, 22, 476–487. [Google Scholar] [CrossRef]
© 2015 by the authors; licensee MDPI, Basel, Switzerland. This article is an open access article distributed under the terms and conditions of the Creative Commons Attribution license (http://creativecommons.org/licenses/by/4.0/).
Share and Cite
Nguyen, H.Q.; Degener, J.; Kappas, M. Flash Flood Prediction by Coupling KINEROS2 and HEC-RAS Models for Tropical Regions of Northern Vietnam. Hydrology 2015, 2, 242-265. https://doi.org/10.3390/hydrology2040242
Nguyen HQ, Degener J, Kappas M. Flash Flood Prediction by Coupling KINEROS2 and HEC-RAS Models for Tropical Regions of Northern Vietnam. Hydrology. 2015; 2(4):242-265. https://doi.org/10.3390/hydrology2040242
Chicago/Turabian StyleNguyen, Hong Quang, Jan Degener, and Martin Kappas. 2015. "Flash Flood Prediction by Coupling KINEROS2 and HEC-RAS Models for Tropical Regions of Northern Vietnam" Hydrology 2, no. 4: 242-265. https://doi.org/10.3390/hydrology2040242
APA StyleNguyen, H. Q., Degener, J., & Kappas, M. (2015). Flash Flood Prediction by Coupling KINEROS2 and HEC-RAS Models for Tropical Regions of Northern Vietnam. Hydrology, 2(4), 242-265. https://doi.org/10.3390/hydrology2040242