1. Introduction
Land use and land cover (LULC) change is a primary driver of alterations in ecosystem functioning, biodiversity, agricultural productivity, and hydrological processes, with direct implications for water resource availability and management [
1,
2,
3,
4,
5,
6]. Accurate characterization of LULC dynamics is therefore essential for understanding coupled human–environment systems, particularly in river basins where land–water interactions are critical.
Traditional approaches for LULC assessment, including aerial photography and field surveys, provide high accuracy but are inherently constrained by cost, labor intensity, and limited temporal coverage [
7,
8,
9]. Satellite remote sensing has consequently become the dominant approach for LULC monitoring, enabling consistent, large-scale observations with repeat coverage across multiple temporal scales [
10,
11,
12,
13,
14].
Multitemporal optical datasets, particularly from Landsat and Sentinel missions, have been widely used for LULC classification and change detection [
15,
16,
17,
18,
19]. However, these datasets typically require substantial preprocessing, including geometric and atmospheric corrections, and their applicability in tropical regions is often constrained by persistent cloud contamination [
20].
In contrast, the Moderate Resolution Imaging Spectroradiometer (MODIS) surface reflectance product (MOD09) provides atmospherically corrected surface reflectance derived using radiative transfer-based algorithms [
21,
22,
23]. In addition, MODIS offers high temporal resolution with near-daily observations, allowing the selection of high-quality observations within compositing periods (e.g., 8-day intervals) to reduce the effects of clouds, aerosols, and view angle variability [
24]. This combination of preprocessing and dense temporal sampling makes MODIS particularly well suited for time-series analysis and the characterization of seasonal and interannual land surface dynamics.
Spectral indices derived from multispectral data play a central role in LULC classification by enhancing the separability of biophysical signals and improving the discrimination of land surface characteristics. Among these, the Normalized Difference Vegetation Index (NDVI), derived from red and near-infrared (NIR) reflectance, is one of the most widely used indicators for characterizing vegetation greenness, productivity, and phenological dynamics [
25,
26,
27,
28,
29,
30,
31,
32]. However, NDVI is sensitive to atmospheric effects, soil background, and variations in vegetation water content, which can limit its performance in environments where moisture availability is a dominant control [
33,
34,
35,
36].
To address these limitations, the Normalized Difference Infrared Index (NDII), which integrates near-infrared (NIR) and shortwave infrared (SWIR) reflectance, has been widely adopted to capture vegetation water content and canopy moisture dynamics [
37,
38,
39,
40,
41]. NDII is less sensitive to atmospheric scattering and exploits the strong absorption of SWIR radiation by leaf water, providing complementary information to NDVI. As a result, NDII has been successfully applied in drought monitoring, vegetation stress detection, biomass estimation, and fire impact assessment [
42,
43,
44]. Several studies further indicate that NDII can enhance land cover discrimination, particularly in environments where vegetation water availability plays a critical role in controlling land surface dynamics [
45,
46,
47,
48]. Building on these applications, recent work by [
49] further demonstrates the utility of NDII in hydrological modeling, where NDII-derived metrics were shown to effectively constrain spatial variability in root zone moisture storage and improve both model performance and the physical realism of distributed simulations. These findings highlight the potential of NDII as a robust proxy linking vegetation water status with catchment-scale hydrological processes.
Despite these advances, two key limitations remain. First, most LULC studies rely on moderate-to-high spatial resolution imagery with relatively low temporal frequency, limiting the ability to capture continuous land use dynamics. Second, operational land use products, such as those provided by national agencies, are typically updated at multi-year intervals, resulting in temporally static representations. These constraints are particularly pronounced in data-limited regions such as Thailand, where studies integrating high-temporal-resolution remote sensing for LULC dynamics remain scarce.
To address these challenges, this study integrates MODIS-derived NDVI and NDII time series to develop a temporally explicit framework for reconciling dynamic satellite observations with operational land use products. Using the Chi River Basin in northeastern Thailand as a case study, an unsupervised classification approach is applied to multi-year (2010–2021) vegetation index time series to characterize land surface dynamics in a monsoon-driven environment. By jointly exploiting vegetation greenness and moisture information, the framework captures both phenological and hydrological controls on land use variability.
This study makes three principal contributions. First, it presents a temporal consistency-based framework for reconciling periodically updated land use products with continuously varying satellite observations. Second, it evaluates the complementary roles of NDVI and NDII in distinguishing vegetation-related land use classes and demonstrates the advantages of moisture-sensitive indices in monsoon-driven environments. Third, it demonstrates the feasibility of generating temporally explicit annual LULC information from MODIS observations in heterogeneous and data-constrained regions. Collectively, the proposed framework provides a practical and transferable approach for dynamic land use monitoring with potential applications in agricultural management, hydrological modelling, and water resources assessment.
2. Material and Methods
2.1. Study Area
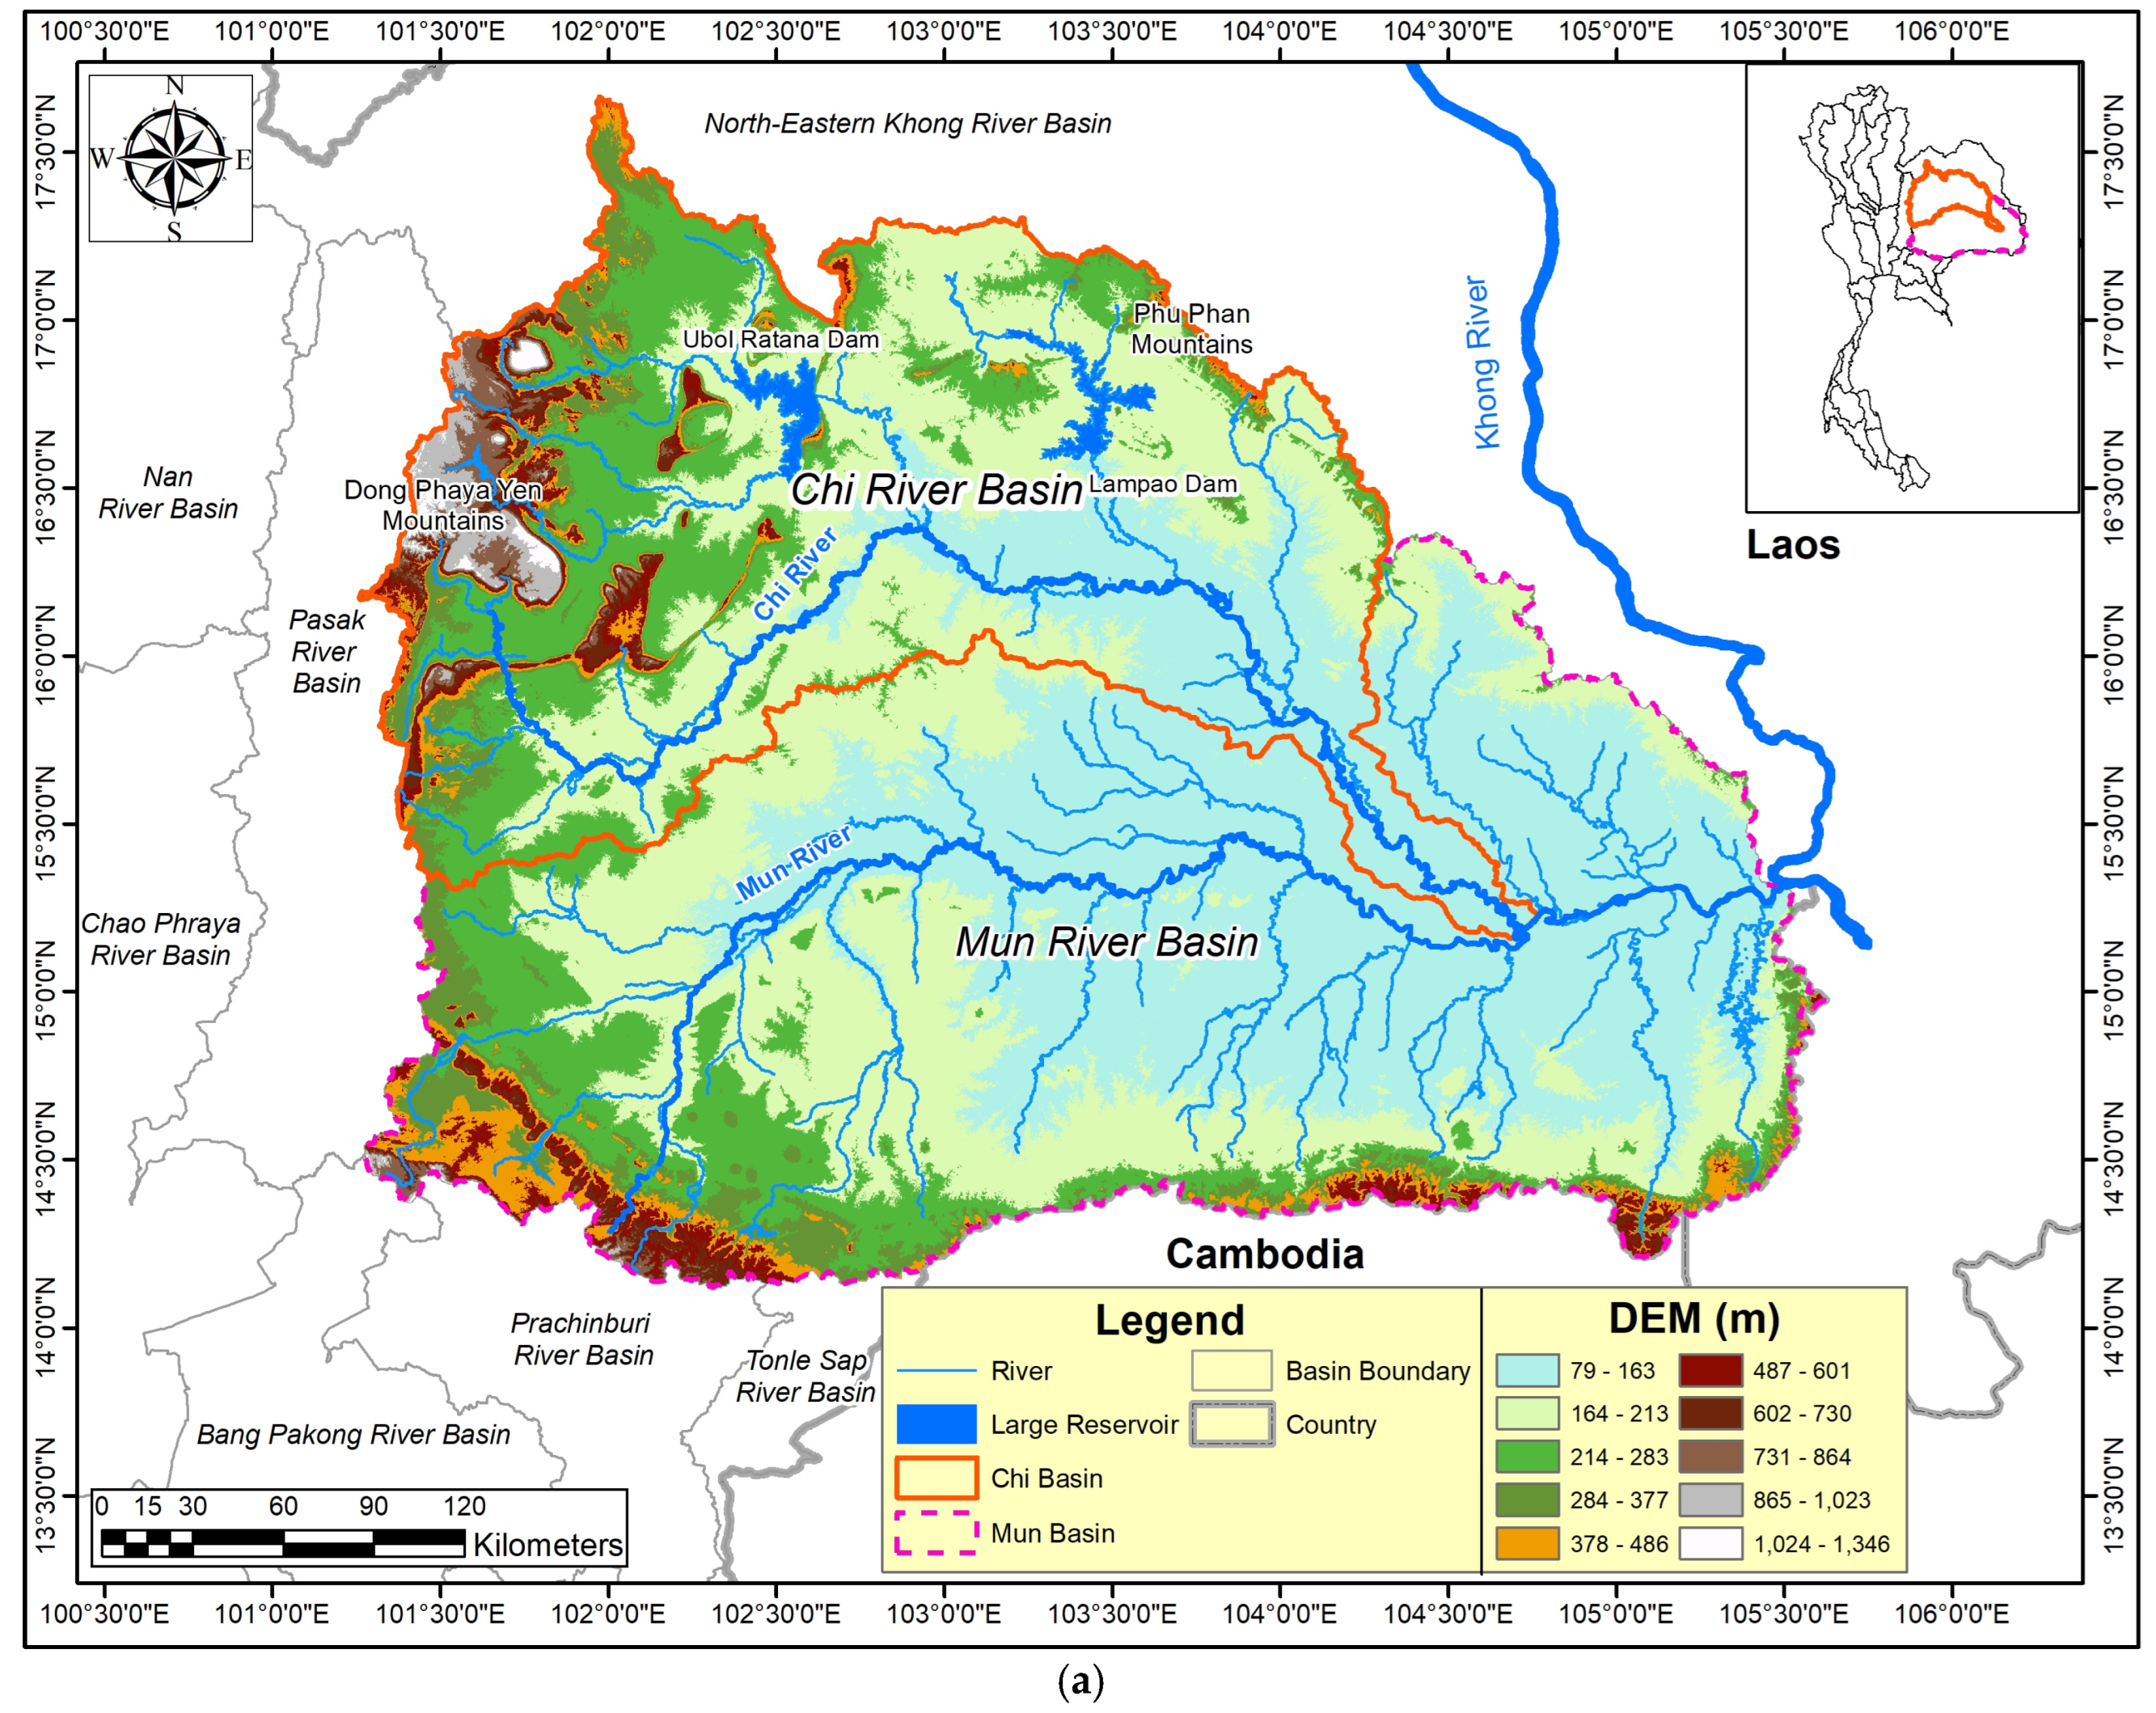
The Chi River Basin (CRB), located in northeastern Thailand (15°30′–17°30′ N, 101°30′–104°30′ E), covers approximately 49,130 km2 and constitutes a major sub-basin of the Mun River system, which ultimately drains into the Mekong River. As one of the largest basins in Thailand, the CRB plays a critical role in regional water resources, agricultural production, and land–water interactions, making it a suitable case study for investigating land use and land cover (LULC) dynamics using time-series remote sensing approaches.
Topographically, the basin exhibits pronounced spatial heterogeneity, ranging from mountainous headwaters in the Dong Phaya Yen and Phu Phan ranges to extensive low-lying alluvial plains downstream. These physiographic gradients strongly influence hydrological processes, soil moisture distribution, and vegetation patterns, resulting in diverse land surface conditions that are well suited for evaluating the combined sensitivity of vegetation greenness (NDVI) and canopy moisture (NDII).
The CRB experiences a tropical monsoon climate characterized by a distinct wet season from May to October, during which approximately 90% of the mean annual rainfall (~1216 mm for 2001–2021) occurs. This strong seasonality drives pronounced intra-annual variability in vegetation growth and surface moisture conditions. However, persistent cloud cover during the wet season significantly limits the usability of optical satellite imagery, highlighting the importance of high-temporal-resolution datasets such as MODIS, which enable compositing and continuous observation of land surface dynamics despite atmospheric constraints.
Land use in the basin is dominated by agriculture, accounting for approximately 68% of the total area, with rainfed systems comprising about 94% of cultivated land. These agricultural areas are primarily located in low-relief floodplains and are characterized by seasonal cropping cycles that respond directly to rainfall variability. In contrast, forest and shrubland are mainly distributed in upland and marginal areas, where topographic and soil constraints limit agricultural expansion. This spatial arrangement creates strong contrasts in vegetation structure and water availability, making the integration of NDVI and NDII particularly valuable for improving land cover discrimination.
The basin’s agricultural landscape is highly fragmented, with mixed cropping systems and smallholder land management practices leading to significant spectral heterogeneity and mixed-pixel effects in moderate-resolution imagery. These characteristics pose challenges for conventional LULC classification methods but can be better addressed through time-series analysis that captures phenological and moisture-driven differences among land cover types.
Hydrologically, the CRB is regulated by major reservoirs, including the Ubol Ratana and Lampao dams, with storage capacities of approximately 2431 and 1980 million cubic meters (MCM), respectively. These reservoirs play a key role in modulating streamflow, supporting irrigation, and influencing seasonal water availability, thereby affecting both vegetation dynamics and land use patterns.
Overall, the combination of strong monsoon seasonality, cloud-prone conditions, heterogeneous land use, and moisture-sensitive vegetation dynamics makes the CRB an ideal testbed for developing and evaluating a MODIS-based, high-temporal-resolution LULC classification framework that integrates NDVI and NDII time series.
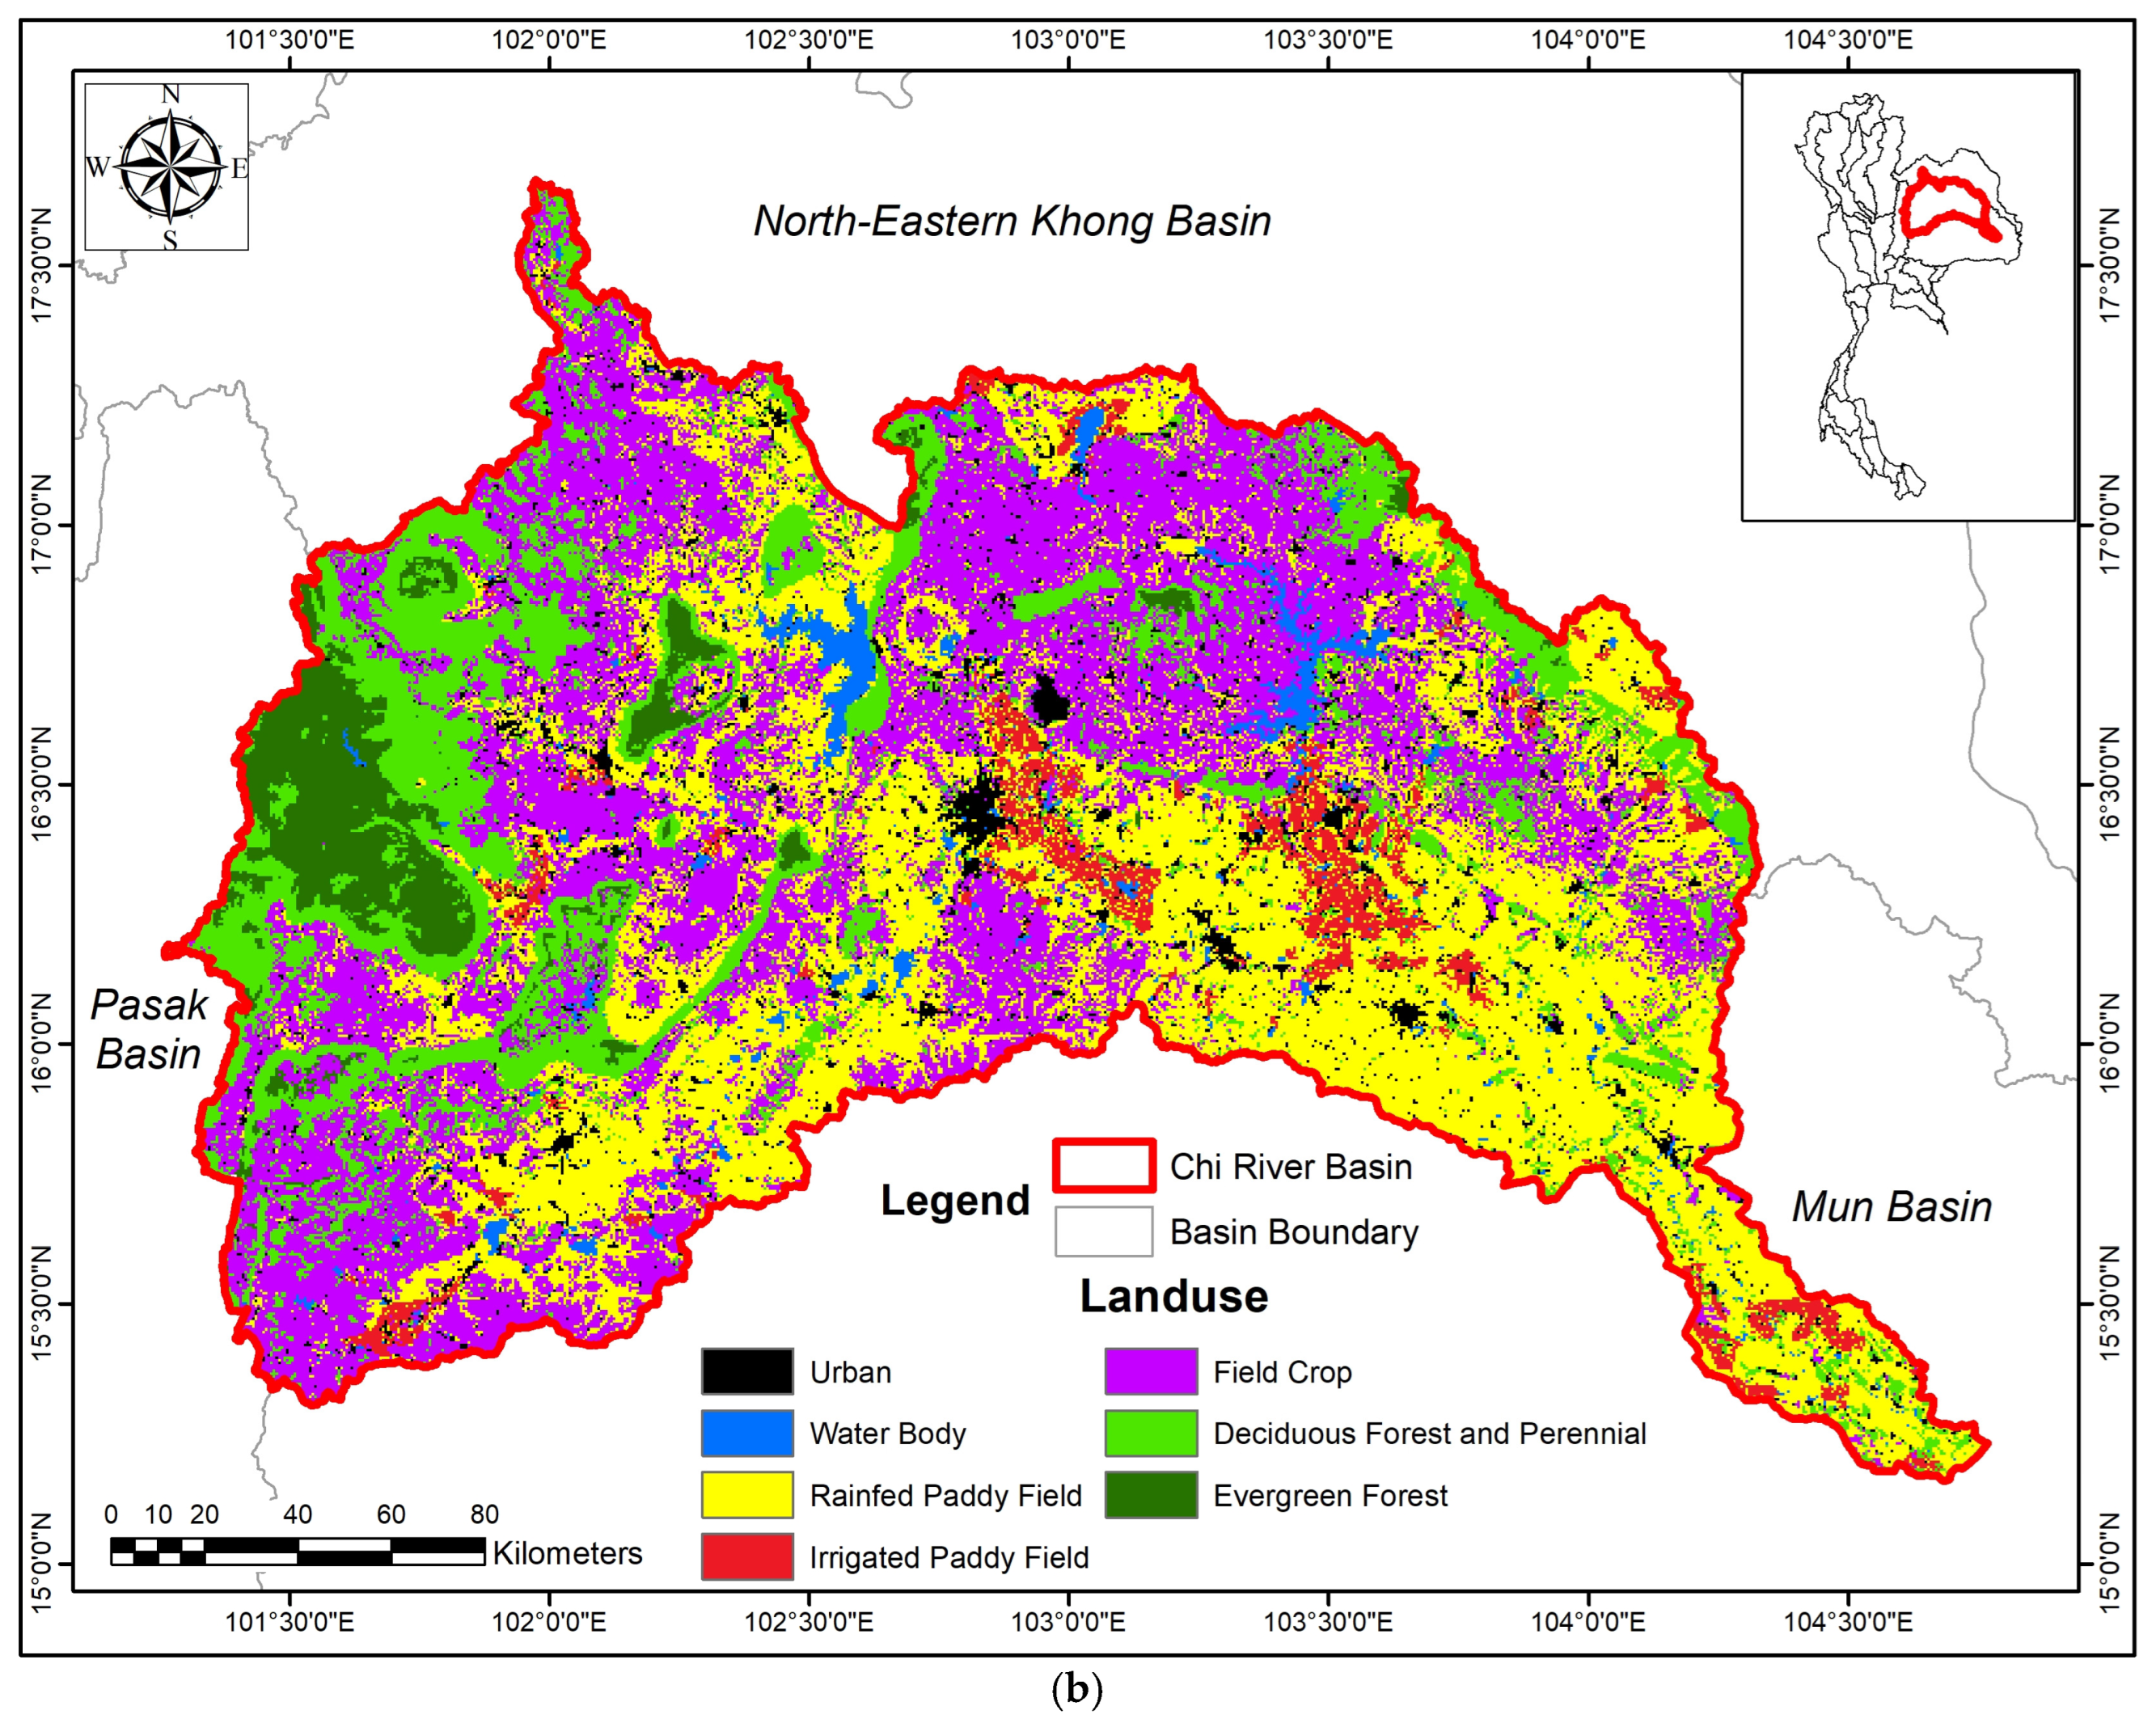
Figure 1 illustrates (a) the geographic location of the CRB and (b) the LULC distribution derived from Land Development Department (LDD) data for 2019–2021.
2.2. Datasets
2.2.1. Normalized Difference Infrared Index (NDII)
The Normalized Difference Infrared Index (NDII) is a moisture-sensitive spectral index widely used to characterize vegetation water status and canopy moisture dynamics [
38,
39]. NDII exploits the contrasting reflectance properties of vegetation in the near-infrared (NIR) and shortwave infrared (SWIR) regions, where SWIR reflectance is strongly influenced by leaf water absorption. Consequently, NDII is sensitive to vegetation water content and has been shown to provide valuable information for drought monitoring, vegetation stress assessment, and hydrological applications [
50,
51].
In monsoon-driven environments, moisture availability strongly controls vegetation growth and land surface dynamics. Compared with greenness-based indices, NDII provides complementary information by capturing variations in canopy water content that are not fully represented by spectral responses in the visible wavelengths. Previous studies have further demonstrated that NDII-derived time series correspond well with root-zone moisture dynamics and can improve the physical realism of distributed hydrological models [
49]. These characteristics suggest that NDII has considerable potential for discriminating vegetation-related land use classes in heterogeneous tropical landscapes.
NDII is defined as:
where NIR and SWIR denote reflectance in the near-infrared and shortwave infrared regions, respectively.
In this study, NDII was derived from the MODIS surface reflectance product MOD09A1 (Version 6), which provides atmospherically corrected 8-day composite images at a spatial resolution of 500 m [
22]. Annual NDII time series consisting of 46 observations per year were generated for the period 2010–2021 and used to characterize vegetation moisture dynamics across the Chi River Basin. The NDII dataset was analysed independently and compared with NDVI to evaluate the relative capability of moisture- and greenness-based indices for land use classification in monsoon-driven environments.
2.2.2. Normalized Difference Vegetation Index (NDVI)
The Normalized Difference Vegetation Index (NDVI) is one of the most widely used indicators of vegetation greenness and phenological variability [
30,
43]. It is based on the characteristic spectral response of vegetation, which strongly absorbs red (RED) radiation due to chlorophyll activity while reflecting near-infrared (NIR) radiation due to leaf cellular structure. Consequently, NDVI provides a robust indicator of vegetation density and photosynthetic activity across a wide range of land cover types. NDVI is calculated as:
where NIR and RED represent reflectance in the red and near-infrared spectral bands, respectively.
NDVI data were obtained from the Terra MODIS vegetation index product MOD13Q1 (Version 6), which provides atmospherically corrected 16-day composite images at a spatial resolution of 250 m. Annual NDVI time series consisting of 23 observations per year were generated for the period 2010–2021 and used to represent vegetation greenness dynamics. The NDVI dataset was analysed independently and compared with NDII to evaluate the relative capability of greenness- and moisture-based indices for land use classification in monsoon-driven environments.
2.2.3. Reference Land Use and Land Cover (LULC) Data
Reference land use and land cover (LULC) data were obtained from the Land Development Department (LDD) of Thailand for the period 2010–2021. The dataset comprises four update periods (2010–2013, 2015–2016, 2017–2018, and 2019–2021) and includes seven land use classes: water bodies, urban areas, rainfed paddy fields, irrigated agricultural areas, field crops, deciduous forest and perennial crops, and evergreen forest.
For the most recent period (2019–2021), rainfed paddy fields constitute the dominant land use type, accounting for approximately 37.8% of the basin area, followed by field crops (25.6%) and deciduous forest and perennial crops (19.5%). Evergreen forest and irrigated agricultural areas occupy 4.7% and 4.8% of the basin area, respectively, while urban areas and water bodies account for 5.1% and 2.5%, respectively (
Figure 1b).
The LDD dataset was used as reference information for evaluating satellite-derived classifications. Because the objective of this study was to assess the capability of NDVI and NDII time series to discriminate vegetation-related land use classes, water bodies and urban areas were excluded from the analysis. Consequently, five vegetation-related classes were considered in subsequent analyses. These classes exhibit distinct differences in phenological and moisture characteristics and are therefore expected to be effectively represented by NDVI and NDII time series.
2.3. Methodology
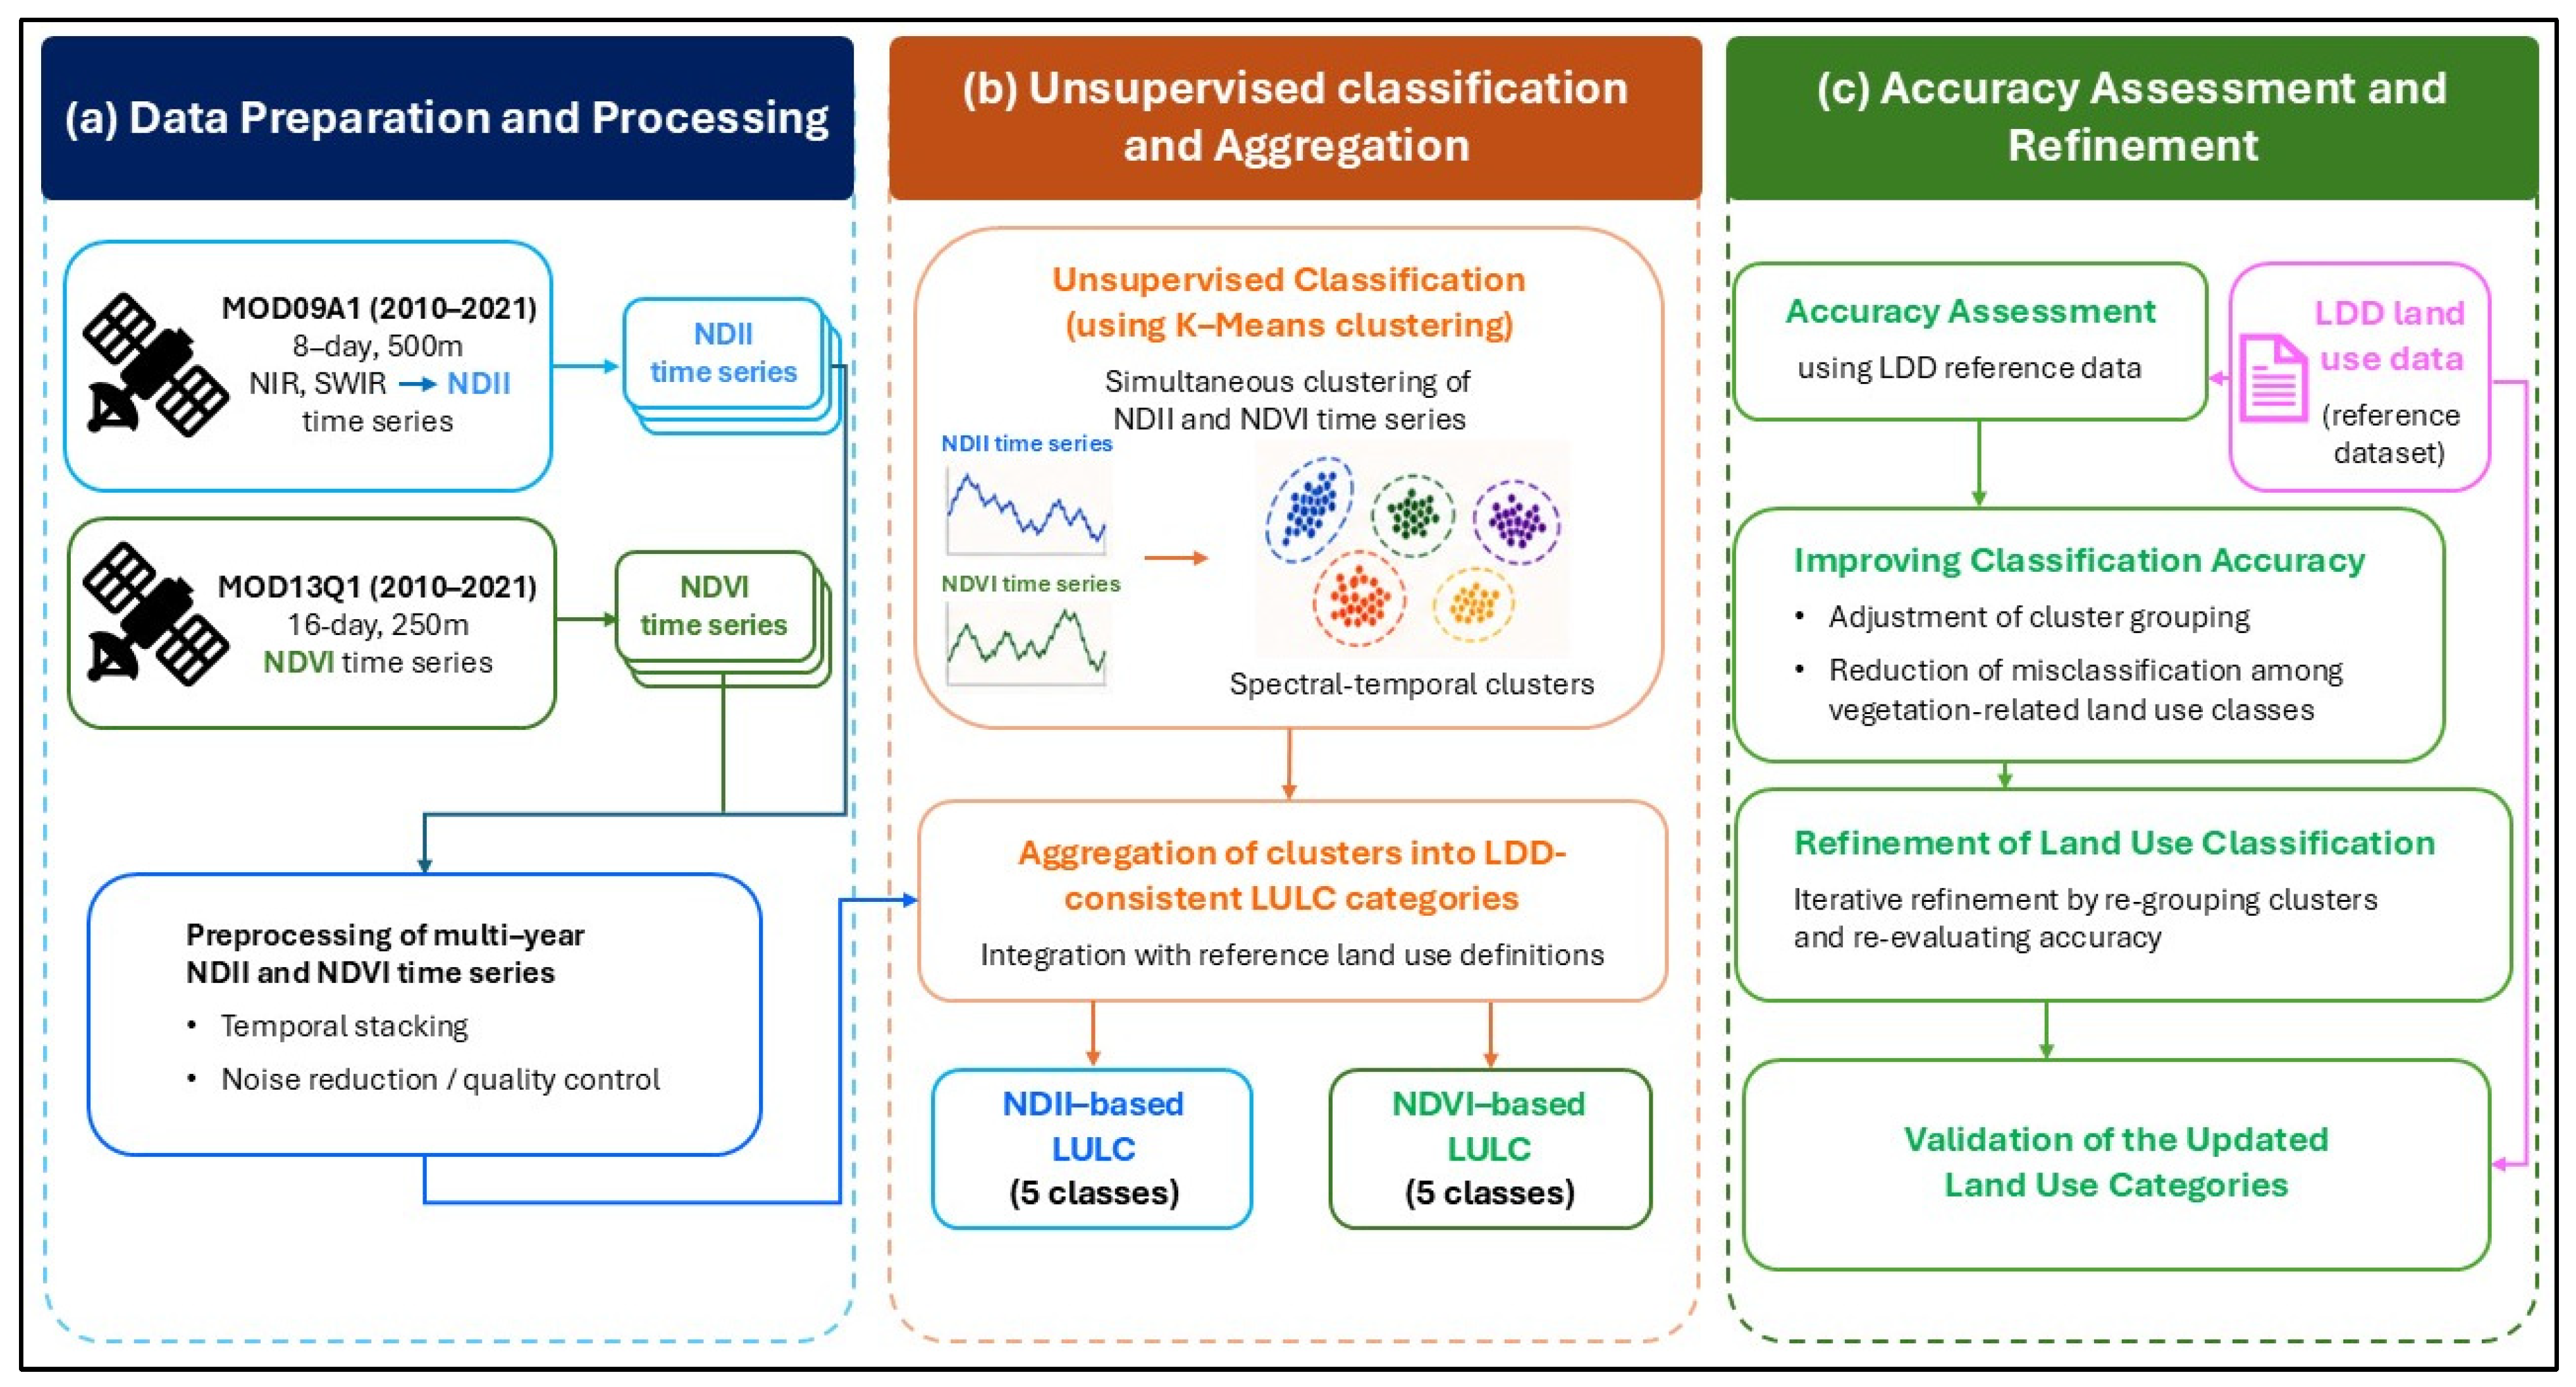
The methodological framework adopted in this study is illustrated in
Figure 2. The approach was designed to reconcile dynamic satellite observations with temporally static land use products by exploiting the complementary information provided by vegetation greenness (NDVI) and canopy moisture (NDII). The framework consists of four steps: (1) unsupervised classification of annual NDVI and NDII time series, (2) aggregation of spectral clusters into Land Development Department (LDD) land use categories, (3) temporal refinement of inconsistent pixels based on signature similarity, and (4) accuracy assessment and comparative analysis.
2.3.1. Unsupervised Classification of NDVI and NDII Time Series
Annual NDVI and NDII time series were independently analysed using the K-means clustering algorithm [
52,
53]. The clustering procedure was implemented in Python (version 3.11) using the KMeans module from the scikit-learn (sklearn) library. An unsupervised approach was adopted to avoid reliance on predefined training samples and to allow land use classes to emerge directly from spectral–temporal similarity among pixels [
54,
55,
56]. This approach is particularly advantageous in heterogeneous and data-constrained environments such as the Chi River Basin, where ground reference information is limited and land use patterns are highly fragmented.
For NDII, annual time series consisted of 46 eight-day composite images derived from MOD09A1, whereas NDVI time series consisted of 23 sixteen-day composite images obtained from MOD13Q1. These temporal profiles preserve seasonal and interannual variations in vegetation greenness and moisture conditions that are essential for distinguishing vegetation-related land use classes in monsoon-driven environments.
K-means clustering partitions the data into K clusters by minimizing the within-cluster sum of squared distances:
where
represents the
i-th data point assigned to cluster
,
is the centroid of cluster
, and
is the number of data points within that cluster.
A total of 30 spectral clusters was selected based on sensitivity analyses to capture detailed temporal variability while maintaining interpretability. Clustering was performed independently for NDII and NDVI, resulting in an initial set of spectral–temporal clusters representing distinct patterns of vegetation dynamics.
2.3.2. Aggregation of Spectral Clusters into LDD Land Use Categories
Because the spectral clusters obtained from K-means do not directly correspond to the land use categories defined by the Land Development Department (LDD), an aggregation procedure was implemented to establish correspondence between the two datasets.
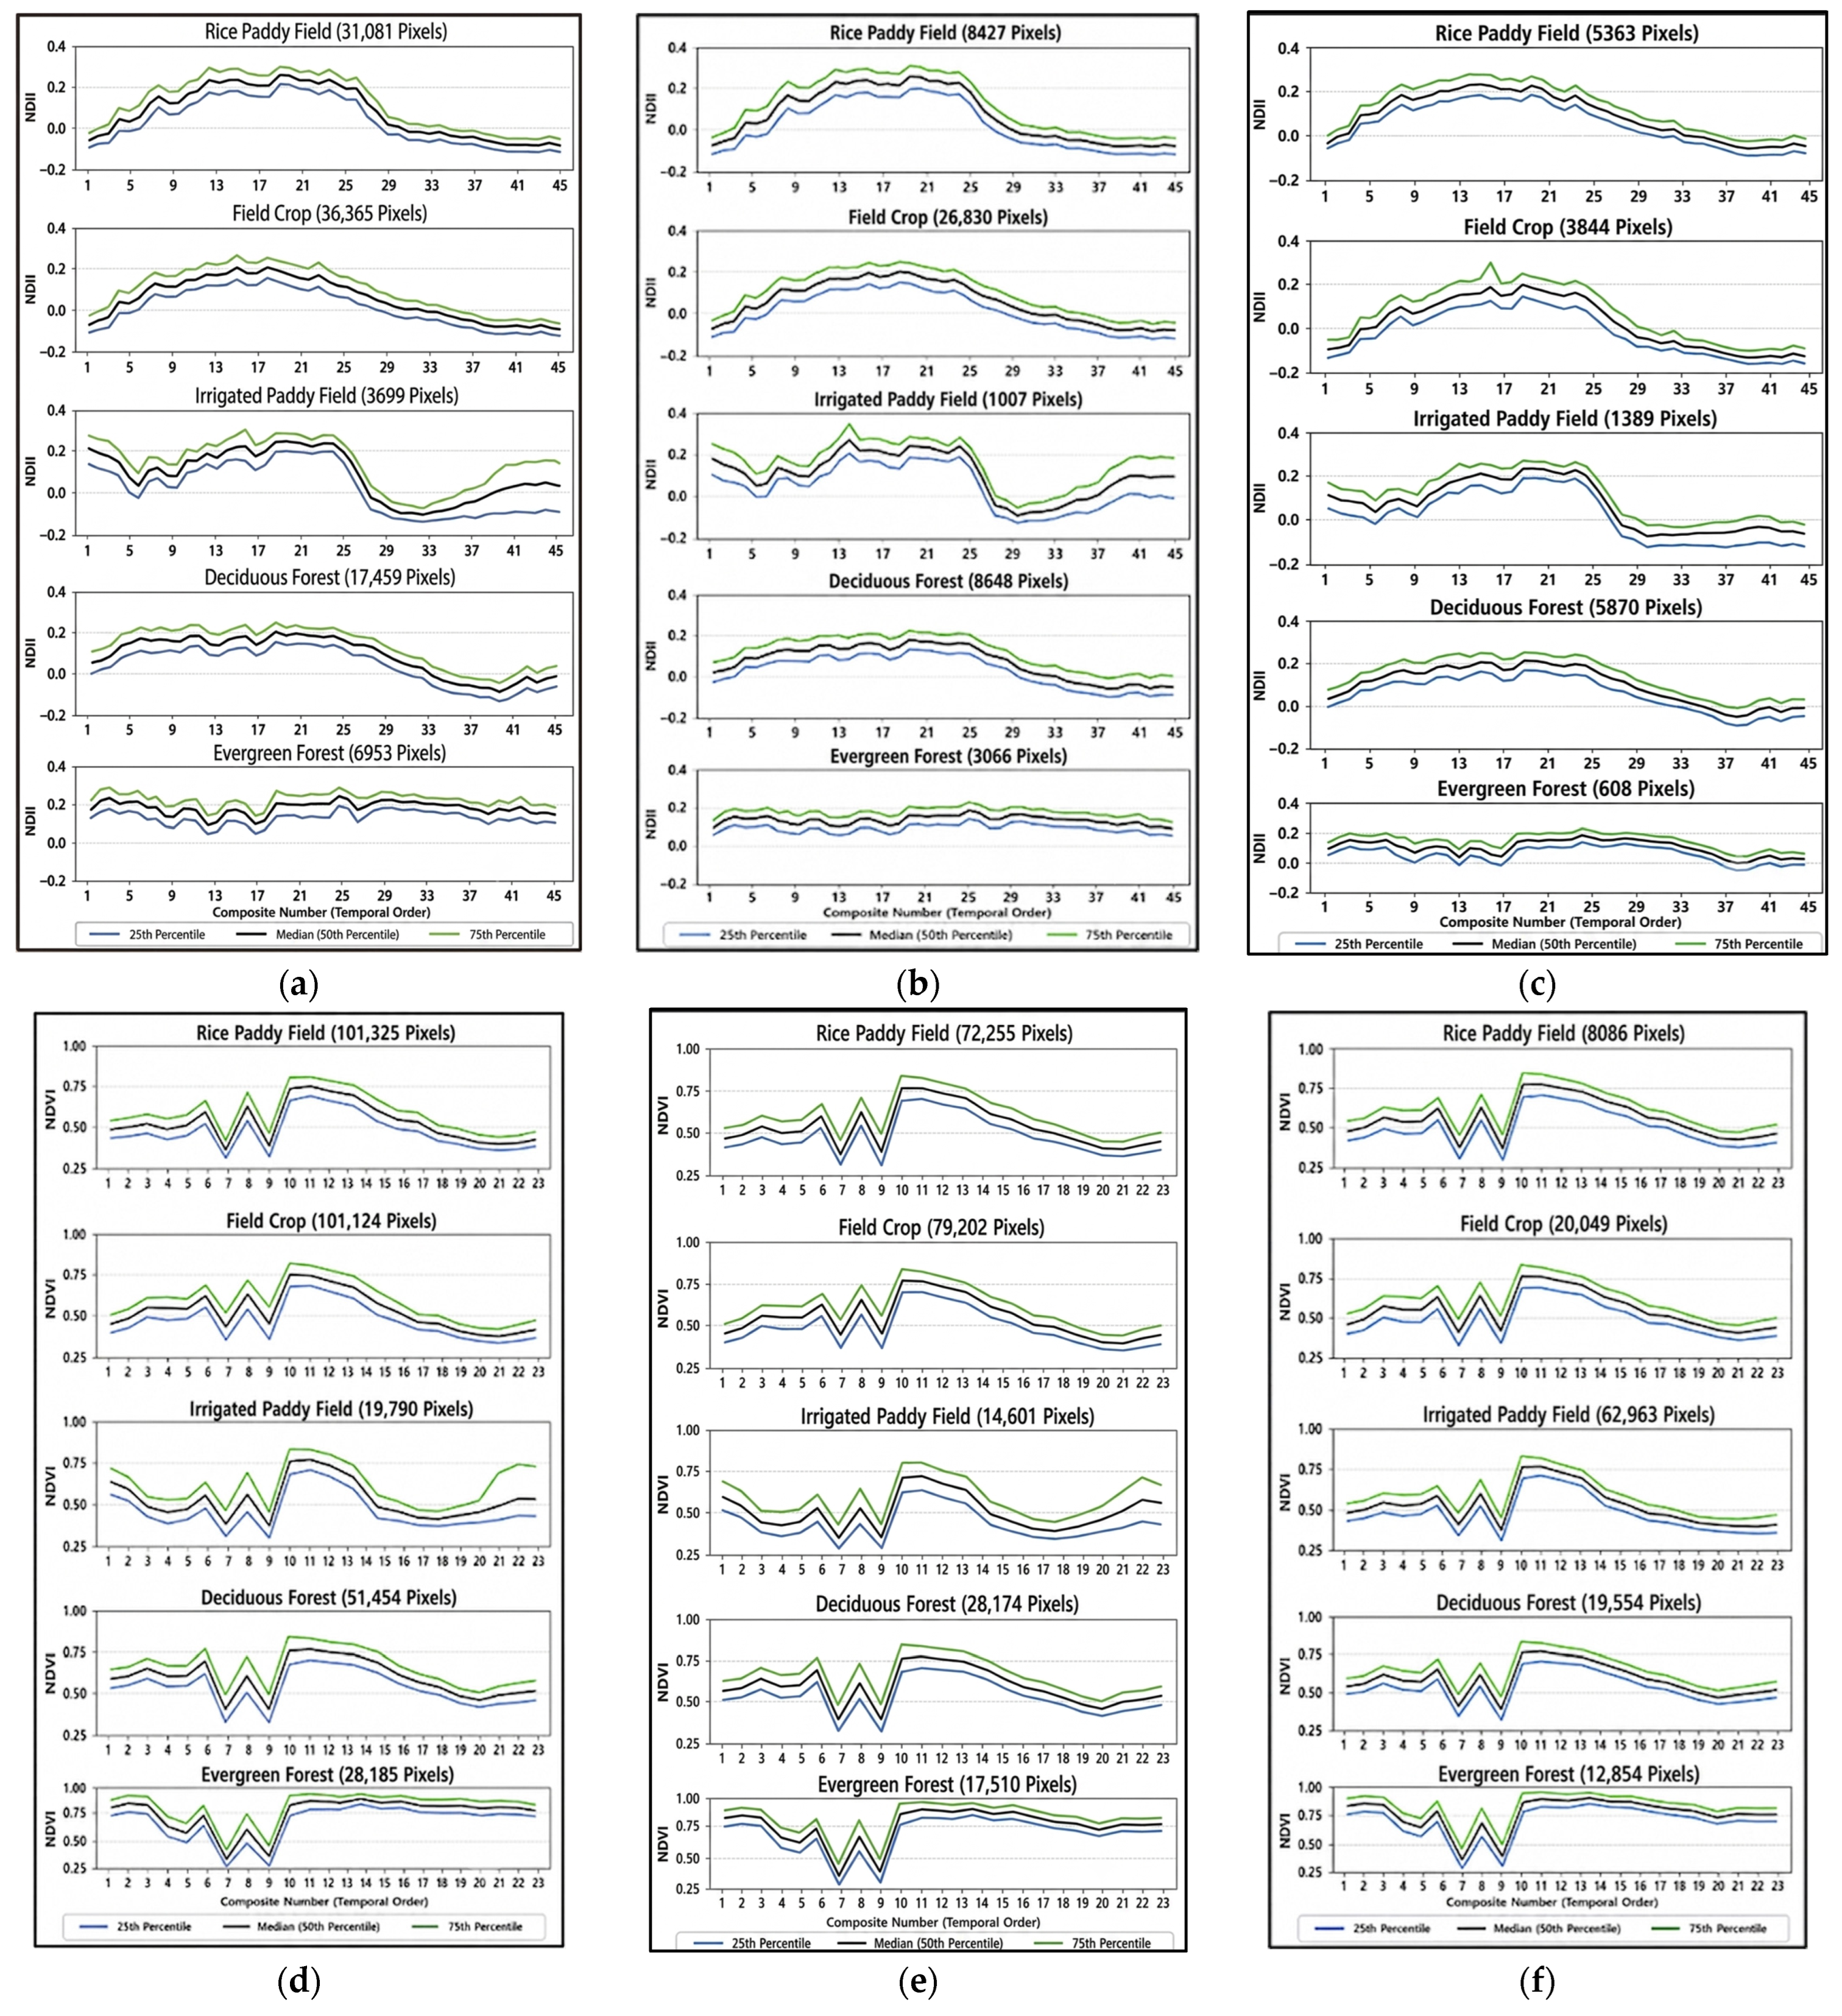
For each spectral cluster, temporal signatures were characterized using the 25th percentile, median (50th percentile), and 75th percentile values of the annual NDII and NDVI time series. Similar percentile-based signatures were generated for the five vegetation-related LDD classes considered in this study. The similarity between spectral clusters and LDD classes was quantified using the Root Mean Square Error (RMSE), and each cluster was assigned to the class associated with the minimum RMSE. This procedure transformed the 30 spectral clusters into five aggregated land use categories corresponding to the LDD classification system.
The aggregation procedure was independently applied to each year from 2010 to 2021 to account for interannual variations in vegetation phenology and moisture conditions.
It should be noted that the K-means clustering was used only as an initial partitioning step to separate pixels with similar temporal characteristics before the aggregation and temporal refinement procedures. The purpose of the initial clustering was to provide sufficient representation of the temporal variability in the satellite observations rather than to define the final land-use classes directly. The final classification was obtained after aggregation into the five vegetation-related LDD classes followed by the temporal refinement procedure based on spatial agreement and temporal similarity.
2.3.3. Enhancement of LULC Classification Accuracy
Initial comparisons between satellite-derived classifications and LDD reference data revealed substantial disagreement. However, part of this discrepancy can be attributed to the fact that LDD products are updated at multi-year intervals and therefore represent temporally static conditions, whereas NDII and NDVI observations capture continuous interannual variability in vegetation conditions. To reconcile these differences, an additional refinement procedure was developed to improve classification accuracy while preserving the temporal dynamics represented by the satellite-derived time series.
Identification of Reference-Consistent Pixels
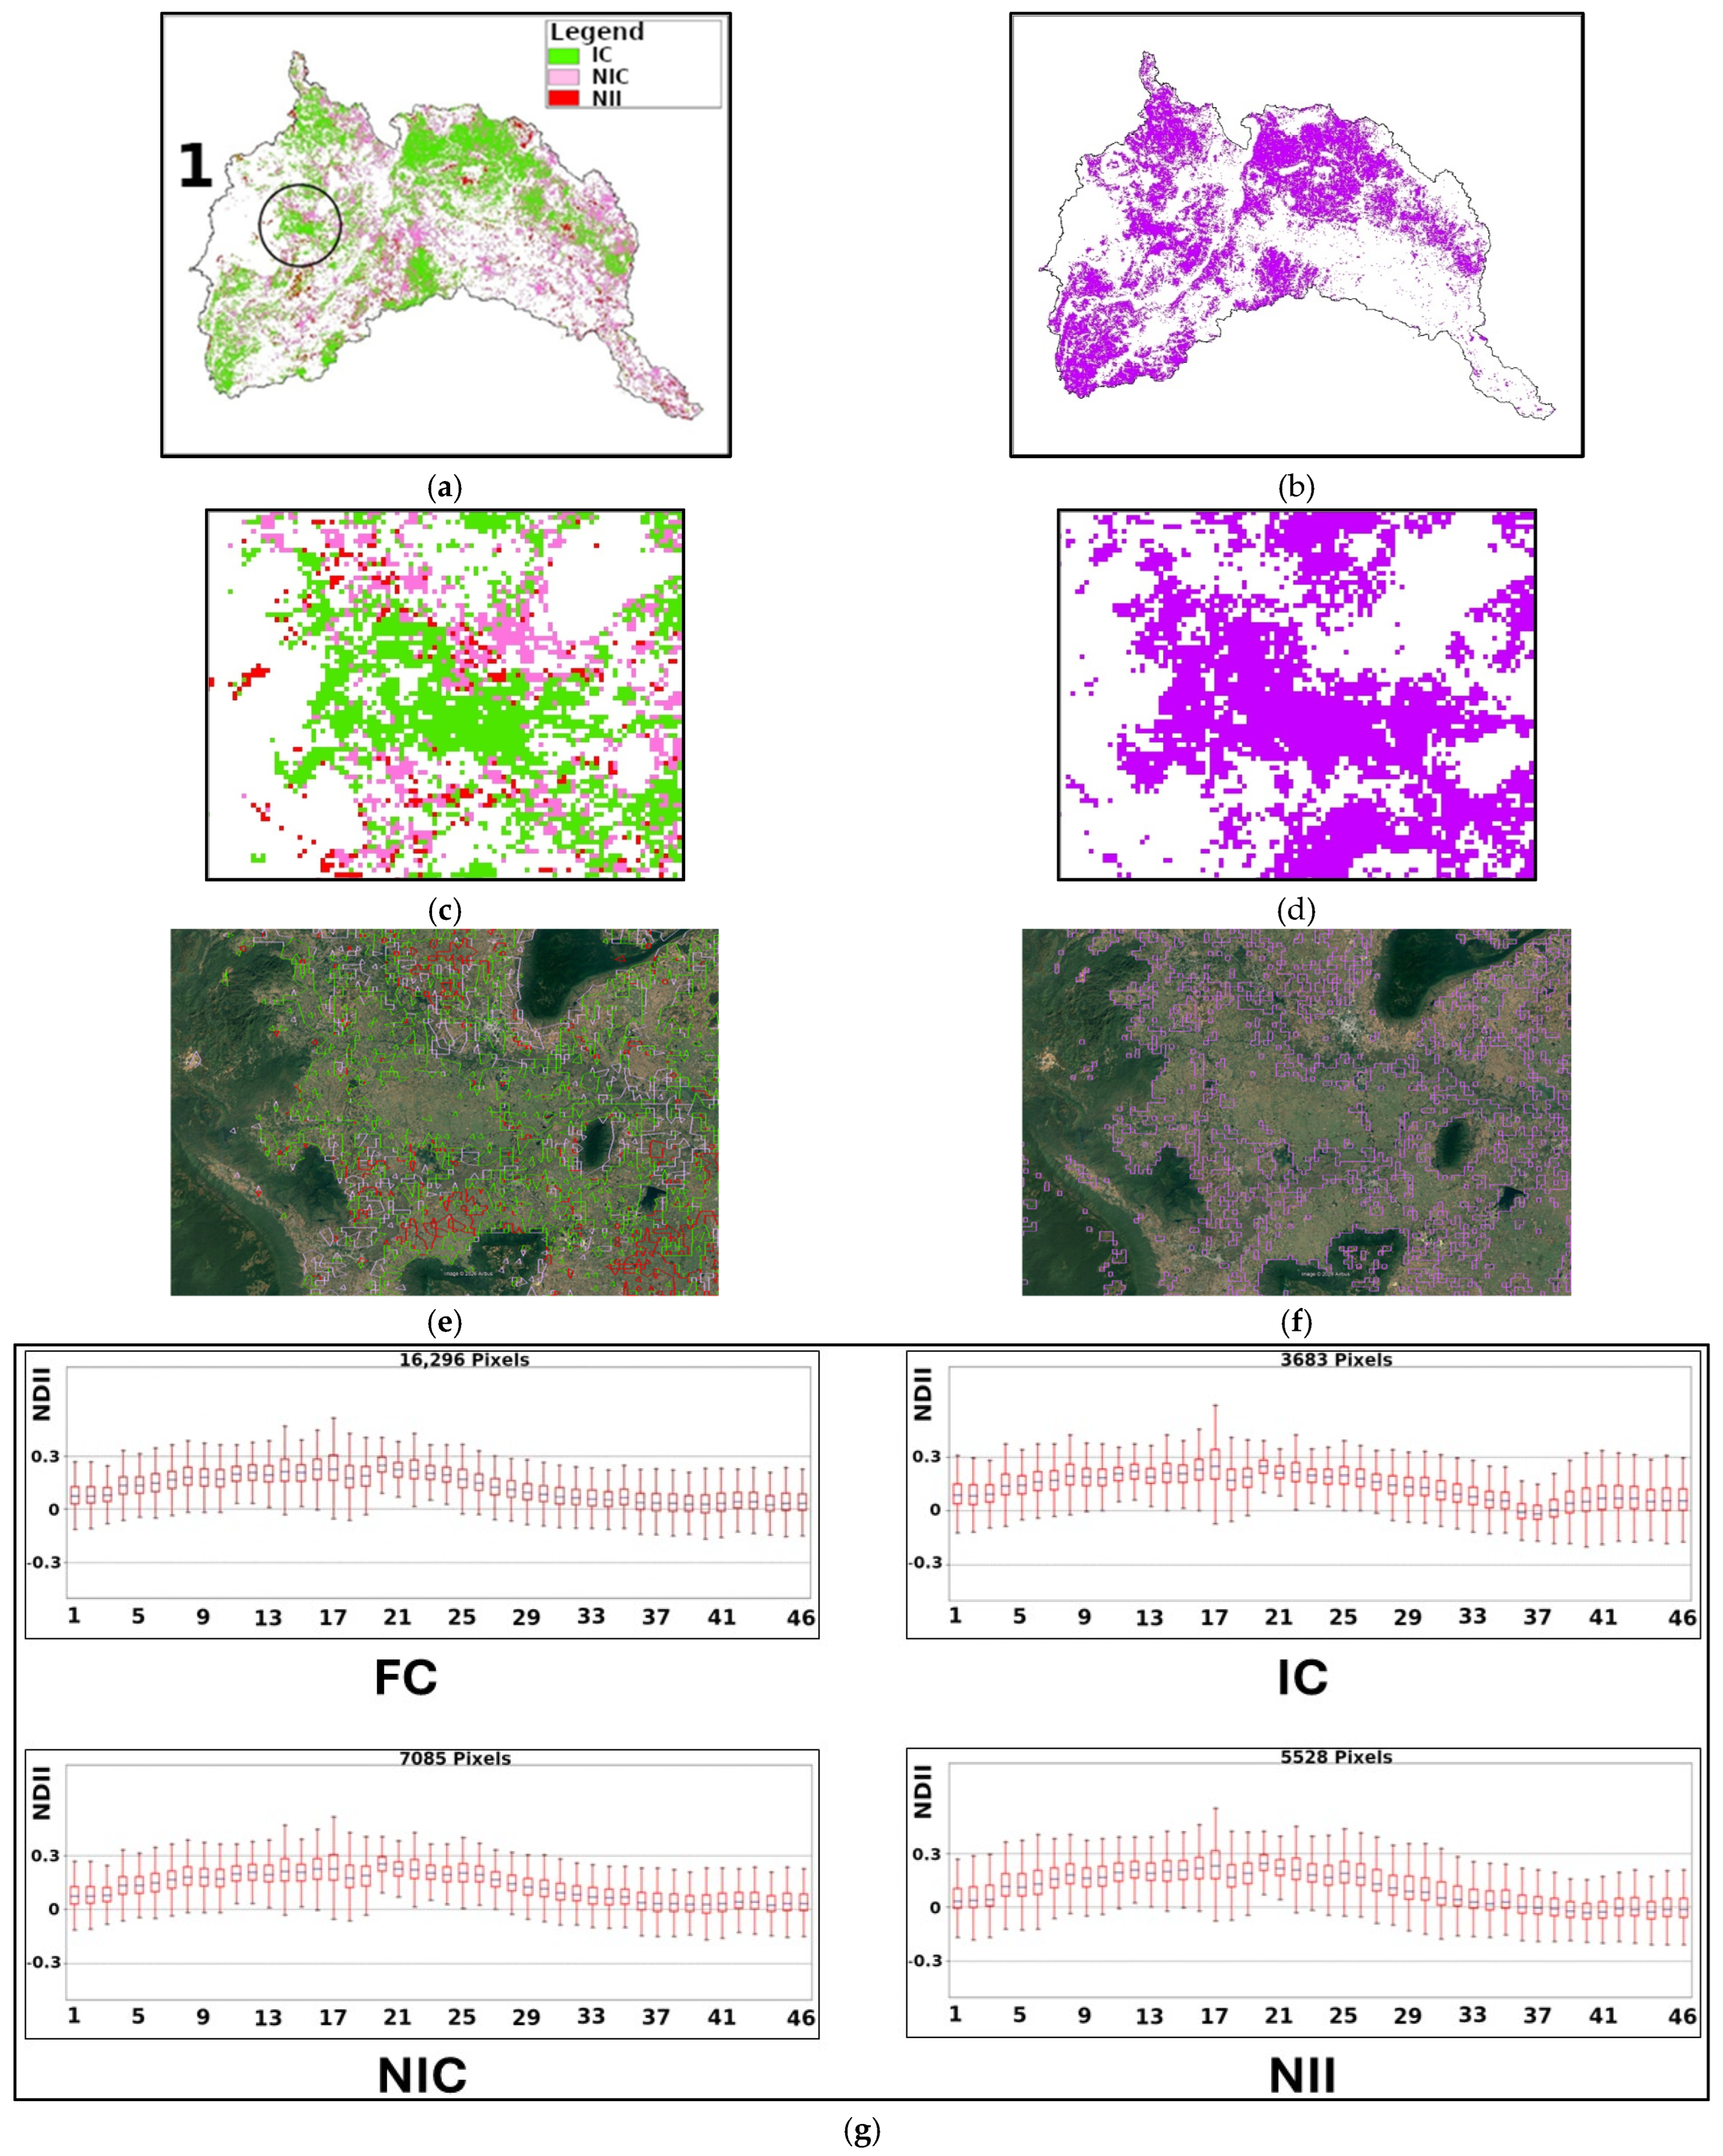
Pixels for which the satellite-derived classification agreed with the corresponding LDD class were first identified and referred to as Intersect and Correct (IC) pixels. These pixels were assumed to represent reliable samples of each land use category.
For each LDD class, representative temporal signatures were subsequently established using the median values of the annual NDII or NDVI time series. These median signatures provide characteristic patterns of vegetation dynamics for each land use category and serve as reference profiles for the subsequent refinement process.
Reclassification of Non-Intersect Pixels
Pixels exhibiting disagreement between the satellite-derived classification and the LDD class were identified as Non-Intersect (NIC) pixels. For each NIC pixel, the annual time series was compared with the representative signatures of the five land use categories. Similarity was quantified using RMSE, and each pixel was assigned to the class associated with the minimum RMSE.
Based on this comparison, NIC pixels were further categorized into two groups:
Non-Intersect but Correct pixels, whose reassigned class is consistent with the original satellite-derived classification. These pixels suggest that the satellite observations capture genuine temporal variability that is not represented in the temporally static LDD maps.
Non-Intersect and Incorrect pixels, whose reassigned class differs from both the original satellite-derived classification and the LDD class, indicating likely misclassification.
The reassigned pixels were collectively referred to as Newly Identified (NII) pixels.
Updating Land Use Classification
The final classification was obtained by integrating information from all pixel groups:
Intersect and Correct (IC) pixels were retained unchanged.
Non-Intersect but Correct pixels were reassigned to the class identified through RMSE-based temporal matching, thereby accounting for temporal variability not represented in the LDD dataset.
Non-Intersect and Incorrect pixels were reassigned to the most suitable class according to the minimum RMSE criterion.
This integration produced refined annual LULC maps that combine the consistency of operational land use products with the dynamic information contained in satellite-derived vegetation indices. The refinement procedure was independently applied to each year during the study period (2010–2021), resulting in temporally explicit annual LULC maps that capture interannual variability in land surface dynamics.
2.3.4. Validation and Comparative Assessment of LULC Classification
Classification performance was evaluated using Land Development Department (LDD) land use data as reference information. A confusion matrix was constructed to quantify the agreement between classified results and reference classes, following established accuracy assessment protocols in remote sensing [
11,
57,
58]. Overall Accuracy (OA) and the Kappa coefficient (K) were calculated as:
where
denotes the number of correctly classified samples for class
,
and
represent the marginal totals for row
and column
, respectively,
is the number of classes, and
is the total number of samples.
Because LDD land use data were also used during the refinement process, completely independent quantitative validation using the same dataset is not feasible. This introduces a degree of dependency that may lead to optimistic accuracy estimates. Therefore, an additional qualitative comparison was conducted using high-resolution imagery available from the Google Earth version 6.8 to assess the spatial consistency of the refined classifications, particularly in areas characterized by heterogeneous land use and dynamic agricultural practices.
It should be noted that the objective of the qualitative comparison was not to provide an independent statistical validation of the proposed framework. Instead, it was intended to examine whether the refined classifications were spatially consistent with the observed land-cover conditions at representative locations. Since the proposed framework was developed to reconcile discrepancies between dynamic satellite observations and temporally static land-use datasets over the period 2010–2021, a statistically independent validation would require temporally consistent reference data for each year, which are not available for the study area.
Although visual interpretation does not provide a statistically rigorous accuracy measure, it offers valuable supporting evidence for evaluating the performance of the proposed temporal refinement framework in regions where reliable reference data are limited.
In addition to NDII-based classification, the entire framework described above was independently applied to NDVI time series. Because NDVI data were derived from the MOD13Q1 product, annual NDVI time series consisted of 23 sixteen-day composites, compared with 46 eight-day composites for NDII derived from MOD09A1. These differences in temporal resolution may influence the ability of each index to capture intra-annual variability, particularly in monsoon-driven environments characterized by rapidly changing vegetation and moisture conditions.
3. Results
3.1. Initial Classification Performance
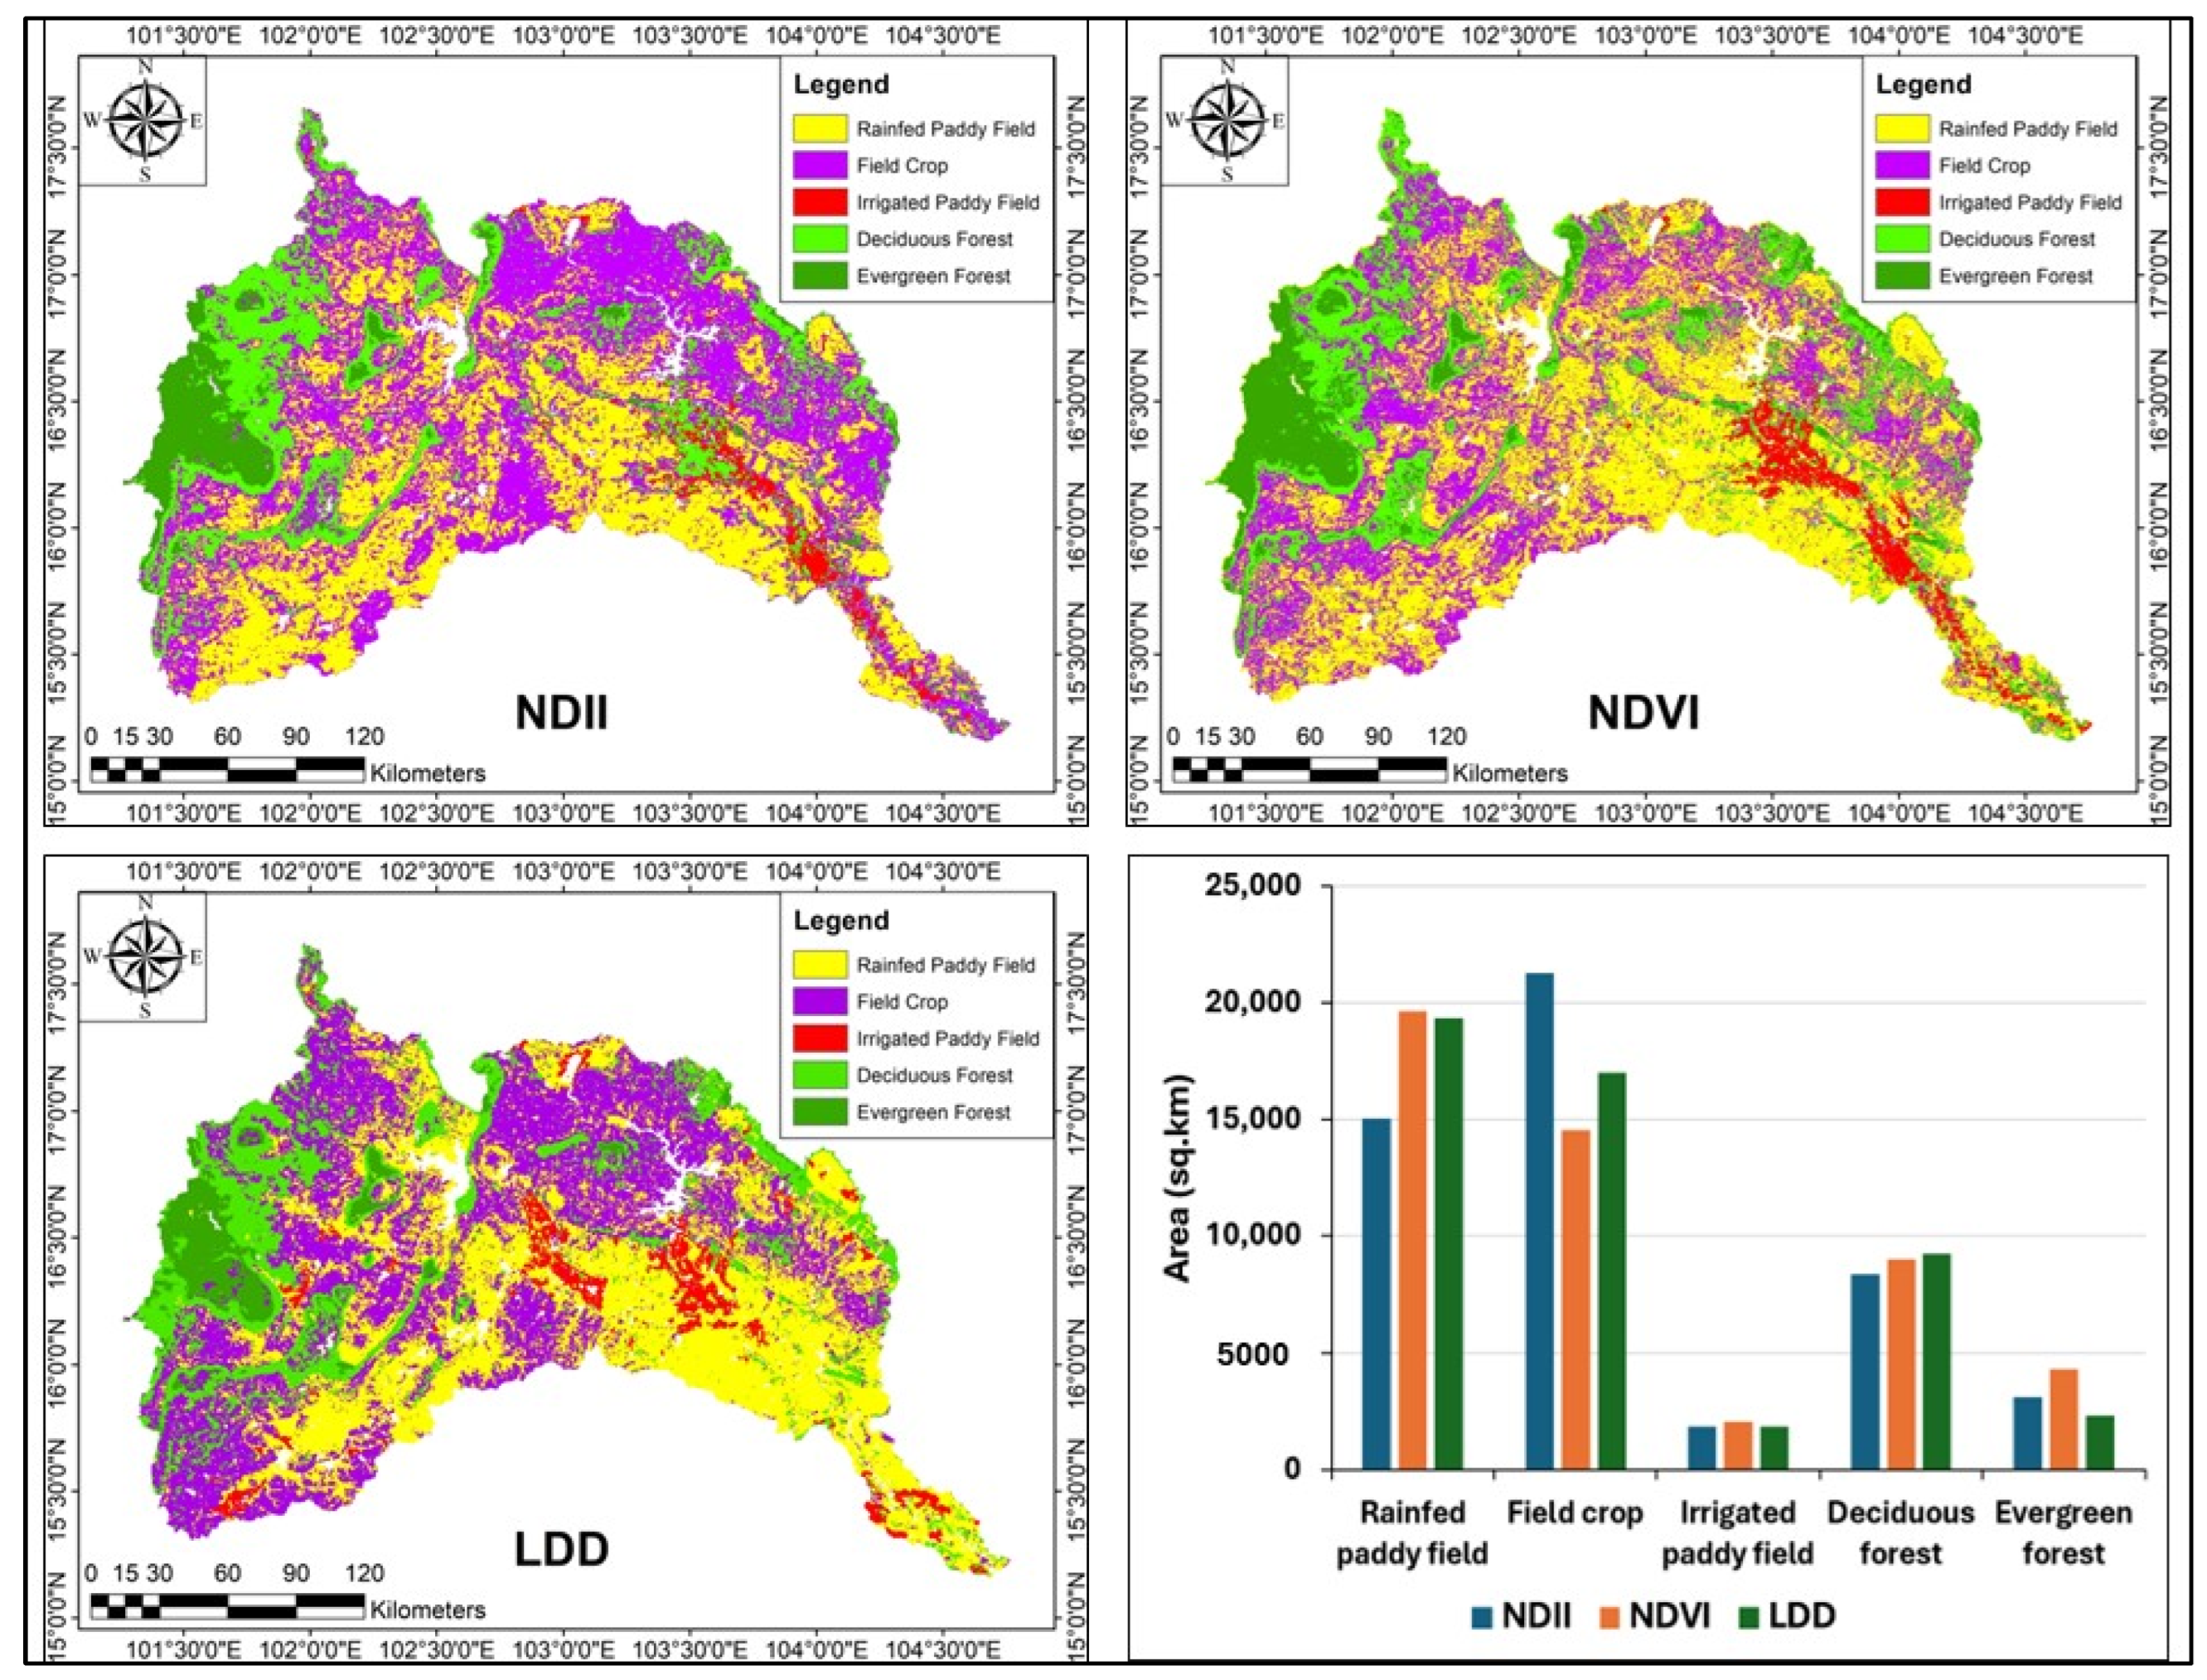
Figure 3 presents the annual land use and land cover (LULC) maps derived from NDII and NDVI time series before applying the temporal refinement procedure. In general, both indices successfully reproduced the major spatial patterns of agricultural and forested areas across the Chi River Basin. However, substantial discrepancies with the LDD land use maps were observed, particularly in regions characterized by fragmented landscapes and strong seasonal variability.
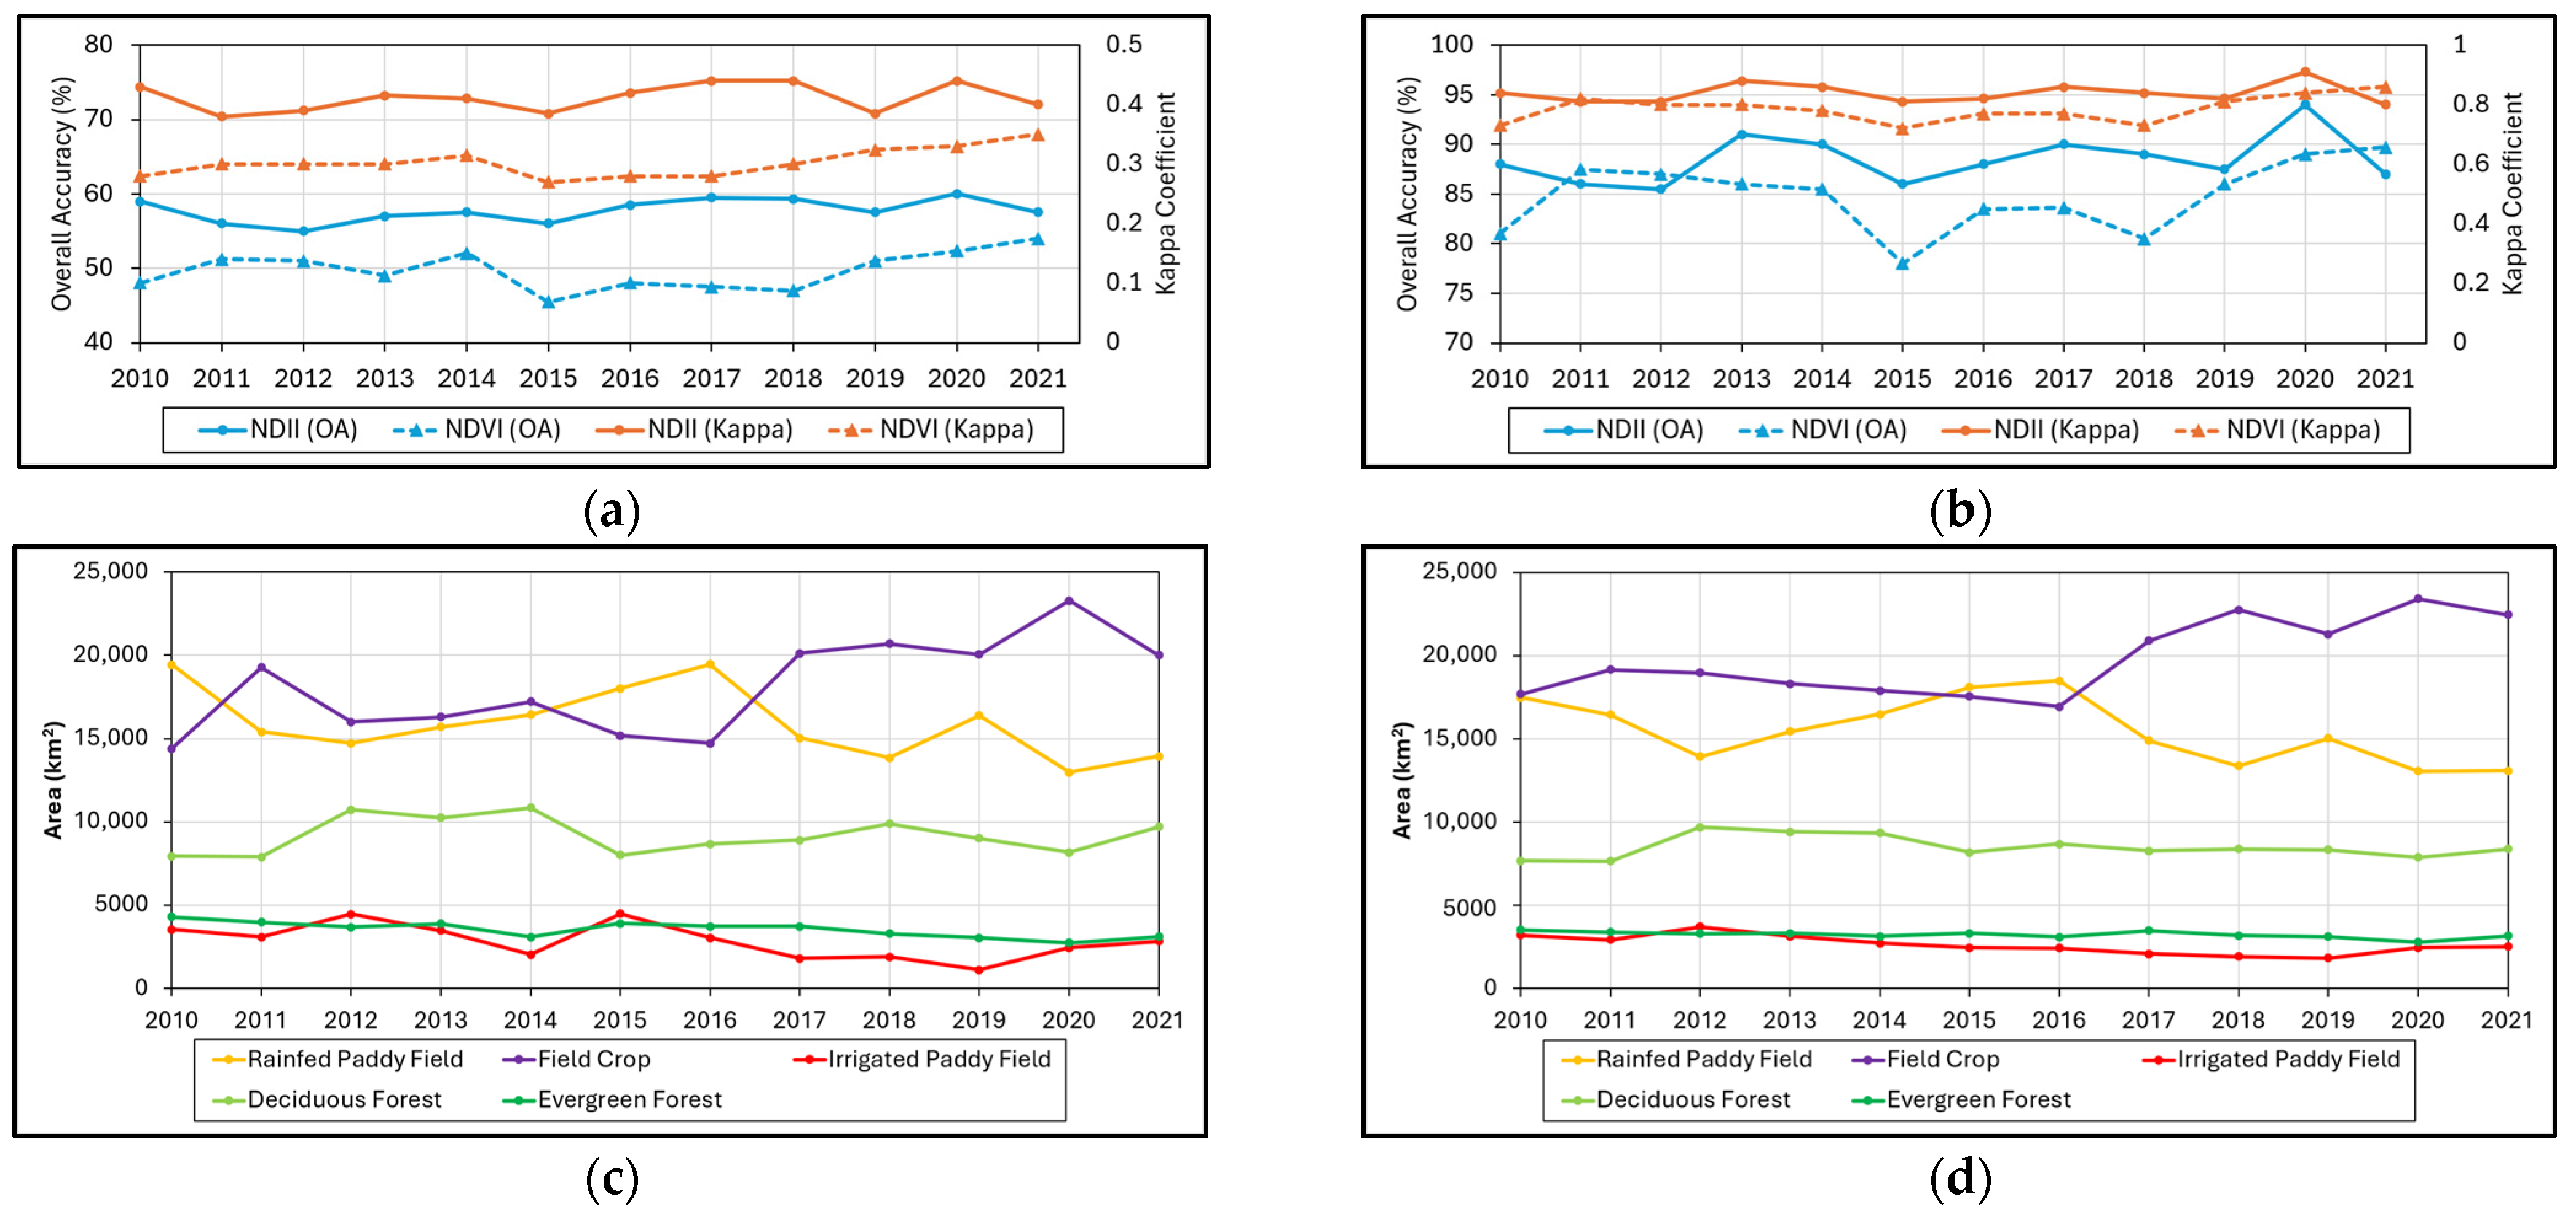
The initial NDII-based classification achieved an average Overall Accuracy (OA) of 57.35% with a Kappa coefficient of 0.36, whereas the corresponding NDVI-based classification yielded an average OA of 51.27% and a Kappa coefficient of 0.28. These results indicate that direct comparisons between dynamic satellite observations and temporally static LDD products may lead to considerable apparent disagreement.
Despite the relatively modest accuracies, NDII consistently outperformed NDVI, suggesting that vegetation moisture information provides additional discriminatory capability beyond vegetation greenness alone.
3.2. Improvement of Classification Accuracy Through Temporal Refinement
The application of the enhancement procedure described in
Section 4.3 resulted in substantial improvements in classification performance.
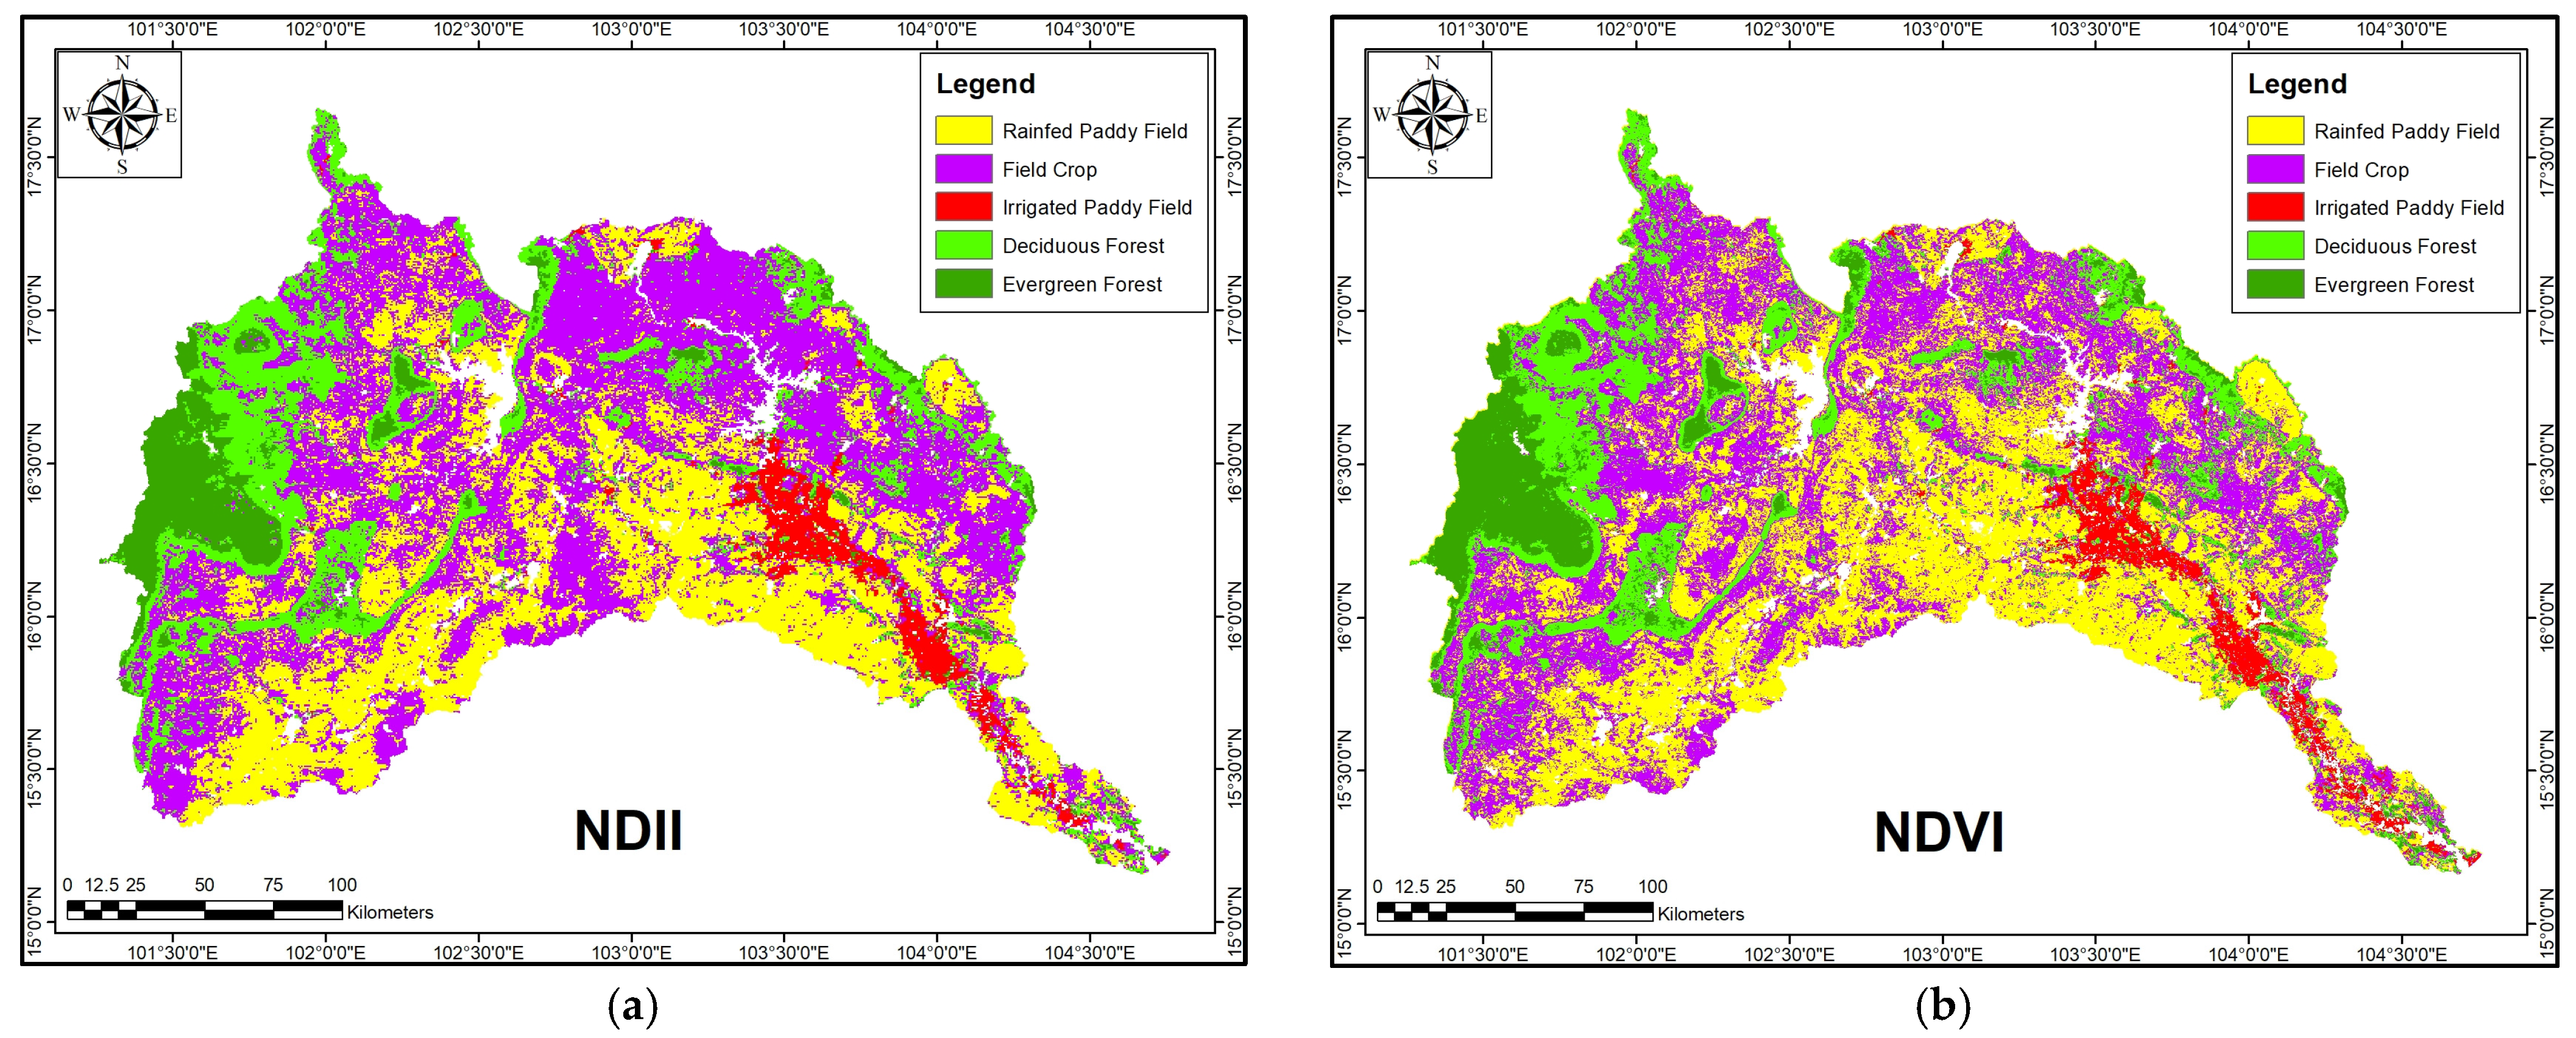
Figure 4 illustrates the spatial distribution of the refined classifications obtained from NDII and NDVI time series.
Following temporal refinement, the average OA increased from 57.35% to 87.28% for NDII and from 51.27% to 86.24% for NDVI. Similarly, the Kappa coefficient increased from 0.36 to 0.82 for NDII and from 0.28 to 0.81 for NDVI. These improvements demonstrate that a large proportion of the initial disagreement can be reconciled through temporal signature analysis.
The enhanced classifications preserve the temporal information contained in the satellite observations while maintaining overall consistency with the LDD classification system. The improvement was particularly evident in areas exhibiting strong interannual variability, where discrepancies between satellite observations and the static LDD maps were frequently observed.
3.3. Comparison Between NDII and NDVI
Figure 5 compares the classification performance obtained from NDII and NDVI throughout the study period. Although both vegetation indices exhibited substantial improvements after temporal refinement, NDII consistently produced slightly higher accuracies than NDVI.
The superior performance of NDII can be attributed to its sensitivity to canopy moisture conditions through the shortwave infrared region. In monsoon-driven environments, vegetation water content and soil moisture strongly influence vegetation dynamics and agricultural activities. Consequently, NDII provides complementary information that is not fully represented by greenness-based indices.
In addition, the higher temporal resolution of MOD09A1, which provides 46 observations per year compared with 23 observations for MOD13Q1, enables NDII to better capture intra-annual variability associated with cropping cycles and seasonal moisture fluctuations.
3.4. Qualitative Validation Using High-Resolution Imagery
Figure 6 presents representative examples of evergreen forest, deciduous forest, irrigated agricultural areas, and field crop regions derived from NDII and NDVI classifications together with corresponding high-resolution imagery obtained from Google Earth. Overall, the refined classifications exhibit good agreement with the observed land cover characteristics. In particular, NDII-derived classifications show improved consistency in regions characterized by heterogeneous vegetation patterns and dynamic agricultural activities.
In addition to improving the overall classification accuracy, the proposed temporal refinement framework also enhanced the temporal consistency of the classified LULC areas (
Figure 6c,d). Before refinement, several land-cover classes, particularly deciduous forest, exhibited relatively large year-to-year fluctuations. Following refinement, the annual areas of both deciduous and evergreen forest became more temporally consistent, indicating that the refinement effectively reduced temporal classification noise. In contrast, the agricultural classes (rainfed paddy and field crops) continued to exhibit interannual variability. Such variations are expected because cropping patterns in the study area may change from year to year in response to water availability, irrigation conditions, and agricultural management practices. These results suggest that the proposed framework improves classification consistency while preserving realistic temporal variations in agricultural land use.
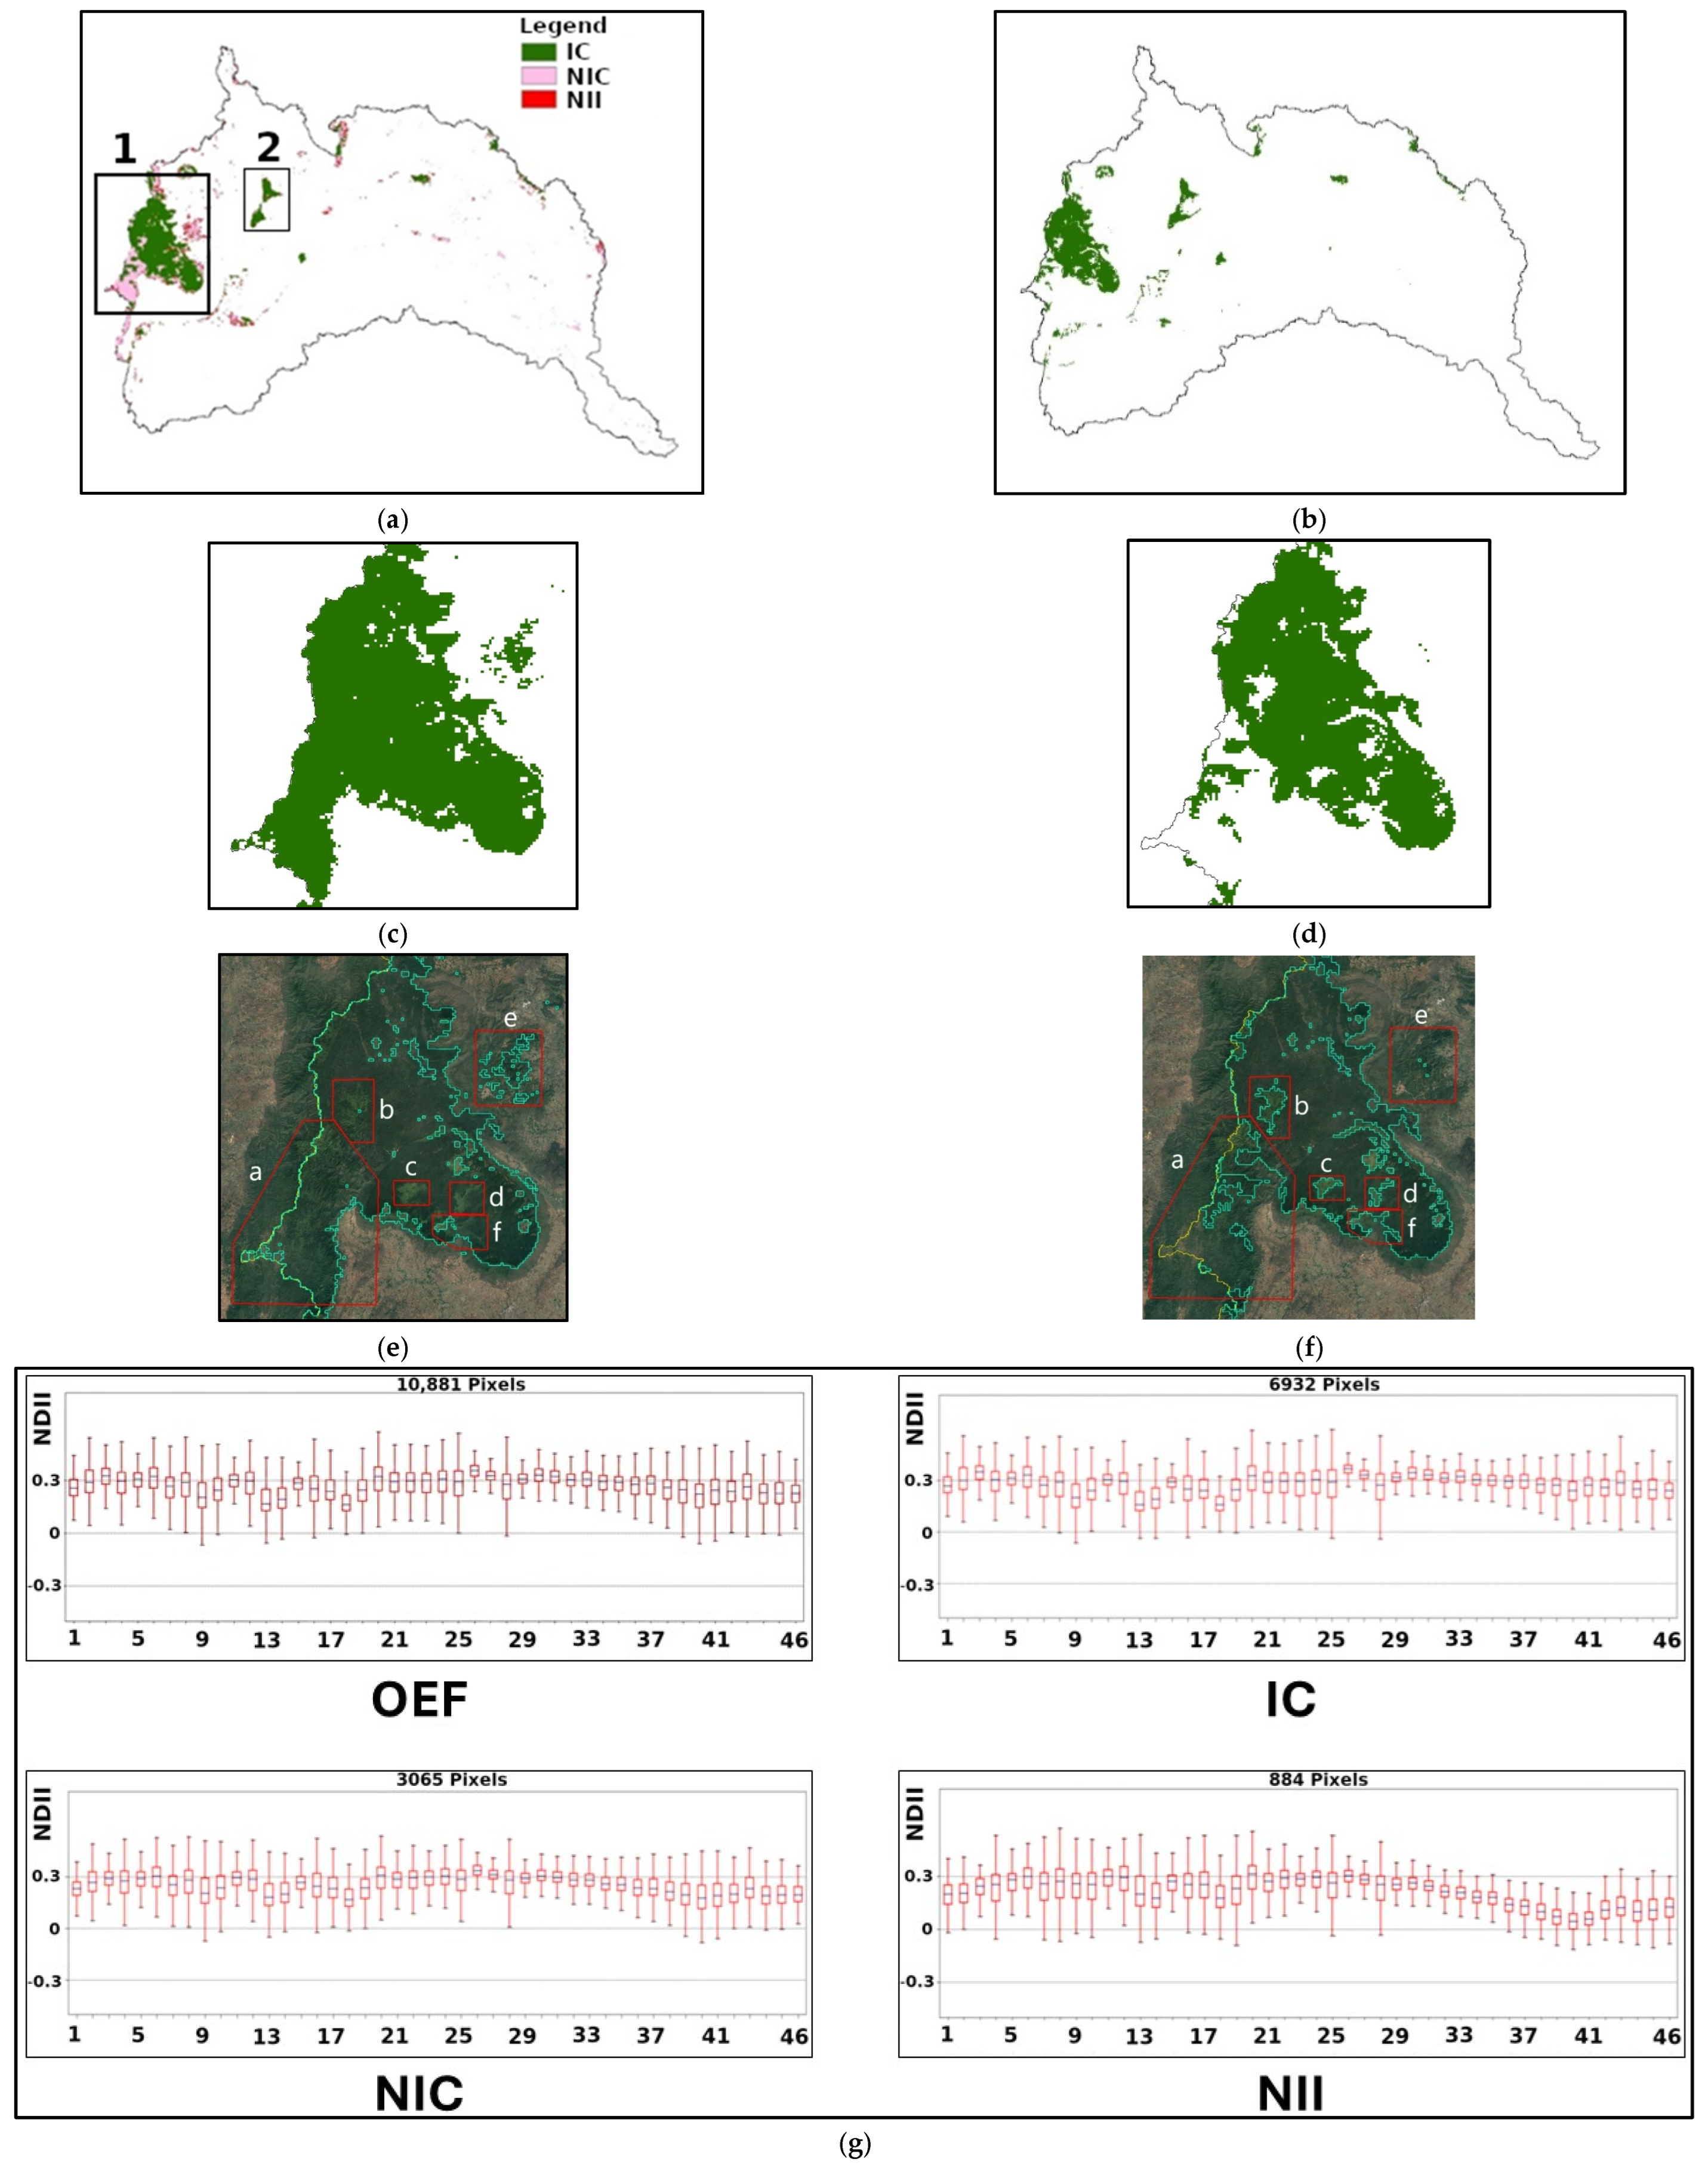
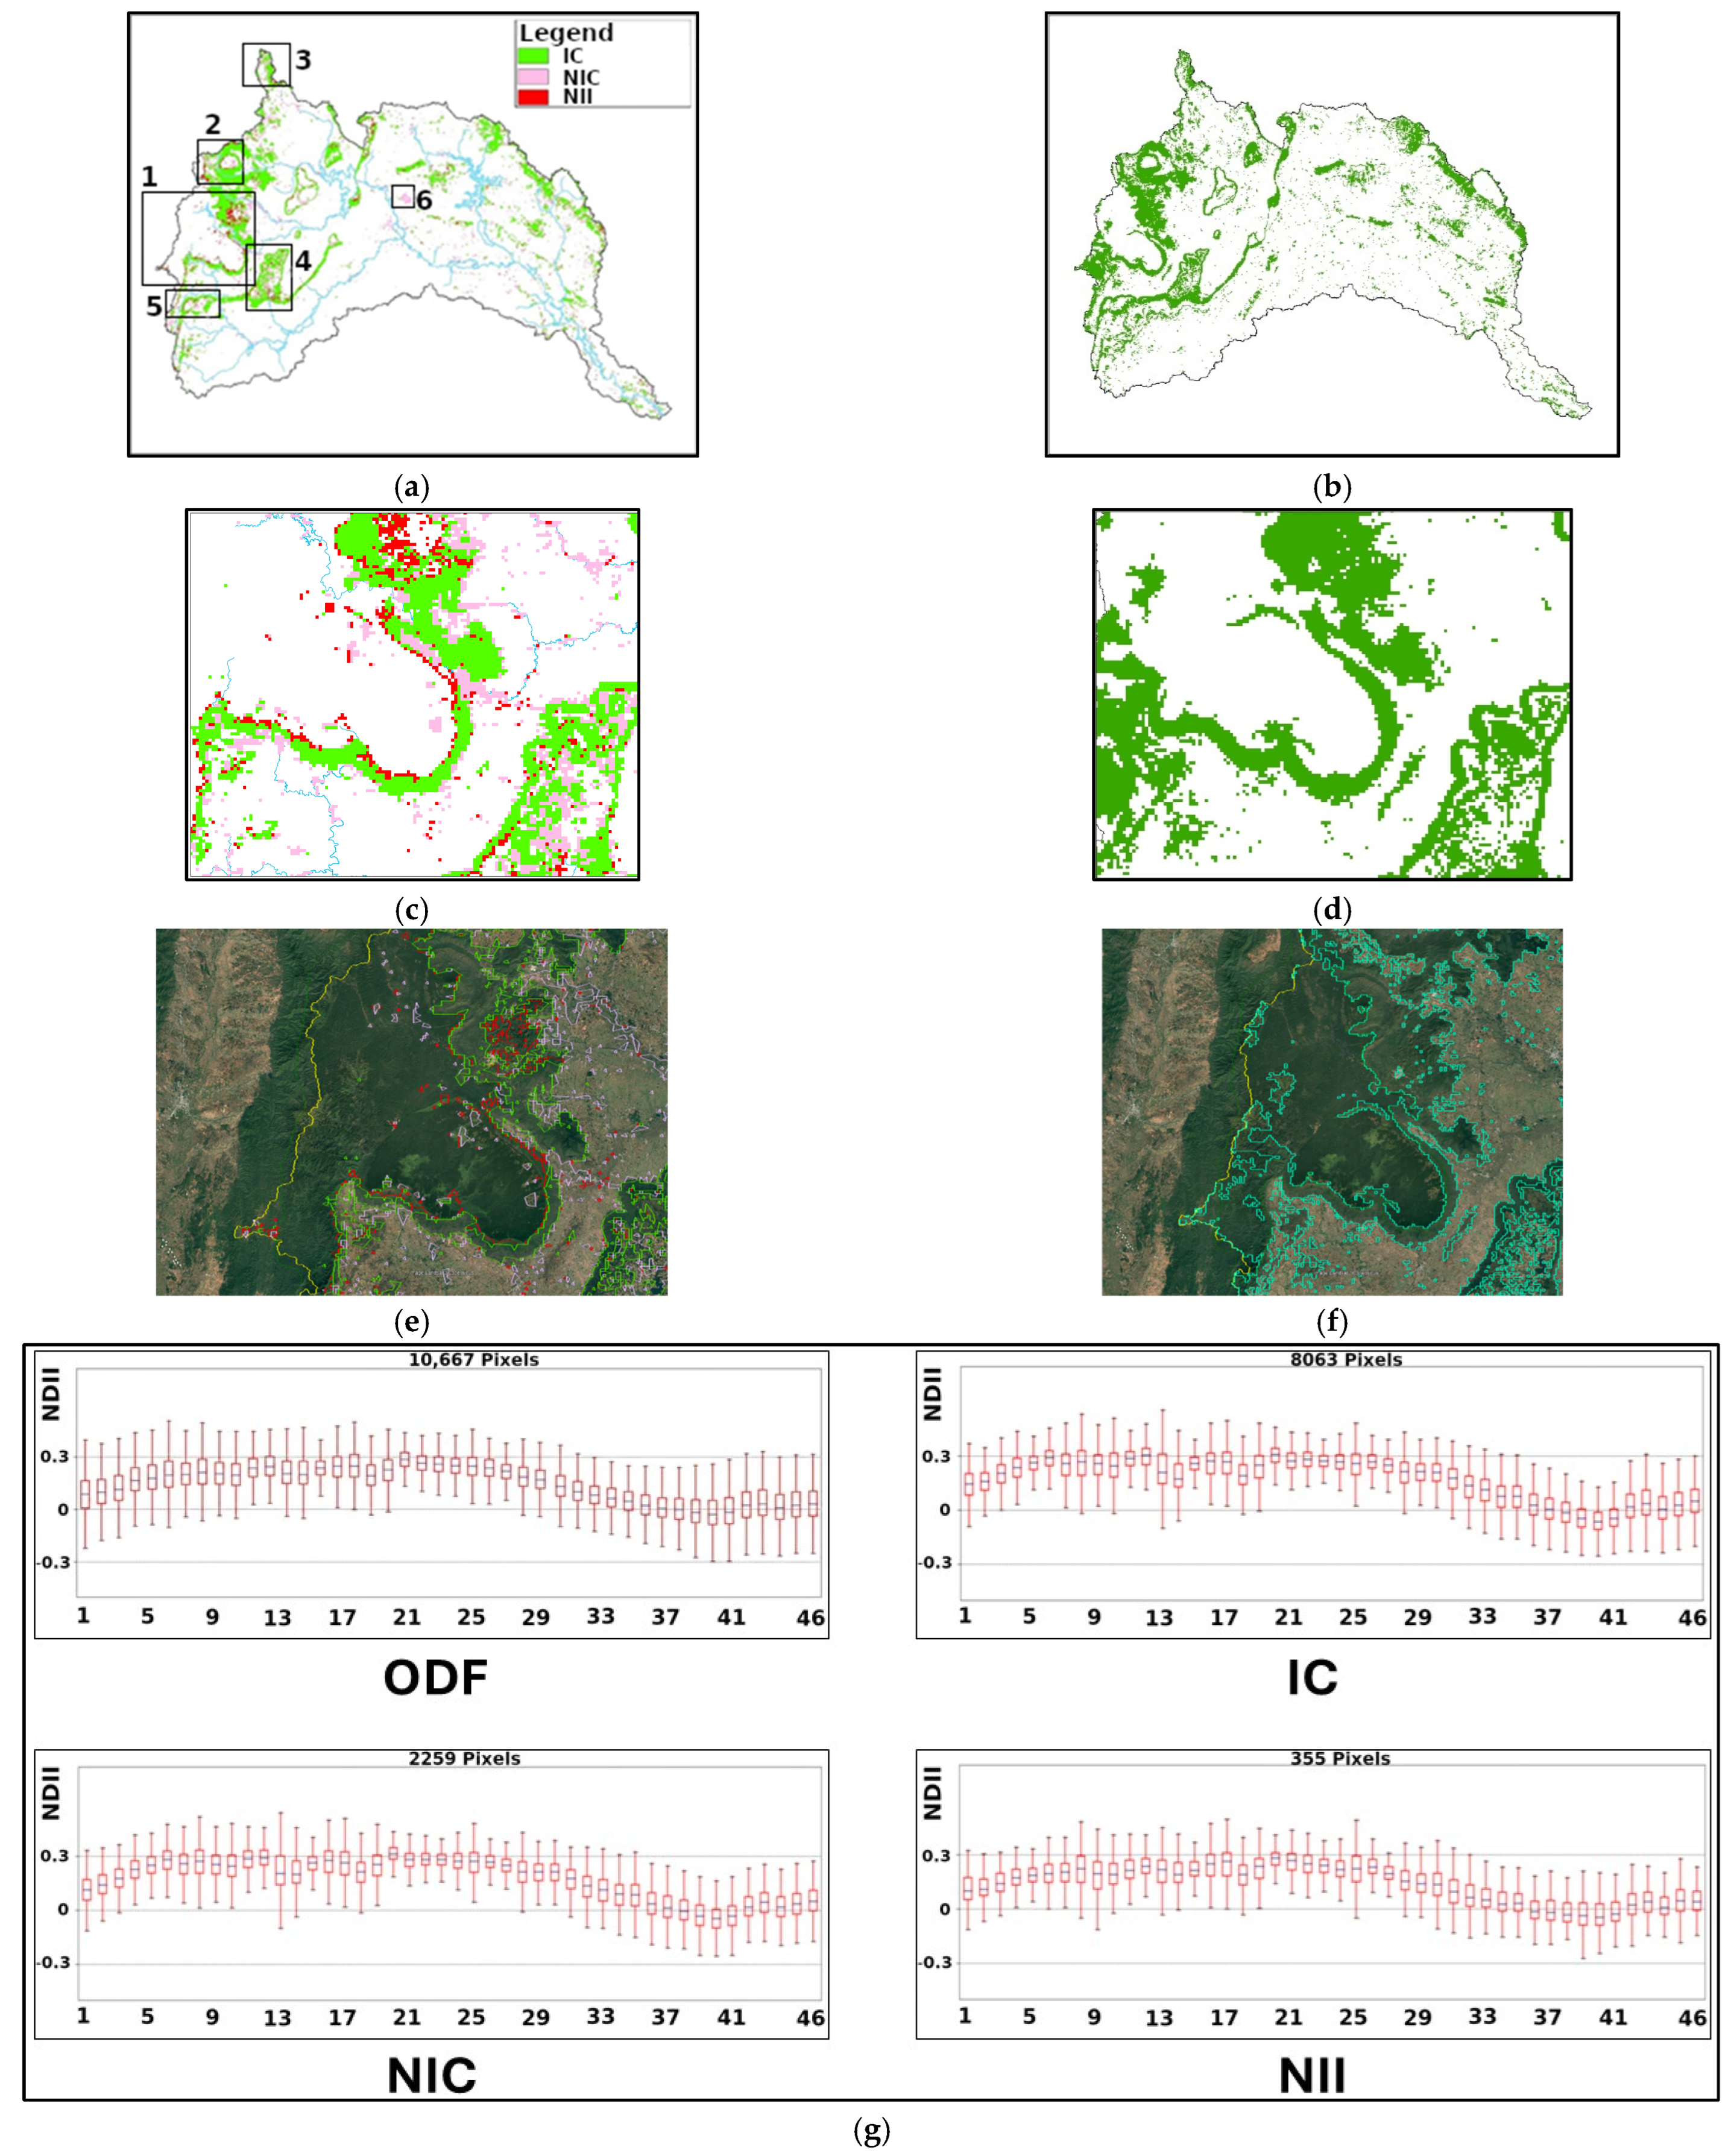
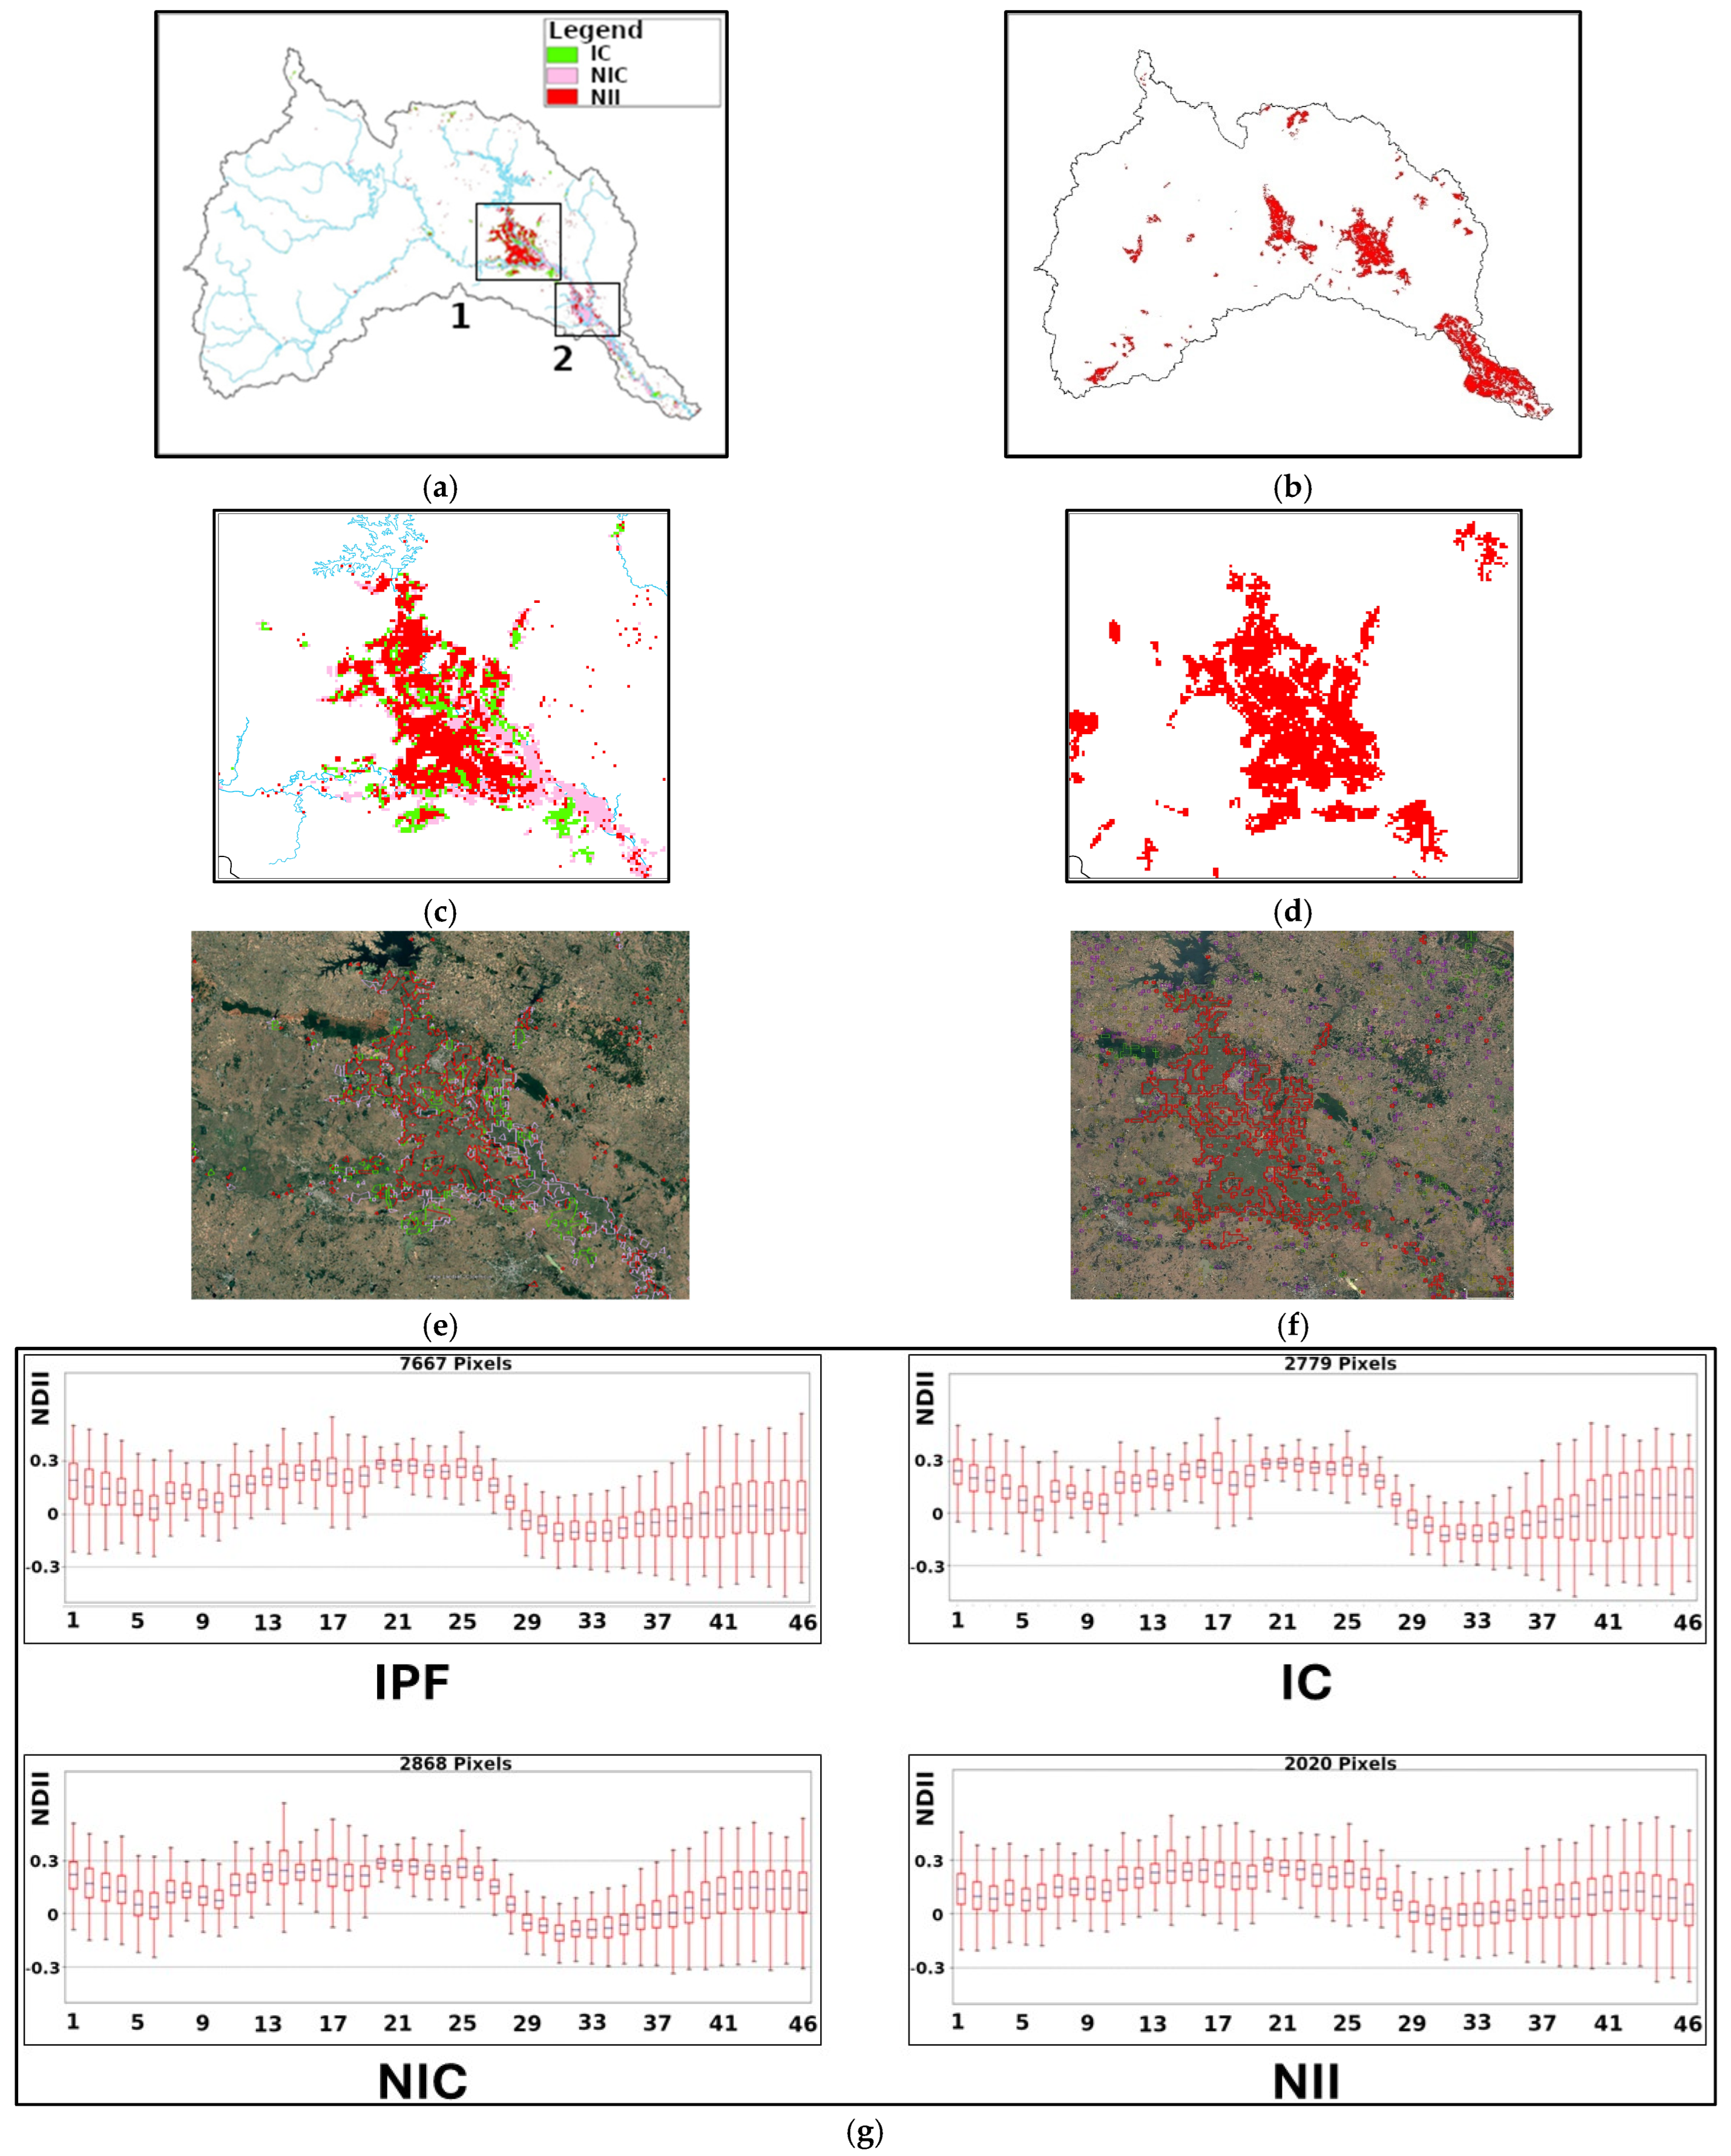
To further examine the reliability of the refined classifications, detailed comparisons were conducted for representative areas corresponding to evergreen forest, deciduous forest, irrigated agricultural land, and field crops (
Figure 7,
Figure 8,
Figure 9 and
Figure 10). These examples provide independent visual evidence of the capability of NDII and NDVI time series to represent vegetation-related land use patterns.
For evergreen forest areas (
Figure 7), both NDII and NDVI classifications generally correspond well with the high-resolution imagery. However, the NDII-based classification better captures the spatial continuity and moisture characteristics associated with dense evergreen vegetation.
In deciduous forest regions (
Figure 8), the refined classifications successfully distinguish deciduous vegetation from adjacent agricultural areas. The observed patterns are generally consistent with the seasonal characteristics evident in the high-resolution imagery.
Figure 9 illustrates representative irrigated agricultural areas. The refined classifications effectively identify irrigated regions despite the complexity of agricultural practices and cropping cycles. The temporal information contained in the satellite observations enables the distinction of irrigated land from surrounding rainfed areas.
For field crop regions (
Figure 10), both NDII and NDVI classifications reproduce the major spatial patterns observed in the reference imagery. Nevertheless, NDII generally provides more coherent spatial patterns, reflecting its ability to capture variations in canopy moisture and seasonal agricultural dynamics.
Several locations identified as Non-Intersect but Correct correspond closely with the land cover conditions observed in the high-resolution imagery. These examples suggest that part of the disagreement with the LDD maps reflects genuine temporal variability captured by satellite observations rather than classification errors. Consequently, the refined classifications provide a more realistic representation of land surface dynamics in monsoon-driven agricultural landscapes.
4. Discussion
4.1. Role of Temporal Signatures in Improving Classification Reliability
The results demonstrate that the temporal refinement procedure substantially improves the agreement between satellite-derived classifications and the reference land use maps. For both NDII and NDVI, Overall Accuracy and Kappa coefficients increased considerably following the enhancement procedure, indicating that temporal information contained in the annual vegetation signatures provides valuable information for distinguishing vegetation-related land use classes.
Unlike conventional approaches that rely solely on spectral similarity, the present framework exploits temporal characteristics derived from annual time series. Representative signatures obtained from pixels exhibiting agreement with the LDD maps provide robust descriptions of vegetation behaviour and enable the reassessment of pixels exhibiting disagreement. Consequently, the refined classifications preserve the temporal dynamics represented by the satellite observations while maintaining consistency with the operational land use products.
These findings highlight the importance of incorporating temporal information into land use classification, particularly in monsoon-driven environments characterized by strong seasonal variability and diverse cropping systems.
4.2. Superior Performance of NDII over NDVI
Although both indices exhibited substantial improvements after temporal refinement, NDII consistently outperformed NDVI throughout the study period. The higher accuracy achieved by NDII can be attributed to the sensitivity of the shortwave infrared (SWIR) region to vegetation water content and canopy moisture conditions.
In monsoon-driven agricultural landscapes, vegetation growth is strongly controlled by moisture availability. Consequently, variations in canopy water content and root-zone moisture influence vegetation dynamics in ways that are not fully captured by greenness-based indices. Previous studies have demonstrated that NDII is closely related to vegetation water status and can provide information complementary to NDVI [
38,
50]. Furthermore, ref. [
49] showed that NDII-derived time series correspond well with root-zone moisture dynamics and improve the physical realism of distributed hydrological models.
Another factor contributing to the superior performance of NDII is the higher temporal resolution of the MOD09A1 product, which provides 46 observations per year compared with 23 observations for MOD13Q1. The denser temporal sampling enables NDII to better capture intra-annual variations associated with cropping cycles and seasonal moisture fluctuations.
These results suggest that vegetation moisture dynamics constitute an important source of information for land use classification in tropical monsoon environments and complement the greenness information represented by NDVI.
4.3. Reconciling Dynamic Satellite Observations with Temporally Static Land Use Products
One of the most important findings of this study is that disagreement between satellite-derived classifications and the LDD maps does not necessarily represent classification errors. Because the LDD products are updated at multi-year intervals, they provide snapshots of land use conditions and may not fully represent interannual variability in vegetation conditions and agricultural practices.
The qualitative validation using high-resolution imagery revealed that several locations identified as Non-Intersect but Correct correspond closely with the actual land cover conditions observed in Google Earth. These examples suggest that some discrepancies arise from genuine temporal variability captured by the satellite observations rather than inaccuracies in the classification process.
This finding highlights a fundamental challenge in evaluating dynamic satellite products using periodically updated reference datasets. Apparently incorrect classifications may in some cases reflect real changes in land cover conditions that are not represented in static land use maps. Therefore, discrepancies between the two datasets should not always be interpreted as errors, but rather as manifestations of differences in temporal representation.
The results demonstrate that integrating static reference products with dynamic satellite observations provides a practical approach for generating temporally explicit annual land use maps while preserving consistency with operational land use products.
4.4. Implications for Agricultural and Water Resources Applications
Reliable annual land use maps are essential for numerous agricultural and hydrological applications, including crop monitoring, irrigation management, drought assessment, and distributed hydrological modelling. In monsoon-driven regions, where vegetation conditions exhibit strong interannual variability, temporally explicit land use information is particularly important.
The enhanced classifications developed in this study provide annual LULC maps that better represent vegetation dynamics and moisture conditions. Such information can support water accounting, agricultural water productivity assessments, and hydrological modelling, where realistic representation of vegetation conditions is required. The framework may also be applicable to other tropical and subtropical regions characterized by limited ground observations and periodically updated land use products.
4.5. Limitations and Future Research
Several limitations should be acknowledged. First, the MODIS spatial resolution may result in mixed pixels, particularly in fragmented agricultural landscapes. Second, because the LDD land use maps were used during the refinement procedure, completely independent quantitative validation was not possible. Although qualitative validation using high-resolution imagery provides additional evidence of classification performance, some degree of dependency remains.
Third, the present study focused on five vegetation-related land use classes and did not consider urban areas and water bodies. Future studies may investigate the applicability of the proposed framework to a broader range of land cover categories. In addition, the integration of higher-resolution satellite observations, such as Sentinel-2 and Landsat, may further improve classification performance and provide more detailed representations of land surface dynamics.
5. Conclusions
This study investigated the capability of NDII and NDVI time series derived from MODIS imagery for land use and land cover (LULC) classification in the Chi River Basin, Thailand, and developed a temporal refinement framework to reconcile dynamic satellite observations with temporally static land use products provided by the Land Development Department (LDD).
The initial classifications obtained from unsupervised clustering exhibited substantial disagreement with the LDD maps, yielding average Overall Accuracy values of 57.35% and 51.27% for NDII and NDVI, respectively. By incorporating temporal signature information and re-evaluating inconsistent pixels, the proposed enhancement procedure substantially improved classification performance, increasing the average Overall Accuracy to 87.28% for NDII and 86.24% for NDVI.
Although both indices benefited from temporal refinement, NDII consistently outperformed NDVI throughout the study period. The superior performance of NDII highlights the importance of vegetation moisture information for discriminating vegetation-related land use classes in monsoon-driven agricultural landscapes, where vegetation dynamics are strongly influenced by seasonal variations in water availability.
Qualitative validation using high-resolution imagery further revealed that some discrepancies between satellite-derived classifications and the LDD maps correspond to actual land cover conditions. These findings suggest that apparent disagreement with periodically updated reference datasets does not necessarily represent classification errors, but may instead reflect genuine interannual variability captured by satellite observations. Consequently, the integration of dynamic satellite observations with temporally static land use products provides a practical approach for generating temporally explicit annual LULC maps while maintaining consistency with operational land use information.
Furthermore, the proposed framework is computationally simple, does not require extensive training data, and demonstrates how annual temporal signatures can be effectively integrated with temporally static reference datasets to improve vegetation-related land-use classification. Unlike conventional approaches based on single-date satellite observations, the proposed framework combines temporal similarity and spatial agreement to distinguish genuine land-cover dynamics from apparent inconsistencies caused by temporally static reference datasets. Because the methodology is based on annual temporal signatures rather than absolute vegetation index values, its applicability is not inherently restricted to tropical monsoon environments. The framework therefore has the potential to be applied to other climatic regions, provided that representative temporal signatures are established under local environmental conditions. The resulting annual LULC maps have potential applications in agricultural monitoring, water accounting, irrigation management, drought assessment, and distributed hydrological modelling, where realistic representation of vegetation dynamics is essential.
Future studies should investigate the use of higher-resolution satellite observations and independent ground reference data to further improve classification accuracy and to extend the applicability of the framework to a broader range of land cover categories.