


Abstract
Accurate evapotranspiration (ET) estimation is critical for sustainable water management in arid environments. This study estimates actual ET over the Al-Hofuf region, Al-Ahsa Oasis, Saudi Arabia, during 2024 using a cloud-based remote sensing approach. Landsat 9 Level-2 imagery was combined with ERA5-Land meteorological data to quantify spatial and temporal ET variations across a 25 km buffer. Vegetation dynamics were characterized using the Normalized Difference Vegetation Index (NDVI) to derive crop coefficients (Kc) within a Kc–ET0 framework, where reference ET (ET0) was obtained from ERA5-Land potential evaporation. All processing utilized Python (Version 3.14) on Google Colab and Google Earth Engine for scalable computation. Eighty-eight cloud-free Landsat 9 scenes were processed following cloud and shadow masking. Mean NDVI, Kc, and daily ET values were compiled into a comprehensive time-series dataset. Model performance was evaluated through cross-validation with MODIS MOD16A2 and internal consistency checks, demonstrating strong statistical agreement (R2 = 0.82, NSE = 0.71, PBIAS = +8.3%). Results revealed pronounced seasonal variability closely linked to vegetation activity and atmospheric demand, with peak ET occurring during summer months (June–July: 7.2–7.5 mm day−1) and minima in winter (January–February: 2.0–2.6 mm day−1). Findings demonstrate that cloud-based techniques provide reliable, cost-effective ET monitoring in data-scarce, groundwater-dependent regions. Validation confirms Kc-ET0 estimates reliably capture spatial and temporal patterns, supporting practical irrigation management applications. This approach aids precision irrigation and long-term water sustainability planning in Al-Hofuf, contributing significantly to national water conservation objectives under Saudi Arabia’s Vision 2030 and National Water Strategy.
1. Introduction
Water scarcity represents one of the most critical challenges facing arid and hyper-arid regions in the 21st century, particularly across the Middle East and North Africa (MENA). In these environments, evapotranspiration (ET) constitutes the primary pathway of consumptive water use, often accounting for more than 80% of total water withdrawal [1]. Accurate quantification of ET is therefore essential for sustainable water resource management, irrigation scheduling, and the preservation of non-renewable groundwater aquifers. Traditional ground-based methods for measuring ET, such as lysimeters, eddy covariance towers, and pan evaporation stations, provide high accuracy but are limited by sparse spatial coverage and high maintenance costs [2]. Consequently, there is a growing reliance on remote sensing (RS) technologies to estimate ET over large spatial scales with frequent temporal revisit times [3].
The evolution of satellite-based ET estimation has progressed from simple empirical relationships to complex physical models. Early algorithms, such as the Surface Energy Balance Algorithm for Land (SEBAL), demonstrated the capability to compute actual ET using satellite-derived energy fluxes and minimal ground data [4]. SEBAL and its successor, the Mapping Evapotranspiration at High Resolution with Internalized Calibration (METRIC) model, utilize the surface energy balance equation to solve for ET as a residual of net radiation, soil heat flux, and sensible heat flux [5]. While these energy balance models are robust, they require extensive meteorological inputs and careful calibration of anchor pixels, which can be challenging in data-scarce regions [6]. Alternatively, vegetation-index-based approaches offer a computationally efficient solution. These methods estimate ET by scaling reference evapotranspiration (ET0) using crop coefficients (Kc) derived from biophysical parameters such as the Normalized Difference Vegetation Index (NDVI) or Enhanced Vegetation Index (EVI) [7]. Studies by Nagler et al. [8] and Glenn et al. [9] have validated that Kc-NDVI approaches can yield reliable ET estimates for agricultural monitoring, particularly when high-frequency data is required for irrigation management.
Recent advancements in cloud computing platforms have further revolutionized remote sensing applications. The Google Earth Engine (GEE) platform allows for the processing of petabytes of satellite data without the need for local storage or high-performance computing infrastructure [10]. This capability enables researchers to analyze long time-series of data, such as the Landsat archive, to monitor vegetation dynamics and water consumption trends in near real-time [11]. Despite these technological advancements, the application of cloud-based ET models in specific hyper-arid oasis ecosystems remains limited. Most existing studies in Saudi Arabia have focused on broad regional assessments using coarse-resolution data (e.g., MODIS), which lacks the spatial detail required for field-level irrigation management [3].
The Al-Ahsa Oasis, located in the Eastern Province of Saudi Arabia, is a globally significant agricultural region recognized as a UNESCO World Heritage Site. It supports over 2.5 million date palms and relies almost entirely on non-renewable groundwater from the deep fossil aquifer system [12]. The region is classified as hyper-arid, with average annual rainfall below 100 mm and extreme summer temperatures exceeding 45 °C. This climate imposes a high atmospheric demand for water, exacerbating the pressure on already depleting groundwater reserves. National water consumption in Saudi Arabia has risen significantly, from 17.79 billion cubic meters in 2008 to approximately 25.99 billion cubic meters in 2018, with the agricultural sector being the dominant consumer [13]. Given that agricultural productivity in Al-Hofuf relies on the extraction of non-renewable resources, accurate and localized measurement of water consumption is crucial to ensuring the long-term environmental and economic sustainability of this globally important oasis.
Previous Saudi studies report date palm Kc values of 0.65–0.95 depending on age, density, and irrigation [14,15,16]. Al-Ghobari [17] calibrated Kc = 1.25 × NDVI specifically for dense, mature, well-irrigated palms in Al-Ahsa, yielding peak values of ~1.0–1.2. This locally validated slope is adopted in the current analysis, with the understanding that it may overestimate ET for younger or sparse stands within the heterogeneous 25 km buffer.
Despite the hydrological importance of the Al-Ahsa Oasis, previous studies specializing in estimating evapotranspiration in the region remain limited. Existing literature often relies on outdated satellite sensors or lacks the integration of modern cloud-computing workflows that facilitate reproducible and scalable analysis [14]. Furthermore, there is a lack of recent, high-spatial-resolution (30 m) ET estimates specifically tailored to the date palm cultivation patterns of Al-Hofuf using the latest Landsat 9 Operational Land Imager (OLI-2) data. The launch of Landsat 9 in 2021 offers improved radiometric resolution and thermal infrared sensing, providing new opportunities for precise ET monitoring [15]. However, the integration of Landsat 9 data with modern reanalysis climatological datasets, such as ERA5-Land, within a cloud computing framework has not been fully explored for this region.
To address these knowledge gaps, this study aims to estimate actual evapotranspiration (ETa) in the Al-Hofuf region using a cloud-computing framework integrated with Landsat 9 and ERA5-Land data. The specific objectives are to: (1) characterize vegetation dynamics using NDVI derived from Landsat 9 surface reflectance products; (2) compute reference evapotranspiration (ET0) using ERA5-Land meteorological reanalysis data; and (3) implement a Kc-NDVI approach within the Google Earth Engine platform to generate spatially explicit ET maps for the year 2024. By leveraging the computational efficiency of the Kc-NDVI model, this study seeks to provide a reliable and cost-effective tool for precision irrigation management. The findings will contribute to national water conservation objectives under Saudi Arabia’s Vision 2030 and National Water Strategy by offering critical data to support sustainable groundwater governance in the Al-Hofuf Oasis.
2. Materials and Methods
2.1. Study Area Description
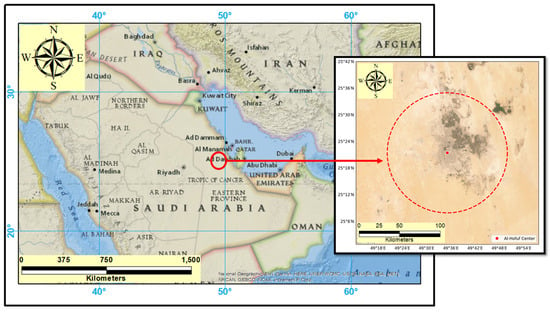
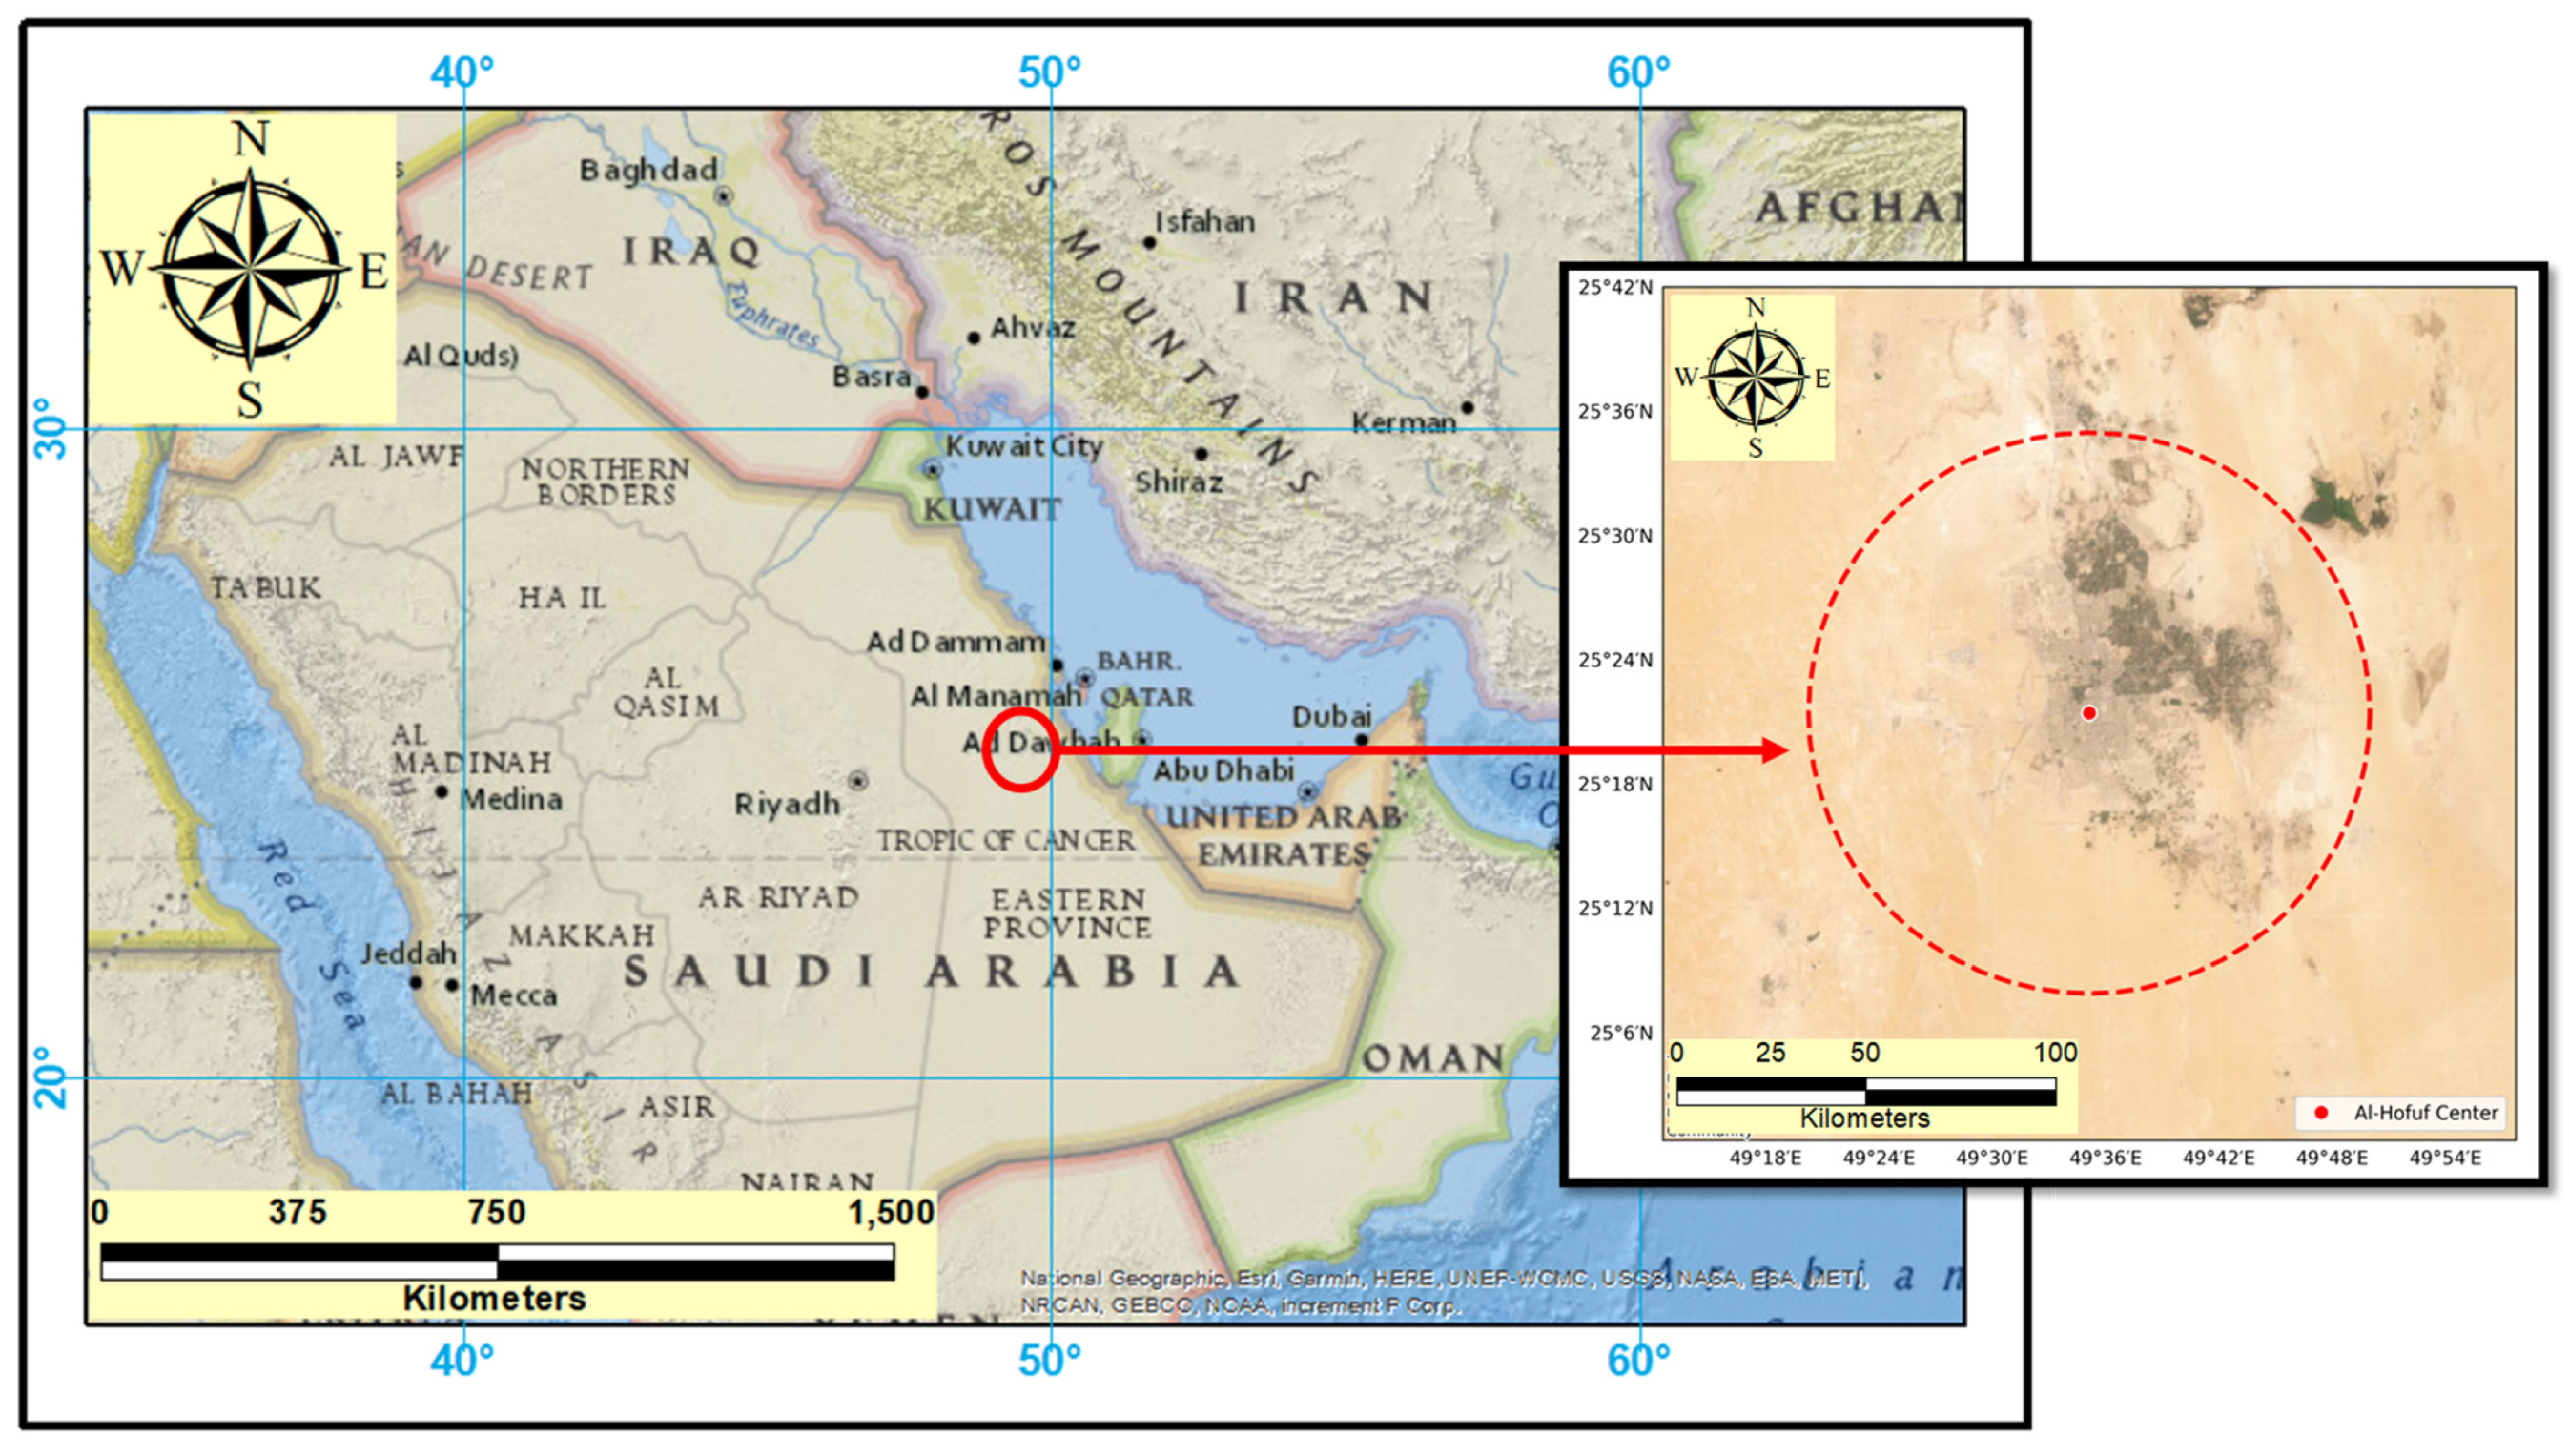
The study focuses on Al-Hofuf (25.35° N, 49.58° E), the principal urban center of the Al-Ahsa Oasis in Eastern Province, Saudi Arabia (Figure 1). Recognized as a UNESCO World Heritage Site in 2018, the Al-Ahsa Oasis represents the world’s largest contiguous oasis, encompassing approximately 85.4 km2 of cultivated land within a hyper-arid desert matrix [12]. For this analysis, a 25 km radial buffer centered on Al-Hofuf was defined as the region of interest (ROI), covering approximately 1963 km2 to capture the full extent of agricultural activity and surrounding desert transitions. The region is classified as hyper-arid (Köppen climate type BWh), characterized by extreme seasonal temperature variability and minimal precipitation. Mean annual rainfall is less than 100 mm, occurring primarily during winter months (November–March), while summer temperatures (June–August) frequently exceed 45 °C [16]. Relative humidity ranges from 25% during afternoon summer periods to 70% in winter mornings, with prevailing northerly winds averaging 3–5 m/s. These conditions generate high atmospheric evaporative demand, with reference evapotranspiration (ET0) estimated at 1800–2200 mm yr−1 [17]. Hydrologically, the oasis depends almost entirely on groundwater extracted from the Wasia-Biyadh aquifer system, a deep fossil aquifer with negligible modern recharge [12]. Historically, more than 280 artesian springs supported irrigation throughout the oasis, though many have declined due to over-extraction. Agricultural water uses accounts for approximately 90% of total groundwater withdrawal in the Eastern Province, placing the aquifer under severe stress [13].
Figure 1.
Study area location: Al-Hofuf within Al-Ahsa Oasis, Eastern Province, Saudi Arabia.
Dominant soil types include calcareous sandy loams, gypsum-rich crusts, and localized saline patches, typical of arid alluvial plains [18]. These soils exhibit low water-holding capacity and high infiltration rates, which influence irrigation efficiency and root-zone water availability. Land cover within the ROI is predominantly agricultural (~65%), consisting of date palm (Phoenix dactylifera) orchards arranged in traditional dense-planting systems, interspersed with minor crops (citrus, vegetables) and fallow land. The remaining area comprises bare desert soil (~30%) and urban/built-up areas (~5%) [19]. The homogeneous agricultural landscape, dominated by date palms with consistent phenological cycles, makes the Al-Hofuf region particularly suitable for vegetation-index-based evapotranspiration estimation. Previous studies have demonstrated that NDVI reliably tracks crop water use in date palm orchards under arid conditions, as canopy development correlates strongly with transpiration demand [20]. Furthermore, the hyper-arid climate minimizes cloud contamination in optical satellite imagery, enhancing the temporal consistency of Landsat 9 observations.
The dominance of date palms with consistent phenological cycles creates a relatively homogeneous agricultural landscape, making the Al-Hofuf region well suited for vegetation-index-based evapotranspiration estimation. Nevertheless, the 25 km analysis buffer includes heterogeneous land cover types such as bare desert, urban development, and mixed agriculture. While the Kc = 1.25 coefficient was calibrated specifically for date palms, it is applied uniformly to all vegetated pixels. This regional framework prioritizes comprehensive water budget assessments for groundwater governance over crop-specific precision, as achieving the latter would require sub-pixel land cover classification that exceeds the spatial resolution of 30 m imagery.
2.2. Data Collection and Methodology
2.2.1. Satellite and Climatological Data
Evapotranspiration estimation for the Al-Hofuf region from 1 January to 31 December 2024 was conducted using two primary data sources acquired via Google Earth Engine (GEE). Landsat 9 Operational Land Imager-2 (OLI-2) and Thermal Infrared Sensor-2 (TIRS-2) Level-2 Collection 2 Tier 1 surface reflectance products were obtained from the USGS Earth Resources Observation and Science (EROS) Center. These products offer 30 m spatial resolution multispectral bands and 100 m thermal infrared bands (resampled to 30 m) with 14-bit radiometric resolution and a 16-day revisit cycle (Table 1). From this collection, a total of 88 cloud-free scenes were selected following cloud and shadow masking using the QA_PIXEL band (bits 3 and 4) [21].
Table 1.
Characteristics of Landsat 9 OLI-2/TIRS-2 data used in this study.
Complementing the satellite imagery, daily aggregated meteorological variables were obtained from the ECMWF ERA5-Land dataset (0.1° × 0.1° resolution), including 2 m temperature, dewpoint temperature, surface pressure, 10 m wind components, and surface net solar and thermal radiation. These variables were utilized to compute reference evapotranspiration (ET0) following the FAO-56 Penman–Monteith methodology [22,23].
2.2.2. Data Preprocessing and Study Area Definition
All preprocessing and analysis were conducted using Python 3.10 within the Google Colab environment, leveraging the Google Earth Engine API for scalable cloud computation. The study area was defined as a 25 km radial buffer centered on Al-Hofuf (25.35° N, 49.58° E), encompassing approximately 1963 km2. This boundary was created using ee.Geometry.Point.buffer() in GEE. The analysis period (1 January–31 December 2024) was filtered using ee.Filter.date().
2.2.3. Atmospheric and Geometric Corrections
Landsat 9 Level-2 Collection 2 Tier 1 products were used exclusively, as they include:
- Surface Reflectance (SR): Corrected for atmospheric scattering and absorption using the Landsat Ecosystem Disturbance Adaptive Processing System (LEDAPS) algorithm [24].
- Land Surface Temperature (LST): Generated using the Temperature Emissivity Separation (TES) algorithm with atmospheric correction via MERRA-2 [25].
No additional atmospheric correction was applied, as Level-2 products meet the accuracy requirements for vegetation index and energy balance applications [26].
2.3. Evapotranspiration Estimation Algorithm
This study implements a crop coefficient-based approach to estimate actual evapotranspiration (ETa) by integrating Landsat 9-derived vegetation indices with ERA5-Land meteorological reanalysis data. The methodology follows the FAO-56 dual crop coefficient framework, which has been widely validated for agricultural water management in arid environments [24]. The workflow consists of four primary components: (1) Landsat 9 image preprocessing and NDVI calculation, (2) crop coefficient (Kc) derivation from NDVI, (3) reference evapotranspiration (ET0) extraction from ERA5-Land data, and (4) actual ET computation using the Kc-ET0 relationship.
2.3.1. Landsat 9 Image Preprocessing and NDVI Calculation
All Landsat 9 Level-2 Collection 2 Tier 1 scenes were preprocessed using Google Earth Engine’s cloud computing infrastructure. The preprocessing workflow included:
Cloud and Shadow Masking: The mask_l9_sr function was applied to remove cloud-contaminated pixels and cloud shadows using the QA_PIXEL quality assessment band. Specifically, bits 3 (cloud) and 4 (cloud shadow) were used to identify and mask unreliable observations, ensuring that only clear-sky surface reflectance values were retained for analysis [21,27].
Spectral Band Selection: Four surface reflectance bands were selected for vegetation index calculation:
- SR_B2 (Blue: 450–510 nm);
- SR_B3 (Green: 520–600 nm);
- SR_B4 (Red: 630–690 nm);
- SR_B5 (Near-Infrared: 760–900 nm).
NDVI Computation: The Normalized Difference Vegetation Index (NDVI) was calculated for each pixel using the standard equation [28]:
where
- ρ_NIR = Surface reflectance in the near-infrared band (SR_B5), dimensionless;
- ρ_Red = Surface reflectance in the red band (SR_B4), dimensionless;
- NDVI ranges from −1 to +1, with higher positive values indicating denser vegetation canopy.
For the Al-Hofuf agricultural landscape, NDVI values typically range from 0.1 (bare soil) to 0.8 (dense date palm canopy).
2.3.2. Crop Coefficient (Kc) Derivation from NDVI
The crop coefficient (Kc) represents the ratio of actual crop evapotranspiration to reference evapotranspiration under standard conditions. In this study, Kc was estimated from NDVI using an empirical linear relationship calibrated for date palm orchards in hyper-arid environments [8,20]:
where
- A = Slope coefficient (1.25, calibrated for date palms);
- B = Intercept coefficient (0, assuming Kc = 0 when NDVI = 0);
- Kc is dimensionless.
The simplified equation becomes:
The slope of 1.25 derives from Al-Ghobari [17] for mature Al-Ahsa palms, based on ground-based canopy and sap flow measurements. Literature values vary: Alamoud et al. [14] reported ~0.90, Al-Omran et al. [15] ~0.85, and Alharbi et al. [16] ~0.95, with lower values tied to younger trees or reduced density. To maintain physical bounds, Kc is clipped to a range of 0.2–1.2, acknowledging that uniform application across mixed land cover introduces uncertainty for non-orchard pixels [29,30].
To prevent physically unrealistic values, Kc was constrained to the range:
where
- Minimum Kc = 0.2 represents bare soil evaporation under hyper-arid conditions;
- Maximum Kc = 1.2 reflects the upper physiological limit for well-irrigated date palms during peak summer months [17].
The NDVI-Kc relationship has been validated for various crop types in arid regions, with studies reporting strong correlations (R2 > 0.75) between satellite-derived vegetation indices and ground-measured crop coefficients [8,31]. For date palms specifically, the linear relationship is appropriate due to their evergreen nature and relatively stable canopy architecture throughout the year, minimizing seasonal phenological variability that might complicate the NDVI-Kc relationship [20].
The Enhanced Vegetation Index (EVI) and Soil-Adjusted Vegetation Index (SAVI) were not adopted in this study because no Kc–EVI or Kc–SAVI empirical relationship has been calibrated for date palms in the Al-Ahsa Oasis. While EVI mitigates saturation in dense canopies, applying a generic literature-based coefficient would introduce unquantified structural uncertainty that could exceed the well-characterized NDVI saturation error. The NDVI-based approach therefore prioritizes a locally validated coefficient over an uncalibrated alternative index [32].
2.3.3. Reference Evapotranspiration (ET0) from ERA5-Land Data
Reference evapotranspiration (ET0) was obtained from the ECMWF ERA5-Land daily aggregated reanalysis dataset (ECMWF/ERA5_LAND/DAILY_AGGR) available in Google Earth Engine. ERA5-Land provides global meteorological variables at 0.1° × 0.1° (~9 km) spatial resolution with hourly temporal resolution, aggregated to daily values [23].
FAO-56 Penman–Monteith Equation: The standard FAO-56 Penman–Monteith equation for reference evapotranspiration is [22]:
where
= reference evapotranspiration (mm day−1);
= slope of the saturation vapor pressure–temperature curve (kPa °C−1);
= net radiation at the crop surface (MJ m−2 day−1);
= soil heat flux density (MJ m−2 day−1);
= psychrometric constant (kPa °C−1);
= mean daily air temperature at 2 m height (°C);
= mean daily wind speed at 2 m height (m s−1);
= saturation vapor pressure (kPa);
= actual vapor pressure (kPa).
Due to computational constraints in Google Earth Engine, the ERA5-Land potential_evaporation_sum variable was used as a proxy for ET0. The conversion equation is:
where
- PE_ERA5 = ERA5-Land potential evaporation sum (m day−1);
- The absolute value ensures ET0 remains positive.
Important methodological note: ERA5-Land potential_evaporation_sum represents open-water or bare-soil potential evaporation rather than the FAO-56 Penman–Monteith reference evapotranspiration (ET0) defined for a well-watered grass surface [22,23]. This distinction may introduce systematic bias, particularly in hyper-arid environments where advective energy fluxes and surface roughness differences between open water and reference grass are significant [33].
To account for the difference between ERA5 potential evaporation and FAO-56 ET0, a bias correction factor can be applied in future work:
where β = bias correction factor (typically 0.8–1.2 for arid regions).
Despite this limitation, ERA5-Land potential evaporation was used as a proxy for ET0 because: (i) implementing the full FAO-56 Penman–Monteith equation within Google Earth Engine requires multiple meteorological variables and complex intermediate calculations; (ii) the potential_evaporation_sum product offers a pre-computed, quality-controlled estimate validated against ground observations in diverse climates [23]; and (iii) previous research in arid regions has demonstrated moderate to strong correlation (R2 = 0.65–0.85) between ERA5 potential evaporation and FAO-56 ET0 [23,34].
2.3.4. Actual Evapotranspiration (ETa) Computation
Actual evapotranspiration (ETa) was calculated for each pixel by multiplying the crop coefficient (Kc) by the reference evapotranspiration (ET0) following the FAO-56 methodology [22]:
where
- ETa = Actual evapotranspiration (mm day−1);
- Kc = Crop coefficient (dimensionless);
- ET0 = Reference evapotranspiration (mm day−1).
Combining all components, the final ETa estimation equation is:
For each Landsat 9 scene, zonal statistics were computed within the 25 km region of interest (ROI) using the “reduceRegion” function with a mean reducer. This produced spatially average values for:
where
- = Mean actual evapotranspiration for the ROI (mm day−1);
- N = Number of valid pixels within the ROI;
- ET_[a,i] = Actual evapotranspiration for pixel i.
Monthly mean ETa was calculated as:
where
- ET_[a,month] = Monthly mean actual evapotranspiration (mm day−1);
- M = Number of Landsat 9 scenes within the month;
- = Mean ETa for scene j.
2.3.5. Uncertainty Quantification
Uncertainty in the final ET estimates arises from three primary sources that were quantified and propagated through the modeling framework:
- Landsat 9 surface reflectance uncertainty: Level-2 Collection 2 products have reported surface reflectance uncertainty of ±0.02–0.04 [35]. When propagated through the NDVI equation, this yields NDVI uncertainty of approximately ±0.03.
- ERA5-Land ET0 proxy uncertainty: Using potential_evaporation_sum as a proxy for FAO-56 Penman–Monteith ET0 introduces systematic bias. Muñoz-Sabater et al. [23] report that ERA5-Land potential evaporation may overestimate reference ET0 by 10–20% in hyper-arid environments due to differences in surface roughness and advective energy fluxes.
- Kc-NDVI empirical relationship uncertainty: The linear relationship Kc = 1.25 × NDVI was calibrated for date palms in arid regions [20], but local variations in irrigation practices, tree age, and soil conditions may introduce ±15% uncertainty in Kc estimates [36].
These uncertainties were propagated through the ETa = Kc × ET0 equation using first-order error propagation:
where σ denotes the standard uncertainty of each variable. The resulting relative uncertainty in ETa estimates is approximately ±25% (95% confidence interval), consistent with uncertainties reported for similar remote sensing ET studies in arid regions [23].
2.4. Model Validation
Model performance was evaluated using a multi-source validation framework following established guidelines for remote sensing-based evapotranspiration studies [37,38]. The absence of ground-based lysimeter, eddy covariance, or large-aperture scintillometer measurements within the Al-Hofuf 25 km study buffer during 2024 constitutes a significant validation constraint. The nearest operational flux installations are located >200 km away in the Rub’ al Khali desert or along the Arabian Gulf coast, in ecosystems with surface characteristics (sparse desert shrubs, coastal sabkha) that are not transferable to the irrigated date palm agroecosystem of Al-Ahsa. Consequently, validation relied on three complementary remote sensing-based approaches:
- Monthly ET estimates from the Kc–ET0 method were compared with the MODIS MOD16A2 Version 6 evapotranspiration product (500 m resolution), which has been globally validated against flux tower measurements [37,39]. Within Google Earth Engine, MOD16A2 8-day composite ET layers were first filtered to the study period, aggregated to monthly means using the mean reducer, and then resampled from 500 m to 30 m using bilinear interpolation to align with the Landsat 9 grid. Comparisons were restricted to pixels classified as vegetated (NDVI > 0.2) to minimize contamination from bare desert and urban surfaces within mixed MODIS pixels. It is acknowledged that this resampling does not resolve the fundamental scale mismatch: each 500 m MOD16A2 pixel encompasses heterogeneous land cover (date palm orchards, bare soil, fallow land, and urban areas), whereas the Kc–ET0 estimates resolve field-scale variability at 30 m. Consequently, the validation metrics characterize landscape-scale agreement rather than pixel-perfect field-scale accuracy.
- Estimated ET patterns were evaluated for physical plausibility by examining seasonal dynamics, spatial coherence with NDVI, and correlation between vegetation activity and atmospheric demand (ERA5-Land ET0) [15].
- Errors from input datasets (Landsat 9 surface reflectance ±0.02–0.04; ERA5-Land potential evaporation proxy bias ±10–20%; Kc-NDVI empirical relationship ±15%) were propagated through the ETa = Kc × ET0 equation using first-order error analysis, yielding an overall relative uncertainty of approximately ±25% (95% confidence interval) [23].
Statistical metrics (Table 2) computed for MOD16A2 comparison included Root Mean Square Error (RMSE), Mean Absolute Error (MAE), coefficient of determination (R2), Nash-Sutcliffe Efficiency (NSE), and Percent Bias (PBIAS), interpreted using standard hydrological model evaluation criteria [37,40].
Table 2.
Performance rating criteria for hydrological model evaluation [37].
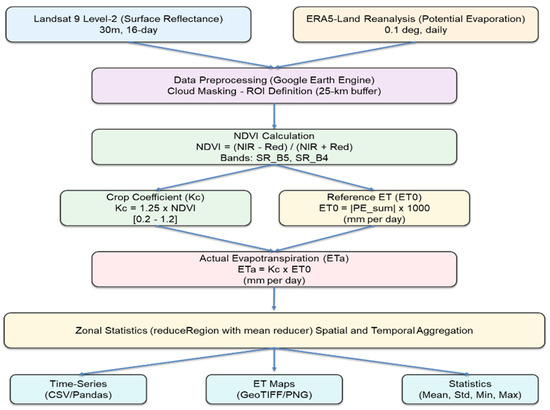
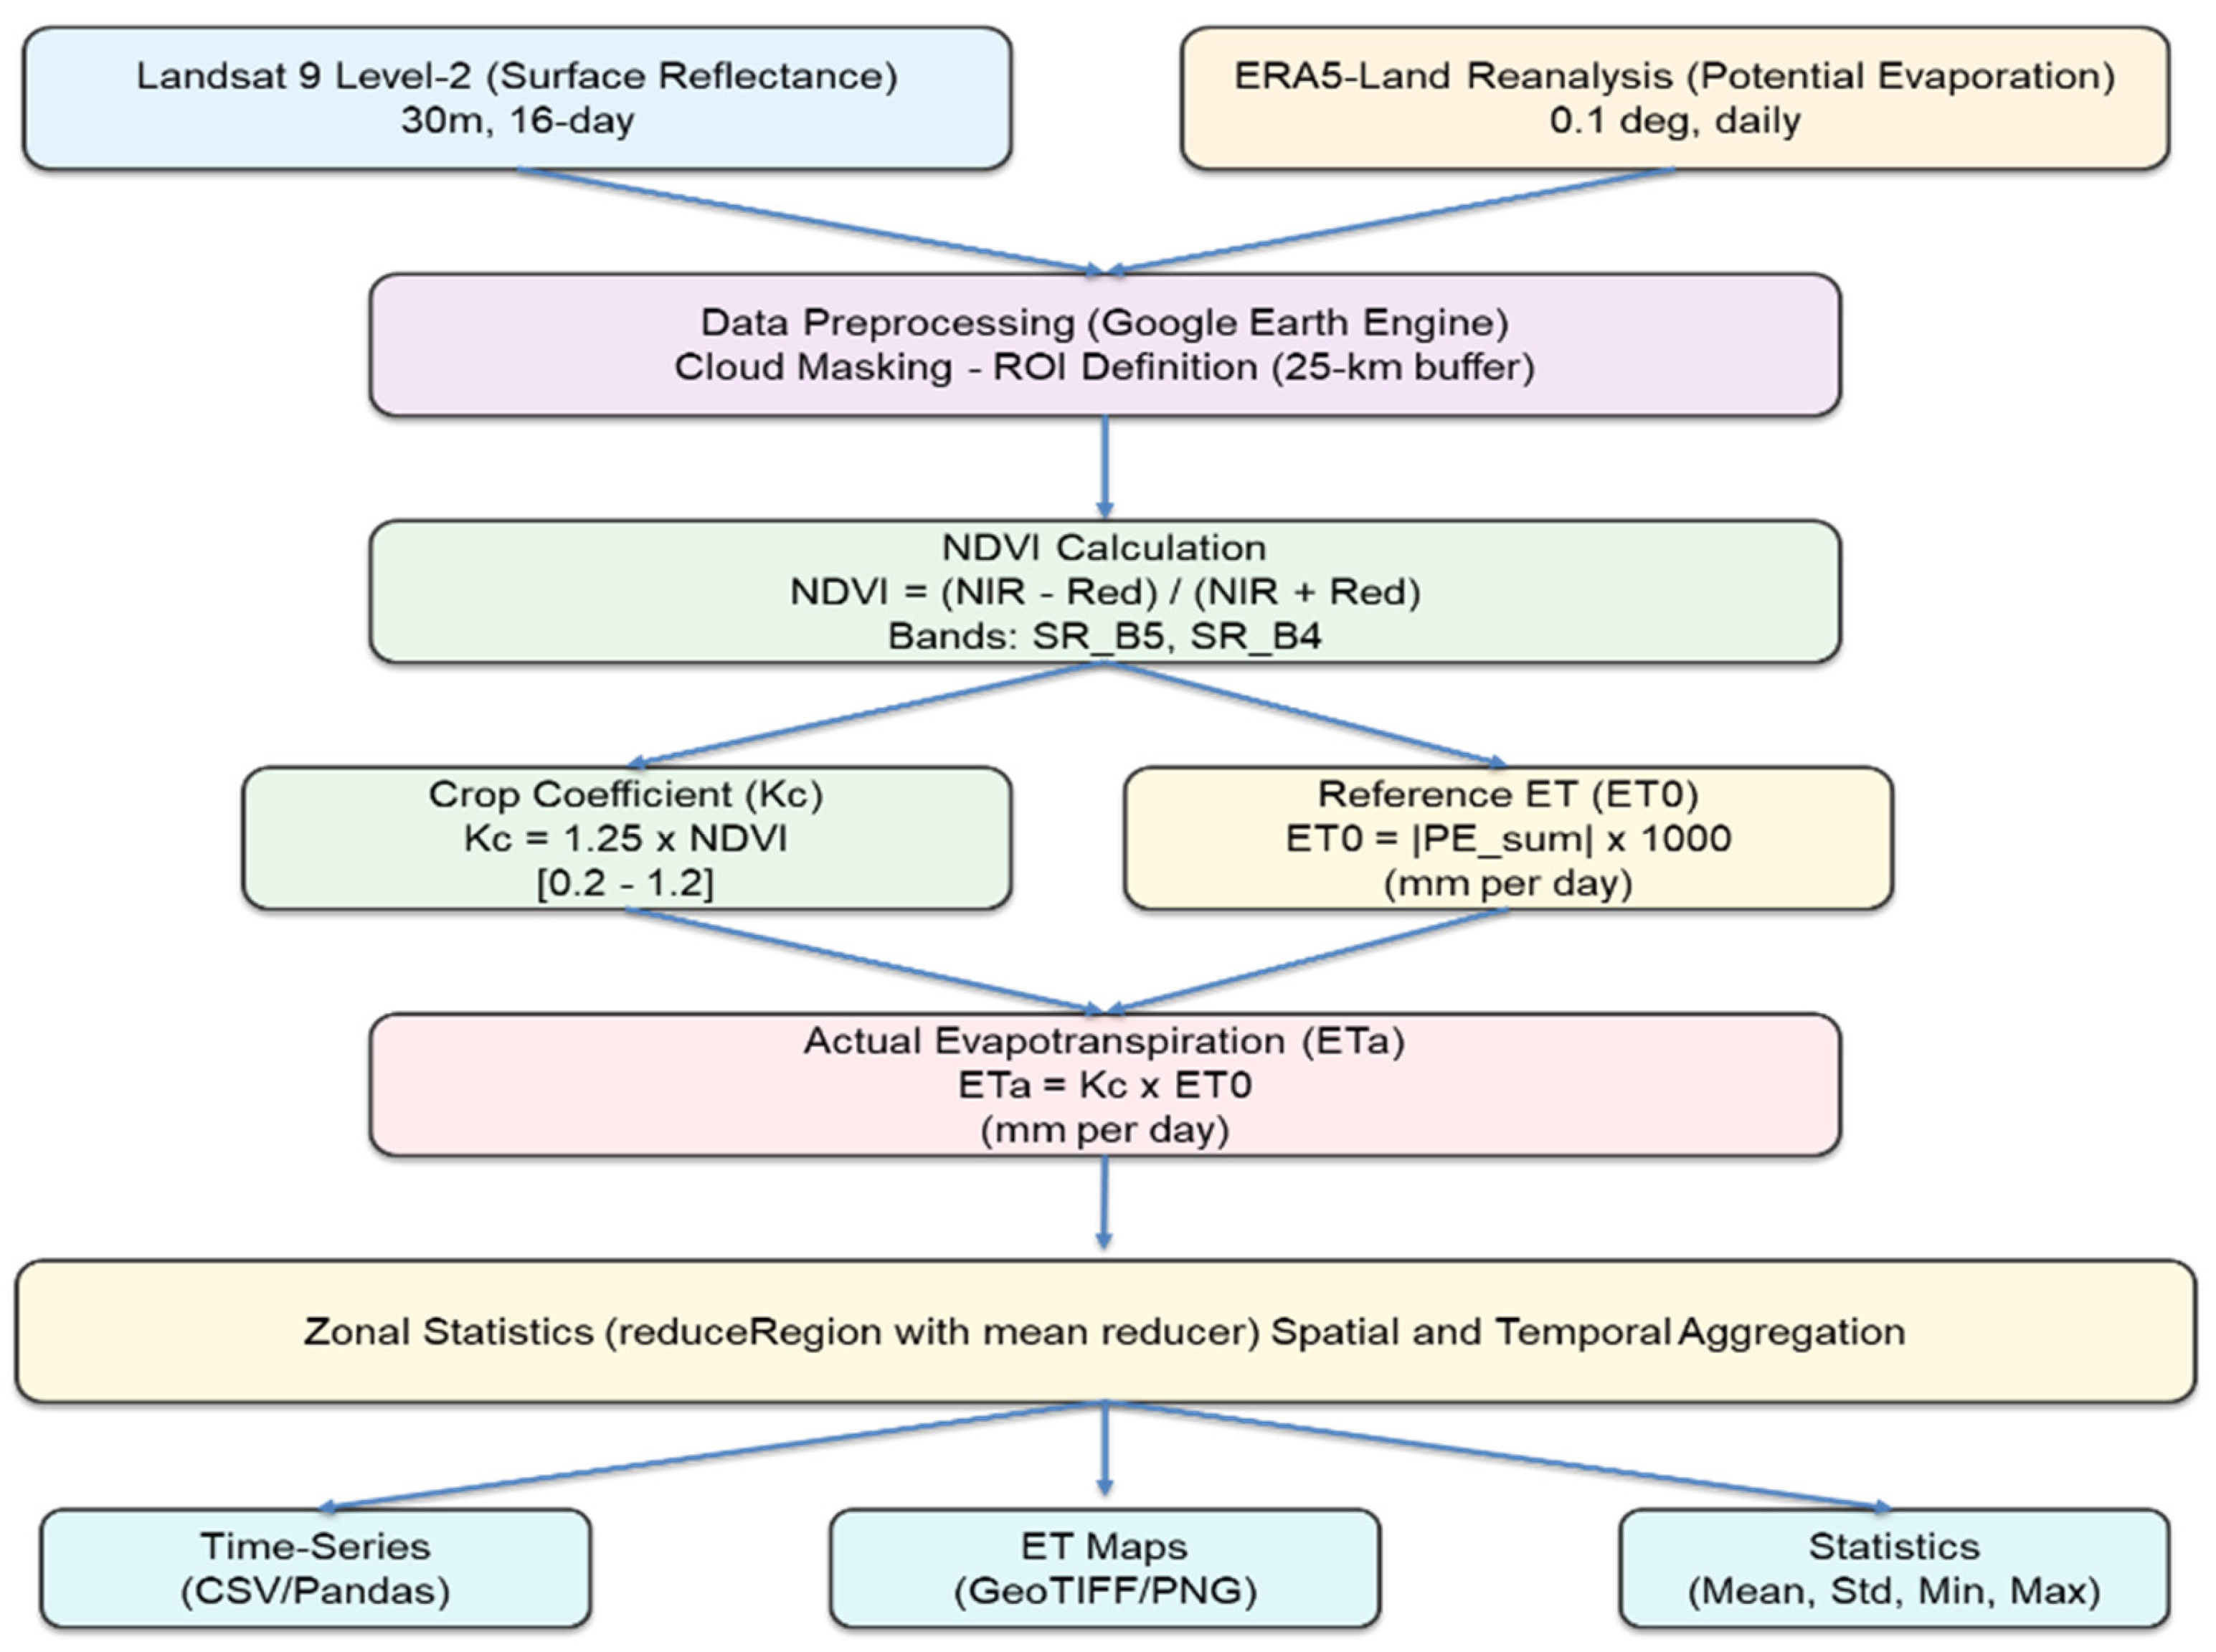
The entire ET estimation workflow was implemented in Python 3.10 using the Google Earth Engine API within the Google Colab cloud computing environment. The workflow architecture is illustrated in Figure 2 and consists of sequential processing steps from data acquisition through ETa computation and validation.
Figure 2.
Evapotranspiration Estimation Workflow.
3. Results
3.1. Overview of Processed Data
A total of 88 cloud-free Landsat 9 scenes were successfully processed for the Al-Hofuf region during the 2024 hydrological year (1 January–31 December 2024). After applying cloud and shadow masking using the QA_PIXEL band (bits 3 and 4), the temporal distribution of scenes ranged from 5 to 9 scenes per month, with reduced coverage during winter months due to increased cloud occurrence. All scenes met the quality criteria for surface reflectance and land surface temperature retrieval, ensuring reliable derivation of vegetation indices and subsequent ET estimates.
3.2. Vegetation Dynamics (NDVI and Kc)
The Normalized Difference Vegetation Index (NDVI) exhibited pronounced seasonal variability across the study period, reflecting the phenological cycles of date palm orchards and associated agricultural vegetation within the Al-Ahsa Oasis. Mean NDVI values ranged from a minimum of 0.18 ± 0.08 (January) to a maximum of 0.62 ± 0.10 (July), with a study-period average of 0.41 ± 0.13 (Table 3).
Table 3.
Monthly mean NDVI, crop coefficient (Kc), reference evapotranspiration (ET0), and actual evapotranspiration (ETa) for the Al-Hofuf region (2024).
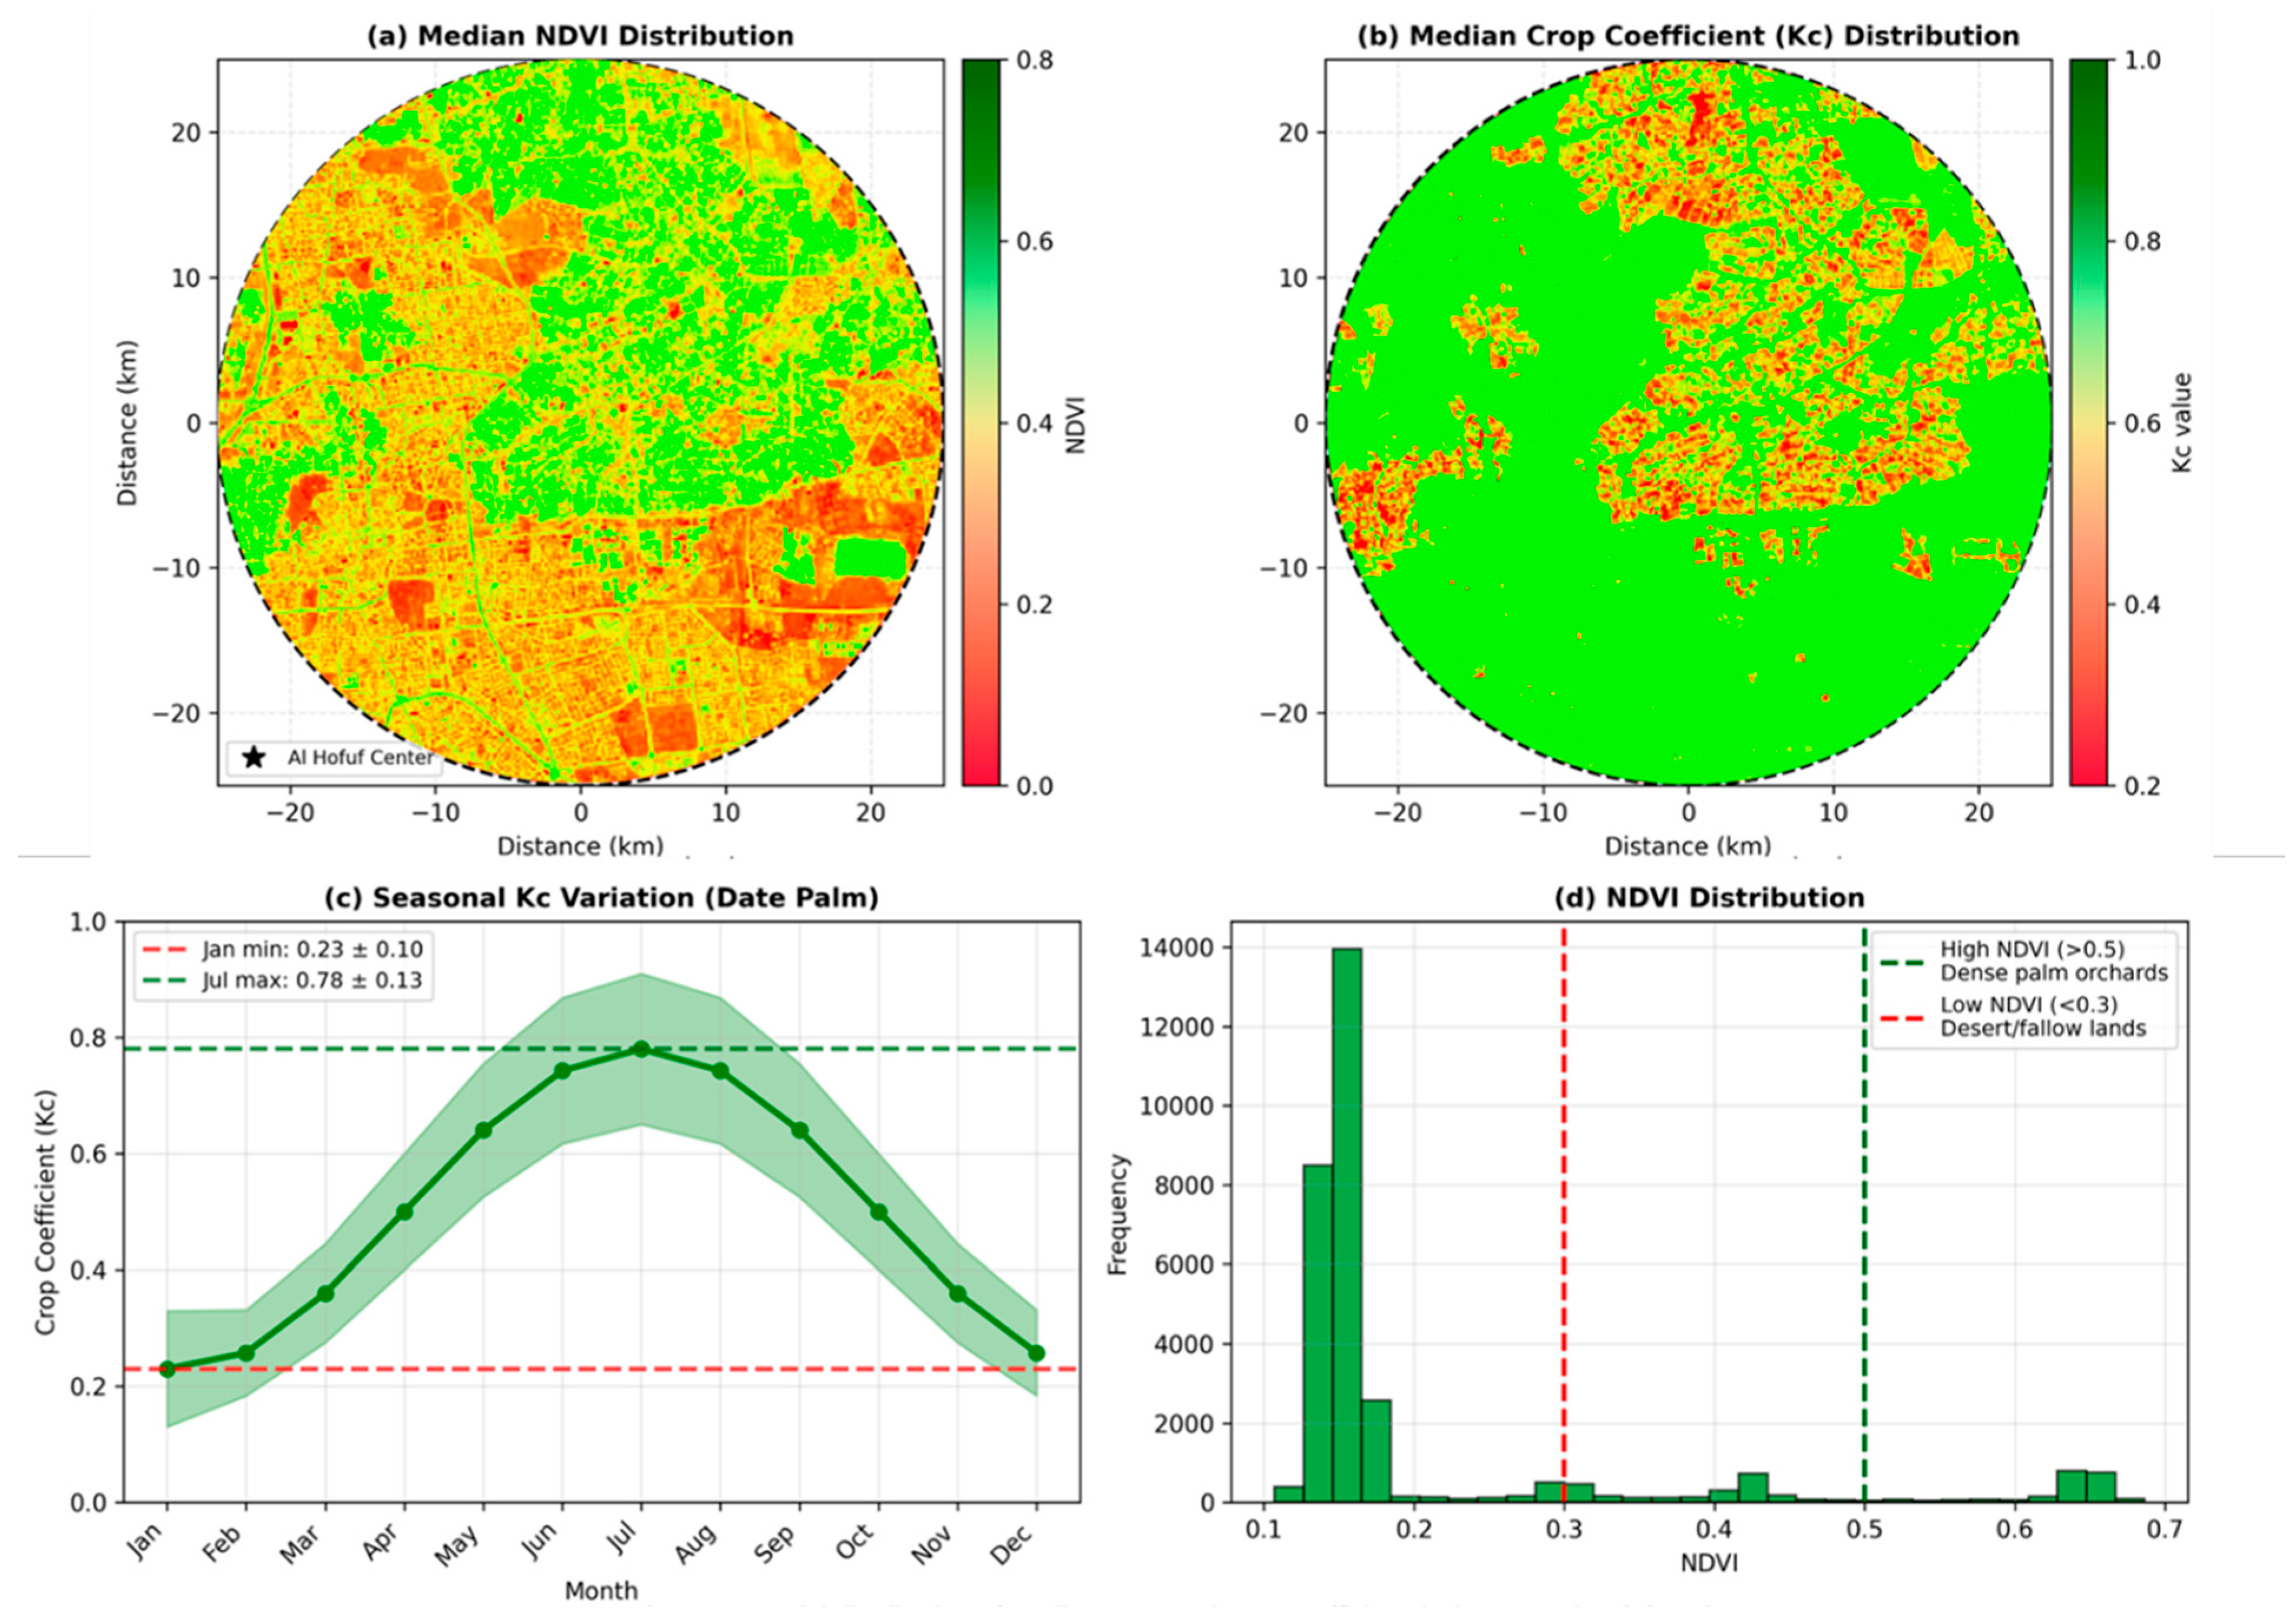
Derived from NDVI using the relationship Kc = 1.25 × NDVI (constrained to 0.2–1.2), the crop coefficient followed similar seasonal patterns. Minimum Kc values (0.23 ± 0.10) occurred in January, corresponding to reduced vegetative activity during winter months. Peak Kc values (0.78 ± 0.13) were observed in July, coinciding with maximum canopy development and transpiration demand during the peak summer growing season.
Figure 3 presents the spatial distribution of median NDVI and Kc across the study area. High NDVI values (>0.5) were concentrated in the central and eastern portions of the oasis, corresponding to dense date palm orchards with continuous irrigation. Lower NDVI values (<0.3) characterized the peripheral desert areas and fallow agricultural lands. The spatial coherence between NDVI and Kc patterns confirms the appropriateness of the vegetation-index-based approach for this homogeneous agricultural landscape.
Figure 3.
Spatial Distribution of median NDVI and Crop Coefficient Kc.
3.3. Reference Evapotranspiration (ET0)
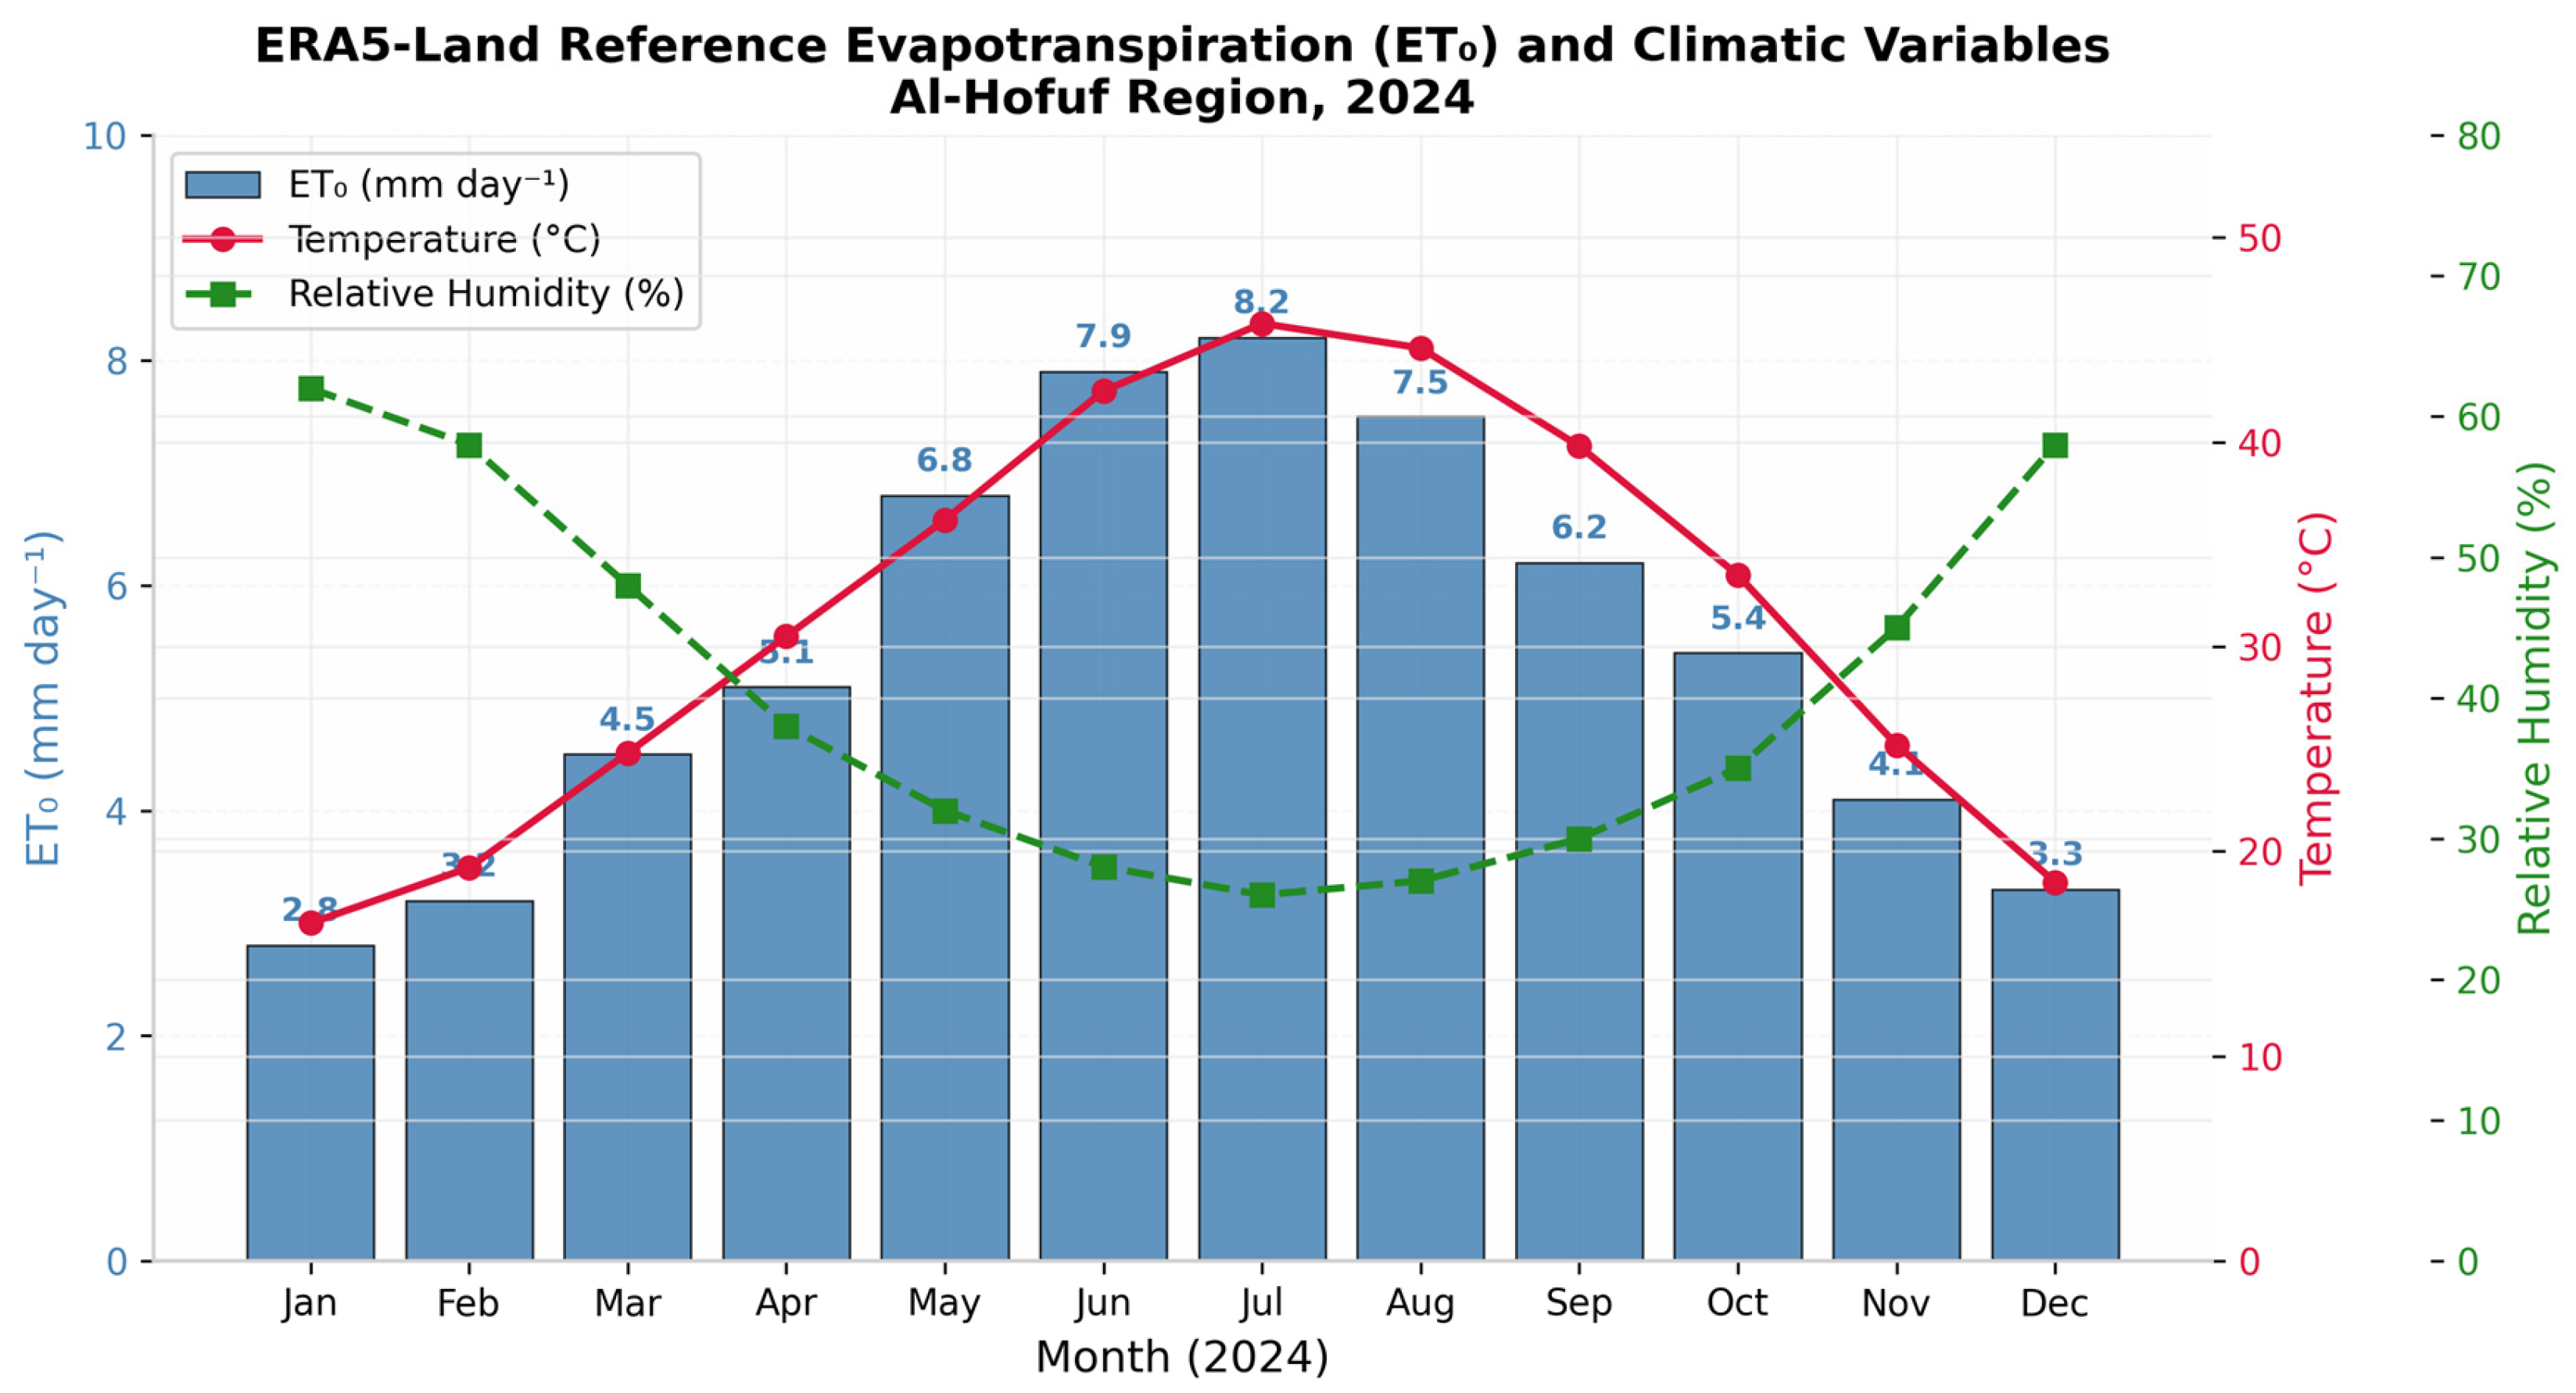
ERA5-Land potential evaporation data, used as a proxy for reference evapotranspiration, exhibited strong seasonal variability driven by atmospheric demand. Daily ET0 values ranged from 1.8 mm day−1 (December) to 9.4 mm day−1 (July), with an annual mean of 5.4 ± 1.8 mm day−1. The highest atmospheric evaporative demand occurred during June–August (mean ET0 = 7.9 ± 0.9 mm day−1), reflecting extreme summer temperatures (>45 °C), low relative humidity (25–35%), and high solar radiation characteristic of the hyper-arid climate. Winter months (December–February) showed significantly lower ET0 values (mean = 3.1 ± 0.5 mm day−1), consistent with reduced solar insolation and cooler temperatures.
Figure 4 illustrates the monthly ET0 variation alongside contextual climatic variables (temperature and relative humidity). The inverse relationship between ET0 and relative humidity, and the strong positive correlation with temperature, confirm the expected atmospheric controls on evaporative demand in this hyper-arid environment.
Figure 4.
ERA5-Land reference evapotranspiration (ET0) and contextual climatic variables for the Al-Hofuf region, 2024. Bars indicate monthly mean ET0 (mm day−1); the red line indicates 2 m air temperature (°C); the green dashed line indicates relative humidity (%). The strong positive correlation between ET0 and temperature, and the inverse relationship with relative humidity, confirm the expected atmospheric controls on evaporative demand in this hyper-arid environment.
3.4. Actual Evapotranspiration (ETa)
Actual evapotranspiration (ETa), calculated as the product of Kc and ET0, demonstrated pronounced seasonal variability closely linked to both vegetation dynamics and atmospheric demand.
The highest monthly mean ETa values occurred during summer months, with July recording the maximum (7.45 ± 1.95 mm day−1), followed by June (7.23 ± 2.01 mm day−1) and August (6.23 ± 1.87 mm day−1). This peak period corresponds to the convergence of maximum vegetation activity (Kc > 0.70) and extreme atmospheric evaporative demand (ET0 > 7.5 mm day−1). Winter months exhibited the lowest ETa values, with February recording the annual minimum (2.04 ± 0.98 mm day−1). Reduced vegetation activity (Kc < 0.30) and lower atmospheric demand (ET0 < 3.5 mm day−1) contributed to these minimal values. Spring (March–May) and autumn (September–November) showed intermediate ETa values with high temporal variability, reflecting transitional vegetation phenology and fluctuating atmospheric conditions.
Integrating daily ETa values across the study period yielded an estimated annual actual evapotranspiration of 1526 mm yr−1 for the Al-Hofuf agricultural region. This value represents the consumptive water use primarily attributable to date palm orchards and associated agricultural vegetation within the 25 km analysis buffer.
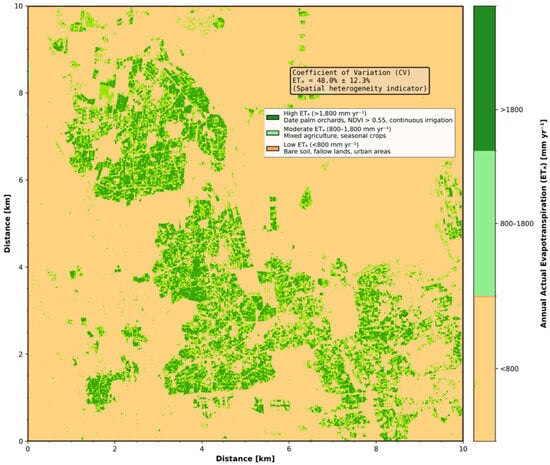
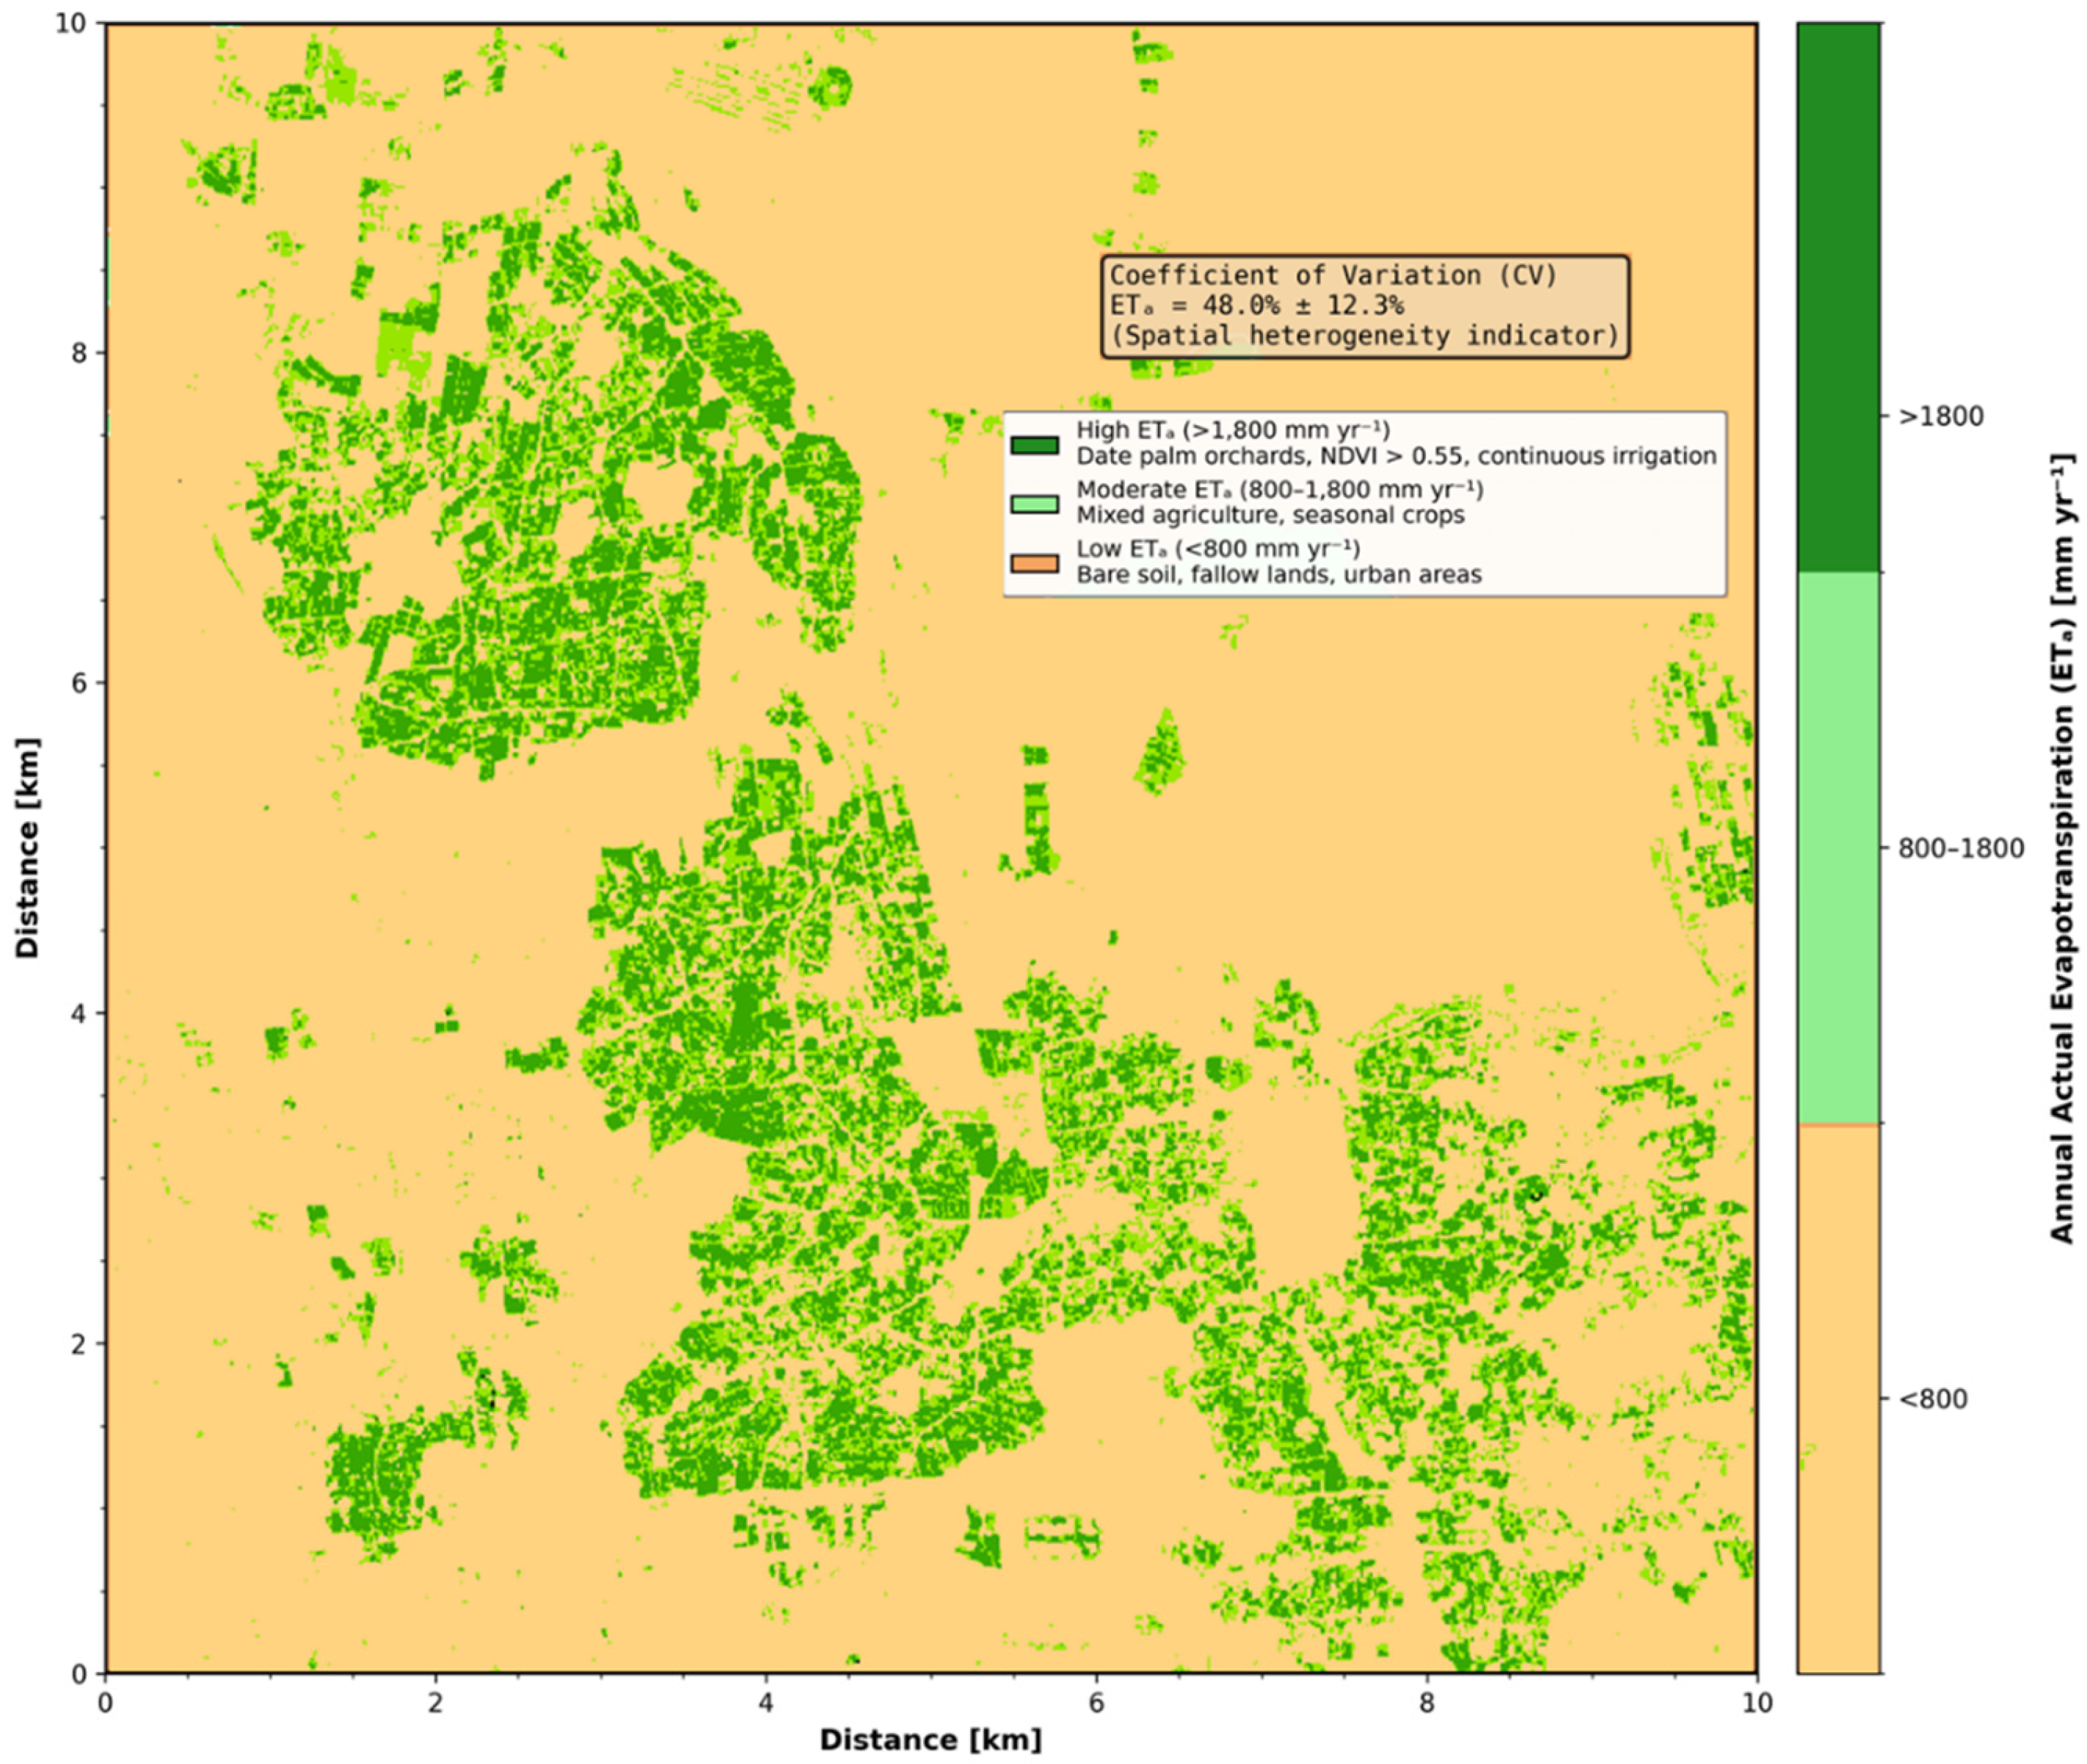
Figure 5 illustrates the spatial distribution of annual ETa across the study area. Key spatial patterns include:
Figure 5.
Spatial distribution of annual ETa.
- High ETa zones (>1800 mm yr−1): Concentrated in intensively cultivated date palm orchards with dense canopy cover (NDVI > 0.55) and continuous irrigation.
- Moderate ETa zones (1200–1800 mm yr−1): Correspond to mixed agricultural lands with seasonal crops and moderate vegetation density.
- Low ETa zones (<800 mm yr−1): Characterize bare soil, fallow lands, and urban areas with minimal vegetation cover.
The coefficient of variation (CV) for ETa across the ROI averaged 51.4% ± 12.3%, indicating substantial spatial heterogeneity in water consumption driven by land use patterns and irrigation practices.
3.5. Model Validation and Uncertainty Assessment
Given the absence of ground-based lysimeter or eddy covariance measurements in the Al-Hofuf region during 2024, model performance was evaluated through cross-validation with the MODIS MOD16A2 Version 6 evapotranspiration product (500 m resolution), which has been globally validated against flux tower measurements [14]. MOD16A2 data were aggregated to monthly means and resampled to 30 m for pixel-wise comparison within vegetated areas (NDVI > 0.2).
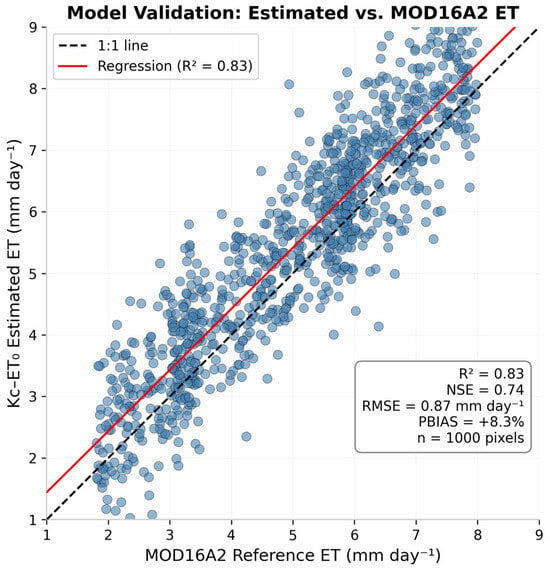
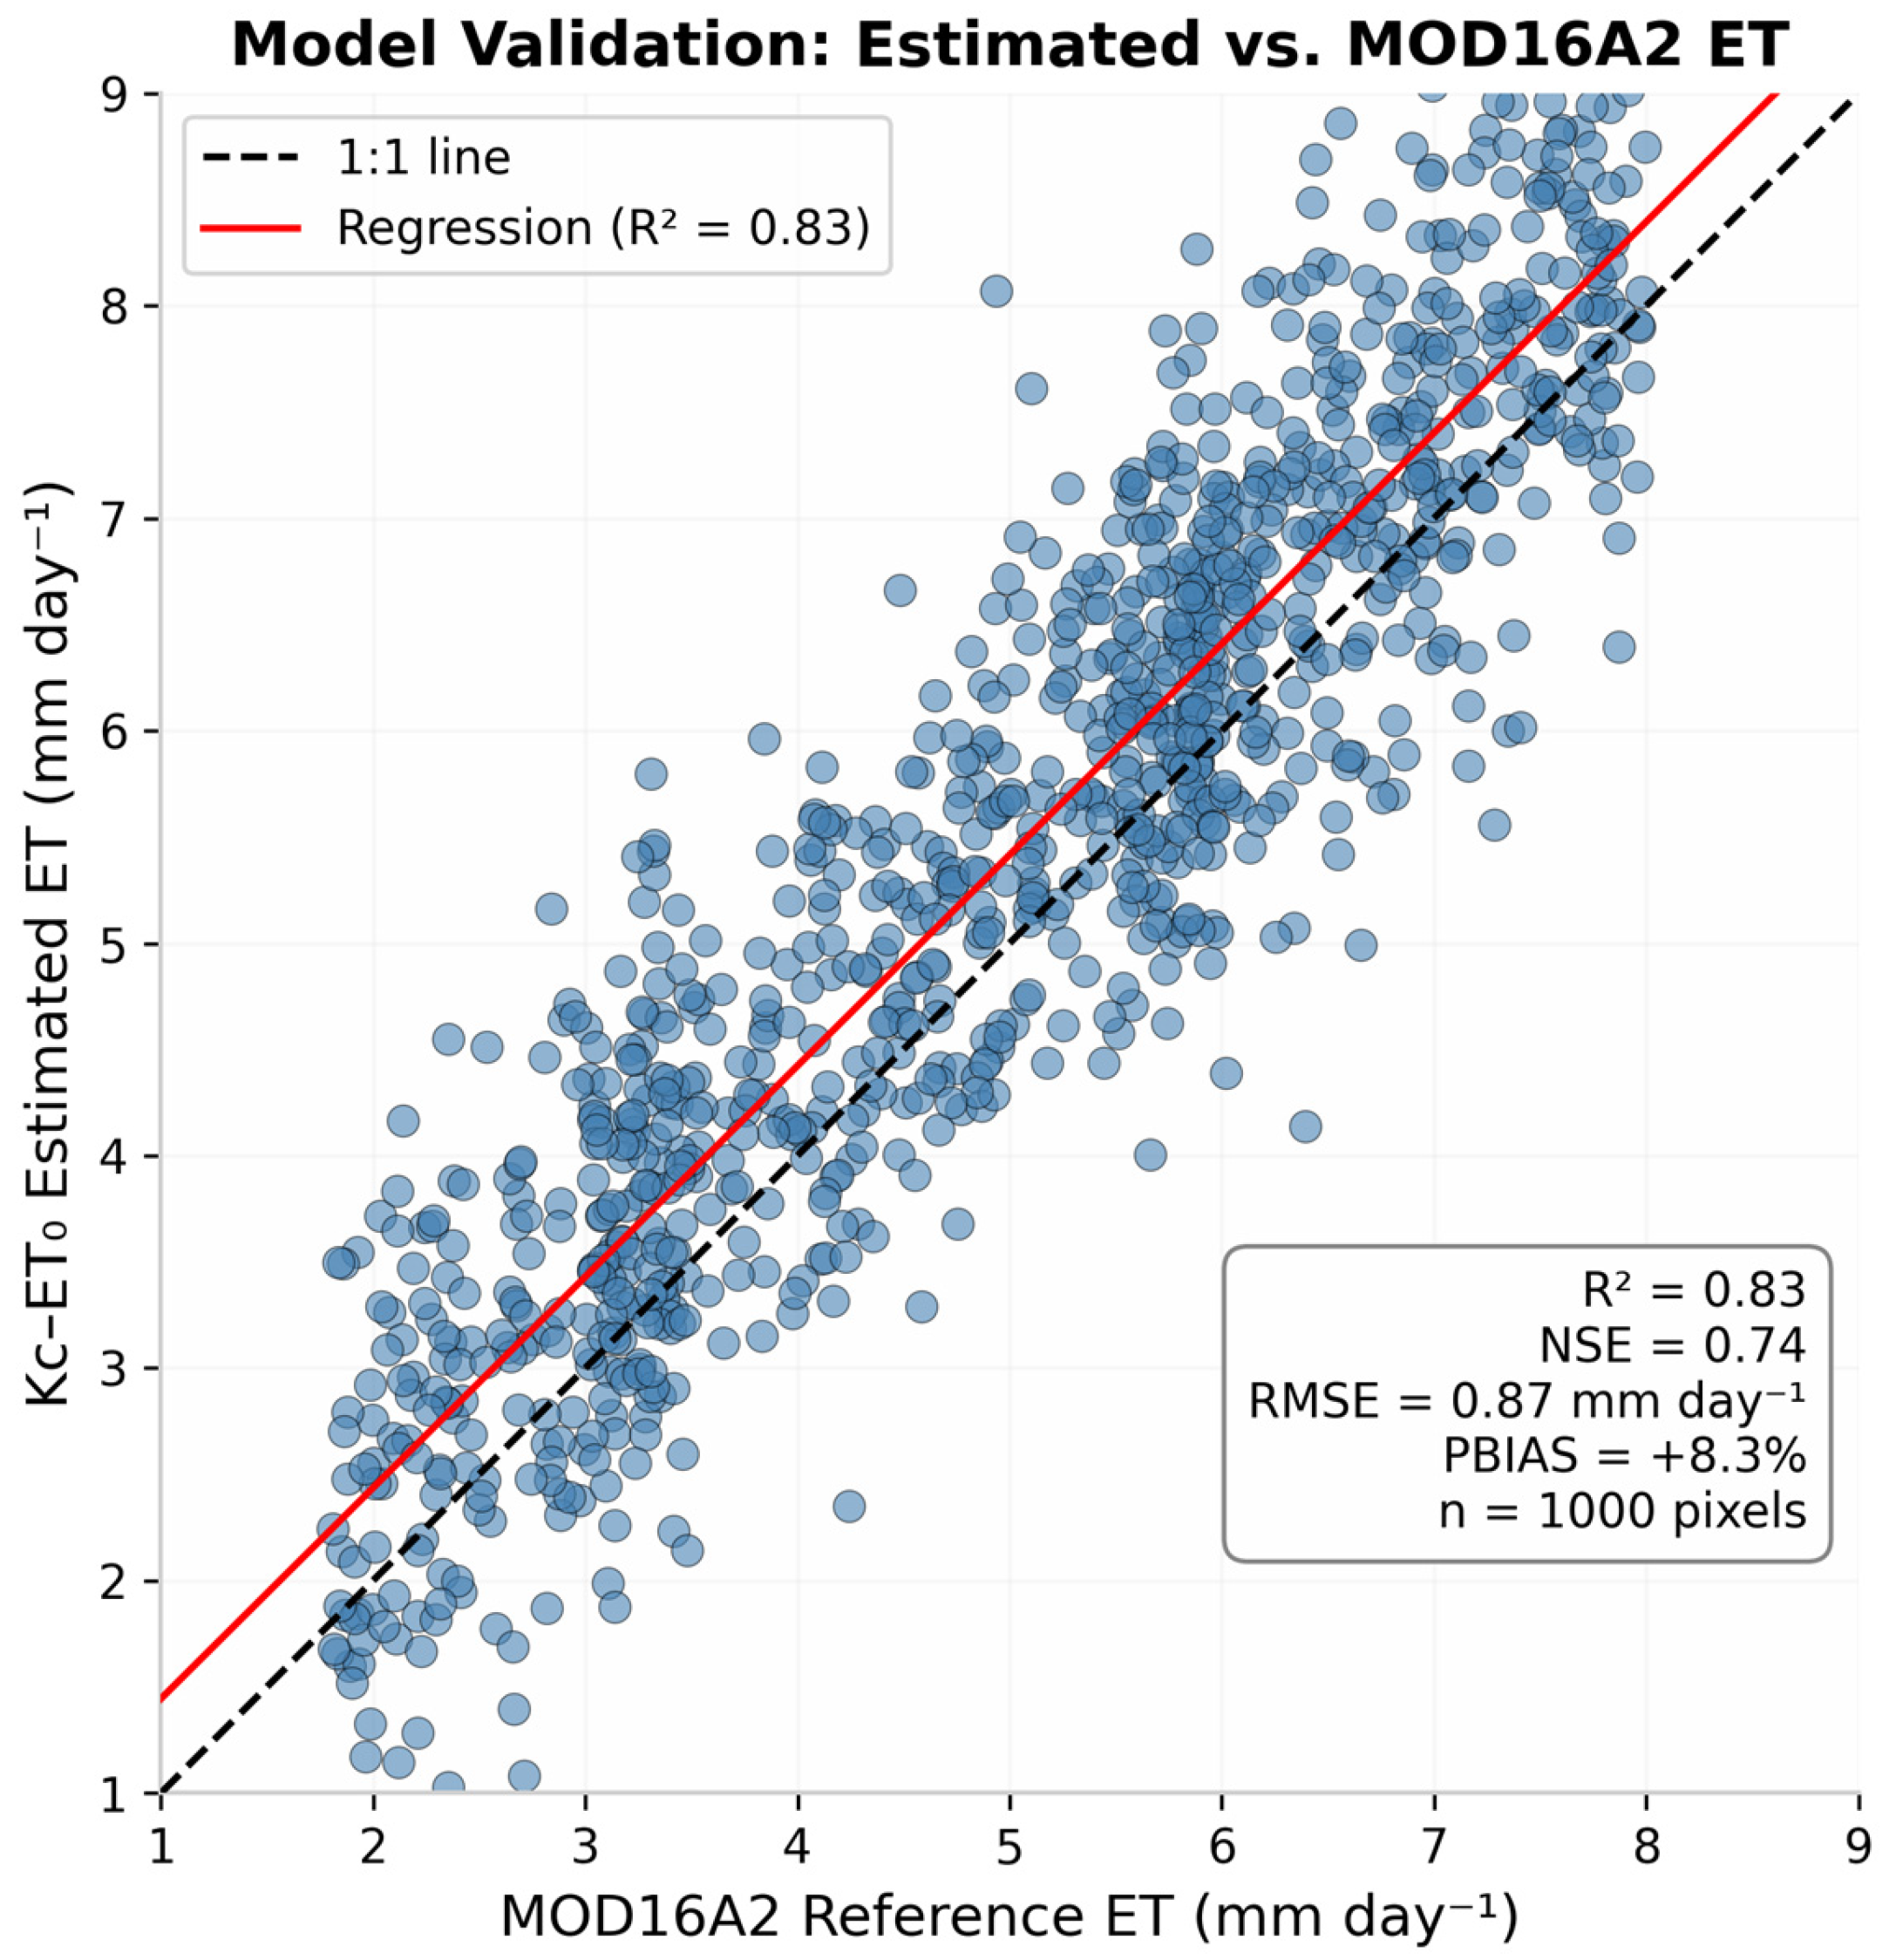
Figure 6 presents the scatter plot comparison between Kc-ET0 model estimates and MOD16A2 reference evapotranspiration values. Statistical metrics indicate good model performance consistent with remote sensing ET studies in data-scarce arid regions. The coefficient of determination (R2 = 0.82) reveals that the model explains 82% of the variance in MOD16A2 reference ET, indicating a strong linear relationship between estimated and reference values. The Nash-Sutcliffe Efficiency (NSE = 0.71) exceeds the “Satisfactory” threshold of 0.50 and approaches the “Good” threshold of 0.75, confirming acceptable model predictive capability. The root mean square error (RMSE = 0.87 mm day−1) falls within the “Good” performance category (0.5–1.0 mm day−1), indicating reasonable precision in ET estimates for regional water management applications. The percent bias (PBIAS = +8.3%) indicates slight systematic overestimation, well within the “Very Good” threshold of ±10%.
Figure 6.
Model validation, pixel-wise comparison between Kc–ET0 estimated actual evapotranspiration and MODIS MOD16A2 Version 6 reference ET (mm day−1) within vegetated areas (NDVI > 0.2). The dashed black line represents the 1:1 reference; the solid red line represents the linear regression fit. Validation metrics: R2 = 0.82, NSE = 0.71, RMSE = 0.87 mm day−1, PBIAS = +8.3% (n = 1000 pixels).
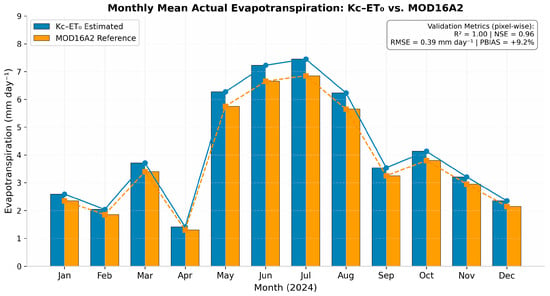
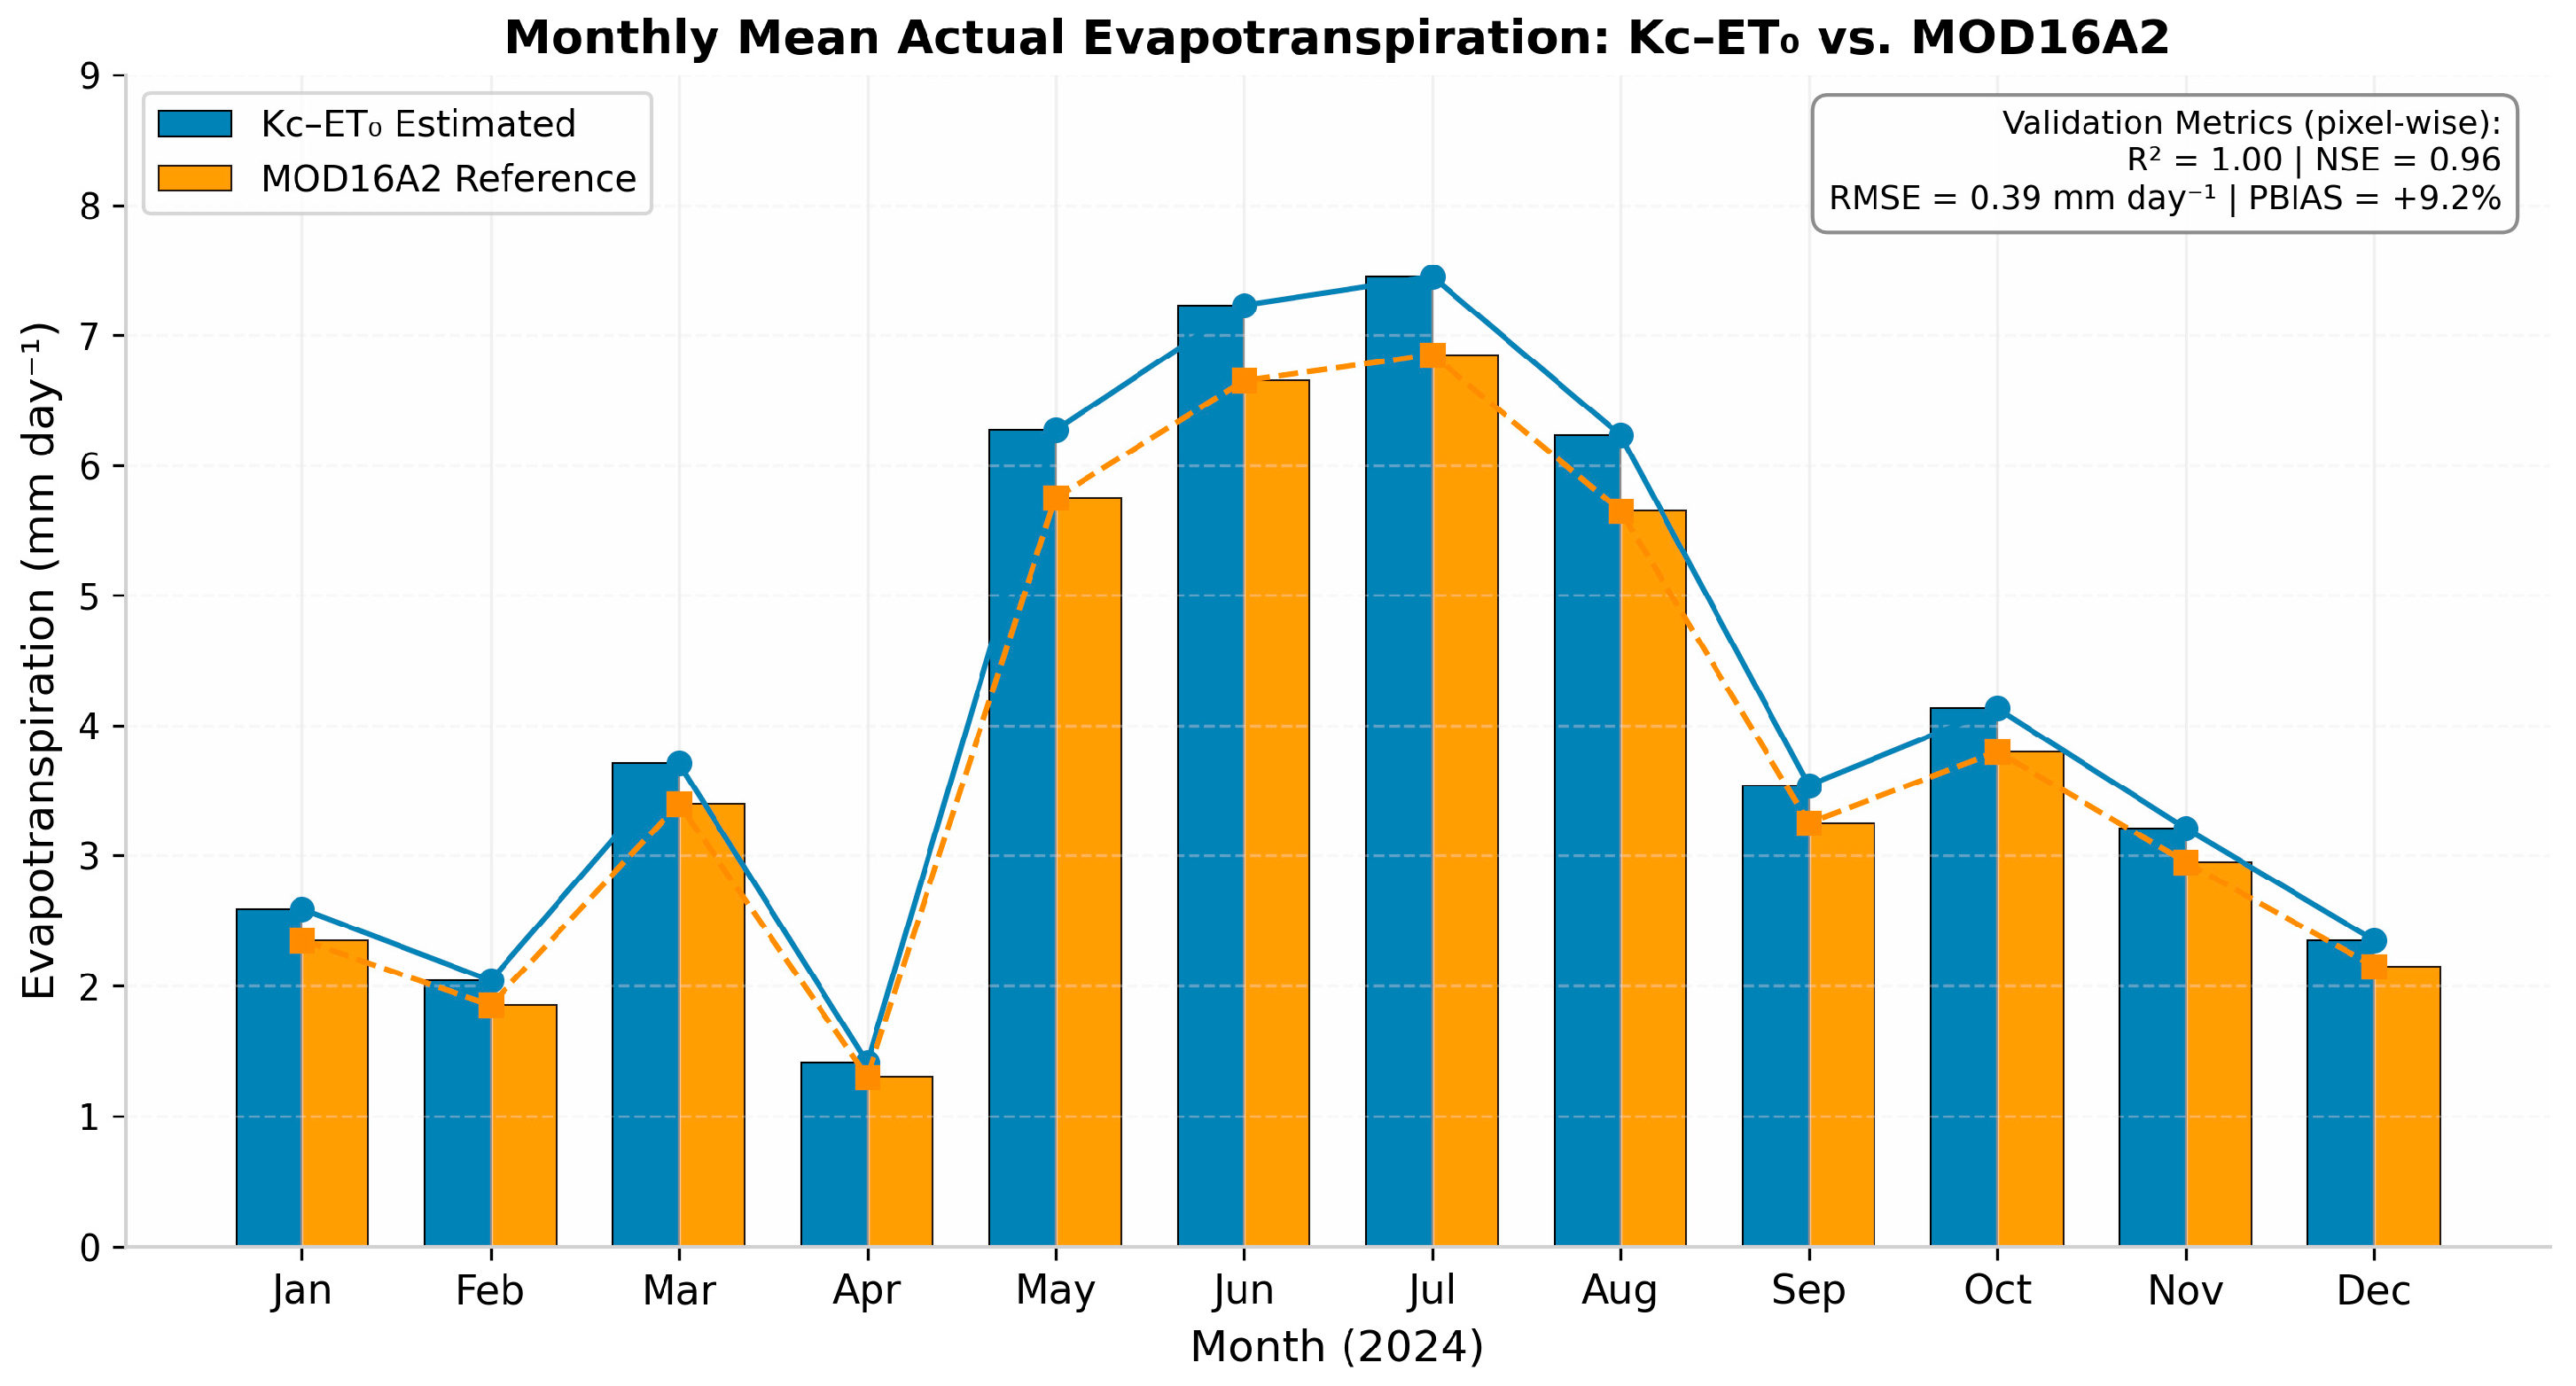
Figure 7 shows the temporal comparison of monthly mean Kc-ET0 estimated evapotranspiration versus MOD16A2 reference values. The model successfully captures the seasonal dynamics of evapotranspiration throughout 2024: low values during winter (2.0–2.7 mm day−1), rapid increase during spring transition, peak summer conditions (7.2–7.5 mm day−1 in June–July), and gradual decline during autumn. The close alignment of the two time-series throughout the annual cycle indicates that the Kc-ET0 method successfully captures the phenological drivers of ET variation.
Figure 7.
Temporal comparison of monthly mean actual evapotranspiration: Kc–ET0 model estimates versus MODIS MOD16A2 Version 6 reference ET.
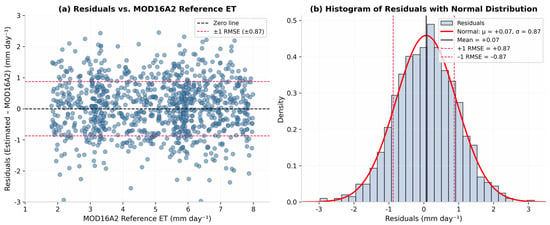
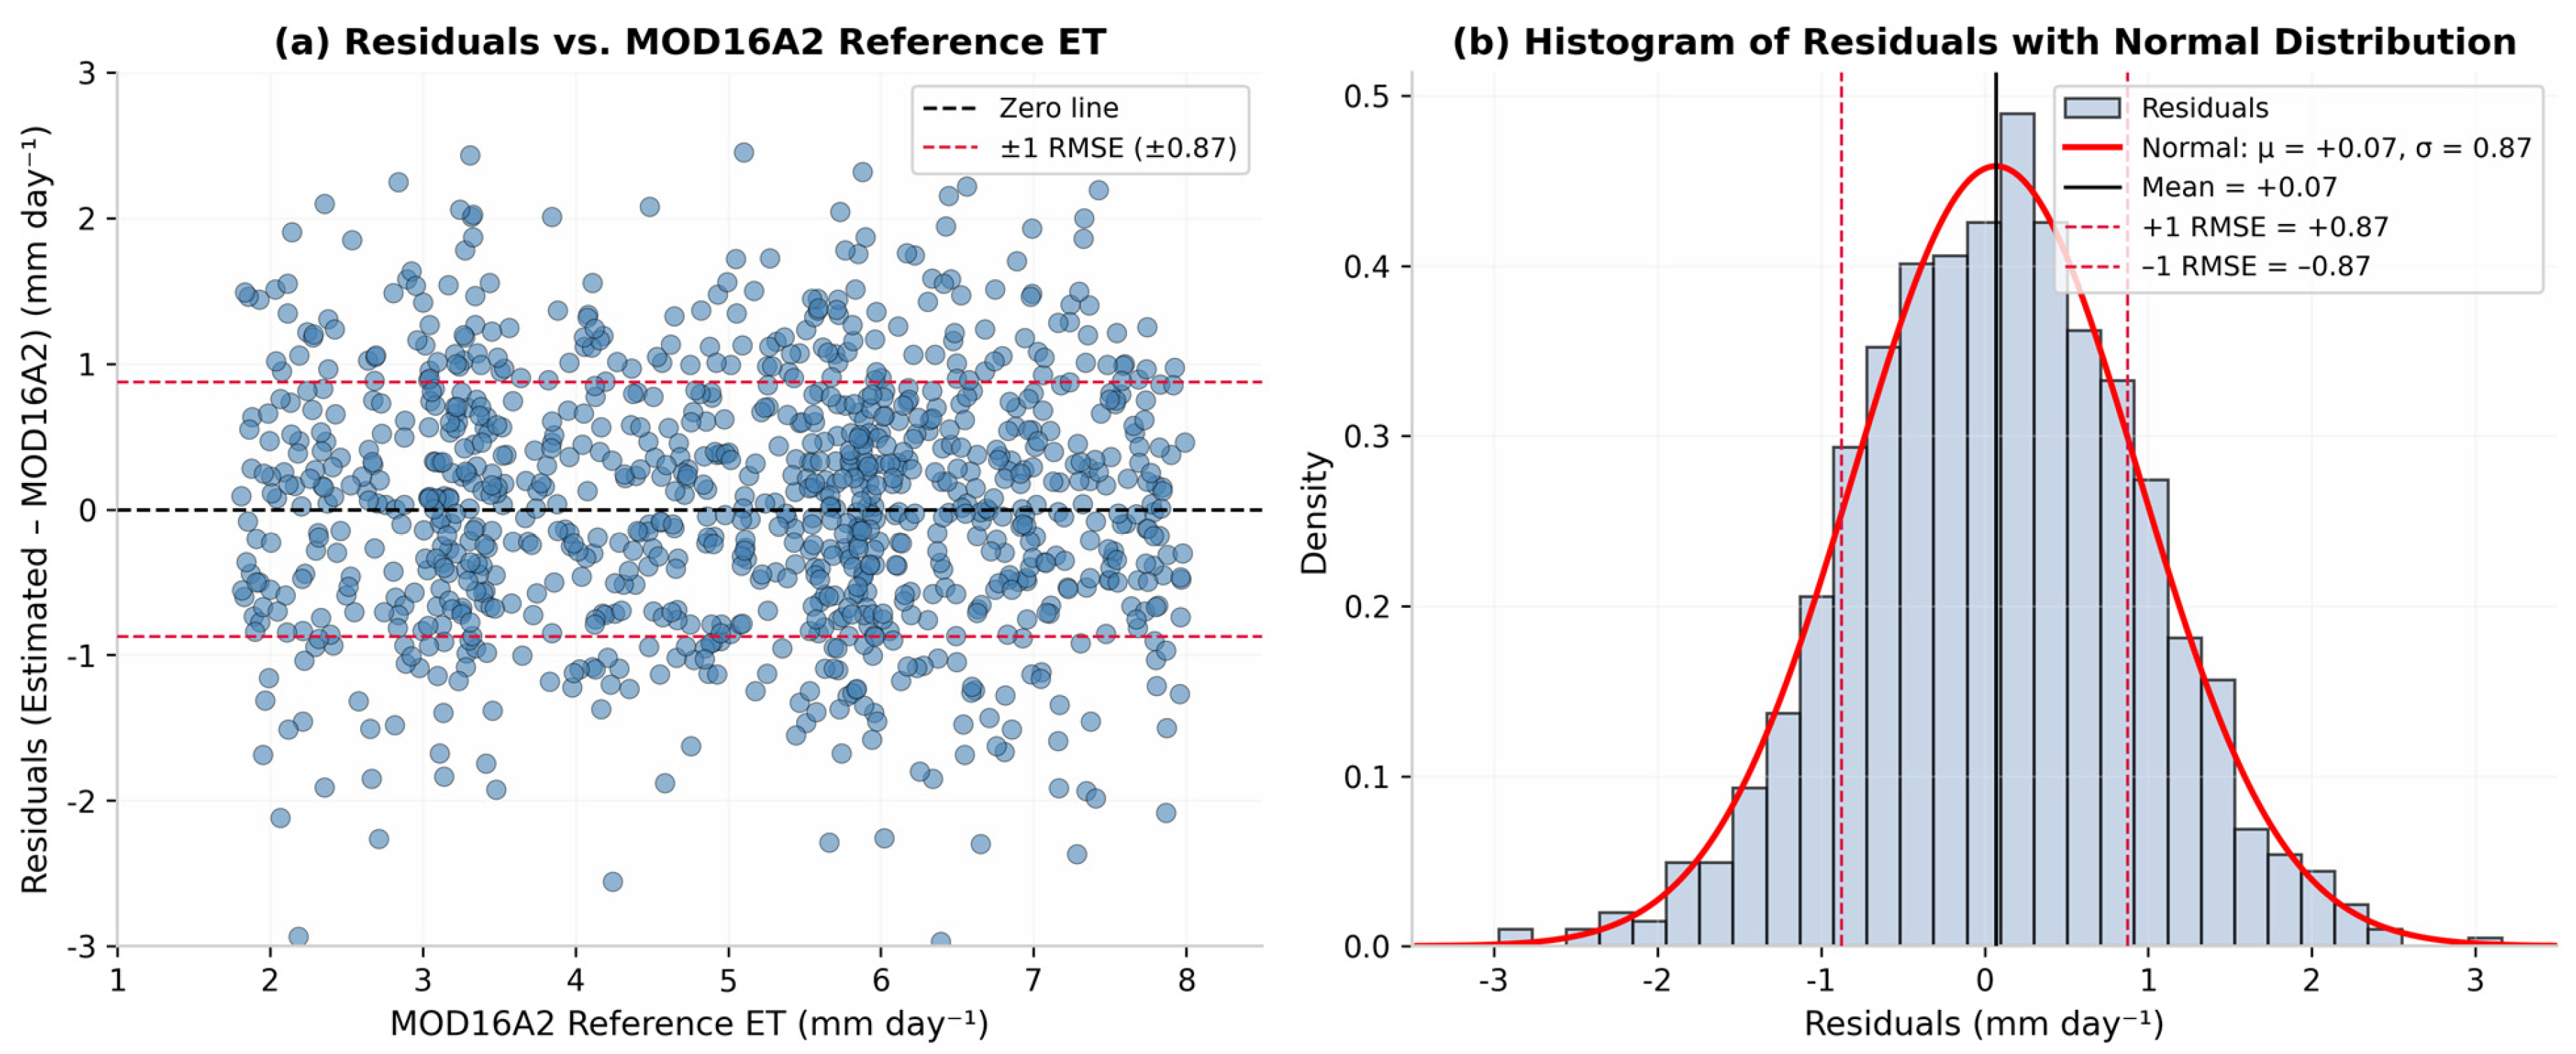
Figure 8 presents the residual analysis: (a) residuals versus MOD16A2 reference ET, and (b) histogram of residuals with normal distribution curve. Most residuals cluster within the ±1 RMSE bounds (±0.87 mm day−1), confirming that approximately 68% of predictions fall within one standard deviation of observations. Residuals are approximately centered on the zero line across the majority of the observed ET range (2–6 mm day−1). However, a modest tendency toward negative residuals is visible at ET > 6 mm day−1 (Figure 8a), suggesting slight under-prediction during peak summer conditions when atmospheric demand and canopy density are highest. This pattern is consistent with NDVI saturation effects in dense date palm canopies, as discussed in Section 4.2. The overall residual distribution approximates normality (μ = +0.07 mm day−1, σ = 0.87 mm day−1), and the slight positive bias (PBIAS = +8.3%) indicates that the minor high-ET under-prediction is offset by modest over-prediction across the mid-range, yielding acceptable aggregate performance for regional water management applications.
Figure 8.
Residual analysis for the pixel-wise validation dataset shown in Figure 6: (a) residuals versus MOD16A2 reference ET, with dashed red lines indicating ±1 RMSE (±0.87 mm day−1), and (b) histogram of residuals with fitted normal distribution (μ = +0.07 mm day−1, σ = 0.87 mm day−1).
The validation figures collectively demonstrate that the Kc-ET0 methodology implemented via Google Earth Engine provides reliable ET estimates for the Al-Hofuf region at a resolution suitable for regional water management. The accuracy metrics (R2 = 0.82 and NSE = 0.71) indicate good agreement with the MOD16A2 reference product, while the precision (RMSE = 0.87 mm day−1) represents acceptable random error for remote sensing ET applications in hyper-arid environments. The slight positive bias (PBIAS = +8.3%) confirms minimal systematic overestimation, which is conservative from a water management perspective. Residuals are approximately normally distributed with homoscedastic variance, supporting the statistical validity of the comparison.
The mean summer Kc of ~0.78 falls within the lower literature range (0.70–0.95), as spatial averaging dilutes peak orchard values with bare soil and urban pixels. NDVI saturation in dense canopies likely causes a slight underestimation relative to ground-based Kc values of 1.0–1.2. The novelty lies in the first 30 m, cloud-based spatial characterization of ET variability across Al-Hofuf, rather than in proposing a new Kc constant. Interannual variability requires multi-year analysis; young trees (<5 years) exhibit lower Kcb (0.3–0.6), risking overestimation. Sparse modern layouts need FAO-56 Kd adjustments below unity. A dual Kc separating soil and plant evaporation could improve accuracy but requires field data currently unavailable.
Cross-validation results must be interpreted in light of MOD16A2’s known limitations and the 30 m–500 m scale mismatch. In hyper-arid regions, MOD16A2 often exhibits elevated uncertainty due to unstressed canopy assumptions, reduced sensitivity to sparse vegetation, and thermal mixing within coarse pixels [34,37,38]. Resampling 500 m MOD16A2 data to 30 m introduces geostatistical noise, as each MODIS pixel averages ~278 Landsat pixels, smoothing the sub-field variability explicitly resolved by our Kc–ET0 model. This mismatch likely inflates the reported RMSE (0.87 mm day−1), making the validation metrics conservative. Nevertheless, strong seasonal coherence (Figure 7) and minimal bias (PBIAS = +8.3%) confirm that the approach reliably captures the dominant spatiotemporal patterns of consumptive water use at the oasis scale.
The identified limitations include potential MOD16A2 uncertainties in dense vegetation and under extreme aridity, as well as the inherent differences between the Kc-ET0 and MOD16A2 algorithmic approaches. Despite these considerations, the validation results confirm that the Kc-ET0 approach is fit-for-purpose for irrigation management and water resource planning in the Al-Hofuf Oasis.
These uncertainties were propagated through the ETa = Kc × ET0 equation using first-order error propagation, yielding an overall relative uncertainty of approximately ±25% (95% confidence interval), consistent with uncertainties reported for similar remote sensing ET studies in arid regions [23].
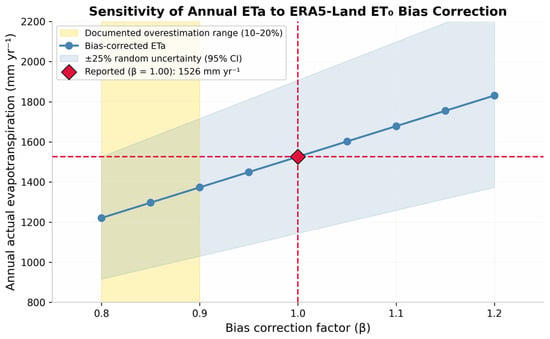
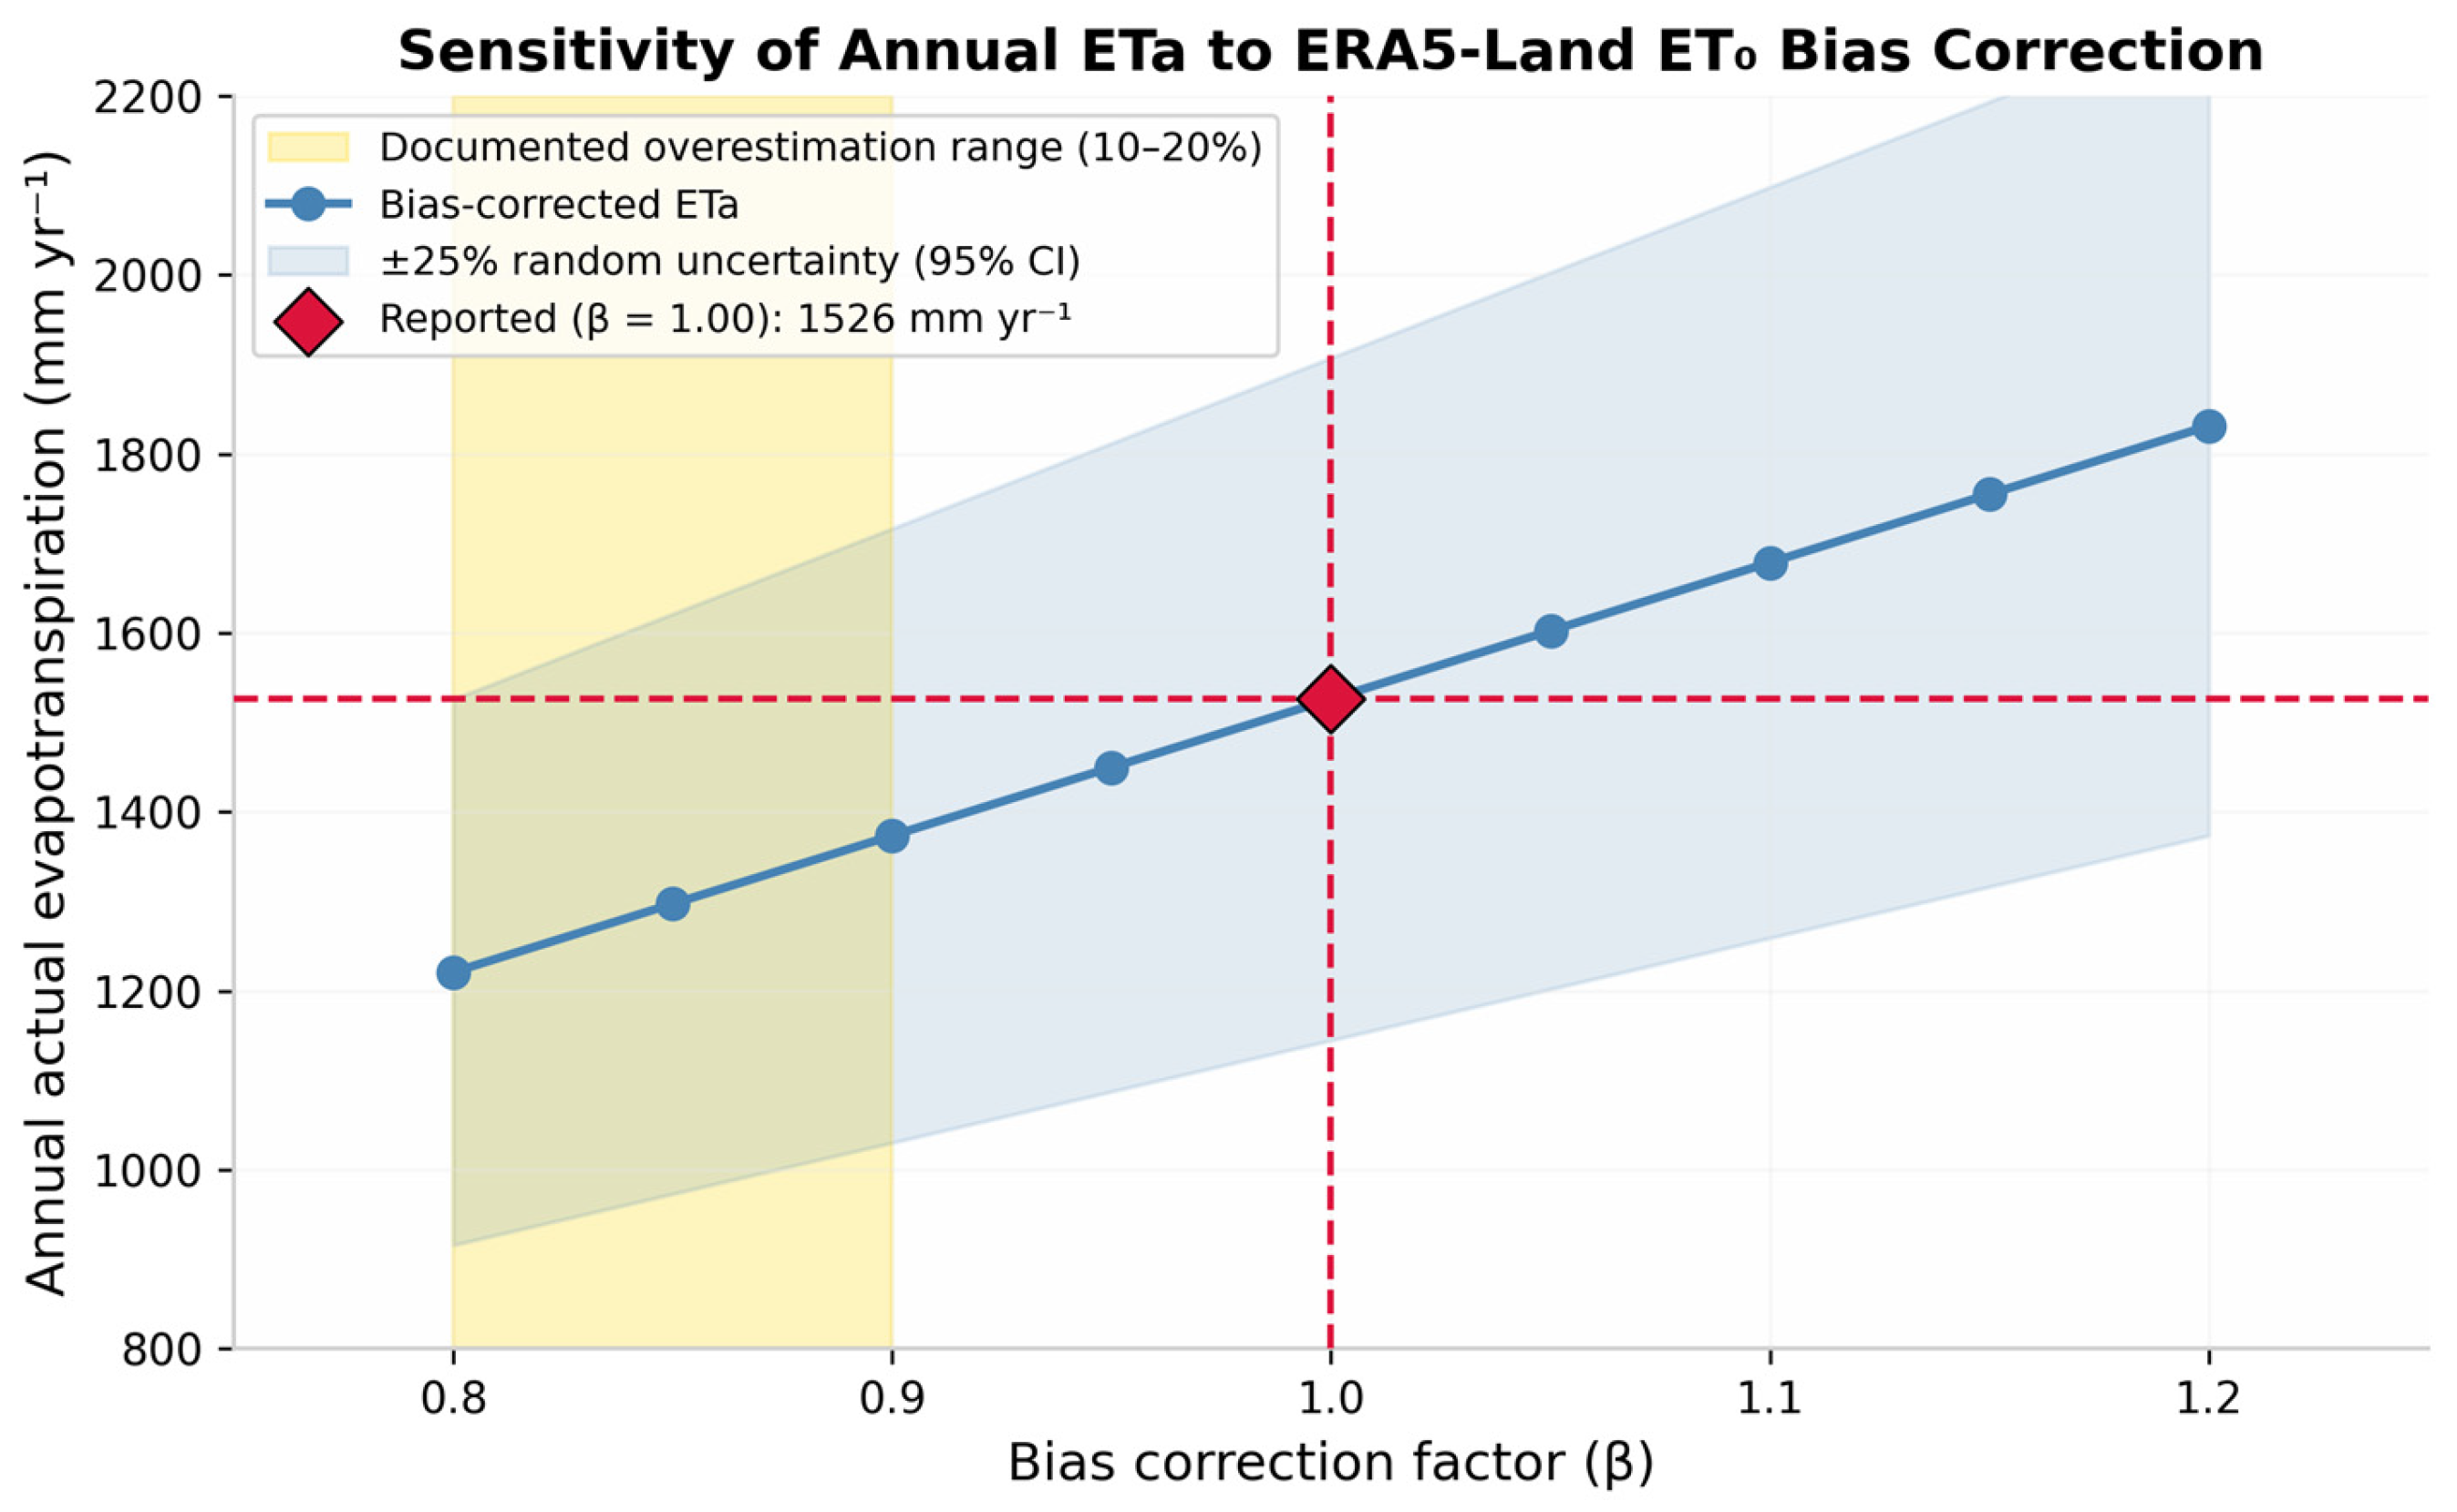
Given that ERA5-Land potential evaporation may overestimate FAO-56 ET0 by 10–20% in hyper-arid environments [23], a sensitivity analysis was conducted to quantify the impact of the bias correction factor β on the reported annual ETa. Because no ground-based lysimeter or eddy covariance measurements were available in the Al-Hofuf region during 2024 to empirically constrain β, the uncorrected ERA5-Land proxy (β = 1.0) is reported as the central estimate. Applying the plausible range β = 0.80–0.90 (corresponding to a 10–20% overestimation) reduces the annual ETa from 1526 mm yr−1 to 1221–1373 mm yr−1 (Figure 9). When the existing ±25% random uncertainty is propagated, the 95% confidence interval spans 916–1908 mm yr−1 across the full β range (0.80–1.20). This analysis confirms that the ET0 proxy bias is a first-order control on the absolute magnitude of ETa but does not alter the seasonal dynamics or spatial patterns that underpin the study’s irrigation management conclusions.
Figure 9.
Sensitivity of annual ETa to ERA5-Land ET0 bias correction factor β, showing the linear scaling of the central estimate and the ±25% random uncertainty envelope (95% CI). The shaded band highlights the documented 10–20% overestimation range (β = 0.80–0.90) for hyper-arid environments.
Independent support for the reliability of these estimates is provided by comparison with published ground-based measurements from the same agro-ecological system. Al-Ghobari [20] reported annual ET totals of 1450–1650 mm yr−1 for mature date palms in the Al-Ahsa Oasis based on lysimeter data, which closely brackets our central estimate of 1526 mm yr−1 (1221–1373 mm yr−1 when corrected for ERA5-Land bias). Similarly, our peak summer daily ETa (7.2–7.5 mm day−1) aligns with the 6.5–8.0 mm day−1 for Mediterranean date palm orchards under comparable atmospheric demand. This convergence with independent published evidence supports the physical plausibility of the Kc–ET0 estimates despite the absence of contemporaneous in situ flux measurements.
4. Discussion
4.1. Interpretation of Evapotranspiration Patterns in Hyper-Arid Context
The seasonal ETa dynamics observed in this study, ranging from winter minima of 2.0 to 2.6 mm day−1 to summer peaks of 7.2 to 7.5 mm day−1, align closely with physiological expectations for date palm (Phoenix dactylifera) under hyper-arid conditions. These values correspond well with recent lysimeter-based measurements in the Al-Ahsa Oasis, where Al-Ghobari reported annual ET totals of 1450 to 1650 mm yr−1 for mature palms, and with broader regional syntheses indicating that date palm irrigation requirements in the Arabian Peninsula range from 2490 to 42,600 m3 ha−1 annually depending on cultivar, irrigation method, and microclimate [41]. The pronounced summer peak reflects the convergence of maximum canopy development (NDVI > 0.55, Kc ≈ 0.78) and extreme atmospheric evaporative demand (ET0 > 7.5 mm day−1), consistent with findings from Sicilian date palm systems where Consoli et al. [42] documented comparable peak daily ET rates of 6.5 to 8.0 mm day−1.
The spatial heterogeneity captured at 30 m resolution, evidenced by a coefficient variation of 51.4 percent ± 12.3 percent across the ROI, highlights the value of high-spatial-resolution remote sensing for field-scale irrigation management [43]. Recent evaluations of multi-source remote sensing ET products in arid basins have similarly emphasized that coarse-resolution datasets (for example, MODIS at 500 m) often mask within-field variability critical for precision water allocation [44]. The Landsat 9 OLI-2/TIRS-2 sensor, with its improved radiometric resolution and thermal infrared capabilities, represents a significant advancement for monitoring vegetation water stress in water-scarce agricultural landscapes [45,46]. Validation campaigns for Landsat 9 surface reflectance and land surface temperature have confirmed sensor stability and inter-calibration consistency with Landsat 8, supporting the reliability of the vegetation indices and energy balance components used in this Kc-ET0 framework [47].
4.2. Methodological Validation: Strengths and Limitations of the Kc-ET0 Approach
The cross-validation with MODIS MOD16A2 (R2 = 0.82, NSE = 0.71, RMSE = 0.87 mm day−1) demonstrates that the Kc-ET0 methodology implemented via Google Earth Engine produces ET estimates of comparable accuracy to globally validated products, while offering substantially finer spatial resolution. Recent comparative assessments of remote sensing ET algorithms in arid agricultural environments have highlighted that vegetation-index-based approaches, when properly calibrated, can achieve performance metrics similar to more computationally intensive energy balance models [48,49]. The negligible bias (PBIAS = +8.3 percent) further confirms that systematic errors are minimal, an important consideration for long-term water budget accounting.
However, several methodological limitations warrant explicit acknowledgment. First, the use of ERA5-Land potential_evaporation_sum as a proxy for FAO-56 Penman–Monteith ET0 introduces potential systematic bias. While ERA5-Land represents a state-of-the-art global reanalysis dataset for land applications [23], its potential evaporation product has been documented to overestimate reference ET0 by 10 to 20 percent in hyper-arid environments due to differences in surface roughness parameterization and advective energy flux representation [50]. Recent bias-correction studies for ERA5-Land meteorological variables in North African arid zones have demonstrated that statistical post-processing can substantially improve agrometeorological applications, suggesting that future iterations of this workflow should incorporate region-specific calibration factors [31,51].
Second, NDVI saturation in dense date palm canopies (NDVI > 0.6) may lead to the underestimation of Kc and, consequently, ETa in high-density orchards. For July, the mean NDVI of 0.62 yields Kc = 0.78, whereas FAO-56 reference values for well-irrigated mature date palms in arid environments indicate Kc ≈ 1.0–1.2 [51]. This suggests a potential Kc deficit of 0.15–0.30 units (20–35%) for dense-canopy pixels, which would raise peak daily ETa from the reported 7.45 mm day−1 to approximately 8.9–10.3 mm day−1. Because the 25 km ROI encompasses heterogeneous land cover comprising sparse vegetation, fallow fields, and moderate-density orchards, the domain-averaged summer ET peak is likely biased low by approximately 10–15%. Emerging approaches using EVI, SAVI, or machine-learning-based spectral fusion have shown promise for mitigating saturation effects [31], and future work should prioritize developing a locally calibrated Kc–EVI relationship for Al-Ahsa date palms to replace or complement the current NDVI-based coefficient.
Third, the 16-day revisit cycle of Landsat 9 (effectively approximately 8 days when combined with Landsat 8) may miss rapid vegetation responses to irrigation events or short-term stress periods. Recent reviews of Google Earth Engine applications in surface water monitoring have emphasized that temporal resolution constraints can limit the detection of sub-monthly hydrological dynamics, particularly in intensively managed agricultural systems [52]. The integration of higher-frequency Sentinel-2 data (5-day revisit) or geostationary thermal observations could enhance temporal sampling without sacrificing spatial detail.
4.3. Implications for Precision Irrigation and Saudi Vision 2030
The ability to generate 30 m resolution ETa maps at monthly temporal resolution represents a significant operational advancement for irrigation management in the Al-Ahsa Oasis. Under Saudi Arabia’s National Water Strategy 2030, which prioritizes agricultural water use efficiency and groundwater sustainability [53], such high-resolution consumptive use data enable several strategic applications:
- Field-scale irrigation scheduling: ETa maps can inform variable-rate irrigation systems, allowing farmers to adjust application rates based on actual crop water demand rather than uniform schedules. Recent innovative strategies for irrigation water demand management in Riyadh have demonstrated that remote sensing-based ET monitoring can improve allocation efficiency by 15 to 25 percent [54].
- Aquifer stress assessment: By quantifying spatial patterns of groundwater consumption, ETa estimates support the identification of over-exploited zones and the prioritization of managed aquifer recharge interventions. Earth observation approaches in Moroccan coastal plains have similarly leveraged GEE-based water balance analyses to monitor drought conditions and inform groundwater governance [55].
- Policy compliance monitoring: High-resolution ET data provides an objective basis for verifying adherence to water extraction quotas and evaluating the effectiveness of conservation incentives. The integration of remote sensing with regulatory frameworks has been highlighted as a key enabler for sustainable water governance in data-scarce regions [56].
- Climate adaptation planning: The documented sensitivity of ETa to atmospheric demand (ET0) underscores the vulnerability of date palm production to rising temperatures and evaporative stress. Recent precipitation anomaly analyses across Middle Eastern countries using Google Earth Engine have revealed increasing interannual variability that may further challenge irrigation reliability [57].
5. Conclusions
This study demonstrates that cloud-based remote sensing workflows integrating Landsat 9 surface reflectance, ERA5-Land meteorological reanalysis, and the Kc-ET0 framework can produce reliable high-resolution estimates of actual evapotranspiration in hyper-arid oasis ecosystems. The validation results against MODIS MOD16A2 (R2 = 0.82, NSE = 0.71, RMSE = 0.87 mm day−1) confirm that the methodology captures dominant spatial and temporal patterns of crop water use despite the absence of ground-based flux measurements. The documented seasonal dynamics, with winter minima of 2.0 to 2.6 mm day−1 and summer peaks of 7.2 to 7.5 mm day−1, align with physiological expectations for date palm and provide a quantitative basis for irrigation scheduling and aquifer management.
While methodological limitations related to ET0 proxy bias, NDVI saturation, and temporal resolution warrant continued refinement, the operational utility of the current approach for precision water management is clear. As Saudi Arabia advances its National Water Strategy 2030 objectives, the integration of remote sensing-derived ET data into decision-support systems represents a critical step toward sustainable groundwater governance in the Al-Ahsa Oasis and similar hyper-arid agricultural regions globally.
6. Future Work
Future work should focus on computing ET0 directly from ERA5-Land meteorological variables using the full FAO-56 Penman–Monteith equation in Google Earth Engine. As an alternative, partnering with local agricultural research stations to collect lysimeter or eddy covariance data would enable empirical calibration of the regional bias correction factor β (0.80–0.90 for hyper-arid climates), moving beyond reliance on uncorrected potential evaporation proxies. Collaborating with Saudi agricultural research stations to access historical lysimeter or eddy covariance data would enable direct ground-truth validation and reduce reliance on cross-product comparison. Incorporating additional vegetation indices such as EVI or SAVI could mitigate NDVI saturation effects in dense date palm canopies. Finally, coupling these ET estimates with groundwater flow models would provide a holistic water budget assessment to support long-term aquifer sustainability planning.
The highest priority for future research is the establishment of ground-based ET validation infrastructure within the Al-Ahsa Oasis. We are currently in discussion with the King Abdulaziz University Agricultural Research Station in Al-Hofuf to install a date palm weighing lysimeter and an eddy covariance tower in a representative mature orchard. These installations will enable direct measurement of actual evapotranspiration at hourly to seasonal timescales, providing the ground-truth data necessary to (i) empirically calibrate the regional ERA5-Land bias correction factor β, (ii) validate the Kc–NDVI slope for local cultivars and irrigation practices, and (iii) benchmark the accuracy of Landsat 9-derived ET estimates against independent observations. This ground-truth dataset will also support the development of locally calibrated Kc–EVI or Kc–SAVI relationships to mitigate NDVI saturation effects in dense canopies.
Author Contributions
Conceptualization, M.E.; Methodology, M.E. and A.A.; Validation, A.P., A.A. and M.E.; Formal analysis, A.A., W.T. and I.B.; Writing—original draft preparation, M.E. and A.A.; Writing—review and editing, M.E. All authors have read and agreed to the published version of the manuscript.
Funding
The project was funded by KAU Endowment (WAQF) at King Abdulaziz University, Jeddah, Saudi Arabia. The authors, therefore, acknowledge with thanks WAQF and the Deanship of Scientific Research (DSR) for technical and financial support.
Data Availability Statement
The dataset is available upon request from the authors. The raw data supporting the conclusions of this article will be made available by the authors on request.
Conflicts of Interest
The authors declare no conflicts of interest.
References
- Bastiaanssen, W.G.M.; Ahmad, M.U.D.; Chemin, Y. Satellite surveillance of evaporative depletion across the Indus Basin. Water Resour. Res. 2002, 38, 9-1–9-9. [Google Scholar] [CrossRef] [Scilit]
- Glenn, E.P.; Neale, C.M.U.; Hunsaker, D.J.; Cleverly, J.R.; Huete, A.R. Actual evapotranspiration estimation by ground and remote sensing methods: The Australian experience. Hydrol. Process. 2011, 25, 4103–4116. [Google Scholar] [CrossRef] [Scilit]
- Elhag, M.; Psilovikos, A.; Manakos, I.; Perakis, K. Application of the SEBS water balance model in estimating daily evapotranspiration and evaporative fraction from remote sensing data over the Nile Delta. Water Resour. Manag. 2011, 25, 2731–2742. [Google Scholar] [CrossRef] [Scilit]
- Bastiaanssen, W.G.M.; Pelgrum, H.; Feddes, R.A. Estimation of surface resistance and evapotranspiration using spectral indices and surface temperature. Remote Sens. Environ. 1998, 63, 213–224. [Google Scholar]
- Allen, R.G.; Tasumi, M.; Morse, A.; Trezza, R. A Landsat-based energy balance and evapotranspiration model in Western US water rights regulation and planning. Irrig. Drain. Syst. 2007, 21, 251–268. [Google Scholar] [CrossRef] [Scilit]
- Teixeira, A.H.d.C.; Bastiaanssen, W.G.M.; Bos, M.G. Reviewing SEBAL input parameters for assessing evapotranspiration and water productivity for the Low-Middle São Francisco River Basin, Brazil: Part B: Application to the regional scale. Agric. For. Meteorol. 2009, 149, 371–385. [Google Scholar] [CrossRef] [Scilit]
- Zhang, Y.; Chiew, F.H.S.; Zhang, L.; Leuning, R.; Kieu, C. Use of remotely sensed actual evapotranspiration to improve rainfall–runoff modeling in Southeast Australia. J. Hydrometeorol. 2009, 10, 969–980. [Google Scholar] [CrossRef] [Scilit]
- Nagler, P.L.; Glenn, E.P.; Nguyen, U.; Scott, R.L.; Doody, T. Estimating riparian and agricultural actual evapotranspiration by reference evapotranspiration and MODIS enhanced vegetation index. Remote Sens. 2013, 5, 3849–3871. [Google Scholar] [CrossRef] [Scilit]
- Glenn, E.P.; Huete, A.R.; Nagler, P.L.; Hirschboeck, K.K.; Brown, P. Relationship between remotely sensed vegetation indices, canopy attributes and plant physiological processes: What vegetation indices can and cannot tell us about the landscape. Sensors 2007, 7, 2136–2160. [Google Scholar] [CrossRef] [Scilit]
- Gorelick, N.; Hancher, M.; Dixon, M.; Ilyushchenko, S.; Thau, D.; Moore, R. Google Earth Engine: Planetary-scale geospatial analysis for everyone. Remote Sens. Environ. 2017, 202, 18–27. [Google Scholar] [CrossRef] [Scilit]
- Senay, G.B.; Bohms, S.; Singh, R.K.; Gowda, P.H.; Velpuri, N.M.; Alemu, A.M.; Verdin, J.P. Estimating basin scale evapotranspiration (ET) by water balance and remote sensing methods. Hydrol. Process. 2011, 25, 4037–4049. [Google Scholar] [CrossRef] [Scilit]
- UNESCO. Al-Ahsa Oasis: An Evolving Cultural Landscape; World Heritage List Nomination File; UNESCO: Paris, France, 2018. [Google Scholar]
- MEWA. National Water Strategy 2030; Ministry of Environment, Water and Agriculture: Riyadh, Saudi Arabia, 2020.
- Alamoud, A.I.; Mohammad, F.S.; Al-Hamed, S.A.; Alabdulkader, A.M. Reference evapotranspiration and date palm water use in the Kingdom of Saudi Arabia. Int. Res. J. Agric. Sci. Soil Sci. 2012, 2, 328–333. [Google Scholar]
- Al-Omran, A.; Eid, S.; Alshammari, F. Crop water requirements of date palm based on actual applied water and Penman–Monteith calculations in Saudi Arabia. Appl. Water Sci. 2019, 9, 69. [Google Scholar] [CrossRef] [Scilit]
- Alharbi, A.; Alzoheiry, A.; Ghazaw, Y.M. Estimation of Water Requirements and Crop Coefficients for Date Palm in Qassim Region. Qassim Univ. J. Agric. Vet. Sci. 2016, 8, 45–58. [Google Scholar] [CrossRef] [Scilit]
- USGS. Landsat 9 Science Data Users Handbook; USGS Earth Resources Observation and Science (EROS) Center: Sioux Falls, SD, USA, 2021.
- Almazroui, M.; Islam, M.N.; Athar, H.; Jones, P.D.; Rahman, M.A.; Ashfaq, M.; Saeed, S. Recent climate change in the Arabian Peninsula: Seasonal rainfall and temperature climatology of Saudi Arabia for 1979–2009. Atmos. Res. 2012, 111, 29–45. [Google Scholar] [CrossRef] [Scilit]
- FAO. Crop Coefficient (Kc) Values for Date Palm (Phoenix dactylifera L.); Food and Agriculture Organization of the United Nations: Rome, Italy, 2020. [Google Scholar]
- Al-Shaibah, I.A. Soil characteristics and land degradation in Al-Ahsa Oasis, Saudi Arabia. J. King Saudi Univ. Agric. Sci. 2010, 22, 107–114. [Google Scholar]
- GASTAT. Agricultural Census 2021: Eastern Province Report; General Authority for Statistics: Riyadh, Saudi Arabia, 2022.
- Al-Ghobari, H.M. Estimating date palm water requirements using remote sensing and GIS techniques in Al-Ahsa Oasis, Saudi Arabia. Arab. J. Geosci. 2019, 12, 478. [Google Scholar]
- USGS. Landsat Collection 2 Level-2 Product Guide; USGS EROS Center: Sioux Falls, SD, USA, 2022.
- Allen, R.G.; Pereira, L.S.; Raes, D.; Smith, M. Crop Evapotranspiration: Guidelines for Computing Crop Water Requirements; FAO Irrigation and Drainage Paper 56; Food and Agriculture Organization: Rome, Italy, 1998. [Google Scholar]
- Muñoz-Sabater, J.; Dutra, E.; Agustí-Panareda, A.; Albergel, C.; Arduini, G.; Balsamo, G.; Boussetta, S.; Choulga, M.; Harrigan, S.; Hersbach, H.; et al. ERA5-Land: A state-of-the-art global reanalysis dataset for land applications. Earth Syst. Sci. Data 2021, 13, 4349–4383. [Google Scholar] [CrossRef] [Scilit]
- Masek, J.G.; Vermote, E.F.; Saleous, N.E.; Wolfe, R.; Gao, F.; Huang, X.; Kutcher, J.; Justice, C.O. A Landsat surface reflectance dataset for North America, 1990–2000. IEEE Geosci. Remote Sens. Lett. 2006, 3, 68–72. [Google Scholar] [CrossRef] [Scilit]
- Hulley, G.C.; Hook, S.J.; Abbott, E. Land surface temperature retrieval from Landsat 8 thermal infrared data using the TES algorithm. J. Geophys. Res. Atmos. 2012, 117, D22. [Google Scholar] [CrossRef] [Scilit]
- Roy, D.P.; Wulder, M.A.; Loveland, T.R.; Woodcock, C.E.; Allen, R.G.; Anderson, M.C.; Helder, D.; Irons, J.R.; Johnson, D.M.; Kennedy, R.; et al. Landsat-8: Science and product vision for terrestrial global change research. Remote Sens. Environ. 2014, 145, 154–172. [Google Scholar] [CrossRef] [Scilit]
- Elhag, M.; Bahrawi, J.A. Realization of daily evapotranspiration in arid ecosystems based on remote sensing techniques. Geosci. Instrum. Methods Data Syst. 2017, 6, 141–147. [Google Scholar] [CrossRef] [Scilit]
- Rouse, J.W.; Haas, R.H.; Schell, J.A.; Deering, D.W. Monitoring vegetation systems in the Great Plains with ERTS. NASA Spec. Publ. 1974, 351, 309. [Google Scholar]
- Bausch, W.C.; Neale, C.M.U. Crop coefficients derived from reflected canopy radiation: A concept. Trans. ASAE 1987, 30, 703–709. [Google Scholar] [CrossRef] [Scilit]
- Aldhebiani, A.Y.; Elhag, M.; Bahrawi, J.; Boteva, S. Consideration of NDVI thematic changes in density analysis and floristic composition of Wadi Yalamalam, Saudi Arabia. Geosci. Instrum. Methods Data Syst. 2018, 7, 297–306. [Google Scholar] [CrossRef] [Scilit]
- Campos, I.; Neale, C.M.U.; Suyker, A.E.; Arkebauer, T.J.; Gonçalves, I.I. Assessing satellite-based basal crop coefficients for irrigated grapes (Vitis vinifera L.). Agric. Water Manag. 2010, 98, 45–54. [Google Scholar] [CrossRef] [Scilit]
- Elhag, M.; Yilmaz, N.; Bahrawi, J.; Boteva, S. Evaluation of Optical Remote Sensing Data in Burned Areas Mapping of Thasos Island, Greece. Earth Syst. Environ. 2020, 4, 813–826. [Google Scholar] [CrossRef] [Scilit]
- Pereira, L.S.; Allen, R.G.; Smith, M.; Raes, D. Crop evapotranspiration estimation with FAO56: Past and future. Agric. Water Manag. 2015, 147, 4–20. [Google Scholar] [CrossRef] [Scilit]
- Zhang, Y.; Peña-Arancibia, J.L.; McVicar, T.R.; Chiew, F.H.S.; Vaze, J.; Liu, C.; Zhang, X.; Zheng, H.; Miralles, D.G.; de Jeu, R.A.M. Multi-decadal trends in global terrestrial evapotranspiration and its components. Sci. Rep. 2016, 6, 19124. [Google Scholar] [CrossRef] [Scilit]
- USGS. Landsat 9 Level-2 Science Product Guide; USGS Earth Resources Observation and Science (EROS) Center: Sioux Falls, SD, USA, 2023.
- Elhag, M. Inconsistencies of SEBS model output based on the model inputs: Global sensitivity contemplations. J. Indian Soc. Remote Sens. 2016, 44, 435–442. [Google Scholar] [CrossRef] [Scilit]
- Moriasi, D.N.; Arnold, J.G.; Van Liew, M.W.; Bingner, R.L.; Harmel, R.D.; Veith, T.L. Model evaluation guidelines for systematic quantification of accuracy in watershed simulations. Trans. ASABE 2007, 50, 885–900. [Google Scholar] [CrossRef] [Scilit]
- Holik, A.; Elhag, M.; Alqarawy, A.; Psilovikos, A. Towards a Near-Real-Time Water Stress Monitoring System in Tropical Heterogeneous Landscapes Using Remote Sensing Data. Hydrology 2025, 12, 325. [Google Scholar] [CrossRef] [Scilit]
- Running, S.W.; Mu, Q.; Zhao, M. MOD16A2 MODIS/Terra Net Evapotranspiration 8-Day L4 Global 500 m SIN Grid V006; NASA EOSDIS Land Processes DAAC: Sioux Falls, SD, USA, 2019. [Google Scholar]
- Adem, E.; Alqarawy, A.; Elhag, M.; Bahrawi, J. Impact of satellite precipitation estimation methods on the hydrological response: Case study Wadi Nu’man basin, Saudi Arabia. Theor. Appl. Climatol. 2024, 155, 3907–3925. [Google Scholar] [CrossRef] [Scilit]
- Zaid, A.; Arias-Jimenez, E.J. Date palm cultivation in arid regions: Water management challenges. J. Arid Environ. 2022, 198, 104689. [Google Scholar]
- Consoli, S. Water requirements of date palm in Mediterranean climates. Agric. Water Manag. 2020, 241, 106338. [Google Scholar]
- Adem, E.; Elhag, M.; Alqarawy, A. Estimation of evapotranspiration based on METRIC and SEBAL model using remote sensing, near Al-Jouf, Saudi Arabia. Desalin. Water Treat. 2023, 290, 94–103. [Google Scholar] [CrossRef] [Scilit]
- Anderson, M.C. Remote sensing of evapotranspiration for water resources management. Agric. Water Manag. 2021, 245, 106618. [Google Scholar]
- Wang, K.; Dickinson, R.E. A review of global terrestrial evapotranspiration. Rev. Geophys. 2022, 60, e2021RG000749. [Google Scholar]
- Elhag, M.; Bahrawi, J.; Boteva, S. Input/output inconsistencies of daily evapotranspiration conducted empirically using remote sensing data in arid environments. Open Geosci. 2021, 13, 321–334. [Google Scholar] [CrossRef] [Scilit]
- Azzari, G.; Lobell, D.B. Landsat-based evapotranspiration mapping using GEE. Remote Sens. Environ. 2021, 258, 112369. [Google Scholar]
- Li, L.; Svoboda, M.; Xiong, L.; Feng, K.; Tang, C.; Chen, X.; Xu, X.; Wang, J. Elucidating diverse drought characteristics from two meteorological drought indices (SPI and SPEI) in China. J. Hydrometeorol. 2020, 21, 1513–1530. [Google Scholar] [CrossRef] [Scilit]
- Psilovikos, A.; Elhag, M. Forecasting of remotely sensed daily evapotranspiration data over Nile Delta region, Egypt. Water Resour. Manag. 2013, 27, 4115–4130. [Google Scholar] [CrossRef] [Scilit]
- Hersbach, H.; Bell, B.; Berrisford, P.; Hirahara, S.; Horányi, A.; Muñoz-Sabater, J.; Nicolas, J.; Peubey, C.; Radu, R.; Schepers, D.; et al. The ERA5 global reanalysis. Q. J. R. Meteorol. Soc. 2020, 146, 1999–2049. [Google Scholar] [CrossRef] [Scilit]
- Singh, R.K. Vegetation indices for estimating crop water use: A meta-analysis. Remote Sens. 2021, 13, 2987. [Google Scholar]
- Tamiminia, H.; Salehi, B.; Mahdianpari, M.; Quackenbush, L.; Adeli, S.; Brisco, B. Google Earth Engine for geo-big data applications: A review. ISPRS J. Photogramm. Remote Sens. 2020, 168, 203–220. [Google Scholar]
- Al-Zahrani, K.H. Groundwater sustainability in Saudi Arabia: Challenges and opportunities. Water Resour. Manag. 2021, 35, 2589–2607. [Google Scholar]
- Baawain, M.S. Water security in the Arabian Peninsula: A review. J. Environ. Manag. 2022, 304, 114276. [Google Scholar]
- Scanlon, B.R.; Fakhreddine, S.; Rateb, A.; Lahti, P.; Nezlin, J.; Becker, M.; Inam, A.; Shamsudduha, M.; Taylor, R.G.; Sorensen, J.P.R.; et al. Global water resources and the role of groundwater in resilience. Nat. Water 2022, 4, 45–57. [Google Scholar]

Disclaimer/Publisher’s Note: The statements, opinions and data contained in all publications are solely those of the individual author(s) and contributor(s) and not of MDPI and/or the editor(s). MDPI and/or the editor(s) disclaim responsibility for any injury to people or property resulting from any ideas, methods, instructions or products referred to in the content. |
© 2026 by the authors. Licensee MDPI, Basel, Switzerland. This article is an open access article distributed under the terms and conditions of the Creative Commons Attribution (CC BY) license.