1. Introduction
Urban areas are characterized by impervious surfaces such as roads, sidewalks, parking lots, and buildings covering vast areas, which prevent rainfall infiltration into the ground. In addition, the natural flow paths are replaced by paved gutters, storm sewers, or other artificial drainage elements that collect this surplus runoff and route it as fast as possible out of the urban perimeter. As a result, cities generate increased runoff volumes with increased peak discharges and shorter travel times compared to the pre-urbanized state [
1]. As cities constantly grow, increasingly more areas are changed from natural to urban areas. Precise modeling is required to design an urban drainage system (with overland flow paths and underground pipes) to cope with the additional discharge that otherwise would overflow and flood roads, houses, parks, etc. [
2].
Runoff is the surface flow of excess rainfall that does not infiltrate the ground or evaporate. The unit cell for runoff modeling is a watershed that may be of any size and can include secondary watersheds with secondary outlets (sub-watersheds) [
3]. Rainfall–runoff models are mathematical models that compute surface runoff in response to a rainfall input, and are an applicable tool for estimating runoff discharge and total volume, both from natural and urban watersheds [
4]. A drainage watershed is an area of land drained into a single point at a lower elevation, called the watershed’s outlet. Urban watershed land use (LU) has the greatest impact on surface runoff initiation because it dictates evapotranspiration and the degree of soil coverage [
5]. Runoff that travels faster to the watershed outlet might cause flooding once the watercourse slope moderates [
6].
Urban watersheds have various land uses with typical variations at the scale of a few meters, whereas, in natural watersheds, the typical watershed’s characteristic variation is over a larger scale (tens or hundreds of meters). To represent the watershed’s impervious and pervious areas, an urban rainfall–runoff model requires an LU classification as input [
3]. Surface topography is represented in Geographical Information Systems (GIS) by a Digital Elevation Model (DEM). A DEM is derived by the interpolation of known elevation points and their locations, which may be attained from physical measurements or photogrammetry of land, airborne, and orbital images. A DEM is typically presented using a raster data file (a form of grid dataset), where each cell contains an elevation value. The raster’s cells can be of any size, usually ranging from a few meters to a few kilometers. The raster’s cell size determination depends on available data, watershed scale, and technical considerations such as computation time, which surges as the resolution increases [
7,
8].
LU classification may be performed via remote sensing techniques based on satellite images or aerial photos, which also supply information regarding its spatial distribution within the watershed, dictating the runoff volumes that reach the watershed and the concentration time [
9]. The existing LU data vary in terms of accuracy and resolution. The United States Geological Survey (USGS) Land Cover Institute (LCI) has a free Land Use/Land Cover (LU/LC) database with a maximum resolution of 30 m. In Israel, the Central Bureau of Statistics offers a publicly available nationwide vector LU/LC classification. However, these classifications are composed of lumped (aggregated) classes, such as “urban areas” or “industrial areas”, without separating impervious and pervious surfaces and their specific land cover. Thus, this general classification could not be used in a distributed urban runoff model [
10].
To accurately simulate the watershed’s ability to infiltrate rain, all data layers must be integrated into a GIS project with optimal spatial scaling that reflects the watershed’s ability to infiltrate runoff [
11]. The challenge in attaining such an optimal modeling resolution involves enabling the interpolation of lower-resolution data layers into higher-resolution projects in a coherent manner with sufficient resolution to accurately reflect runoff sources, sinks, and flow paths. In urban areas, the variety of complex juxtapositions demands variable surface illustration scales to represent typical compositions [
12]. Once the urban area slope range is as wide as in mountainous terrains and the surface infiltration rate differs over close distances, such as in the study area case [
1], no single modeling platform is capable of multi-scale processing and finding the optimal modeling resolution is essential. Model resolution is also reflected by model LU/LC permeability attribution, while a low-resolution model that needs to address knowledge uncertainties is considered lumped; once the dataset reflects the properties of an entire watershed or more, a spatially distributed model can be applied. In model scaling, there is a tradeoff between model accuracy and model resources, as a large scale that demands less data and computing resources than a fine scale is usually less accurate [
13].
Nonetheless, a lower resolution or larger scale may be used as a filter that prevents the bias of minor runoff routing trends that are redundant in matters of runoff routing at the entire watershed scale or the water balance of adjacent watersheds [
2]. Since accurately simulating and predicting runoff in urban karstic mountainous watersheds is yet an unresolved challenge, this study’s objective was to develop a nominal modeling methodology for such terrains. This involved finding an optimal spatial scale for a distributed rainfall–runoff model by evaluating several spatial resolutions and validating that the nominal DEM resolution chosen correctly represents the sub-basin hydrologically. Another aspect was the LU/LC classification, which involved the fusion of various datasets and remote sensing classification methodologies to obtain a correct illustration of the watershed. Finally, a correct modeling procedure involved the integration of several models over a GIS platform.
2. Materials and Methods
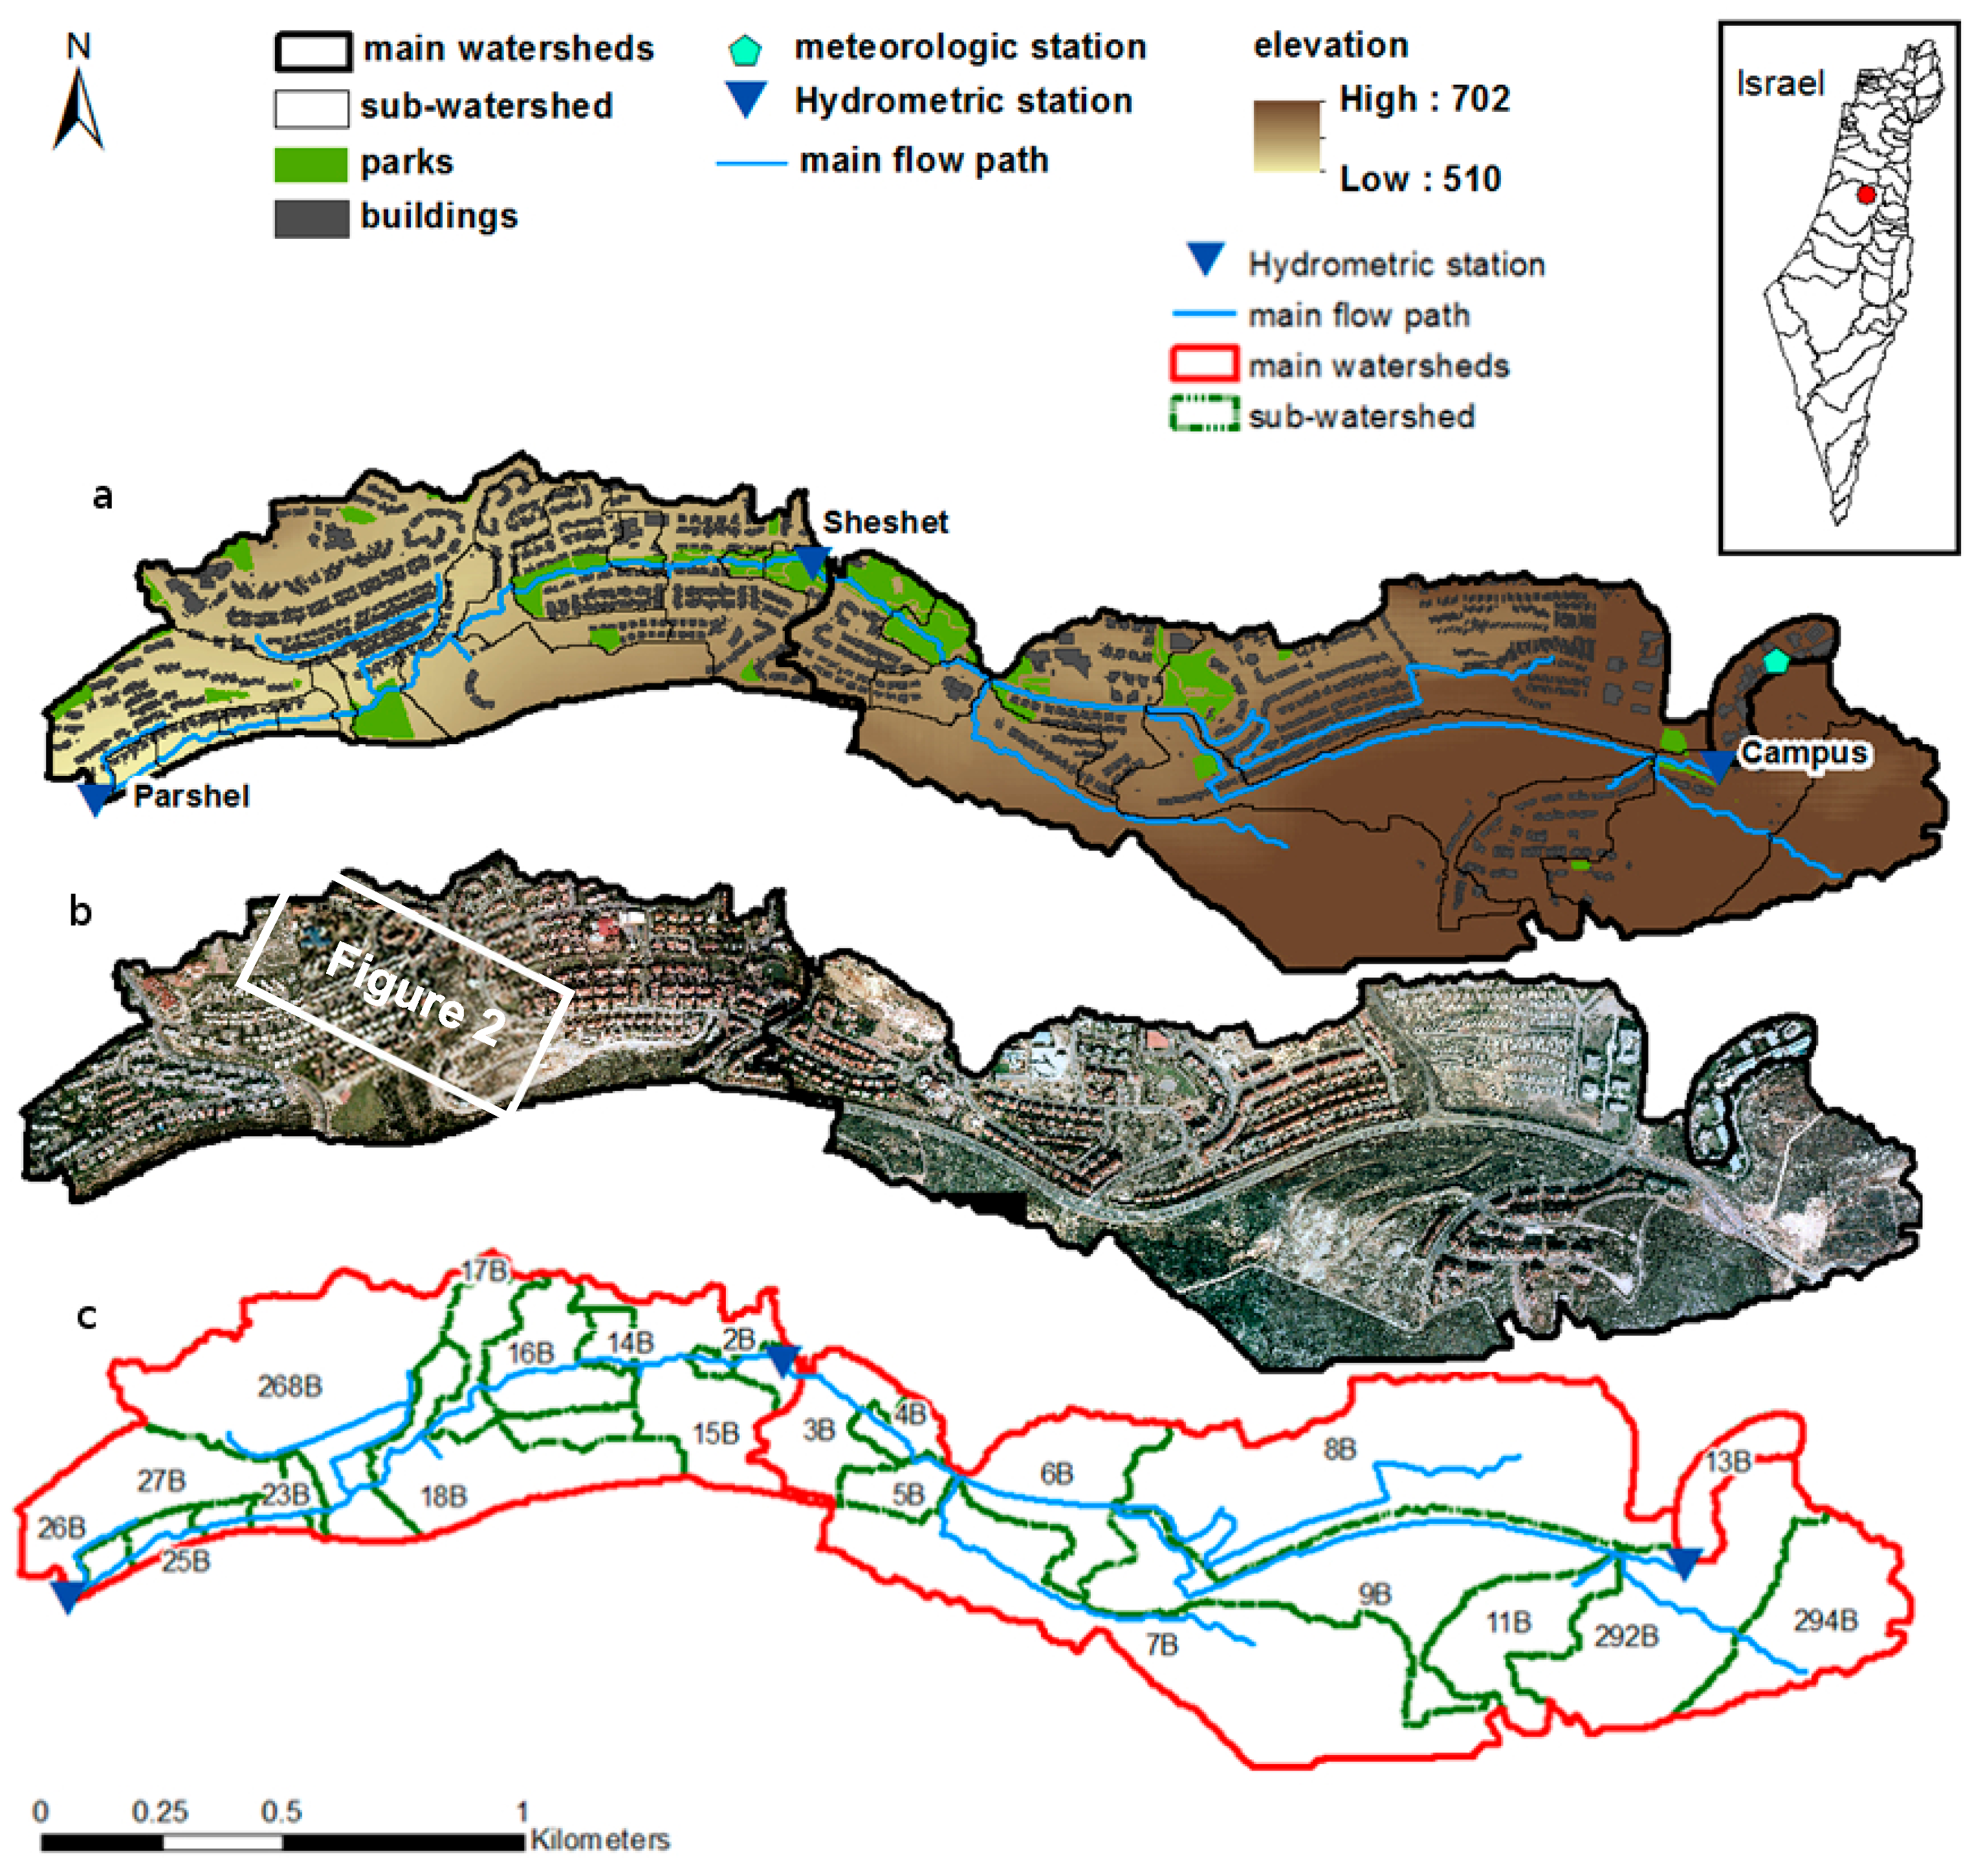
Owing to slope and surface permeability variability, mountainous karst urban watersheds are likely the most complicated scenario for hydrological modeling. To develop a methodology for a spatially distributed high-resolution rainfall–runoff model that can handle such terrain, the study site should be equipped with a monitoring system capable of measuring sufficient components of the hydrological system. The city of Ariel is equipped with a hydrological monitoring system that was constantly operating for six years before this study, which includes three hydrometric stations at the sub-watersheds outlet and a meteorological station that measures rain thickness, temperature, radiation, and wind velocity and direction, which enabled the calculation of evapotranspiration (
Figure 1).
Figure 1.
Study site location map: (
a) names of the sub-watersheds and illustration of built-up areas, parks, and the main flow path through the city;
Figure 2 location is the white square; (
b) aerial-photo; (
c) subdivision of the main watersheds to sub-watersheds according to dominant flow type and streamline pathways.
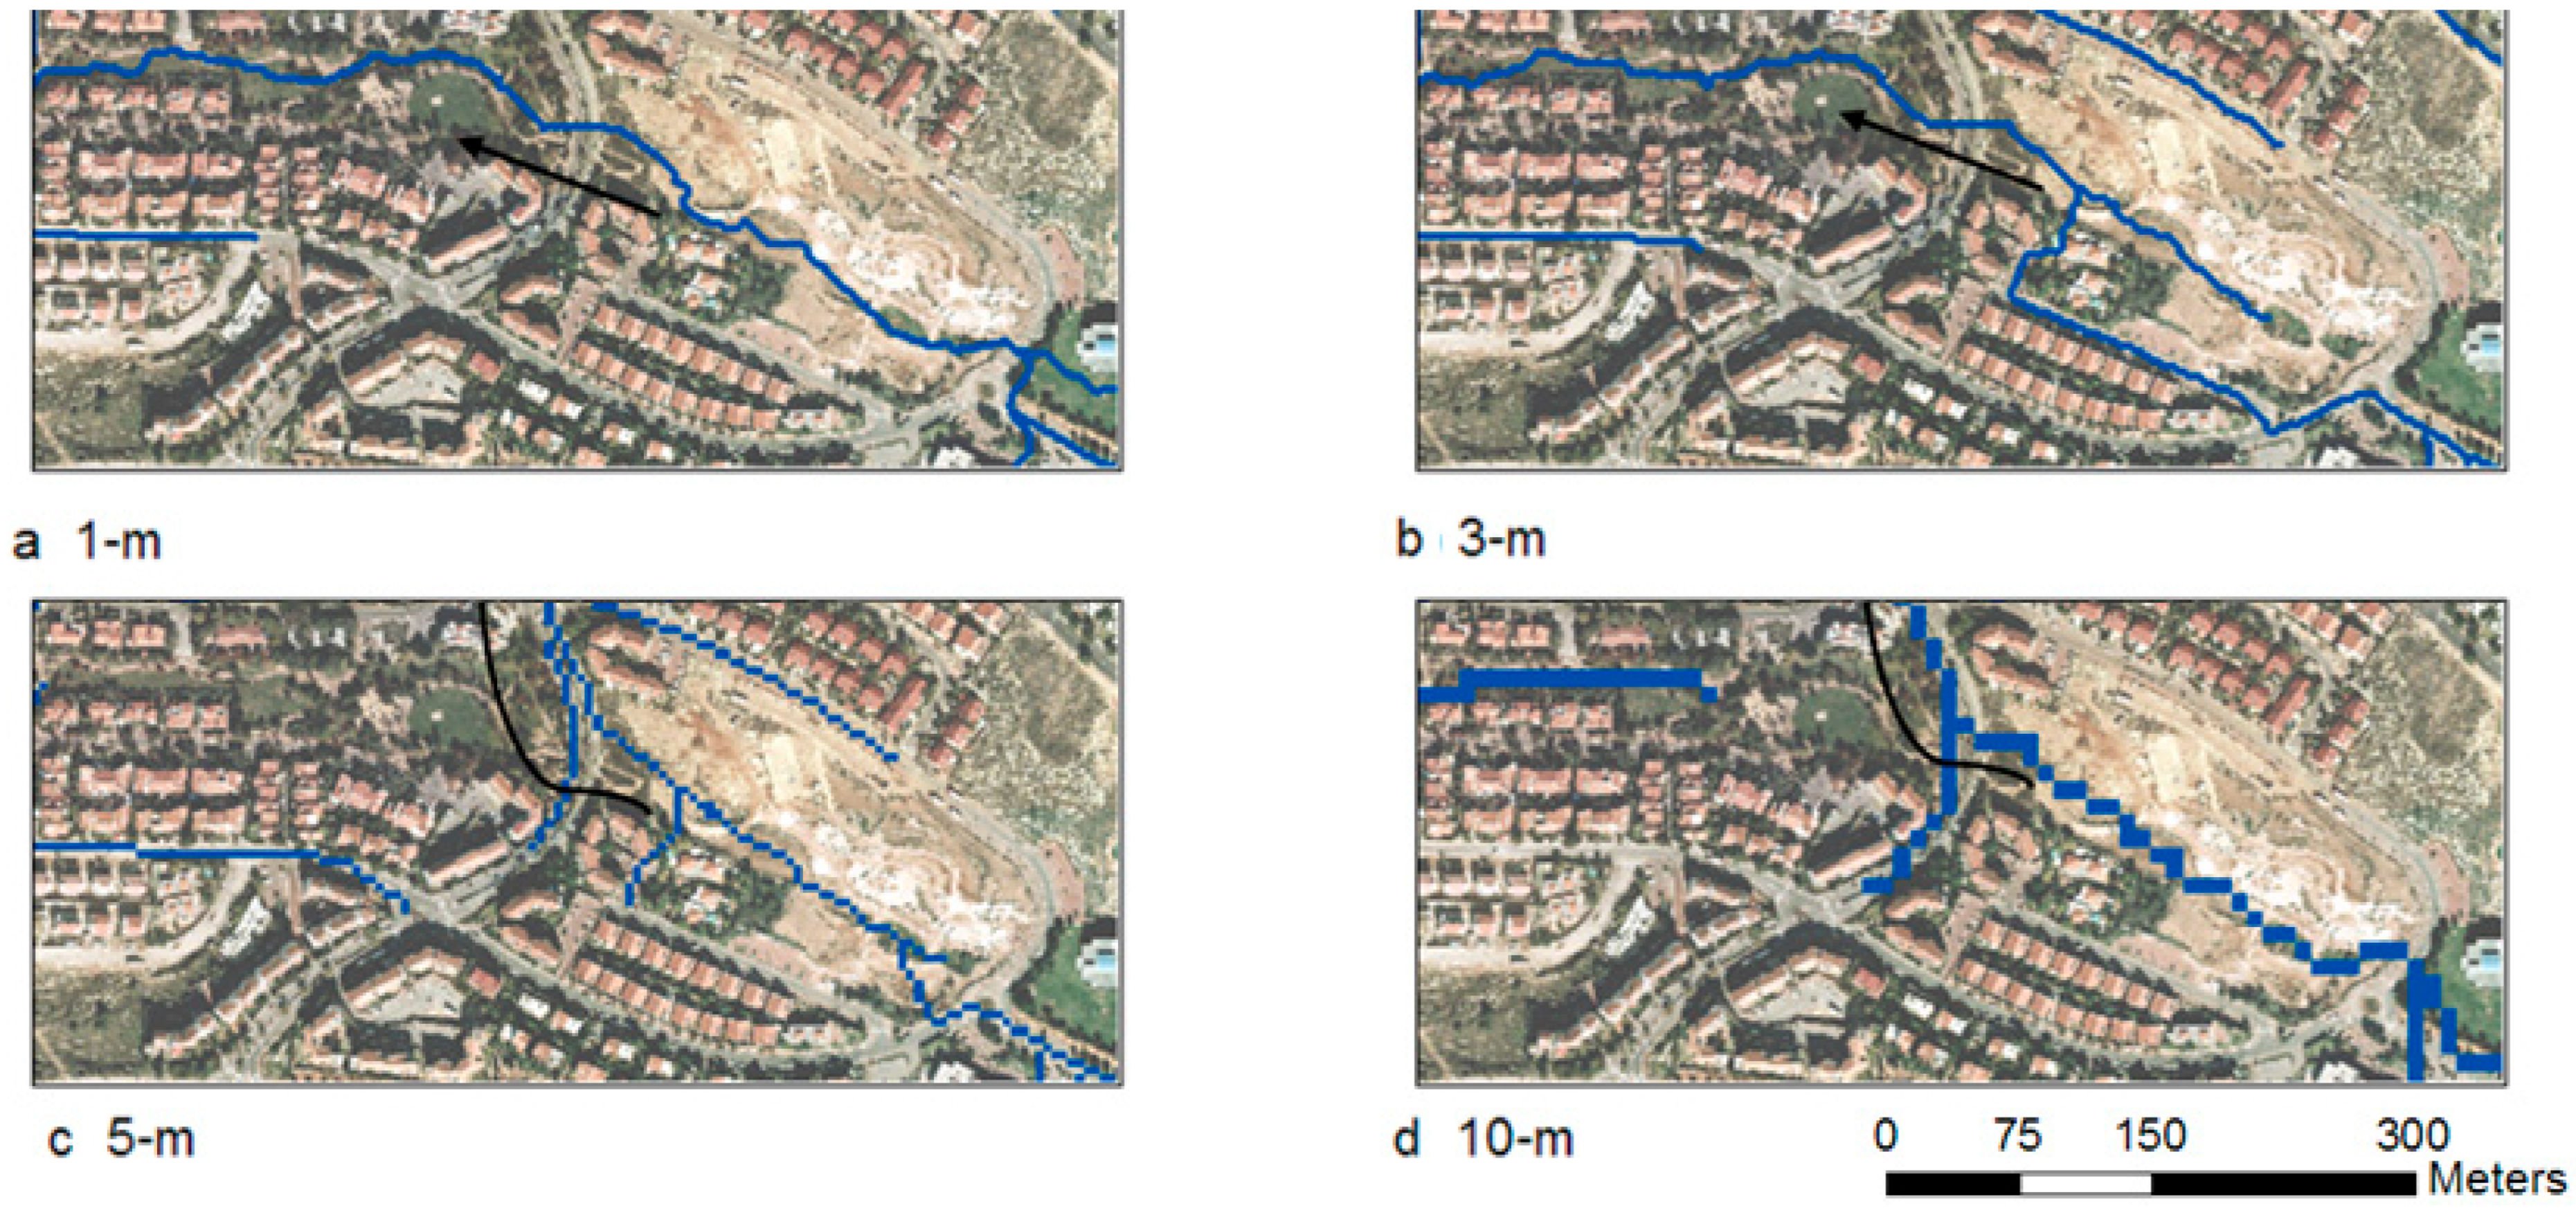
Figure 2.
Comparison of flow path delineation from DEMs that were derived directly from elevation data (contours, height points, etc.) using various cell sizes: (a,b) reproduction of the actual flow path, which is from east to west along the park, while (c,d) delineate an incorrect north-flowing path.
2.1. Study Area
The city of Ariel is located on Israel’s central mountain rim (Samaria Mountains), which is included within the Yarkon-Ayalon 1800 km
2 watershed that flows through Israel’s largest metropolitan area to the Mediterranean Sea, and is one of the largest watersheds in Israel [
14]. The mountain range comprises Terra Rossa and Rendzina soils on top of hard, fractured limestone and dolomite with karstic features [
15]. The regional lithology is karstic Judea group dolomite and limestone, demonstrating typical Eastern Mediterranean morphology that includes both epikarst, such as fissures and a developed cave system that efficiently drains runoff down to the groundwater level [
16]. This mountain range serves as the recharge zone of the mountain aquifer, which is Israel’s most crucial water resource in terms of quantity and quality. The average water table depth of a regional aquifer is approximately 300 m below the surface of the study area [
17]. The total size of Ariel’s urban watershed is 1.9 km
2, defined as the outlet at the southwest point on the ephemeral stream (wadi) that crosses the city (
Figure 1). Ariel sprawls over a few mild hills and the wadi between them, with a maximal elevation of 702 mASL and a minimum elevation of 509 mASL.
The stormwater gravitational drainage network is designed according to the city’s topography. As in many rapidly developed urban areas, information regarding the drainage system’s pipe location, dimensions, and connectivity is not adequately documented, and with a datum and scale that might change along different stages of development, to the point that it might be considered missing or redundant [
11]. While in flat urban areas the drainage is less dependent on surface relief, in a mountainous area it is reasonable to assume that it is highly correlated with the topography. In addition, the drainage network has a few known outlets where it discharges the collected runoff from higher parts of the city into a lower wadi, which serves as a city park with a stream in its midst. The Park stream serves as the watershed’s central flow path. Unlike other mountainous karstic cities in Israel, a hydrologic database of monitored runoff discharge in Ariel was gathered in a few locations along its main flow path from 2006 until 2013. Since the area’s regional development post-2012 has been significantly changed through the construction of a shopping mall near the study area terminal outlet, and with ongoing construction going on to present, the research period was limited to 2006–2012.
The study area is divided into three sub-water shades, equipped with flow velocity measuring devices at their outlets. Rainwater accumulation and runoff start at the upper part of the city at the Ariel University “Campus” watershed. The city’s middle elevation area is monitored at the Stream Park “Sheshet” runoff monitoring station, and the lower elevation area runoff routing and rainwater accumulation are monitored at the “Parshell” monitoring station. Rainfall volume and Penman–Monteith evapotranspiration [
18] from interpolation of relative humidity, temperature, sun radiation, and wind velocity and direction were measured at a meteorological station located at the Campus sub-watershed. The Campus sub-watershed area is 0.03 km
2, the Sheshet sub-watershed area is 1.207 km
2, and the Parshell sub-watershed area is 0.66 km
2. The total area of the Ariel watershed, which ultimately drains through the Parshell outlet, is 1.9 km
2 (
Figure 1).
2.2. Digital Elevation Model (DEM)
To represent a small-scale variation in the urban surface, an accurate DEM is required. While many studies have suggested that DEM quality and resolution significantly affect the accuracy of any extracted hydrological parameter [
19], some studies have indicated that a resolution that is too high might create chaotic flow patterns, which can be avoided by reducing the DEM resolution from centimeters to meters [
20,
21]. Comparison of a high-resolution 1 m LiDAR DEM to a 25 m cartographic DEM, in various resolutions, indicated that the input DEM resolution accuracy severely impacts the derived hydrologically spatial properties [
22]. LiDAR is a remote sensing (RS) technique for elevation mapping that uses distance measurements by illuminating the target with a laser and analyzing the reflected light arrival time. LiDAR has a very high sampling density, which produces very-high-resolution DEMs of less than 1 m [
23]. While LiDAR has advantages for urban hydrology models, it has higher costs and processing resources than the high-resolution photogrammetric DEMs used in the current study.
Since even high-resolution DEMs with a resolution of a few meters might be insufficient to capture the fine urban topography [
24], DEM reprocessing and correcting are commonly used to represent the hydrologic properties of urban watersheds. A standard processing technique enforces the known flow paths by artificially reducing the DEM cell elevation by a specified height. This is performed to ensure that they are lower than their surroundings, as in reality. This technique, known as “DEM burning”, improves hydrological derivation [
23]; following a sensitivity assessment, an elevation adjustment of 20 cm, that also reflects a typical road curbstone height, was used to burn artificial drains. Assessing the minimal necessary resolution for correctly delineating the urban watershed’s flow paths and boundaries involves performing terrain, flow path, and water divide line modeling at various DEM scales [
7]. A high-resolution DEM was created from photogrammetric-derived contours with a vertical interval of 0.5 m, and resampled to resolutions of 1 m, 2 m, 3 m, 4 m, 5 m, 10 m, and 25 m. Within the urban watershed itself, areas such as parking lots and areas that may be considered natural have a less complex feature assembly than residential areas. A variable resolution that reflects the minimal necessary resolution assessment was used for different areas of the urban watershed for the modeling stage. This approach applies the finest possible resolution to areas transporting the most runoff (e.g., streams), whereas coarser resolution applies to areas with less hydrological impact.
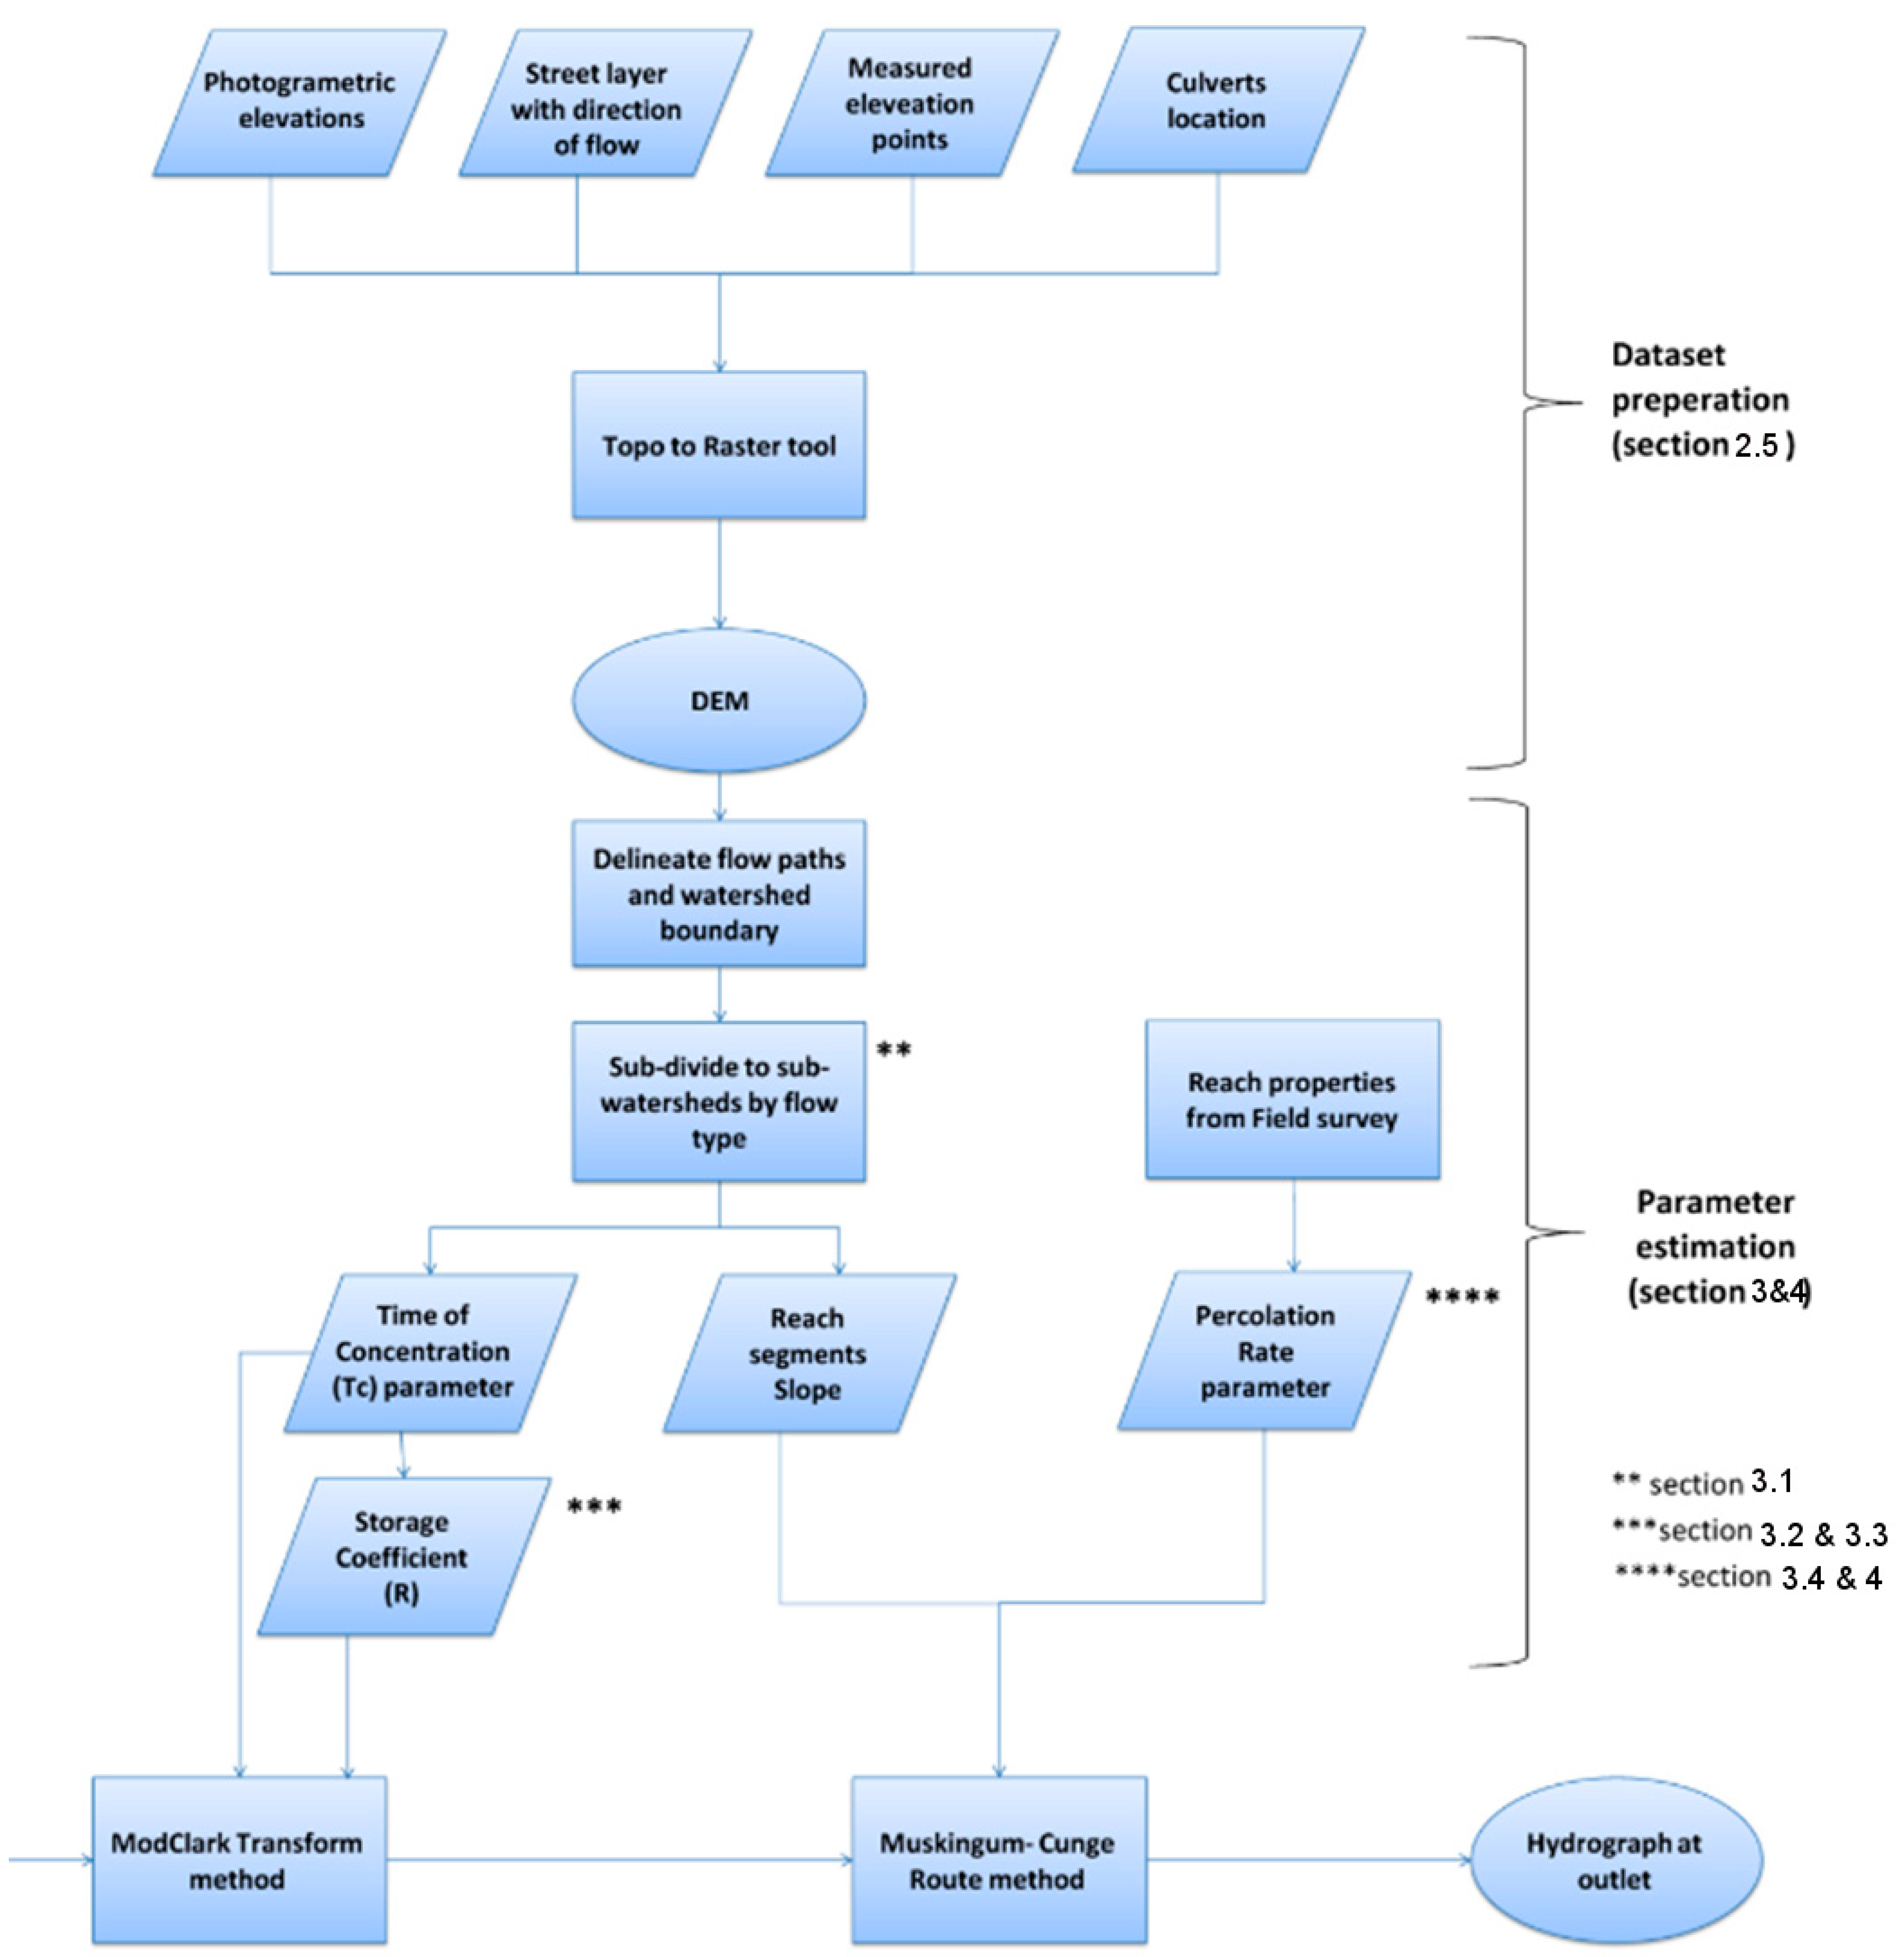
The DEM was generated using ArcGIS’s Topo To Raster tool, an interpolation method designed to create hydrologically correct DEMs [
8]. This DEM shows Ariel’s natural topography without the effects of urban features. The DEM was corrected using the city engineering department’s measurement data of road slopes and other flow paths, and by applying field survey data of culvert locations and drainage lines. This analysis determined the minimum necessary resolution for correctly delineating the urban watershed’s flow paths and sub-basin boundaries. For the 50 cm vertical resolution, a differential spatial resolution was applied, with the highest resolution of 1 m, but mostly 4 m, along the “burnt” streamlines and around the runoff velocity sampling stations (blue triangles in
Figure 1), which was reduced proportionally to the anticipated runoff volume towards the sub-basin divide lines and in hydrologically homogenous areas. The DEM resolution effect on runoff routing was evaluated both by visual verification on-site during rain events and by comparing hydrograph simulations for the different DEMs (See
Appendix A.1).
2.3. Land Use/Land Cover Classification
Medium-resolution orbital sensors such as Landsat Thematic Mapper (TM) (at 30 m pixel resolution) and SPOT High-Resolution Visible (HRV) (at 20 m) are commonly used for land cover classification [
25]. Since feature distinction within the pixel resolution is not applicable, these sensors are irrelevant for urban watershed classification. In contrast, high-resolution imagery, such as an orthophoto, is more suitable [
26]. With pixel sizes as small as 0.5 m, orthophotography can provide greater detail in complex urban areas and has been used successfully in some studies. The authors of [
10,
27] explored the potential of very high-resolution (VHR) optical images (0.5–2.5 m) for retrieving LU/LC information for distributed hydrological models, and concluded that, for watersheds at the scale of a few km
2, manual digitizing based on 0.5 m resolution images was accurate enough to supply information about natural and impervious areas, hedgerows, the vegetation type, and rotation and bare soils, which significantly improved model parameterization. However, manual digitizing is time-consuming and prevents procedure automation.
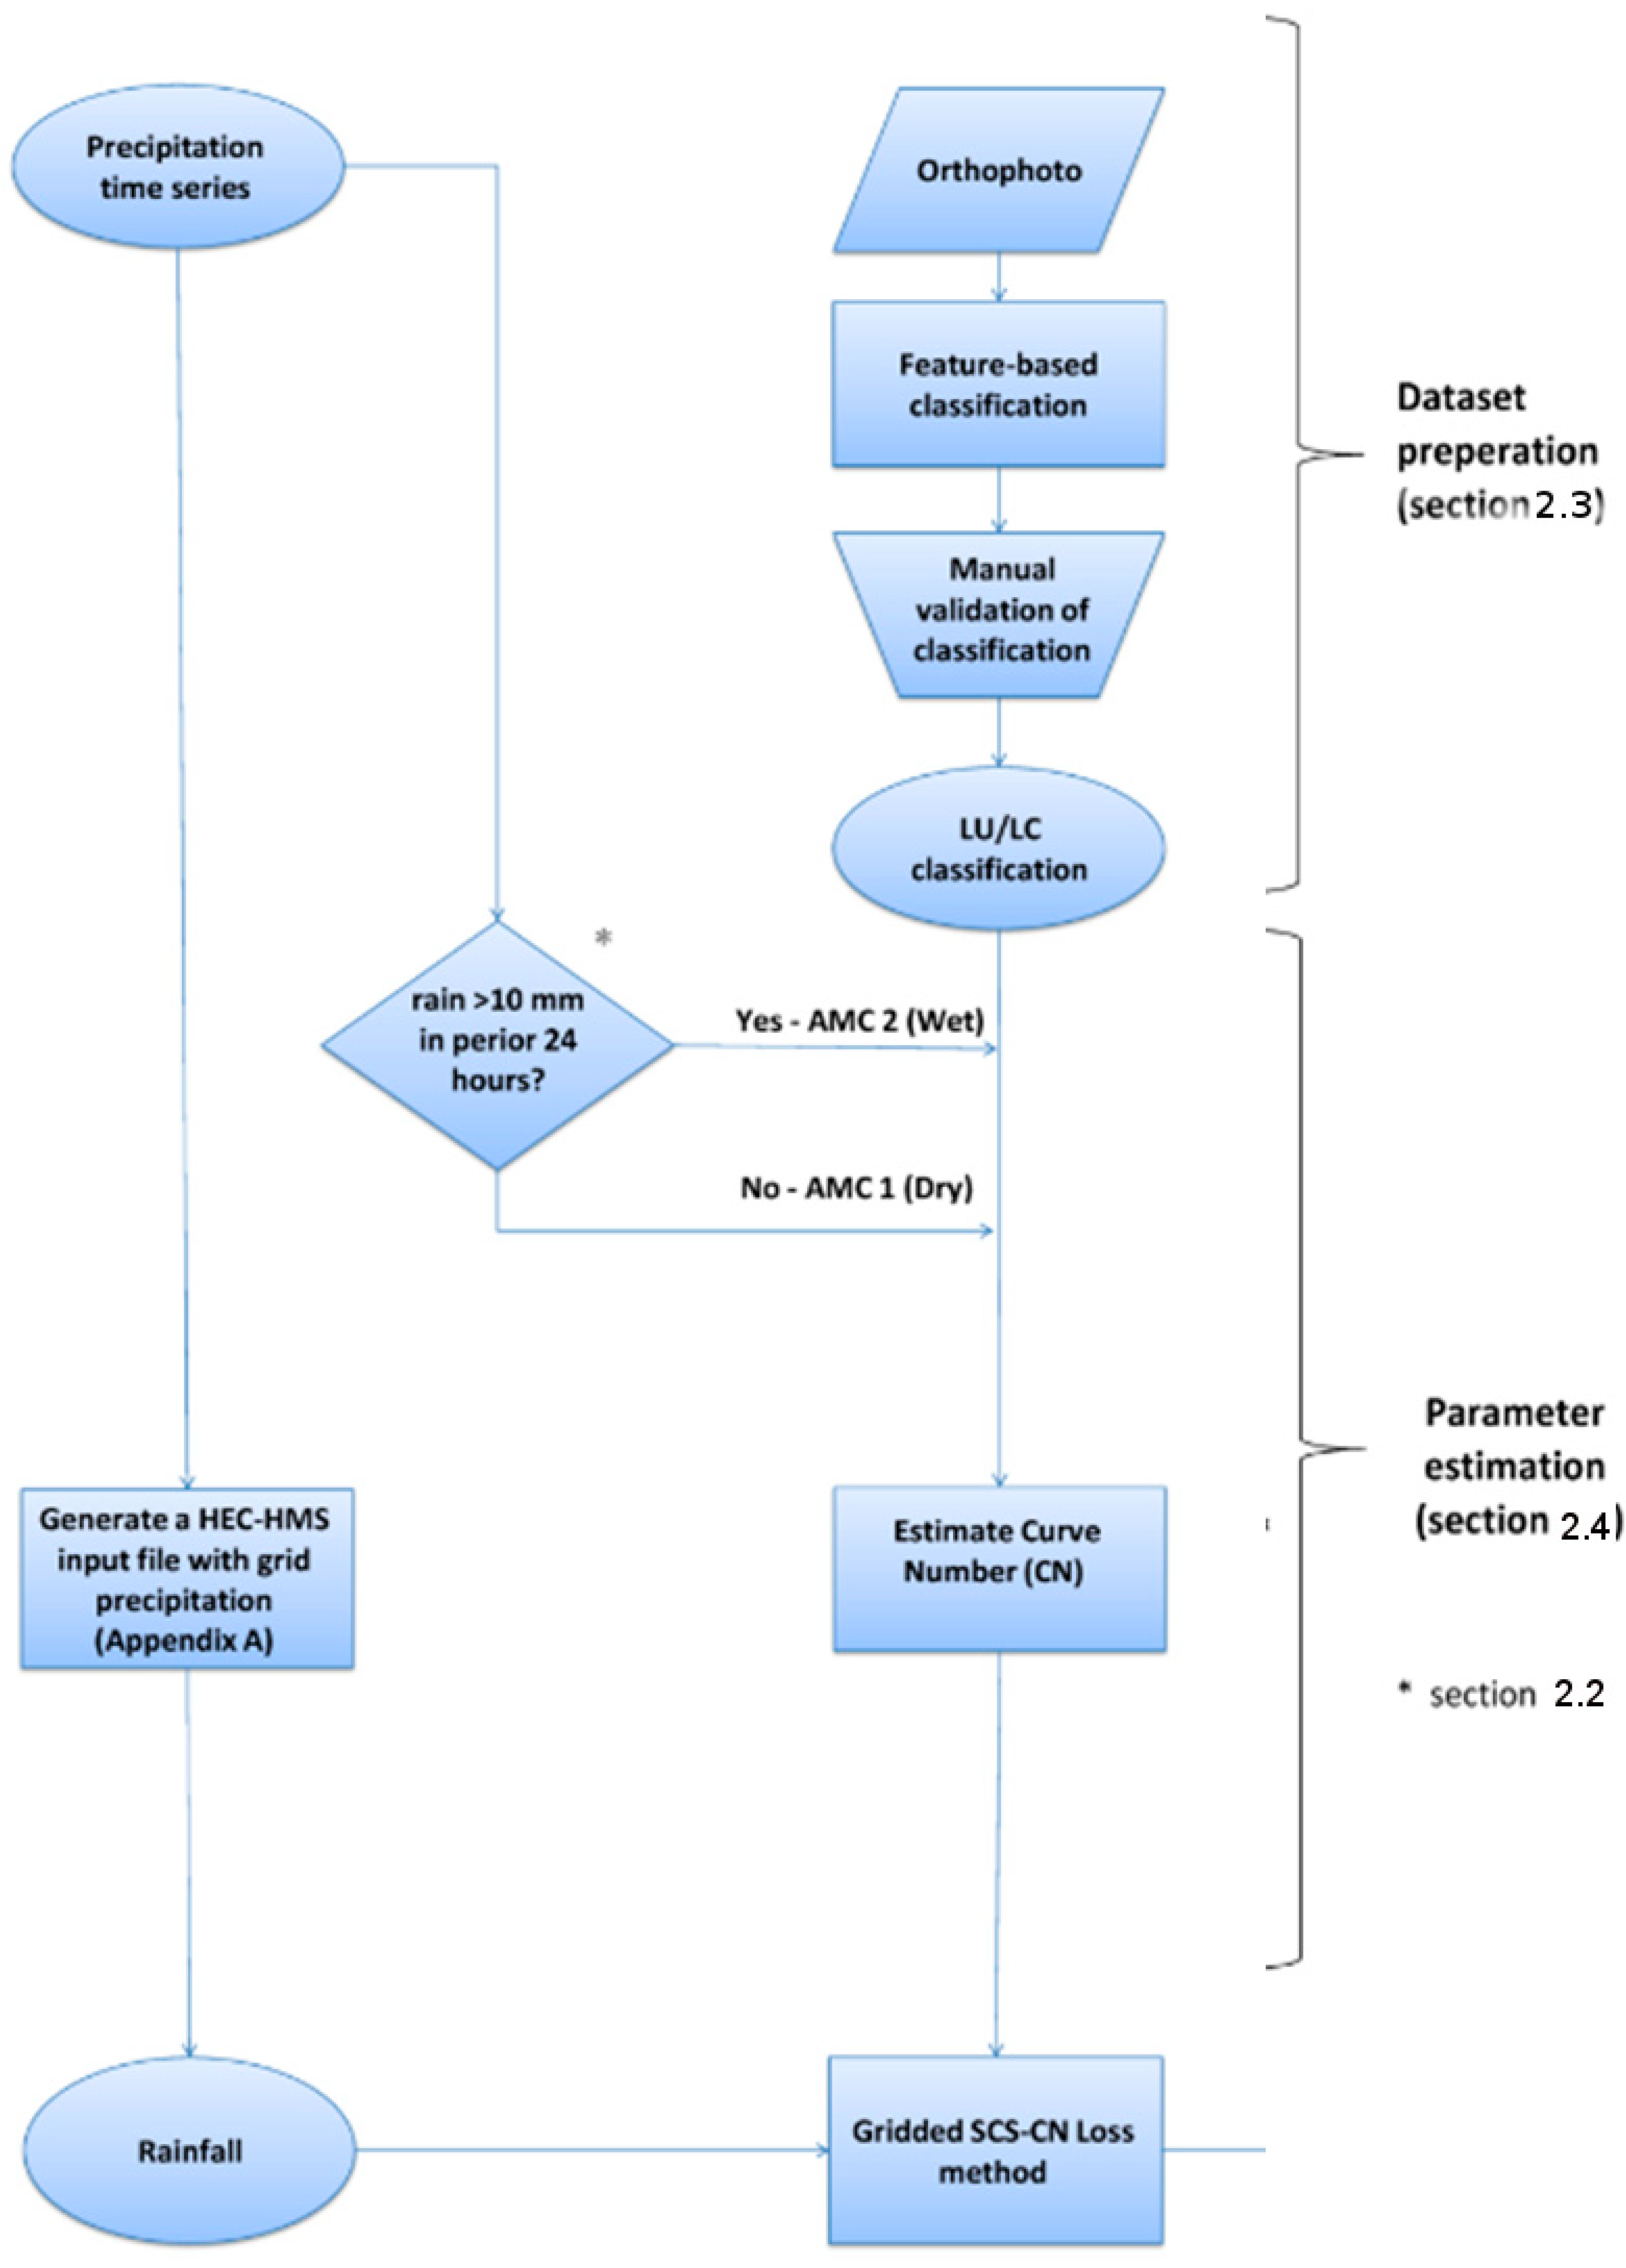
A very-high-resolution (0.2 m) RGB orthophoto of the study area, taken in 2006, was classified into five LUs. Since different LUs may have a similar visible spectrum in three bands, a feature-based classification was implemented. The orthophoto tiles are enhanced via histogram matching and histogram stretching techniques, and are mosaicked into a single image. The shaded areas were masked and then classified separately to overcome shading from buildings and trees. The image analysis software ENVI EX, with the feature extraction module, was used to extract information from the high-resolution imagery based on spatial, spectral, and textural characteristics instead of traditional pixel-based classification.
The object-based approach allows objects to be classified according to their shape, size, texture, and spectral properties. The k-Nearest Neighbor (KNN) algorithm was used as a supervised classification method with K = 3. For both classifications, a training dataset is prepared by manually selecting objects that belong to each class. Supervised classification is then performed on the entire image using the training data. The feature extraction process starts by partitioning an image into segments by grouping neighboring pixels with similar feature values (brightness, texture, color, etc.). These segments ideally correspond to real-world objects. The edge-based segmentation algorithm has a single Scale Level parameter ranging from 0 to 100, with high values for coarse segmentation and low values for fine segmentation. The merging process is an additional optional step to aggregate small segments within larger, textured areas, such as trees or fields. The Merge Level parameter represents the threshold lambda value [
28], which ranges from 0 to 100, where low values may result in over-segmenting and high values in under-segmenting (See
Appendix A.1).
2.4. Modeling Application
The United States Corps of Engineers Hydrologic Engineering Center’s Hydrologic Modeling System (HEC-HMS, V 4.2) was found to be the most suitable platform for this study, as it implements the semi-distributed ModClark Transform method [
29], which may be coupled with grid-based loss methods for reflecting heterogeneous infiltration velocities in karstic streams. HEC-HMS is designed to simulate the precipitation–runoff processes of various watershed systems and applies to a wide range of hydrological problems. HEC-HMS is publicly available free software, and the parameters and input files for the selected models can be derived using any GIS program or designated tools such as HEC-geoHMS for ArcGIS [
30].
In HEC-HMS,
is selected as the minimum of the following: the user-defined step time, the travel time through the reach, or 1/20th the time to rise of the peak inflow with the steepest rising limb, rounded to the nearest multiple or divisor of the user time step [
29]. Once
is chosen, HEC-HMS computes
as
As
c is the velocity of the flood wave as it passes a reach segment, ∆
x 1 is constrained such that
where
So is the bed slope,
Qr is a reference flow computed from the inflow hydrograph as 1/2 Q
peak, and
B is the top width of the water surface.
The modeling period consisted of seven winters from 2006 to 2012, which involved rain and runoff sampling of the entire Ariel watershed in three sub-basins along the flow path. The sub-basin runoff sampling was performed via automatic water level gauges that measured the runoff level flowing through a known cross-section (V-notch and Parshall flumes) with manually calibrated flow velocities to measure water levels. Valid events were defined as rain events starting with the beginning of rainfall, provided that the measured discharge was zero for at least four hours before the rain started; an event ends after the rainfall ceases and only when the discharge equals or tends to zero at all hydrometric stations. Atmospheric parameters such as rainfall, wind speed, humidity, radiation, and temperature were attained from the meteorological station at Campus sub-water shade, while assuming uniform conditions throughout the whole water shade enabled the calculation of the evapotranspiration component. The grid-based loss method chosen for this study is the Soil Conservation Service (SCS) Curve Number (CN) method, which is the official and perhaps the most widely used approach for small urban watershed hydrology in the U.S., and is becoming popular in other continents [
31,
32]. The SCS-CN method imitates the observed rainfall–runoff behavior; when the accumulated runoff (Q) is plotted versus accumulated rainfall (P), runoff starts after some rainfall has accumulated, and the line curves become asymptotic to a line of equality. Determining an equation for a curve that describes this pattern is by empirical and not physically based derivation, but with statistically valid mass conservation. While the Curve Number runoff equation is not a direct infiltration equation, it can estimate all runoff losses within a certain perimeter [
33] (See
Appendix A.2).
2.5. Model Evaluation
The Nash and Sutcliff coefficient of Efficiency (
NSE, Equation (3)) is used to evaluate hydrologic model performance [
34,
35]. This efficiency coefficient ranges from minus infinity to 1.0, with higher values indicating better agreement, as follows:
where
is the observed discharge in time increment
i,
is the predicted model simulation discharge in time increment
i and
is the mean of observed discharge, and
N is the last time increment.
Physically, the
NSE is the ratio of the Mean Square Error (
MSE) (Equation (4)) to the variance in the observed data, subtracted from unity.
Thus, if the square of the differences between the model simulation and the observations is as large as the observed data variability, then , and if it exceeds it, then
Thus,
indicates that the observed mean is as good a predictor as the model, while
indicates that the observed mean is a better predictor than the model (both are unacceptable results).
is a perfect fit, while
is considered a satisfactory model performance [
36].
Another acceptable statistical indicator is the percent bias (referred to as the deviation percentage). The deviation percentage measures the average tendency of the simulated data to be larger or smaller than their observed counterparts [
37]. The optimal value of the deviation percentage is 0.0, with low-magnitude values indicating accurate model simulation. Positive values indicate model overestimation bias, and negative values indicate model underestimation bias. The deviation percentage (
D%) was calculated via Equation (5) as follows:
where
indicates the observed model element at time
i and
indicates the simulated model element at time
i. General performance ratings for the
NSE and deviation percentage [
36] are summarized in
Table 1.
3. Results
The detailed DEM preparation of the Ariel watershed involved the integration of available municipal GIS data and data collected from field observations. As the city’s stormwater gravity drainage system information was incomplete, a thorough field survey was performed to locate the drainage network discharge to open areas. Assuming that the drainage network correlates with the street paths and slopes, they serve as the main flow paths. As all roads and their flow directions are burnt into the DEM, the derived terrain surface represents both overland flow on streets and flow in pipes in the drainage network. The data interpolation enabled the production of the following base layers:
Vector layer of photogrammetric-derived contours with a vertical interval of 0.5 m in non-built-up areas.
Vector layer of local height measurements along all the roads in the city.
A road layer, including the flow direction of each road segment.
Line layer of culvert location and flow direction derived from the field survey.
3.1. DEM Scale Effect
Qualitative analyses were conducted to determine the proper DEM cell size for urban watershed delineation for the entire study site’s basin and sub-watersheds. DEMs of various sizes were independently derived from the single GIS dataset: 25 m, 10 m, 5 m, 4 m, 3 m, 2 m, and 1 m. The watershed delineation procedure was performed on each of the DEMs. The stream layers generated according to the DEMs were compared to known flow paths. DEMs with cell sizes of 1 to 3 m could directly produce the flow path correctly, whereas DEMs of 4, 5, 10, and 25 m failed. The lower-resolution DEMs (4 m and above) indicated that the flow path of the wadi in the park was discontinuous and curved north, although this was inconsistent with the observed topography and road slope.
The actual flow path continues through a culvert under the road and down to the city park’s stream (
Figure 2), which was derived correctly from the 1 m and 3 m DEMs. In DEMs with resolutions coarser than 3 m, streamline path errors are manifested by the sub-watershed’s incorrect delineation. This resulted from the representation of the small-scale topography by the small cells (1–3 m) of high-resolution DEMs, which the larger cells of lower-resolution DEMs (4, 5, 10, and 25 m) could not capture (
Figure 3). Since running hydrologic models at a 1 m resolution was assumed to exceed a reasonable computation time 23, there was a need to reduce the resolution and conserve the correct flow path and watershed boundaries.
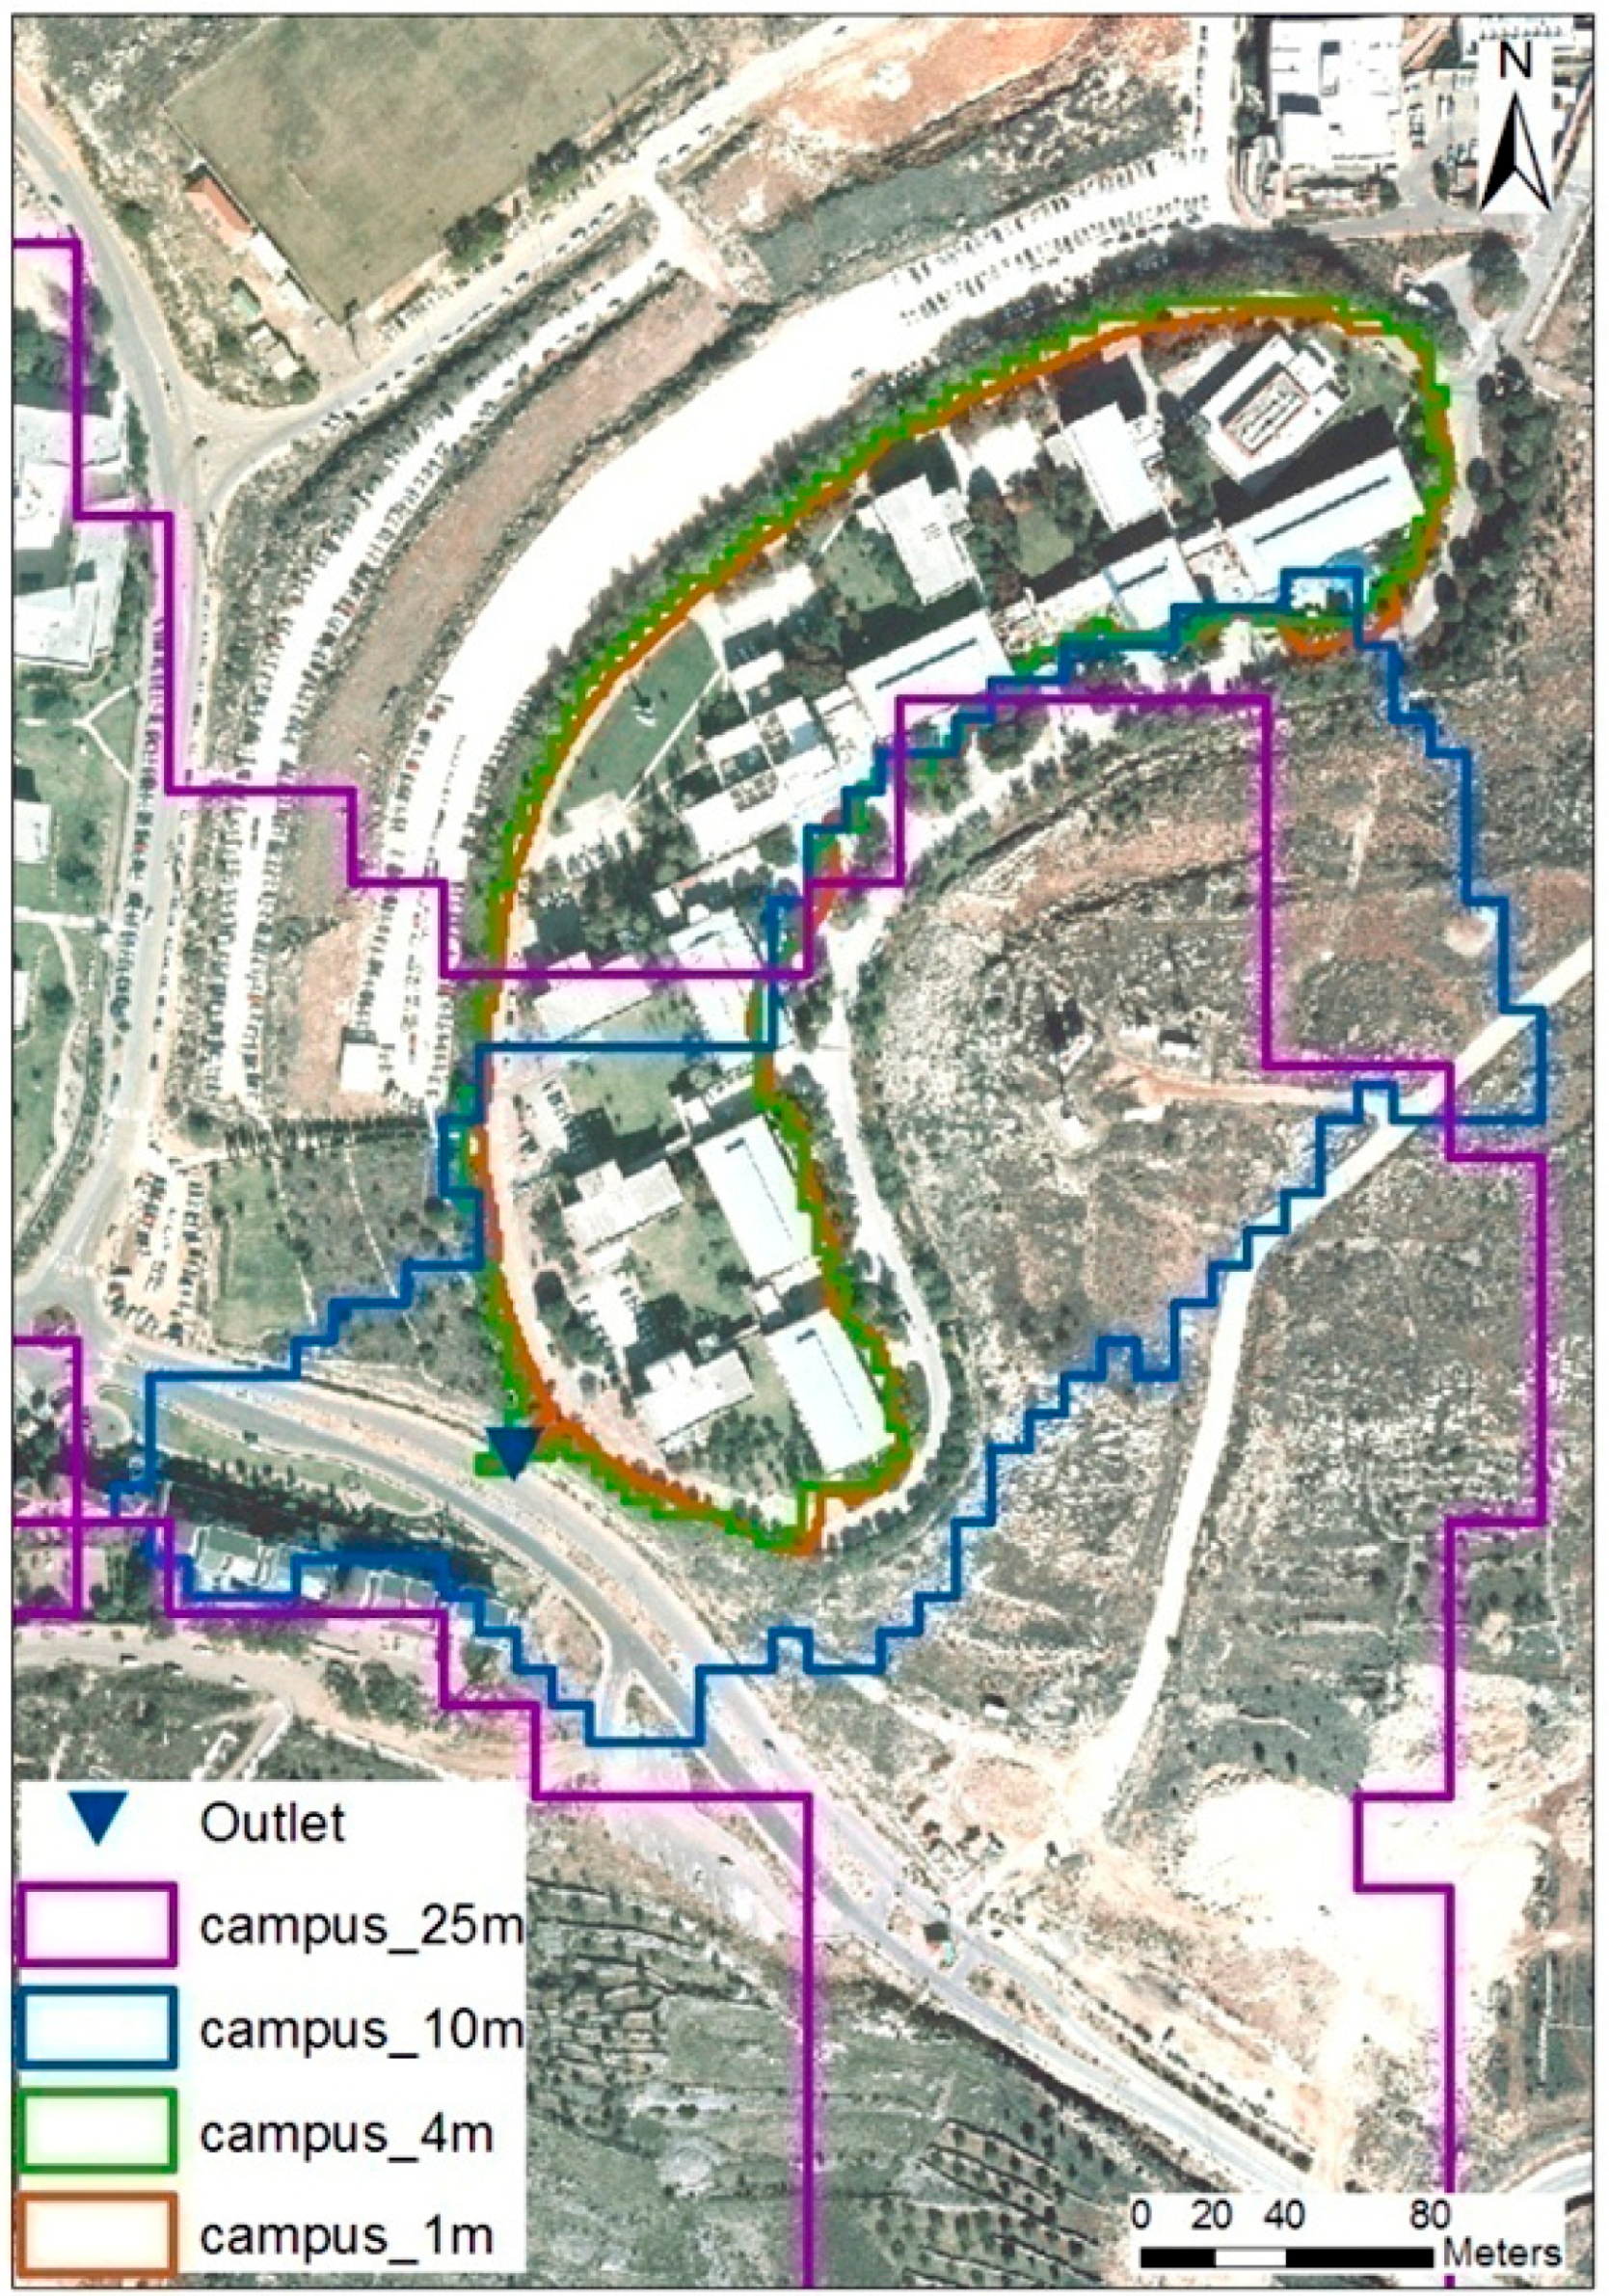
The most accurate DEM of 1 m was used as the basis for the derivation of coarser-resolution DEMs, indicating that the loss of details by resampling the higher-resolution DEM to a coarser resolution is much less compared to the details captured in an a priori coarse-resolution DEM. Using nearest-neighbor interpolation (NNI), the DEMs were resampled for selected 4 m, 10 m, and 25 m cell sizes, after which the streets and culverts were burnt. Watershed boundaries were delineated using each of the resampled DEMs and compared. The general watershed border derived via a 1 m DEM was the smoothest and most accurately described the smallest Upper Campus sub-watershed. The 10 m and 25 m DEMs could not capture the Upper Campus sub-watershed at all, and the general watershed border was very coarse. A comparison of the Upper Campus sub-watershed border is shown in
Figure 1. Finally, the 4 m DEM produced using the NNI and urban feature imprint was most similar to the 1 m DEM, and was selected for hydraulic model simulation. NNI and urban feature fusion to the DEM enabled the use of a 4 m DEM instead of a 3 m DEM, which was the coarser option for stream delineation at the initial assessment stage (
Figure 2). Following the development of the modeling method for the Ariel University Campus watershed (
Figure 3), the watershed analysis and flow path modeling results were extrapolated to the entire city (
Figure 1).
3.2. Land Use Classification
There are many techniques for automatically classifying land cover information from remotely sensed satellite imagery with the aid of GIS. Traditional classification methods use typical reflectance characteristics of relevant land covers and various pixel-by-pixel classification algorithms, such as the maximum likelihood classifier (MLC), to assign each pixel to the land cover class it best matches. However, some acknowledged weaknesses when mapping urban areas using pixel-by-pixel classification algorithms include the imperfect differentiation of anthropogenic surfaces, such as concrete, from soil features [
38]. These algorithms do not account for important semantic/spatial information required to interpret the image. Other classification approaches are supplied by image segmentation techniques, which are often advantageous when high-resolution data are used. These algorithms use both spectral and spatial information, and generate pixel groups (clusters) that are spectrally homogeneous and recognizable as landscape segments. This method has been successfully applied for high-resolution classification [
39].
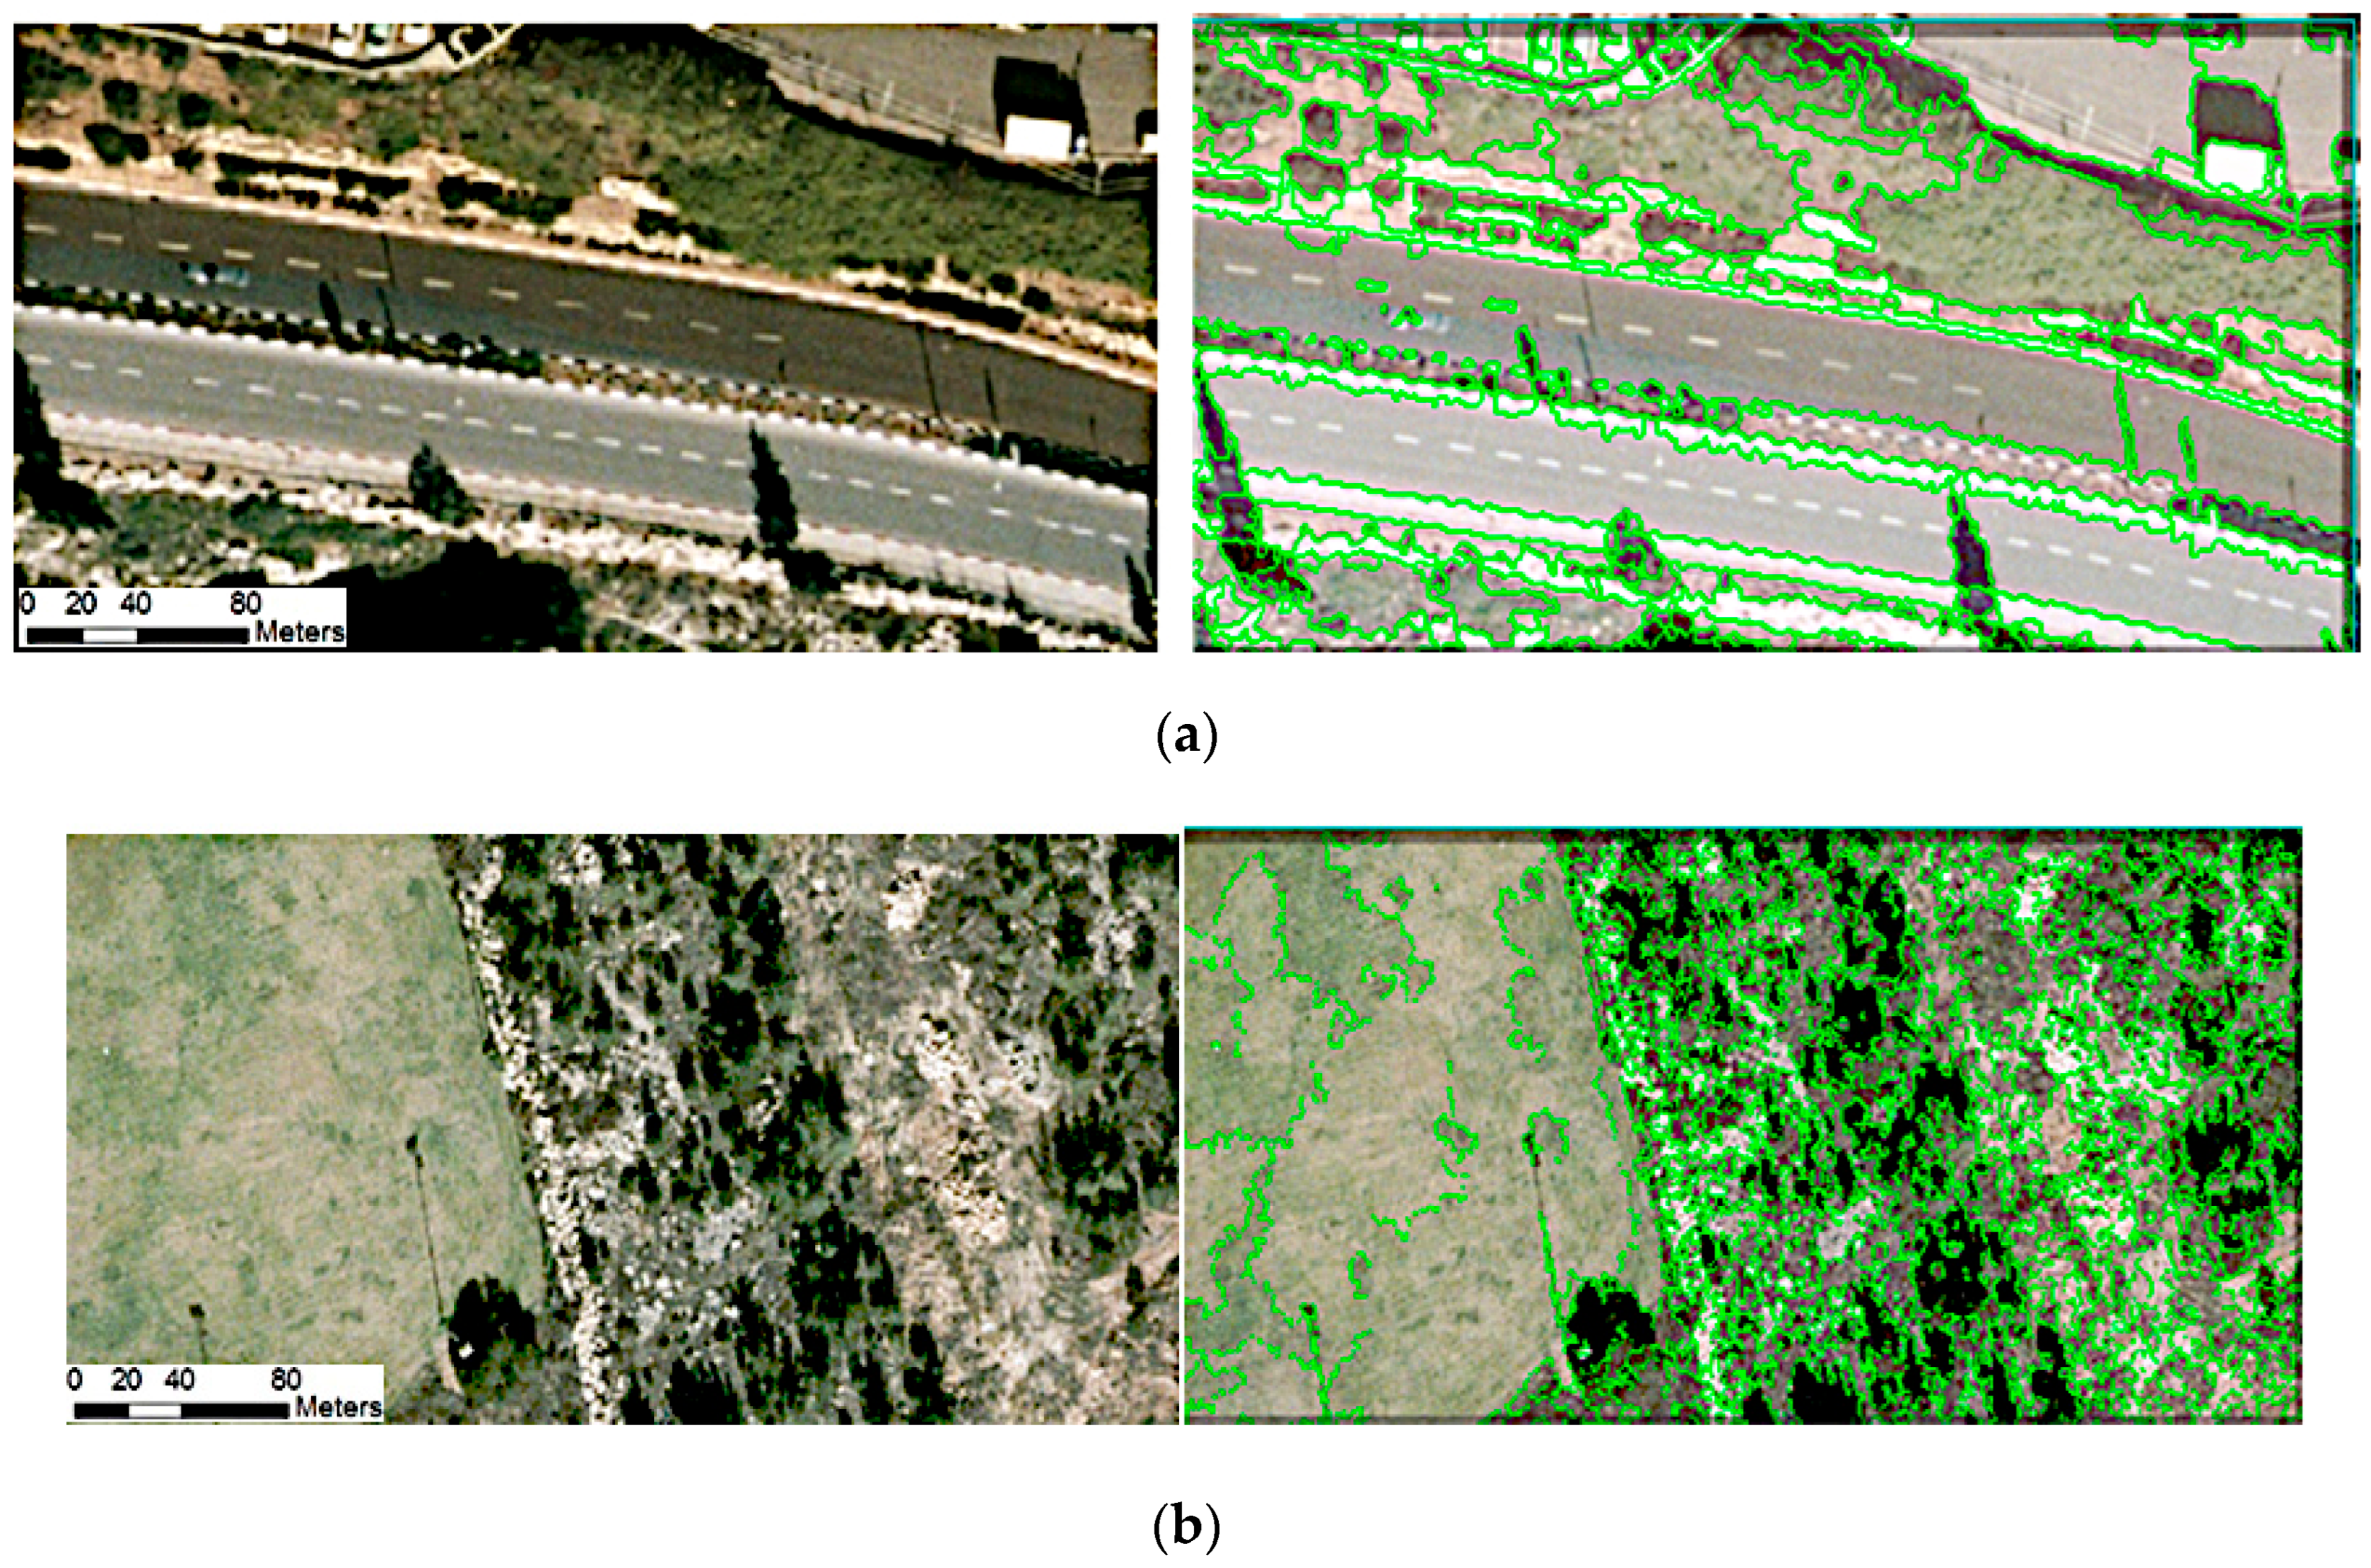
GIS and remote sensing techniques, including feature-based segmentation, were employed for high-resolution semi-automated LU/LC classification. A segmentation level value of 31 and a merging level value of 91 were found to be optimal for individual delineations of roads, buildings, groves, and lawns [
40], as shown in
Figure 4a. In natural open areas where the land cover consists of patches of bare soil, rock, and shrubs, the segmentation process delineated each of these objects separately, as they have different properties (
Figure 4b). Post-classification processes merge these objects into more general classes.
Thirteen classes were defined to obtain an accurate classification, enabling distinguishing between features of a single LU type with many different appearances, such as red roofs, gray roofs, and roads, which are three different classes that are classified and later merged into a single impervious area LU class. The feature extraction procedure is run in parallel for LU classification. A post-processing stage included manual correction of classification errors using vector GIS data. Buildings classified incorrectly as open areas were changed to impervious areas via an intersection with the building layer, while open area patches incorrectly classified as impervious areas were changed into bare soil. The manual correction served as a tool for validating the classification results. An LU classification map was created, containing the following five LUs: Impervious surfaces, Lawns, Groves, Bare soil, and Limestone (
Figure 5). The original classified map has a 0.2 m resolution and was resampled to the selected model cell size of 4 m.
Once a hydrological base layer was elucidated, an integrated modeling procedure, including SCS-CN, ModClark, and Muskingum–Cunge, was applied to quantify the runoff modeling parameters (
Table 2). The watershed’s CN, Tc, and cross-sectional parameters were estimated from the DEM, LU/LC classification, field surveys, and precipitation data, and the storage coefficient (R) and percolation rate (K) were calibrated using measured rainfall and runoff data [
41]. The suitability of the gridded SCS-CN and ModClark methods for runoff prediction in the Ariel urban watershed was evaluated during the model’s initial calibration using the Ariel University Upper Campus sub-watershed (23,900 m
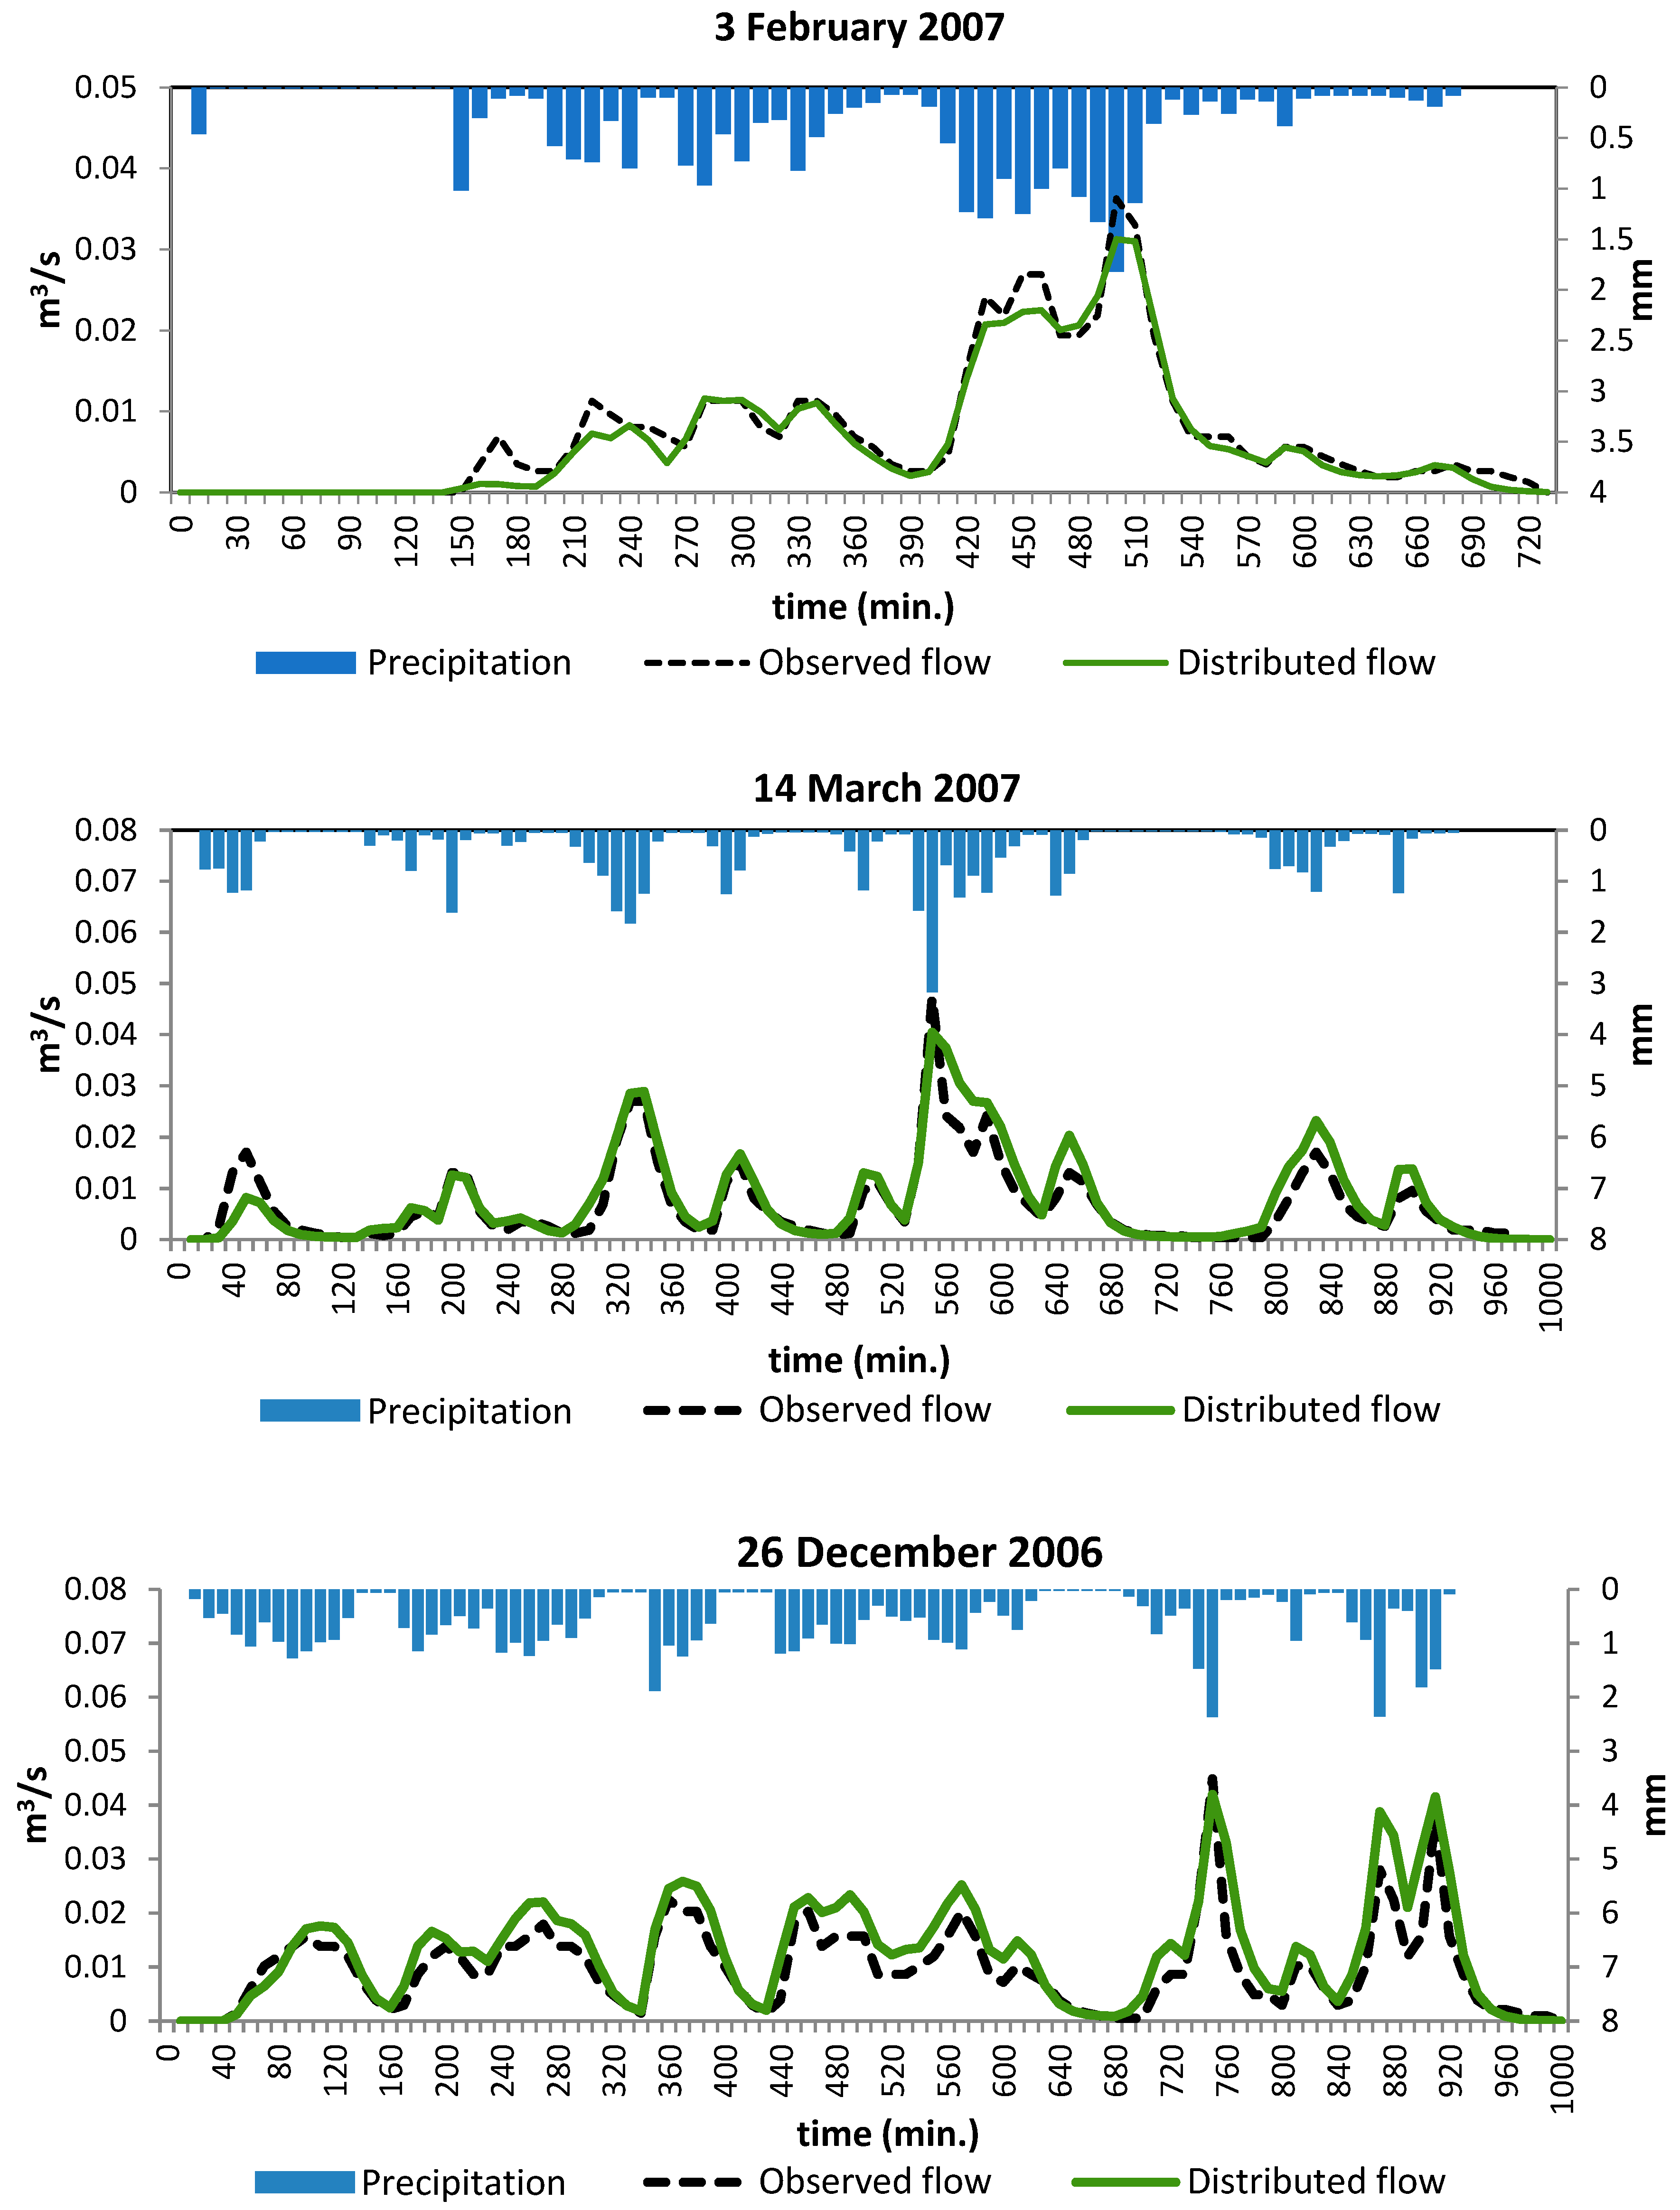
2), which was selected because it is the highest area in the larger Ariel watershed, and thus has no external flow source other than the runoff generated in its area. In addition, the Campus sub-watershed has a hydrometric station at its outlet, and is a representative urban sub-watershed composed of buildings and roads with lawns and grove patches (
Figure 6).
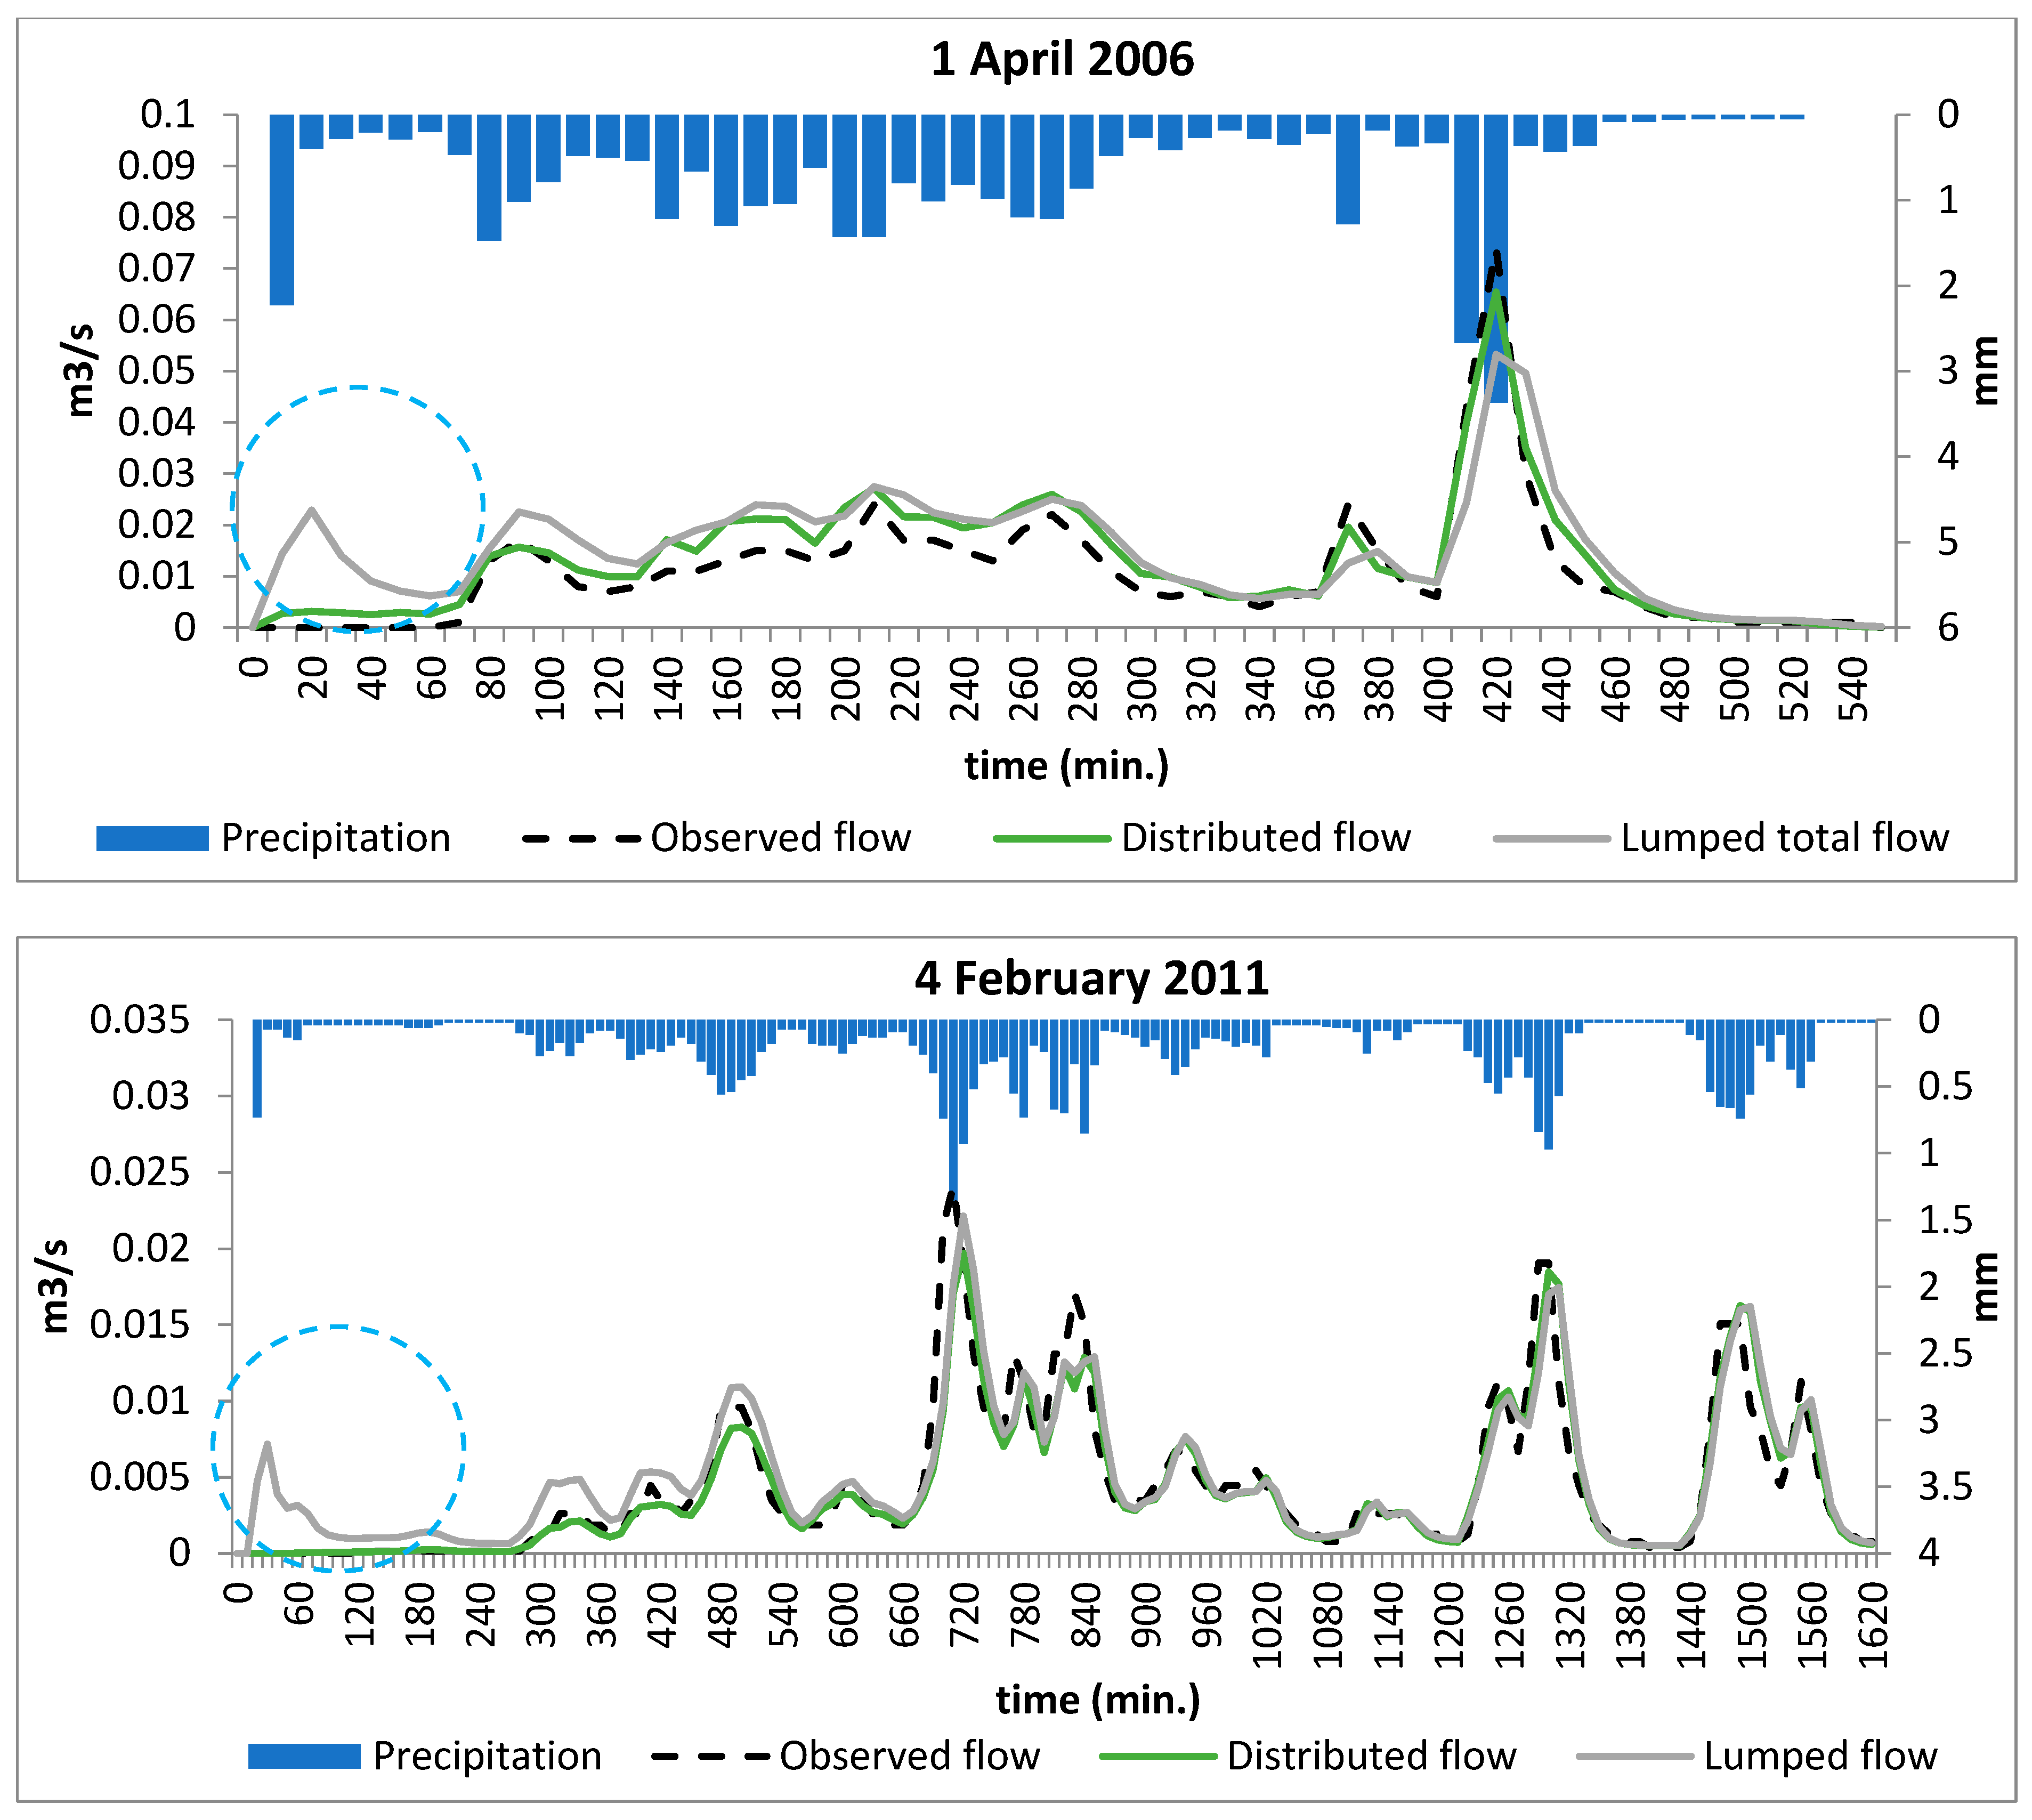
Once the campus sub-watershed distributed model was calibrated, it was tested with different datasets of the campus watershed. During the testing stage, the distributed gridded SCS-CN and ModClark models were compared to lumped–distributed models and found to be more suitable for runoff prediction from urban watersheds than their lumped versions (
Figure 7). After model calibration and testing at the Campus sub-watershed, the model validation was performed for the Sheshet at the park and Parshell sub-watersheds.
3.3. Runoff Modeling
Seven rain events were used for the model calibration, which were also used to find the storage coefficient value, R, which was determined through calibration. The R value was changed manually from 0.1 to 0.3 until satisfactory agreement was obtained between the observed and simulated hydrographs.
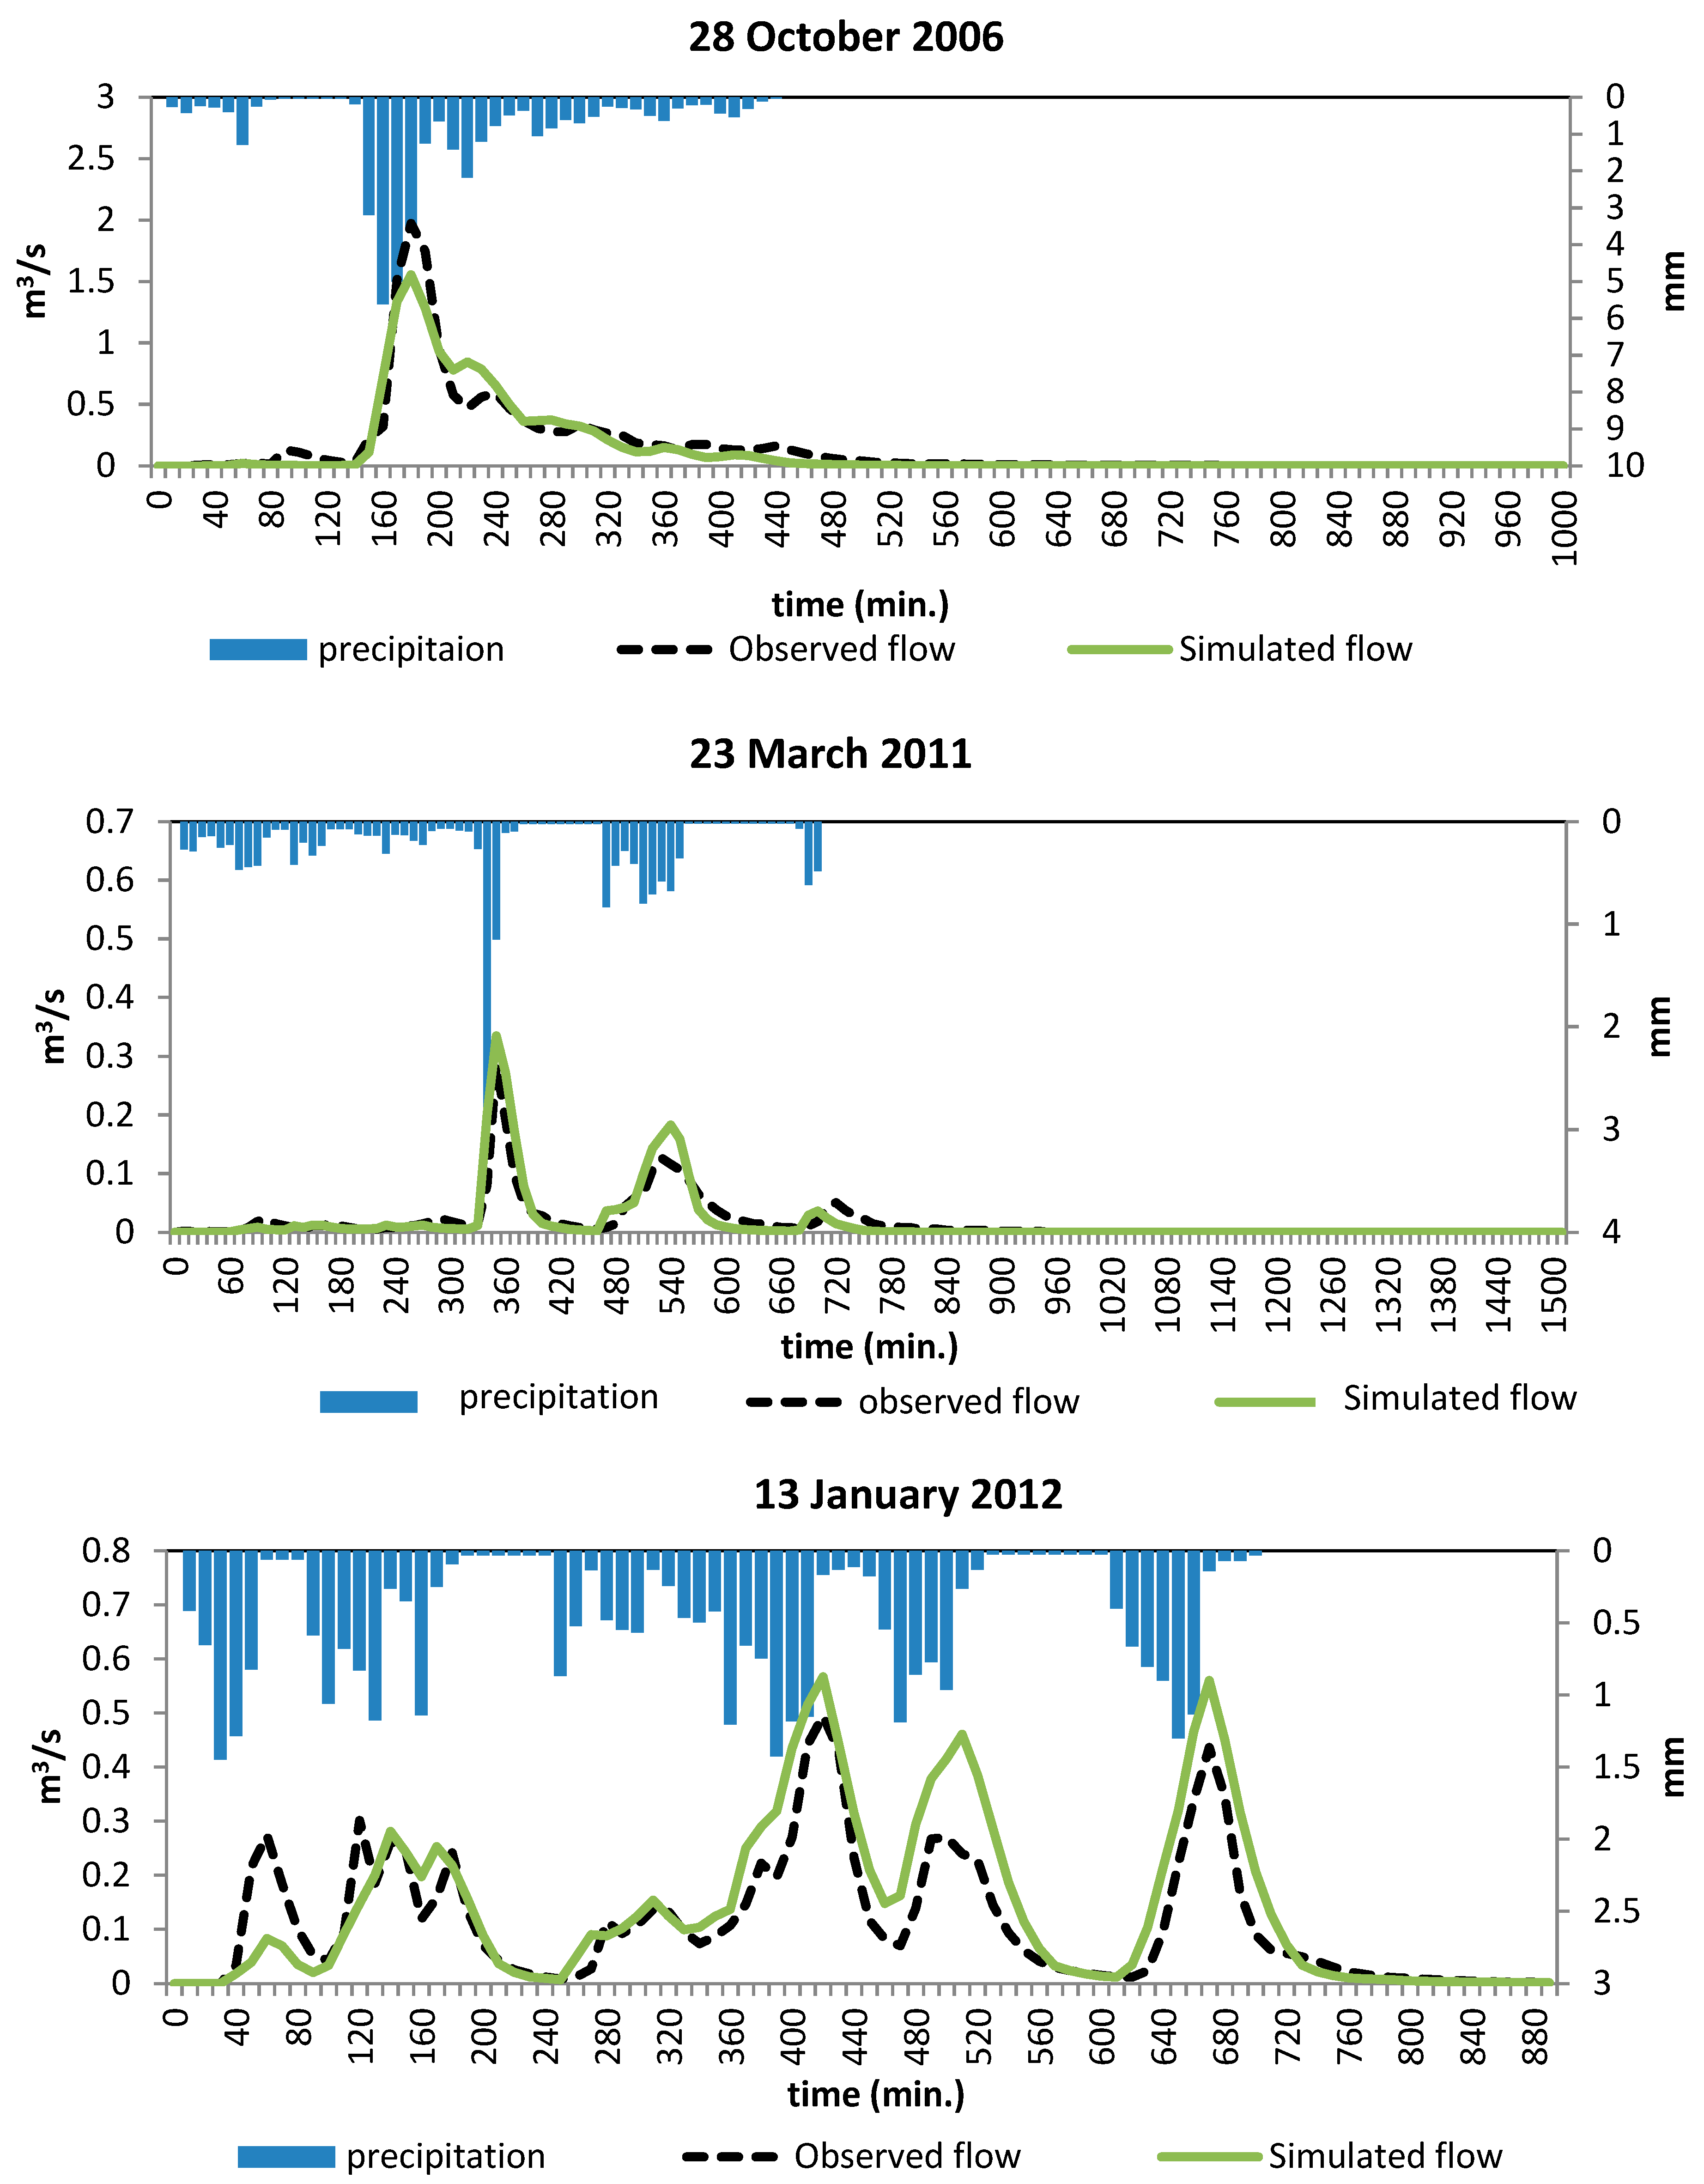
Figure 6 shows observed versus simulated hydrographs for selected events, with a good correlation in peak timing. The runoff modeling results indicate that the best performance was obtained when R = 0.2 (hr.). Thus, a relationship between R and t_c was derived as follows:
These relationship-derived R values were used for every other sub-watershed in this study.
The calibration process resulted in a good fit based on three statistical indicators: the NSE coefficient (
Table 1), runoff depth deviation percentage, and peak discharge deviation percentage. A comparison of the simulated and observed hydrograph fit using the NSE coefficient revealed that the results were satisfactory, with an NSE ranging from 0.62 to 0.95. The performance indicated by the runoff depth D% is rated good to satisfactory, with a range of −12.91% to +32.08%. As the events have multiple peaks, the peak discharge deviation percentage compares the highest observed peak to the simulated peak simultaneously. The peak discharge deviation percentage ranged from −35% to −4%.
3.4. Comparison of Lumped and Distributed Modeling
The distributed and lumped simulated hydrographs against the observed data comparisons of selected rain events (
Figure 7) indicate that the initial rise of the lumped hydrograph (marked with a blue dashed circle) is an immediate response to the first rain input. The observed hydrographs, however, are delayed and rise only later after more rain has accumulated and the initial abstraction has been satisfied. The distributed hydrograph’s first response timing and magnitude better fit the observed flow.
In the model upscaled to the entire Ariel watershed, the test–simulation model of individual basins was less accurate than that of a particular basin model; the peak flow was delayed, and the hydrograph limbs rose and receded more slowly and continuously than the observed hydrograph, which had a faster response to changes in the rainfall input. The subdivision simulation shows a much better correlation with the observed hydrograph, both in the peak timing of hydrograph limb rise and recession. The prediction improvement was achieved by subdividing the large Sheshet watershed (
Figure 8) into small sub-watersheds according to the flow type and assigning ModClark parameters accordingly.
4. Discussion
The typical DEM resolution ranges from less than 0.5 m to coarser than 100 m, depending on the aerial photograph resolution and the elevation point sampling interval. The orbital RS best available DEM for the study area had a 25 × 25 m resolution, which was insufficient for hydrological modeling. The watershed area and shape delineation are derived from the watershed’s topography, which controls the computed runoff volume and the timing at which it will reach the outlet. Since the topography of urban watersheds is altered by man-made features such as buildings, roads, and culverts, high-resolution topography data is required to delineate an urban watershed accurately [
19,
20,
22]. Rainfall–runoff models must simulate the watershed’s ability to infiltrate rain, which is related to the soil type, surface cover, and LU. While in urban watersheds, LU heterogeneity is a scale variation of a few meters, in natural watersheds, the variation in typical watershed characteristics is greater than a scale of tens or hundreds of meters. Urban watersheds may be hydrologically classified into impervious and pervious surfaces. Dynamic runoff initiation processes depend on the rainfall depth, soil type, soil moisture conditions, and anthropogenic factors such as land use and typical surface permeability [
3,
42].
The optimal runoff modeling DEM resolution was derived from comparing a runoff routing model prepared for one sub-basin with DEM cell sizes of 25 m, 10 m, 5 m, 4 m, 3 m, 2 m, and 1 m to the actual in situ runoff routing. This enabled the identification of the urban sub-watershed nominal DEM resolution for correct delineation. DEMs with cell sizes of 1 to 3 m could correctly produce the flow path, but those with sizes of 4, 5, 10, and 25 m failed. The lower-resolution DEMs (4 m and above) indicated that the wadi flow path in the park was discontinuous and curved north, which was negated by the observed conditions. The actual flow path that continues through a culvert under the road down to the city park’s stream (
Figure 1,
Figure 2 and
Figure 3) was derived correctly from the 1 m and 3 m DEMs. Since the 3 m, 2 m, and 1 m DEMs delineated the stream correctly, using the 3 m DEM is preferable, owing to optimizing computing resources and filtering the insignificant flow paths for runoff routing. The integration of NNI DEM resampling and urban feature fusion enabled the use of a 4 m DEM instead of a 3 m DEM.
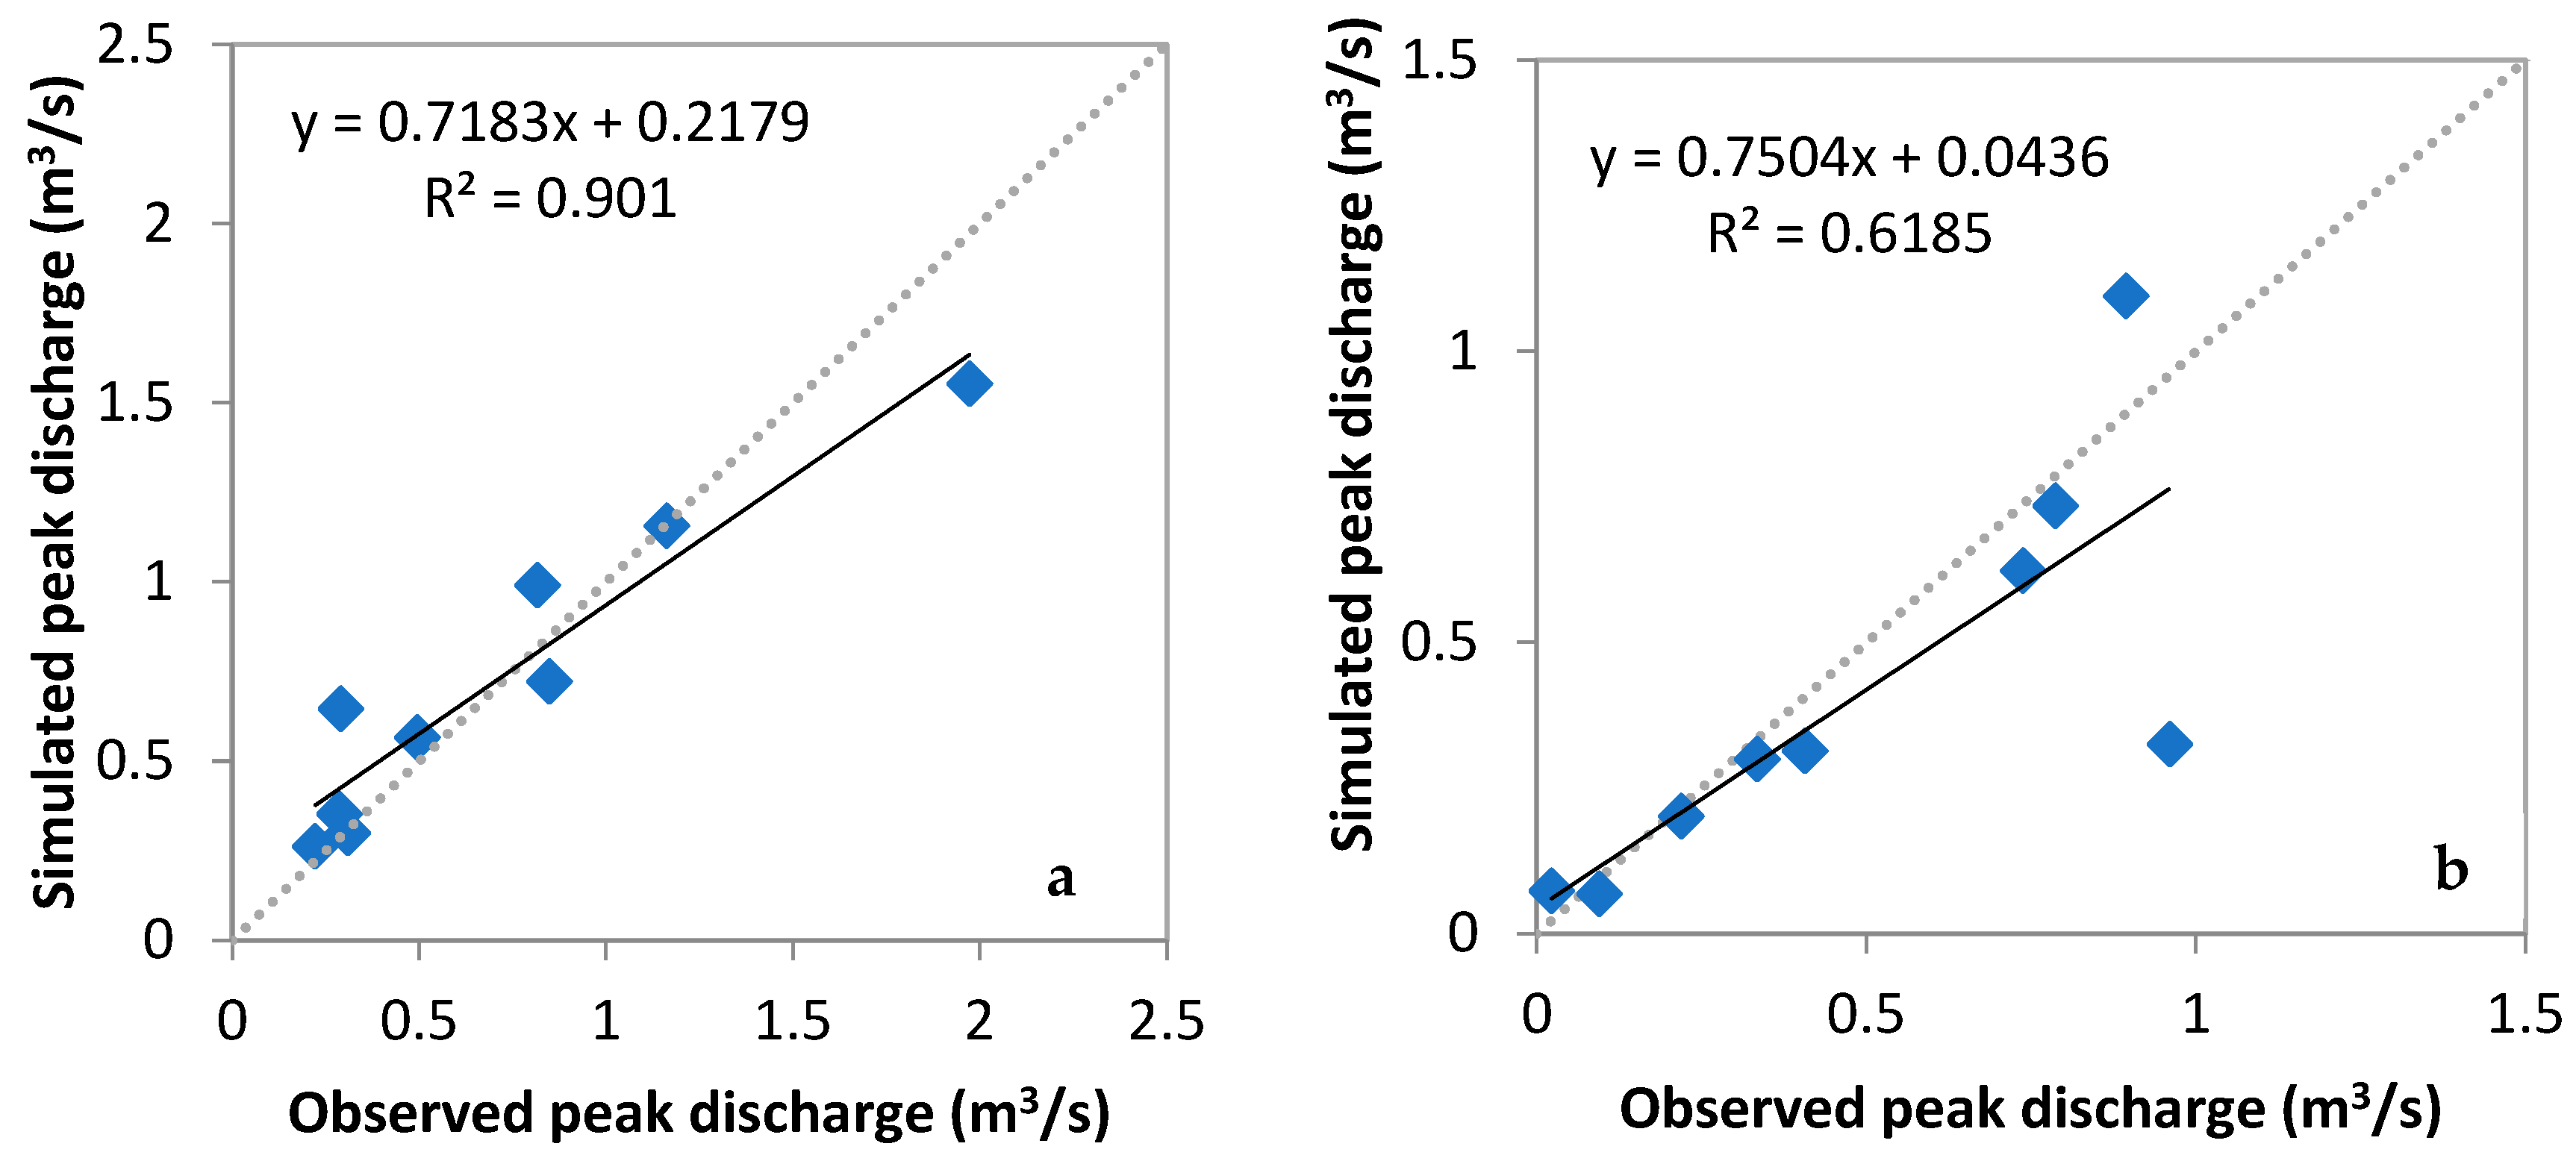
The optimized DEM watershed subdivision and LU classification improved the model’s performance, as the subdivision simulation hydrographs and test simulation had reasonable matching to the observed hydrographs (
Figure 9). While the variability in sub-watershed infiltration rates might cause divergence from the trendline, it seems that, in high runoff velocities, the model tends to slightly overestimate runoff or underestimate transmission losses, which can be regarded as additional precaution for drainage planning. The successful extrapolation of the Campus watershed training to the larger watersheds downstream enabled the preparation of a digital base layer, enabling Ariel’s optimal runoff modeling as a representative of mountainous urban karstic terrain. This base layer is still the precise platform for performing hydrological transformation modeling that can assist local engineering authorities in planning drainage in cities.
While the exact mechanism of runoff infiltration (transmission loss) is complex, a correlation was observed with the precipitation rate parameter. The specific loss in the reach increased as the discharge and wetted reach area increased; the specific loss decreased during the initial wet soil moisture conditions [
43]. Since the HEC-HMS percolation calculation method does not consider the loss rate dynamic decay, owing to accumulated rainfall over the reach bed, which gradually saturates it, transmission loss overestimation and runoff volume underestimation were observed at the Parshell outlet. Another possible reason is subsurface discharge, which contributes to flow to the wadi reach, as implied by a few events (
Figure 8: 28 October 2006), with the overshooting of the observed peak flow and continued flow after the rain stopped. It is possible that infiltrated rainfall from upper sub-watersheds exits the subsurface through seepage at the wadi reach. Such a contribution was not included in the model, as it seemed to be a local phenomenon that does not occur in urbanized watersheds [
44].
The practical outcome of this research enables an engineering framework for runoff prediction from urban watersheds. This capability is essential for appropriately planning drainage systems and residential and commercial areas, emphasizing a low-impact development strategy (LID), which is particularly beneficial for mountainous karstic urban areas where a constant infiltration coefficient is not valid [
45]. It is suggested that, in a similar manner to a non-karstic or mountainous terrain, a model training procedure on a small but representative watershed may be extrapolated to much larger areas. Yet, such areas may differ in typical infiltration and runoff velocities, and also in retention between events owing to field capacity, which may be explicitly regarded. Once a correct estimation of the runoff event peak flow is achieved, it allows a correct drainage design to prevent flash floods within the urban area and maintain a null runoff signature of urban areas to their natural surroundings [
46]. Considering that there is no direct routing from the surface to the regional aquifer, which is likely because the water table depth is greater than 200 m, it was found that, in sequential events within less than 48 h, the surface reaches its field capacity, and the runoff accumulation rate increases, which causes slight variations in the observed hydrographs.
5. Conclusions
Urbanization is a global trend, cross-cutting different climate zones and landscapes that usually involves a reduction in infiltration capacity and a reduction in runoff quality. While it is most prudent in karstic terrains, such as the study area, it should be taken into the regional development design of other regions to prevent flooding in the transition zone from mountainous to moderate slope terrains. Moreover, once the urban area includes industrial activities, groundwater recharge of polluted runoff might jeopardize groundwater quality. The modeling strategy as described in this work may be applied in both complex scenarios and an urban, mountainous, karstic terrain, and to less hydrologically complex regions, for exactly indicating the hydrological junction, which, by applying a nominal drainage modification, such as permeable pavement, increasing or decreasing the landscape roughness, and the installation of runoff absorbing areas such as biofilters, may prevent urban flooding while preserving the groundwater recharge quality.
The widely applicable implications from this study suggests that
Applying an optimal resolution to a hydrological model instead of the highest available has several advantages. In addition to reduction in computer resources, the lower resolution acts as a smoothing filter that prevents bias from minor structural elements that do not influence real-world hydrology.
The optimal grid-based model resolution was derived as 4 m, as a lower-resolution DEM was unable to indicate the urban flow paths or to accurately delineate the watershed border, whereas a higher-resolution DEM might unnecessarily increase the model complexity.
By manipulating the HEC-HMS input files, it is possible to run the SCS-CN and ModClark models using grid cell sizes smaller than the 10 m platform’s limit.
The regional SCS-CN loss method optimization from its initial configuration (small urban watersheds in the U.S.) involved redefining the rainfall initial accumulation before the rain event to 24 h (1 day), as earlier rain events did not appear to have an accumulation effect, probably owing to the karstic nature of the area.
Subdivision of a watershed into smaller sub-watersheds according to the dominant flow type drastically improved the model performance.
The model used in a representative mountainous karstic urbanized area was found to concur with the actual measurements and with minor alignments, and may be applied to similar regions worldwide.
