Article

Unifying Flood-Risk Communication: Empowering Community Leaders Through AI-Enhanced, Contextualized Storytelling

by
Michal Zajac
,
Connor Kulawiak
,
Shenglin Li
,
Caleb Erickson
,
Nathan Hubbell
and
Jiaqi Gong
*
Department of Computer Science, University of Alabama, Tuscaloosa, AL 35487, USA
*
Author to whom correspondence should be addressed.
Hydrology 2025, 12(8), 204; https://doi.org/10.3390/hydrology12080204
Submission received: 1 July 2025 / Revised: 24 July 2025 / Accepted: 30 July 2025 / Published: 4 August 2025

Abstract

Floods pose a growing threat globally, causing tragic loss of life, billions in economic damage annually, and disproportionately affecting socio-economically vulnerable populations. This paper aims to improve flood-risk communication for community leaders by exploring the application of artificial intelligence. We categorize U.S. flood information sources, review communication modalities and channels, synthesize the literature on community leaders’ roles in risk communication, and analyze existing technological tools. Our analysis reveals three key challenges: the fragmentation of flood information, information overload that impedes decision-making, and the absence of a unified communication platform to address these issues. We find that AI techniques can organize data and significantly enhance communication effectiveness, particularly when delivered through infographics and social media channels. Based on these findings, we propose FLAI (Flood Language AI), an AI-driven flood communication platform that unifies fragmented flood data sources. FLAI employs knowledge graphs to structure fragmented data sources and utilizes a retrieval-augmented generation (RAG) framework to enable large language models (LLMs) to produce contextualized narratives, including infographics, maps, and cost–benefit analyses. Beyond flood management, FLAI’s framework demonstrates how AI can transform public service data management and institutional AI readiness. By centralizing and organizing information, FLAI can significantly reduce the cognitive burden on community leaders, helping them communicate timely, actionable insights to save lives and build flood resilience.

1. Introduction

Flooding remains an escalating global crisis, disproportionately affecting socio-economically vulnerable populations who often lack the adequate resources and infrastructure to respond effectively [1,2]. Worldwide, flooding events have increased dramatically in both frequency and severity over recent decades [3]. This trend is compounded by rapid urbanization, which alters landscapes and concentrates populations in areas that may be at risk of flooding [4]. Concurrently, the effectiveness of water management strategies is crucial, as understanding local water dynamics is essential for predicting and mitigating threats to coastal and riverine communities [5]. Locally, communities frequently experience devastating consequences, including displacement, substantial economic losses, disruptions to critical infrastructure such as roads, power grids, and water systems, as well as significant impacts on public health and safety [3]. The resulting damage often requires extensive recovery efforts that strain community resources and resilience. Recent severe flooding events, such as those observed in Central Texas resulting in significant fatalities [6], underscore a critical need to enhance flood-risk communication and emergency preparedness systems. Challenges persist in forecasting complex weather systems and effectively promoting timely public response, indicating a systemic gap in current federal and local communication frameworks that necessitates reform [7,8].
Community leaders—including emergency managers, city officials, and local coordinators—play a pivotal role in flood-risk management, particularly in facilitating timely and effective communication with the public. Effective flood-risk communication requires the dissemination of accurate, timely information to coordinate emergency response and guide public action. However, these leaders encounter significant barriers due to the fragmented nature of flood-risk information, which is spread across numerous local, state, and federal agencies. Each agency typically maintains its own data formats, reporting mechanisms, and communication protocols, resulting in information silos. Community leaders must expend considerable effort synthesizing vast amounts of scattered data from a variety of sources, which can lead to information overload and ultimately result in ineffective or delayed public communication [9]. This fragmentation exacerbates confusion, undermines public trust, and diminishes the capacity for rapid decision-making during crises, particularly affecting vulnerable populations who rely heavily on clear guidance during emergencies.
Existing flood-risk communication methods predominantly rely on conventional platforms such as dashboards, automated alerts, static reports, and traditional media broadcasts [10]. Although valuable, these approaches often fail to deliver cohesive, contextually relevant messages that diverse audiences can easily understand. Dashboards and static reports often present isolated data points without context or narrative framing, limiting their effectiveness in motivating coherent community action [11]. Additionally, automated alerts often lack specificity, failing to capture the nuances of local contexts and the unique needs of different demographic groups. This absence of an integrated, narrative-driven communication approach leads to inconsistent public understanding, decreased community engagement, and impaired collective resilience, ultimately hindering effective emergency response and preparedness.
Addressing this critical communication challenge requires a unified reference framework centered on a coherent, narrative-driven approach. Such a narrative framework, grounded in a structured vocabulary or ontology, explicitly defines flood-risk concepts and their interrelationships, providing a foundational structure for organizing diverse information streams. Leveraging this ontology facilitates systematic data integration, straightforward interpretation, and enhanced communication among stakeholders [12]. Once established, this structured ontology can effectively integrate diverse datasets—including real-time governmental updates from agencies like the Federal Emergency Management Agency (FEMA) or the National Oceanic and Atmospheric Administration (NOAA), historical records, and social media inputs—into a comprehensive knowledge graph [13]. This interconnected web of information provides a robust foundation for AI-driven systems that can rapidly generate insightful, context-specific flood-risk narratives tailored to various stakeholder groups.
This paper introduces FLAI (Flood Language AI), a centralized, narrative-focused framework designed to improve flood-risk communication. FLAI leverages artificial intelligence and knowledge-graph techniques to combat information overload by systematically organizing, curating, and strategically presenting flood-risk data. Grounded in a thorough analysis of existing information sources, communication methods, stakeholder roles, and technologies, our research addresses a critical question: How can technology improve the current state of flood-risk communication? The proposed AI-powered platform provides community leaders with an intuitive web interface and analytical tools to craft compelling and timely narrative-based public communications. By clarifying what to communicate, how to deliver it and where to reach key audiences, this research aims to significantly enhance the clarity and effectiveness of flood-risk messaging, ultimately helping protect communities, reduce damages, and save lives.

2. Problem Definition

2.1. Devastating Impact of Floods
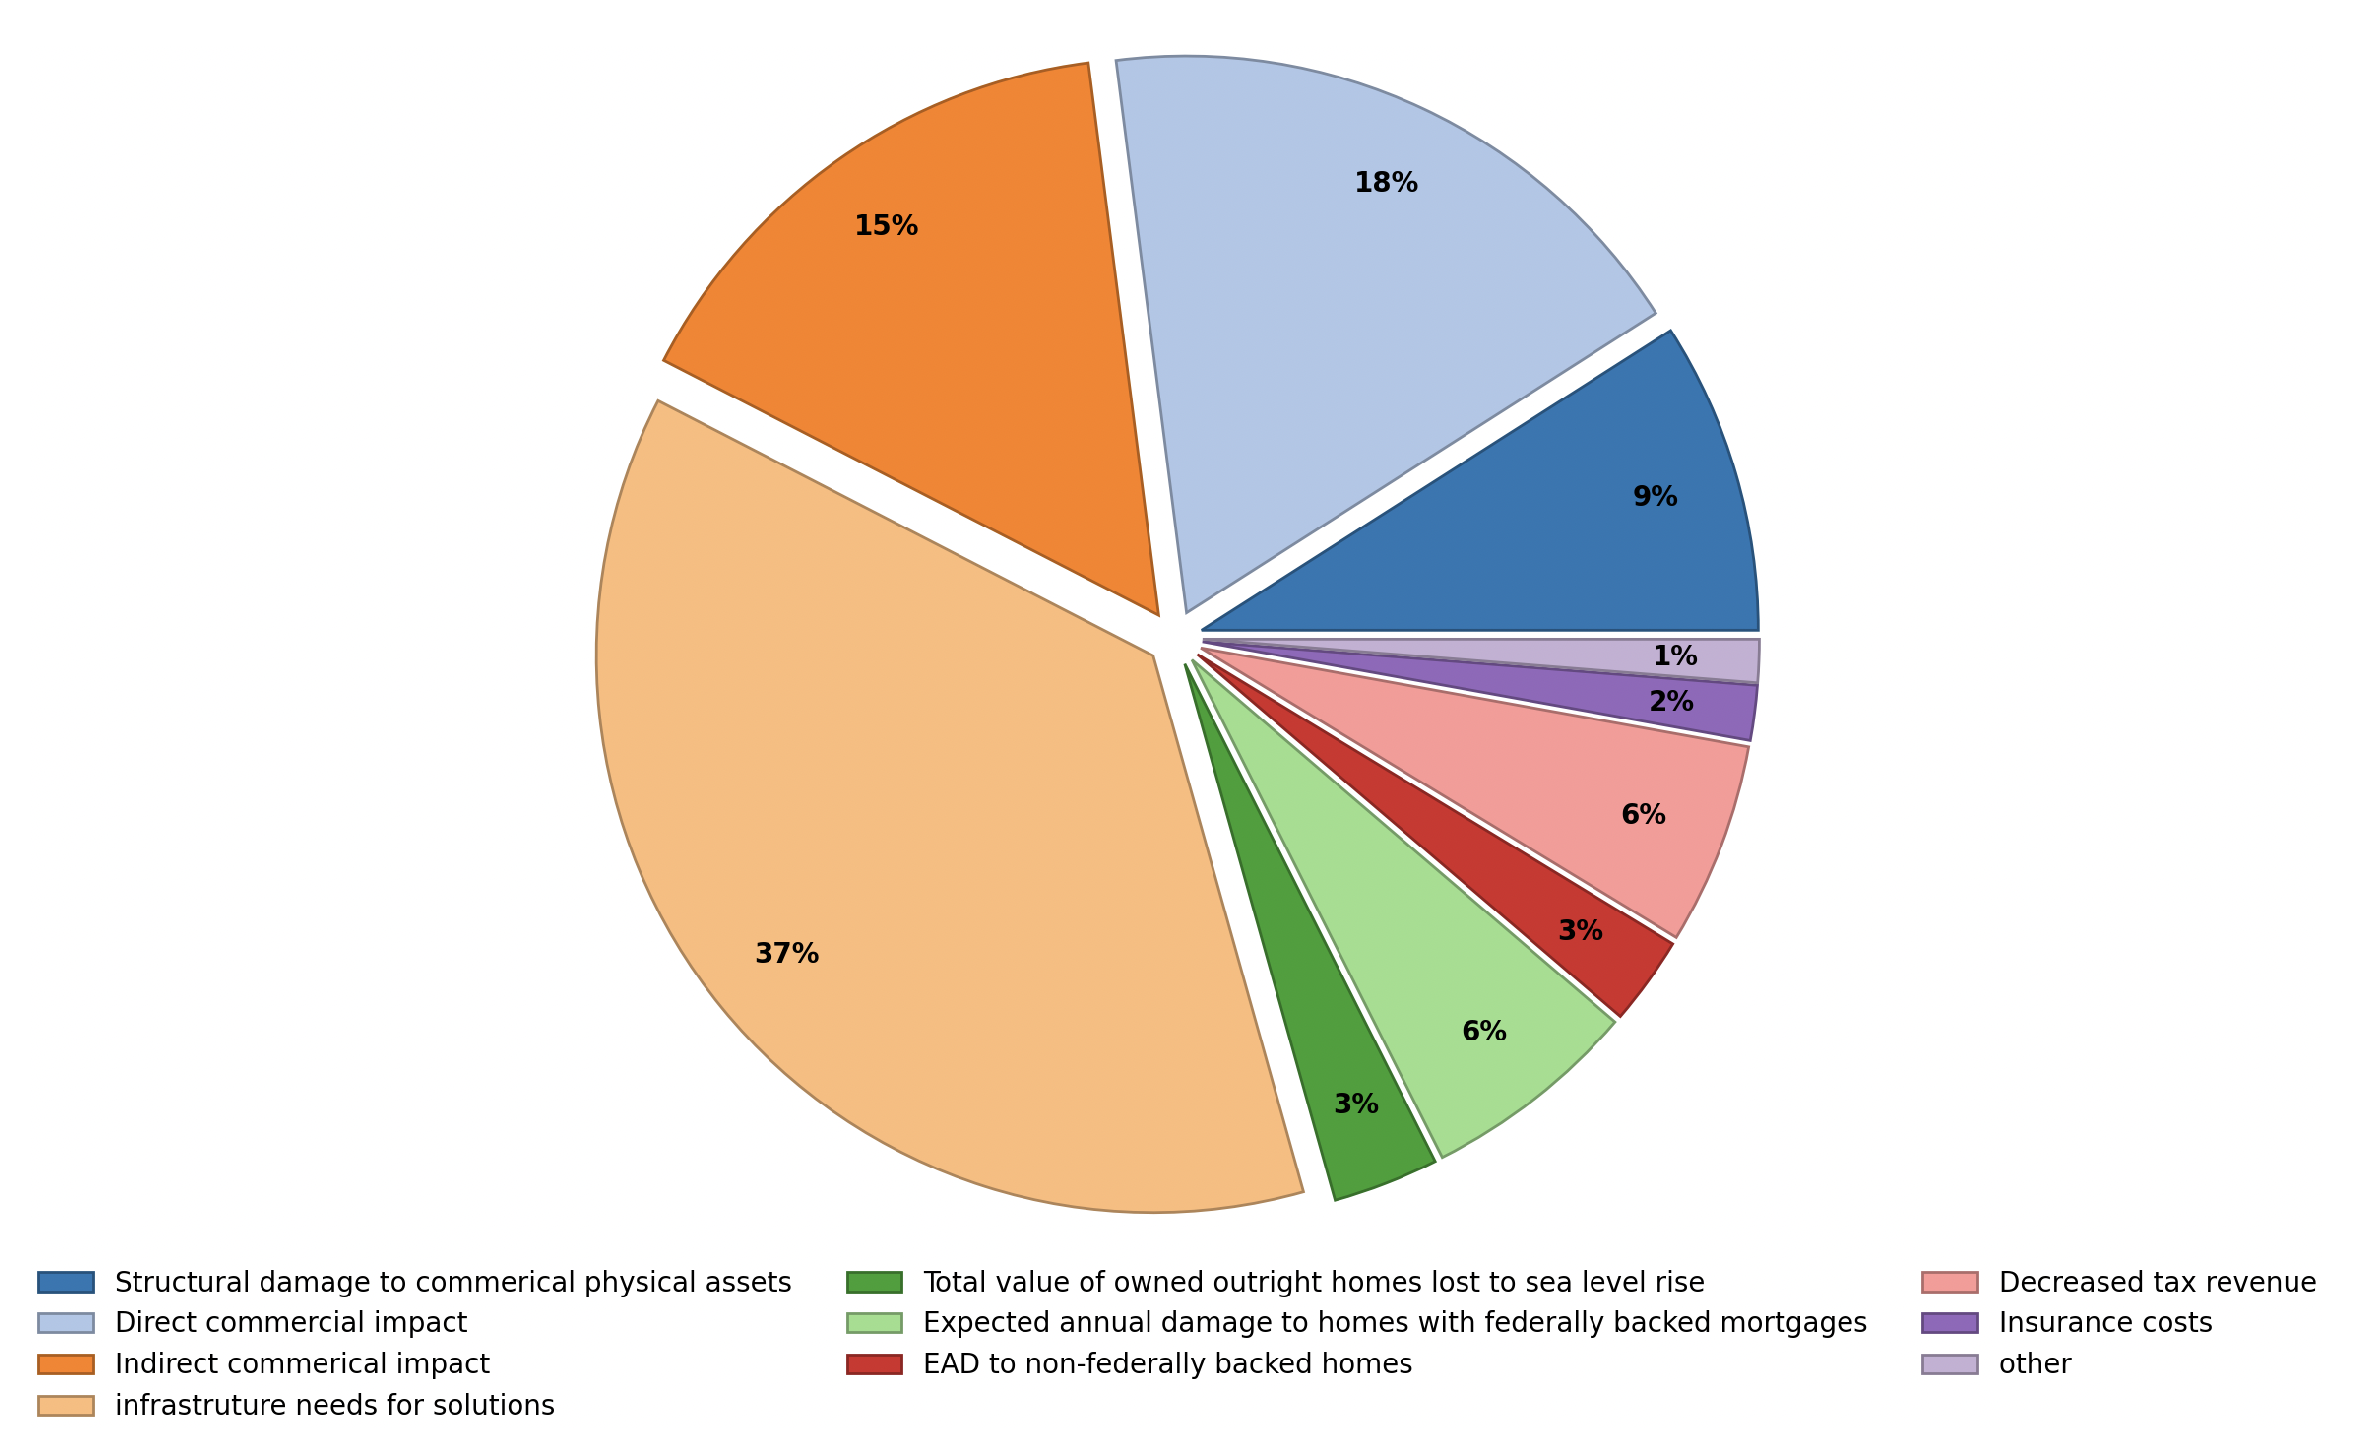
Floods cause substantial economic harm globally, with the United States alone experiencing over USD 180 billion annually in flood-related damages [14]. This immense financial burden affects governmental institutions, insurance agencies, and individual citizens alike. Flood events devastate communities, leading to significant loss of life, property, and employment. The National Weather Service reports an average annual death toll of 127 Americans due to flooding [15]. A recent example includes the catastrophic flash floods in Kentucky, which resulted in 39 fatalities and extensive economic disruption [16]. Floods rank among the most common extreme weather events, occurring almost daily [17].
Globally, approximately 1.81 billion people—roughly one-quarter of the world’s population—live in flood-prone areas. Of this group, at least 170 million live in extreme poverty [1]. Limited resources and weak infrastructure make it especially difficult for socioeconomically vulnerable populations to withstand and recover from floods.
In addition to their direct economic and physical impacts, floods impair critical infrastructure such as water, electricity, and transportation systems. This impairment occurs both directly through physical damage and indirectly as heightened demand during emergencies strains these essential services. Floods also cause significant indirect effects, including lasting mental health consequences such as post-traumatic stress disorder, anxiety, and depression [18].
As Figure 1 shows, flood damage touches every sector of society, from lost tax revenue for local governments to property damage for individual homeowners. Flooding does not just affect the individual; it impacts the community as a whole. Floods cause societal impacts (loss of life), economic impacts (property loss and inability to work), and governmental impacts (reduced tax revenue and greater demands on local and federal resources). Therefore, reducing flood impacts benefits communities, governments, and individuals alike.
The effects of flooding can be reduced by preparation. The more time a community has to prepare for a flood event, the more resources it can get ready; officials have more time for policy decisions, and citizens can decide what to do based on the information available. Chinguwo describes the importance of timely flood information, as it increases a community’s level of preparedness [19].
With the rise of urbanization across the globe, the risks of flooding and extreme weather events are more impactful than ever before. Increased population density exacerbates the damage and risks of flooding in communities. When floods occur in densely populated areas with more buildings, people, and resources, the impacts increase significantly. In metropolitan areas specifically, there are higher rates of surface runoff and river discharge. Higher surface runoff is caused by the water’s inability to be absorbed into the ground, a consequence of the densely packed roads and buildings common in a metro area. High river discharge rates cause water levels to rise quickly, which can lead to flooding in certain areas [20]. These byproducts of urbanization increase the risk of dangerous flash flooding. Water that is unable to be absorbed by the ground instead pools on streets or flows into rivers, increasing water levels in the area quickly. As a result, water resource management is becoming more difficult in urban areas.
Figure 1. Annual impacts and costs of flooding in the United States by percentage. Adapted from the U.S. Congress Joint Economic Committee [14].
Hydrology 12 00204 g001

2.2. Information Overload and Data Silos

Effective flood preparation and response depend heavily on timely and accurate information. However, flood-related data—including forecasts, alerts, and geographical maps—are fragmented across numerous, disparate platforms and data silos. In fact, Mostafiz identified over 50 major portals for accessing flood-related information [21]. These sources differ widely in coverage, scope, and granularity, ranging from local to global contexts. Table 1 identifies several major flood information sources provided by the U.S. government. The proliferation of such fragmented sources contributes significantly to information overload, making it challenging for individuals and community leaders to discern relevant and actionable insights during an emergency.
Table 1. Key flood information sources (government-related fragmentation). All sources listed are affiliated with FEMA, USGS, NWS, NOAA, or other U.S. government agencies.
Government agencies such as NOAA, FEMA, NWS, and USGS provide critical flood information. However, their valuable resources are compartmentalized on separate platforms, as shown in Table 1. Navigating these isolated repositories to aggregate and interpret relevant data is a complex and time-consuming process that can be overwhelming for the average user. Furthermore, many of the sources listed in Table 1 and Table 2 provide redundant information and are not tailored to specific user needs. Because these platforms do not assist with information dissemination, that burden falls on the users themselves. This lack of built-in communication support leaves users to relay critical information manually, a process that increases the risk of human error.
Table 2. Key flood information sources (non-governmental fragmentation). This includes private companies, independent meteorologists, blogs, and local platforms.
In addition to government sources of flood information, a large portion of Americans get their weather information from television. A YouGov poll found that about 27% of Americans get weather information from dedicated weather channels and 40% from local news channels [53]. This media landscape is also highly segmented; competing corporate news outlets own various channels that provide different information at different times. Further complicating matters, many of these organizations also offer their own proprietary weather apps.
Figure 2 illustrates the confusion community leaders face when attempting to make sense of siloed information. Regarding news sources, numerous agencies report varying information and host different segments. This variation in reporting across different stations can confuse the public when trying to interpret it all.
With multiple organizations providing their own reporting, forecasts, predictions, and apps, the volume of information provided can be overwhelming and difficult to process.
Deciding which information is valuable and relevant for citizens is a complex task. The abundance of available information can contribute to information overload [9]. Processing substantial quantities of information with varying levels of quality poses a significant challenge for an individual.
The information provided is often standardized and not tailored to an individual’s needs, yet an individual must discern the most important information, not consume all that is available. With the internet at our fingertips, access to information should be more immediate than ever before. A quick web search can yield thousands of sources of flood information, but these sources offer varying degrees of utility. For example, one source might provide out-of-date flood information, causing confusion and spreading misinformation about the current situation. Esparza found biases when viewing crowd-sourced flood reports [54], and such bias in reporting leads to flawed conclusions and complicates information collection. Determining which sources are most useful requires an in-depth evaluation of each one, increasing the time it takes to become informed and to inform others.
Figure 2. Siloed news sources leave users confused and struggling to navigate information [41,44,45,55,56,57,58,59,60,61].
Hydrology 12 00204 g002
Weather applications attempt to alleviate the issue of information silos by providing all the information a user may need in a single app. This streamlines the curation process and provides a single repository of information for a user. However, as shown in Table 2, multiple weather apps exist. These apps may offer competing forecasts, place some information behind paywalls, and acquire data from different sources. The information provided within these apps is also restricted to its native platform. Furthermore, these apps do not offer ways to disseminate their information to people who may not have the app. Therefore, the responsibility for sharing information falls on the user, not the application itself.
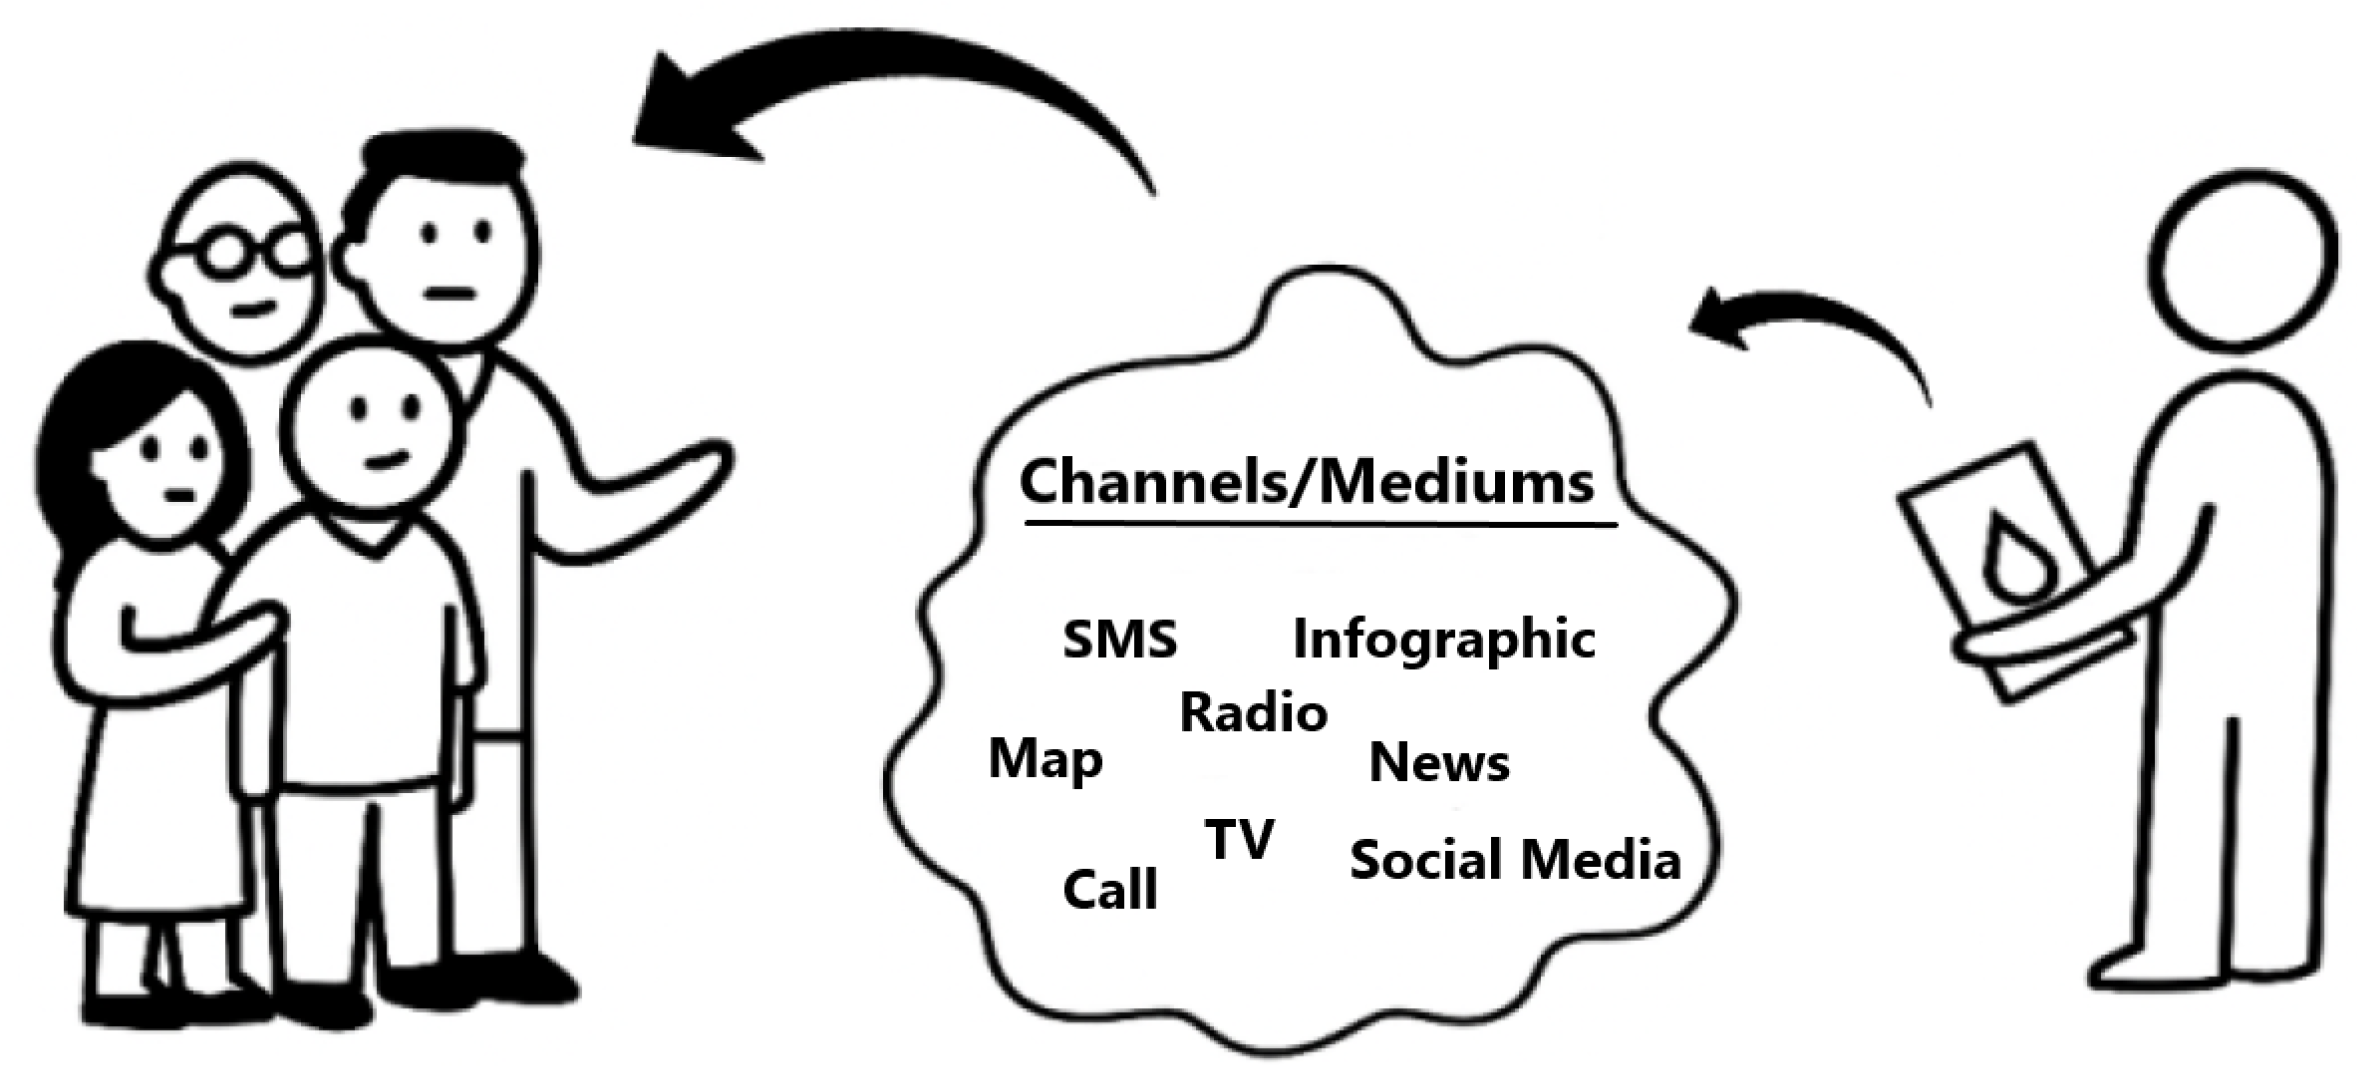
As depicted in Figure 3. community leaders face the difficult task of making sense of all the information around them and disseminating the most important and relevant information to their community. They take in multiple sources of expert data and must disseminate that information through various communication channels.

2.3. Limitations of Current Toolkits

Current flood information dissemination toolkits primarily offer pre-made infographics and static resources, aiming to streamline communication [62]. However, these resources lack sufficient customization to address specific, real-time community needs, necessitating the manual creation of tailored graphics. The development of custom infographics is a specialized and time-intensive task, requiring proficiency with graphic design software like Photoshop (version 26.9) or Canva (Visual Suite 2.0).
Much of the material in these pre-made sources offers only basic flood-safety advice, FEMA insurance details, and common-sense guidance. NOAA-provided flood infographics offer information similar to Ready.gov’s materials [63], and both sources contain information that is neither tailored nor local. Furthermore, available toolkits addressing flood safety and FEMA-related information are scattered across multiple digital platforms, creating additional silos. No existing platform allows users to create customized resources that disseminate information and meet community-specific needs effectively.
Despite these limitations, existing expert-driven information dissemination remains crucial. Specialists in hydrology and meteorology play a vital role in generating accurate forecasts, interpreting complex data, and translating technical information into accessible formats [64]. Their contributions enable citizens and community leaders to comprehend flood risks and preparedness measures effectively. Individuals often struggle not only with the volume of data but also with its varying quality and relevance. Consequently, it is the experts who provide the most important and applicable information.
When analyzing the abilities of multiple communication channels (Table 3), we find that the infographic can be used on almost all popular communication platforms. While certain channels allow for richer information than a static image, the ability to spread information across as many channels as possible is valuable. Based on this analysis, we have found that the infographic is a very useful tool for disseminating information. An infographic is a visual representation of information that combines images, symbols, and text to present complex data or concepts in a clear and easily understandable format [65]. A simple, easy-to-digest, and easily shared source of information can provide more utility to a community than a weather app. Because an infographic can be shared easily, it allows many people to access the same critical information.
Preserving the current strengths—expert involvement and the use of infographics—while addressing data fragmentation, information overload, and toolkit limitations will significantly enhance flood preparedness and response. Achieving communication improvements starts with those best positioned to lead: community leaders and trusted public institutions.

3. Resilience Begins with Community Leaders

A diverse range of stakeholders can benefit from the expertise of technologists and AI engineers in flood-risk communication, including individual residents, urban planners, and emergency-management agencies. However, community leaders and personnel from the National Oceanic and Atmospheric Administration (NOAA) and the National Weather Service (NWS) represent the most influential leverage points for significantly enhancing flood resilience outcomes.

3.1. Key Stakeholder Groups (Community Leaders, NOAA/NWS)

Community leaders hold significant local legitimacy, and their participation in planning can reduce conflicts and foster community buy-in for flood-risk-management strategies [66]. Experiences from cities like Accra demonstrate that effective resilience outcomes rely heavily on engaging community leaders not merely during implementation but importantly in the initial design phases of risk-management plans [66].
In parallel, personnel from NOAA and NWS provide critical scientific and technical support. The NOAA’s weather forecasting alone contributes an estimated USD 31.5 billion annually in economic benefits for U.S. households [67]. Furthermore, precise forecasts from NWS significantly reduce fatalities compared to less accurate forecasting methods, resulting in substantial societal benefits that far exceed the agency’s annual budget of approximately USD 1 billion [68]. NOAA and NWS continue to innovate, exemplified by recent efforts such as releasing experimental street-level flood-inundation maps, which assist emergency managers in resource allocation and evacuation planning [69].
Despite their crucial roles, community leaders and emergency officials often lack decision-support tools that transform high-level data into actionable, locally relevant decisions. Both local leaders and government agencies recognize the importance of investing proactively in disaster risk reduction yet face challenges justifying these investments under stringent resource constraints [70]. A recent evaluation of web-based tools indicated a notable scarcity of essential resources, such as cost–benefit analyses for municipal mitigation strategies [21]. Nevertheless, evidence suggests every dollar invested in flood-risk mitigation yields an average savings of USD 5 in prevented damages [70]. These findings highlight the urgent need for advanced, user-centered digital tools integrating authoritative data with transparent economic analyses to facilitate informed, long-term decision-making

3.2. How Can Community Leaders Save Lives?

The timely dissemination of accurate and practical information is essential for protecting lives and property during flooding events. For instance, during the 2013 Calgary flood, residents overwhelmingly sought clear and instructive guidance detailing how, when, and where to evacuate safely [71]. Such explicit guidance constitutes the most critical communication element in situations posing imminent threats to human safety. Community leaders, serving as trusted information channels through mechanisms such as phone networks, social media, or direct interactions, can significantly enhance the effectiveness of life-saving protective actions.

4. Storytelling as a Risk-Communication Strategy

4.1. The Power of Storytelling in Driving Action

In flood-risk communication, storytelling strategically uses narrative structures to convey critical information that motivates protective behavior. Unlike traditional expository communication that presents isolated facts, risk storytelling weaves data, context, and human experience into coherent narratives. Research demonstrates that narrative text is read twice as fast and recalled twice as well compared to expository text, stemming from storytelling’s context-dependency where meaning emerges from cause-and-effect temporal structures [72]. These are chains of events that help audiences understand not just what is happening but why it matters and what might happen next. Stories provide a shared point of reference—a perceptual framing of facts that helps audiences make sense of risk information.
Stories offer increased engagement and interest while making complex environmental data accessible to non-scientific audiences [73]. This engagement is critical for flood preparedness, where taking protective action often depends on the emotional and personal connection that narratives provide [74,75].

4.2. Examples of Storytelling Channels and Mediums

Contemporary flood-risk storytelling manifests across diverse mediums and channels as illustrated in Figure 4. Visual storytelling through infographics, flood inundation maps, and data visualizations effectively engages non-scientists with complex subject matter [73]. Social media platforms, particularly Twitter, have emerged as crucial channels, with social-media-acquired information reducing flood losses by an average of 37 percent during the 2011 Bangkok flood [21].
Traditional channels such as community meetings, local news, text messages, and phone calls remain vital for reaching populations with limited digital access [76]. Storytellers include National Weather Service meteorologists, community leaders, and emergency managers, each offering distinct forms of credibility and audience reach.

4.3. The Imperative of Contextualization in Storytelling

Effective flood-risk storytelling requires contextualization to specific communities and their unique vulnerabilities, experiences, and cultural frameworks. Two-way communication through participatory approaches represents best practice, engaging people in conversations and supporting them in their current circumstances [77]. Community-based approaches like digital storytelling and flood walks are able to build archives of historic flood experience that resonate with local audiences [77]. For example, a coastal-community flood warning might reference Hurricane Katrina’s impact on similar neighborhoods, while the same event communicated to an inland agricultural community would more effectively reference historical river flooding and crop impacts.
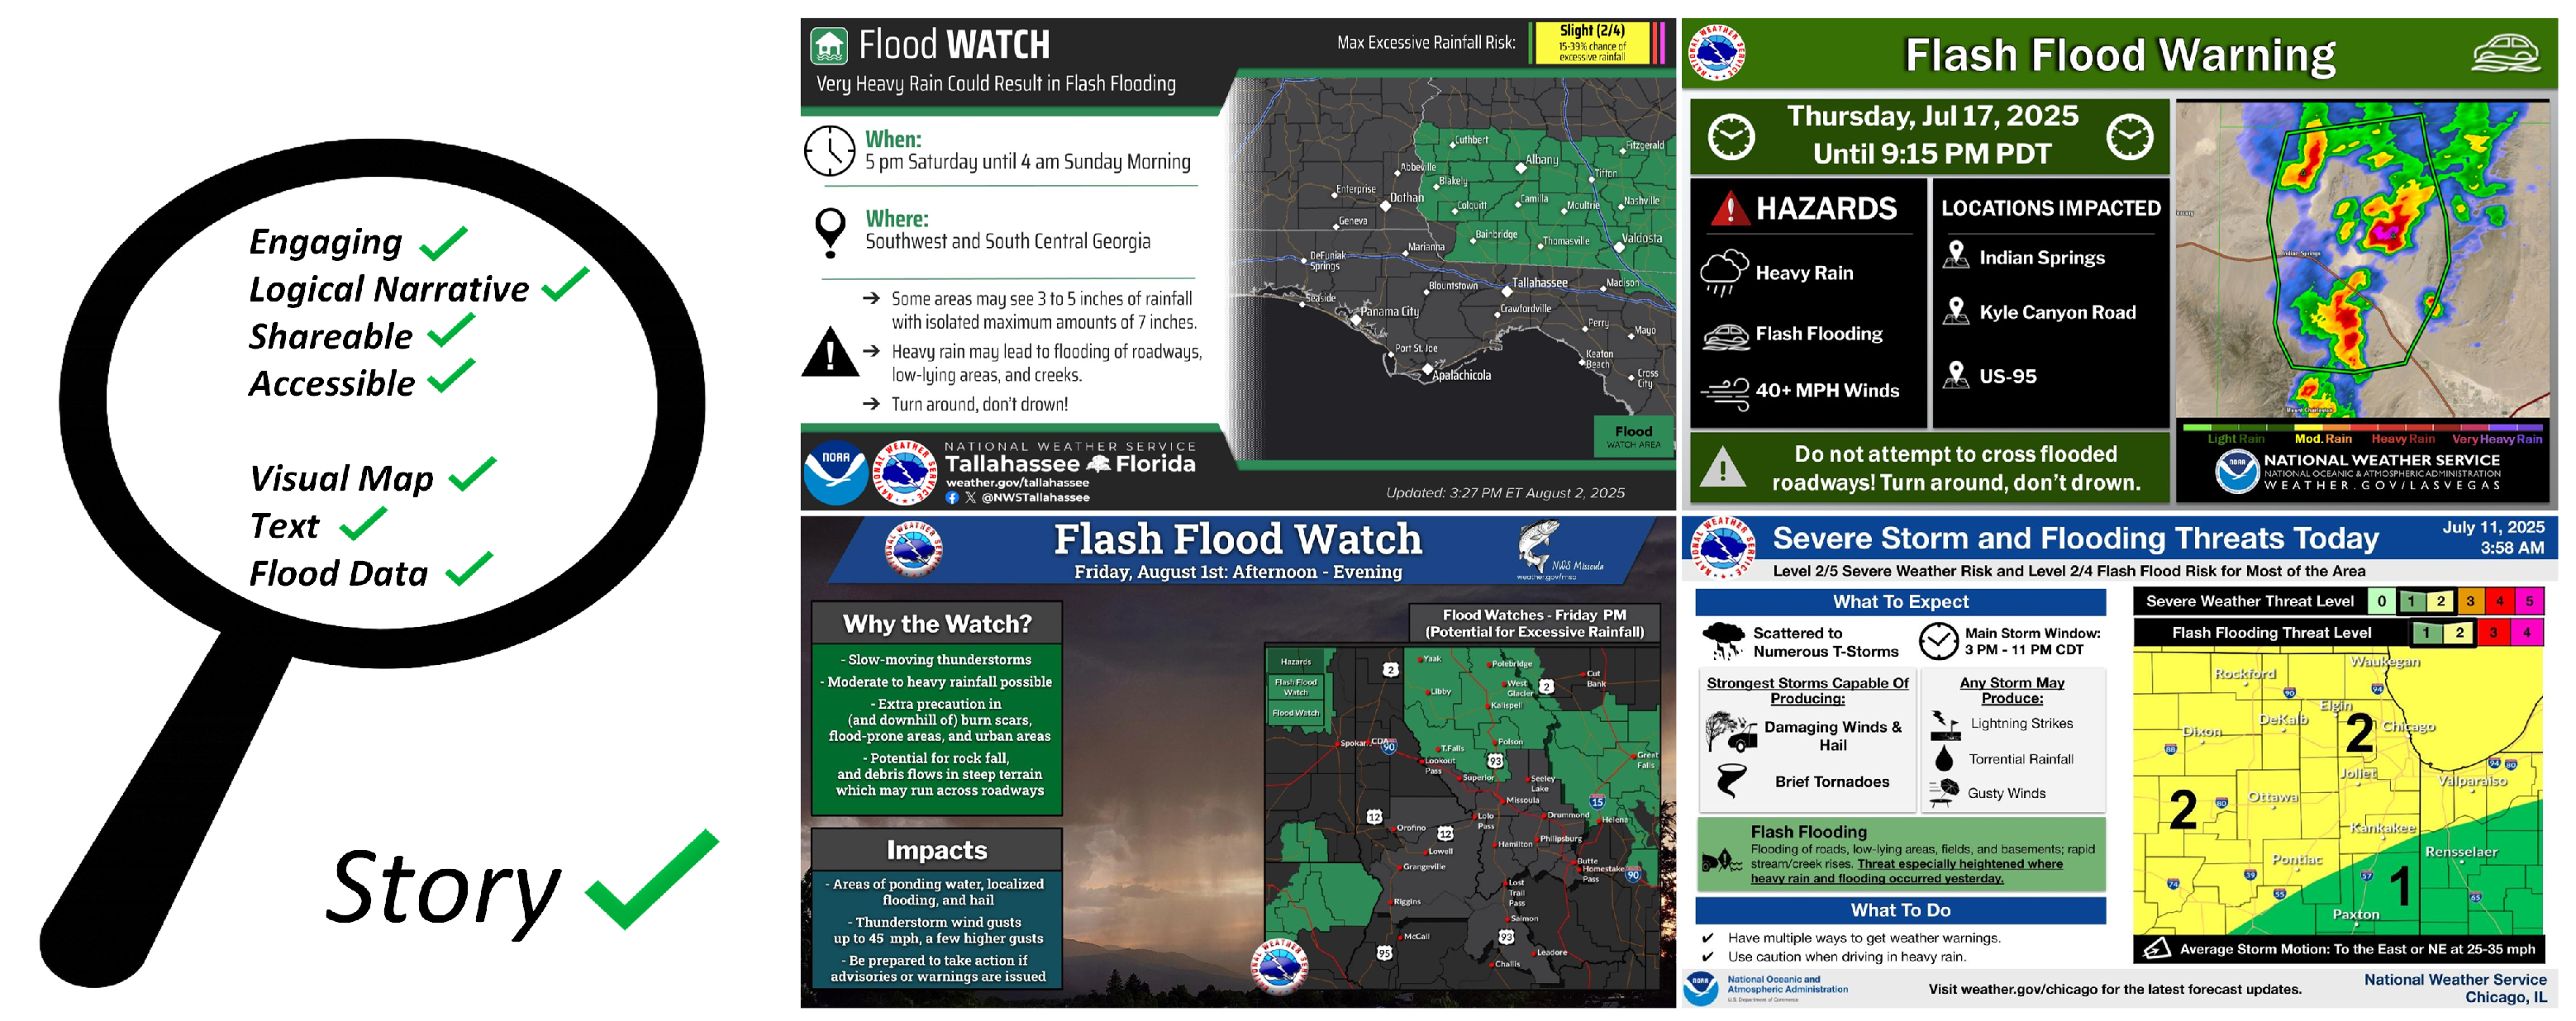
Current flood-risk storytelling often takes the form of infographics distributed through social media by agencies like the National Weather Service as shown in Figure 5. These visual communications combine meteorological data, risk zones, and protective messaging into digestible narratives for rapid social-media consumption. However, creating these pieces requires significant manual effort, with staff manually designing graphics and customizing content for different platforms.

4.4. Example of Current Risk-Communication Storytelling

While social media has proven effective for addressing short-term information needs during events, current approaches remain largely restricted to immediate response rather than long-term community preparedness [21]. Miller’s ethnographic study of the National Weather Service office in Lubbock, Texas, revealed that social media remains “a relatively new practice” with forecasters lacking centralized training, leading to varied approaches and comfort levels with these platforms [78]. One forecaster in the study expressed the time-intensive nature of expanding social-media capabilities, stating: “I think it’s a lot of work for us to have to learn [how to create videos] … if they start to go deeper, then I think they’re gonna lose a lot of us because we don’t know how to do [more complex posts]” [78] (p. 27).
Despite these challenges, social media serves not only as a communication channel but as a valuable data source for risk assessment and response. As Miller documented, National Weather Service forecasters increasingly recognize social media’s dual potential, with one forecaster noting: “especially with Twitter. [It] helps us when [people] can tweet us, you know, damage photos, [or photos of] tornadoes on the ground. So it [can help] save lives. So I think it’s essential going forward that we do implement social media in our weather forecasting” [78]. Our proposed integrated platform could leverage this dual nature by scraping social-media information to construct comprehensive flood-risk narratives while automating the labor-intensive content-creation process, addressing the current gap where manual creation of social-media content limits agencies to reactive rather than proactive community-preparedness strategies.
This limitation highlights the need for comprehensive approaches supporting both immediate response and sustained community engagement through contextualized storytelling platforms that can integrate multiple data sources—including user-generated social-media content—while reducing the technical burden on agency staff.

5. Technological Opportunities

5.1. Opportunity for Tailored, Trusted Communication

Recent advancements in artificial intelligence, particularly in large language models (LLMs), retrieval-augmented generation (RAG), and knowledge graph architectures, offer a transformative opportunity to enhance how communities prepare for and respond to flooding events. As outlined in Section 2.2 and Section 2.3, flood-related information is not lacking, but it remains highly fragmented across heterogeneous, isolated data sources. This fragmentation renders it extremely difficult for non-experts to interpret, synthesize, and apply the information, particularly in high-stress, time-sensitive emergency situations [79,80,81].
Consequently, many communities default to generic, one-size-fits-all warning systems that lack local specificity and contextual relevance, factors critical to public trust and effective action. Research consistently demonstrates that context-aware, community-tailored communication significantly narrows the gap between individuals who receive a warning and those who take protective measures in response [82,83].
By integrating state-of-the-art AI technologies, specifically knowledge graphs for data harmonization, RAG pipelines for grounding outputs in verified sources, and LLMs for generating human-readable, multimodal content, we can construct a fully autonomous, end-to-end system capable of producing personalized, context-specific flood-risk narratives. These narratives are not only more accessible to the public but also more actionable, accurate, and trustworthy.

5.2. Leveraging LLMs for Contextual Storytelling

LLMs are sophisticated statistical learning systems trained on massive, multimodal datasets encompassing text, images, and code. Recent research has shown that leading models, such as OpenAI’s GPT series, excel at generating coherent, fluent, human-like language by predicting the most probable next token in a given input sequence based on deeply learned language patterns [84]. This expressive fluency makes LLMs particularly effective in translating complex datasets into understandable natural language explanations, a critical asset in disaster risk communication.
Recent innovations in multimodal LLMs (MLLMs) [85], especially OpenAI’s GPT-4 models, have further expanded this capacity to include image generation. These models are now capable of creating visually grounded outputs such as infographics and data-driven illustrations [86,87,88], vastly enhancing their storytelling potential. Numerous studies have shown that people are more likely to understand and respond to information presented visually rather than through text alone [89].
However, a well-documented limitation of LLMs is their tendency to hallucinate, that is, to produce outputs that are syntactically convincing but factually inaccurate or entirely fabricated [90]. These hallucinations often arise when a model attempts to fulfill a prompt without sufficient grounding in reliable, structured data [84]. In the context of emergency preparedness, such inaccuracies can have serious consequences, potentially leading to ineffective or harmful decisions and resulting in property damage or loss of life [91].
To combat this risk, we propose an integrated architecture that combines the generative fluency of LLMs with the structured integrity of knowledge graphs through a RAG framework [91,92,93]. To support human-in-the-loop safeguards, the final output includes an LLM-generated reasoning summary that presents both the raw data retrieved from the RAG pipeline and the LLM’s explanation of how that data was transformed into an infographic. This ensures that the system is not merely a black box, producing outputs without exposing how decisions are made [94], but instead provides a verifiable information source that community leaders can validate for accuracy.
We discuss in Section 5.3 and Section 5.4 how combining knowledge graphs with RAG frameworks grounds LLM outputs in verified, standardized, context-specific information. The result is a storytelling system capable of generating personalized flood risk narratives and visuals that are accurate, persuasive, and actionable, enhancing public engagement and trust during critical decision-making moments.

5.3. Knowledge Graphs for Marrying Information Silos

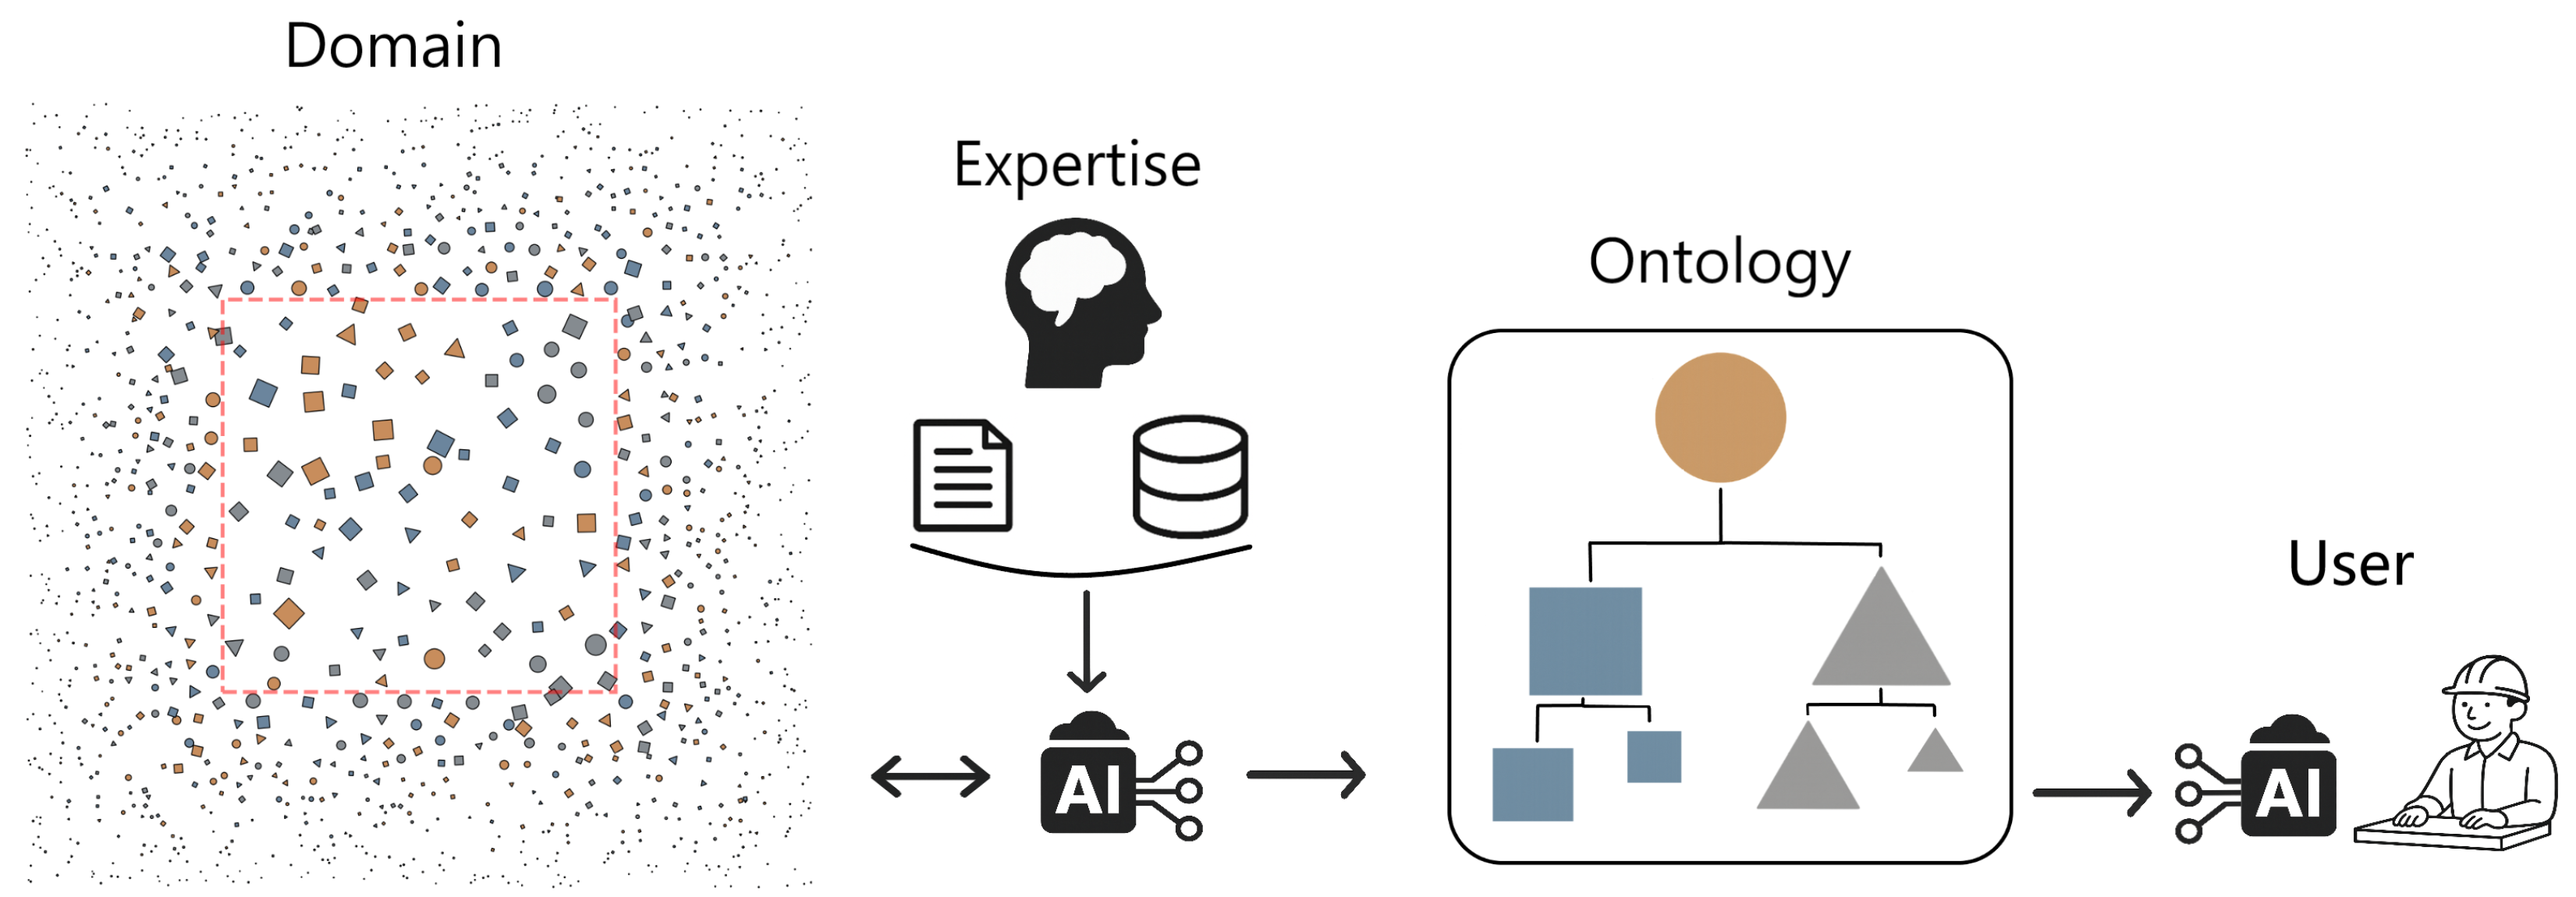
Knowledge graphs serve as robust tools to unify fragmented datasets by explicitly representing information as interconnected entities, concepts, and relationships defined through an underlying ontology. Intuitively, an ontology provides a shared conceptual framework specifying the types of entities (such as rivers, floods, or evacuations) and their possible relationships, guided by real-world use-cases and community consensus. Thus, ontologies are inherently use-case driven, formalizing domain-specific knowledge into a structured vocabulary essential for consistent interpretation across different information silos [95,96,97]. Knowledge graphs instantiate these ontologies by populating them with real-world data, creating a semantic representation that can reason intrinsically about the data relationships, enabling advanced queries and automated inference [98]. Figure 6 illustrates the relationship between use cases, ontological concepts, and the instantiated knowledge graph, demonstrating how flood-related entities and their interconnections support semantic integration from multiple data sources.
In addition to integrating static datasets, knowledge graphs can incorporate real-time or streaming data sources, including sensor networks, meteorological forecasts, and even social media content, turning them into adaptive knowledge repositories that evolve with changing conditions [99,100]. In contrast to traditional relational Structured Query Language (SQL) databases, knowledge graphs are fundamentally designed for semantic interoperability and inference, not merely data storage or retrieval. While SQL databases excel in efficiently managing structured, tabular data through explicit and predefined relational schemas, they lack the inherent flexibility and semantic richness necessary to bridge diverse, dynamic information sources and perform automated reasoning based on complex relational queries.
The fragmented nature of flood-risk information, spread across isolated governmental agencies and local stakeholders, makes knowledge graphs particularly advantageous. By harmonizing data from NOAA, FEMA, NWS, USGS, and local sources into a single semantic representation, knowledge graphs significantly reduce information overload and improve data discoverability and interoperability. This unified representation allows emergency managers and community leaders to pose complex, semantically rich questions (such as predicting likely evacuation zones or anticipating resource needs) with far greater accuracy and speed than conventional databases [101,102].
Existing disaster-management knowledge graphs and ontologies illustrate these capabilities effectively. The Flood Evacuation Ontology developed by Khantong et al. provides critical situational awareness through structured evacuation data [103]. The POLARISCO ontology exemplifies successful semantic interoperability among emergency responders, emphasizing the critical importance of maintaining shared semantics [104]. Similarly, the Ontology for Flood Process Observation (OFPO) integrates diverse flood-management stages, sensors, and data types, enabling comprehensive flood-risk decision support [105]. Collectively, these examples highlight how carefully structured knowledge representations, enabled by knowledge graphs and ontologies, can powerfully address the longstanding challenge of fragmented flood-risk information, ultimately enhancing decision-making and community resilience.

5.4. RAG for Generating Contextually Grounded Stories

Retrieval-augmented generation (RAG) pipelines address one of the key limitations of large language models (LLMs): their lack of grounding in current, verifiable information. In a typical RAG setup, a retriever converts both the user’s query and a corpus of documents into dense embeddings (numerical vectors that capture semantic meaning), ranks candidate passages by cosine similarity, and then passes the top results to the generator. Figure 7 illustrates how textual concepts such as “tropical storm Imelda” and a “response plan” appear as nearby points in embedding space, allowing the system to surface the passages most relevant to a user’s query. This approach combines the semantic fluency of AI models with the factual accuracy and context of extracted data. It improves the reliability of LLM outputs by anchoring them in authoritative source material rather than relying solely on the model’s internal knowledge, which significantly reduces hallucinations [106]. RAG has also been shown to enhance performance on knowledge-intensive NLP tasks and improve the accuracy of open-domain question answering.
In the context of flood-risk communication, RAG pipelines can enable highly localized messaging [99,106]. For example, a community leader in Baton Rouge might input a specific ZIP code and receive a narrative that references not only a general flood forecast but also past flood events, current rainfall rates, at-risk roadways, and tailored protective actions. This aligns with best practices in participatory risk communication, where messages are most effective when they reflect the specific vulnerabilities and lived experiences of the target audience [107].
RAG systems can also integrate user-generated content (such as images, damage reports, and social-media posts) into the retriever’s source corpus. When configured in this way, they act both as synthesizers of dynamic information and as real-time sense-making engines during fast-moving events [93]. This dual role allows RAG-enabled platforms to support not only accurate public messaging but also collective understanding and response during emergencies.
When paired with structured inputs like geospatial layers and demographic metadata, RAG pipelines can translate complex risk information into grounded, accessible narratives that aid public decision-making [108]. These capabilities illustrate the potential of RAG systems to deliver timely, community-specific stories that bridge data with action.

6. Proposed Platform: AI for Unified Flood Communication

6.1. Guiding Principles

Through our review of both the academic literature and existing flood-risk tools, we encountered a persistent problem: fragmentation requires communicators—especially community leaders—to spend valuable time piecing together dispersed information. This problem can be further validated, and its contours specified, through interviews and the analysis of social-media discourse on platforms such as Reddit, X, and other online forums. Having recognized this obstacle, we clarified the central need: a single space that both centralizes data and supports effective flood communication while saving time.
Storytelling consistently emerges in the literature as a highly effective communication strategy, and recent advances in AI suggest a promising path forward. Accordingly, our aim is
“To design an AI-enabled platform that centralizes fragmented flood-risk data and automatically generates context-specific narratives and visuals (stories), thereby reducing community leaders’ time synthesizing whilst improving the clarity and timeliness of public flood-risk communication.”
To reach that aim, there needs to be a map of the landscape. We must first understand—and formally represent—the domain in which these leaders operate. We identify the concepts that surround our goal and examine their relationships so that we can determine which data will truly support our envisioned solution. We anchor these conceptualizations in a trusted ethos—government flood-risk documents from NOAA, FEMA, NWS, and USGS—while remaining open to additional, relevant concepts. The resulting “diagram,” “blueprint,” or “schema” is an ontology, and its chief function is to confer situational awareness. Rosch famously noted
“The task of category systems is to provide maximum information with the least cognitive effort” [109]
Or more pointedly
“One purpose of categorization is to reduce the infinite differences among stimuli to behaviorally and cognitively usable proportions.” [109]
The ontology is not just arbitrary. A domain-specific ontology (a category system in essence), rigorously grounded in institutional flood-risk knowledge from NOAA, FEMA, NWS, and USGS, delivers exactly that benefit: lightening the cognitive load on community leaders (Figure 8).
Next, we enrich this expert map (ontology) with observations of the world—that is, data, whether qualitative or quantitative. Because large language models can process semantic data quickly, we can source information from the same expert agencies that supplied our ontology, as well as from social media, news coverage, and other culturally relevant materials that feed compelling stories. Using an LLM as an extractor and discriminator, we assign each instance or entity in the data to the proper conceptual class [110]. Once extracted and loaded, the combination of data and ontology forms a knowledge graph.
With both a reasoning-rich map and well-situated data, we can navigate more effectively. Employing the retrieval-augmented generation (RAG) technique referenced in the technology section, we couple our knowledge graph to narrative generation so that stories are contextually grounded. The RAG layer retrieves the most relevant nodes and feeds them into the LLM, which crafts a contextualized story in the medium best suited to the target audience (e.g., infographic, SMS alert, interactive map). Every output is therefore traceable to—and verifiable against—the same knowledge base. In doing so, we ensure the generation of stories that most effectively mobilize communities, educate the public, foster engagement, and, ultimately, save lives.
To review,
  • The ontology provides an efficient map of flood-risk concepts;
  • The knowledge graph links real-world data to that map, enabling reasoning;
  • RAG-driven storytelling delivers timely, audience-specific flood communication

6.2. Intended Users

The proposed platform targets two key groups of information brokers vital to building community flood resilience.
Community leaders, including local officials, nonprofit coordinators, and other respected individuals who serve as trusted, informal voices, and Formal Experts, such as meteorologists and official forecasters who generate institutional and authoritative knowledge.
This targeted approach recognizes that, particularly in high-stakes scenarios such as flooding events, simply delivering information often fails to motivate decisive action. Effective persuasion typically arises through interactive, socially influenced communication, frequently driven by local opinion leaders. These influential community members represent a strategic subset within communication networks, capable of rapidly amplifying messages and significantly influencing broader adoption of new behaviors and preparedness measures [111]. The strategic intent of the platform, therefore, is not to replace these crucial actors but to strengthen their capabilities. By equipping both community leaders and Formal Experts with unified, accessible data and streamlined storytelling tools, the platform empowers trusted voices.

6.3. Ontology and Knowledge-Graph Construction

Developing a reliable AI-enabled communication platform begins with a formal semantic framework and a data backbone that supports automated reasoning. This process outlines how we (i) create a domain ontology, (ii) collect and prepare authoritative data, (iii) extract ontology-aligned knowledge using large language models, and (iv) incorporate the resulting triples into a knowledge graph that underlies every downstream service.
The ontology forms the platform’s semantic framework. Guided by the methodology of Noy and McGuinness [97], the process involves interviewing community leaders, personnel from NOAA and NWS, and social workers to define the ontology’s scope and conceptual boundaries. Subsequently, the seed ontology is systematically refined and validated through structured competency questions, explicitly identifying new classes mentioned in question texts to ensure coverage of critical user scenarios and domain-specific needs. Furthermore, semantic alignment is rigorously achieved by integrating structured knowledge from authoritative sources, including FEMA and the National Weather Service, thereby reconciling and harmonizing flood-related terminologies across agencies. The resulting integrated ontology, validated for logical consistency using Protégé’s built-in reasoner, embodies a robust, context-sensitive resource. It organizes knowledge into mutually supportive concept families, such as FloodType (coastal, riverine, flash, and urban floods), Impact (social, economic, health, infrastructure losses), VulnerabilityFactor (poverty, age, disability, language), and ResilienceMeasure (preparedness actions, evacuation capacity). Each class is anchored to a lightweight upper taxonomy (e.g., Hazard → Flood; Impact → Economic Loss) and reuses established vocabularies such as SOSA/SSN for sensor observations and GeoSPARQL for spatial relations [112]. Following Rosch’s cognitive-economy principle [109], the approach retains only those categories providing maximal informational gain with minimal complexity. Ultimately, these rigorous validation steps ensure the ontology reliably captures real-world requirements and effectively supports rapid flood-risk communication and decision-making processes.
Populating the ontology with instances demands reliable, multi-granular evidence. The process assembles three complementary data streams. First, government repositories such as NOAA, FEMA, NWS, and USGS offer instrumented measurements and official classifications. Second, historical archives such as peer-reviewed event catalogs and municipal after-action reports provide longitudinal context that reveals how hazards and exposures change over decades. Finally, real-time social signals, curated Reddit threads, and X posts provide fine-grained situational awareness often missing from institutional feeds [113]. Together, these three data streams are integrated to form a comprehensive and multi-layered database that captures both the breadth of official knowledge and the depth of lived, real-time experiences.
After constructing the seed ontology and aggregating relevant data sources, the approach leverages the advanced natural language processing (NLP) capabilities of large language models (LLMs) to efficiently extract knowledge aligned with the ontology structure. LLMs demonstrate exceptional proficiency in identifying entities, relationships, and contextual patterns embedded in diverse data formats, ranging from structured governmental documents to unstructured social media content [110]. By automating critical NLP tasks, including named entity recognition, semantic role labeling, and relation extraction, LLMs significantly reduce the manual labor traditionally associated with data curation and annotation [13]. This automation not only accelerates the integration of new information but also enables near-real-time responsiveness, ensuring that community leaders and decision-makers rapidly receive accurate, context-rich insights during critical flood-related events. When applied appropriately, LLM-based extraction processes enhance scalability, accuracy, and consistency in populating the ontology, forming a robust foundation for analytics and storytelling.
Following the extraction of ontology-aligned knowledge using large language models, the resulting structured triples are systematically integrated into a comprehensive knowledge graph (KG), forming the foundational semantic structure for all downstream analytical and narrative services. The KG is constructed by populating the seed ontology with data extracted from authoritative and useful sources. This ensures coherence, interpretability, and ease of understanding across complex flood-risk information. Leveraging the KG’s visual interpretability and semantic precision allows for intuitive querying and precise responses to community leaders’ questions, directly supporting their decision-making processes during critical events [114].

6.4. AI Services

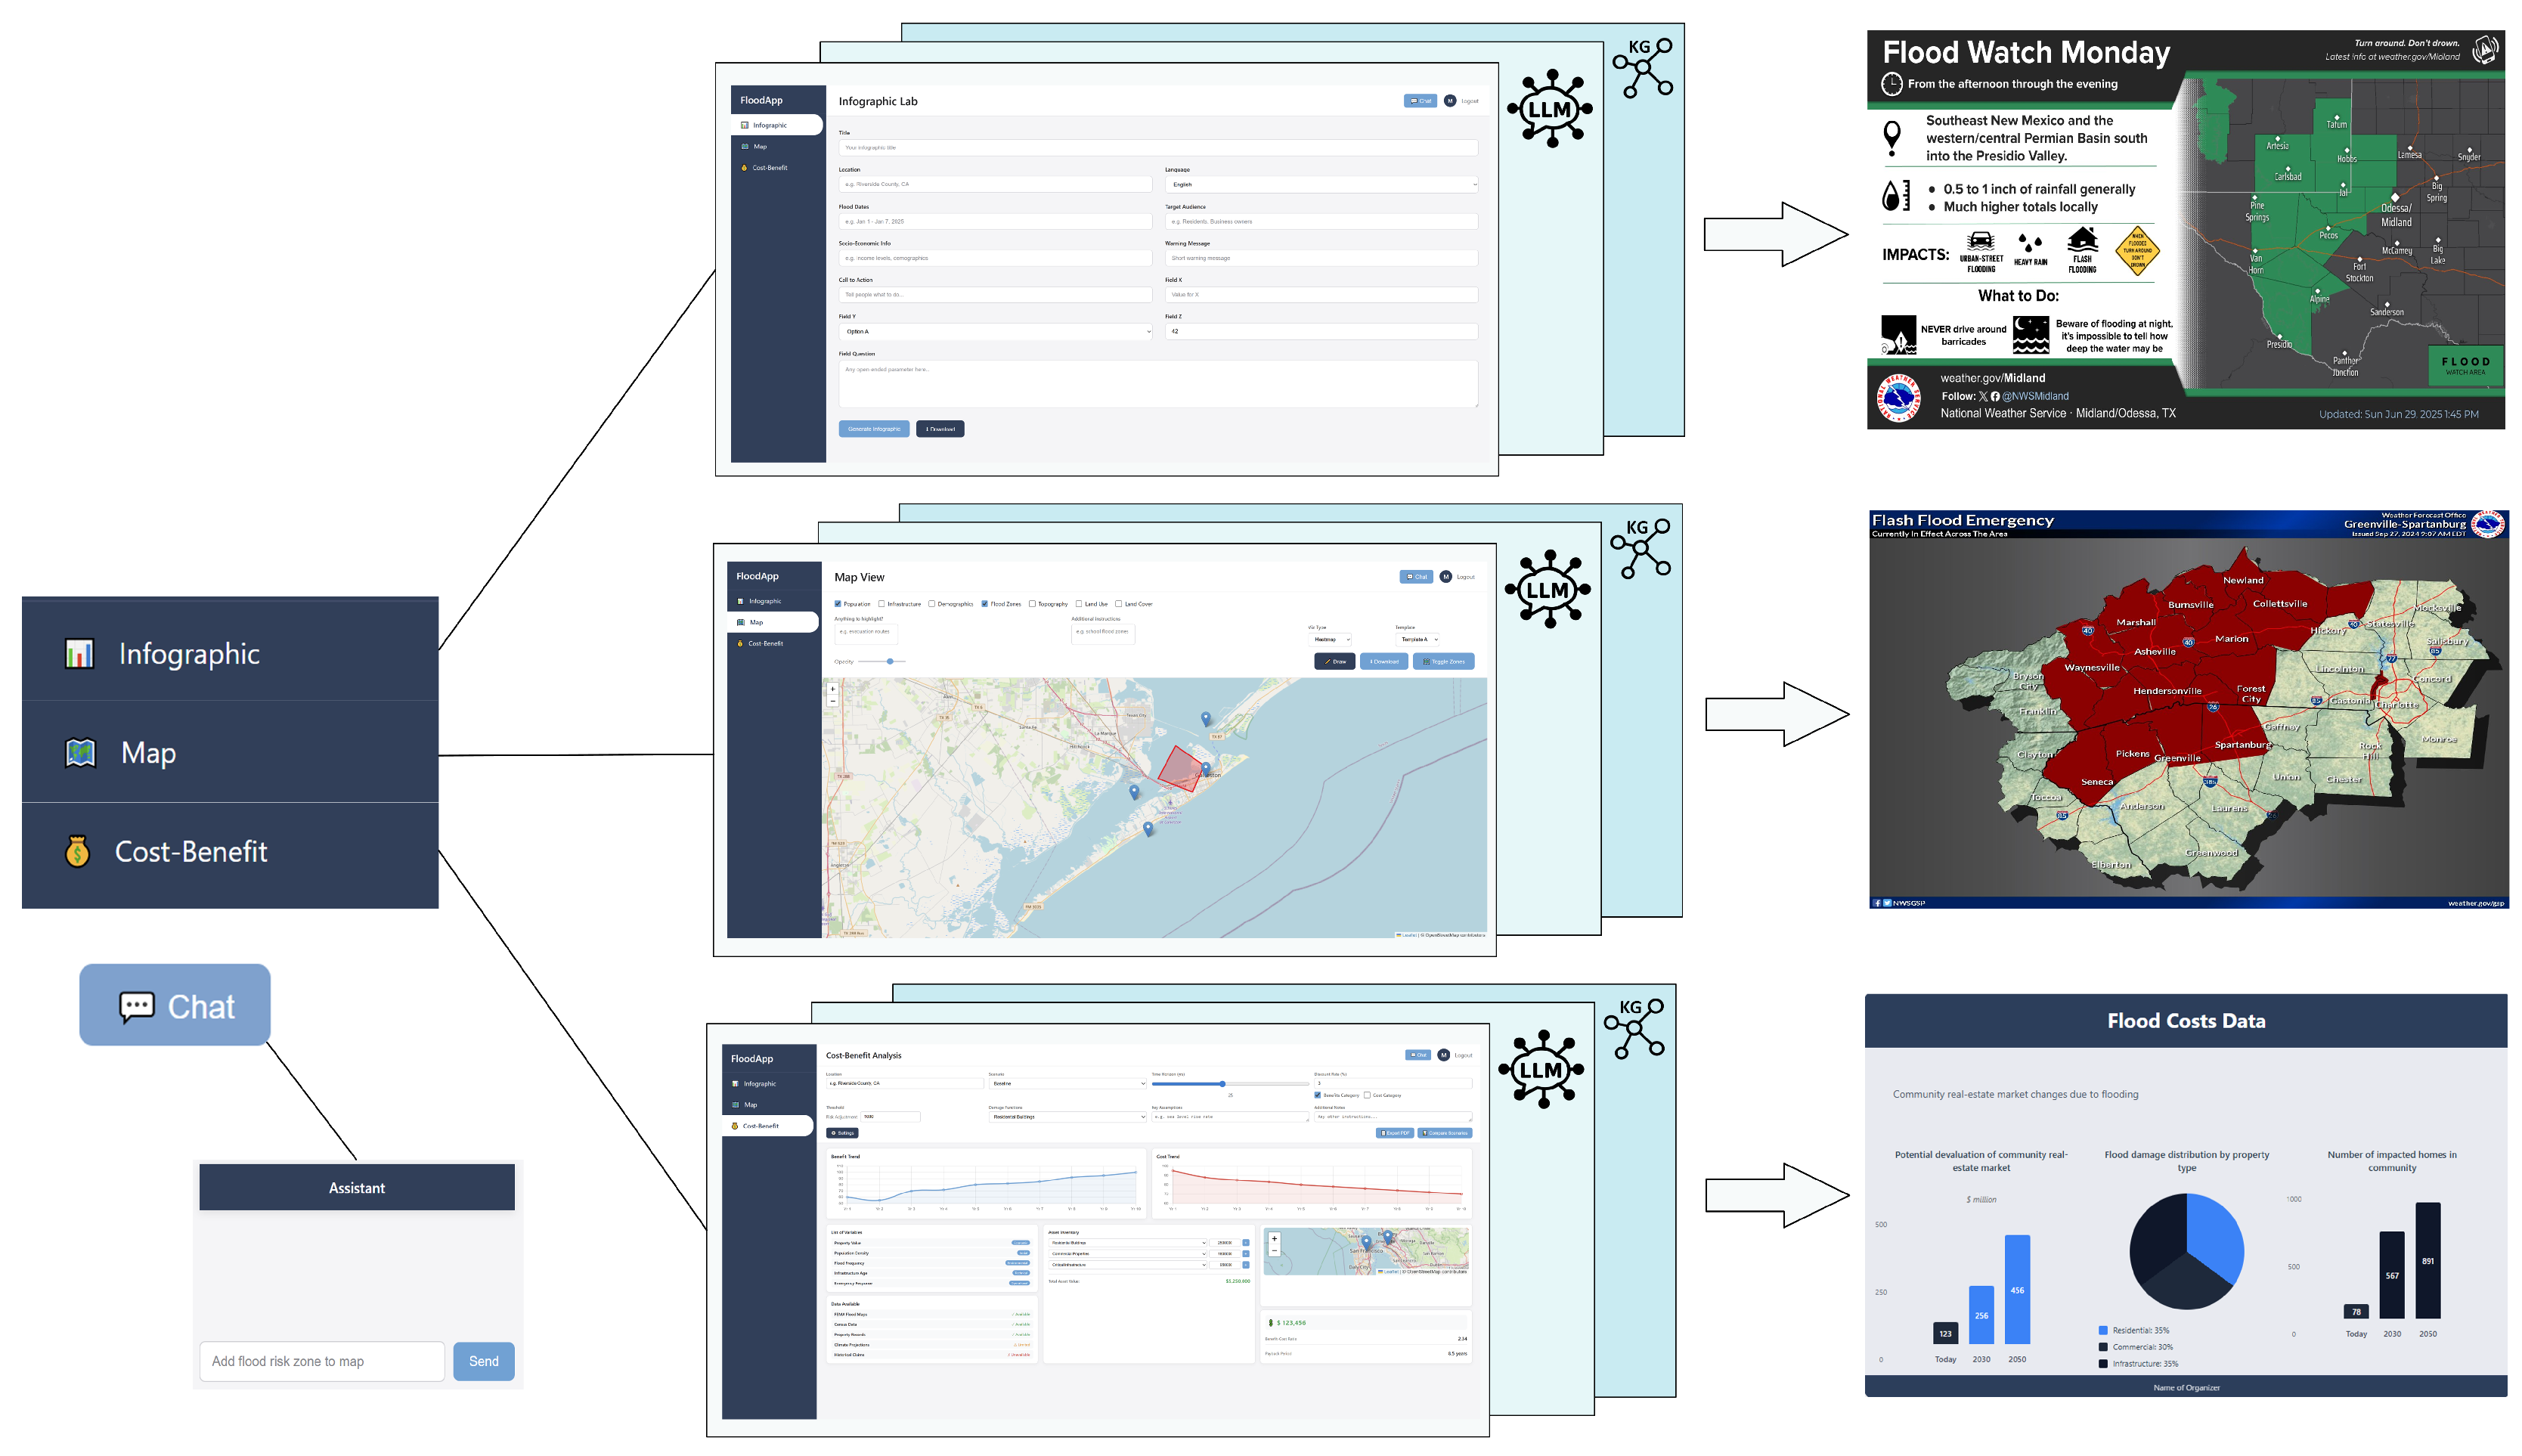
Infographic Generation via AI. Infographics represent a compelling medium for effective storytelling, uniquely capable of distilling complex flood-risk information into concise, visually appealing narratives easily understood by diverse audiences. Visual storytelling has consistently demonstrated effectiveness in engaging the public, particularly through social media platforms. Current flood-risk communication strategies employed by agencies such as NOAA and the National Weather Service (NWS) predominantly rely on static, pre-made infographics, which provide generalized rather than locally tailored information. However, the creation of customized infographics typically requires significant time and specialized graphic design expertise, such as proficiency with software like Photoshop or Canva, which limits rapid responsiveness to community-specific flood events.
Artificial intelligence presents a robust solution to this customization challenge, offering automation capabilities that substantially enhance the speed and flexibility of infographic generation. Pre-designed, standardized infographic templates serve as foundational layouts. AI tools, particularly LLMs, then dynamically generate tailored textual content based on real-time data, community-specific risks, and the evolving flood situation. Additionally, LLMs provide an image module that can refine visual appeal, automatically adjusting layout elements and graphical embellishments to ensure clarity and aesthetic coherence. By automating infographic customization, AI significantly reduces manual effort and ensures timely, context-specific visual communications during flood emergencies, thereby maximizing the impact of information dissemination [115].
Cost–Benefit Analysis. Cost–benefit analysis is a critical lens for flood-management decisions because it applies hard numbers to economic damage, social disruption, and infrastructure impacts, clarifying the costs and benefits of any project. We propose a feature that advances this practice by tying hazard maps to a knowledge graph rich in economic figures and infrastructure inventories [116]. This feature, similar to FEMA’s Hazus tool [117], would leverage an artificial intelligence and knowledge graph framework to make key metrics more accessible for officials. To ground the analysis, the application would ingest public data from the U.S. Census Bureau, the Bureau of Labor Statistics, Homeland Infrastructure Foundation-Level Data (HIFLD) [118], and FEMA’s National Flood Insurance Program (NFIP) [119] while also allowing users to customize asset inventories with local inputs. To ensure accuracy, the app would calculate a range of losses—such as direct physical repair costs, business interruption costs, and damage to essential facilities—by leveraging an extensive library of expert damage functions, including those from the U.S. Army Corps of Engineers (USACE) [120] and FEMA’s own Hazus and Benefit-Cost Analysis (BCA) framework [121]. Through a conversational panel, a community leader could model alternative scenarios and visualize the financial benefits of a proposed project, like a new levee, under various return-period or budget assumptions [122]. Once a configuration is selected, the application would use a template to export an infographic of the cost-benefit data, turning fragmented data into a story for council briefings and public communication [123].
Chatbot for Flood Information Dissemination. A chatbot represents a robust and accessible AI-driven tool that significantly enhances public engagement and responsiveness before, during, and after flood events. Utilizing advanced retrieval-augmented generation (RAG) techniques, chatbots effectively query extensive, integrated knowledge graphs populated with authoritative flood-related information. Upon receiving user queries, the chatbot efficiently retrieves relevant contextual data, providing accurate, comprehensible, and timely responses tailored to each user’s need. The strength of an AI-enabled chatbot lies in its intuitive accessibility and the immediacy of its responses. It democratizes flood-risk information by enabling individuals to engage directly with sophisticated knowledge bases without specialized technical knowledge [99]. A great example of a flood-related chatbot is FloodBrain, a large language model assistant for helping collect information on floods [124].
AI Map creation. The mapping function serves as a critical tool in enhancing public awareness, educational initiatives, and research associated with flood resilience. By visualizing diverse datasets, including demographic distributions, vulnerable populations, land-use patterns, urban–rural ratios, elevation metrics, hydrologic soil groups, drainage connectivity, historical inundation extents and infrastructure integrity, at the U.S. county scale, these interactive maps provide an intuitive method for users from various backgrounds to access and interpret complex geographic and socioeconomic information. The visual clarity and accessibility of these maps ensure usability for community leaders, educators, researchers, and the general public alike. Community leaders gain spatially precise information to guide strategic decisions and improve resource allocation, while educators can rapidly incorporate flood-preparedness concepts into lessons, fostering a deeper understanding of local risk. Most importantly, the simplified yet data-rich visualizations empower residents themselves: households can instantly see whether their neighborhood lies within a high-risk floodplain, compare past flood extents with projected scenarios, and review practical mitigation options without needing technical expertise.
By explicitly merging direct hydrological exposure indicators with socioeconomic proxies, our mapping logic addresses potential biases that may classify affluent floodplain zones as low priority. This integrated approach is well supported by the literature, [125,126]. By reducing misclassification and bias, the platform enhances community engagement, supports informed household-level actions, builds collective confidence in local resilience strategies. Evidence reinforces these benefits; on the Tagliamento River in Italy, a participatory mapping campaign produced citizen-generated risk-perception layers that closely matched official hazard maps and sparked strong interest in future river-management discussions [127]. Likewise, in Quebec, an ArcGIS StoryMaps application translated complex flood and climate-change projections into an address-searchable, slide-based narrative whose clear legends and toggleable layers substantially improved comprehension among residents and municipal decision-makers [128]. A representation of all the features in the proposed FLAI system is provided in Figure 9.

6.5. Comparison to Existing Tools

There are currently many tools developed by private entities and research teams alike as shown in Table 4. These tools offer different features, some similar and some absent, while our proposed solution offers all of them along with a feature that none of the others provide: tailored infographic generation for quick, efficient information dissemination. While other tools may provide risk analysis and map visualization features, they still lack the ability to disseminate the information effectively. Google Flood Hub [129], for instance, provides flood inundation forecasts, gauge readings, and river level forecasts while leveraging machine learning. The information generated by this tool is useful; however, it lacks the ability to present the information in a meaningful way. Without support for creating materials to disseminate the information, the burden of this task falls entirely on the user. Similar issues exist with other tools, which also lack features to help users share information after it has been acquired. This increases the chance of human error during the creation of communication materials.
Some tools are not freely accessible to most individuals. Private firms use machine learning models for climate prediction and risk analysis, often serving insurance companies. In the business-to-business market, the exact services being provided are difficult to determine, as their products are not available for public testing or review. Jupiter Intelligence, a private organization, offers climate risk analysis tools to businesses [130], though what they provide depends on the specific needs of each client. The idea of tailoring a product to meet individual needs is exactly what we aim to achieve with the creation of the FLAI tool. Our approach gives users access to the most important information and the tools to share it effectively.
The information provided by these sources is typically presented through map tools and forecasts related to risk analysis. There is a clear absence of the ability to present tailored information. An image generation tool, like the one developed by MIT [131], can help visualize the impact of a flood. Our infographic feature allows users to create custom materials to help community leaders distribute information. While image generation tools may illustrate the impacts of a flood event, the infographic tool helps individuals understand and prepare for expert predictions. These infographics can also be tailored and further customized to highlight the most relevant information, depending on what the community leader considers important.
The FLAI tool would provide users with a free application that includes infographic creation assistance, flood narratives, and analysis tools. While similar features may be offered through private services, our tool is free and enables users to easily share the information it generates. It provides a unique combination of necessary analytical features and dissemination tools that are not currently available in a single, publicly accessible platform.

7. Discussion and Implications

7.1. Benefits

The proposed platform delivers tangible social benefits for the entire spectrum of flood communicators—church leaders, local government officials, forecasters, news anchors, social-service workers, and nonprofit managers—by supporting both proactive preparedness and reactive response.
First, the platform closes the critical delay between a flood’s onset and a leader’s response. The automated story generation condenses a variety of historical, institutional, and social-media posts into publish-ready alerts in a timely manner, so community leaders can issue clear guidance while a flood is still unfolding. It ensures victims gain timely access to instructions even when bandwidth, attention, and patience are scarce.
But, just as importantly, or even more importantly, the system serves as a proactive educator. The automatic generation of maps and infographics translates forecasts and mitigation tips into stories that community members can absorb online, in town-hall meetings, or church services. For the community leaders and communicators, the same system provides the centralization of information and eliminates the time needed to scavenge across fragmented sources. Psychologist George A. Miller’s classic finding that human working memory tops out at “about seven, plus or minus two” independent chunks explains why such condensation is vital: without it, even experienced officials struggle to juggle the dozens of parameters that exist for flood resilience [132].
Centralizing those fragmented sources tackles the deeper problem of information overload. Herbert Simon warned that “a wealth of information creates a poverty of attention,” arguing that modern crises are defined less by data scarcity than by the human bottleneck of selective focus [133]. Organizing NOAA forecasts, FEMA directives, local sensor readings, and crowd-sourced observations into a coherent ontology safeguards that scarce attentional resource—delivering the right fact, to the right voice, at the right moment, and thereby elevating community resilience from reactive improvisation to deliberate, context-driven practice.

7.2. Broader Impact

The framework proposed in this paper has implications that extend far beyond flood-risk communication. The platform’s core principles of unifying fragmented data, establishing a coherent organizational structure, and leveraging AI for narrative generation are fundamentally generalizable. This model could be readily adapted to enhance risk communication for other major threats, such as wildfires, by integrating data from sources like the National Interagency Fire Center (NIFC) or risk-mapping products from the U.S. Forest Service. Similarly, it could address the challenges of extreme heat events by leveraging information from the National Integrated Heat Health Information System (Heat.gov), a joint effort by NOAA and the CDC. By applying the same methodology, the system could generate tailored, life-saving narratives for communities facing a wide array of environmental hazards, thereby advancing risk communication generally.
Furthermore, the framework developed is not only valuable for crisis communication but also lays the groundwork for a much-needed modernization of public-sector data management. Current government data systems often lag significantly behind industry standards, hindering the adoption of modern technologies. As a recent Government Accountability Office (GAO) report highlights, approximately 80 percent of the more than USD 100 billion the federal government spends annually on IT and cyber-related investments is dedicated to operating and maintaining existing legacy systems [134]. This technological debt creates significant barriers; a 2021 KPMG report found that 60 percent of executives from federal and state government agencies believe their current IT systems are hurting their ability to integrate new tools, with 79 percent stating that the age of their systems negatively impacts their agency’s mission [135].
Our proposed framework offers a direct solution to this widespread issue. The challenge of modernizing government data is often rooted in understanding and integrating decades of siloed information. As Oskuie (2023) points out, the first step of liberating legacy data is “creating a comprehensive data dictionary, which involves understanding the structure and organization of the mainframe data… and mapping the data elements” [135]. The ontology and automated knowledge-graph construction at the core of our system are designed to achieve precisely this. By creating a unified semantic layer, the framework allows for the convergence of “data from both legacy systems and new sources,” which can then be transformed “into useful information for real-time decision-making” that government officials, analysts, and the general public can easily search and utilize [135]. This process, which we have conceptualized for flood risk, provides a robust and replicable blueprint for any government domain or sector struggling with fragmented information, setting the stage for a new generation of AI-ready, data-driven public services.

8. Conclusions

This paper set out to improve flood-risk communication by exploring how artificial intelligence (AI) can help community leaders and experts translate fragmented data into actionable insights. Focusing on AI-based solutions such as ontologies, knowledge graphs, large language models (LLMs), and retrieval-augmented generation (RAG), we reviewed both government and non-government flood information sources, assessed current communication modalities and channels, synthesized the literature on the role of community leaders, and analyzed the strengths and weaknesses of existing flood-risk tools. Our results highlight three key challenges: first, the fragmentation of flood-risk information across agencies and platforms; second, information overload, which hinders timely decision-making; and third, the absence of a unified platform that effectively integrates communication and actionable data.
Building on these results, we find that AI-driven techniques—especially when paired with infographics as the primary communication modality and social media as a preferred channel—can significantly enhance the clarity and accessibility of flood-risk messages. The proposed FLAI platform and framework addresses the identified gaps by combining ontologies, knowledge graphs, and LLM-based storytelling to generate contextualized, audience-specific narratives, maps, and cost–benefit visuals. This integrated approach not only reduces cognitive burden for community leaders but also strengthens public preparedness and resilience.
A key strength of this work lies in its interdisciplinary synthesis, uniting flood-risk communication, community-based perspectives, and state-of-the-art AI technologies into a coherent framework. However, the study remains primarily conceptual and exploratory; empirical validation and field deployment of the FLAI platform are required. The roadmap for addressing this limitation is detailed in the Section 9, which outlines the next steps for testing and refining the framework in real-world scenarios.

9. Future Work

To further advance the FLAI platform and strengthen its real-world utility, several research and development efforts are currently underway or planned. One priority is to construct a flood communication-specific ontology using authoritative documents, large language models, and human feedback, formalized in OWL. This ontology will then be populated with concrete data from the same authoritative sources, along with web-scraped flood information, to create a stakeholder-specific dynamic knowledge graph. We also plan to analyze social media platforms such as Reddit to extract public attitudes, needs, and requirements related to flood resilience. These insights will help expand and validate the ontology, making it more grounded in real-world community perspectives. In parallel, we are developing a web application, which will be validated through semi-structured stakeholder interviews involving community leaders and others engaged in flood-risk communication. An additional research direction that emerged during this work is the potential utility of incorporating the contact information of community leaders’ followers into the webapp and the knowledge graph to enable faster dissemination. This would require designing a new framework or strategy for effective community data collection.

Author Contributions

M.Z.: Conceptualization, Project administration, Writing—original draft, Writing—review and editing, Visualization. C.K.: Writing—original draft, Visualization, Data curation. S.L.: Writing—original draft, Methodology, Writing—review and editing, Visualization. C.E.: Writing—original draft. N.H.: Writing—original draft. J.G.: Conceptualization, Supervision, Funding acquisition, Writing—review and editing. All authors have read and agreed to the published version of the manuscript.

Funding

Funding for this project was provided in part by the NOAA, awarded to the Cooperative Institute for Research to Operations in Hydrology (CIROH) through the Cooperative Agreement with The University of Alabama (NA22NWS4320003). The Cooperative Institute for Research to Operations in Hydrology operates under Cooperative Agreement #NA22NWS4320003 from the National Oceanic and Atmospheric Administration, U.S. Department of Commerce. The statements, findings, conclusions, and recommendations presented are those of the authors and do not necessarily reflect the views of the National Oceanic and Atmospheric Administration or the Department of Commerce.

Data Availability Statement

No new data were created or analyzed in this study. Data sharing is not applicable to this article.

Acknowledgments

During the preparation of this manuscript, the authors used Generative AI tools (GPT4o) to generate some icons in the figures based on the authors’ own sketches, as well as to assist with text generation in parts of the paper. The authors have reviewed and edited the output and take full responsibility for the content of this publication.

Conflicts of Interest

The authors declare no conflicts of interest. The funders had no role in the design of the study; in the collection, analyses, or interpretation of data; in the writing of the manuscript; or in the decision to publish the results.

Abbreviations

The following abbreviations are used in this manuscript:
AIArtificial Intelligence
CDCCenters for Disease Control and Prevention
FEMAFederal Emergency Management Agency
FEWSFlood Early Warning Systems
FLAIFlood Language AI
GAOGovernment Accountability Office
GPTGenerative Pre-trained Transformer
KGKnowledge Graph
LLMLarge Language Model
MLLMMultimodal Large Language Model
NIFCNational Interagency Fire Center
NOAANational Oceanic and Atmospheric Administration
NLPNatural Language Processing
NWSNational Weather Service
OFPOOntology for Flood Process Observation
POLARISCOOperational Platform for Interagency Civil Security Intelligence Updating
RAGRetrieval-Augmented Generation
SOSASensor, Observation, Sample, and Actuator Ontology
SQLStructured Query Language
SSNSemantic Sensor Network Ontology
USGSUnited States Geological Survey

References

  1. Rentschler, J.; Salhab, M.; Jafino, B.A. Flood Exposure and Poverty in 188 Countries. Nat. Commun. 2022, 13, 3527. [Google Scholar] [CrossRef]
  2. Kirezci, E.; Young, I.R.; Ranasinghe, R.; Lincke, D.; Hinkel, J. Global-Scale Analysis of Socioeconomic Impacts of Coastal Flooding over the 21st Century. Front. Mar. Sci. 2023, 9, 1024111. [Google Scholar] [CrossRef]
  3. United Nations Office for Disaster Risk Reduction. Global Assessment Report on Disaster Risk Reduction 2022: Our World at Risk: Transforming Governance for a Resilient Future; United Nations Office for Disaster Risk Reduction: Geneva, Switzerland, 2022. [Google Scholar]
  4. Kaya, Y. Automated Estimation of Building Heights with ICESat-2 and GEDI LiDAR Altimeter and Building Footprints: The Case of New York City and Los Angeles. Buildings 2024, 14, 3571. [Google Scholar] [CrossRef]
  5. Dietrich, J.T.; Magruder, L.A.; Holwill, M. Monitoring Coastal Waves with ICESat-2. J. Mar. Sci. Eng. 2023, 11, 2082. [Google Scholar] [CrossRef]
  6. Wiley, K.; Adams, C. Flash Flooding Claimed More Than 100 Lives in Central Texas. Here’s What We Know About the Victims. KXAN. 2025. Available online: https://www.kxan.com/central-texas/2025-central-texas-hill-country-flash-flooding-victims/ (accessed on 22 July 2025).
  7. Koch, A. Deadly Texas Flood Exposes Neglected Infrastructure. Yahoo News. Available online: https://www.yahoo.com/news/deadly-texas-flood-exposes-neglected-232505520.html (accessed on 22 July 2025).
  8. Hernandez, J. How Good Was the Forecast? Texas Officials and the National Weather Service Disagree. NPR. Available online: https://www.npr.org/2025/07/06/nx-s1-5458512/texas-flash-flood-weather-forecast (accessed on 22 July 2025).
  9. Arnold, M.; Goldschmitt, M.; Rigotti, T. Dealing with information overload: A comprehensive review. Front. Psychol. 2023, 14, 1122200. [Google Scholar] [CrossRef] [PubMed]
  10. Fang, N.Z.; Bedient, P.B.; Brody, S.; Zaretsky, M.; Li, D.D.; Li, W.; Greenwood, K.; Furrh, T. Flood Early Warning Systems (FEWS) Guidance Document for Texas; Texas Water Development Board Contract No. 2101792481 Final Report, Received 10 February 2023; Texas Water Development Board (TWDB): Austin, TX, USA, 2023. [Google Scholar]
  11. Fansher, M.; Walls, L.; Hao, C.; Subramonyam, H.; Boduroglu, A.; Shah, P.; Witt, J.K. Narrative visualizations: Depicting accumulating risks and increasing trust in data. Cogn. Res. Princ. Implic. 2025, 10, 7. [Google Scholar] [CrossRef] [PubMed]
  12. Sermet, Y.; Demir, I. Towards an information centric flood ontology for information management and communication. Earth Sci. Inform. 2019, 12, 541–551. [Google Scholar] [CrossRef]
  13. Zhu, R.; Shimizu, C.; Stephen, S.; Fisher, C.K.; Thelen, T.; Currier, K.; Janowicz, K.; Hitzler, P.; Schildhauer, M.; Li, W.; et al. The KnowWhereGraph: A Large-Scale Geo-Knowledge Graph for Interdisciplinary Knowledge Discovery and Geo-Enrichment. arXiv 2025, arXiv:2502.13874. [Google Scholar]
  14. Staff, J.E.C.D. Flooding Costs the U.S. Between $179.8 and $496.0 Billion Each Year. United States Joint Economic Committee. 2024. Available online: https://www.jec.senate.gov/public/index.cfm/democrats/2024/6/flooding-costs-the-u-s-between-179-8-and-496-0-billion-each-year (accessed on 9 June 2025).
  15. National Weather Service. Official Website. Available online: https://www.weather.gov (accessed on 9 June 2025).
  16. National Weather Service. Historic July 26th–July 30th, 2022 Eastern Kentucky Flooding. Available online: https://www.weather.gov/jkl/July2022Flooding (accessed on 9 June 2025).
  17. Tompkins, F.; Watts, B. Flooding Is Nearly a Daily Occurrence Throughout the U.S. The Pew Charitable Trusts—U.S. Conservation. 15 December 2022. Available online: https://www.pew.org/en/research-and-analysis/articles/2022/12/15/flooding-is-nearly-a-daily-occurrence-throughout-the-us (accessed on 25 June 2025).
  18. Stanke, C.; Murray, V.; Amlôt, R.; Nurse, J.; Williams, R. The effects of flooding on mental health: Outcomes and recommendations from a review of the literature. PLoS Curr. 2012, 4, e4f9f1fa9c3cae. [Google Scholar] [CrossRef]
  19. Chinguwo, D.D.; Deus, D. Assessment of community-based flood early warning system in Malawi. Jàmbá J. Disaster Risk Stud. 2022, 14, 1166. [Google Scholar] [CrossRef]
  20. Li, C.; Wang, H.; Wu, J.; Li, N. Impacts of Urbanization on Flooding: A Bibliometric Analysis Based on CiteSpace. Nat. Hazards 2020, 104, 1945–1972. [Google Scholar] [CrossRef]
  21. Mostafiz, R.B.; Rohli, R.V.; Friedland, C.J.; Lee, Y. Actionable Information in Flood Risk Communications and the Potential for New Web-Based Tools for Long-Term Planning for Individuals and Community. Front. Earth Sci. 2022, 10, 840250. [Google Scholar] [CrossRef]
  22. Weather Underground. Homepage. Available online: https://www.wunderground.com/ (accessed on 17 June 2025).
  23. U.S. Geological Survey. Flood Inundation Mapping (FIM) Program. Available online: https://www.usgs.gov/mission-areas/water-resources/science/flood-inundation-mapping-fim-program (accessed on 17 June 2025).
  24. California Department of Water Resources. California Data Exchange Center (CDEC). Available online: https://cdec.water.ca.gov/ (accessed on 17 June 2025).
  25. National Flood Insurance Program. FloodSmart.gov Homepage. Available online: https://www.floodsmart.gov/ (accessed on 17 June 2025).
  26. National Severe Storms Laboratory. Severe Weather 101—Floods. Available online: https://www.nssl.noaa.gov/education/svrwx101/floods/ (accessed on 17 June 2025).
  27. Federal Emergency Management Agency. Floods. Ready.gov. Available online: https://www.ready.gov/floods (accessed on 17 June 2025).
  28. National Oceanic and Atmospheric Administration. NOAA Weather Radio. Available online: https://www.weather.gov/nwr/ (accessed on 17 June 2025).
  29. Federal Communications Commission. Emergency Alert System (EAS). Available online: https://www.fcc.gov/emergency-alert-system (accessed on 17 June 2025).
  30. Federal Emergency Management Agency. FEMA Flood Map Service Center. Available online: https://msc.fema.gov/portal/home (accessed on 17 June 2025).
  31. National Weather Service. Wireless Emergency Alerts (WEA) Information. Available online: https://www.weather.gov/riw/WEA_Info (accessed on 17 June 2025).
  32. Federal Emergency Management Agency. Integrated Public Alert and Warning System (IPAWS). Available online: https://www.fema.gov/emergency-managers/practitioners/integrated-public-alert-warning-system (accessed on 17 June 2025).
  33. National Oceanic and Atmospheric Administration. Sea Level Rise Viewer. Available online: https://coast.noaa.gov/slr/ (accessed on 17 June 2025).
  34. NOAA National Centers for Environmental Information. Storm Events Database. Available online: https://www.ncdc.noaa.gov/stormevents/ (accessed on 17 June 2025).
  35. Harris County Flood Warning System. Homepage. Available online: https://www.harriscountyfws.org/ (accessed on 17 June 2025).
  36. Iowa Flood Center. Iowa Flood Information System (IFIS). Available online: https://ifis.iowafloodcenter.org/ifis/ (accessed on 17 June 2025).
  37. American Red Cross. Flood Safety. Available online: https://www.redcross.org/get-help/how-to-prepare-for-emergencies/types-of-emergencies/flood.html (accessed on 17 June 2025).
  38. Meta. Facebook Homepage. Available online: https://www.facebook.com/ (accessed on 17 June 2025).
  39. TikTok Inc. TikTok Homepage. Available online: https://www.tiktok.com/en/ (accessed on 17 June 2025).
  40. Yale Center for Environmental Communication. Yale Climate Connections. Available online: https://yaleclimateconnections.org/ (accessed on 17 June 2025).
  41. Fox News Media. Fox Weather Homepage. Available online: https://www.foxweather.com/ (accessed on 17 June 2025).
  42. WeatherNation TV. Homepage. Available online: https://www.weathernationtv.com/ (accessed on 17 June 2025).
  43. Space City Weather. Houston Weather Blog. Available online: https://spacecityweather.com/ (accessed on 17 June 2025).
  44. The Weather Company. Weather.com Homepage. Available online: https://weather.com/ (accessed on 17 June 2025).
  45. AccuWeather Inc. Homepage. Available online: https://www.accuweather.com/ (accessed on 17 June 2025).
  46. Spann, J. Personal X (Formerly Twitter) Page. Available online: https://x.com/spann?lang=en (accessed on 17 June 2025).
  47. Holthaus, E. July 28, 2024 Update. Currently. Available online: https://www.currentlyhq.com/p/july-28-2024 (accessed on 17 June 2025).
  48. Mass, C. Cliff Mass Weather Blog. Available online: https://cliffmass.blogspot.com/ (accessed on 17 June 2025).
  49. Cantore, J. Personal X (Formerly Twitter) Page. Available online: https://x.com/JimCantore (accessed on 17 June 2025).
  50. Zee, G. Personal X (Formerly Twitter) Page. Available online: https://x.com/Ginger_Zee (accessed on 17 June 2025).
  51. First Street Foundation. Flood Risk Methodology. Available online: https://firststreet.org/methodology/flood (accessed on 17 June 2025).
  52. ClimateCheck. Homepage. Available online: https://climatecheck.com/ (accessed on 17 June 2025).
  53. YouGov. How and Where Americans Get Information About the Weather. YouGov U.S. 22 May 2024. Available online: https://today.yougov.com/health/articles/45672-how-and-where-americans-get-information-weather (accessed on 25 June 2025).
  54. Esparza, M.; Farahmand, H.; Brody, S.; Mostafavi, A. Examining Data Imbalance in Crowdsourced Reports for Improving Flash Flood Situational Awareness. arXiv 2022, arXiv:2207.05797. [Google Scholar] [CrossRef]
  55. Cable News Network (CNN). Weather Homepage. Available online: https://www.cnn.com/weather (accessed on 17 June 2025).
  56. NBC News. Weather Homepage. Available online: https://www.nbcnews.com/weather (accessed on 17 June 2025).
  57. ABC News. Weather Homepage. Available online: https://abcnews.go.com/alerts/weather (accessed on 17 June 2025).
  58. CBS News. Weather Homepage. Available online: https://www.cbsnews.com/weather (accessed on 17 June 2025).
  59. Fox News. Weather Category. Available online: https://www.foxnews.com/category/weather (accessed on 17 June 2025).
  60. Newsmax Inc. Homepage. Available online: https://www.newsmax.com/ (accessed on 20 July 2025).
  61. NewsNation LLC Homepage. Available online: https://www.newsnationnow.com/ (accessed on 20 July 2025).
  62. Federal Emergency Management Agency. Flood Safety Social Media Toolkit. Available online: https://www.ready.gov/flood-toolkit (accessed on 9 June 2025).
  63. National Weather Service. Flood Infographics. Weather-Ready Nation. 2025. Available online: https://www.weather.gov/wrn/flood_infographics (accessed on 26 June 2025).
  64. Venhuizen, G.J.; Hut, R.; Albers, C.; Stoof, C.R.; Smeets, I. Flooded by jargon: How the interpretation of water-related terms differs between hydrology experts and the general audience. Hydrol. Earth Syst. Sci. 2019, 23, 393–403. [Google Scholar] [CrossRef]
  65. Traboco, L.; Pandian, H.; Nikiphorou, E.; Gupta, L. Designing Infographics: Visual Representations for Enhancing Education, Communication, and Scientific Research. J. Korean Med. Sci. 2022, 37, e214. [Google Scholar] [CrossRef]
  66. Atanga, R.A. The role of local community leaders in flood disaster risk management strategy making in Accra. Int. J. Disaster Risk Reduct. 2020, 43, 101358. [Google Scholar] [CrossRef]
  67. National Oceanic and Atmospheric Administration. NOAA by the Numbers: NOAA’s Value to the Nation. Available online: https://repository.library.noaa.gov/view/noaa/17891 (accessed on 17 June 2025).
  68. Shrader, J.G.; Bakkensen, L.; Lemoine, D. Fatal Errors: The Mortality Value of Accurate Weather Forecasts. Center for Economic Studies, U.S. Census Bureau. 2023. Available online: https://www2.census.gov/ces/wp/2023/CES-WP-23-30.pdf (accessed on 17 June 2025).
  69. National Oceanic and Atmospheric Administration. NWS Unveils New Experimental Flood Inundation Maps. Available online: https://www.weather.gov/news/232609-experimental-flood-inundation-maps (accessed on 17 June 2025).
  70. Mechler, R.; Czajkowski, J.; Kunreuther, H.; Michel-Kerjan, E.; Botzen, W.; Keating, A.; McQuistan, C.; Cooper, N.; O’Donnell, I. aking Communities More Flood Resilient: The Role of Cost-Benefit Analysis and Other Decision-Support Tools in Disaster Risk Reduction. Zurich Flood Resilience Alliance. 2014. Available online: https://pure.iiasa.ac.at/id/eprint/11193/ (accessed on 17 June 2025).
  71. Magnusson, M. Information Seeking and Sharing During a Flood. In Proceedings of the European Conference on Social Media ECSM 2014, Brighton, UK, 10–11 July 2014; Available online: https://www.researchgate.net/publication/295869397 (accessed on 17 June 2025).
  72. Dahlstrom, M.F. Using Narratives and Storytelling to Communicate Science with Nonexpert Audiences. Proc. Natl. Acad. Sci. USA 2014, 111, 13614–13620. [Google Scholar] [CrossRef]
  73. Grainger, S.; Mao, F.; Buytaert, W. Environmental Data Visualization for Non-scientific Contexts: Literature Review and Design Framework. Environ. Model. Softw. 2016, 85, 299–318. [Google Scholar] [CrossRef]
  74. Slovic, P.; Finucane, M.L.; Peters, E.; MacGregor, D.G. Risk as Analysis and Risk as Feelings: Some Thoughts about Affect, Reason, Risk, and Rationality. Risk Anal. 2004, 24, 311–322. [Google Scholar] [CrossRef] [PubMed]
  75. Terpstra, T. Emotions, Trust, and Perceived Risk: Affective and Cognitive Routes to Flood Preparedness Behavior. Risk Anal. 2011, 31, 1658–1675. [Google Scholar] [CrossRef]
  76. Northwest Center for Public Health Practice. Plan for Hard-to-Reach Populations. In Emergency Risk Communication (Section 3: Planning). Available online: https://www.nwcphp.org/docs/perrcolate/erc/section3/populations.html (accessed on 8 June 2025).
  77. Henderson, F.; Helwig, K. A Smart Guide to Flood Risk Communication. Centre of Expertise for Waters (CREW). 2022. Available online: https://www.crew.ac.uk/sites/www.crew.ac.uk/files/publication/CRW2018_04_A-Smart_Guide_to%20Flood_Risk%20Communication.pdf (accessed on 17 June 2025).
  78. Miller, M.D. Clouds and Clout: Understanding the Role of Social Media in a National Weather Service Forecast Office. Master’s Thesis, Texas Tech University, Lubbock, TX, USA, 2024. Available online: https://hdl.handle.net/2346/100783 (accessed on 17 June 2025).
  79. Yu, J.; Li, Y.; Huang, X.; Ye, X. Data Quality and Uncertainty Issues in Flood Prediction: A Systematic Review. Int. J. Digit. Earth 2024, 17, 1033–1053. [Google Scholar] [CrossRef]
  80. Lee, J.; Sanders, B.F. A Review of Flood Risk Management in the USA. Water 2023, 15, 947. [Google Scholar] [CrossRef]
  81. Ren, M.; Zhang, Z.; Zhang, J.; Mora, L. Understanding the Use of Heterogenous Data in Tackling Urban Flooding: An Integrative Literature Review. Water 2022, 14, 2160. [Google Scholar] [CrossRef]
  82. Wing, O.E.J.; Lehmann, J.; Bates, P.D.; Sampson, C.C.; Smith, A.M.; Neal, J.C.; Winsemius, H.C.; Kousky, C. Inequitable Patterns of US Flood Risk in the Anthropocene. Nat. Clim. Chang. 2022, 12, 156–162. [Google Scholar] [CrossRef]
  83. Mileti, D.S.; Sorensen, J.H. Communication of Emergency Public Warnings: A Social Science Perspective and State-of-the-Art Assessment; Report No. ORNL-6609; Oak Ridge National Laboratory: Oak Ridge, TN, USA, 1990. [Google Scholar] [CrossRef]
  84. Minaee, S.; Mikolov, T.; Nikzad, N.; Chenaghlu, M.; Socher, R.; Amatriain, X.; Gao, J. Large Language Models: A Survey. arXiv 2023, arXiv:2307.06435v1. [Google Scholar] [PubMed]
  85. Yin, S.; Fu, C.; Zhao, S.; Li, K.; Sun, X.; Xu, T.; Chen, E. A Survey on Multimodal Large Language Models. Natl. Sci. Rev. 2024, 11, nwae403. [Google Scholar] [CrossRef]
  86. Kuka, V. OpenAI’s New Image Generation Model: Competing with the Studios? Learn Prompting. 3 April 2025. Available online: https://learnprompting.org/blog/openai-new-image-generation-model-competes-with-studios (accessed on 19 June 2025).
  87. Cui, X.; Sun, Q.; Zhou, W.; Li, H. Exploring GPT-4 Vision for Text-to-Image Synthesis Evaluation. In Proceedings of the ICLR 2024, Vienna, Austria, 7–11 May 2024; Available online: https://openreview.net/forum?id=xmQoodG82a (accessed on 19 June 2025).
  88. OpenAI. Introducing 4o Image Generation: A Native Multimodal Model. OpenAI Blog. 25 March 2025. Available online: https://openai.com/index/introducing-4o-image-generation (accessed on 19 June 2025).
  89. Kung, J.Y.; Tsuyuki, R.T. Maximizing Impact with Infographics. Can. Pharm. J. 2020, 153, 208–210. [Google Scholar] [CrossRef] [PubMed]
  90. Ji, Z.; Lee, N.; Frieske, R.; Yu, T.; Su, D.; Xu, Y.; Ishii, E.; Bang, Y.; Chen, D.; Dai, W.; et al. Survey of Hallucination in Natural Language Generation. arXiv 2024, arXiv:2202.03629. [Google Scholar] [CrossRef]
  91. Lei, Z.; Dong, Y.; Li, W.; Ding, R.; Wang, Q.; Li, J. Harnessing Large Language Models for Disaster Management: A Survey. arXiv 2024, arXiv:2501.06932. [Google Scholar]
  92. Zhu, X.; Guo, X.; Cao, S.; Li, S.; Gong, J. StructuGraphRAG: Structured Document-Informed Knowledge Graphs for Retrieval-Augmented Generation. Proc. AAAI Symp. Ser. 2024, 4, 242–251. [Google Scholar] [CrossRef]
  93. Xie, Y.; Verner, D.R.; Jiang, B.; Mallick, T.; Branham, J.; Bergerson, J.D.; Alexander, M.R.; Hutchison, J.K.; Ross, R.B.; Levy, L.-A.; et al. A RAG-Based Multi-Agent LLM System for Natural Hazard Resilience and Adaptation. arXiv 2025, arXiv:2504.17200v1. [Google Scholar]
  94. IBM. Black Box AI. Available online: https://www.ibm.com/think/topics/black-box-ai (accessed on 17 June 2025).
  95. Guarino, N.; Oberle, D.; Staab, S. What Is an Ontology? In Handbook on Ontologies; Staab, S., Studer, R., Eds.; Springer: Berlin/Heidelberg, Germany, 2009; pp. 1–17. [Google Scholar]
  96. Uschold, M.; Grüninger, M. Ontologies: Principles, Methods and Applications. Knowl. Eng. Rev. 1996, 11, 93–136. [Google Scholar] [CrossRef]
  97. Noy, N.F.; McGuinness, D.L. Ontology Development 101: A Guide to Creating Your First Ontology; Technical Report KSL-01-05; Stanford Knowledge Systems Laboratory: Stanford, CA, USA, 2001. [Google Scholar]
  98. Bu Daher, J.; Huygue, T.; Stolf, P.; Hernandez, N. An ontology and a reasoning approach for evacuation in flood disaster response. In Proceedings of the 17th International Conference on Knowledge Management (IKCM 2022), Potsdam, Germany, 23–24 June 2022; pp. 117–131. [Google Scholar]
  99. Martelo, R.; Ahmadiyehyazdi, K.; Wang, R.-Q. Towards Democratized Flood Risk Management: An Advanced AI Assistant Enabled by GPT-4 for Enhanced Interpretability and Public Engagement. Available online: https://arxiv.org/abs/2403.03188 (accessed on 20 June 2025).
  100. Son, J.; Lim, C.-S.; Shim, H.-S.; Kang, J.-S. Development of Knowledge Graph for Data Management Related to Flooding Disasters Using Open Data. Future Internet 2021, 13, 124. [Google Scholar] [CrossRef]
  101. Dorasamy, M.; Raman, M.; Kaliannan, M. Knowledge management systems in support of disasters management: A two-decade review. Technol. Forecast. Soc. Chang. 2013, 80, 1834–1853. [Google Scholar] [CrossRef]
  102. Chen, M.; Tao, Z.; Tang, W.; Qin, T.; Yang, R.; Zhu, C. Enhancing emergency decision-making with knowledge graphs and large language models. Int. J. Disaster Risk Reduct. 2024, 113, 104804. [Google Scholar] [CrossRef]
  103. Khantong, S.; Sharif, M.N.A.; Mahmood, A.K. An ontology for sharing and managing information in disaster response: An illustrative case study of flood evacuation. Int. Rev. Appl. Sci. Eng. 2020, 11, 22–33. [Google Scholar] [CrossRef]
  104. Elmhadhbi, L.; Karray, M.-H.; Archimède, B.; Otte, J.; Smith, B. POLARISCO: A modular ontology for semantically enhanced interoperability in operational disaster response. Information 2021, 12, 432. [Google Scholar] [CrossRef]
  105. Du, W.; Liu, C.; Xia, Q.; Wen, M.; Hu, Y. OFPO & KGFPO: Ontology and knowledge graph for flood process observation. Environ. Model. Softw. 2025, 185, 106317. [Google Scholar] [CrossRef]
  106. Lewis, P.; Perez, E.; Piktus, A.; Petroni, F.; Karpukhin, V.; Goyal, N.; Küttler, H.; Lewis, M.; Yih, W.-t.; Rocktäschel, T.; et al. Retrieval-Augmented Generation for Knowledge-Intensive NLP Tasks. arXiv 2021, arXiv:2005.11401. [Google Scholar]
  107. National Academies of Sciences, Engineering, and Medicine. Communicating Science Effectively: A Research Agenda; The National Academies Press: Washington, DC, USA, 2017. [Google Scholar]
  108. Yu, D.; Bao, R.; Ning, R.; Peng, J.; Mai, G.; Zhao, L. Spatial-RAG: Spatial Retrieval Augmented Generation for Real-World Geospatial Reasoning Questions. arXiv 2025, arXiv:2502.18470v5. [Google Scholar]
  109. Rosch, E. Principles of Categorization. In Cognition and Categorization; Rosch, E., Lloyd, B.B., Eds.; Lawrence Erlbaum Associates: Hillsdale, NJ, USA, 1978; pp. 27–48. [Google Scholar]
  110. Xu, D.; Chen, W.; Peng, W.; Zhang, C.; Xu, T.; Zhao, X.; Wu, X.; Zheng, Y.; Wang, Y.; Chen, E. Large language models for generative information extraction: A survey. Front. Comput. Sci. 2024, 18, 186357. [Google Scholar] [CrossRef]
  111. Dearing, J.W. Applying Diffusion of Innovation Theory to Intervention Development. Res. Soc. Work. Pract. 2009, 19, 503–518. [Google Scholar] [CrossRef] [PubMed]
  112. Compton, M.; Barnaghi, P.; Bermudez, L.; García-Castro, R.; Corcho, O.; Cox, S.; Graybeal, J.; Hauswirth, M.; Henson, C.; Herzog, A.; et al. The SSN ontology of the W3C semantic sensor network incubator group. Web Semant. 2012, 17, 25–32. [Google Scholar] [CrossRef]
  113. Castillo, C. Big Crisis Data: Social Media in Disasters and Time-Critical Situations; Cambridge University Press: Cambridge, UK, 2016. [Google Scholar]
  114. Hogan, A.; Blomqvist, E.; Cochez, M.; d’Amato, C.; de Melo, G.; Gutierrez, C.; Kirrane, S.; Gayo, J.E.L.; Navigli, R.; Neumaier, S.; et al. Knowledge Graphs. ACM Comput. Surv. 2021, 54, 71. [Google Scholar] [CrossRef]
  115. Millet, B.; Carter, A.P.; Broad, K.; Cairo, A.; Evans, S.D.; Majumdar, S.J. Hurricane Risk Communication: Visualization and Behavioral Science Concepts. Wea. Clim. Soc. 2020, 12, 193–211. [Google Scholar] [CrossRef]
  116. Molinari, D.; Dazzi, S.; Gattai, E.; Minucci, G.; Pesaro, G.; Radice, A.; Vacondio, R. Cost–Benefit Analysis of Flood Mitigation Measures: A Case Study Employing High-Performance Hydraulic and Damage Modelling. Nat. Hazards 2021, 108, 3061–3084. [Google Scholar] [CrossRef]
  117. Hazus User & Technical Manuals. Available online: https://www.fema.gov/flood-maps/tools-resources/flood-map-products/hazus/user-technical-manuals (accessed on 22 July 2025).
  118. HIFLD. Data Catalog. Data.gov. Available online: https://catalog.data.gov/dataset?publisher=HIFLD (accessed on 22 July 2025).
  119. Federal Emergency Management Agency. Flood Insurance Data and Analytics. Available online: https://nfipservices.floodsmart.gov/reports-flood-insurance-data (accessed on 22 July 2025).
  120. United States Army Corps of Engineers. Physical Depth Damage Function Summary Report; North Atlantic Coast Comprehensive Study: Resilient Adaptation to Increasing Risk; U.S. Army Corps of Engineers, January 2015. Available online: https://www.nad.usace.army.mil/Portals/40/docs/NACCS/10A_PhysicalDepthDmgFxSummary_26Jan2015.pdf (accessed on 22 July 2025).
  121. Federal Emergency Management Agency. Benefit-Cost Analysis. Available online: https://www.fema.gov/grants/tools/benefit-cost-analysis (accessed on 22 July 2025).
  122. Napolitano, J.; Di Francesco, M.; Sechi, G.M. Decision Trees in Cost–Benefit Analysis for Flood Risk Management Plans. J. Hydroinform. 2024, 26, 762–778. [Google Scholar] [CrossRef]
  123. McGee, K. A Place Worth Protecting: Rethinking Cost-Benefit Analysis Under FEMA’s Flood-Mitigation Programs. Univ. Chic. Law Rev. 2021, 88, 1925–1968. [Google Scholar]
  124. Colverd, G.; Darm, P.; Silverberg, L.; Kasmanoff, N. FloodBrain: Flood Disaster Reporting by Web-based Retrieval Augmented Generation with an LLM. In Proceedings of the 6th Workshop on Artificial Intelligence for Humanitarian Assistance and Disaster Response (NeurIPS 2023), New Orleans, LA, USA, 15 December 2023. [Google Scholar]
  125. Schwarz, I.; Kuleshov, Y. Flood Vulnerability Assessment and Mapping: A Case Study for Australia’s Hawkesbury-Nepean Catchment. Remote Sens. 2022, 14, 4894. [Google Scholar] [CrossRef]
  126. Tate, E.; Rahman, M.A.; Emrich, C.T.; Sampson, C.C. Flood Exposure and Social Vulnerability in the United States. Nat. Hazards 2021, 106, 435–457. [Google Scholar] [CrossRef]
  127. Scaini, A.; Stritih, A.; Brouillet, C.; Scaini, C. Flood Risk and River Conservation: Mapping Citizen Perception to Support Sustainable River Management. Front. Earth Sci. 2021, 9, 675131. [Google Scholar] [CrossRef]
  128. Oubennaceur, K.; Chokmani, K.; El Alem, A.; Gauthier, Y. Flood Risk Communication Using ArcGIS StoryMaps. Hydrology 2021, 8, 152. [Google Scholar] [CrossRef]
  129. Google Research. Flood Hub: AI-Powered Global Flood Forecasting Platform. 2023. Available online: https://sites.research.google/floods/l/0/0/3 (accessed on 26 June 2025).
  130. Jupiter Intelligence. ClimateScore Global. Available online: https://www.jupiterintel.com/climatescore-global (accessed on 26 June 2025).
  131. Chu, J. New AI Tool Generates Realistic Satellite Images of Future Flooding. MIT News, 25 November 2024. Available online: https://news.mit.edu/2024/new-ai-tool-generates-realistic-satellite-images-future-flooding-1125 (accessed on 26 June 2025).
  132. Miller, G.A. The Magical Number Seven, Plus or Minus Two: Some Limits on Our Capacity for Processing Information. Psychol. Rev. 1956, 63, 81–97. [Google Scholar] [CrossRef] [PubMed]
  133. Simon, H.A. Designing Organizations for an Information-Rich World. In Computers, Communications, and the Public Interest; Greenberger, M., Ed.; The Johns Hopkins Press: Baltimore, MD, USA, 1971; pp. 37–72. [Google Scholar]
  134. Walsh, K. Information Technology: Agencies Need to Continue Addressing Critical Legacy Systems; GAO-23-106821; U.S. Government Accountability Office: Washington, DC, USA, 2023. Available online: https://www.gao.gov/products/GAO-23-106821 (accessed on 26 June 2025).
  135. Oskuie, C. It’s Time to Bring Legacy Data into the Modern Era. Government Technology Insider. Available online: https://governmenttechnologyinsider.com/its-time-to-bring-legacy-data-into-the-modern-era/ (accessed on 26 June 2025).
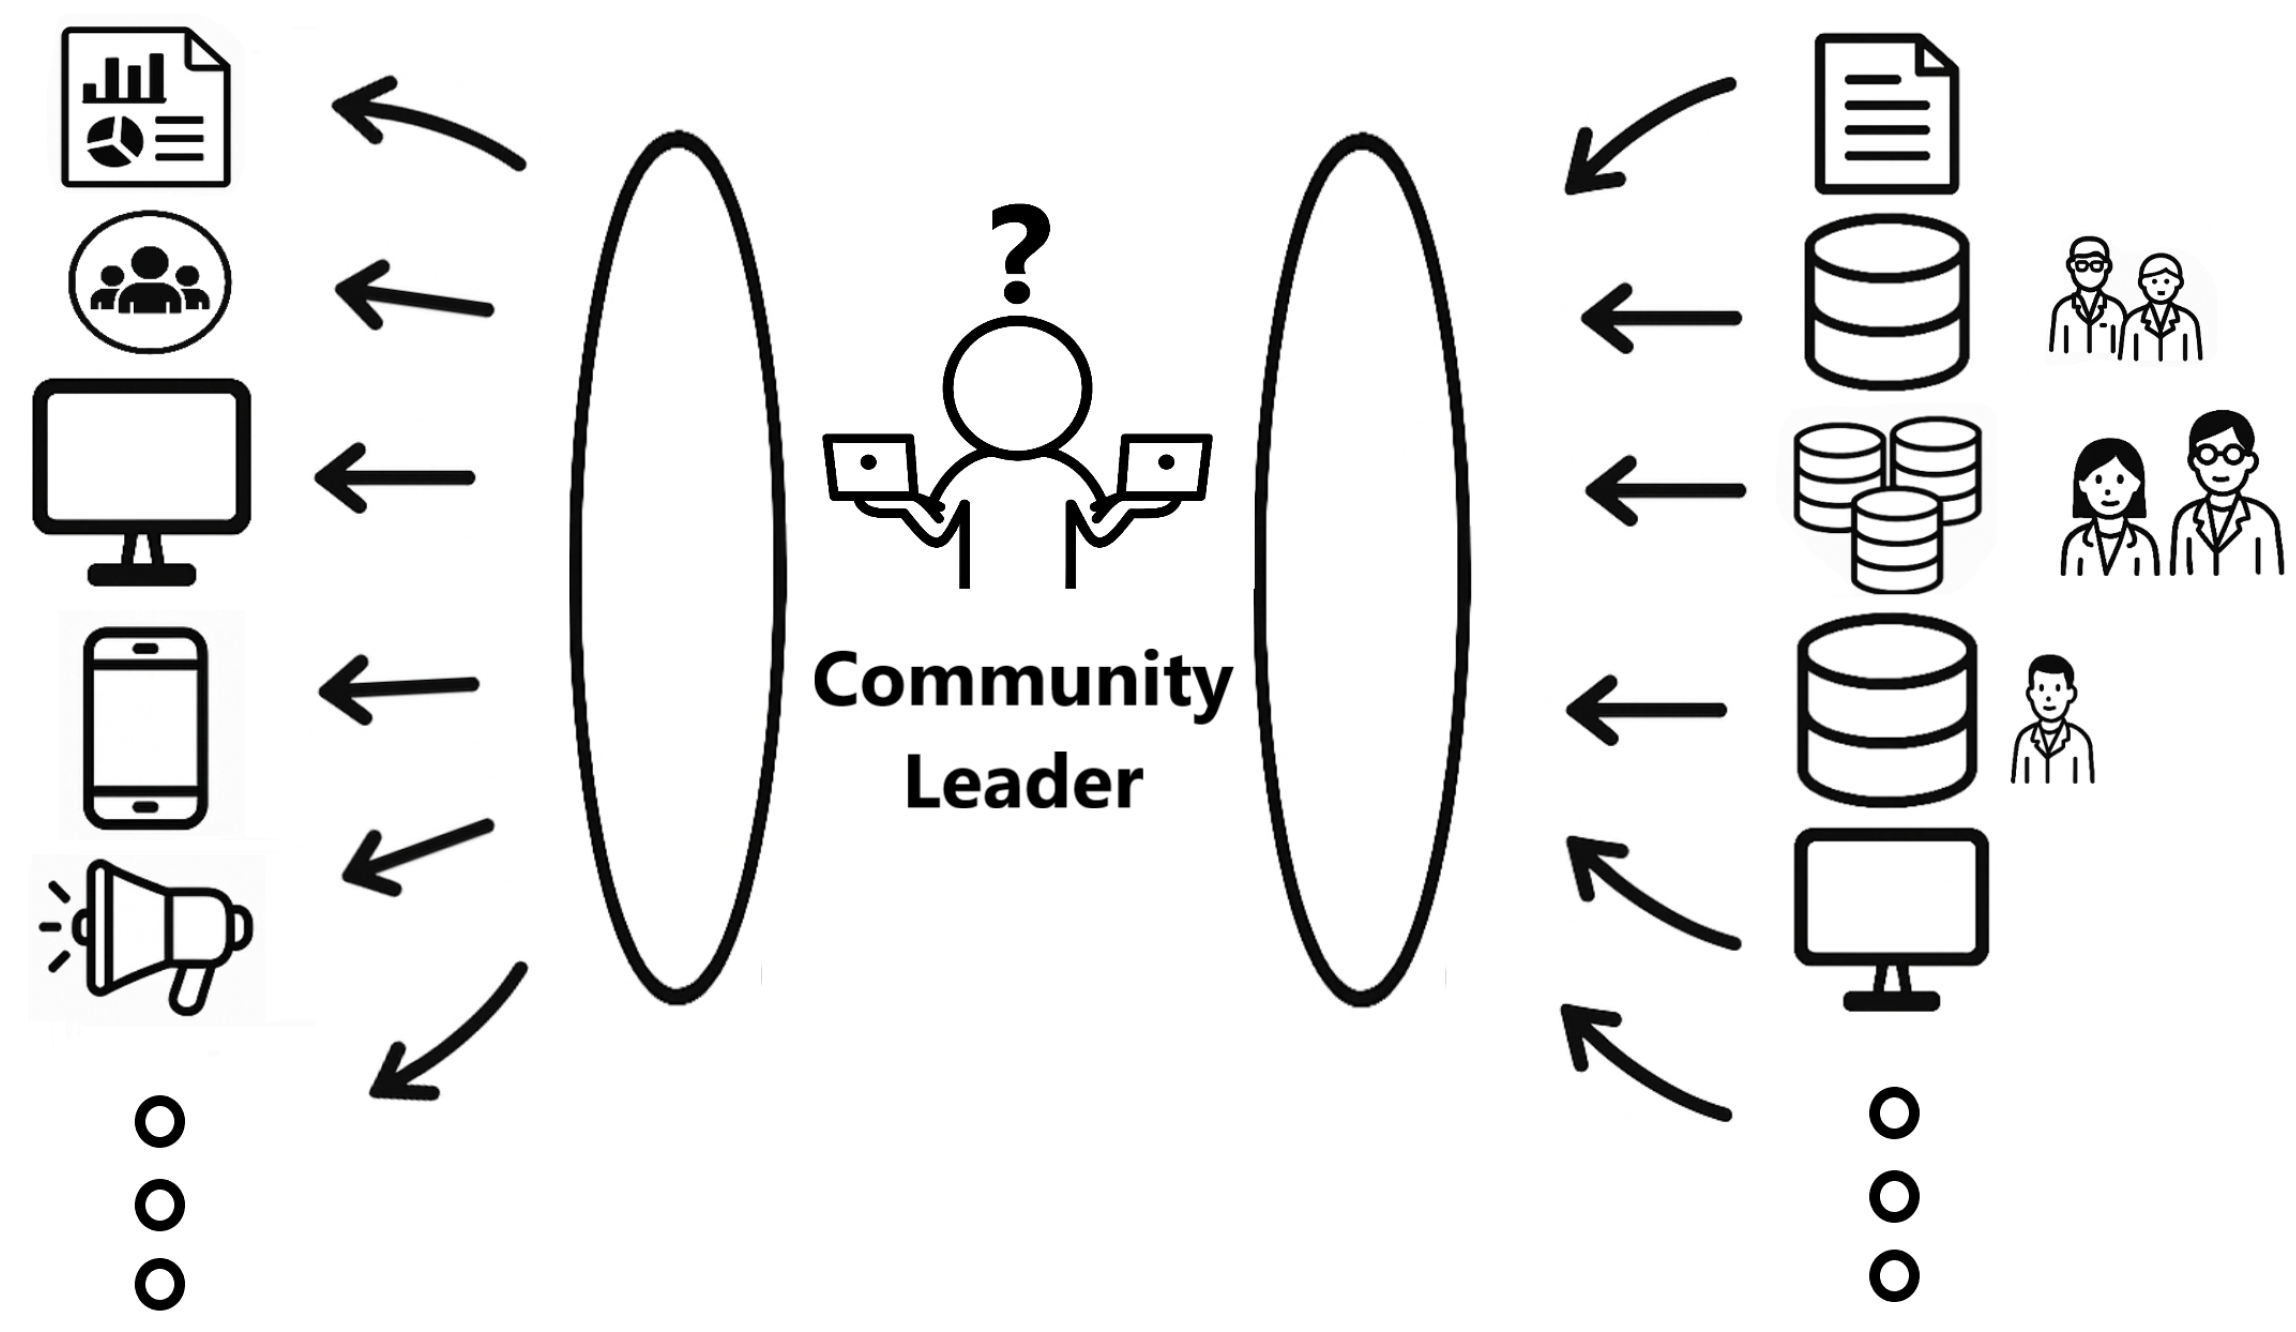
Figure 3. Community leaders face information overload.
Hydrology 12 00204 g003
Figure 4. Leaders must choose from a multitude of channels and mediums to communicate flood information.
Hydrology 12 00204 g004
Figure 5. Infographics with maps, clear text, and community context help convey an engaging and informative flood story.
Hydrology 12 00204 g005
Figure 6. Diagram illustrating the relationship between use cases, ontological structure, the resulting knowledge graph, and underlying data instances.
Hydrology 12 00204 g006
Figure 7. Detailed workflow diagram of the FLAI system.
Hydrology 12 00204 g007
Figure 8. Transforming infinite conceptual complexity into usable structure through collaboration between human experts and AI, with different shapes representing different concepts.
Hydrology 12 00204 g008
Figure 9. FLAI platform interface and example outputs. Users generate tailored infographics, maps, and cost–benefit visuals through LLM- and KG-powered system.
Hydrology 12 00204 g009
Table 3. Communication modalities across channels (ordered by decreasing modalities).
Communication ChannelsTextImagesVideoAudioReal-Time InformationInteractive
Social media platformsXXXXXX
YouTubeXXXXXX
Mobile appsXXXXXX
WebinarsXXXXXX
News websitesXXXXX
Government websitesXXXXX
Public service announcementsXXXXX
TelevisionXXXXX
BlogsXXXX
Online forumsXXX
Emergency alert systemsXXX
Community bulletin boardsXXX
RadioXX
NewspapersXX
MagazinesXX
Email newslettersXX
Text alerts (SMS)XX
PodcastsX
Word of mouthX
Press releasesX
Note: “X” indicates that the communication modality is present in the corresponding channel. “–” indicates the modality is not typically used or supported.
Table 4. Flood-risk tools and their functional attributes.
Tool NameCost BenefitCommunicationMap VisualizationFreeGlobal ScaleInfographic and Story Gen.
FloodBrainXXX
FloodWaiveX
Google Flood HubXXX
HydroSphereAI (Aquanty)XX
Okeanos (Netilion Flood Monitoring)XX
Jacobs Flood PlatformXX
FloodbaseXX
One ConcernXXX
Jupiter IntelligenceXXX
Stantec Flood PredictorXX
Vassar Labs’ Flood ToolXXXX
MIT’s AI for Satellite ImagesXXX
AECOM’s Flood Risk MappingX
Esri’s Flood Modeling ToolsXXX
Risk Factor (First Street)XX
Iowa Flood Center AIXXX
Texas A&M Flood ToolX
FLAIXXXXXX
Note: “X” indicates the presence of the attribute; “–” indicates the attribute is not featured. FLAI is the tool we propose in this paper.
Disclaimer/Publisher’s Note: The statements, opinions and data contained in all publications are solely those of the individual author(s) and contributor(s) and not of MDPI and/or the editor(s). MDPI and/or the editor(s) disclaim responsibility for any injury to people or property resulting from any ideas, methods, instructions or products referred to in the content.