Abstract
Accurate dynamic hydrological models are often too complex and costly for the rapid, broad-scale screening necessitated for proactive land-use planning against increasing cloudburst risks. This paper demonstrates the use of GPT-4 to develop a GUI-based Python 3.13.2 application for geospatial flood risk assessments. The study used instructive prompt techniques to script a traditional stream and catchment delineation methodology, further embedding it with a custom GUI. The resulting application demonstrates high performance, processing a 29.63 km2 catchment at a 1 m resolution in 30.31 s, and successfully identifying the main upstream contributing areas and flow paths for a specified area of interest. While its accuracy is limited by terrain data artifacts causing stream breaks, this study demonstrates how human–AI collaboration, with the LLM acting as a coding assistant guided by domain expertise, can empower domain experts and facilitate the development of advanced GIS-based decision-support systems.
1. Introduction
Increasing cloudburst events challenge urban and rural land-use planning, creating a growing need for effective flood risk assessment tools [1]. While advanced dynamic hydrological models exist, they are often too complex and costly for the rapid, broad-scale screening required for proactive mitigation planning by Danish municipalities [2]. This creates a gap between the need for hydrographic information and the practical constraints of real-world planning. This paper addresses this gap by demonstrating an LLM-assisted development of a static, terrain-based hydrological analysis. The goal is to provide a scalable and computationally efficient tool that enables domain experts to conduct preliminary risk assessments, bridging the gap between complex modeling and practical land-use decision-making.
Hydrological modeling provides a framework for understanding catchment-scale runoff dynamics and identifying where water is likely to flow and accumulate during extreme rainfall events [3]. In Denmark, current legislation requires municipalities to carry out dynamic flood modeling as part of a socio-economic cost–benefit analysis prior to implementing cloudburst mitigation measures [2]. These models simulate unfolding rainfall events and provide detailed insights, but are computationally intensive and require domain experts to set up and interpret. As of this publication release, no municipalities have reportedly completed this analysis, highlighting the complexity and resource demands of the process.
While static, terrain-driven hydrological analysis offers a faster alternative for preliminary screening [4], the development of custom, automated GIS tools to perform such analyses typically requires significant programming expertise, representing a blockade for domain experts needing tailored solutions. Emerging approaches using LLMs for geospatial code generation have gained attention for their ability to generate functional code from natural language instructions [5], presenting an opportunity to accelerate development and lower the technical barrier for creating specialized applications.
However, the application of LLMs by domain experts to construct and validate complete, end-to-end GIS automation pipelines, particularly within the geospatial (sub)domains, remains an emergent area of research [5,6,7]. This paper explores this gap by using an LLM-assisted (GPT-4) approach where domain expertise guides the LLM in scripting a modular Python application. We specifically investigate this human–AI collaborative model for its efficacy in developing a practical tool that automates a well-established hydrological workflow for preliminary cloudburst risk screening, evaluating both the resulting application and the LLM-assisted development process.
2. Literature Review
Hydrological modeling is foundational for understanding the challenges of cloudburst-related flooding, with models broadly categorized as static or dynamic [8]. Dynamic models are often capable of producing detailed simulations of flood events by including temporal, directional, and physical parameters into the modeling to account for factors like infiltration and flow velocity [8]. However, their computational intensity and data requirements can be limiting for rapid screening [4]. Static models, in contrast, do not include time and analyze steady-state condition, offering a computationally efficient alternative for initial risk assessments and identifying areas at potential risk [4]. This study focuses on enhancing the development of such static screening tools.
Performing a hydrological analysis often necessitates the delineation of hydrographic features such as streams and catchments, which are derived from DTMs [9,10]. A stream represents a flow path, while a catchment is the contributing land area to an outlet [11]. The delineations utilize GIS to process topographic data, typically derived from LiDAR or remote sensing surveys [12,13]. Using GIS and DTMs, hierarchical stream classification systems, notably the Strahler Stream Order [14], are employed to delineate and quantify drainage networks from topographic data [11]. While GIS provides essential capabilities, challenges pertaining to varying DTM resolutions and the representation of sub-terrain drainage infrastructure remain [9,13,15].
Carrying out or automating GIS-based hydrological workflows is crucial for effective and reproducible decision-support [4]. Conventionally, these analyses are achieved through built-in toolsets within GIS software, graphical model builders, or custom scripting. While scripting—typically with Python and associated geospatial libraries—offers maximum flexibility for tailored solutions, it demands significant programming expertise and deep GIS tool familiarity [4]. Recent advancements have explored the use of LLMs to autonomously generate entire “tool-use chains” to solve sequences of geospatial operations from natural language prompts, facilitated through specialized model training and simulated environments [16].
LLMs have shown to be powerful tools in software development, demonstrating remarkable capabilities in code generation across diverse programming languages and domains [17,18,19]. The primary strength of LLMs in this context is their ability to translate natural language instructions into functional code, thereby streamlining development processes as productivity enhancers or “mentors” for programmers [5,18]. This interest is part of a broader trend of integrating AI in hydrology, where other studies explore, for instance, the use of multi-modal LLMs for interpreting visual data like satellite images of floods [20]. Concurrently, investigations into their geospatial awareness indicate an increasing adeptness in comprehending fundamental geographic information [5,6,7,21].
However, while LLM utility in software development is increasingly recognized, their specific application for constructing end-to-end, domain-specific GIS automation pipelines remains an area of further investigation [5]. Successfully leveraging LLMs for such complex geospatial applications requires more than generating isolated code snippets; as highlighted by recent research, it involves enabling the LLM to effectively orchestrate complex sequences of geospatial operations, correctly utilize specialized GIS libraries, and maintain the logical integrity of an entire analytical workflow [5,7]. The geospatial domain poses distinct difficulties for current code-generating LLMs due to several factors:
- The necessity for nuanced spatial reasoning and an understanding of relevant world knowledge [5].
- Proficiency with niche software libraries which are often underrepresented in general LLM training datasets [5].
- A tendency toward “hallucination” or refusal to code when faced with tasks requiring deep domain-specific knowledge not present in their training corpora [21].
- Exhibition of “hazy memory” regarding specific GIS prerequisites, such as consistent map projections or data type compatibility for spatial joins, necessitating explicit and detailed guidance [7].
With the use of LLMs for geospatial code generation representing an emerging area, research focusing on methodologies for effectively using LLMs is important for helping domain experts develop tailored and reliable GIS tools [5,21]. This study contributes to this timely topic by detailing an LLM-assisted approach to create a scalable Python application for automated cloudburst risk mapping. We specifically aim to demonstrate the efficacy of LLM-assisted development for creating a GIS application, assessing the GIS solution, and showing how this human–AI approach can increase accessibility and democratize geospatial decision-support systems.
3. Methodology
This section outlines the development of the static risk assessment tool based on terrain-driven hydrological analysis. The workflow automates stream and catchment delineation from a DTM and outputs a styled QGIS project for visualization. The application was developed in Python using a modular structure and incorporates GIS libraries and PCRaster functions. The methodology includes terrain preprocessing, flow direction modeling, runoff volume estimation, and automated map generation, implementing standard methodologies and hydrological principles through LLM-assisted scripting.
3.1. Data and Software
The study used a high-resolution DTM from the Danish Agency for Data Supply and Efficiency, originally captured at 40 cm resolution using airborne laser scanning with a 3–5 cm vertical accuracy [22]. The DTM was clipped to a selected ID-15 catchment (Standardized nationwide watershed dataset with an average size of 15 km2 per watershed, developed by Aarhus University for water management [23]) and resampled to 1 m for computational efficiency. Hydrological modeling was performed using PCRaster, and additional spatial processing and visualization were supported by GIS libraries. Bluespot data (Official Danish screening data that show depressions in terrain which will flood during cloudburst [24]) for the area was also included to support flood risk interpretation [25].
3.2. Hydrological Analysis
The project utilized a static hydrological model approach due to its computational efficiency, which made it superior for the primary goal of rapid, preliminary screening across large areas compared to the significant requirements of dynamic models. A pipeline was developed to streamline spatial analysis using established raster-based methodologies, integrating flow direction modeling, stream network classification, catchment delineation, and sediment transport. These operations were automated outside GUI-based GIS applications to improve computational efficiency and ensure consistency across simulations.
3.2.1. Preprocessing: Creating Local Drain Direction (LDD)
The DTM was processed to generate a Local Drain Direction (LDD) map, a required input for deriving hydrographic features. This was performed using the lddcreate function, which assigned each raster cell a downslope neighbor based on the steepest gradient (values from 1 to 8 for neighboring cells) and performed sink filling to ensure continuous flow. While this initial preprocessing was computationally intensive, requiring approximately 10 h, it created a foundational, hydrologically corrected LDD map. This one-time process was critical as it ensured that all subsequent analyses were consistent, reproducible, and rapid. However, as discussed later, artifacts in the underlying DTM lead to discontinuities in the flow network.
3.2.2. Stream Network Classification
The stream network was classified using the streamorder tool, which applied the Strahler stream order system to hierarchically organize drainage pathways. This method traced streams using the LDD, assigning first-order streams to the smallest tributaries and increasing stream order when two of the same rank merged. The assigned stream orders allowed for filtering minor tributaries out when focusing on major drainage pathways. This classification was essential for modeling stream paths and providing structural information for catchment delineation and rainfall volume estimations.
3.2.3. Defining Outlets and Catchments
Outlet points were established along the study area’s boundary to serve as drainage locations. For each outlet, catchments were delineated using the catchment tool, which used the locations and the LDD to identify all cells contributing flow to the specified outlets. The resulting catchment areas were extracted as polygon features, representing the total upstream area contributing water to the outlet points. With catchments derived from many outlet points, catchments were merged into a single polygon to ensure a continuous visual representation of the upstream area. A second stream network classification was performed within the identified catchment to improve visual interpretability in the final result.
3.2.4. Rainfall Volume Estimation
Runoff volume was estimated by computing six distinct rainfall scenarios, ranging from 15 mm to 90 mm in 15 mm increments, representing a spectrum of cloudburst intensities. PCRaster’s accuflux function was used to compute flow accumulation on raster layers, tracking the total volume of water reaching each cell in the LDD. A flat 10% reduction was applied to the total rainfall volume as a simplified approximation to account for initial surface infiltration. While this is a generalized value, it serves to provide an estimate of surface runoff in this preliminary screening model.
3.3. LLM-Assisted Application Development
The application was iteratively developed to integrate a graphical user interface (GUI) with the hydrological processing pipeline. The GUI served as the central interface, linking user inputs to function parameters and triggering execution across the hydrological processing pipeline. It was developed with a modular architecture, where each script handled specific tasks within the application runtime. LLM-assisted scripting was used to generate and refine processing scripts, ensuring compatibility between modules. The application architecture is illustrated in Figure 1.
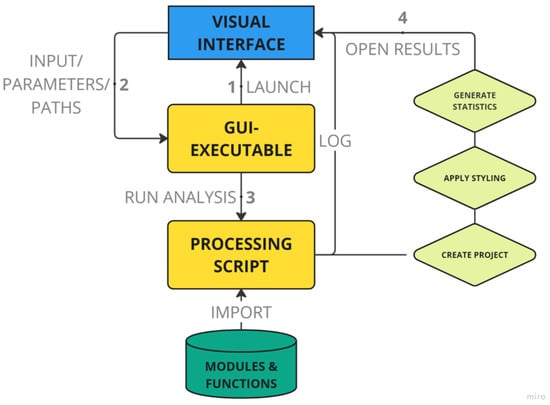
Figure 1.
The processing workflow between the interface and processing components.
The development of the Python application for this study was achieved through an end-to-end collaborative process with an LLM, specifically GPT-4 [17], which acted as a comprehensive coding assistant and mentor. The process was fundamentally conversational, and extended from initial environment setup and core library identification, the development of the hydrological pipeline, to the construction of the core application logic, and adding user interface elements. In this approach, the authors provided high-level objectives of desired outcomes, making the LLM facilitate the identification of the appropriate code.
For the core hydrological analysis, this involved scripting PCRaster operations based on defined conceptual steps. For components like the Tkinter-based GUI, the authors described desired user functionalities, including necessary widgets, layout, and user experience features like automatic file selection and logging, with the LLM subsequently generating the corresponding code. All LLM-generated code was validated through direct script testing and comparison to outputs against results from parallel GUI-based GIS operations. Feedback, error messages, or clarifications given to the LLM in subsequent prompts facilitated iterative refinement.
This human-in-the-loop approach was essential for supplementing the LLM’s inherent limitations, particularly regarding the limited geospatial understanding GPT-4 exhibited. While proficient with standard Python from zero-shot prompts, the LLM often struggled to correctly sequence complex geospatial operations or accurately apply niche library functions (e.g., from PCRaster) without explicit instruction. The authors addressed this by providing one-shot examples and copy-pasting relevant technical documentation directly into prompts, followed by precise instructions for workflow sequencing.
Despite these guidance techniques, there were instances where the LLM repeatedly offered incorrect solutions when struggling to grasp the full details of the code, particularly in new chat sessions where conversational history was reset. In such cases, GPT-4 had a tendency to disregard important logical definitions within the established code, necessitating careful oversight and instruction for the LLM. This collaborative and iterative cycle of LLM-assisted code generation, author-led testing and implementation, as well as guided refinements and manual corrections, culminated in significant assistance in the developing process:
- The Graphical User Interface (GUI): Tkinter-based code for user interaction, including input fields, buttons, and file handling.
- The Core Hydrological Analysis Pipeline: Python scripts implementing PCRaster functions for DTM processing, stream and catchment delineation, and flow accumulation, based on author-defined conceptual steps.
- QGIS Project Automation Scripts: Code for the automated creation and styling of QGIS projects to visualize hydrological outputs.
4. Results
4.1. Application Interface and Runtime Performance
The developed application integrates a user-friendly interface from where the hydrological processing pipeline can be executed. Users can upload input files, define rainfall parameters, and configure visualization preferences. When run, the tool performs stream and catchment delineation as well as volume estimation based on the LDD, with progress shown in a log window. For the 29.63 km2 catchment, the analysis completed consistently around 30.31 s at a 1 m resolution (Hardware specifications: Lenovo Yoga, 12th Gen Intel(R) Core(TM) i7-12700H, 16 GB DDR5 @ 6000 MT/s), which is very effective compared to traditional GIS workflows that rely on manual processing. The output is a set of styled geospatial layers, prepared in a QGIS project file that opens upon completion for visual inspection and further analysis (Figure 2).
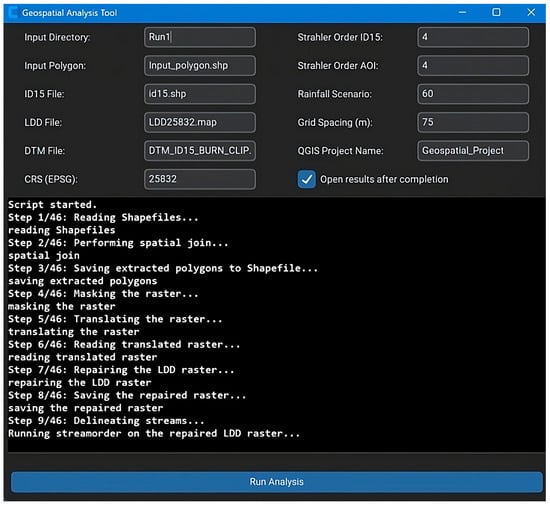
Figure 2.
Graphical user interface for executing the hydrological analysis with parameter selection and real-time logging.
4.2. Model Output
The model results illustrate the drainage structure and flow accumulation patterns across the ID-15 catchment and the area of interest (AOI), as shown in Figure 3a,b. In the broader catchment (Figure 3a), the delineated stream network transports water from the southeastern uplands toward the northwestern outlet, with stream widths reflecting estimated accumulation volumes. In the AOI (Figure 3b), flow converges along a smaller tributary segment near K5, with visible accumulation near roads and low-lying bluespot zones.
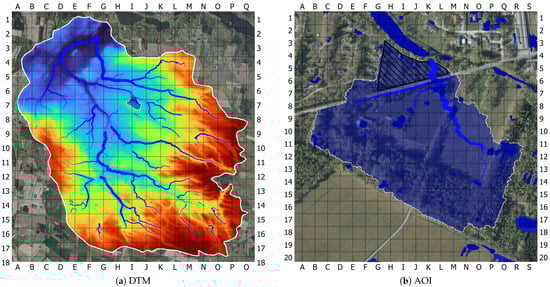
Figure 3.
(a) Digital terrain model with derived drainage network. (b) Delineated upstream catchment for the AOI, showing hydrological flow paths and accumulation zones.
Enhanced with orthophoto and bluespot data, the catchment delineation in Figure 3b illustrates the upstream area contributing runoff to the AOI. Flow converges near the main road (K6), passes through the AOI at (K5), and continues toward the larger ID-15 system near (K4). The map reveals localized accumulation near houses and roads, though the extent of flooding appears limited.
Breaks in the stream network were observed at F2, F7, F12, G8, and other locations, where flow paths did not align with expected hydrological behavior. These anomalies are likely related to issues in the terrain data or missing drainage infrastructure. Despite these disruptions, the network overall follows the terrain structure and reflects expected catchment behavior, confirming that the static model successfully captures primary drainage patterns using only terrain data.
Maximum flow accumulation was estimated for six simulated rainfall scenarios ranging from 15 mm to 90 mm (Figure 4). As expected, the accumulated volumes increased with rainfall intensity, with the relationship being nonlinear. This reflects how upstream runoff concentrates along shared flow paths, leading to exponential-like increases in volume at key accumulation points. The estimates offer a useful indication of how large an area contributes runoff to the AOI, supporting early-stage planning decisions when assessing cloudburst impacts.
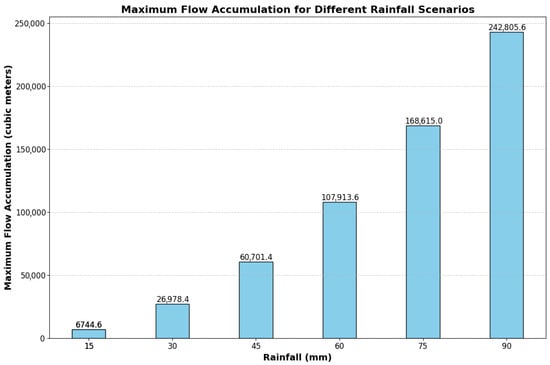
Figure 4.
Raw model output: Maximum flow accumulation values within the AOI catchment across six simulated cloudburst scenarios.
5. Discussion
Cloudbursts, intensifying along with climate-driven moisture increases [1], amplify runoff risks from large rural catchments—a challenge highlighted in the introduction. The developed screening tool builds upon a DTM and an area of interest to produce a visualization of upstream catchments and stream networks. With caveats, Figure 3a,b confirm that streams and catchment align well with the topography based on visual inspection and knowledge of the vertical accuracy of the DTM, which shows that the generated flow paths correctly originate in higher-elevation areas and follow the primary topographic gradients toward the main watershed outlet, reflecting expected runoff behavior.
The employed static approach suits rural contexts, where little subterranean infrastructure like pipes, sewers, or bridges reduces modeling demands. However, stream breaks, likely from natural and artificial DTM depressions, act as “virtual holes” that disrupt flow continuity, directing water into dead ends. Although PCRaster’s lddcreate function applies sink filling, it fails to fully resolve these discontinuities, which can stem from LiDAR inaccuracies when penetrating vegetation and water bodies [12,26], as shown in Figure 5, or from interpolation artifacts during DTM creation [12,27]. While DTM resolution would theoretically impact stream delineation, little difference was observed during the project development, which used resolutions from 40 to 160 cm in a variety of catchments.
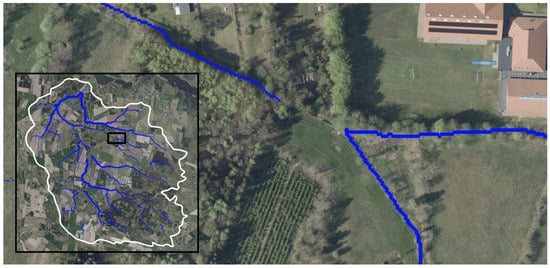
Figure 5.
Example of stream break around dense vegetation.
The presence of these stream breaks has a direct impact on the quantitative accuracy of the flow accumulation analysis. Since each break effectively severs an upstream portion of the contributing catchment from the stream network, the resulting accumulation values in Figure 4 represent an underestimation of the true potential runoff volume. This limits the model’s utility for precise volume estimation, but it preserves its primary function as a screening tool, as the relative patterns of flow concentration remain valid for identifying high-risk runoff paths.
The rainfall volume calculation was also found to provide an uneven basis for estimating the total volume. The method used, relying on the maximum accumulation value, was found to be flawed during development and testing, where two unconnected streams within a delineated AOI rainfall catchment would cause the calculation to ignore the smaller of the two, as the method was focused on the largest value. Future work could enhance pit preprocessing and flow continuity alongside refining volume calculations to account for all streams. These improvements would strengthen the model’s ability to map contributing catchments and flows, addressing limitations of static methods to achieve higher accuracy.
Despite these limitations, the tool demonstrates clear value as a static screening result for rural planning. For a decision-maker, its strength lies in its ability to quickly perform initial risk assessments, as required for Danish municipalities, before committing to mandatory and resource-intensive dynamic modeling [2]. In theory, the model can be asserted to be theoretically globally applicable, as the only data requirement consists of a DTM. However, its practical use is contingent on the availability of high-resolution DTM data. Furthermore, as this study is a proof-of-concept on a single watershed, its broader applicability and robustness require further testing across diverse watersheds and terrains.
While the use of GPT-4 in scripting the tool was a novel approach, the process revealed limitations in its geospatial reasoning capabilities. Most notably, the model had a tendency for hallucinating functions for the niche and specialized PCRaster toolbox, which is in line with findings on LLM performance in geospatial code generation [5], and so the human–AI approach was essential to provide domain-expertise and technical oversight to offset LLM limitations. However, while newer models at the time of publication have demonstrated remarkable advancements and improved geospatial reasoning capabilities [5,16,21], GPT-4 significantly accelerated code structuring and reduced development time compared to a manual process.
This study demonstrates that an LLM-assisted approach can significantly accelerate the development of specialized GIS tools by domain experts. The specific screening tool developed offers practical value to planners managing cloudburst and runoff risks in rural catchments across the globe. Key future work for enhancing this tool involves refining DTM preprocessing techniques to address challenges with stream breaks along with refinement of the volume estimation calculation. Beyond this specific application, continued exploration of human–AI collaborative models and the advancing geospatial capability of LLMs holds potential for democratizing automation and accessibility of advanced decision-support systems across GIS-sciences.
6. Conclusions
This study introduced a hydrological application that streamlines cloudburst risk assessment screening using terrain data, a defined area of interest, and a static hydrological modeling approach. Developed with LLM-assisted scripting supported by GPT-4, the tool delineates upstream catchments and stream networks, providing preliminary flood risk insights. While limited by static assumptions and the exclusion of hydrological infrastructure, its runtime and low data requirements make it well suited for low-entry use, particularly in rural planning contexts. The study demonstrates the efficacy of using LLMs as coding assistants for specialized GIS applications, highlighting the potential of such guided methodologies to bridge technical gaps, accelerate the development of domain-specific tools, and ultimately enhance the accessibility of advanced GIS-based workflows for domain experts in real-world planning applications.
Author Contributions
Conceptualization, I.K., A.A. and A.N.M.; methodology, A.A., I.K. and A.N.M.; software, A.A. and A.N.M. and I.K.; validation, I.K., A.A. and A.N.M.; formal analysis, A.N.M., A.A. and I.K.; investigation, A.A., A.N.M. and I.K.; resources, I.K., A.N.M. and A.A.; data curation, A.A., A.N.M. and I.K.; writing—original draft preparation, A.A., A.N.M. and I.K.; writing—review and editing, A.N.M., I.K. and A.A.; visualization, A.N.M., A.A. and I.K.; supervision, I.K., A.A. and A.N.M.; project administration, I.K., A.A. and A.N.M. All authors have read and agreed to the published version of the manuscript.
Funding
This research received no external funding.
Data Availability Statement
The original DTM data used in the study are openly available at the Danish Climate Data Agency [https://dataforsyningen.dk/data/930, accessed on 13 March 2025]. The developed application code is openly available on GitHub [https://github.com/Adiyasa2000/Cloudburst-Risk-Assessment-Application, accessed on 13 March 2025].
Conflicts of Interest
The authors declare no conflicts of interest.
References
- Intergovernmental Panel on Climate Change. Climate Change 2021: The Physical Science Basis. Contribution of Working Group I to the Sixth Assessment Report of the IPCC; Chapter 8; Intergovernmental Panel on Climate Change: Geneva, Switzerland, 2021. [Google Scholar]
- Klima-, Energi- og Forsyningsministeriet. Bekendtgørelse om Fastsættelse af Serviceniveau for HåNdtering af tag- og Overfladevand. 2020. Available online: https://www.google.com/url?sa=t&source=web&rct=j&opi=89978449&url=https://www.retsinformation.dk/api/pdf/218584&ved=2ahUKEwjF8Iuh9dGOAxVhe_UHHdniLMQQFnoECBsQAQ&usg=AOvVaw0KrieLOA-I61lmZcXLTVCS (accessed on 13 March 2025).
- Beven, K.J. Rainfall-Runoff Modelling: The Primer, 2nd ed.; Wiley-Blackwell: Oxford, UK, 2012. [Google Scholar]
- Maidment, D.R. Arc Hydro: GIS for Water Resources; ESRI Press: Redlands, CA, USA, 2002. [Google Scholar]
- Gramacki, P.; Martins, B.; Szymański, P. Evaluation of Code LLMs on Geospatial Code Generation. In Proceedings of the 7th ACM SIGSPATIAL International Workshop on AI for Geographic Knowledge Discovery (GeoAI’24), Atlanta, GA, USA, 29 October–1 November 2024. [Google Scholar] [CrossRef]
- Bhandari, P.; Anastasopoulos, A.; Pfoser, D. Are Large Language Models Geospatially Knowledgeable? arXiv 2023, arXiv:2310.13002. [Google Scholar] [CrossRef]
- Li, Z.; Ning, H. Autonomous GIS: The Next-Generation AI-Powered GIS. arXiv 2023, arXiv:2305.06453. [Google Scholar] [CrossRef]
- Devia, G.K.; Ganasri, B.; Dwarakish, G. A Review on Hydrological Models. Aquat. Procedia 2015, 4, 1001–1007. [Google Scholar] [CrossRef]
- Tarboton, D.G. A new method for the determination of flow directions and upslope areas in grid digital elevation models. Water Resour. Res. 1997, 33, 309–319. [Google Scholar] [CrossRef]
- Lehner, B.; Verdin, K.; Jarvis, A. New Global Hydrography Derived From Spaceborne Elevation Data. Eos Trans. Am. Geophys. Union 2008, 89, 93–94. [Google Scholar] [CrossRef]
- Horton, R.E. Erosional development of streams and their drainage basins: Hydrophysical approach to quantitative morphology. Geol. Soc. Am. Bull. 1945, 56, 275–370. [Google Scholar] [CrossRef]
- Li, Z.; Zhu, Q.; Gold, C. Digital Terrain Modeling: Principles and Methodology; CRC Press: Boca Raton, FL, USA, 2005. [Google Scholar]
- Wilson, J.P.; Gallant, J.C. Terrain Analysis: Principles and Applications; John Wiley and Sons: New York, NY, USA, 2000. [Google Scholar]
- Strahler, A.N. Quantitative analysis of watershed geomorphology. Trans. Am. Geophys. Union 1957, 38, 913–920. [Google Scholar] [CrossRef]
- Yamazaki, D.; Ikeshima, D.; Tawatari, R.; Yamaguchi, T.; O’Loughlin, F.; Neal, J.C.; Sampson, C.C.; Kanae, S.; Bates, P.D. A High-Accuracy Map of Global Terrain Elevations. Geophys. Res. Lett. 2017, 44, 5844–5853. [Google Scholar] [CrossRef]
- Zhang, Y.; Li, J.; Wang, Z.; He, Z.; Guan, Q.; Lin, J.; Yu, W. Geospatial large language model trained with a simulated environment for generating tool-use chains autonomously. Int. J. Appl. Earth Obs. Geoinf. 2025, 136, 104312. [Google Scholar] [CrossRef]
- OpenAI; Achiam, J.; Adler, S.; Agarwal, S.; Ahmad, L.; Akkaya, I.; Aleman, F.L.; Almeida, D.; Altenschmidt, J.; Altman, S.; et al. GPT-4 Technical Report. arXiv 2024, arXiv:2303.08774. [Google Scholar] [CrossRef]
- Poldrack, R.A.; Lu, T.; Beguš, G. AI-Assisted Coding: Experiments with GPT-4. arXiv 2023, arXiv:2304.13187. [Google Scholar] [CrossRef]
- Chen, M.; Tworek, J.; Jun, H.; Yuan, Q.; de Oliveira Pinto, H.P.; Kaplan, J.; Edwards, H.; Burda, Y.; Joseph, N.; Brockman, G.; et al. Evaluating Large Language Models Trained on Code. arXiv 2021, arXiv:2107.03374. [Google Scholar] [CrossRef]
- Kadiyala, L.A.; Mermer, O.; Samuel, D.J.; Sermet, Y.; Demir, I. The Implementation of Multimodal Large Language Models for Hydrological Applications: A Comparative Study of GPT-4 Vision, Gemini, LLaVa, and Multimodal-GPT. Hydrology 2024, 11, 148. [Google Scholar] [CrossRef]
- Hou, S.; Shen, Z.; Zhao, A.; Liang, J.; Gui, Z.; Guan, X.; Li, R.; Wu, H. GeoCode-GPT: A large language model for geospatial code generation. Int. J. Appl. Earth Obs. Geoinf. 2025, 138, 104456. [Google Scholar] [CrossRef]
- Danish Agency for Data Supply and Efficiency. DHM Product Specification v1.0.0; Technical report; Release 1.0.0; Styrelsen for Dataforsyning og Effektivisering: Copenhagen, Denmark, 2020. [Google Scholar]
- Sørensen, P.B.; Damgaard, C.F.; Bjerg, P.L.; Andersen, H.E.; Holm, P.E.; Tornberg, H.; Bak, J.L.; Heckrath, G.J.; Kjeldgaard, A.; Fauser, P. Udvikling af Model til Understøttelse af Vandplanlægningen i Fastlæggelsen af Koncentrationsniveauer af Metaller i Danske Vandløb; Technical Report 484; Aarhus Universitet, DCE—Nationalt Center for Miljø og Energi: Aarhus, Denmark, 2022. [Google Scholar]
- Larsen, M.; Nielsen, N.H.; Rasmussen, S.F. The Blue Spot Model: Development of a Screening Method to Assess Flood Risk on Highways; Technical Report 183; Danish Road Directorate, Danish Road Institute: Fløng, Denmark, 2010. [Google Scholar]
- Styrelsen for Dataforsyning og Effektivisering. Hydrological analysis product identifying flood-prone depressions during extreme rainfall. In Danmarks Højdemodel, DHM/Bluespot_ekstremregn—Dataspecifikation; Technical Report; SDFE: Copenhagen, Denmark, 2017. [Google Scholar]
- Hodgson, M.; Bresnahan, P. Accuracy of Airborne LIDAR-Derived Elevation: Empirical Assessment and Error Budget. Photogramm. Eng. Remote Sens. 2004, 70, 331–339. [Google Scholar] [CrossRef]
- Bater, C.W.; Coops, N.C. Evaluating error associated with lidar-derived DEM interpolation. Comput. Geosci. 2009, 35, 289–300. [Google Scholar] [CrossRef]
Disclaimer/Publisher’s Note: The statements, opinions and data contained in all publications are solely those of the individual author(s) and contributor(s) and not of MDPI and/or the editor(s). MDPI and/or the editor(s) disclaim responsibility for any injury to people or property resulting from any ideas, methods, instructions or products referred to in the content. |
© 2025 by the authors. Licensee MDPI, Basel, Switzerland. This article is an open access article distributed under the terms and conditions of the Creative Commons Attribution (CC BY) license (https://creativecommons.org/licenses/by/4.0/).