Article

Using Landsat 8/9 Thermal Bands to Detect Potential Submarine Groundwater Discharge (SGD) Sites in the Mediterranean in North West-Central Morocco

by
Youssef Bernichi
1,*,
Mina Amharref
1,
Abdes-Samed Bernoussi
1 and
Pierre-Louis Frison
2
1
Geoinformation, Land Management and Environment Research Team (GATE), Faculty of Sciences and Technology, Abdelmalek Essaâdi University, Tangier 93000, Morocco
2
Laboratory in Sciences and Technologies of Geographical Information for the City and Sustainable Territories LaSTIG, Gustave Eiffel University, IGN, 5 Bd Descartes, Champs-sur-Marne, Marne-la-Vallée, CEDEX 2 City, 77455 Champs-sur-Marne, France
*
Author to whom correspondence should be addressed.
Hydrology 2025, 12(6), 144; https://doi.org/10.3390/hydrology12060144
Submission received: 28 March 2025 / Revised: 22 May 2025 / Accepted: 29 May 2025 / Published: 10 June 2025
(This article belongs to the Topic Karst Environment and Global Change)

Abstract

The objective of this study is to detect the locations of submarine groundwater discharge (SGD) in the coastal area of the El Jebha region, located in northwestern Morocco. It is hypothesized that this zone is fed by one of the most rain-rich karstic aquifers in Morocco (the Dorsale Calcaire). The region’s geology is complex, characterized by multiple faults and fractures. Thermal remote sensing is used in this study to locate potential SGD zones, as groundwater emerging from karst systems is typically cooler than surrounding ocean water. Landsat satellite imagery was used to assess temperature variations and detect anomalies associated with the presence of freshwater in the marine environment. El Jebha’s geographical location, with a direct interface between limestone and sea, makes it an ideal site for the appearance of submarine groundwater discharges. This study constitutes the first use of Landsat-8/9 thermal-infrared imagery, processed with a multi-temporal fuzzy-overlay method, to detect SGD. Out of 107 Landsat scenes reviewed, 16 cloud-free images were selected. The workflow identified 18 persistent cold anomalies, of which three were classified as high-probability SGD zones based on recurrence and spatial consistency. The results highlight several potential SGD zones, confirming the cost-effectiveness of thermal remote sensing in mapping thermal anomalies and opening up new perspectives for the study of SGD in Morocco, where these phenomena remain rarely documented.

1. Introduction

Coastal aquifers are complex, constantly evolving systems characterized by the continuous interaction and mixing of freshwater and seawater, leading to the formation of subterranean estuaries, which play a crucial role in influencing the chemical composition of the ocean through processes involving the discharge of groundwater called subsurface groundwater discharge (SGD) [1].
These designated mixing zones represent sites characterized by highly dynamic and complex biogeochemical reactions, which significantly alter the chemical composition of groundwater in ways that go far beyond the simple predictions that could be deduced from simple mixing models and principles [2]. Saltwater intrusion, exacerbated by excessive pumping and sea-level rise, widens the subsurface estuary and accelerates biogeochemical processes, potentially increasing nutrient, carbon, and metal flows to coastal waters [2]. The complex characterization of these multifaceted systems requires the incorporation of a wide range of interdisciplinary methodologies, which should include a comprehensive set of meticulously measured geological assessments, hydrological evaluations, and biogeochemical analyses [3]. Reactive end-element mixing analysis is a crucial methodological approach that can contribute significantly to the identification and quantification of various chemical reactions occurring in coastal aquifers, revealing complex processes such as cation exchange, mineral precipitation, and redox reactions, all of which play an essential role in the composition of SGD [4]. A thorough understanding of these biochemical and physical reactions is of paramount importance for the assessment of coastal water quality, as well as for the accurate evaluation of nutrient loads, which have a significant impact on marine ecosystems in complex and interconnected ways [3].
In other words, SGD refers to the complex process of groundwater emanating from subterranean aquifers located in marine ecosystems, including, but not limited to, vast bodies of water such as seas, vast oceans, or complex estuarine systems. This multi-faceted discharge phenomenon can manifest itself through a variety of pathways, which may include the progressive infiltration of water through various stratified layers of sedimentary or igneous rocks located beneath the ocean floor, the emergence of submarine springs, or the infiltration of groundwater from coastal aquifers into the marine environment [1,5,6].
The mixing zone is highly dynamic. It shifts continually under changing hydrodynamics. This interface is pivotal for coastal exchange. Here, separate water masses collide and mingle. Their contact mobilizes dissolved species such as nutrients, trace metals, and contaminants, and then drives them seaward. Repeated stirring and sharp density gradients amplify this transport. As a result, the zone reshapes both the concentrations and the spatial patterns of these compounds in nearby marine waters [7]. SGD has a significant impact on coastal ecosystems by influencing nutrient fluxes, salinity regimes, and overall health [8].
Remote sensing has proven invaluable for environmental management, offering applications such as flood mapping [9], deforestation and wetland tracking [10], vegetation health analysis [11], and urban development planning [12].
Although modern L-band microwave missions such as SMOS, Aquarius, and SMAP can now retrieve sea-surface salinity within roughly 40 km of the coastline, their native 40–150 km grid spacing is still far too coarse to resolve the sub-kilometer plumes characteristic of SGD [13].
Another approach is widely used, which is grounded on thermally driven anomalies caused by groundwater discharge, where cooler anomalies arise from colder SGD into warm coastal zones [14], whereas warmer anomalies are associated with thermal springs, where groundwater temperatures surpass those of receiving surface waters [15].
Detecting SGD using satellite-derived sea surface temperature data requires a wise balance between the spatial resolution offered by sensors and the frequency at which they capture temporal data.
The Jebha area, the marine study area, characterized by karst rock formations, is home to numerous caves overlooking the Mediterranean Sea. The potential existence of conduits directly connecting groundwater to the Mediterranean Sea is of scientific interest and warrants further research.
The Jebha Fault that borders the Jebha area is a major ENE–WSW sinistral transcurrent fault in the Rif Cordillera, formed during the emplacement of the Internal Zones on the Flysch and External Zones units [16]. It defines the southern limit of the Alboran Block as well as the North Betic Fault to the north. Fault activity occurred mainly during the Burdigalian, with later reactivation as a dextral fault during the recent NW–SE Eurasia-Africa convergence [16]. Therefore, this area is the most suitable for the existence of freshwater flows towards the sea.
This study is the first to fuse 100 m Landsat-8/9 STA with a multi-date fuzzy overlay to locate persistent cold plumes. No previous investigation of SGD has targeted the carbonate coast of north-central Morocco. Eighteen candidate plumes coincide with the Jebha Fault trace and the recharge belt of the Dorsale Calcaire aquifer, suggesting structural control on discharge. Because the workflow relies entirely on open-source code and freely available data, it can be readily transferred to other data-poor karst coastlines lacking dense field-monitoring networks, providing a scalable reconnaissance tool for global SGD assessment.

2. Materials and Methods
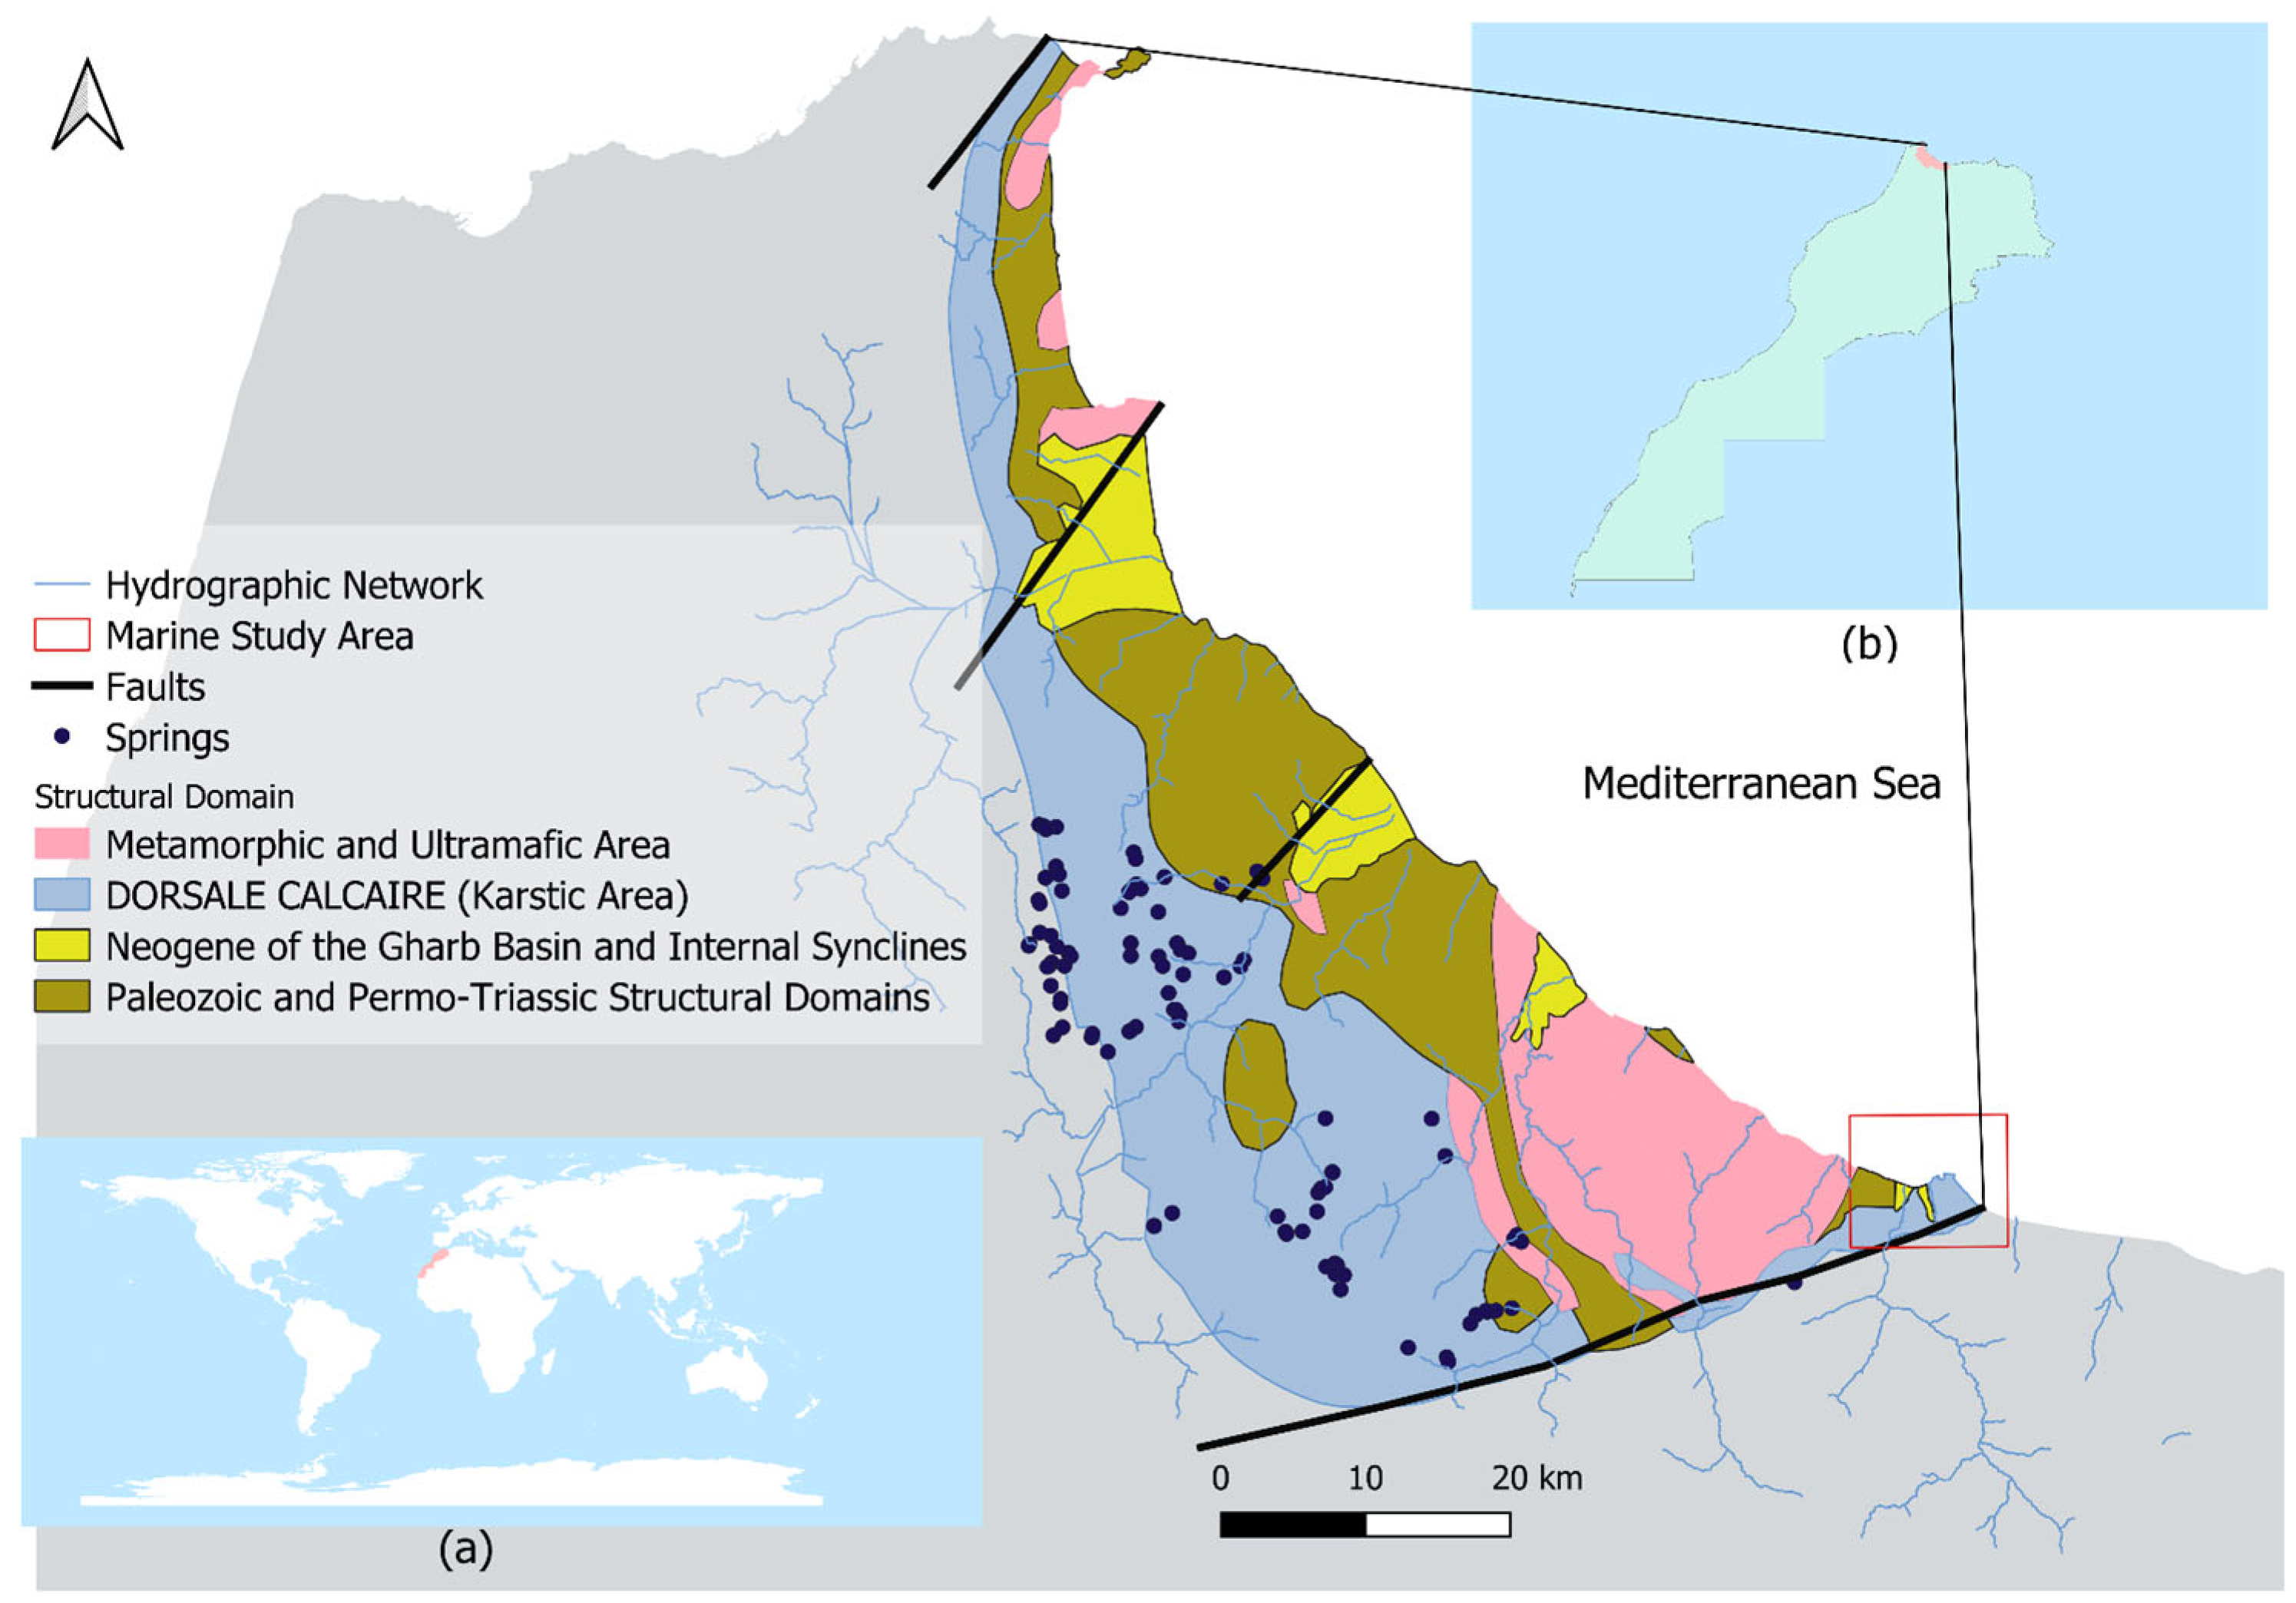
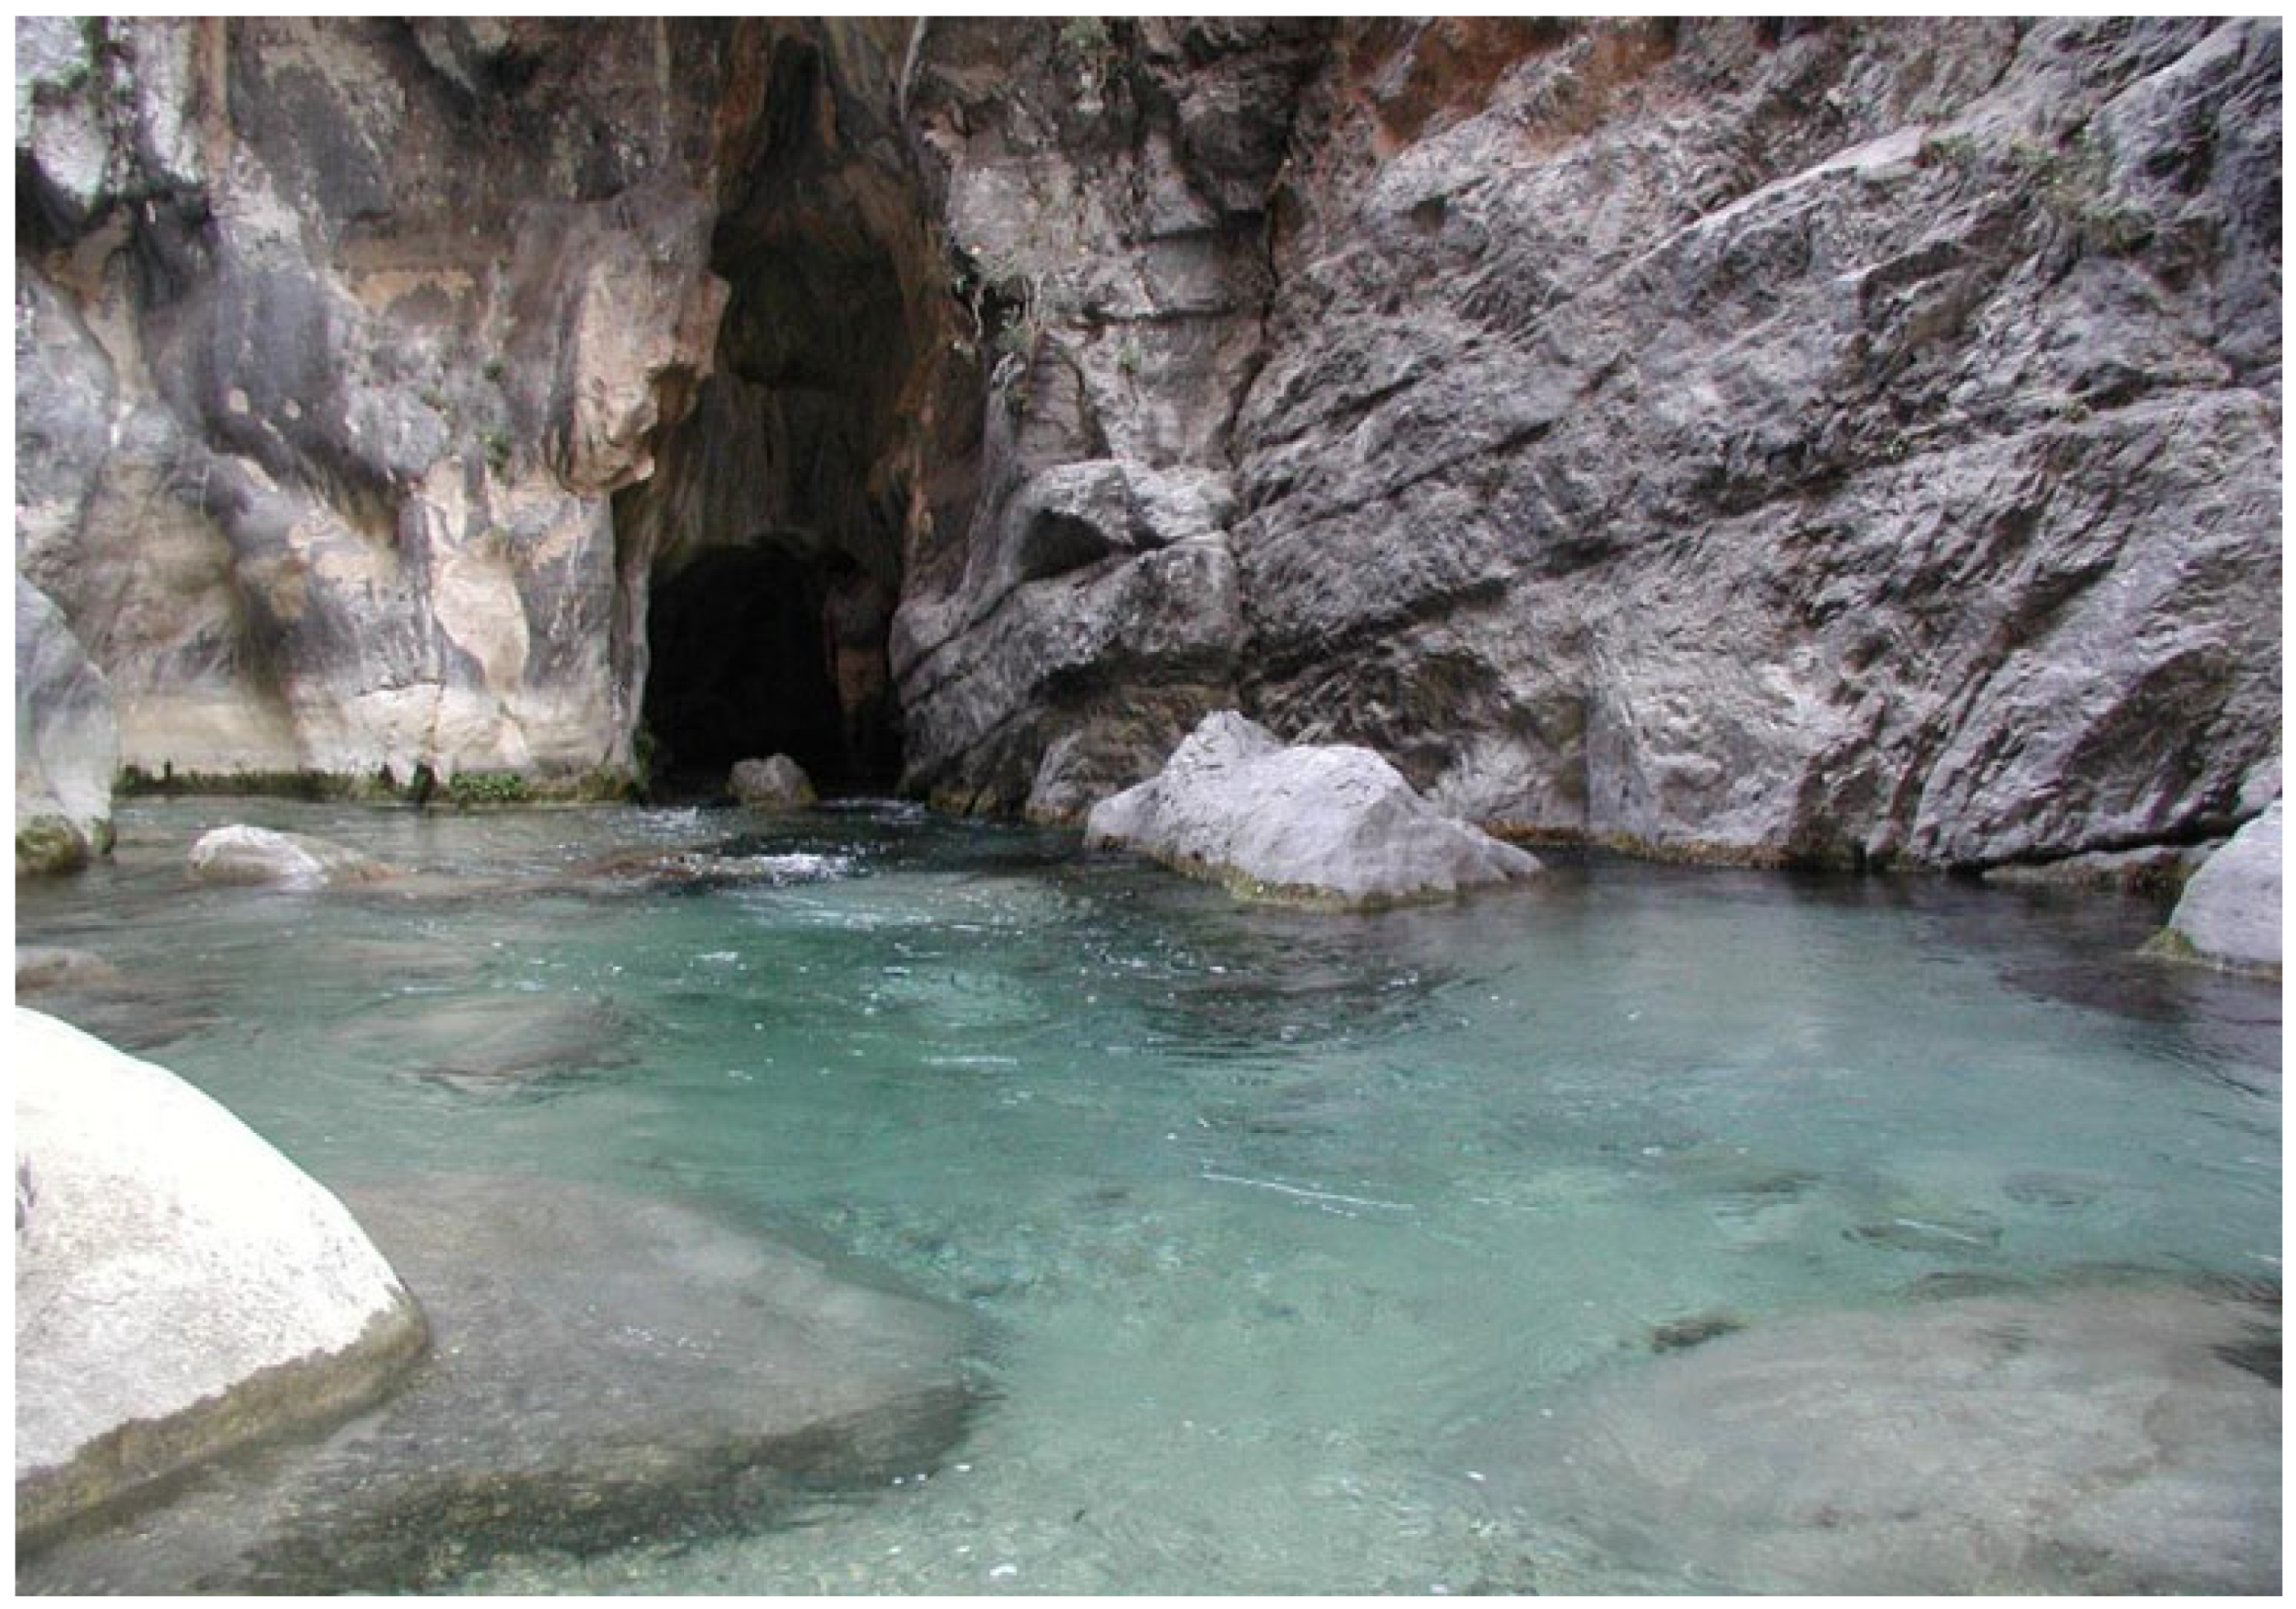
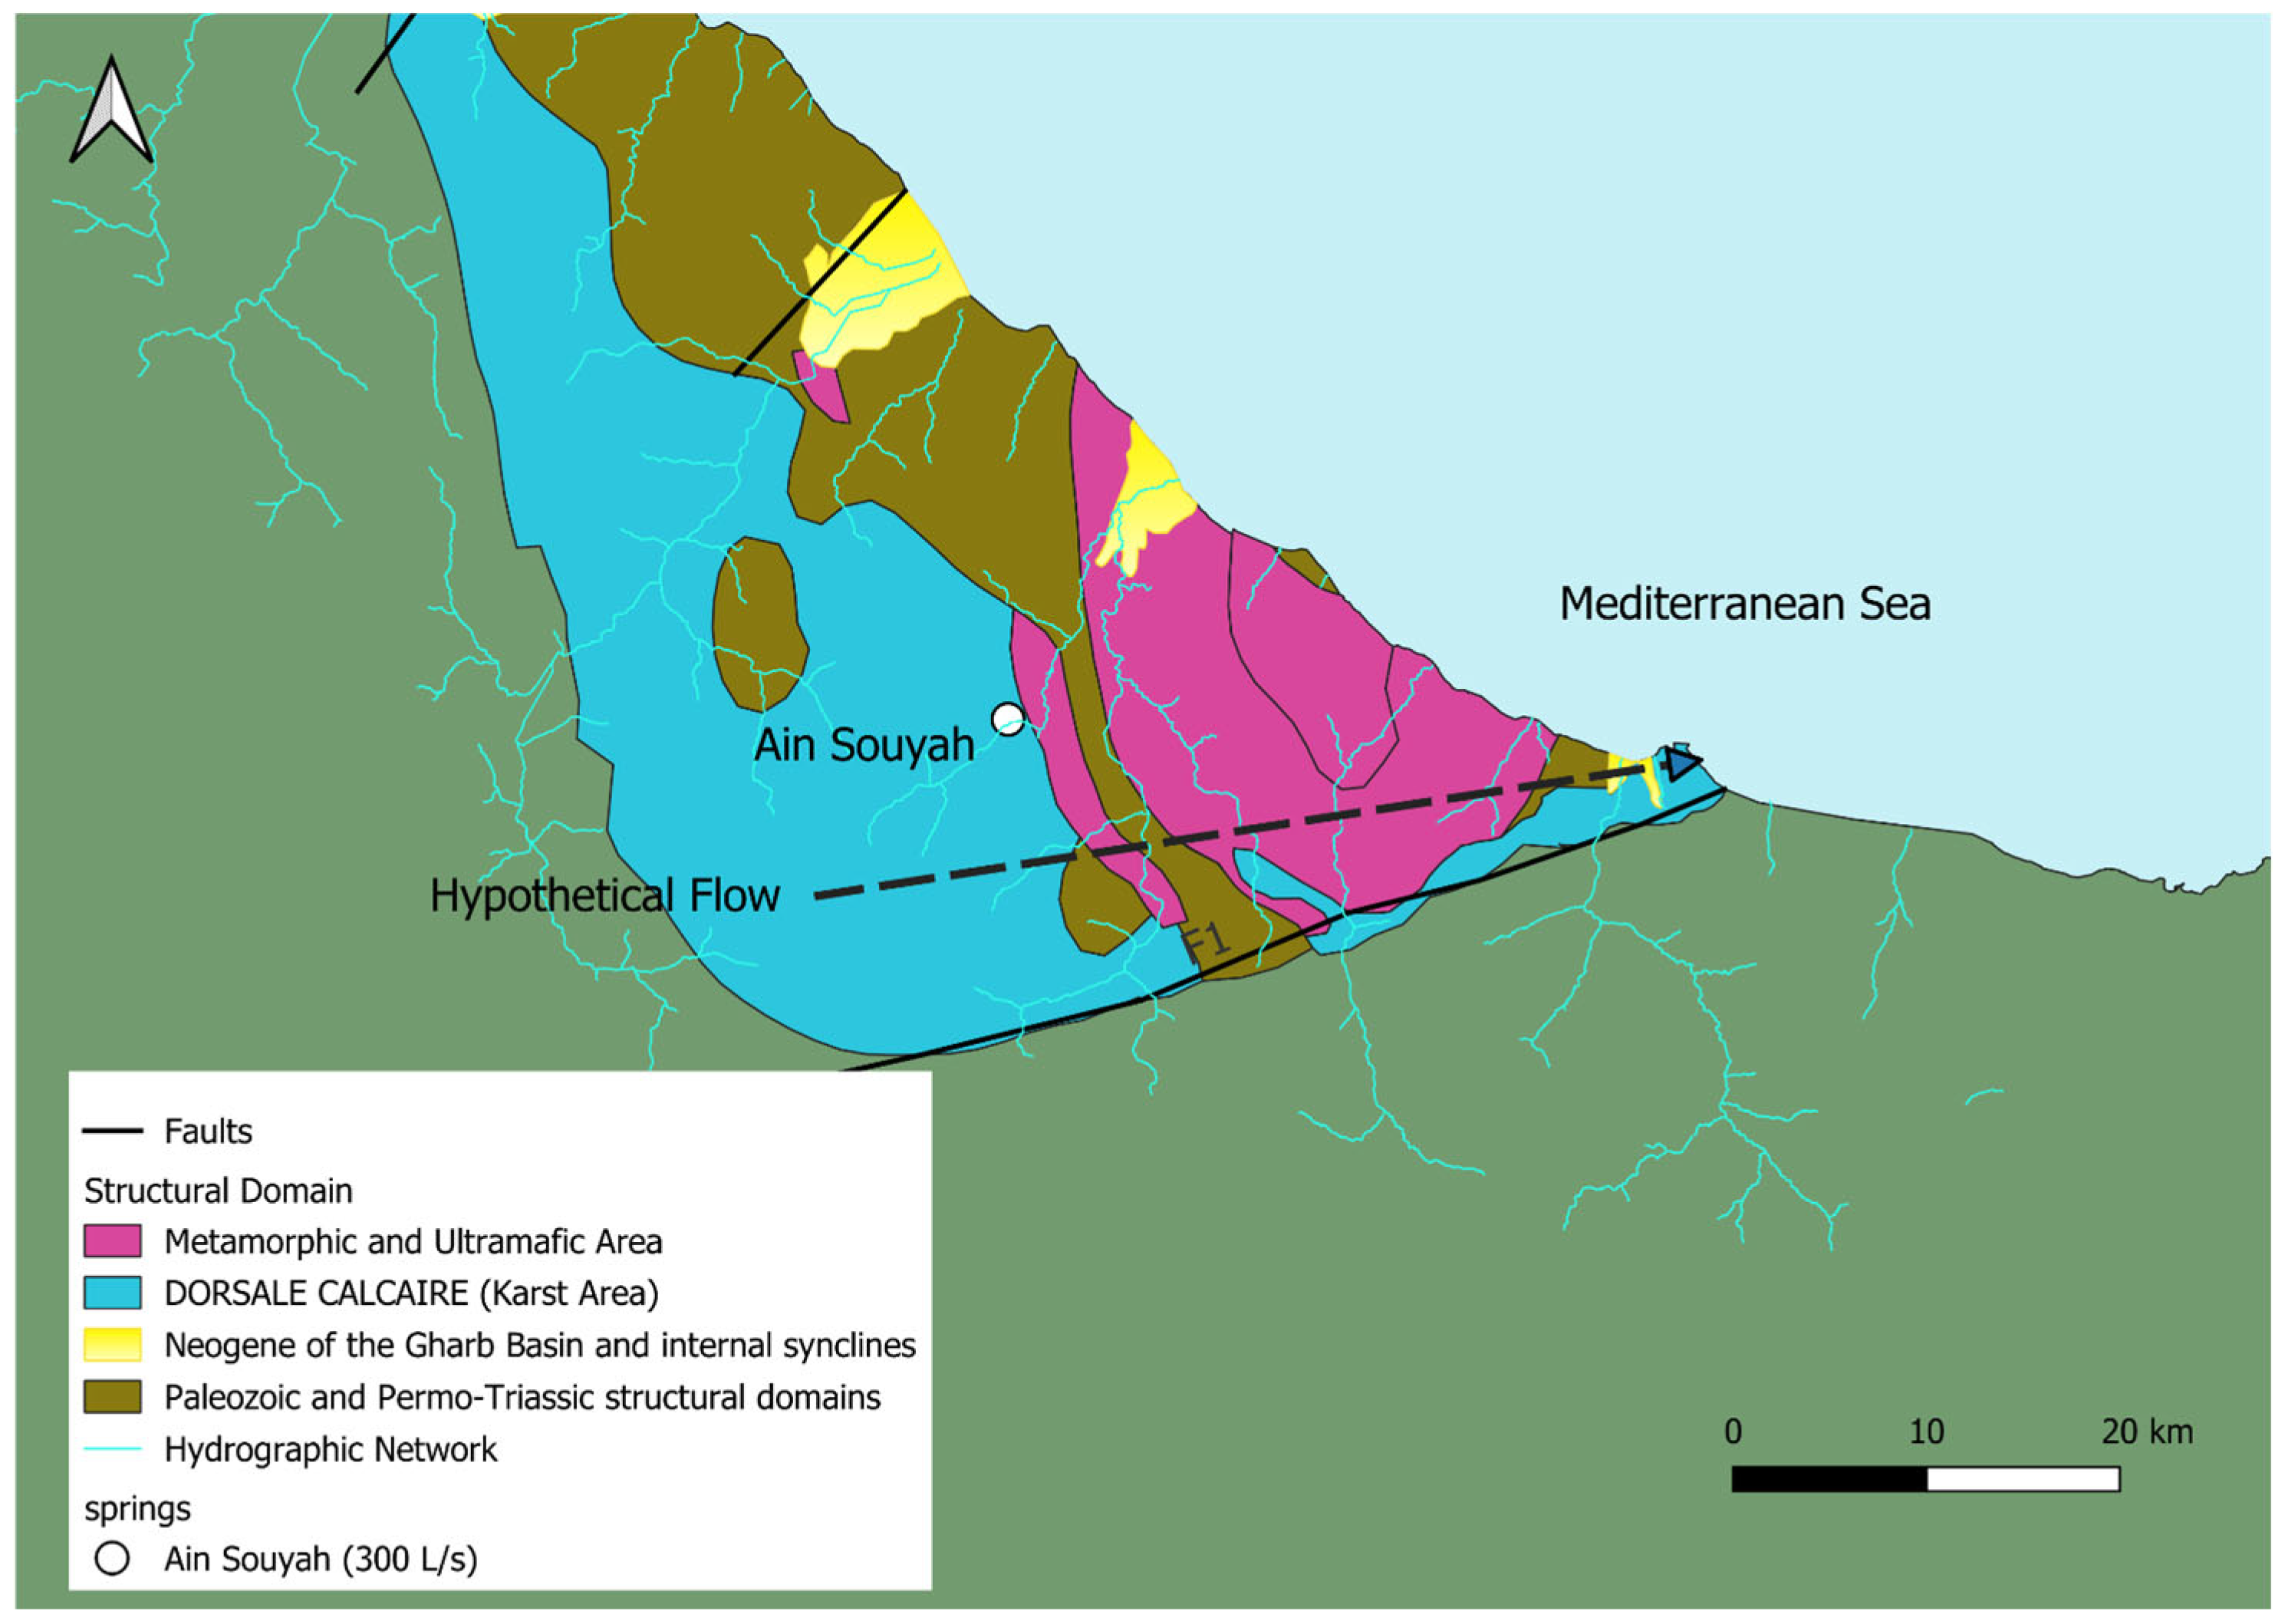
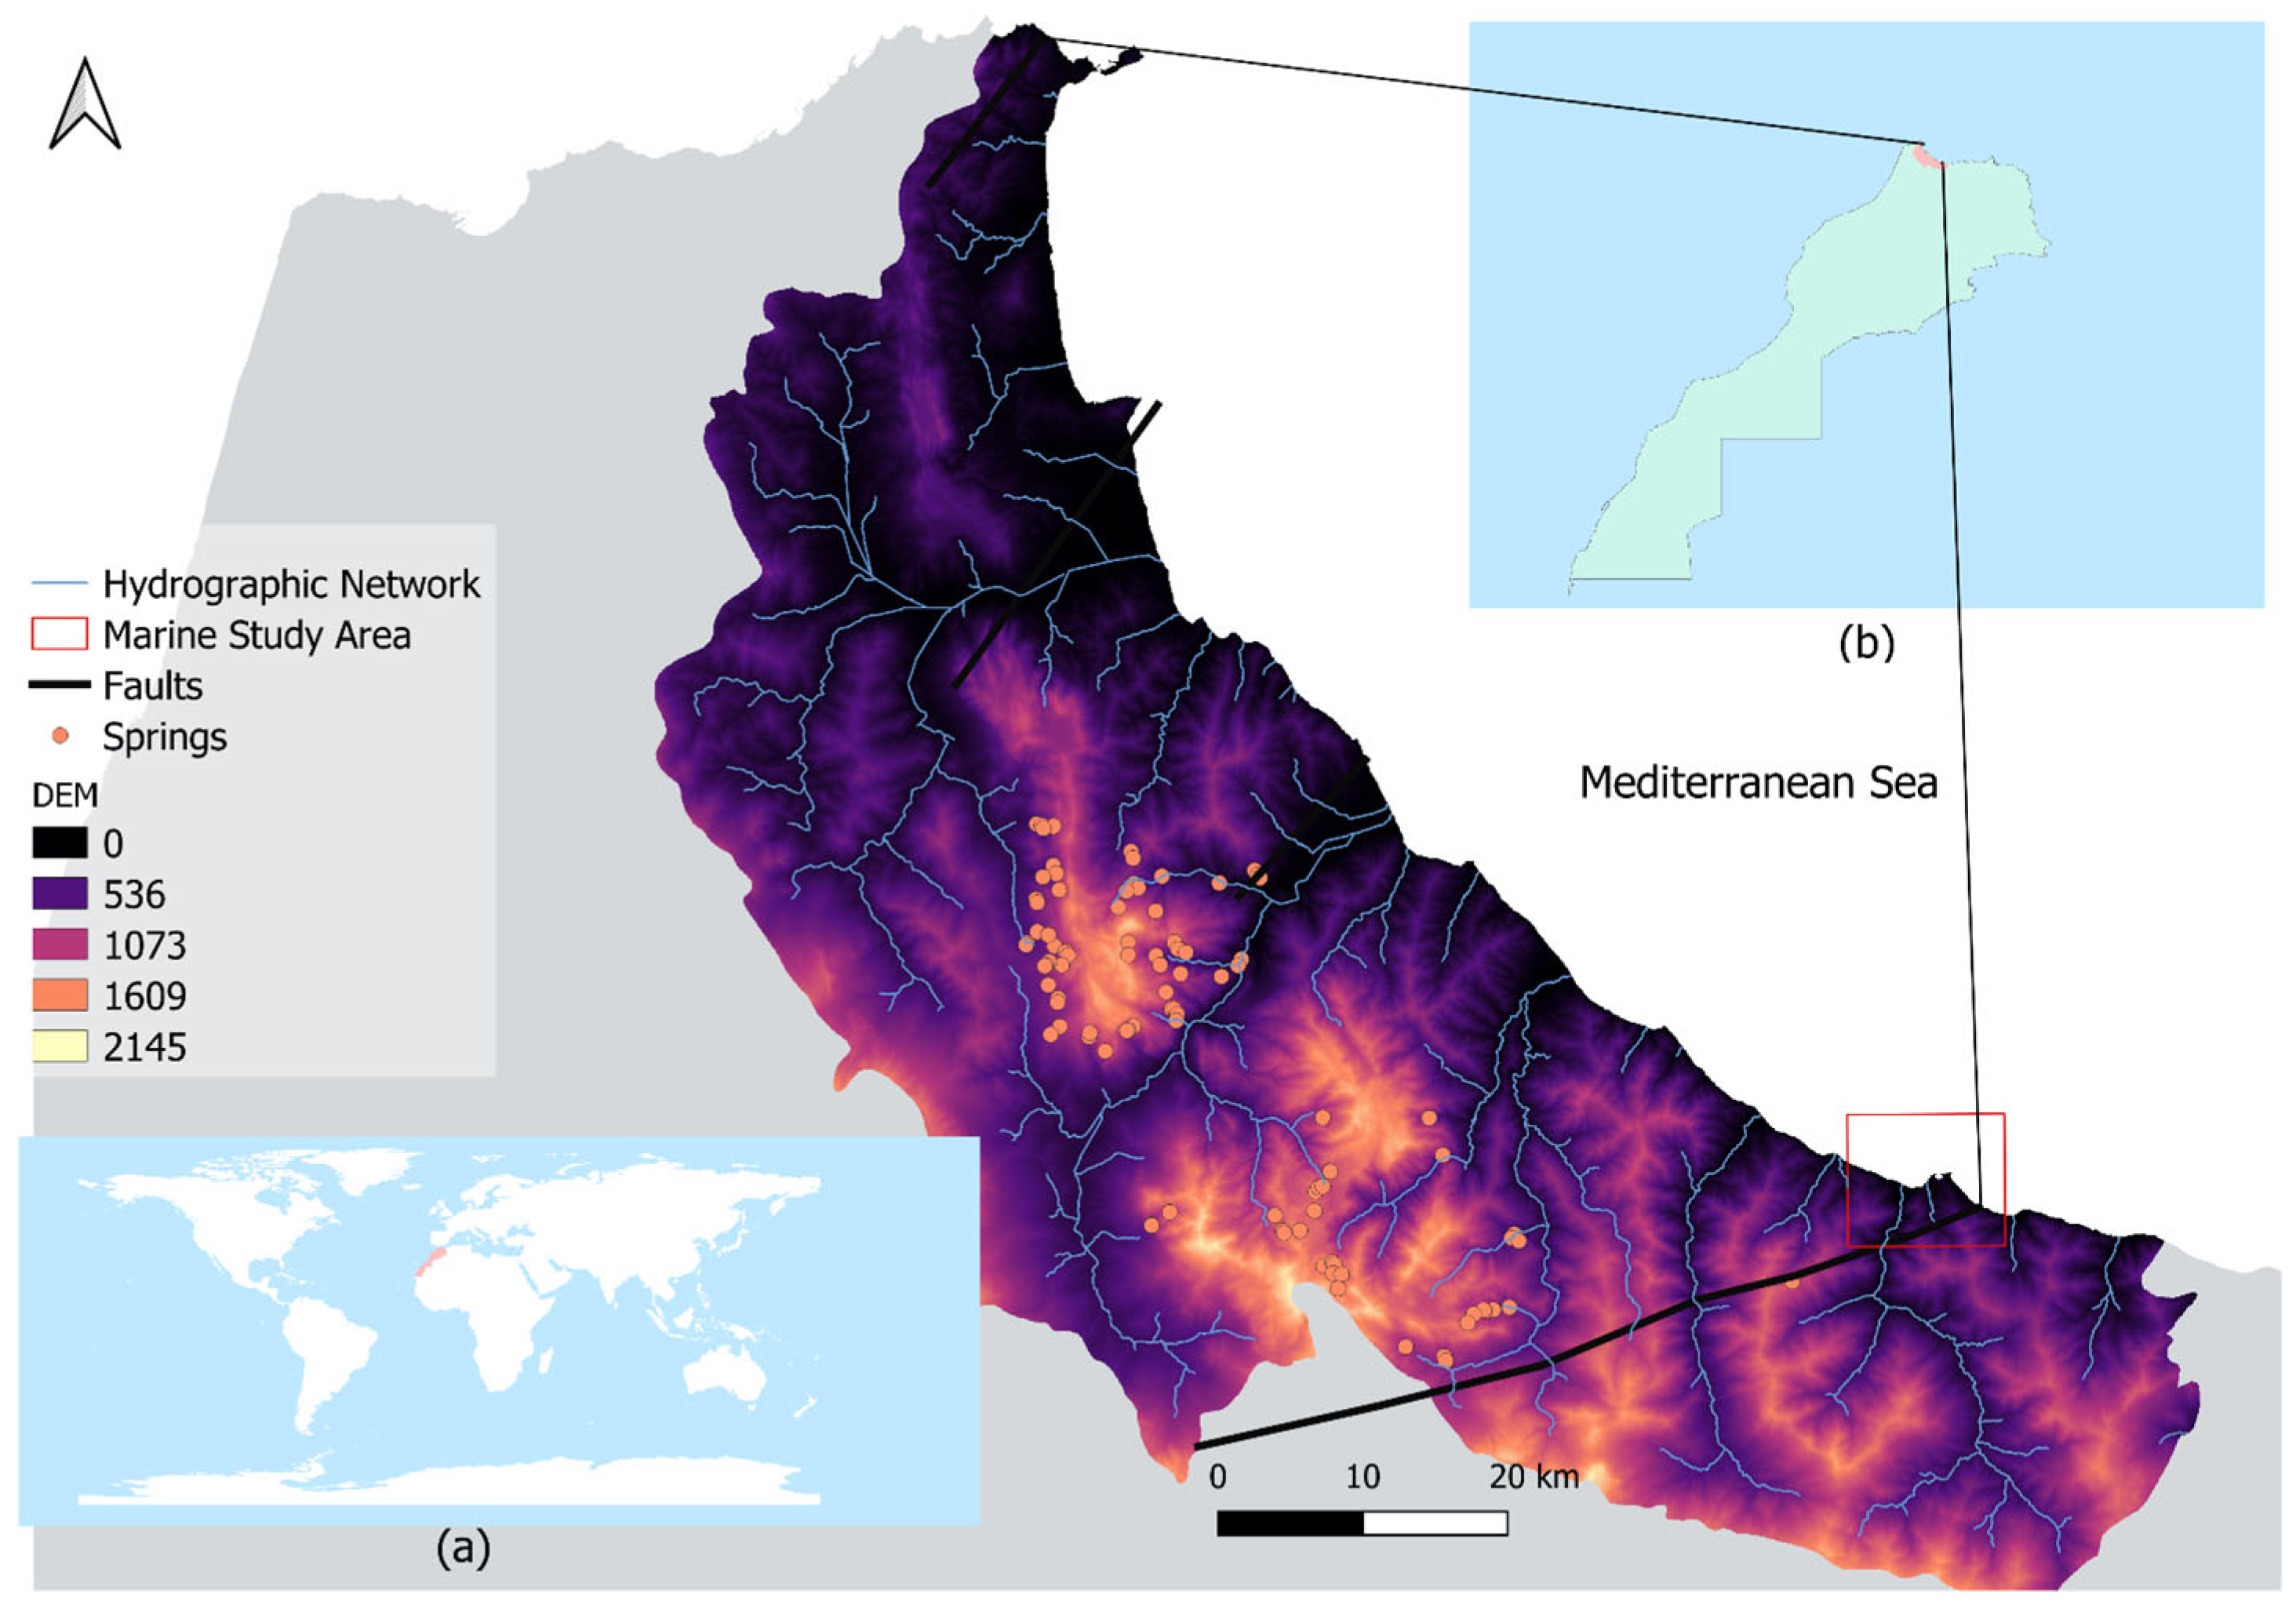
2.1. Study Area

The Dorsale Calcaire karst region is located within the western Mediterranean hydrological zone of Morocco. It is bounded to the north by the Mediterranean Sea, in proximity to the Strait of Gibraltar. The Dorsale Calcaire serves as a key aquifer in northern Morocco. Its hydrogeological importance is attributed to its wide spatial extent, substantial annual rainfall, and the frequent presence of both perennial springs and seasonal streamflow [17]. The occurrence of typical karst features such as sinkholes, caves, and limestone pavements, along with noticeable seasonal drops in water levels, confirms its karstic character [17].
The Jebha region stands out as the only known karst area in the region that connects directly to the Mediterranean Sea [18]. Its unique geological features, including extensive karst formations and sea-facing caves, create a striking natural setting that attracts both scientists and visitors.
The potential presence of natural underground conduits linking the local groundwater system directly to the sea highlights the need for more in-depth research in this exceptional area. The management of water resources is carried out under the authority of the Loukous Hydraulic Basin Agency and is administratively part of the province of Chaouen, part of the region of Tangier–Tetouan–El Hoceima.
The region being studied has a semi-arid climate, with an aridity index of 12. Rainfall in the area ranges between 213 mm and 528 mm, averaging around 337 mm over the long period from 1945 to 2017, according to the project for a master plan for the integrated development of water resources in the Loukkos, Tangier, and Mediterranean coast basin [19].
In contrast, the nearby area thought to supply water to the region through underground karst channels specifically the limestone ridge known as Dorsale Calcaire, experiences much wetter conditions. There, the aridity index is significantly higher at 35, with annual rainfall varying between 345 mm and 1993 mm and an average of 950 mm in the Chaouen area [19].
Even wetter still is the neighboring region of Bab Taza, which has an aridity index of 44. Rainfall there spans from 465 mm to a remarkable 2925 mm, averaging about 1280 mm over the same timeframe. These differences highlight the strong climatic contrasts within the wider geographical area [19].
The Jebha area, characterized by karstic rock formations, is home to numerous caves overlooking the Mediterranean Sea as shown in Figure 1. The potential existence of conduits directly linking underground water to the Mediterranean Sea is arousing scientific interest and justifying further research.
As shown in Figure 2, the Dorsale Calcaire has a potential direct pathway toward the Jebha promontory. This is why this region was selected as the target for detecting potential (SGD) zones. Karst areas are more susceptible to submarine groundwater resurgence due to conduit-dominated flow [20], and the concentrated outflow is more detectable using thermal remote sensing [21]. The Dorsale Calcaire hosts numerous inland springs, of which Ain Souyah is the largest, delivering the greatest discharge toward the Mediterranean.
Although the spring first enters the hydrographic network rather than the sea, its Vauclusian conduit geometry typifies the pathways that could transfer important flowrates. This spring originated from the contact between karst and non-karst areas, so in the case of the promontory of El Jebha, the non-existence of an impermeable barrier suggests the existence of SGD. Figure 3 and Figure 4 locate Fault F1, the inferred offshore flow path, and the spring within the coastal structural and drainage framework.
A buffer of 550 m from the coastline was generated and chosen as the marine study area, as previous works demonstrated that SGD at more than 500 m from shore are hardly detectable by Landsat thermal remote sensing [21].
In fact, SGD is not the only source of thermal anomalies [21]; expanding the distance will result in many SGD-like anomalies that are the results of other phenomena.

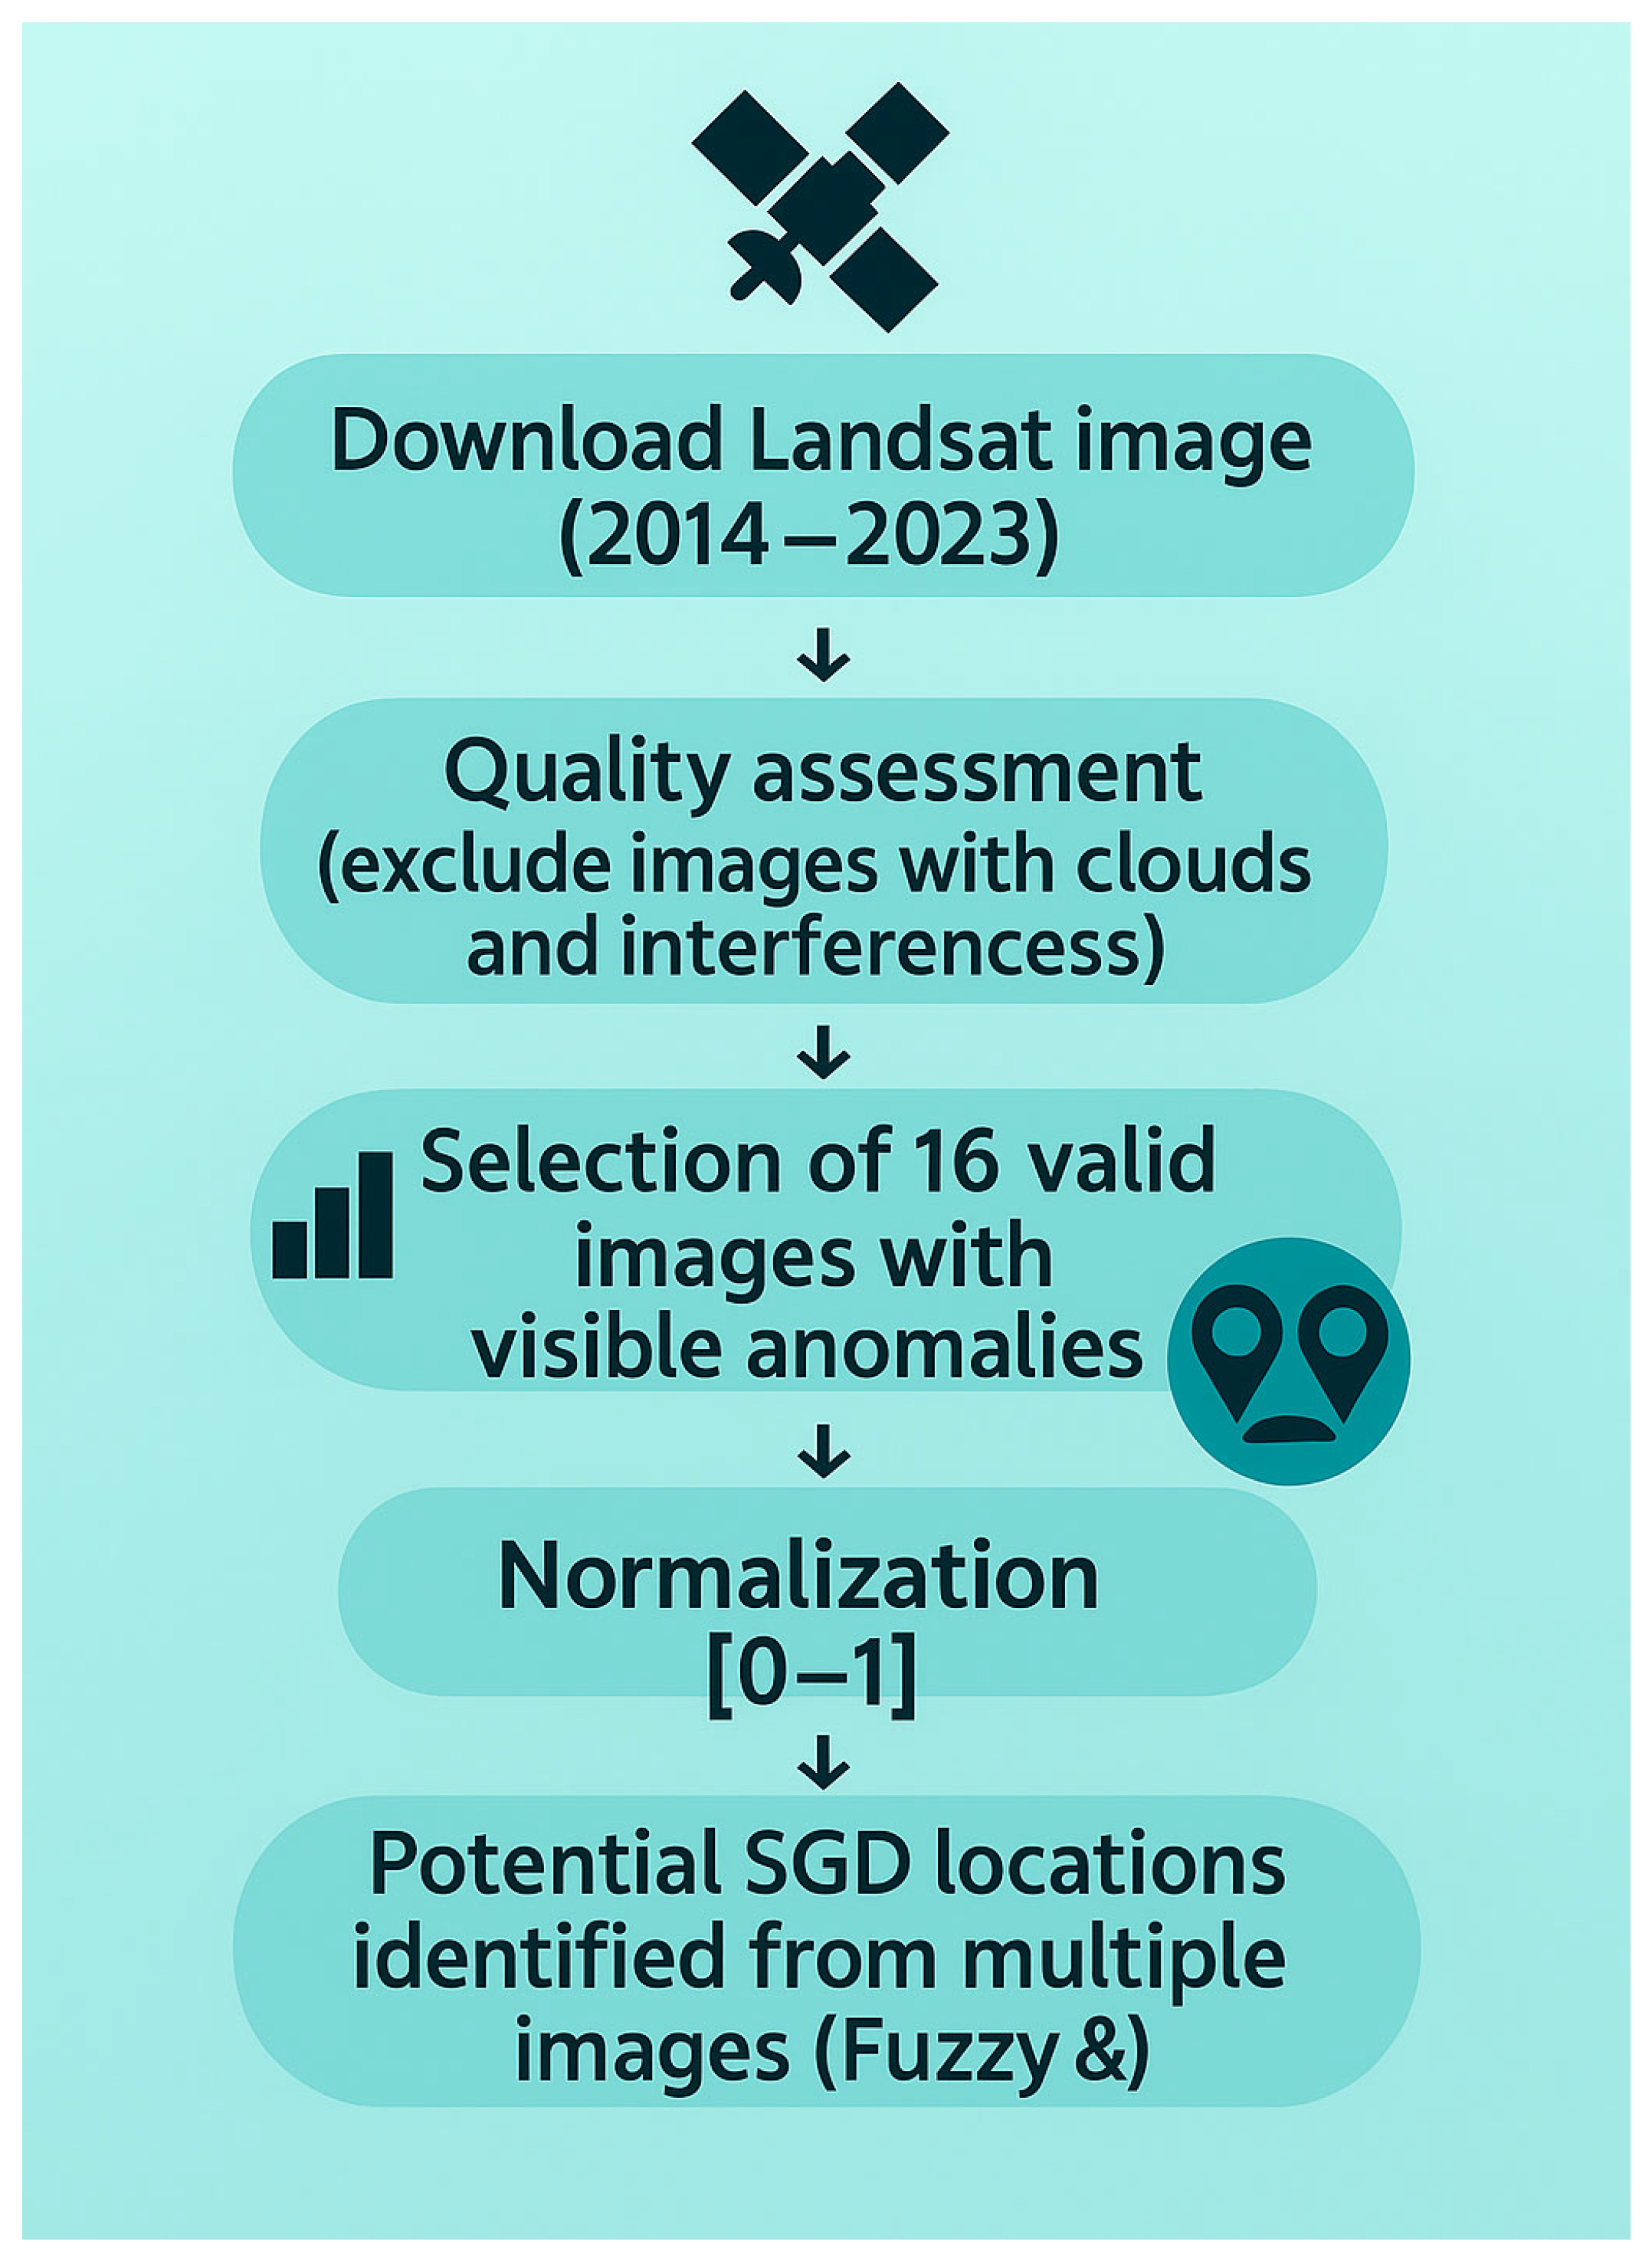
2.2. Data Acquisition and Refinement

Satellite thermal and salinity sensors each offer advantages and constraints for detecting submarine groundwater discharge (SGD). Landsat-8/9 is preferred in this study because its 100 m thermal band, denoted as B 10, resolves the sub-kilometer plumes expected along carbonate coasts [21,22]. The sensor’s eight-day revisit interval, however, cannot capture intra-tidal or storm-scale variability [23].
Sentinel-3 SLSTR and MODIS shorten the interval to 1–2 days, respectively, but their 1 km pixels smear narrow coastal plumes and are therefore better suited to basin-scale circulation analyses [24].
SEVIRI, on the other hand, offers remarkable temporal resolution, providing images at 15 min intervals [24], but lacks the spatial detail necessary for most coastal applications.
Satellite-derived sea-surface salinity (SSS) provides a complementary line of evidence, but its present resolution is still too coarse for individual SGD sites. L-band microwave missions such as SMOS, Aquarius, and SMAP retrieve SSS within ≈ 40 km of shore [25]. Measurement precision, however, is still challenged by radio-frequency interference (RFI) and land–sea contamination (LSC) [13]. New retrieval approaches, most notably the light gradient boosting model (LGBM), have reduced the mean bias to 0.03 PSU and the root-mean-square error (RMSE) to 0.54 PSU after correction [13]. Region-specific models can perform even better; in the Southern Yellow Sea, an RMSE of 0.29 PSU has been reported [25]. Despite these gains, two key limitations remain: the coarse spatial resolution of the satellite products and their uneven performance in the coastal fringe, where salinity gradients change most rapidly [26].
The Soil Moisture and Ocean Salinity (SMOS) and Aquarius missions represent significant advancements in remote sensing technology, particularly in measuring soil moisture and ocean salinity. SMOS operates at a spatial resolution of approximately 40 km, utilizing L-band (1.4 GHz) passive radiometry, while Aquarius employs a different approach with a resolution of 150–200 km, using a combination of radiometer and radar techniques [27,28].
Therefore, the detection of SGD by satellite-retrieved salinity will not be feasible, as it is nearly impossible that SGD will generate plumes of 40 or 150 km size [21].
As part of a detailed analysis of the study area, as described in Figure 5, 107 Landsat 8/9 Level-2 scenes (2014–2023) were downloaded via United States Geological Survey (USGS) Earth Explorer. Each scene was accompanied by built-in Quality Assessment (QA_PIXEL and QA_RADSAT) bands, which were used to rigorously screen for cloud cover, striping, and other environmental or sensor-related interferences that could compromise thermal anomaly detection. In addition to automated filtering, all images underwent visual inspection to verify spatial coherence and sea-surface coverage. After this thorough screening, 16 cloud-free scenes were retained for further analysis. This careful selection process ensured the accuracy and reliability of the thermal dataset, thereby strengthening the integrity of the anomaly detection and subsequent interpretation. Atmospherically corrected Landsat Collection 2 Level-2 scenes were downloaded through United States Geological Survey Earth Explorer [29], Because the Level-2 products already include the radiometrically calibrated surface-temperature band (ST_B10) produced by the USGS Landsat Surface Temperature algorithm and converted to kelvin, no additional thermal calibration was required [30,31].
The treatment and manipulation of the images in question were executed through the application of the software QGIS 3.16, an open tool designed for geographic information system analysis and spatial data management.
Alongside these automated checks, visual inspection and histogram stretching techniques were also applied. Only images displaying thermal anomalies without any signs of thermal interference were selected for further analysis. This careful screening ensures the accuracy and reliability of the data used in the subsequent stages of the study.

2.3. Standardized Thermal Anomaly

In order to detect specific geographical locations that may constitute potential submarine groundwater discharges, we employed the analytical methodology of utilizing temperature anomaly maps, commonly referred to in the literature as TA, which provide significant insights into thermal variations. TA is considered an indication of such subterranean water movements [32], and standardized temperature anomaly maps (STA) [32] are calculated using the Raster Calculator module of QGIS software.
Temperature anomaly (TA) [32]
T A = T a T p
where TA denotes the temperature anomaly expressed in Kelvin, Tp signifies the sea surface temperature (SST) value corresponding to each individual pixel, also expressed in Kelvin, and Ta represents the average sea surface temperature value that is calculated for the entire scene, which is quantified in Kelvin,
Standardized temperature anomaly (STA) [32]:
S T A = T A / σ
STA refers to the dimensionless normalized temperature anomaly, a key metric used to assess temperature deviations relative to a defined baseline. It also incorporates the standard deviation (σ) of the observed scene to account for natural variability in the temperature data. These calculations were performed on a per-pixel basis across the sea surface temperature (SST) layers, resulting in the generation of both TA (temperature anomaly) and STA maps. These maps highlight areas with notable thermal anomalies, helping to identify potential sites of submarine groundwater discharge (SGD).
Positive STA values were disregarded in the analysis due to the predominant hypothesis, which posits that the temperature of groundwater in karstic regions is consistently lower than that of the adjacent seawater [33], leading us to conclude that such positive values would not contribute significantly to our findings. Conversely, if our primary objective were to investigate the presence of thermal springs, then it stands to reason that those positive STA values would become considerably more pertinent and beneficial for our research objectives.

2.4. Potential Locations per Date

These generated maps were derived from the STA calculations, whereby these specific points exhibiting negative anomalies were evaluated and subsequently identified as potential sites for sea groundwater discharge.

2.5. Potential Locations from Multiple Images (Fuzzy Function)

A multi-scene approach is adopted here to curb false positives. Transient thermal spots can mislead SGD mapping [34]. Examining a long stack of Landsat scenes reduces that risk. Each frame is checked against many others collected over years. Sporadic signals from currents, tides, or sensor noise appear on only one or two dates. Their random or seasonal pattern marks them as non-SGD sources. In contrast, genuine SGD plumes recur in the same coastal pixels throughout the archive. Their persistence across successive time stamps confirms authenticity [34]. This sequential screening boosts confidence in every retained anomaly.
In order to effectively identify and analyze the presence of persistent negative anomalies that may occur frequently across a diverse range of multiple images, the fuzzy and overlay function is used [35]. The initial stage of the process involves normalization, during which it is imperative that all images undergo a rescaling transformation to fit within the standardized range of [0, 1] prior to their application in subsequent analyses or operations.
N o r m a l i z e d   V a l u e = R a s t e r   V a l u e M i n   V a l u e M a x   V a l u e M i n   V a l u e
Fuzzy AND Operation for Multiple Spatial-Temporal Anomaly (STA) Layers:
Let A = { S T A 1 , S T A 2 , S T A 3 , …, S T A n } represent n sets corresponding to spatial-temporal anomaly (STA) layers. Each set ST A i has a membership function ST A i ( x ) quantifying the degree to which a pixel x belongs to the anomaly class in layer ST A i , where μST A i (x) ∈ [0, 1] [35].
μ i = 1 n S T A i ( x ) = m i n ( μ S T A 1 ( x ) , μ S T A 2 ( x ) , , μ S T A 3 ( x ) )
In order to clarify the result and make it more intuitive, an inversion is needed in order to have cooler regions with higher potential of SGD near 1 and hotter regions near 0.
S G D   P r o b a b i l i t y = 1 μ i = 1 n S T A i ( x )

3. Results

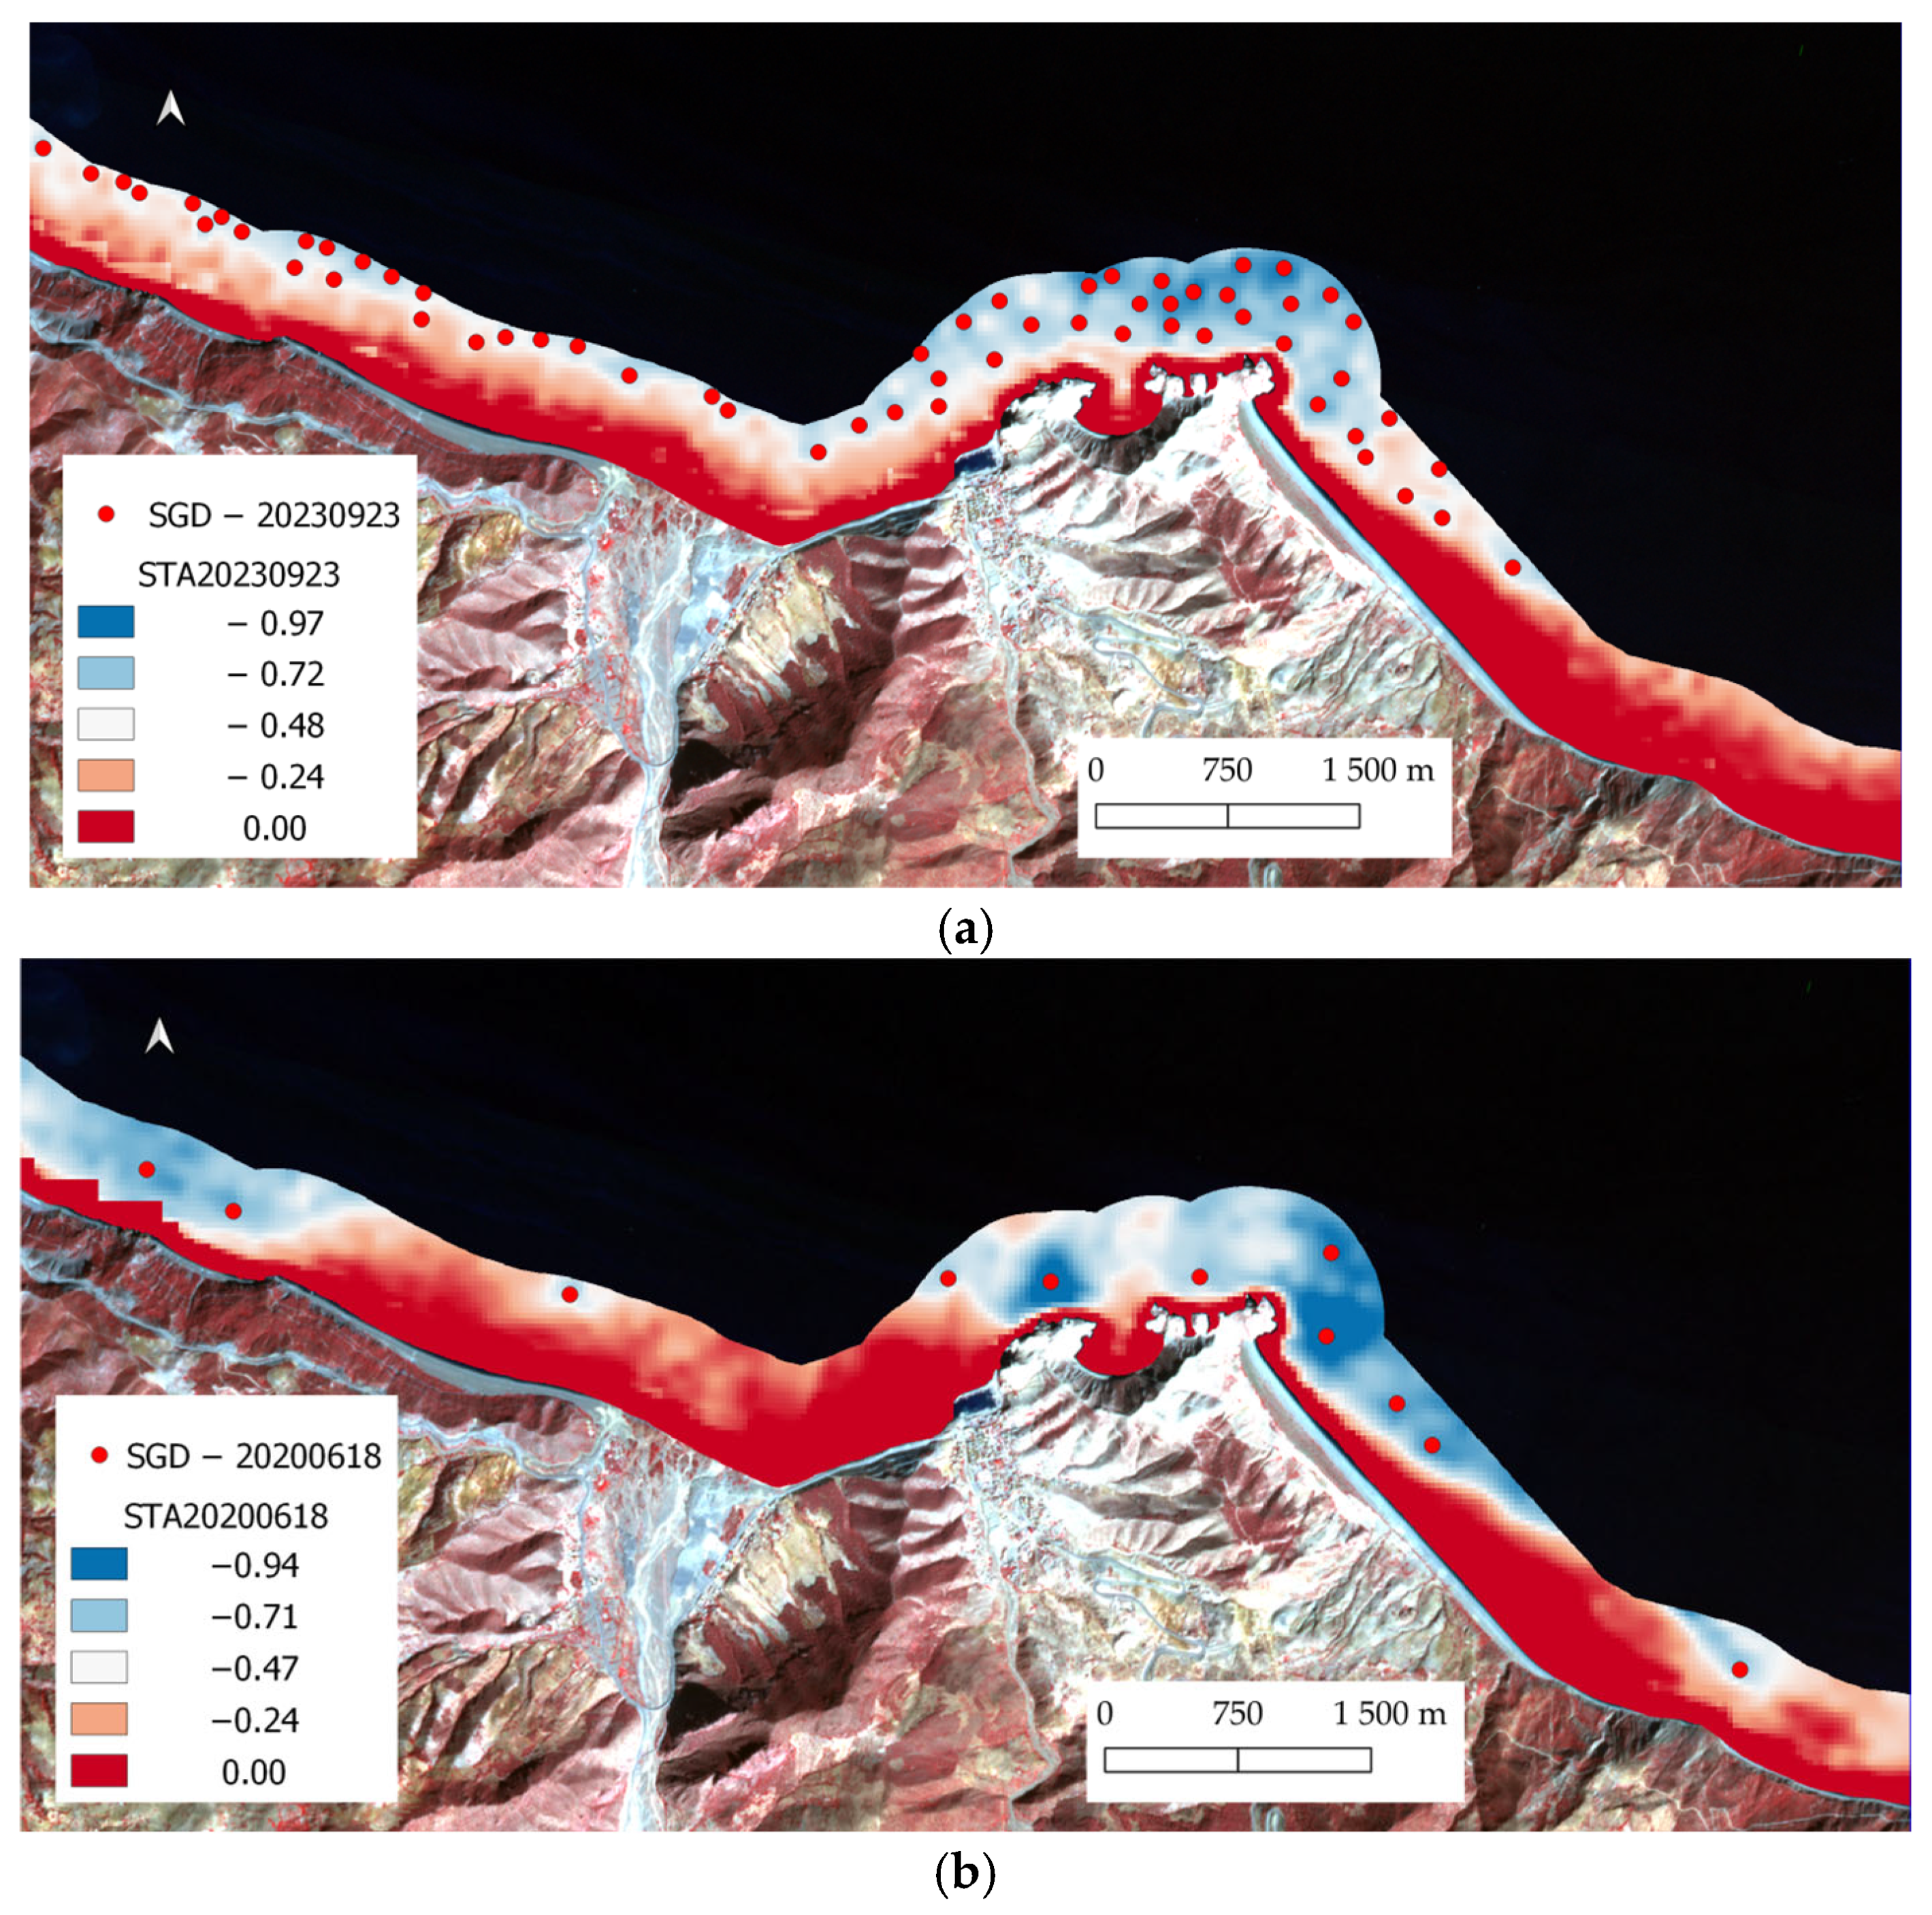
3.1. Potential Locations per Day

After the generation of the standardized thermal anomaly (STA) maps (Equation (2)), a detailed anomalies count shapefile was systematically created for each specific date; within the framework of this analytical approach, all identified anomalies were regarded as potential candidates for further investigation and consideration.
The quantification of these potential anomalies exhibited a notable range, fluctuating from a minimum of 18 occurrences on the date of 18 June 2022 to a maximum of 61 occurrences recorded on 23 September 2023, as is clearly illustrated in the subsequent table presented for reference:
Table 1 summarizes the seasonal distribution of potential SGD anomalies identified through single-date STA from 2014 to 2023. The highest anomaly count (61) was recorded on 23 September 2023 (autumn), while the lowest (11) occurred on 18 June 2020 (summer). Seasonal trends are evident, with autumn dates (September–October) consistently showing elevated counts (e.g., 50–61 anomalies) compared to summer months (11–40 anomalies). Notably, 2023 exhibited the most pronounced activity, with one autumn and one summer date (23 September 2023 and 11 June 2023) accounting for 61 and 37 anomalies, respectively. This contrasts with lower counts in 2022 (11–15 anomalies). While STA identified a high number of potential SGD anomalies (e.g., 61 on 23 September 2023), the counts likely overrepresented true SGD signals. Hydrological processes such as coastal upwelling, sediment plumes, or tidal water circulation can produce spectral anomalies resembling SGD, particularly in single-date analysis [21].
Figure 6 shows examples of standardized thermal anomalies for summer and autumn; background images were courtesy of Planet Labs [36].

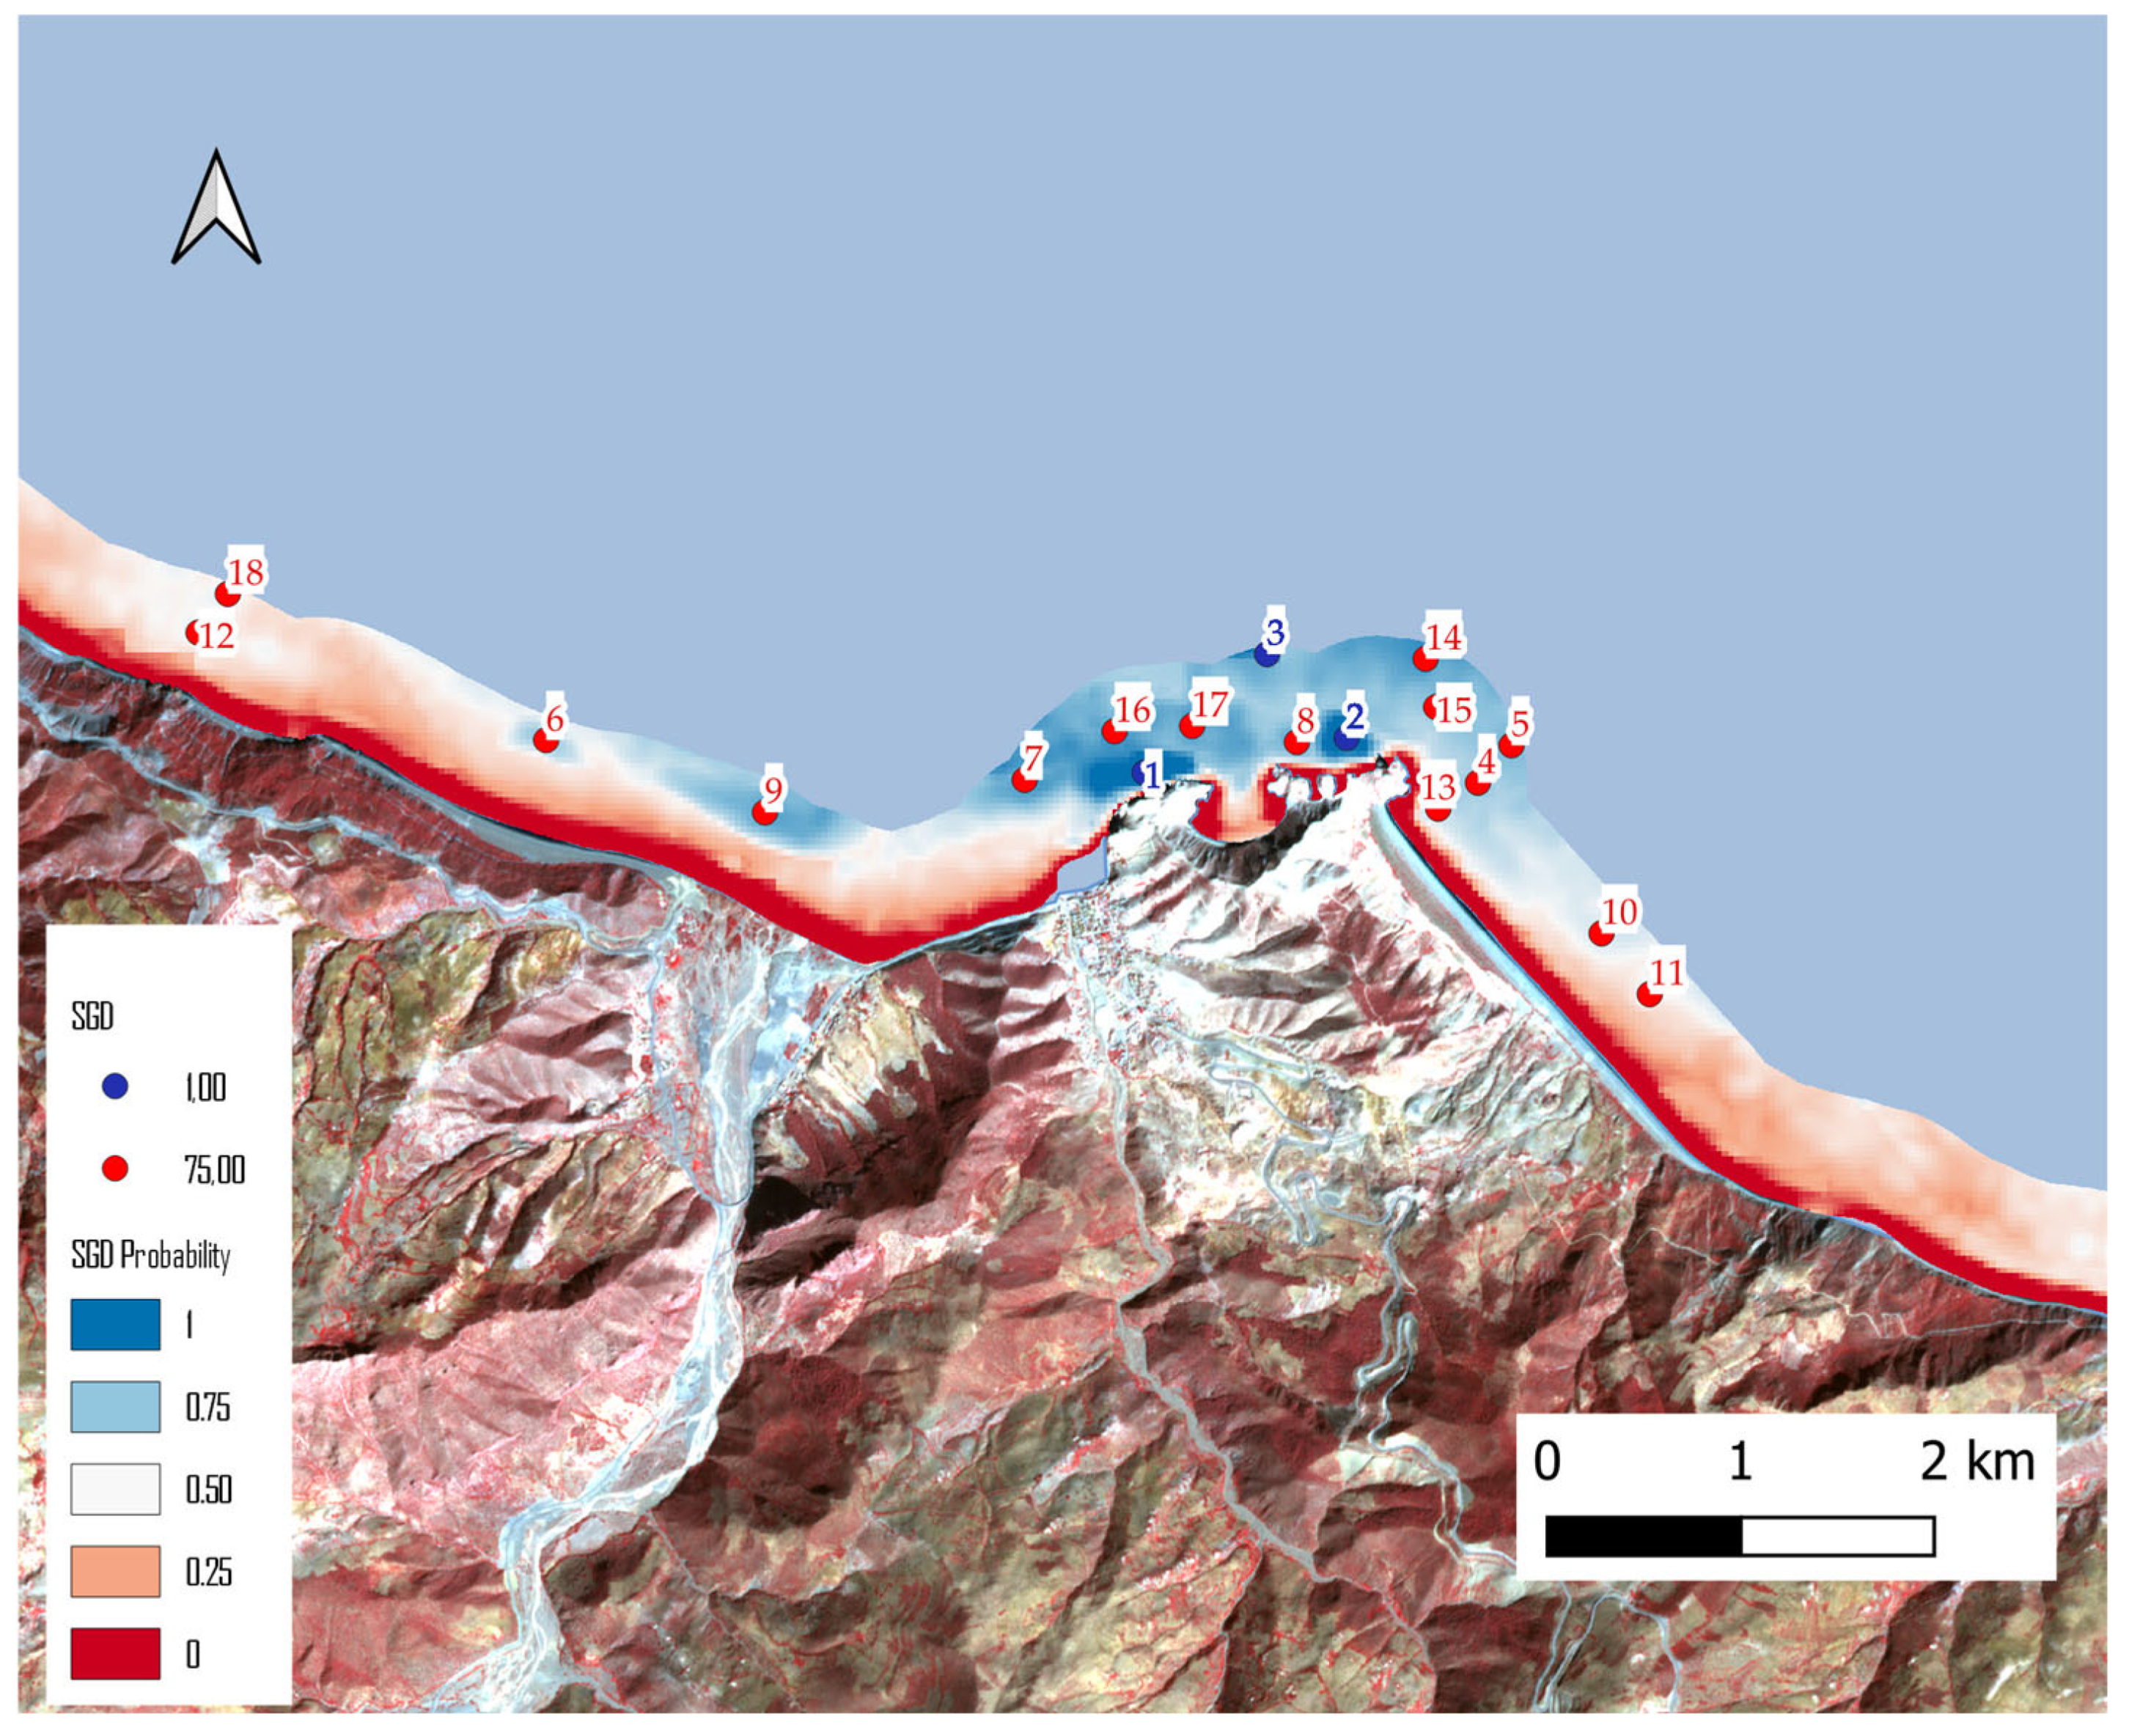
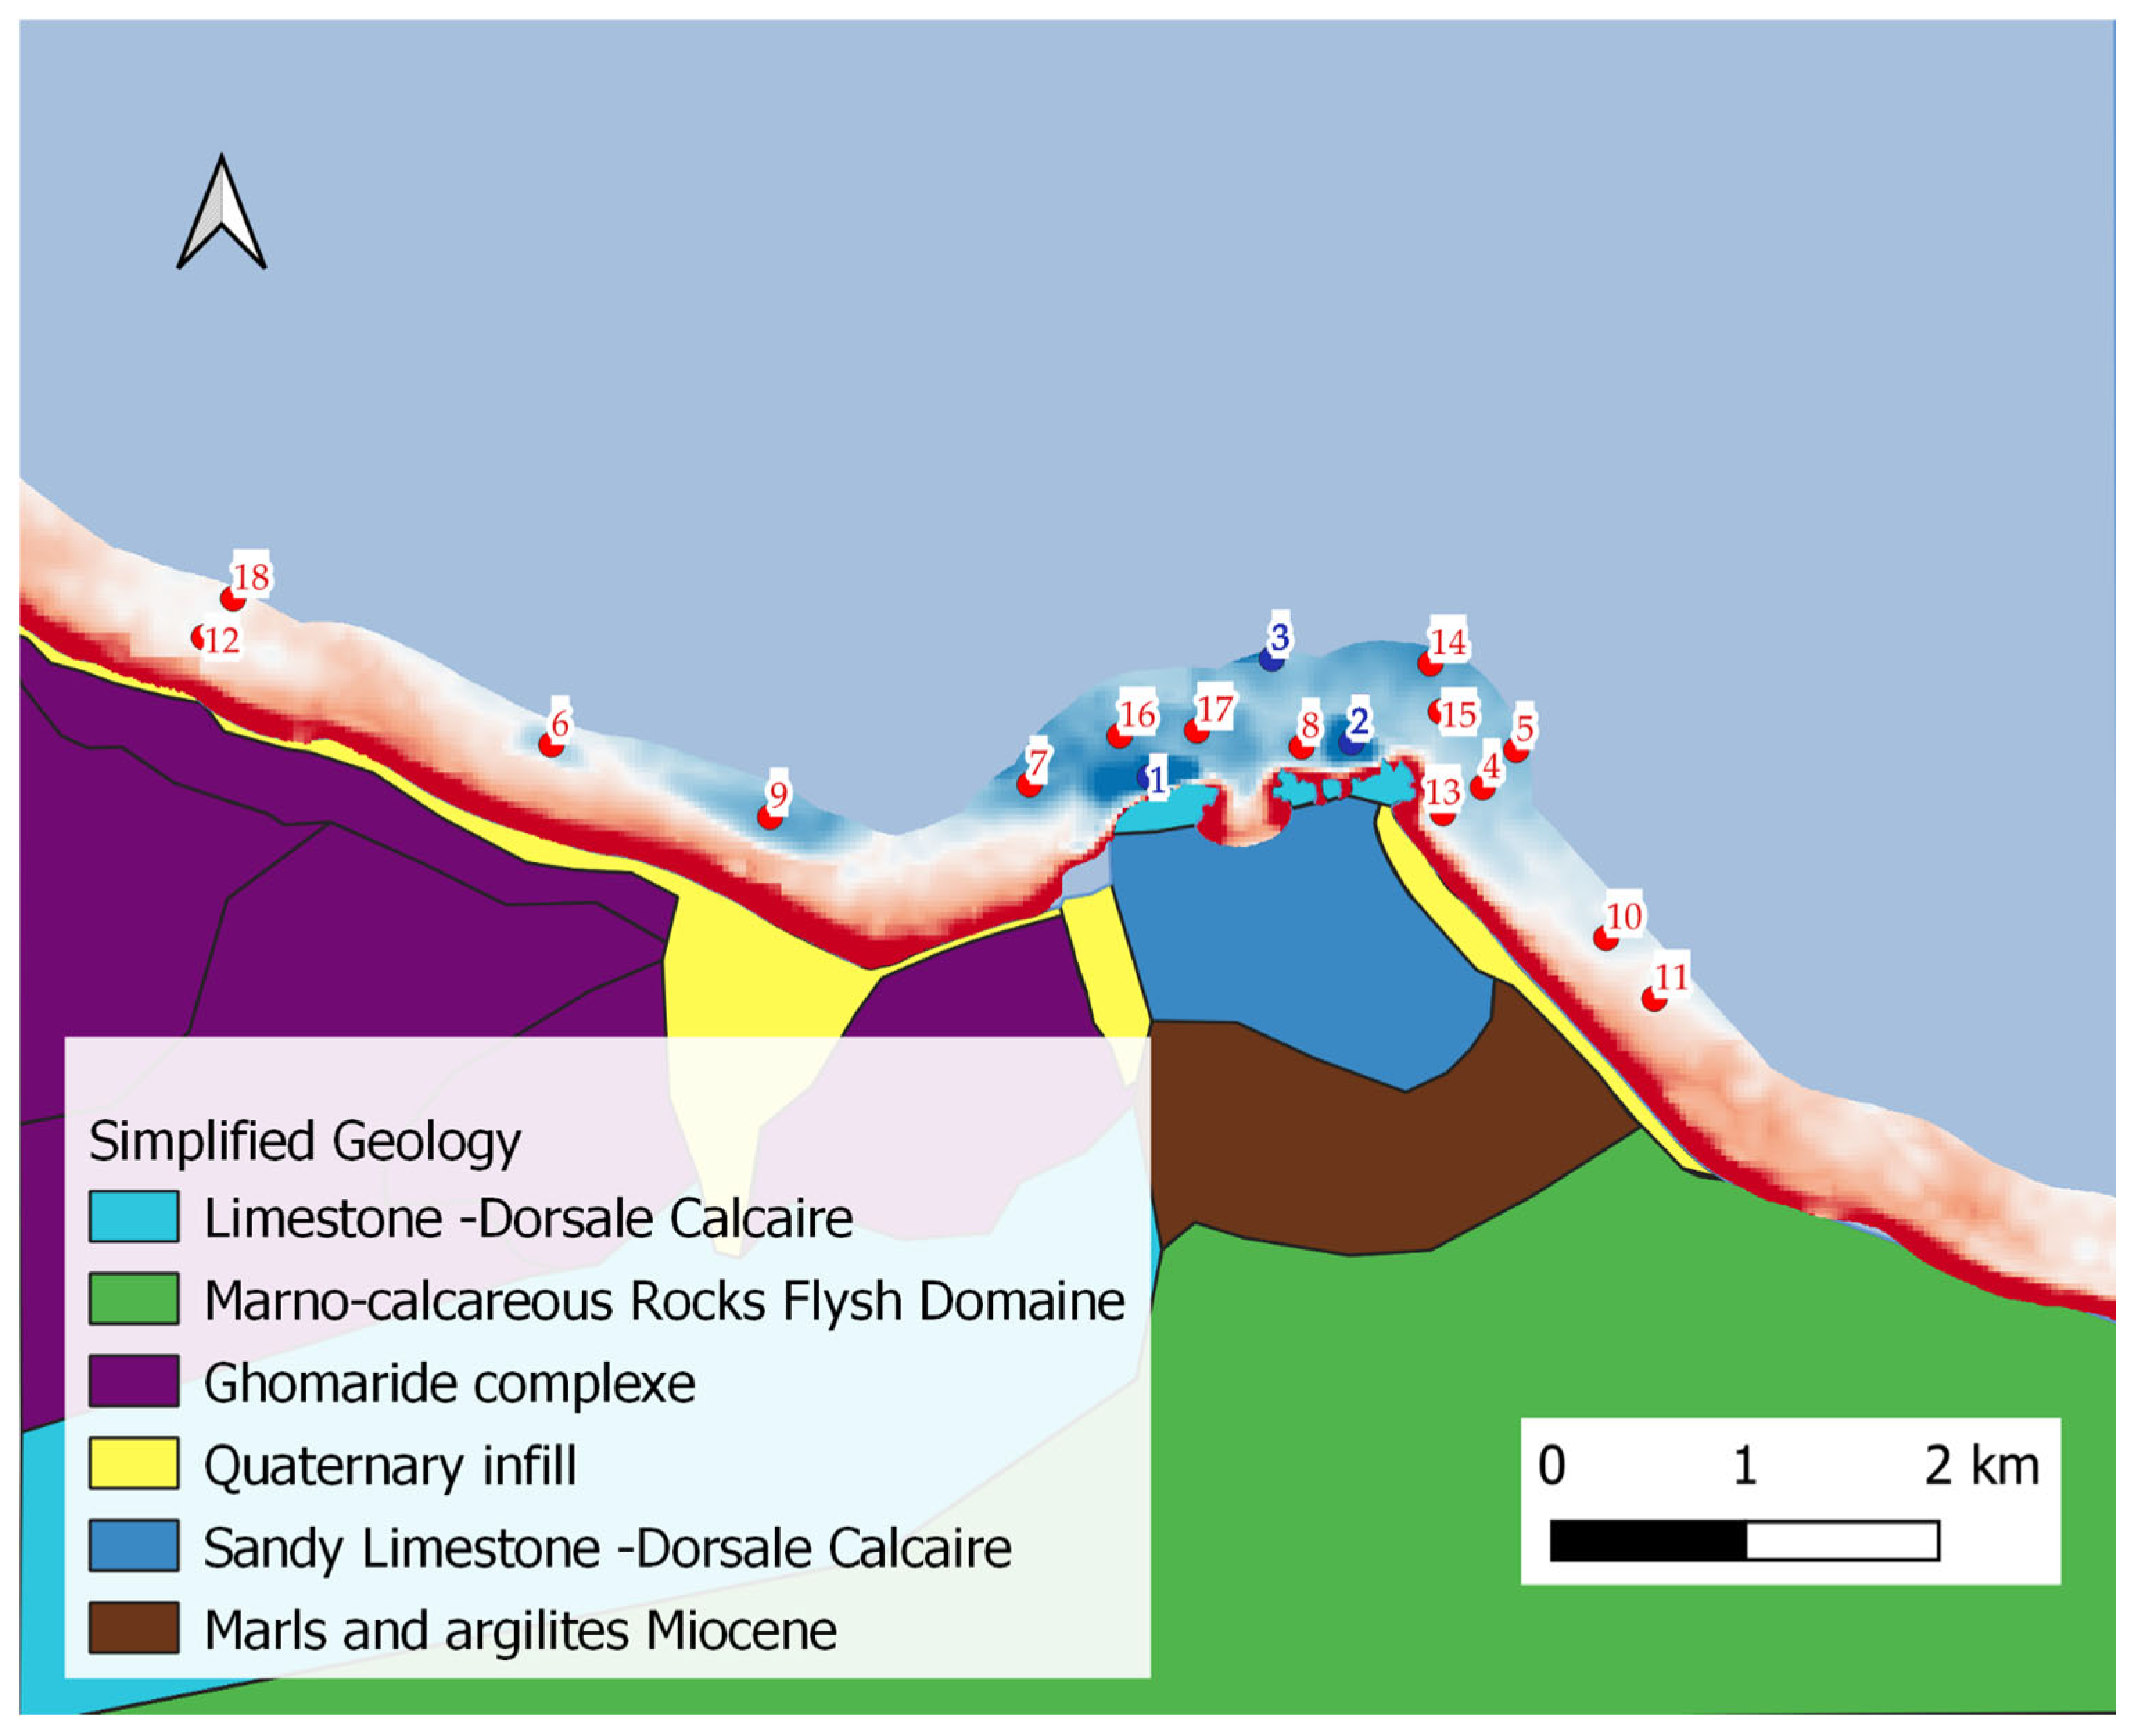
3.2. Potential Locations from Multiple Images (Fuzzy Function)

The spatial distribution of the submarine groundwater discharge (SGD) probability map was generated by (Equation (4)) after the inversion of the fuzzy and overlay function output in order to make it more intuitive.
This Figure 7 displays the probability of SGD occurrence across the study area, scaled from (0) for no likelihood to (1) as highest likelihood. The probability is categorized into five levels, represented in the legend:
  • Dark blue (1.0)—highest probability of SGD;
  • Light blue (0.75)—moderate probability;
  • Beige (0.50)—low probability;
  • Light brown (0.25)—extremely low probability;
  • Red (0.0)—no SGD probability.
Figure 7. Spatial distribution of submarine groundwater discharge (SGD) Probability map.
Hydrology 12 00144 g007
Eighteen thermal anomalies were spotted and labeled; three of them (labeled 1, 2, 3) were in the high probability region, while the others were in the moderate probability cluster.

4. Discussion

Traditional in situ techniques remain indispensable for flux calibration, yet each carries logistical or spatial limitations:
Seepage meters are essential tools for measuring groundwater flux in marine environments and assessing subsurface groundwater discharge (SGD). Deployed on the seafloor, these devices quantify seepage rates by detecting changes in water level within a sealed chamber, which reflect the entry or exit of groundwater. The automatic seepage meter (ASM) uses advanced sensors to provide high-resolution flux measurements under a variety of environmental conditions [37]. Measurement techniques such as SGD-MRT incorporate tracer injections to improve accuracy, allowing a wide range of flow rates to be measured [38]. Infiltration rates can vary considerably depending on environmental factors, with tropical coastal regions experiencing rates of up to 754 cm/day [39]. However, the effectiveness of seepage measurement devices can be affected by factors such as sediment permeability, bag filling, and deployment duration, which can lead to inaccuracies [40]. Furthermore, the type of collection bag used influences the accuracy of the flow measurement, highlighting the need for careful selection and calibration [41]. Despite their usefulness in providing valuable information on groundwater dynamics, seepage meters face environmental and design challenges that require continued optimization to achieve more accurate results in various contexts.
Electrical resistivity methods play a crucial role in detecting submarine groundwater discharge (SGD) by exploiting the resistivity contrasts between freshwater and seawater in subsurface environments. These techniques allow researchers to efficiently map SGD fluxes, providing valuable insights into groundwater dynamics and salinity intrusion. Indeed, the resistivity of seawater is much lower than that of freshwater, making it easy to identify saline intrusion. For example, resistivity values below 5 ohm/m indicate a seawater content greater than 50% in aquifers [42]. Wenner and dipole–dipole configurations are commonly used to collect resistivity data, which can then be integrated into 3D models to improve the spatial resolution of SGD areas [42]. These methods have shown their effectiveness in identifying seawater intrusion in various types of aquifers, whether alluvial or karstic, thus proving their versatility [43,44]. In addition, numerical modeling, coupled with resistivity studies, makes it possible to estimate SGD flows and analyze their spatial variations, which enriches the understanding of coastal groundwater dynamics [45]. However, although these methods are effective for mapping SGD, they may encounter limitations in some coastal environments, thus requiring the use of complementary techniques for comprehensive assessments.
Piezometric measurements play a crucial role in understanding groundwater dynamics [46], especially in coastal areas where freshwater and seawater interact [47]. By monitoring water pressure at different depths, it is possible to infer groundwater flow patterns, particularly in regions where hydraulic gradients are significant [48]. These analyses are essential for the management of coastal water resources and for mitigating problems such as seawater intrusion and salinization of aquifers. Piezometric data, for example, allow the quantification of submarine groundwater flows, which is essential for the preservation of coastal ecosystems [49]. They also offer a means of monitoring saltwater intrusion, providing information on the interface between fresh and salt water, a crucial aspect for assessing the dynamics of freshwater/saltwater exchanges [50]. Regarding methodological approaches, studies have used temperature profiles in piezometers to quantify vertical discharges, thus revealing upward flows in coastal aquifers [51]. In addition, innovative downhole geophysical methods enable high-resolution data on the freshwater–saltwater interface in response to environmental changes such as precipitation [52]. However, while these measurements provide valuable information, they face challenges related to measurement uncertainties, including density variability and tidal effects, which complicate the quantification of flows and require careful data collection and in-depth error analysis [53].
Chemical tracers, such as radon and chlorofluorocarbons (CFCs), are essential for monitoring and quantifying submarine groundwater discharges (SGD) in coastal environments [5]. These substances provide insight into the movement and interaction of groundwater with marine systems, providing critical information on the transport of nutrients and contaminants. Radon (222Rn) [54], a short-lived radioactive gas, is particularly useful for tracing groundwater discharges due to its rapid decay and high solubility in water [54]. On the other hand, chlorofluorocarbons (CFCs), non-reactive gases, serve as ideal transient tracers for modern flow systems, allowing the assessment of flow paths and residence times of groundwater [54]. These tracers play a key role in the study of nutrient and contaminant transport, which is crucial for understanding their impact on marine ecosystems [55]. Furthermore, methods such as radon mass balances are used to model SGD fluxes and provide reliable estimates essential for coastal resource management [20]. However, while these tracers are valuable, their use has limitations, such as their degradation over time and the need for careful sampling and analysis to obtain accurate results. These challenges highlight the importance of continued research to improve tracing methodologies and refine SGD assessments.
Given the logistical constraints and the huge cost that limit classical techniques, we focused instead on high-resolution thermal-infrared remote sensing.
First, out of a comprehensive analysis of a total of 107 distinct images evaluated, a total of 16 images were selected, which consequently resulted in a significant rejection rate of 85%, indicating that a substantial majority of the analyzed images did not meet the necessary criteria.
During the scene-selection stage, our first aim was to retain only those Landsat frames that passed every predefined quality-assessment band. In parallel, we required that each accepted image display a thermal anomaly whose geometry and plume outline matched published submarine-groundwater-discharge signatures. Frames distorted by seasonal marine currents, wind-driven upwelling, sensor striping, or any other radiometric artifact were rejected immediately. This multi-criterion filter isolated a robust dataset and protected the integrity of the subsequent statistical analysis.
To more effectively differentiate and characterize the negative thermal anomalies present in our dataset, we employed the analysis of standardized temperature anomalies (STA) categorized by specific dates of observation. Through the implementation of this analytical approach, we were able to identify a potential range of submarine groundwater discharges (SGD), which varied significantly from a minimum of 11 to a maximum of 61, contingent upon the particular date when the observations were made. The outcomes of our comprehensive analysis reveal a notable increase in the frequency of thermal anomalies occurring during the autumn months, as compared to the relatively lower incidence observed throughout the summer period. This particular finding leads us to conclude that not all of the thermal anomalies detected in our study can be solely ascribed to submarine groundwater discharge (SGD), as a portion of these anomalies may also be influenced by the complex dynamics of ocean circulation patterns.
Indeed, it is a well-documented phenomenon that during the transitional seasons of autumn and the subsequent winter months, the progressive decrease in ambient temperatures results in a corresponding rise in the density of water, which in turn significantly facilitates and promotes the formation of deeper water masses within aquatic environments [55]. This dynamic intensifies thermohaline circulation and generates significant vertical mixing. In contrast, the summer period is characterized by higher surface temperatures, inducing stable stratification and reducing turbulence [56]. Although these references concern regions far from the study site, they apply to the Mediterranean Sea.
To refine the identification of potential SGD, an approach based on the fuzzy and overlay function [34] was applied. This employed methodology facilitated the detection of only those negative thermal anomalies that exhibited persistence throughout the entirety of the study duration, thereby ensuring that our findings were robust and reliable. The implementation of this systematic approach ultimately resulted in the identification of 18 potential submarine groundwater discharges (SGD), which were categorized into two distinct groups based on SGD probability:
  • 3 SGD in the highest probability category
  • 15 SGD in the lower probability category
The classification of points 1 and 2 as having the highest probability of groundwater flow is strongly supported by the geological characteristics of the El Jebha promontory, which is made up of limestone karstic formations [57]. These formations are known for their rapid flow of water due to the presence of a vast network of underground conduits [58]. The karstic nature of the limestone enables groundwater to be moved and drained efficiently [59]. The rapid dissolution of carbonate rocks, such as limestone, creates a complex system of fractures [28], conduits, and caves that facilitate variable groundwater flow paths, ranging from slow laminar flow to high-velocity turbulent flow.
The thermal anomalies observed at points 10 and 11, as shown in Figure 8, located opposite a Quaternary infill zone preceded by marl and argillite, are probably linked to the hydrogeological extension of the area’s drainage network. This deduction is supported by the geological and hydrogeological characteristics of the Quaternary deposits, which often facilitate interactions between surface water flows and underground flows. The presence of a recognizable hydrographic network in the marl argillite impermeable area also suggests that these thermal anomalies could be influenced by the dynamics of interactions between groundwater and surface water.
Point 9 exhibits a significant thermal anomaly that is both pronounced and extensive in nature. Despite being categorized within the medium probability range regarding the fuzzy result, the anomaly location, which is situated directly across from a Quaternary sedimentary fill that is known to host the Jebha alluvial aquifer [19], strongly implies a heightened likelihood of the existence of an active submarine groundwater discharge (SGD) in that area.
Points 18, 16, and 6 share a similar hydrogeological context to points 10 and 11, reinforcing the hypothesis that local geological structures contribute to SGD circulation.
Finally, for the other points identified, the El Jebha promontory area and its surroundings remain a region of major interest for the investigation of potential SGD.
These results yield an initial framework that delineates specific geographical regions characterized by a significant potential for submarine groundwater discharge (SGD), thereby simultaneously creating new avenues for more comprehensive and developed investigations into this phenomenon. They justify the necessity for the execution of seasonal oceanographic campaigns, which are crucial for gathering data, as well as the establishment of continuous measurement modules that would enable the corroboration of both the qualitative and quantitative aspects of the identified phenomena. Consequently, this study lays a fundamental groundwork that is indispensable for the optimization of prospecting endeavors, allowing for a reduction in the financial expenditures associated with the exploration of extensive areas while also facilitating the prioritization of sectors that warrant further scholarly inquiry in the future.

5. Conclusions

Potential SGD fingerprinting with Landsat-8/9 thermal-infrared imagery offers a robust reconnaissance tool for identifying submarine groundwater discharge (SGD) along structurally complex carbonate coasts. Sixteen cloud-free scenes acquired between 2014 and 2023 revealed eighteen persistent negative sea-surface-temperature anomalies (STAs); three high-confidence plumes cluster on the Jebha promontory, the only sector of the regional karst that meets the Mediterranean shoreline within the study area. The recurrence of these three plumes in both summer and autumn imagery points to a groundwater rather than a purely hydrographic origin.
The STA workflow proved algorithmically efficient: an initial set that exceeded sixty candidate anomalies in some scenes was pared to eighteen high-confidence detections by applying a fuzzy-logic AND overlay, effectively suppressing transient oceanographic noise without sacrificing true positives. The resulting probability map can support water-management agencies, universities, and research institutes in positioning seepage meters, radon samplers, and electrical-resistivity transects, enabling field teams to prioritize sites where discharge is most likely.
Future field campaigns will combine radon and δ1⁸O tracers with on-shore piezometry to quantify fluxes and to validate the satellite-derived probabilities. Because the entire workflow relies on open-source code and freely available data, it can be transferred readily to other data-poor karst coastlines, providing a rapid means of exposing hydraulically significant SGD hotspots.

Author Contributions

Conceptualization, Y.B. and M.A.; methodology, Y.B.; software, Y.B. and P.-L.F.; validation, Y.B., M.A. and A.-S.B.; formal analysis, Y.B.; investigation, Y.B.; resources, A.-S.B.; data curation, Y.B.; writing—original draft preparation, Y.B.; writing—review and editing, M.A.; visualization, Y.B.; supervision, M.A., A.-S.B. and P.-L.F.; project administration, A.-S.B.; funding acquisition, M.A. and A.-S.B. All authors have read and agreed to the published version of the manuscript.

Funding

This research was supported by the OGIEnv project (PPR2/2016/79) under the auspices of Morocco’s Ministry of Higher Education, Scientific Research and Innovation (MESRSI) and the National Centre for Scientific and Technical Research (CNRST).

Data Availability Statement

Data is available upon request.

Acknowledgments

The authors would like to thank planet team for providing access to planet imagery Planet Team (2022). Planet Application Program Interface: In Space for Life on Earth. San Francisco, CA. https://www.planet.com/industries/education-and-research/ under Education and Research Program.

Conflicts of Interest

The authors declare no conflicts of interest.

Abbreviations

The following abbreviations are used in this manuscript:
SGDSubmarine groundwater discharge
ASMAutomatic seepage meter
CFCChlorofluorocarbons
SMOSSoil Moisture and Ocean Salinity
SmapSoil moisture active passive
RFIRadio frequency interference
LSCLand-sea contamination
LGBMLight gradient boosting model
RMSERoot-mean-square error
MODISModerate-resolution imaging spectroradiometer
SEVIRISpinning enhanced visible infrared imager

References

  1. Moore, W.S. The effect of submarine groundwater discharge on the ocean. Ann. Rev. Mar. Sci. 2010, 2, 59–88. [Google Scholar] [CrossRef] [PubMed]
  2. Moore, W.S.; Joye, S.B. Saltwater Intrusion and Submarine Groundwater Discharge: Acceleration of Biogeochemical Reactions in Changing Coastal Aquifers. Front. Earth Sci. 2021, 9, 600710. [Google Scholar] [CrossRef]
  3. Kim, K.H.; Heiss, J.W. Methods in Capturing the Spatiotemporal Dynamics of Flow and Biogeochemical Reactivity in Sandy Beach Aquifers: A Review. Water 2021, 13, 782. [Google Scholar] [CrossRef]
  4. Goyetche, T.; Luquot, L.; Carrera, J.; Martínez-Pérez, L.; Folch, A. Identification and quantification of chemical reactions in a coastal aquifer to assess submarine groundwater discharge composition. Sci. Total Environ. 2022, 838, 155978. [Google Scholar] [CrossRef]
  5. Burnett, W.C.; Dulaiova, H. Estimating the dynamics of groundwater input into the coastal zone via continuous radon-222 measurements. J. Environ. Radioact. 2003, 69, 21–35. [Google Scholar] [CrossRef]
  6. Taniguchi, M.; Dulai, H.; Burnett, K.M.; Santos, I.R.; Sugimoto, R.; Stieglitz, T.; Kim, G.; Moosdorf, N.; Burnett, W.C. Submarine Groundwater Discharge: Updates on Its Measurement Techniques, Geophysical Drivers, Magnitudes, and Effects. Front. Environ. Sci. 2019, 7, 141. [Google Scholar] [CrossRef]
  7. Alorda-Kleinglass, A.; Garcia-Orellana, J.; Rodellas, V.; Cerdà-Domènech, M.; Tovar-Sánchez, A.; Diego-Feliu, M.; Trezzi, G.; Sánchez-Quilez, D.; Sanchez-Vidal, A.; Canals, M. Remobilization of dissolved metals from a coastal mine tailing deposit driven by groundwater discharge and porewater exchange. Sci. Total Environ. 2019, 688, 1359–1372. [Google Scholar] [CrossRef]
  8. Burnett, W.C.; Aggarwal, P.K.; Aureli, A.; Bokuniewicz, H.; Cable, J.E.; Charette, M.A.; Kontar, E.; Krupa, S.; Kulkarni, K.M.; Loveless, A.; et al. Quantifying submarine groundwater discharge in the coastal zone via multiple methods. Sci. Total Environ. 2006, 367, 498–543. [Google Scholar] [CrossRef]
  9. Bernichi, Y.; Amharref, M.; Bernoussi, A.S.; Frison, P.-L. Contribution Of Supervised And Unsupervised Classification In Inundation Mapping: A Case Study. E3S Web Conf. 2024, 502, 04007. [Google Scholar] [CrossRef]
  10. Mayer, A.L.; Lopez, R.D. Use of remote sensing to support forest and wetlands policies in the USA. Remote Sens. 2011, 3, 1211–1233. [Google Scholar] [CrossRef]
  11. Gil, L.K.T.; Martínez, D.V.; Saba, M. The Widespread Use of Remote Sensing in Asbestos, Vegetation, Oil and Gas, and Geology Applications. Atmosphere 2023, 14, 172. [Google Scholar] [CrossRef]
  12. Shumilo, L.; Shelestov, A.; Yailymov, B.; Brazhnyi, A.; Bilokonska, Y. Remote Sensing Data Usage for Smart City Greening Strategy Planning. In Proceedings of the IEEE EUROCON, Lviv, Ukraine, 6–8 July 2021; pp. 92–97. [Google Scholar]
  13. Song, H.; Zhang, Y.; Zhang, B.; Lv, Y.; Zhang, L. Coastal Regions Sea Surface Salinity Retrieval of SMAP MISSION Based on Light Gradient Boosting Model. In Proceedings of the 2024 Progress in Electromagnetics Research Symposium (PIERS), Chengdu, China, 21–25 April 2024; pp. 1–3. [Google Scholar]
  14. Tamborski, J.J.; Rogers, A.D.; Bokuniewicz, H.J.; Cochran, J.K.; Young, C.R. Identification and quantification of diffuse fresh submarine groundwater discharge via airborne thermal infrared remote sensing. Remote Sens. Environ. 2015, 171, 202–217. [Google Scholar] [CrossRef]
  15. Akawwi, E.; Al-Zouabi, A.; Kakish, M.; Koehn, F.; Sauter, M. Using Thermal Infrared Imagery (TIR) for Illustrating the Submarine Groundwater Discharge into the Eastern Shoreline of the Dead Sea-Jordan. Am. J. Environ. Sci. 2008, 4, 693–700. [Google Scholar] [CrossRef]
  16. Benmakhlouf, M.; Galindo-Zaldívar, J.; Chalouan, A.; Sanz de Galdeano, C.; Ahmamou, M.; López-Garrido, A.C. Cinemática y paleoesfuerzos en la zona de falla transcurrente de Jebha-Chrafate (Rif septentrional, Marruecos). Kinemat. Paleostresses Jebha-Chrafate Transcurrent Fault 2005, 38, 71–74. [Google Scholar]
  17. Amraoui, A. Hydrogéologie de la Dorsale Calcaire du Rif (Maroc Septentrional). Ph.D. Thesis, Université Joseph-Fourier—Grenoble I, Saint Martin of Heres, France, 31 October 1988. [Google Scholar]
  18. Suter, G. Carte Géologique de la Chaîne Rifaine [Map]; Échelle 1:500 000; Notes et Mémoires du Service Géologique du Maroc, No. 245a; Ministère de l’Énergie et des Mines, Direction de la Géologie: Rabat, Morocco, 1980.
  19. Agence du Bassin Hydraulique du Loukkos. Projet du Plan Directeur d’Aménagement Intégré des Ressources en Eau des Bassins Hydrauliques du Loukkos, Tangérois et Côtiers Méditerranéens; Agence du Bassin Hydraulique du Loukkos: Tanger, Morocco, 2022; pp. 1–147.
  20. Savatier, M.; Morrissey, P.; Gill, L.; Rocha, C. Intercomparison of marine tracer and catchment-based submarine groundwater discharge estimates for a karst aquifer. J. Hydrol. 2023, 627, 130358. [Google Scholar] [CrossRef]
  21. Jou-Claus, S.; Folch, A.; Garcia-Orellana, J. Applicability of Landsat 8 thermal infrared sensor for identifying submarine groundwater discharge springs in the Mediterranean Sea basin. Hydrol. Earth Syst. Sci. 2021, 25, 4789–4805. [Google Scholar] [CrossRef]
  22. What are the Band Designations for the Landsat Satellites?|U.S. Geological Survey. Available online: https://www.usgs.gov/faqs/what-are-band-designations-landsat-satellites (accessed on 13 April 2025).
  23. What are the Acquisition Schedules for the Landsat Satellites?|U.S. Geological Survey. Available online: https://www.usgs.gov/faqs/what-are-acquisition-schedules-landsat-satellites (accessed on 13 April 2025).
  24. Ahmed, M.R.; Ghaderpour, E.; Gupta, A.; Dewan, A.; Hassan, Q.K. Opportunities and Challenges of Spaceborne Sensors in Delineating Land Surface Temperature Trends: A Review. IEEE Sens. J. 2023, 23, 6460–6472. [Google Scholar] [CrossRef]
  25. Vinogradova, N.T.; Lee, T.; Boutin, J.; Drushka, K.; Fournier, S.; Sabia, R.; Stammer, D.; Bayler, E.; Reul, N.; Gordon, A.L.; et al. Satellite Salinity Observing System: Recent Discoveries and the Way Forward. Front. Mar. Sci. 2019, 6, 243. [Google Scholar] [CrossRef]
  26. Dossa, A.N.; Alory, G.; da Silva, A.C.; Dahunsi, A.M.; Bertrand, A. Global Analysis of Coastal Gradients of Sea Surface Salinity. Remote Sens. 2021, 13, 2507. [Google Scholar] [CrossRef]
  27. Lagerloef, G.; Font, J. SMOS and Aquarius/SAC-D Missions: The Era of Spaceborne Salinity Measurements is About to Begin. In Oceanography from Space: Revisited; Springer: Dordrecht, The Netherlands, 2010; pp. 35–58. [Google Scholar]
  28. Rodriguez-Fernandez, N.; Anterrieu, E.; Cabot, F.; Boutin, J.; Picard, G.; Pellarin, T.; Merlin, O.; Vialard, J.; Vivier, F.; Costeraste, J.; et al. A New L-Band Passive Radiometer For Earth Observation: SMOS-High Resolution (SMOS-HR). In Proceedings of the International Geoscience and Remote Sensing Symposium (IGARSS), Waikoloa, HI, USA, 26 September–2 October 2020; pp. 5978–5981. [Google Scholar]
  29. Sayler, K. Landsat 8–9 Collection 2 Level 2 Science Product Guide; U.S. Geological Survey: Reston, VA, USA, 2024.
  30. EarthExplorer. Available online: https://earthexplorer.usgs.gov/ (accessed on 25 March 2025).
  31. Landsat Collection 2 Quality Assessment Bands|U.S. Geological Survey. Available online: https://www.usgs.gov/landsat-missions/landsat-collection-2-quality-assessment-bands (accessed on 26 March 2025).
  32. Samani, A.N.; Farzin, M.; Rahmati, O.; Feiznia, S.; Kazemi, G.A.; Foody, G.; Melesse, A.M. Scrutinizing Relationships Between Submarine Groundwater Discharge and Upstream Areas Using Thermal Remote Sensing: A Case Study in the Northern Persian Gulf. Remote Sens. 2021, 13, 358. [Google Scholar] [CrossRef]
  33. Londoño-Londoño, J.E.; Condesso de Melo, M.T.; Nascimento, J.N.; Silva, A.C.F. Thermal−Based Remote Sensing Solution for Identifying Coastal Zones with Potential Groundwater Discharge. J. Mar. Sci. Eng. 2022, 10, 414. [Google Scholar] [CrossRef]
  34. Migiros, G. Groundwater Coastal Discharge of the Karstic System of the Mani Peninsula, Southern Peloponnesus-Greece. In Proceedings of the 8th International Hydrogeological Congress of Greece, Thessaloniki, Greece, 8–10 October 2008. [Google Scholar]
  35. Çakıt, E.; Karwowski, W. A fuzzy overlay model for mapping adverse event risk in an active war theatre. J. Exp. Theor. Artif. Intell. 2018, 30, 691–701. [Google Scholar] [CrossRef]
  36. Planet Team Planet Application Program Interface: In Space for Life on Earth. 2022. Available online: https://support.planet.com/hc/en-us/articles/115006038627-Citing-Planet-Data (accessed on 25 March 2025).
  37. Zlotnik, V.A.; Solomon, D.K.; Genereux, D.P.; Gilmore, T.E.; Humphrey, C.E.; Mittelstet, A.R.; Zlotnik, A.V. Theory of an Automatic Seepage Meter and Ramifications for Applications. Water Resour. Res. 2023, 59, e2023WR034766. [Google Scholar] [CrossRef]
  38. Schlüter, M.; Maier, P. Submarine Groundwater Discharge from Sediments and Sand Boils Quantified by the Mean Residence Time of a Tracer Injection. Front. Earth Sci. 2021, 9, 710000. [Google Scholar] [CrossRef]
  39. Lino, Y.; Udayashankar, H.N.; Suresh Babu, D.S.; Ramasamy, M.; Balakrishna, K. Large submarine groundwater discharges to the Arabian Sea from tropical southwestern Indian Coast: Measurements from seepage meters deployed during the low tide. J. Hydrol. 2023, 620, 129394. [Google Scholar] [CrossRef]
  40. Rosenberry, D.O.; Duque, C.; Lee, D.R. History and evolution of seepage meters for quantifying flow between groundwater and surface water: Part 1—Freshwater settings. Earth-Sci. Rev. 2020, 204, 103167. [Google Scholar] [CrossRef]
  41. Lee, C.; Kim, W.; Jeen, S.-W. Measurement of Flux at Sediment–Water Interface Using a Seepage Meter Under Controlled Flow Conditions. Water 2020, 12, 3071. [Google Scholar] [CrossRef]
  42. Islami, N.; Irianti, M. A Quantitative interpretation of salt water mixture in the shallow aquifer through the geoelectrical resistivity data. J. Phys. Conf. Ser. 2023, 2582, 012001. [Google Scholar] [CrossRef]
  43. Tur-Piedra, J.; Ledo, J.; Queralt, P.; Marcuello, A.; Diego-Feliu, M.; Alorda-Kleinglass, A.; Rodellas, V.; Folch, A. Combining terrestrial and marine electrical resistivity methods to improve data acquisition in the land-sea transition zone. In Proceedings of the 25th EGU General Assembly, Vienna, Austria, 23–28 April 2023. [Google Scholar] [CrossRef]
  44. Syamsuddin, S.; Fajar, M.; Wirawan, A.H.; Salsabila, N.; Rezky, R.; Massinai, M.F.I.; Selfiana, S.; Harimei, B. Determination of Seawater Intrusion Zones Using the Resistivity Method in Kelurahan Soreang, Maros District, South Sulawesi Province: Penentuan Zona Intrusi Air Laut Menggunakan Metode Tahanan Jenis di Kelurahan Soreang, Kabupaten Maros. Geocelebes 2023, 7, 99–107. [Google Scholar] [CrossRef]
  45. Unnikrishnan, P.K.N.; Balan, S.; Srinivas, R.; Suresh Babu, D.S. Evaluation of submarine groundwater discharge and associated beach groundwater dynamics. ISH J. Hydraul. Eng. 2023, 29, 121–131. [Google Scholar] [CrossRef]
  46. Porru, M.C.; Arras, C.; Biddau, R.; Cidu, R.; Lobina, F.; Podda, F.; Wanty, R.; Da Pelo, S. Assessing Recharge Sources and Seawater Intrusion in Coastal Groundwater: A Hydrogeological and Multi-Isotopic Approach. Water 2024, 16, 1106. [Google Scholar] [CrossRef]
  47. Geranmehr, M.; Bau, D.; Mayer, A.; Mancewicz, L.; Yu, W. Seawater Intrusion Mechanisms in Heterogeneous Coastal Aquifers Subject to Pumping. In Proceedings of the European Geosciences Union General Assembly (EGU24) 2024, Vienna, Austria, 14–19 April 2024. [Google Scholar] [CrossRef]
  48. Morton, K. The use of groundwater monitoring and underground pressure release tests to benefit block caving. In Proceedings of the Caving 2022: Fifth International Conference on Block and Sublevel Caving, Perth, Australia, 30 August–1 September 2022; pp. 611–622. [Google Scholar]
  49. Romano, G.; Capozzoli, L.; Lapenna, V.; Polemio, M. A new multiscale and multisensory strategy for the characterization of groundwater discharge in coastal areas The SUBGEO project. In Proceedings of the EGU General Assembly 2024, Vienna, Austria, 14–19 April 2024. [Google Scholar] [CrossRef]
  50. Da Pelo, S.; Porru, M.C.; Piscedda, F.A.; Testa, M.; Lorrai, M.; Botti, P.; Lobina, F.; Arras, C.; Buttau, C.; Loi, A.; et al. Monitoring of physical-chemical parameter depth profile to assess sea water intrusion phenomena in a coastal multi-layer aquifer. In Proceedings of the 24th EGU General Assembly, Vienna, Austria, 23–27 May 2022. [Google Scholar] [CrossRef]
  51. Pezard, P.; Henry, G.; Brun, L.; Gee, R.; Folch, A.; Goyetche, T.; Martinez, L.; Carrera, J.; Luquot, L. Innovative downhole geophysical methods, petrophysical characterization and high frequency downhole monitoring of seawater intrusion dynamics in a coastal aquifer. The Me Distraes project, Argentona, Spain. In Proceedings of the IAHS-AISH Scientific Assembly 2022, Montpellier, France, 29 May–3 June 2022. [Google Scholar] [CrossRef]
  52. Jiménez-Valera, J.A.; Alhama, I.; Trigueros, E. Quantification of Groundwater Vertical Flow from Temperature Profiles: Application to Agua Amarga Coastal Aquifer (SE Spain) Submitted to Artificial Recharge. Water 2023, 15, 1093. [Google Scholar] [CrossRef]
  53. Post, V.E.A.; Banks, E.; Brunke, M. Groundwater flow in the transition zone between freshwater and saltwater: A field-based study and analysis of measurement errors. Hydrogeol. J. 2018, 26, 1821–1838. [Google Scholar] [CrossRef]
  54. Schubert, M.; Lin, M.; Clark, J.F.; Kralik, M.; Damatto, S.; Copia, L.; Terzer-Wassmuth, S.; Harjung, A. Short-lived natural radionuclides as tracers in hydrogeological studies—A review. Sci. Total Environ. 2024, 920, 170800. [Google Scholar] [CrossRef]
  55. Moore, W.S.; Benitez-Nelson, C.; Schutte, C.; Moody, A.; Shiller, A.; Sibert, R.J.; Joye, S. SGD-OD: Investigating the potential oxygen demand of submarine groundwater discharge in coastal systems. Sci. Rep. 2024, 14, 9249. [Google Scholar] [CrossRef]
  56. Somot, S.; Houpert, L.; Sevault, F.; Testor, P.; Bosse, A.; Taupier-Letage, I.; Bouin, M.-N.; Waldman, R.; Cassou, C.; Sanchez-Gomez, E.; et al. Characterizing, modelling and understanding the climate variability of the deep water formation in the North-Western Mediterranean Sea. Clim. Dyn. 2018, 51, 1179–1210. [Google Scholar] [CrossRef]
  57. Cusinato, E.; Zanchettin, D.; Sannino, G.; Rubino, A. Mediterranean Thermohaline Response to Large-Scale Winter Atmospheric Forcing in a High-Resolution Ocean Model Simulation. Pure Appl. Geophys. 2018, 175, 4083–4110. [Google Scholar] [CrossRef]
  58. Milanolo, S. Sources and Transport of Inorganic Carbon in the Unsaturated Zone of Karst; Springer: Berlin/Heidelberg, Germany, 2016. [Google Scholar]
  59. Nhu, V.-H.; Rahmati, O.; Falah, F.; Shojaei, S.; Al-Ansari, N.; Shahabi, H.; Shirzadi, A.; Górski, K.; Nguyen, H.; Ahmad, B.B. Mapping of Groundwater Spring Potential in Karst Aquifer System Using Novel Ensemble Bivariate and Multivariate Models. Water 2020, 12, 985. [Google Scholar] [CrossRef]
Figure 1. Locator maps. (a) Global view showing Morocco. (b) National view highlighting the western Mediterranean coastal region of Morocco. Regional study-area map displaying structural domains, main faults and hydrographic network. readapted from geological map [18], springs [17].
Hydrology 12 00144 g001
Figure 2. Ain Souyah karst spring (35°13′9.1″ N, 5°02′5.6″ W) emerging at the lithological contact between the Dorsale Calcaire limestone ridge and the surrounding metamorphic Internal-Rif units. (Photo reproduced from the Loukkos Basin PDAIRE (2022) [19]).
Hydrology 12 00144 g002
Figure 3. Structural and hydrogeologic framework of the El Jebha Coast, highlighting Fault F1 and hypothesized submarine-groundwater-discharge pathway and the location of Ain Souyah Spring.
Hydrology 12 00144 g003
Figure 4. (a) Global view showing Morocco. (b) National view highlighting the western Mediterranean coastal region of Morocco. Hydrological basins near the study area.
Hydrology 12 00144 g004
Figure 5. Flowchart process for SGD detection.
Hydrology 12 00144 g005
Figure 6. (a): Standardized thermal anomaly in 23 September 2023 (autumn), (b) standardized thermal anomaly in 18 June 2020 (summer).
Hydrology 12 00144 g006
Figure 8. Spatial distribution of SGD related to the geological context.
Hydrology 12 00144 g008
Table 1. Potential SGD anomalies by date and season (STA analysis, 2014–2023).
Scene IDDateScene Center Time (UTC)PathRowNumber of AnomaliesSeason
LC08_L2SP_201035_201406022 June 201410:56:23Z2013527Summer
LC08_L2SP_201035_2014102424 October 201410:56:59Z2013528Autumn
LC08_L2SP_201035_201507077 July 201510:56:14Z2013531Summer
LC08_L2SP_201035_2017091414 September 201710:56:52Z2013515Autumn
LC08_L2SP_201036_2018061313 June 201810:56:02Z2013630Summer
LC08_L2SP_201035_201907022 July 201910:56:40Z2013525Summer
LC08_L2SP_201035_2019071818 July 201910:56:43Z2013540Summer
LC08_L2SP_201035_201908033 August 201910:56:50Z2013531Summer
LC08_L2SP_201035_201910066 October 201910:57:08Z2013550Autumn
LC08_L2SP_201035_2020092222 September 202010:57:03Z2013513Autumn
LC08_L2SP_201035_2020061818 June 202010:56:27Z2013511Summer
LC09_L2SP_201035_2022071818 July 202210:56:38Z2013515Summer
LC08_L2SP_201035_2022072626 July 202210:57:08Z2013514Summer
LC08_L2SP_201035_2023061111 June 202310:56:12Z2013537Summer
LC08_L2SP_201035_2023072929 July 202310:56:35Z2013535Summer
LC09_L2SP_201035_2023092323 September 202310:56:49Z2013561Autumn
Disclaimer/Publisher’s Note: The statements, opinions and data contained in all publications are solely those of the individual author(s) and contributor(s) and not of MDPI and/or the editor(s). MDPI and/or the editor(s) disclaim responsibility for any injury to people or property resulting from any ideas, methods, instructions or products referred to in the content.

