Article

Evaluation of Rainfall Distribution Based on the Precipitation Concentration Index: A Case Study over the Selected Summer Rainfall Regions of South Africa

1
South African Weather Service, Private Bag X097, Pretoria 0001, South Africa
2
Department of Geography, Geoinformatics and Meteorology, University of Pretoria, Private Bag X020, Hatfield, Pretoria 0028, South Africa
3
Department of Water and Sanitation, Private Bag X313, Pretoria 0001, South Africa
*
Author to whom correspondence should be addressed.
Hydrology 2025, 12(6), 136; https://doi.org/10.3390/hydrology12060136
Submission received: 7 April 2025 / Revised: 28 May 2025 / Accepted: 29 May 2025 / Published: 3 June 2025

Abstract

The Precipitation Concentration Index (PCI) is considered a powerful tool that can be used to analyse the spatial and temporal distribution and variability of precipitation over a region. It plays a significant role in planning and managing water resources, including monitoring and forecasting drought and flood risks. As such, the present study used the PCI to investigate the spatio-temporal distribution of precipitation in summer rainfall regions covering six selected South African provinces. Specifically, this study analysed monthly precipitation data from 49 rainfall districts spanning from 1979 to 2023 and assessed the spatio-temporal variability patterns of annual, seasonal and supra-seasonal PCI values and their trends based on the Mann–Kendall trend test. Pearson’s correlation was used to evaluate the relationship between the PCI values and precipitation across the provinces. Moderate annual PCI values were observed mainly in KwaZulu-Natal and the eastern regions of the Free State and Mpumalanga provinces. A large portion of the study site exhibited irregular annual precipitation concentrations. The PCI decreased by −1.5 and −1.2 magnitudes of change during 1979–1989 and 2000–2011 and increased by 2.1 and 2.8 magnitudes between 1990–2000 and 2012–2023, respectively. Uniform precipitation concentration was mostly recorded during the December–January–February (DJF) season. The entire study area recorded moderate precipitation concentration during the March–April–May (MAM) and September–October–November (SON) seasons (with exceptions for KwaZulu-Natal (KZN)). In addition, irregular precipitation concentration dominated during the June–July–August (JJA) rainy season. All provinces except KZN recorded positive trends in annual PCI. Also, positive trends in PCI were observed during the supra-wet season across the provinces, except KZN and in parts of the Free State. Furthermore, negative trends in seasonal PCI were mostly dominant during DJF and MAM, while positive trends were mostly observed during SON and JJA rainy seasons. The annual PCI values were positively correlated with annual precipitation in KZN, Free State and Limpopo, while negative correlations were observed in Mpumalanga and North West provinces. The results presented in this study contribute to drought and flood monitoring in support of water resource management and planning.

1. Introduction

Climate change is one of the known factors affecting the changes in the hydrological cycle, influencing the intensity and frequency of precipitation [1]. Extreme or heavy precipitation occurs when the amount of rainfall or snow received in a specific region significantly exceeds defined normal conditions. Intense precipitation such as heavy rainfall, hail and snowstorms arises from storm systems converging due to the increased amount of water evaporated into the air triggered by raised ocean temperatures, coupled with moisture-laden air hovering over land [2]. Flooding, soil erosion, decreased water quality and crop failure, infrastructure damage, economic loss, and human casualties are some of the effects of heavy precipitation [3], among others. Extreme precipitation events have increased over the years in frequency, intensity, and duration across many regions, covering different spatial scales [4]. These events are expected to intensify in the future as climate change and anthropogenic activities continue unabatedly [5,6,7], exacerbating inherent impacts on the most vulnerable climate regions and society in general.
Heavy precipitation events are recognized as key contributors to flooding and landslide events [8]. In South Africa, for instance, the coastal KwaZulu-Natal (KZN) has historically experienced extreme precipitation events that have led to severe flooding in most parts of the province. The most preeminent precipitation (up to 800 mm over 5 days) was recorded in September 1987, resulting in widespread and deadly floods and landslides, which resulted in the displacement of thousands of civilians, damaged infrastructures, washed roads and more than 500 deaths [9]. A similar flood and mudslide occurred most recently in April 2022, causing severe damage in eThekwini Metropolitan Municipality, where approximately 40,000 civilians were displaced, roads and bridges were destroyed and over 400 people lost their lives.
Evidence suggesting an increase in rainfall during the summer rainfall season in many regions of South Africa has been presented in the literature. For instance, studies by Roy and Rouault [10] reported a predominantly and strong positive trend in extreme hourly precipitation over the southeast coastal areas of South Africa. Kruger and Nxumalo [11] reported an increase in the trend for annual daily rainfall extremes along the west and southern interior of South Africa from 1921 to 2015. Similar studies by McBride et al. [12] reported an increase in the probability of extreme daily rainfall for most areas in South Africa for the 1921 to 2020 period. In addition to flooding, changes in precipitation contribute to drought, a condition often attributed to factors such as insufficient/delayed/decreasing rainfall as well as human-induced climate change (e.g., agricultural development, land use change, over-abstraction of surface water from rivers and ponds, as well as population growth) [13,14]. Over the years, South Africa has experienced severe droughts that have impacted key economic sectors, such as water resources, agriculture, energy, health and tourism [15,16,17,18].
South Africa, like many other African countries vulnerable to climate change, is projected to experience changes in precipitation amount, intensity, frequency and patterns, which are likely to exacerbate the occurrence of weather and extreme events such as drought and floods [5]. Higher precipitation concentration has the ability to trigger droughts, runoff and floods [19], posing a serious threat to an already water-stressed country, where the water demand for various purposes exceeds supply. Understanding the level of annual and seasonal precipitation concentration over a region is useful for water resource management and environmental planning and disaster prevention, whereby inherent impacts on soil erosion, droughts and floods can be alleviated [20]. The Precipitation Concentration Index (PCI) is considered a statistical tool to study, evaluate and quantify the spatio-temporal distribution of rainfall patterns over a region [21,22]. Specifically, the PCI focusses on establishing the concentration of rainfall over a given period, e.g., a year/season. This PCI can be regarded as an effective tool for evaluating climate and its inherent impacts on water management, agriculture and soil erosion [23]. The PCI has been extensively applied in various research studies. For instance, studies by Rawat et al. [23] used the PCI to evaluate the rainfall variability and intensity of long-term monthly rainfall data in the western agro-climatic zone of Punjab, India. The authors reported a notable spatial variation in rainfall concentration (with strong irregularity), attributed to regional monsoon dynamics and climate influences. Similar studies in agro-climatic zones of Andhra Pradesh, India, reported irregular distribution of rainfall over the period of 1981–2010 [24].
Studies by Martin-Vide [25] evaluated the spatial distribution of the PCI in Peninsular Spain. Key findings highlighted the significance of regional climatic factors in precipitation distribution and revealed clear spatial patterns associated with the Mediterranean climate. Li et al. [26] evaluated the spatio-temporal variability of precipitation in Xinjiang, China, reporting increasing trends in precipitation concentration associated with regional atmospheric circulation patterns and climate change. In addition, Iskander et al. [27] assessed precipitation distribution, intensity and trends in Bangladesh, reporting a strongly irregular precipitation distribution in the South-Eastern Region. Furthermore, Mondol et al. [28] examined the variability in the precipitation of high- and low-rainfall regions in Bangladesh and detected a strong correlation between monsoon variability and climate extremes and changes in precipitation concentration. In South Africa, Botai et al. [29] investigated the spatio-temporal variability and trends of precipitation concentration across the country during the 1998–2015 period, reporting a relatively uniform to highly irregular distribution of precipitation on an annual scale.
The foregoing studies highlighted the wide use of PCI in the evaluation of patterns of rainfall distribution across various climatic zones. Issues such as greater variability and increased frequency of extreme events necessitate the need for regional climate adaptation strategies despite regional variations. Studies reported in the literature have shown the success of the application of PCI in different contexts [23,24,25,26,27,28]; however, the approaches used mostly focus on broad spatial or temporal assessments within particular climatic contexts. In contrast, our study examines a yearly timescale within the summer rainfall regions of South Africa. This geographic focus helps in the understanding of local precipitation patterns moulded by complex regional factors, including topography, land use, and southern Africa’s particular climate variability. Furthermore, the current study emphasizes thorough provincial analysis that is usually ignored in broader regional investigations. The basis of our approach lies in the need to identify subtle trends and patterns of variability in precipitation concentration that are critical for effective water resource management and disaster preparedness. The present study provides valuable insights into the impacts of climate variability on vulnerable areas, thus filling a gap in the existing literature on the lack of selected provincial analysis of precipitation distribution within South Africa that can support localized climate adaptation plans that are tailored to the particular needs of the summer rainfall areas of South Africa.
In the context of the variability in the precipitation distribution and concentration and building on studies by Botai et al. [29], this study aims to evaluate the distribution of precipitation over the six selected summer rainfall provinces of South Africa (namely, Limpopo, Mpumalanga, KwaZulu-Natal, Gauteng, North West and Free State) across annual, seasonal and supra-seasonal timescales. Specifically, we intend to advance knowledge of how trends in precipitation concentrations change in response to changing climatic conditions by contrasting global patterns with South Africa’s summer rainfall regions. The applicability of PCI for disaster risk reduction, regional climate assessment, and sustainable water resource planning in a variety of geographical contexts is further supported through this study. While the selected provinces are classified as summer rainfall regions, they share dissimilar features, including, for instance, economic factors/challenges (e.g., unemployment, poverty and inequality) making the provinces the ideal sites for investigating and understanding the spatio-temporal variability in precipitation in an effort to reduce the impact of weather and extreme events such as drought and floods, which are frequently recurring, making most of the provinces drought- and flood-prone regions.

2. Materials and Methods

2.1. Study Area

South Africa has distinct spatial zones of rainfall seasons [11]. In summer, the eastern and central regions receive rainfall from October to March, with October being significant for farmers to begin planning suitable time to sow for the next growing season. The present study focused on six selected summer rainfall provinces in South Africa, as shown in Figure 1. The KwaZulu-Natal (KZN) Province is geographically located on the eastern seaside of South Africa, bordering Mozambique and Eswatini to the north, Lesotho and Free State in the west, the Eastern Cape Province in the south as well as Mpumalanga along the north-west region. It is the second most populated province after Gauteng, with a surface area of ~106,000 km2 [30]. The province is mostly characterized by rugged topography, steeply increasing from the Indian Ocean (elevation from sea level) to the Drakensberg escarpment (mountainous interior) [9]. The climate in KZN is primarily subtropical, receiving mean annual rainfall ranging from 650 mm in the eastern Grasslands and 900 mm in the central Bushveld to about 1400 mm in the eastern Coastal Bushveld [30]. Most of the rainfall is received during mid-summer, e.g., between October and March.
Mpumalanga Province lies in the eastern part of South Africa on the high plateau grassland of the Middleveld. The province is bounded to the east by Mozambique and Eswatini and to the west by Gauteng. It is the second smallest province after Gauteng with a total surface area of ~79,490 km2 and the fourth-largest economic contributor in South Africa. Mpumalanga is mostly a summer rainfall area demarcated by an escarpment characterized by cold and frosty conditions and moderate summers in the high-lying (Highveld) and mild winters and subtropical climate in the low-lying regions (also known as Lowveld). Mean annual rainfall, with most of it received between September and March, ranges from 620 mm in the Lowveld, reaching up to 1000 mm in the Highveld regions. The Highveld escarpment areas are also prone to snow during winter [31].
Limpopo Province is situated in the northernmost part of the country, sharing international borders with Mozambique, Botswana and Zimbabwe and local boundary with Gauteng Province. The average annual rainfall amounts to 372 mm; however, during winter months, the province is extremely dry [32]. Gauteng (the smallest province) is considered the economic powerhouse of the country and also the financial capital of Africa. Gauteng province has an average annual rainfall of approximately 713 mm [33]. The Free State (FS) Province covers an estimated 129,825 km2, making it the third largest province of the country. The province is bordered by Lesotho and six additional provinces. It is vital for the agricultural economy in South Africa, contributing 30% towards the country’s maize production. Agriculture is dependent on rainfall, with less than 10% of the province under irrigation [18]. The North-West (NW) Province is situated towards the western part of South Africa, with a total land mass of 116,320 km2. The province is more rural than urban at 65% and 35%. It receives an average annual rainfall of around 300 mm, occasionally reaching up to 700 mm. Climate change is set to affect South Africa during the 21st century, which may have a major impact on the county’s summer rainfall region [33].

2.2. Data

Monthly rainfall data from 49 South African Weather Service (SAWS) rainfall climate districts were analysed in the current study. The data analysed spanned from January 1979 to December 2023. The spatial distribution of the selected climate districts is shown in Figure 1, providing fairly good coverage across the six provinces. The selected rainfall districts, which form part of the country’s 94 rainfall climate centroids, contain long-term monthly rainfall totals from 1921 to the present; hence, they provide reliable and continuous datasets. Table 1 gives a summary of the rainfall districts for each province. Climate districts in KZN recorded the highest annual rainfall, ranging between 733 and 1130 mm, followed by Mpumalanga Province with minimum (maximum) annual rainfall of 635 mm (1000 mm). The lowest annual rainfall (290 mm) was recorded in NW and FS (336 mm) and Limpopo (363 mm). The Mann–Kendall (MK) trend test indicates that rainfall decreased during the assessed period. Notably, 83% of the rainfall districts depict a negative trend, thus signalling a decrease in rainfall over a vast region of the selected study area. Only approximately 20% of the detected negative trends are statistically significant at 0.05 significance level (these are shown in bold).

2.3. Methods

2.3.1. Precipitation Concentration Index

The PCI was used to evaluate the distribution of precipitation across the central and north-eastern parts of South Africa, covering North-West, Free State, KwaZulu-Natal, Gauteng, Mpumalanga and Limpopo provinces. The PCI was calculated on annual, seasonal and supra-seasonal timescales to understand the distribution and trend patterns of precipitation across long-, medium- and short-term timescales. On an annual scale, the PCI was calculated using Equation (1), as described in [21],
P C I a n n u a l = i = 1 12 P i 2 i = 1 12 P i 2 × 100
where Pi is the total precipitation of the i month, yearly calculated for each of the 49 climate districts across the investigated period. Considering the climate of the selected study area, which is characterized by early September to late May rainfall, Equation (1) was modified to calculate the 9-month PCI interval based on Equation (2),
P C I 9 = i = 1 9 P i 2 i = 1 9 P i 2 × 75
In addition, the PCI was also calculated on a seasonal scale, defined as September–October–November (SON), December–January–February (DJF), March–April–May (MAM) and June–July–August (JJA) rainy seasons as well as on a supra-seasonal (e.g., summer half of the year) scale. In this study, the supra-season for the wet/summer half of the year was defined as starting from October to March. In this case, Equations (3) and (4) were used to calculate seasonal and supra-seasonal PCI values, respectively, for each rainfall district throughout the observation period.
P C I s e a s = i = 1 3 P i 2 i = 1 3 P i 2 × 25
P C I s s = i = 1 6 P i 2 i = 1 6 P i 2 × 50
According to Oliver [21], the PCI values are characterized based on four categories, as summarized in Table 2. The lowest PCI value (i.e., less than 10) indicates uniformity in precipitation distribution, values 10 and 15 mean a moderate precipitation concentration, whereas PCI values between 16 and 20 and greater than 20 indicate irregular and strong irregular precipitation distribution. In this study, the PCI classification in Table 2 was used to investigate the distribution of precipitation over the six selected provinces of South Africa.

2.3.2. Mann–Kendall Trend Analysis

Trend analysis for rainfall and PCI across seasons was carried out by using the original form of the Mann–Kendall (MK) test [34,35]. The MK is a non-parametric test that is flexible with all distributions; i.e., the data do not have to conform to a certain distribution or follow the presumption of normality [36,37]. The MK test statistic (S) is calculated using Equation (5), as described in [34,35],
S = i = 1 n 1 j = i + 1 n s g n x j x i
where n represents the number of datasets, and xi and xj are the ranks for the ith (i = 1, 2, 3, …, n − 1) and jth (j = i + 1, 2, …, n) datasets. The sign function, sgn, is calculated using Equation (6),
s g n   x j x i = 1 ;   if   x j x i > 0 0 ;   if   x j x i = 0 1 ;   if   x j x i < 0
The variance Var(S) is calculated as given by Equation (7)
V a r S = n n 1 2 n + 5 i = 1 P t i t i 1 2 t i + 5 18
where P is number of tied groups, is the summation over all tied groups and ti represents the number of data values in the ith group with i = 1, 2, 3, …, n. The standardized MK test is computed using Equation (8),
Z M K = S 1 V a r S ;   if   S > 0   0 ;   if   S = 0 S + 1 V a r S ;   if   S < 0
Equation (8) was evaluated to test the presence of a statistically significant trend, whereby a positive Z M K indicates an increasing trend, whereas a negative Z M K signifies a decreasing trend in the time series. An increasing/decreasing monotonic trend at p significance level was tested, with the p-value calculated as per Equation (9),
p v a l u e = 2 × 1 C D F Z M K
where C D F Z M K is the cumulative distribution function of the standard normal distribution. In this study, a 0.05 significance level was considered; consequently, the p-value was calculated for the analysed PCI values across the study site.

2.3.3. Correlation Analysis

Correlation analysis was undertaken to assess the relationship between the annual PCI values and precipitation across the provinces. Pearson’s correlation coefficient, a tool used to evaluate a linear relationship between two random variables, was used in the current study. The correlation coefficient is often defined as given in Equation (10),
R x y = x i x ¯ y i y ¯ x i x ¯ 2 y i y ¯ 2
where R ( x y ) measures the correlation between x and y variables. In this study, x and y variables are the annual PCI values and precipitation averaged for each province, respectively. Thus, in Equation (10), x i and y i represent the PCI values and x ¯ and y ¯ are the mean PCI and precipitation for each province. Pearson’s correlation coefficient ranges between −1 and 0 to +1. Positive correlation suggests that when one variable increases, the other also tends to increase, whereas negative correlation occurs when one variable decreases and the other tends to increase. In this study, the Pearson correlation was interpreted based on a summary given in Table 3 adopted from Mukaka [38].

3. Results

3.1. Characteristics of Annual and Decadal PCI Values

Figure 2 depicts an annual PCI time series averaged for each of the six provinces. On the top panel of Figure 2 are annual PCI time series averaged for Gauteng, North-West and Free State provinces; these are located in the interior parts of South Africa. The bottom panel is the annual PCI series averaged for Limpopo, Mpumalanga and KwaZulu-Natal provinces situated along the east coast and the northern parts of the country. The results indicate that the annual PCI values are highly variable, particularly for the North-West and Limpopo provinces. The annual PCI average time series are characterized by inter- and intra-annual variability across the six provinces. Generally, the Free State and Gauteng provinces recorded the lowest annual PCI values, as shown in Figure 2a. Similarly, the lowest annual PCI values were recorded in KZN and Mpumalanga provinces (Figure 2b). A notable increasing trend indicated by the linear regression is observed across the provinces, suggesting that the annual PCI values increased over the investigated period. The highest annual PCI average (>25) was recorded in 2022 and 2023 in the Free State and KZN provinces as well as in the North-West province (only in 2023). In KZN, the high value of annual PCI can be attributed to high precipitation events that lead to the April and May 2022 flooding.
Figure 3 shows the annual distribution of the mean PCI values computed based on the monthly precipitation data from the 49 selected rainfall districts over the 1979–2023 investigated period. Based on the classification given in Table 2, the spatial distribution of PCI delineates the study site into two distinct areas: (a) the coastal KZN, parts of Mpumalanga and the Free State, and (b) the extensive area covering the interior, the north-western parts (with exceptions to some pocket areas in Limpopo, North West). None of the 49 rainfall districts recorded PCI ≤ 10, i.e., uniform rainfall concentrations between 1979 and 2023. The KZN and the eastern parts of Free State and Mpumalanga are mostly characterized by moderate precipitation distribution, with PCI values ranging between 13 and 15.
A vast area of the study site presented PCI values within the irregular precipitation distribution category. Only one rainfall district in the Free State and North-West and two in Limpopo provinces recorded PCI greater than 20, suggesting a heterogeneous distribution of annual precipitation in those pocket areas during the investigated period. Variations in precipitation concentrations are often localized and attributed to factors such as latitudes, topography, and atmospheric circulation patterns [39,40]. According to Weldon and Reason [41] and Nel and Sumner [42], the KZN province exhibits differences in rainfall patterns when compared with other areas due to a mix of climatic, atmospheric, and geographical influences. The region experiences moderate precipitation concentration owing to its proximity to the Indian Ocean, high elevations, particularly along the western border and the Drakensberg mountains. The orographic effect plays an important role as moist air from the ocean rises over the mountains, cools, and condenses, leading to reliable and steady rainfall patterns annually. Conversely, other regions exhibit inconsistent rainfall patterns because of variations in their geographical positions and climatic factors with factors such as proximity to moisture sources, intricate terrain, and fluctuations in atmospheric circulation, causing irregular and unpredictable precipitation. Furthermore, the effects of climate change, such as modified weather systems and shifting wind patterns, affect rainfall distribution, causing certain regions to be more susceptible to unpredictable precipitation. Generally, precipitation pattern variations over South Africa are a result of the interaction of factors, like topography, closeness to moisture sources, atmospheric dynamics, and climate change impacts [41].
To investigate the decadal changes in PCI values, the data were divided and analysed in the following four decades, 1979–1989, 1990–2000, 2001–2011 and 2012–2023. The decadal PCI values were calculated and averaged over each of the decadal periods and compared with the reference period (1979–2023). The results are shown in Figure 4 for the reference and decadal PCI averages (a), change in PCI average (b), and Table 4 depicting the total number of centroids with increased (decreased) decadal PCI average. Based on the results, the PCI average values for the reference and decadal periods (with the exceptions of 1979–1989) fall within the irregular PC type. Generally, the 1990–2000 and 2012–2023 decades show increased PCI values, with the last decade showing the highest irregular PCI value of 18.5 (Figure 4a). On the other hand, the 1979–1989 and 2001–2011 decades show a decrease in PCI, with the prior decade showing a moderate PCI of ~15. Approximately 83.6% of the rainfall districts experienced decreasing PCI values during the 1979–1989 decadal period (Table 4). During the 1990–2000 period, ~77.6% of the districts experienced increasing PCI values. Decadal PCI values decreased in 39 of the rainfall districts during the 2001–2011 period. On the contrary, 39 of the rainfall districts depicted an increase in PCI values for the last decade. Results for the decadal PCI magnitude of change are shown in Figure 4b. For the decreasing decades, PCI decreased by −1.5 and −1.2 magnitudes of change between the 1979–1989 and 2001–2011 periods, respectively. Similarly, between 1990–2000 and 2012–2023, the PCI average values increased by 2.1 and 2.8 magnitudes of change, respectively.
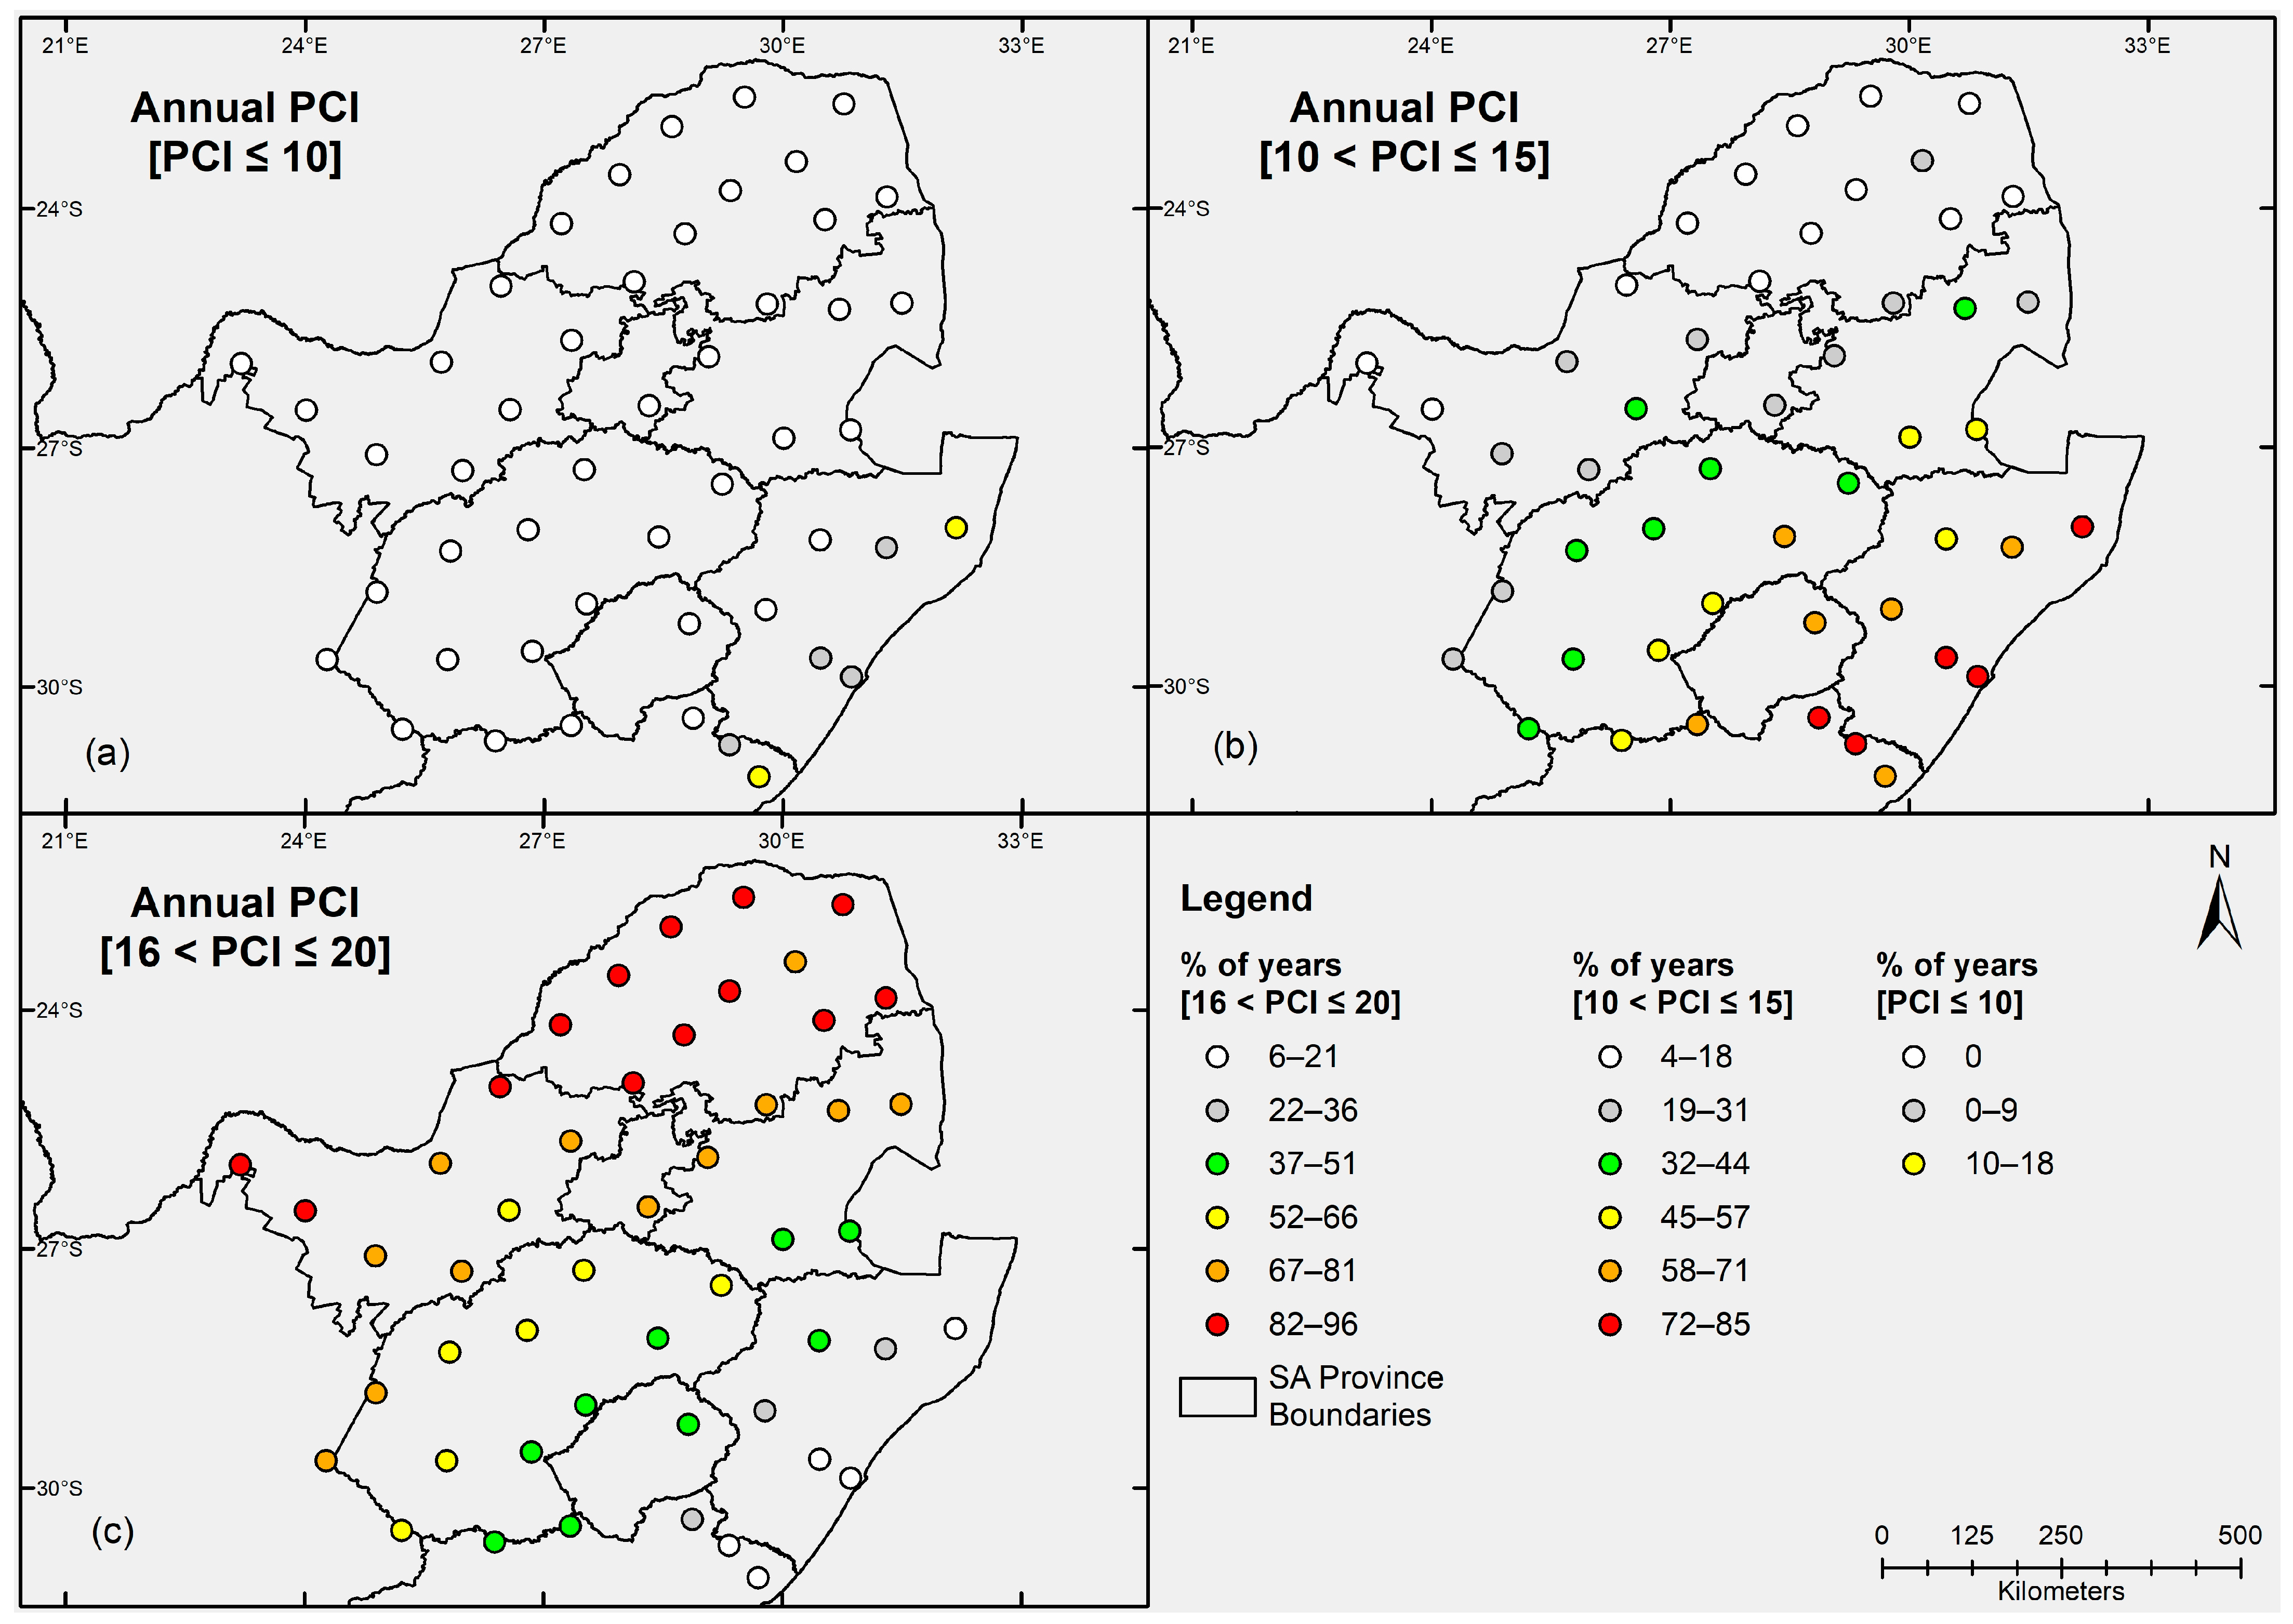
The characteristics of the annual PCI were also assessed by evaluating the frequency of years when individual rainfall districts recorded uniform, moderate and irregular precipitation distributions, i.e., PCI ≤ 10, 10 < PCI ≤ 15 and PCI > 16, respectively. Results for this analysis are shown in Figure 5. None of the provinces, except KZN, exhibited frequent uniform distributions (Figure 5a). In particular, about six of the rainfall districts in KZN displayed between 4% (2 years) and 18% (8 years) of uniform distributions. Similarly, the KZN province mostly recorded more than 58% (26 out of 45 years), reaching up to ~84% (38 years) frequency of moderate distributions. Most of the rainfall districts in Free State and parts of Mpumalanga exhibited between 32 and 44% frequency of moderate distributions, with few districts reaching up to 57% (25 out of 45 years) of moderate distributions. The majority of the rainfall districts in the North-West and Gauteng displayed between 19 and 31% (~8 to ~14 years) frequency of moderate distributions. The lowest frequency of moderate distributions was detected in Limpopo province, with a percentage of years ranging between 4 and 18%, i.e., equivalent to ~2 and up to 8 years. On the contrary, a high frequency of irregular distributions was observed in Limpopo province, with the years ranging between 82 and 96%. Similarly, rainfall districts in the North-West, Gauteng and parts of Mpumalanga registered between 67 and 81% (up to 36 years) within the category of irregular distributions, with additional pocket areas in the North West displaying more than 82% of frequency of years with irregular distributions. KwaZulu-Natal is the only province that recorded less frequency of years, i.e., the lowest of 6 and the highest of 37% (equivalent to 2 up to ~16 years) of irregular distributions. Generally, the results indicate that while the northern parts of the study site experienced a significant frequency of years in the category of irregular distributions, the eastern parts are characterized by greater frequency of years within the moderate distributions of PCI.

3.2. Seasonal Variations in PCI

Results for the seasonal PCI values are depicted in Figure 6, where (a) corresponds to the spatial distribution of PCI based on the 9-month calculations, (b) is for the supra-seasonal, (c) summer (December–January–February; DJF), (d) autumn (March–April–May; MAM), (e) winter (June–July–August; JJA) and (f) is for the spring (September–October–November; SON). For the 9-month PCI computation, about 86% of the rainfall districts presented PCI values within the moderate precipitation distribution. Five of the rainfall districts, three in Limpopo and one in the North-West and Free State provinces, recorded PCI values with an irregular precipitation distribution. Moderate PCI values were recorded across the rainfall districts and the provinces during the supra-wet and MAM rainfall seasons (Figure 6b,d). A vast area of the study site exhibits PCI values within the uniform precipitation distribution, with exceptions in the northern (Limpopo) and southern (Free State) areas, which recorded moderate precipitation distributions during the summer rainfall season (Figure 6c). During the JJA rainfall season, KZN, the northern parts of Mpumalanga and small pockets of Limpopo recorded PCI values within the moderate precipitation distribution category, while the rest of the study site showed PCI values equivalent to the moderate distribution (Figure 6e). Furthermore, the SON rainfall season shows uniform distribution along the coastal KZN and moderate precipitation distribution across the five provinces, with one rainfall district in Mpumalanga showing irregular precipitation distribution (Figure 6f).

3.3. Trends of PCI Across Timescales

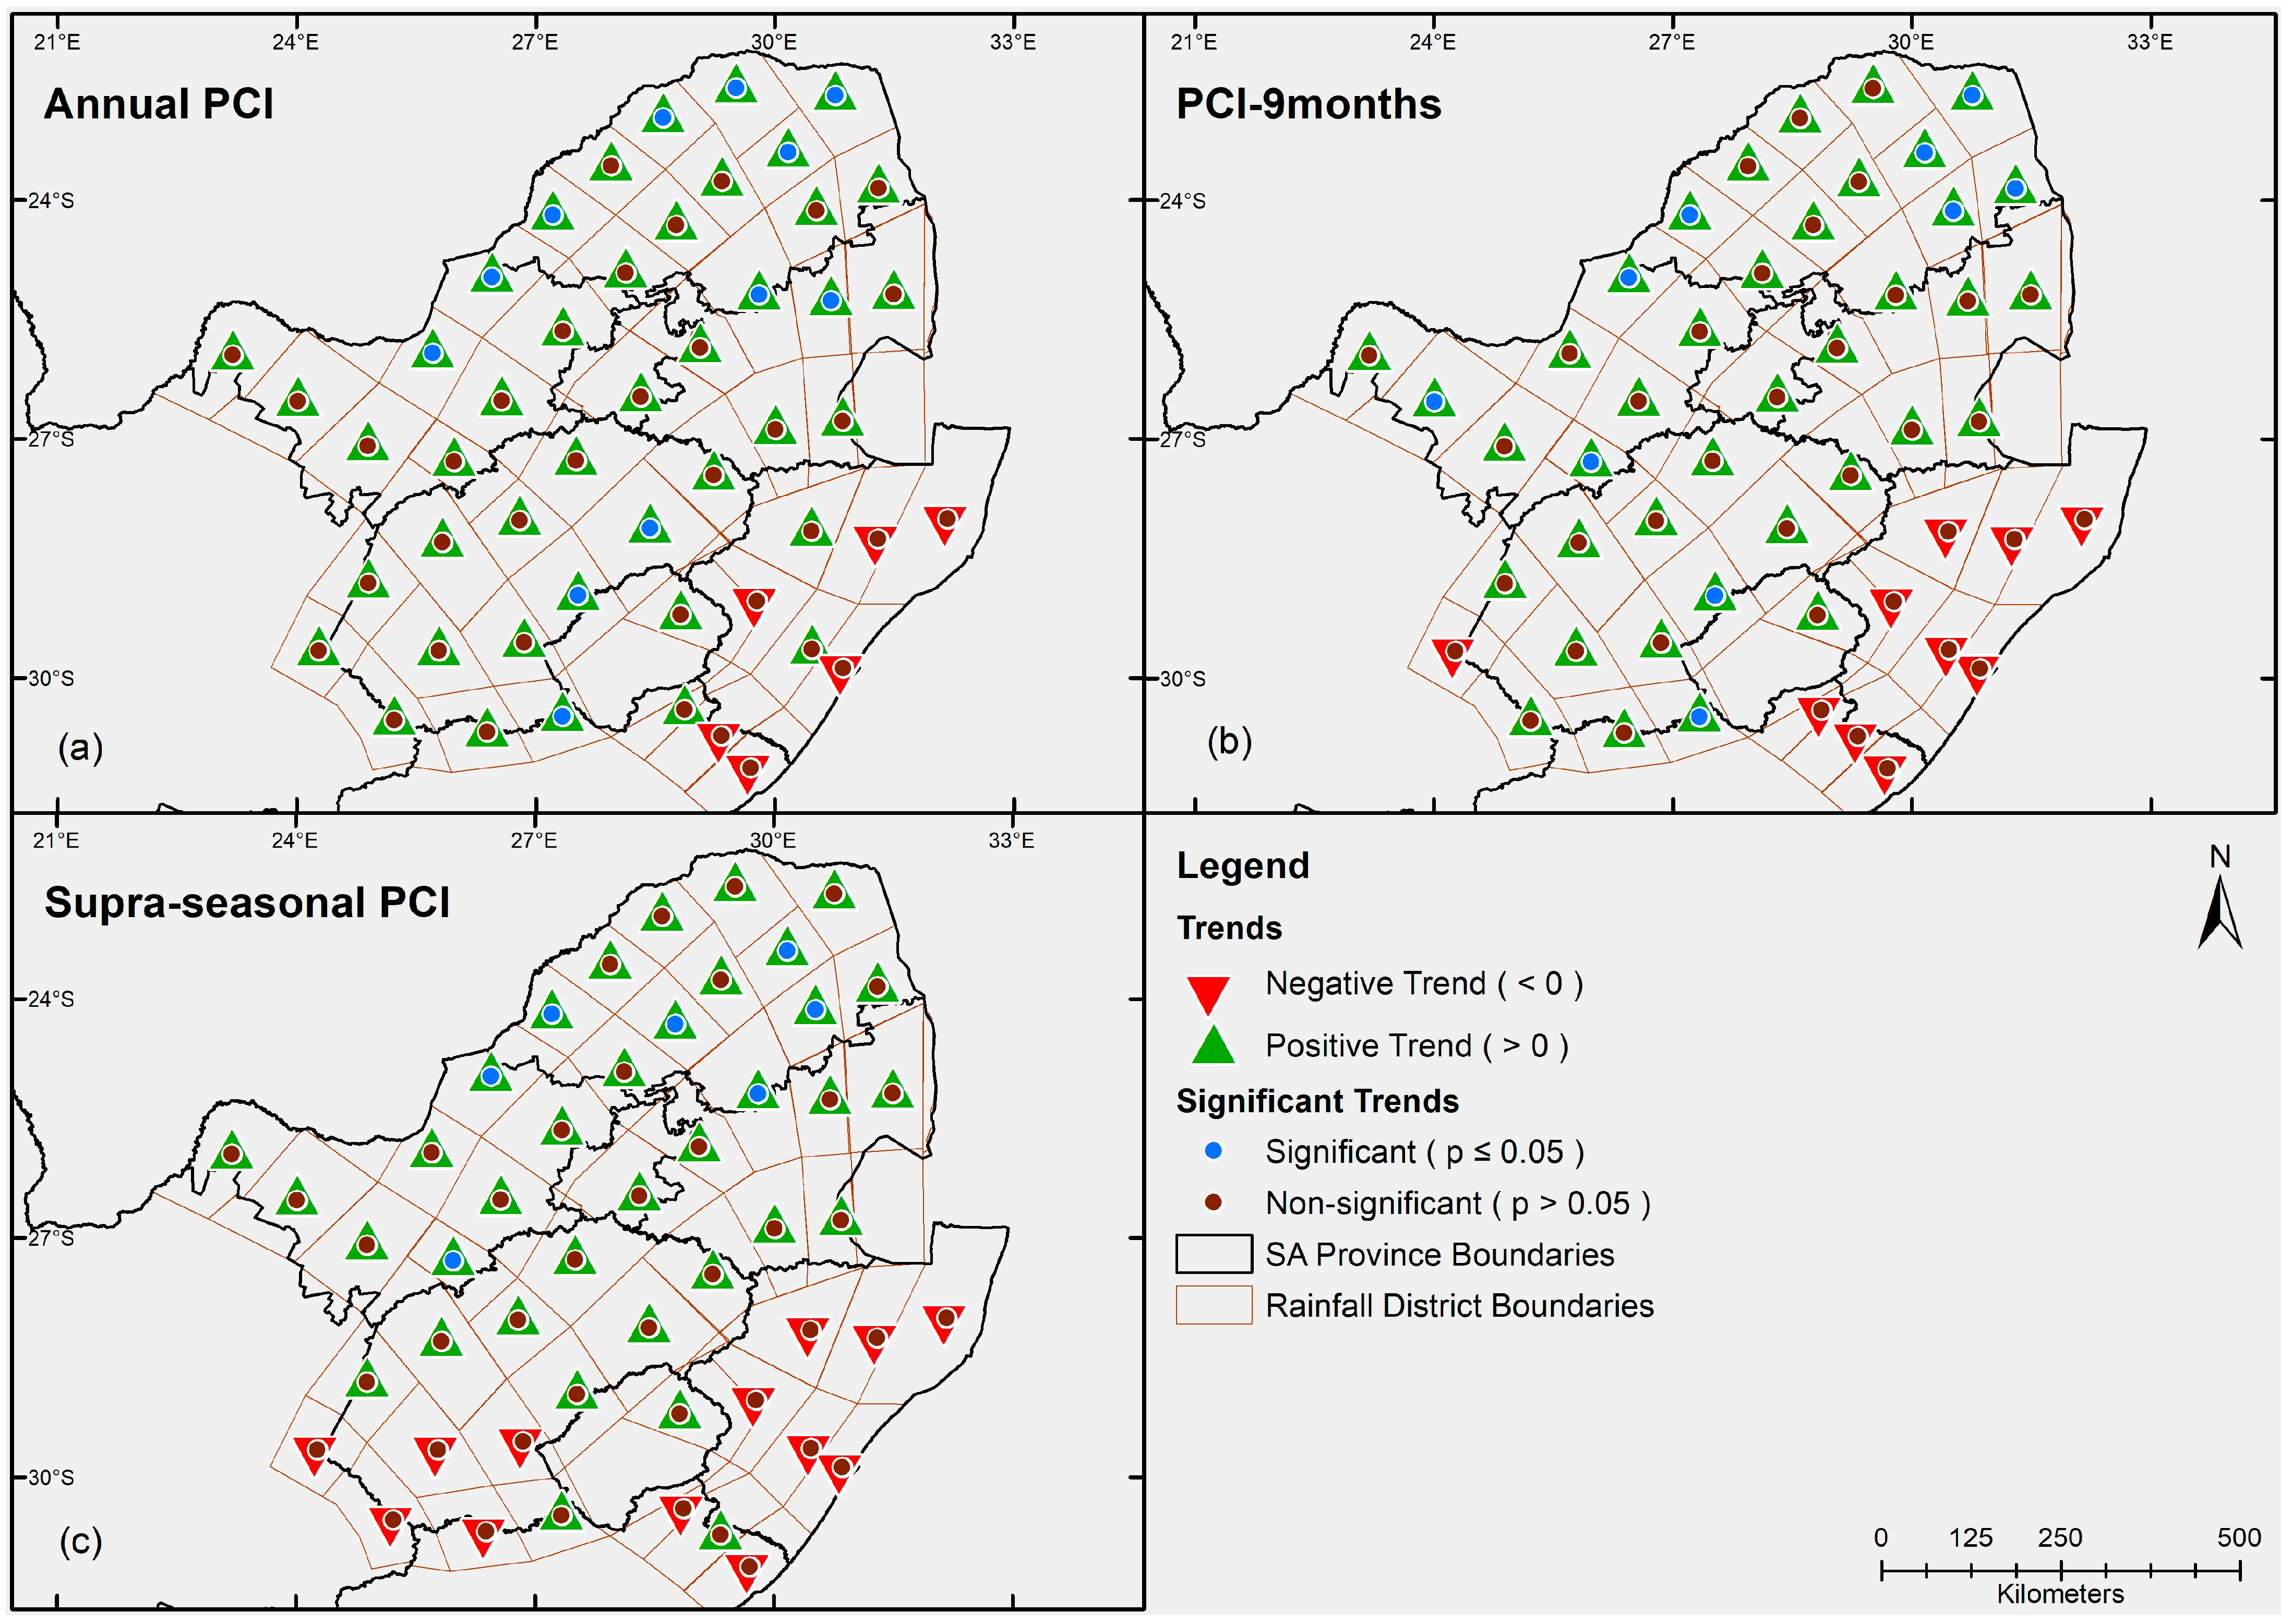
Figure 7 depicts the spatial distribution of (a) annual, (b) 9-month and (c) supra-seasonal PCI trends across the study site from 1979 to 2023. The green and red triangles represent increasing (positive) and decreasing (negative) trends, respectively. Furthermore, the blue and brown dots symbolize a statistically significant trend at the 95% (p ≤ 0.05) significance level and a non-significant (p > 0.05) trend, respectively. Almost all provinces, except parts of KZN, exhibit increasing annual PCI trends, statistically significant in 12 out of 43 rainfall districts. Similar results are observed for the 9-month data, except that all rainfall districts in KZN show a non-significant decreasing PCI trend. For the supra-wet season, KZN and the southern parts of Free State recorded a non-significant negative PCI trend, while positive trends are observed over the remaining study area.
Results for seasonal trends calculated from the 49 rainfall districts during the assessed period are shown in Figure 8. The spatial distribution of the seasonal PCI trends shows distinct patterns across the four seasons. While the trend pattern for DJF and MAM is almost similar to JJA and SON, respectively, the PCI trends depict dissimilar features. For instance, in the summer season, an increasing trend is observed, mostly from the interior, moving towards the northern regions (covering parts of North West, Gauteng, Mpumalanga and Limpopo), while the central (mostly Free State) region moving towards the eastern areas (e.g., KZN) depicts a decreasing PCI trend. Contrary trend features are observed during the winter season, where the central part moving towards the north exhibits a decreasing trend, whereas the interior moving towards the eastern parts shows an increasing trend. Similarly, trends in autumn and spring seasons exhibit contrary features. For instance, during MAM, the majority of the study area exhibits decreasing trends, with only 12 out of 49 rainfall districts having recorded an increasing trend. On the contrary, in SON, increasing PCI trends dominate the study area, with only 13 of the districts exhibiting a decreasing PCI trend.

3.4. Correlation Between the PCI and Annual Precipitation

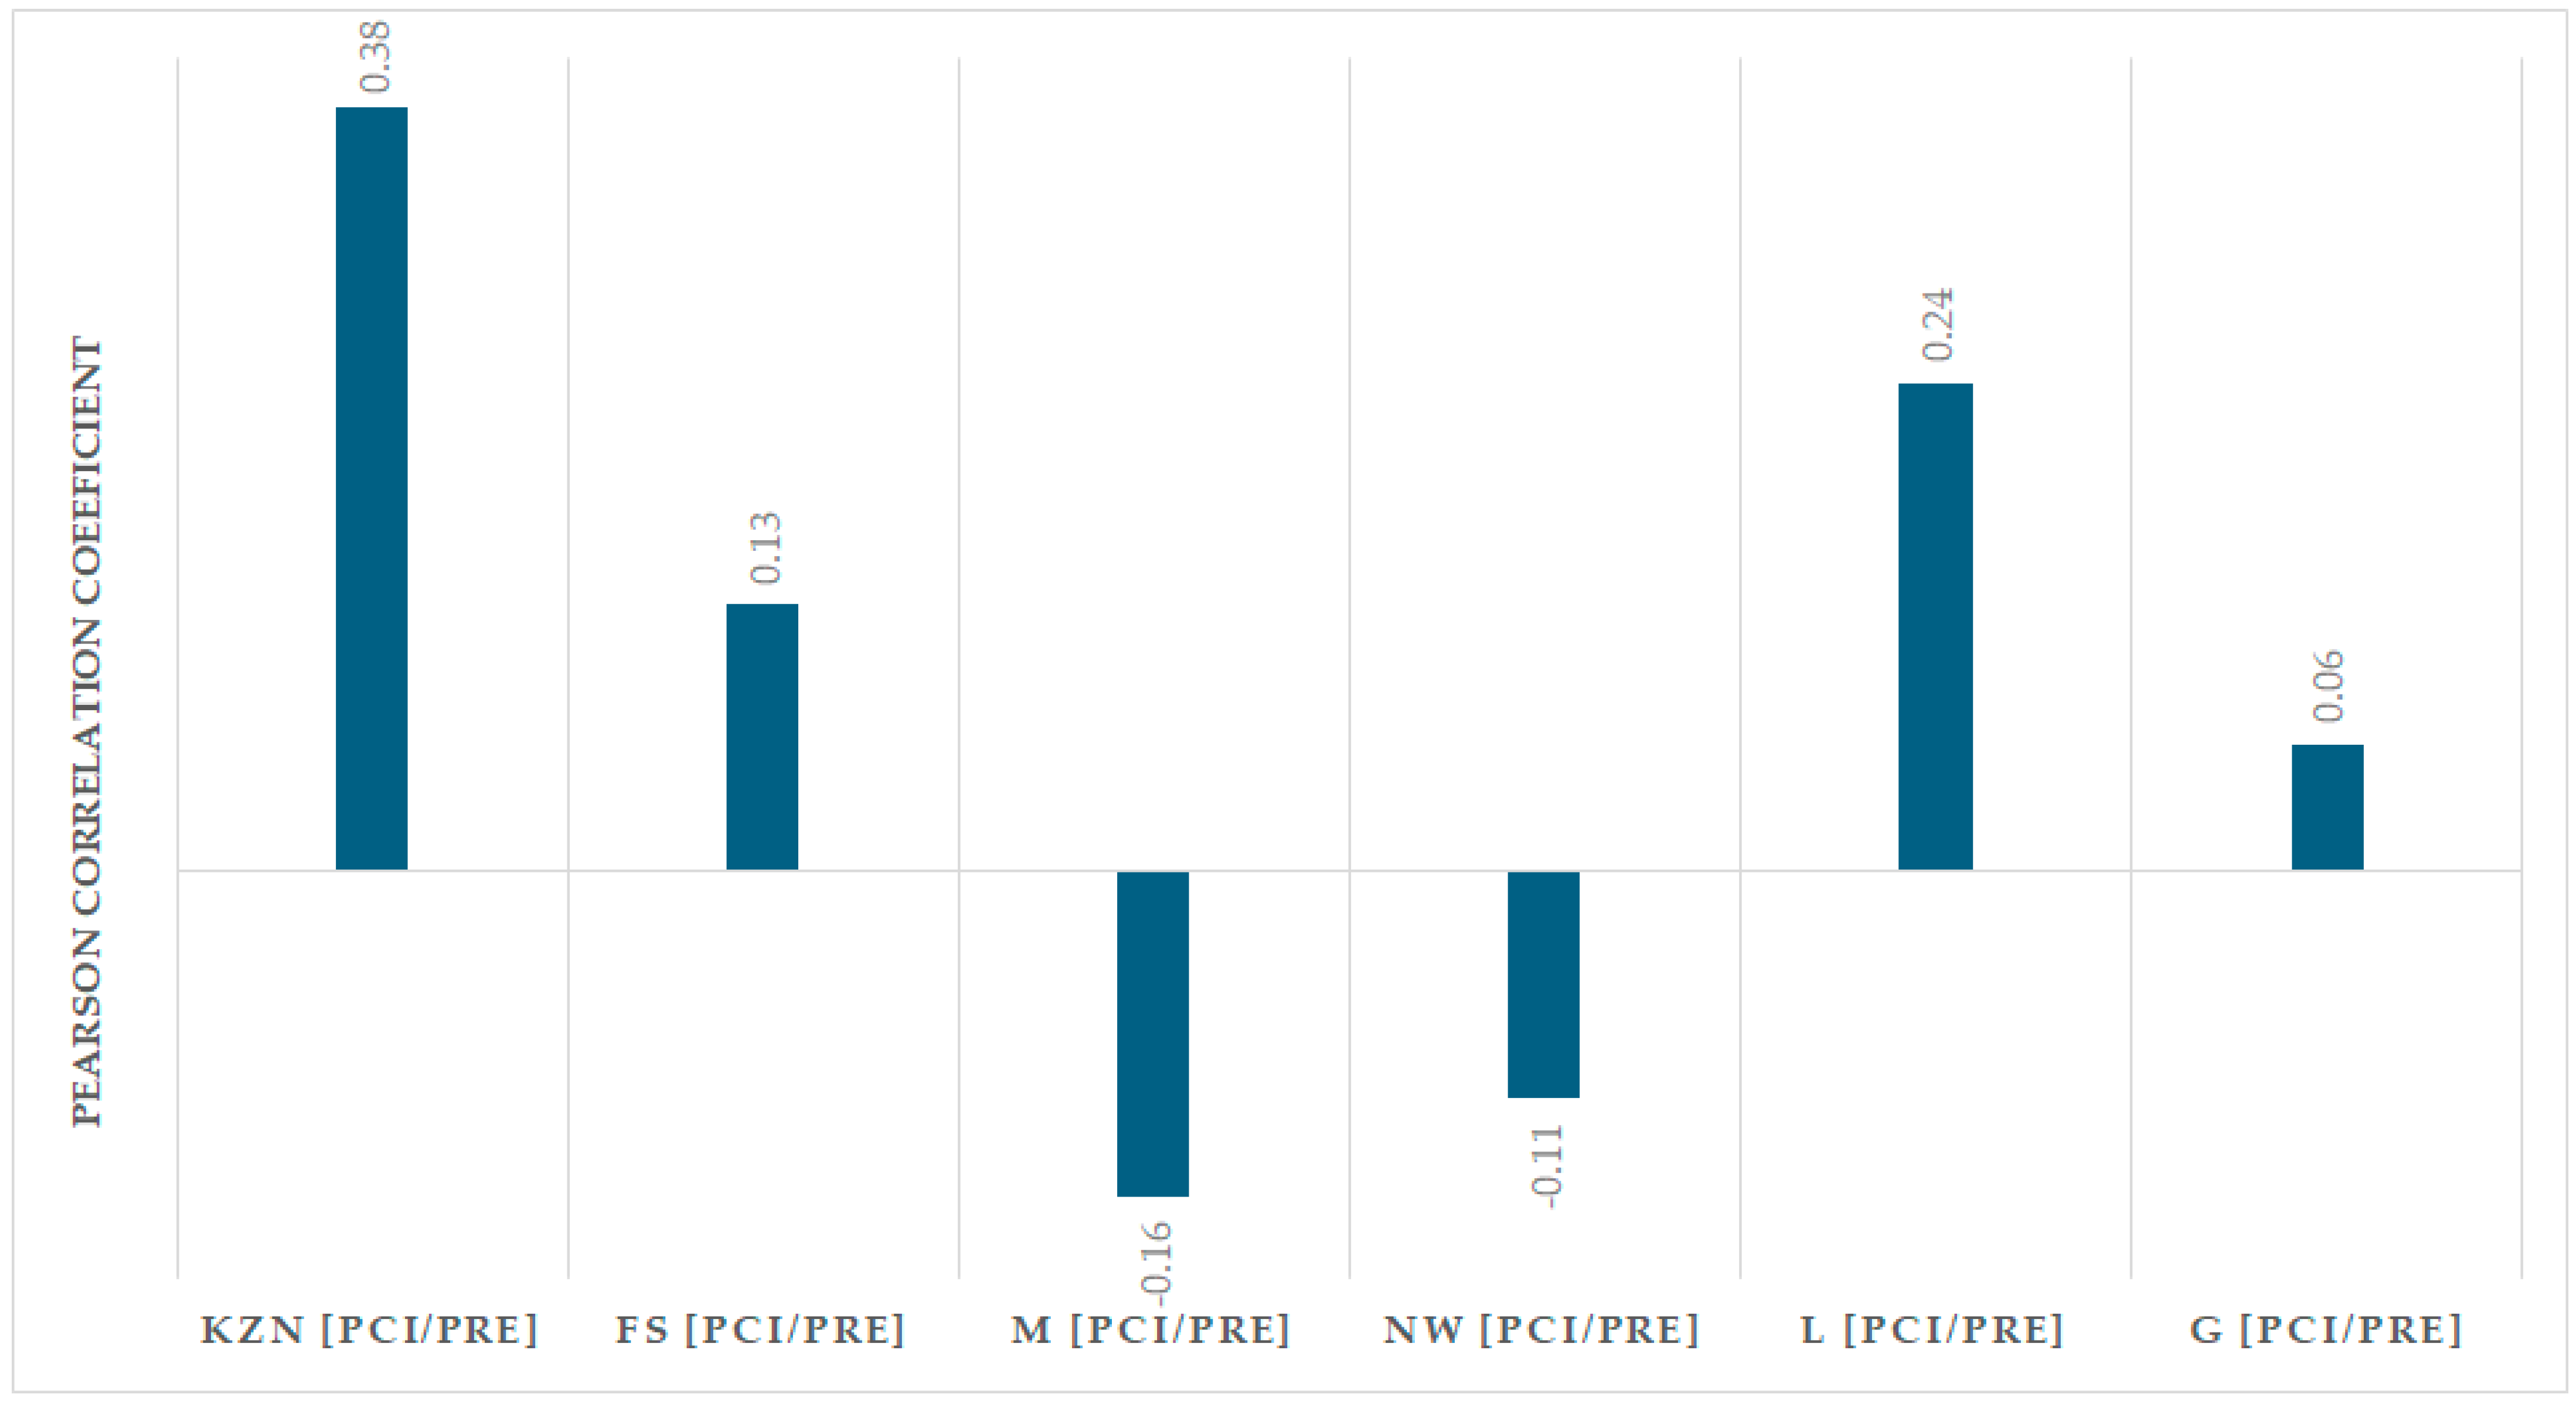
Pearson’s correlation coefficient was used to evaluate the relationship between annual PCI values and annual precipitation across the provinces. Results for the correlation analysis are presented in Figure 9, with each abbreviation defined as follows: KwaZulu-Natal (KZN), Free State (FS), Mpumalanga (M), North West (NW), Limpopo (L) and Gauteng (G). Correlation coefficient values range between −0.16 and 0.38. Generally, a positive correlation between the PCI and precipitation is detected in KwaZulu-Natal, Free State, Limpopo and Gauteng, whereas negative correlations are observed in Mpumalanga and North-West provinces. Only the KZN province exhibits moderate positive correlation, while the rest of the provinces (with the exceptions of Gauteng) depict a weak correlation, as per the classification proposed by Mukaka [38] and summarized in Table 3. Mukaka [38] proposed that a coefficient of <±0.1 indicates a negligible/minimal relationship between the paired variables. Consequently, a minimal association is detected for Gauteng Province, with a correlation coefficient of ~0.01. Although the observed correlation is between the weak and moderate categories, it can be concluded that the annual PCI values across the provinces are influenced by the amount of precipitation received over the assessed period. These results can be improved by considering other factors such as the climatic indices (e.g., drought indices, El Niño–Southern Oscillation), geographical factors (latitude, longitude, and altitude), as well as soil characteristics.

4. Discussion

The PCI is considered a compelling measure of the spatio-temporal distribution of precipitation [43] and a key component of the climate, with great influences on the availability of water resources [44,45]. This study evaluated the spatial and temporal distribution of PCI in the summer rainfall regions covering six South African provinces based on analysis of 45 years of monthly precipitation data from the 49 rainfall districts spatially distributed across the selected provinces. Precipitation in vast areas of the study site is highly variable. Rainfall districts in Limpopo, NW and FS recorded the lowest annual rainfall, ranging between 290 and 363 mm. KZN and Mpumalanga recorded the highest annual rainfall, with a minimum (maximum) of ~733 (~1130 mm) and 635 (~1000 mm), respectively. High intensity, frequency, duration and spatial distribution of rainfall have, in the past (and continue to), caused human distress and financial losses manifested through natural hazards such as droughts (L, NW, FS) and floods (e.g., in KZN, Gauteng and Mpumalanga). In this study, ~84% of the rainfall districts recorded a decreasing trend in precipitation, suggesting that rainfall reduced during the investigated period (1979–2023). Water resources are highly influenced by precipitation changes, coupled with human-induced factors. With reduced rainfall, water resources become a limiting factor to socio-economic development, particularly in Gauteng, KZN and Mpumalanga provinces, which are considered as key contributors to the country’s economy, as well as in L, NW and FS provinces, which are highly dependent on rain-fed agriculture.
The annual PCI time series derived from the monthly precipitation data are highly variable and are mostly characterized by inter- and intra-annual variability across the six provinces. An increase in PCI values resulted in a higher concentration of annual precipitation. Generally, the annual PCI values delineated the study site into two distinct regions, the moderate and irregular precipitation concentration areas. In this case, the KZN and parts of the FS and Mpumalanga provinces are characterized by a moderate precipitation concentration. The moderate precipitation distribution observed around 2015 (Figure 2) in KZN, NW, Mpumalanga, Limpopo, and FS provinces aligns with reports of moderate to extreme drought conditions in the National Integrated Water Information System (NIWIS), also reported by Simanjuntak et al. [46] for these provinces, and others such as the Western Cape. Conversely, an irregular precipitation concentration dominated in Limpopo, NW, Gauteng, and parts of the FS, confirming previously reported findings reported by Botai et al. [29]. In addition, the irregular to strongly irregular precipitation distribution observed after 2020 corresponds with reports of drought recovery and potential flood risks, offering useful data for flood mapping in South Africa, using the PCI.
Approximately 84% of the 49 rainfall districts showed negative trends in annual precipitation. Conversely, ~88% of the rainfall districts depicted positive trends in annual PCI values, suggesting that a vast region of the study site experienced an increase in PCI during the analysed period of study. Such findings suggest that precipitation was concentrated in fewer months/events, leading to inflated PCI values, albeit the overall annual precipitation is lower. Six (6) of the rainfall zones in KZN province showed negative trends; however, the detected trends failed the significance test (e.g., p ≤ 0.05). Undoubtedly, a decline in annual precipitation resulted in irregularities in precipitation, particularly in Limpopo, Gauteng, NW and FS, where irregular concentrations of precipitation were mostly dominant. In KZN province, there are consistent decreasing trends in both PCI and annual precipitation, suggesting that declining rainfall conditions in the province were significant. In terms of seasonal trends, ~73 and ~57% of the rainfall districts showed positive trends during SON and JJA, while ~51 and ~76% of the rainfall districts exhibited negative trends in the DJF and MAM seasons, respectively. The current findings are in accordance with those reported by Botai et al. [29]. Similar results were reported by Salameh [47], where the observed decreasing trend in annual precipitation was reported to have resulted in increased precipitation irregularities in the Levant region. Benetó and Khodayar [48] detected an opposite relationship between trends of PCI and annual precipitation in Spain. Increasing/decreasing PCI trends were also reported elsewhere, globally, for example, in China for the period of 1960–2016 [49] and in the northeast and eastern parts of India for the period spanning 1986–2015 [50].
The observed increasing/decreasing trends in both annual and seasonal PCI may pose challenges for water resource management, including the management of hydrometeorological hazards such as droughts and floods. Heavy and intense rainfall often causes floods, whereas insufficient or no rainfall may result in droughts. For instance, increasing trends in PCI values in almost all the provinces, with the exceptions of KZN, could lead to a shift from a moderate to irregular distribution of precipitation, causing floods, as well as land/mudslides, and soil erosion, significantly affecting agricultural productivity and water quality. Conversely, the decreasing trend in PCI, which is attributed to a decline in rainfall, may result in drought, particularly in KZN, where negative trends dominated across the timescales. Such conditions may affect water supply for various purposes, leading to the over-abstraction of groundwater and the river system. In addition, decreasing trends in PCI values, particularly during the MAM season across the provinces, could be linked to fluctuating heat wave patterns in Limpopo, Mpumalanga, KZN, NW, and FS [46,51]. Changes in PCI values coupled with heat wave patterns may exacerbate the occurrences of drought in drought-prone regions. Furthermore, studies by Mukhawana et al. [52] reported a positive correlation between precipitation-based droughts and hydrological droughts (surface and groundwater) in the Western Cape. Thus, PCI information could serve as an early-warning indicator for droughts across South Africa. The PCI can also be integrated with other drought indicators such as the Temperature Condition Index, Standardized Precipitation Index and Standardized Streamflow Index to enhance drought risk monitoring.

5. Conclusions

The present study analysed the spatial distribution of precipitation using the PCI, calculated on annual, seasonal, and supra-seasonal timescales based on monthly precipitation data from 1979 to 2023. The 45-year monthly precipitation data were collected from 49 rainfall districts spatially distributed across six South African provinces characterised by the summer rainfall season. The results of this study can be summarized as follows:
-
Vast areas of the study site exhibited annual PCI values within the irregular precipitation concentration category. The KZN and the eastern parts of Free State and Mpumalanga showed annual PCI values within a moderate precipitation concentration category. Only one rainfall district in the FS and NW and Limpopo exhibited strong irregular annual PCI values, suggesting that precipitation was highly concentrated in those pocket areas during the investigated period. The supra-seasonal PCI values indicated a moderate precipitation concentration across the provinces.
-
The decadal PCI values decreased by −1.5 and −1.2 magnitudes of change during the 1979–1989 and 2001–2011 periods and increased by 2.1 and 2.8 magnitudes between 1990–2000 and 2012–2023, respectively.
-
Uniform precipitation concentration was mostly recorded during the DJF season. The entire study area recorded moderate precipitation concentration during the MAM and SON seasons (with the exceptions of KZN). In addition, irregular precipitation concentration dominated during the JJA rainy season.
-
Positive trends in annual PCI were recorded across the provinces, with exceptions in KZN province. Similarly, during the wet season, positive trends in supra-seasonal PCI were detected across the provinces, with exceptions in KZN and in parts of the Free State. Furthermore, negative trends in seasonal PCI values mostly dominated during DJF and MAM, whereas positive trends were mostly observed during the SON and JJA seasons.
In this study, the results on the moderate precipitation distribution aligned with reported moderate to extreme drought conditions in NIWIS, making the present findings valuable for identifying drought-prone (hot-spots) areas in the selected study site, with the possibility of extending the study to cover the whole country. In this case, the PCI could serve as an early-warning indicator for drought across South Africa, thus enhancing drought risk management efforts in the country. In addition, the observed irregular to strongly irregular precipitation distribution corresponds with reports of drought recovery and potential flood risks; thus, these findings can contribute to flood mapping in South Africa, using the PCI as a flood monitoring indicator. To enhance drought mapping efforts, it is recommended to explore the possibility of integrating the PCI with other climatic factors such as El Niño–Southern Oscillation; the Indian Ocean Dipole; drought indices such as the Temperature Condition Index, the Standardized Precipitation Index and the Standardized Streamflow Index; as well as the Simple Daily Intensity Index.
In addition, the adaptation of integrated approaches that combine other climatic and hydrological indicators (e.g., remote sensing information such as satellite-derived surface water levels, soil moisture and vegetation health indices) with the drought indices mentioned above, and the use of advanced geospatial analytical tools and machine learning algorithms, could improve the accuracy and sensitivity of drought mapping. Furthermore, future research could focus on the analysis of the spatial and temporal dimensions of precipitation in all regions of South Africa, taking into account the regional variations and long-term trends. Another aspect would be the use of high-resolution climate models and downscaled climate projections that consider climate indicators such as the temperature anomalies, evapotranspiration rates, and humidity levels, as well as the development and validation of predictive models that incorporate climatic, environmental and socio-economic information to enhance drought and flood early-warning systems. The present study set the groundwork for future climate change research to play a crucial role in strengthening water management and early-warning systems. By advancing predictive tools and sustainable water practices, this study contributes to the efforts to ensure water security and protect communities from climate-related risks and extreme weather events such as floods and droughts. These efforts are vital for building resilience in the face of increasing climate variability.

Author Contributions

Conceptualization, C.M.B. and J.O.B.; methodology, C.M.B. and J.O.B.; software, J.O.B.; formal analysis, C.M.B. and H.T.; data curation, J.d.W.; writing—original draft preparation, C.M.B., N.Z. and M.B.M.; writing—review and editing, all authors; visualization, J.d.W. and N.S.M. All authors have read and agreed to the published version of the manuscript.

Funding

This research received no external funding.

Data Availability Statement

The raw data supporting the conclusions of this article are unavailable due to privacy and restrictions, as guided by the institution’s data policy.

Acknowledgments

The authors wish to thank the anonymous reviewers for providing constructive and detailed comments, enhancing the quality of the manuscript. The authors also acknowledge the research work partly supported by the National Research Foundation of South Africa (RA23021780171).

Conflicts of Interest

The authors declare no conflicts of interest.

References

  1. Contractor, S.; Donat, M.G.; Alexander, L.V. Changes in observed daily precipitation over global land areas since 1950. J. Clim. 2021, 34, 3–19. [Google Scholar] [CrossRef]
  2. Tebaldi, C.; Hayhoe, K.; Arblaster, J.M.; Meehl, G.A. Going to the Extremes: An intercomparison of model-simulated historical and future changes in extreme events. Clim. Change 2006, 79, 185–211. [Google Scholar] [CrossRef]
  3. Schauwecker, S.; Gascón, E.; Park, S.; Ruiz-Villanueva, V.; Schwarb, M.; Sempere-Torres, D.; Stoffel, M.; Vitolo, C.; Rohrer, M. Anticipating cascading effects of extreme precipitation with pathway schemes-Three case studies from Europe. Environ. Int. 2019, 127, 291–304. [Google Scholar] [CrossRef] [PubMed]
  4. Tabari, H.; Paz, S.M.; Buekenhout, D.; Willems, P. Comparison of statistical downscaling methods for climate change impact analysis on precipitation-driven drought. Hydrol. Earth Syst. Sci. 2021, 25, 3493–3517. [Google Scholar] [CrossRef]
  5. IPCC. Contribution of Working Group I to the Sixth Assessment Report of the Intergovernmental Panel on Climate Change. In Climate Change 2021: The Physical Science Basis; Masson-Delmotte, V., Zhai, P., Pirani, A., Connors, S.L., Péan, C., Berger, S., Caud, N., Chen, Y., Goldfarb, L., Gomis, M.I., et al., Eds.; Cambridge University Press: Cambridge, UK; New York, NY, USA, 2021; p. 2391. [Google Scholar]
  6. Stocker, T.; Qin, D.; Platner, G.-K. Contribution of Working Group I to the Fifth Assessment Report of the Intergovernmental Panel on Climate Change. In Climate Change 2013: The Physical Science Basis; Intergovernmental Panel on Climate Change, Ed.; Cambridge University Press: Cambridge, UK, 2013. [Google Scholar]
  7. Du, X.; Zhao, X.; Zhou, T.; Jiang, B.; Xu, P.; Wu, D.; Tang, B. Effects of climate factors and human activities on the ecosystem water use efficiency throughout Northern China. Remote Sens. 2019, 11, 2766. [Google Scholar] [CrossRef]
  8. Stott, E. Rainfall-to-Reach, Modelling of Braided Morphodynamics. Master’s Thesis, University of Glasgow, Glasgow, UK, 2019. [Google Scholar]
  9. Badenhorst, P.; Cooper, J.A.G.; Crowther, J.; Gonsalves, J.; Laubscher, W.I.; Grobler, N.A.; Mason, T.R.; Illenberger, W.K.; Perry, J.E.; Reddering, J.S.V.; et al. Survey of September 1987 Natal Floods; South African National Scientific Programmes Report 164; CSIR: Pretoria, South Africa, 1989; p. 136. [Google Scholar]
  10. Roy, S.S.; Rouault, M. Spatial patterns of seasonal scale trends in extreme hourly precipitation in South Africa. Appl. Geogr. 2013, 39, 151–157. [Google Scholar]
  11. Kruger, A.C.; Nxumalo, M.P. Historical rainfall trends in South Africa: 1921–2015. Water SA 2017, 43, 285–297. [Google Scholar] [CrossRef]
  12. McBride, C.; Kruger, A.C.; Dyson, L. Changes in extreme daily rainfall characteristics in South Africa: 1921–2020. Weather Clim. Extrem. 2022, 38, 100517. [Google Scholar] [CrossRef]
  13. Mishra, A.K.; Singh, V.P. A review of drought concepts. J. Hydrol. 2010, 391, 202–216. [Google Scholar] [CrossRef]
  14. Mishra, A.K.; Singh, V.P. Changes in extreme precipitation in Texas. J. Geophys. Res. Atm. 2010, 115, D14106. [Google Scholar] [CrossRef]
  15. Dube, K.; Nhamo, G.; Chikodzi, D. Climate change-induced droughts and tourism: Impacts and responses of Western Cape province, South Africa. J. Outdoor Recreat. Tour. 2022, 39, 100319. [Google Scholar] [CrossRef]
  16. Botai, C.M.; Botai, J.O.; Dlamini, L.; Zwane, N.; Phaduli, E. Characteristics of Droughts in South Africa: A Case Study of Free State and North West Provinces. Water 2016, 8, 439. [Google Scholar] [CrossRef]
  17. Schreiner, B.G.; Mungatana, E.D.; Baleta, H. Impacts of Drought Induced Water Shortages in South Africa: Economic Analysis; Water Research Commission Report; Water Research Commission: Pretoria, South Africa, 2018. [Google Scholar]
  18. Adeola, O.M.; Masinde, M.; Botai, J.O.; Adeola, A.M.; Botai, C.M. An analysis of precipitation extreme events based on the SPI and EDI values in the Free State Province, South Africa. Water 2021, 13, 3058. [Google Scholar] [CrossRef]
  19. Ashrafi, S.; Karbalaee, A.R.; Kamangar, M. Projections patterns of precipitation concentration under climate change scenarios. Nat. Hazards 2024, 120, 4775–4788. [Google Scholar] [CrossRef]
  20. Adegun, O.; Balogun, I.; Adeaga, O. Precipitation Concentration Changes in Owerri and Enugu. In Special Publication of the Nigerian Association of Hydrological Sciences; Nigerian Association of Hydrological Sciences: Abuja, Nigeria, 2012. [Google Scholar]
  21. Oliver, J.E. Monthly precipitation distribution: A comparative index. Prof. Geogr. 1980, 32, 300–309. [Google Scholar] [CrossRef]
  22. Zhang, Q.; Xu, C.Y.; Marco, G.; Chen, Y.P.; Liu, C.L. Changing properties of precipitation concentration in the Pearl River Basin, China. Stoc. Environ. Res. Risk Assess. 2009, 23, 377–385. [Google Scholar] [CrossRef]
  23. Rawat, K.S.; Pa, R.K.; Singh, S.K. Rainfall variability analysis using Precipitation Concentration Index: A case study of the western agro-climatic zone of Punjab, India. Indones. J. Geogr. 2021, 53, 388–399. [Google Scholar] [CrossRef]
  24. Valli, M.; Sree, K.S.; Krishna, I.V. Analysis of precipitation concentration index and rainfall prediction in various agro-climatic zones of Andhra Pradesh, India. Int. Res. J. Environ. Sci. 2013, 2, 53–61. [Google Scholar]
  25. Martin-Vide, J. Spatial distribution of a daily precipitation concentration index in Peninsular Spain. Int. J. Climatol. 2004, 24, 959–971. [Google Scholar] [CrossRef]
  26. Li, X.; Jiang, F.; Li, L.; Wang, G. Spatial and temporal variability of precipitation concentration index, concentration degree and concentration period in Xinjiang, China. Int. J. Climatol. 2011, 31, 1679–1693. [Google Scholar] [CrossRef]
  27. Iskander, S.; Rajib, M.A.; Rahman, M. Trending regional precipitation distribution and intensity: Use of climatic indices. Atmos. Clim. Sci. 2014, 4, 385–393. [Google Scholar] [CrossRef]
  28. Mondol, M.A.H.; Mamun, A.; Jang, D. Seasonality Analysis on High- and Low-Rainfall Regions in Bangladesh using Precipitation Concentration Index. J. Clim. Res. 2017, 12, 215–226. [Google Scholar] [CrossRef]
  29. Botai, C.M.; Botai, J.O.; Adeola, A.M. Spatial distribution of temporal precipitation contrasts in South Africa. S. Afr. J. Sci. 2018, 114, 70–78. [Google Scholar] [CrossRef]
  30. Kapangaziwiri, E.; Kahinda, J.M.; Dzikiti, S.; Ramoelo, A.; Cho, M.; Mathieu, R.; Cho, M.; Mathieu, R.; Naidoo, M.; Seetal, A.; et al. Validation and verification of lawful water use in South Africa: An overview of the process in the KwaZulu-Natal Province. Phys. Chem. Earth Parts A/B/C 2018, 105, 274–282. [Google Scholar] [CrossRef]
  31. Maponya, P.; Mpandeli, S.; Oduniyi, S. Climate change awareness in Mpumalanga province, South Africa. J. Agric. Sci. 2013, 5, 273. [Google Scholar] [CrossRef]
  32. Rusere, F.; Hunter, L.; Collinson, M.; Twine, W. Nexus between summer climate variability and household food security in rural Mpumalanga Province, South Africa. Environ. Dev. 2023, 47, 100892. [Google Scholar] [CrossRef]
  33. Malatji, D.P.; Tsotetsi, A.M.; Muchadeyi, F.C.; Van Marle-Koster, E. A description of village chicken production systems and prevalence of gastrointestinal parasites: Case studies in Limpopo and KwaZulu-Natal provinces of South Africa. Onderstepoort J. Vet. Res. 2016, 83, 1–8. [Google Scholar] [CrossRef] [PubMed]
  34. Mann, H.B. Non-parametric test against trend. Econometrica 1945, 13, 245–259. [Google Scholar] [CrossRef]
  35. Kendall, M.G. Rank Correlation Methods, 4th ed.; Charles Griffin: London, UK, 1975. [Google Scholar]
  36. Gao, F.; Wang, Y.; Chen, X.; Yang, W. Trend analysis of rainfall time series in Shanxi Province, Northern China (1957–2019). Water 2020, 12, 2335. [Google Scholar] [CrossRef]
  37. Wang, F.; Shao, W.; Yu, H.; Kan, G.; He, X.; Zhang, D.; Ren, M.; Wang, G. Re-evaluation of the power of the Mann-Kendall test for detecting monotonic trends in hydrometeorological time series. Front. Earth Sci. 2020, 8, 14. [Google Scholar] [CrossRef]
  38. Mukaka, M.M. Statistics corner: A guide to appropriate use of correlation coefficient in medical research. Malawi Med. J. 2012, 24, 69–71. [Google Scholar] [PubMed]
  39. Shrestha, S.; Yao, T.D.; Kattel, D.B.; Devkota, L.P. Precipitation Characteristics of Two Complex Mountain River Basins on the Southern Slopes of the Central Himalayas. Theor. Appl. Climatol. 2019, 138, 1159–1178. [Google Scholar] [CrossRef]
  40. Yang, L.; Villarini, G.; Smith, J.A.; Tian, F.Q.; Hu, H.P. Changes in Seasonal Maximum Daily Precipitation in China over the Period 1961–2006. Int. J. Climatol. 2013, 33, 1646–1657. [Google Scholar] [CrossRef]
  41. Weldon, D.; Reason, C.J. Variability of rainfall characteristics over the South Coast region of South Africa. Theor. Appl. Climatol. 2014, 115, 177–185. [Google Scholar] [CrossRef]
  42. Nel, W.; Sumner, P.D. Trends in rainfall total and variability (1970–2000) along the KwaZulu-Natal Drakensberg foothills. S. Afr. Geogr. J. 2006, 88, 130–137. [Google Scholar] [CrossRef]
  43. De Luis, M.; Gonzalez-Hidalgo, J.C.; Brunetti, M.; Longares, L.A. Precipitation concentration changes in Spain 1946–2005. Nat. Hazards Earth Syst. Sci. 2011, 11, 1259–1265. [Google Scholar] [CrossRef]
  44. Arsiso, B.K.; Tsidu, G.M.; Stoffberg, G.H.; Tadesse, T. Climate change and population growth impacts on surface water supply and demand of Addis Ababa, Ethiopia. Clim. Risk Manag. 2017, 18, 21–33. [Google Scholar] [CrossRef]
  45. Hagemann, S.; Chen, C.; Clark, D.B.; Folwell, S.; Gosling, S.N.; Haddeland, I.; Hanasaki, N.; Heinke, J.; Ludwig, F.; Voss, F.; et al. Climate change impact on available water resources obtained using multiple global climate and hydrology models. Earth Syst. Dyn. 2013, 4, 129–144. [Google Scholar] [CrossRef]
  46. Simanjuntak, C.; Gaiser, T.; Ahrends, H.E.; Ceglar, A.; Singh, M.; Ewert, F.; Srivastava, A.K. Impact of climate extreme events and their causality on maize yield in South Africa. Sci. Rep. 2023, 13, 12462. [Google Scholar] [CrossRef]
  47. Salameh, A.A. Using the precipitation concentration index for characterizing the rainfall distribution in the Levant. J. Water Clim. Change 2024, 15, 1945–1960. [Google Scholar] [CrossRef]
  48. Benetó, P.; Khodayar, S. On the need for improved knowledge on the regional-to-local precipitation variability in eastern Spain under climate change. Atmos. Res. 2023, 290, 106795. [Google Scholar] [CrossRef]
  49. Zhang, K.; Ya, Y.; Qian, X.; Wang, J. Various characteristics of precipitation concentration index and its cause analysis in China between 1960 and 2016. Int. J. Climatol. 2019, 39, 4648–4658. [Google Scholar] [CrossRef]
  50. Bhattacharyya, S.; Sreekesh, S.; King, A. Characteristics of extreme rainfall in different gridded datasets over India during 1983–2015. Atmos. Res. 2022, 267, 105930. [Google Scholar] [CrossRef]
  51. Passos, M.V.; Kan, J.-C.; Destouni, G.; Barquet, K.; Kalantari, Z. Identifying Hotspots of Heat Waves, Droughts, Floods, and their Co-Occurrences. Res. Sq. 2024. preprint. [Google Scholar] [CrossRef]
  52. Mukhawana, M.B.; Kanyerere, T.; Kahler, D.; Masilela, N.S.; Lalumbe, L.; Umunezero, A.A. Hydrological drought assessment using the Standardized Groundwater Index and the Standardized Precipitation Index in the Berg River Catchment, South Africa. J. Hydrol. Reg. Stud. 2024, 53, 101779. [Google Scholar] [CrossRef]
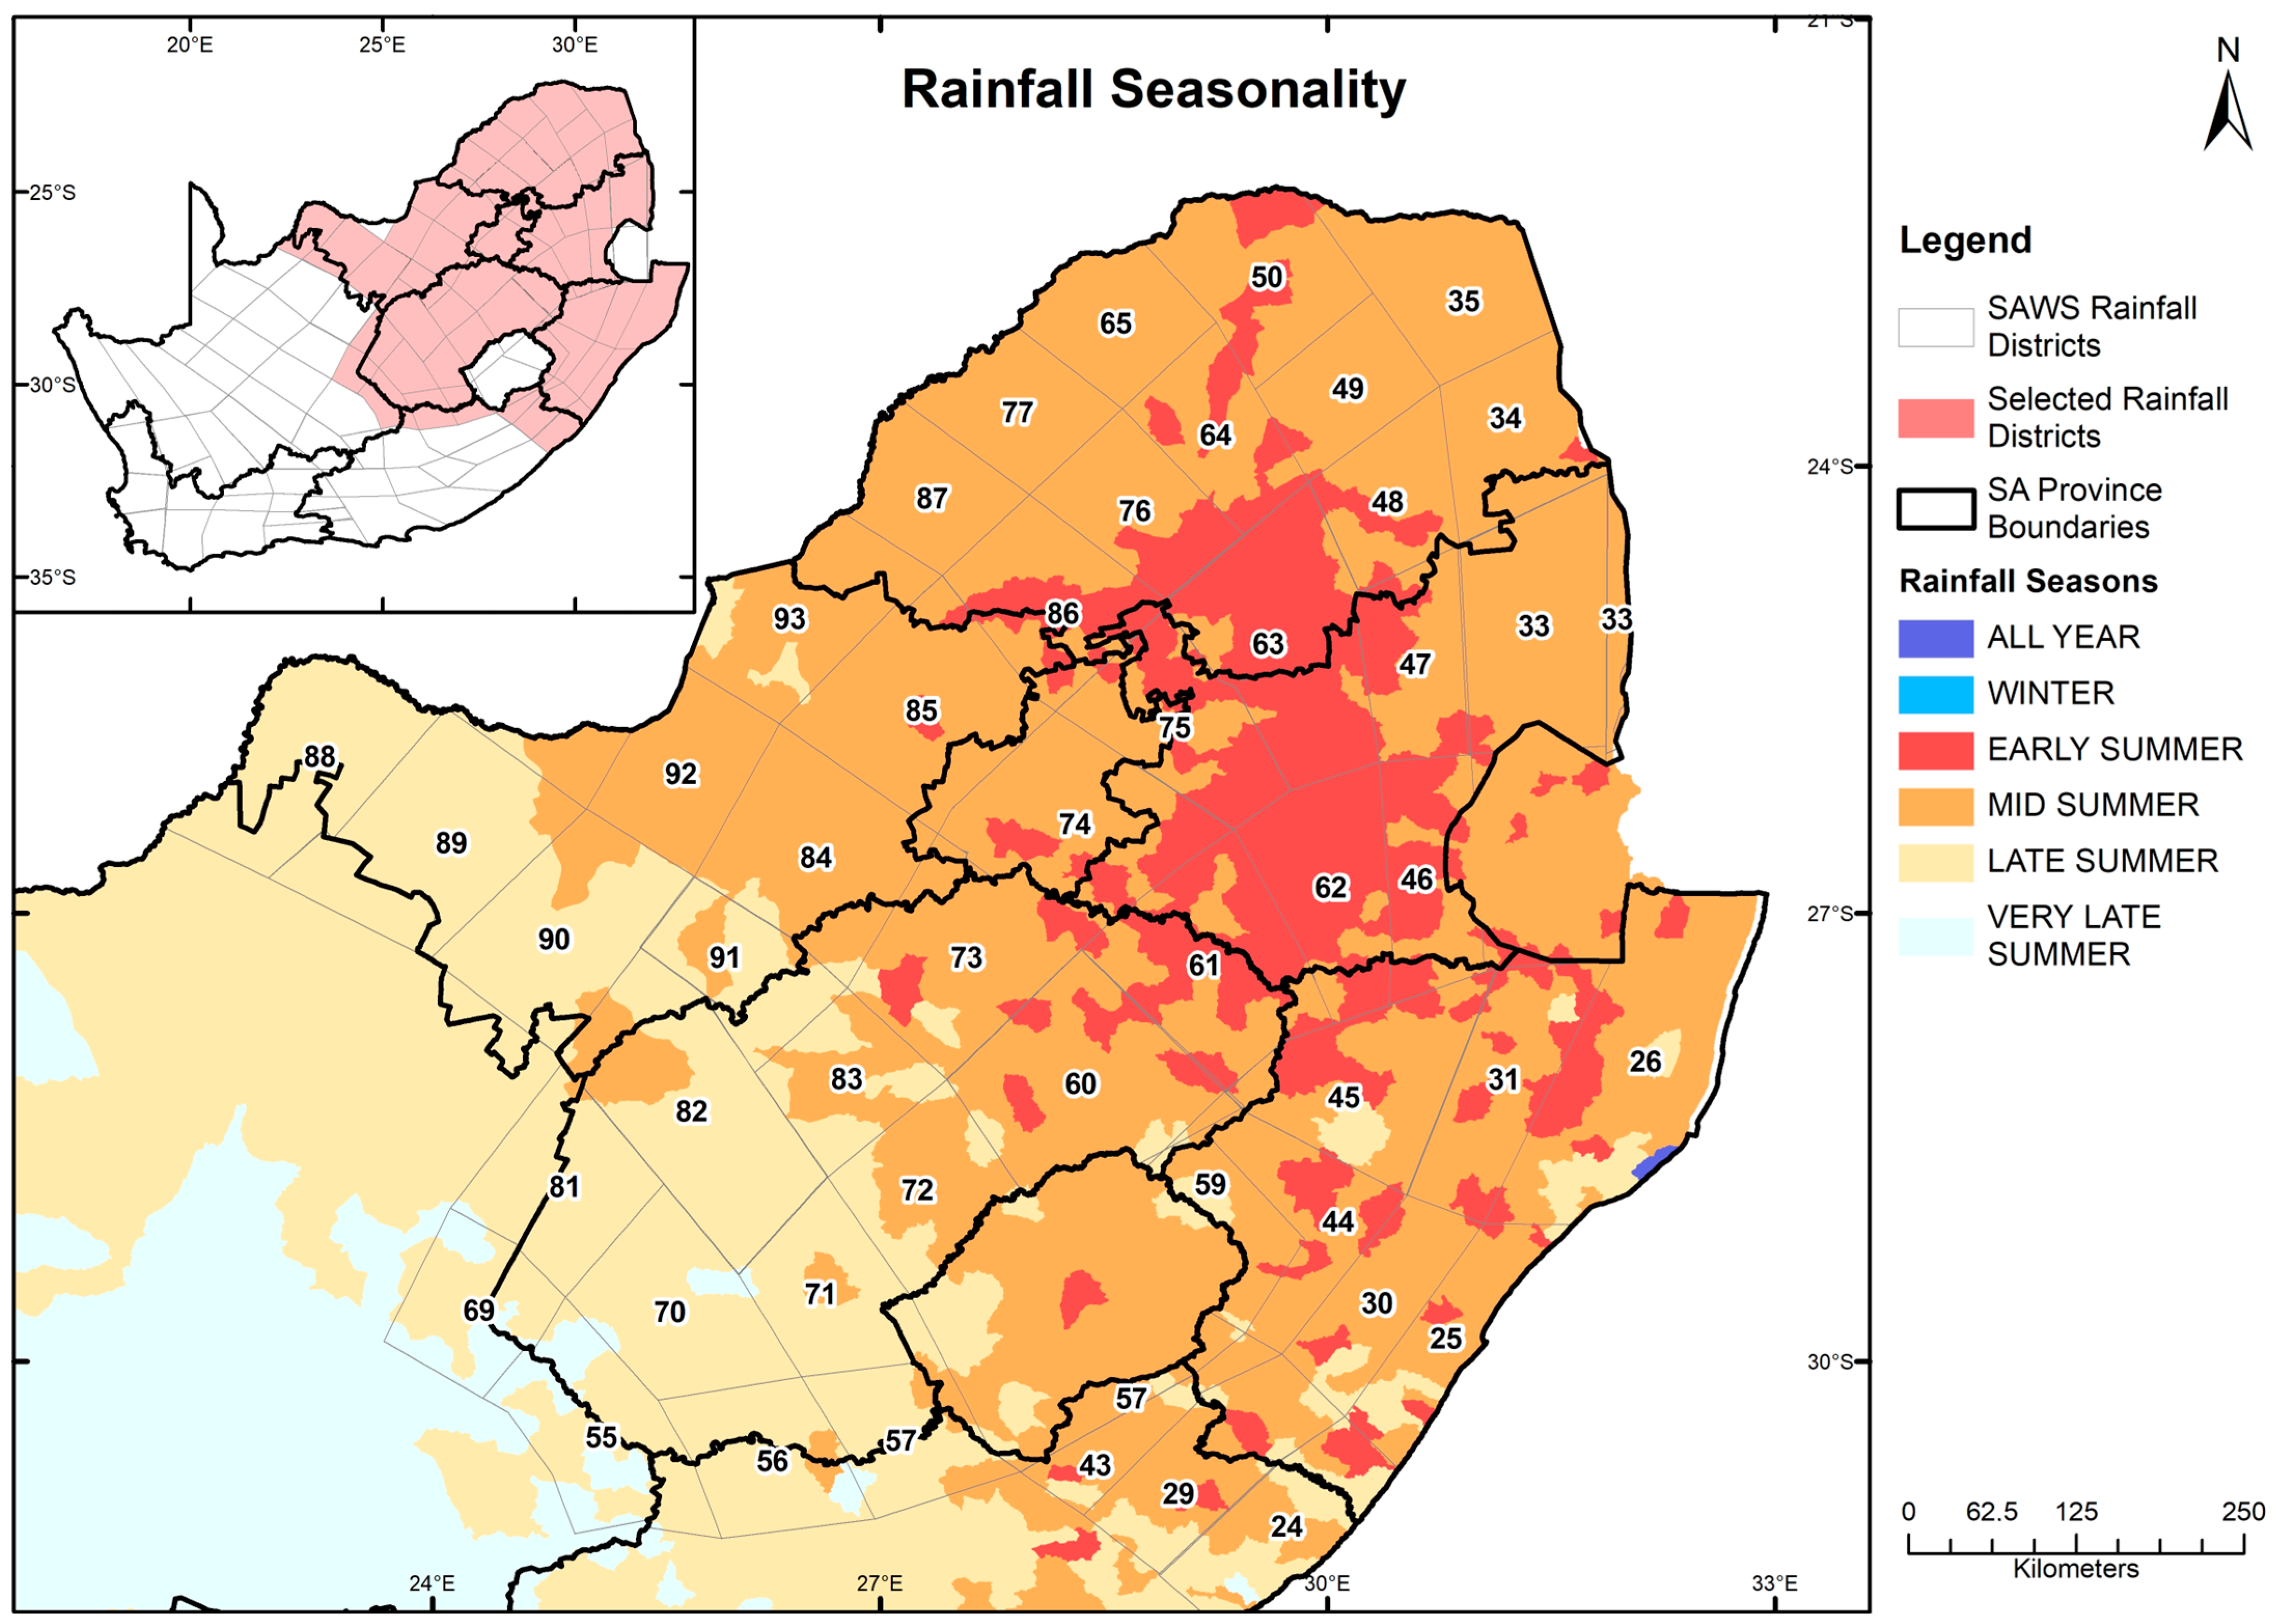
Figure 1. The study area shows rainfall seasons and the distribution of the rainfall districts across the selected summer rainfall regions.
Hydrology 12 00136 g001
Figure 2. Evolution of annual PCI averages per province and linear regression: (a) Gauteng (G), North-West (NW) and Free State (FS) and (b) Limpopo (L), Mpumalanga (M) and KwaZulu-Natal (KZN) provinces.
Hydrology 12 00136 g002
Figure 3. Spatial distribution of annual PCI values.
Hydrology 12 00136 g003
Figure 4. (a) Decadal PCI averages and (b) decadal PCI change.
Hydrology 12 00136 g004
Figure 5. Percentage of yearly frequency per centroid based on: (a) low precipitation concentration—PCI ≤ 10, (b) moderate—10 < PCI ≤ 15 and (c) irregular precipitation distribution—16 < PCI ≤ 20.
Hydrology 12 00136 g005
Figure 6. Spatial distribution of the seasonal PCI based on 1979–2023 investigated period for (a) 9 months, (b) supra-wet, (c) December–January–February (DJF), (d) March–April–May (MAM), (e) June–July–August (JJA) and (f) September–October–November (SON).
Hydrology 12 00136 g006
Figure 7. Spatial distribution of trends and significant trends for: (a) annual, (b) 9 months and (c) supra-seasonal/summer half of the year PCI values.
Hydrology 12 00136 g007
Figure 8. Spatial distribution of seasonal PCI trends based on the 1979–2023 rainfall data.
Hydrology 12 00136 g008
Figure 9. Pearson’s correlation coefficient between PCI and annual precipitation across the provinces: KwaZulu-Natal (KZN), Fre State (FS), Mpumalanga (M), North West (NW), Limpopo (L) and Gauteng (G).
Hydrology 12 00136 g009
Table 1. Characteristics of selected rainfall districts across the study area: KZN (KwaZulu-Natal), M (Mpumalanga), L (Limpopo), G (Gauteng), FS (Free State) and NW (North-West) provinces. Bold indicates statistically significant trends.
IDSProvinceLatitudeLongitudeAnnual Rainfall [mm]Trends
dis24KZN−31.13329.69911100.040
dis25KZN−29.87930.861935−0.007
dis26KZN−28.00232.174916−0.010
dis29KNZ−30.72729.3319080.037
dis30KZN−29.64230.469845−0.009
dis31KZN−28.25531.297844−0.024
dis33M−25.18231.493685−0.018
dis34L−23.85131.307454−0.021
dis35L−22.68430.761521−0.020
dis43KZN−30.39728.8698670.009
dis44KZN−29.03529.782932−0.008
dis45KZN−28.15630.465733−0.032
dis46M−26.77830.8518650.001
dis47M−25.26130.7061009−0.023
dis48L−24.13530.524684−0.017
dis49L−23.40330.168976−0.009
dis50L−22.59429.516454−0.021
dis55FS−30.53525.223384−0.015
dis56FS−30.68226.392502−0.017
dis57KZN/FS−30.48527.339635−0.085
dis59KZN−29.20728.8221131−0.001
dis60FS−28.12328.438673−0.016
dis61FS/M−27.45729.237656−0.009
dis62M−26.87930.009735−0.002
dis63L/M−25.19229.802635−0.014
dis64L−23.76829.338444−0.021
dis65L−22.96728.602363−0.044
dis69FS−29.6624.2753360.007
dis70FS−29.65925.7864800.000
dis71FS−29.55326.8555980.003
dis72FS−28.96127.535655−0.020
dis73FS−27.27427.506614−0.029
dis74G−26.47228.317694−0.001
dis75G/M−25.85729.064684−0.018
dis76L−24.31428.768566−0.016
dis77L−23.57127.948426−0.027
dis81FS−28.81124.898401−0.004
dis82FS−28.29825.827510−0.006
dis83FS−28.02626.797538−0.038
dis84NW−26.51926.573589−0.018
dis85G/NW−25.6527.344625−0.007
dis86L/NW−24.91528.128591−0.025
dis87L−24.18627.217484−0.032
dis88NW−25.94523.195290−0.057
dis89NW−26.52624.0134190.001
dis90NW−27.08624.893474−0.019
dis91NW−27.28425.978528−0.003
dis92NW−25.92525.7085310.001
dis93NW−24.96826.454521−0.005
Table 2. Range and classification of Precipitation Concentration Index values.
PCI ValueSignificance
PCI ≤ 10Uniform monthly precipitation distribution (low precipitation concentration)
10 < PCI ≤ 15Moderate Precipitation Distribution
16 < PCI ≤ 20Irregular Precipitation Distribution
PCI > 20Strongly irregular precipitation distribution (high precipitation concentration)
Table 3. Description of Pearson correlation coefficient.
Correlation Coefficient RangeStrength of
Correlation
Correlation Type or
Direction
−0.7 to −1.0Very strongNegative
−0.5 to −0.7StrongNegative
−0.3 to −0.5ModerateNegative
0 to −0.3WeakNegative
0NoneZero
0 to 0.3WeakPositive
0.3 to 0.5ModeratePositive
0.5 to 0.7StrongPositive
0.7 to 1.0Very strongPositive
Table 4. Total rainfall districts that exhibited increasing/decreasing decadal PCI average.
DecadeTotal Rainfall in Rainfall Districts with Increased PCITotal Rainfall in Rainfall Districts with Decreased PCI
1979–1989341
1990–2000 3811
2001–2011 1039
2012–2023 3910
Disclaimer/Publisher’s Note: The statements, opinions and data contained in all publications are solely those of the individual author(s) and contributor(s) and not of MDPI and/or the editor(s). MDPI and/or the editor(s) disclaim responsibility for any injury to people or property resulting from any ideas, methods, instructions or products referred to in the content.