


Study on the Surface Water Chemical Composition and Water Quality Pollution Characteristics of the Shiyang River Basin, China

Abstract
1. Introduction
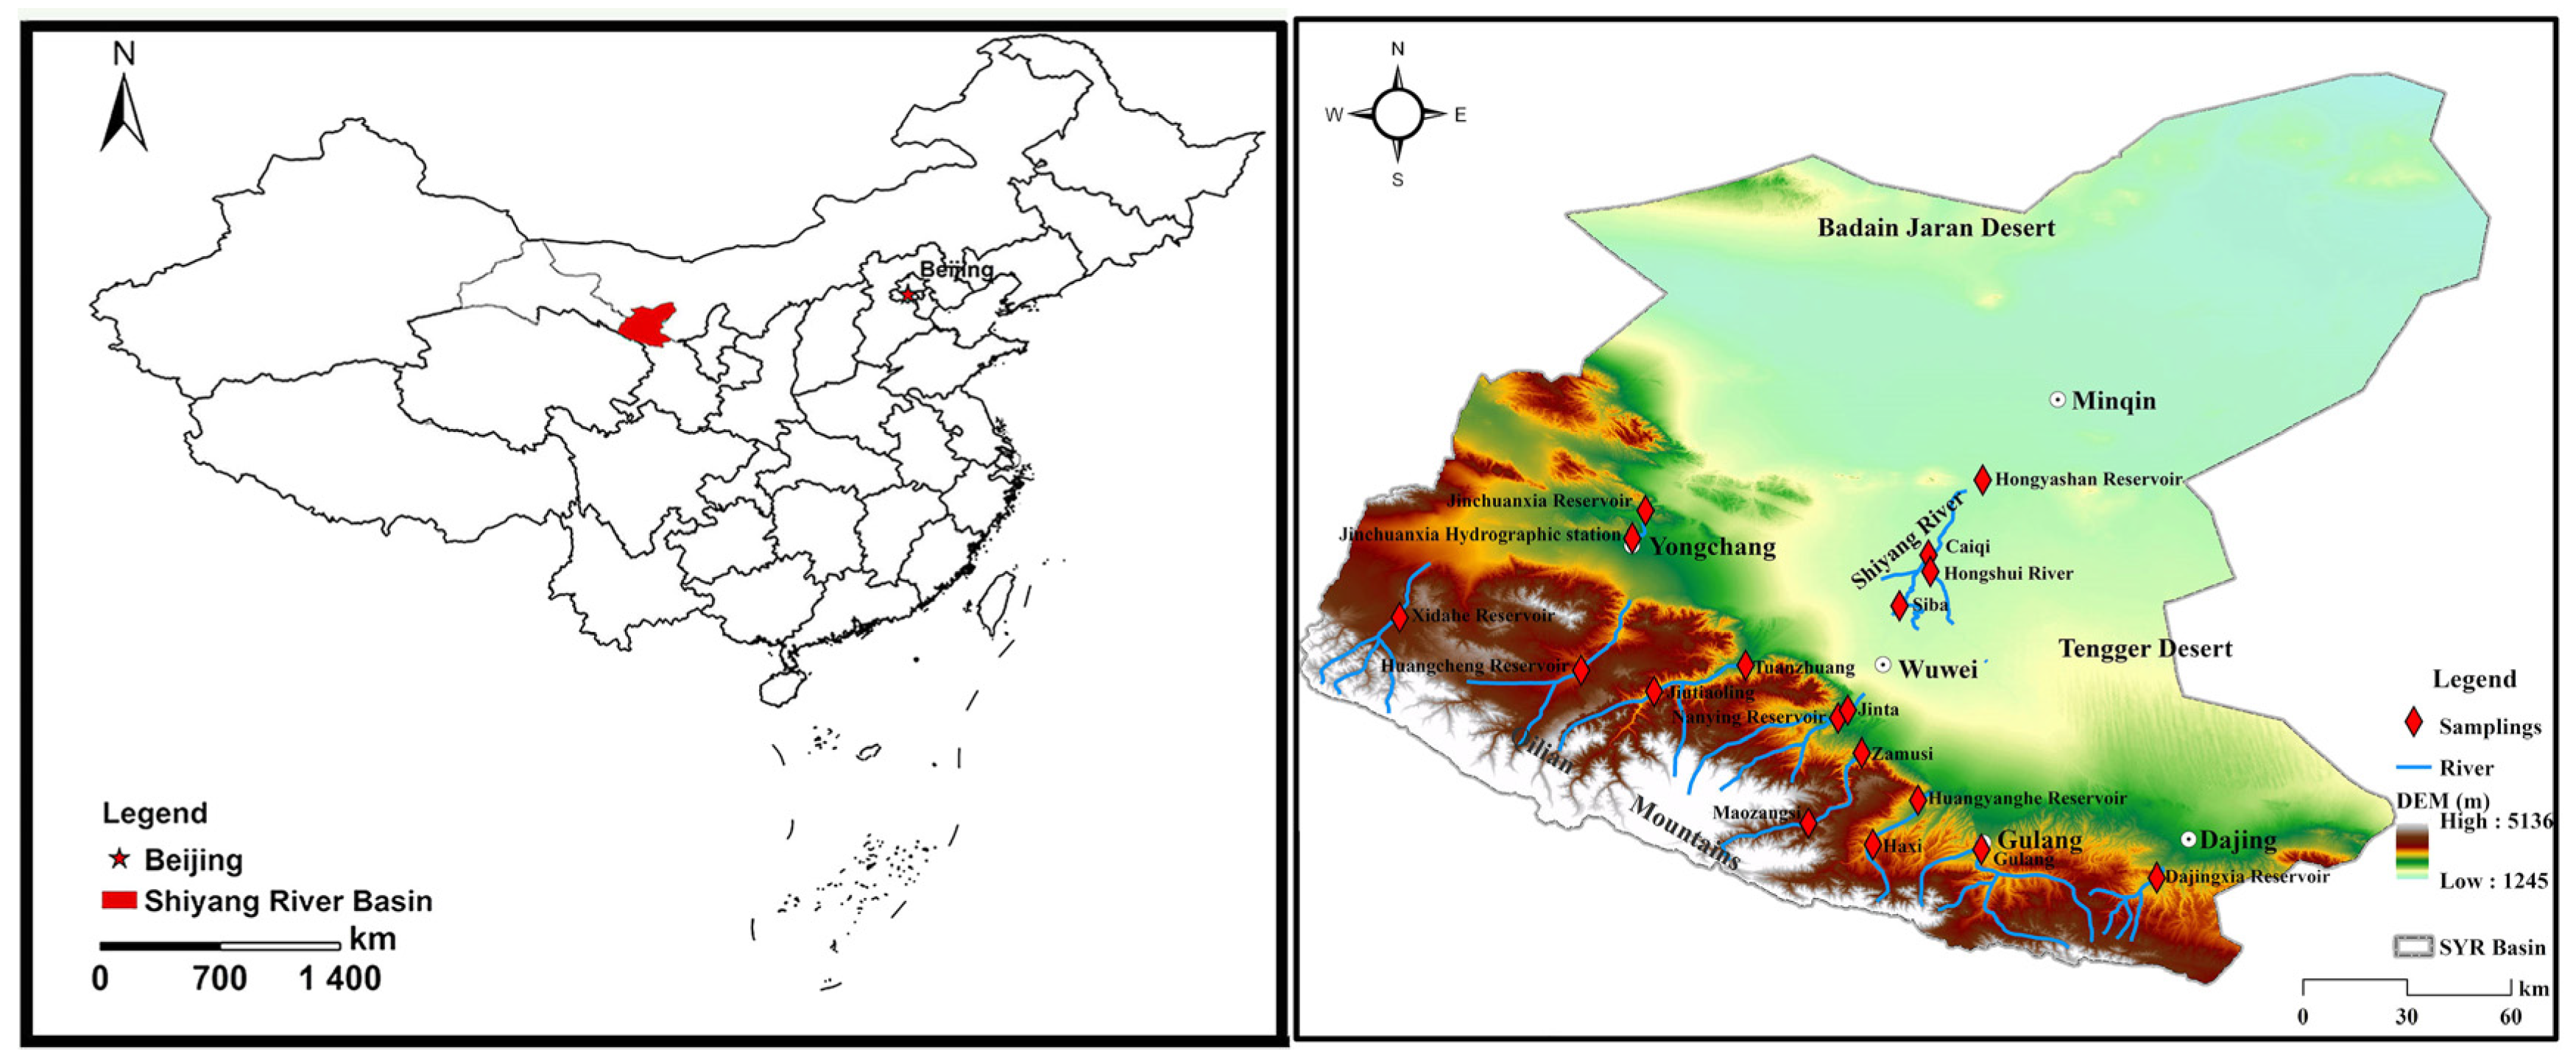
2. Study Area
3. Materials and Methods
3.1. Sample Collection and Testing
3.2. Methods
4. Results and Discussion
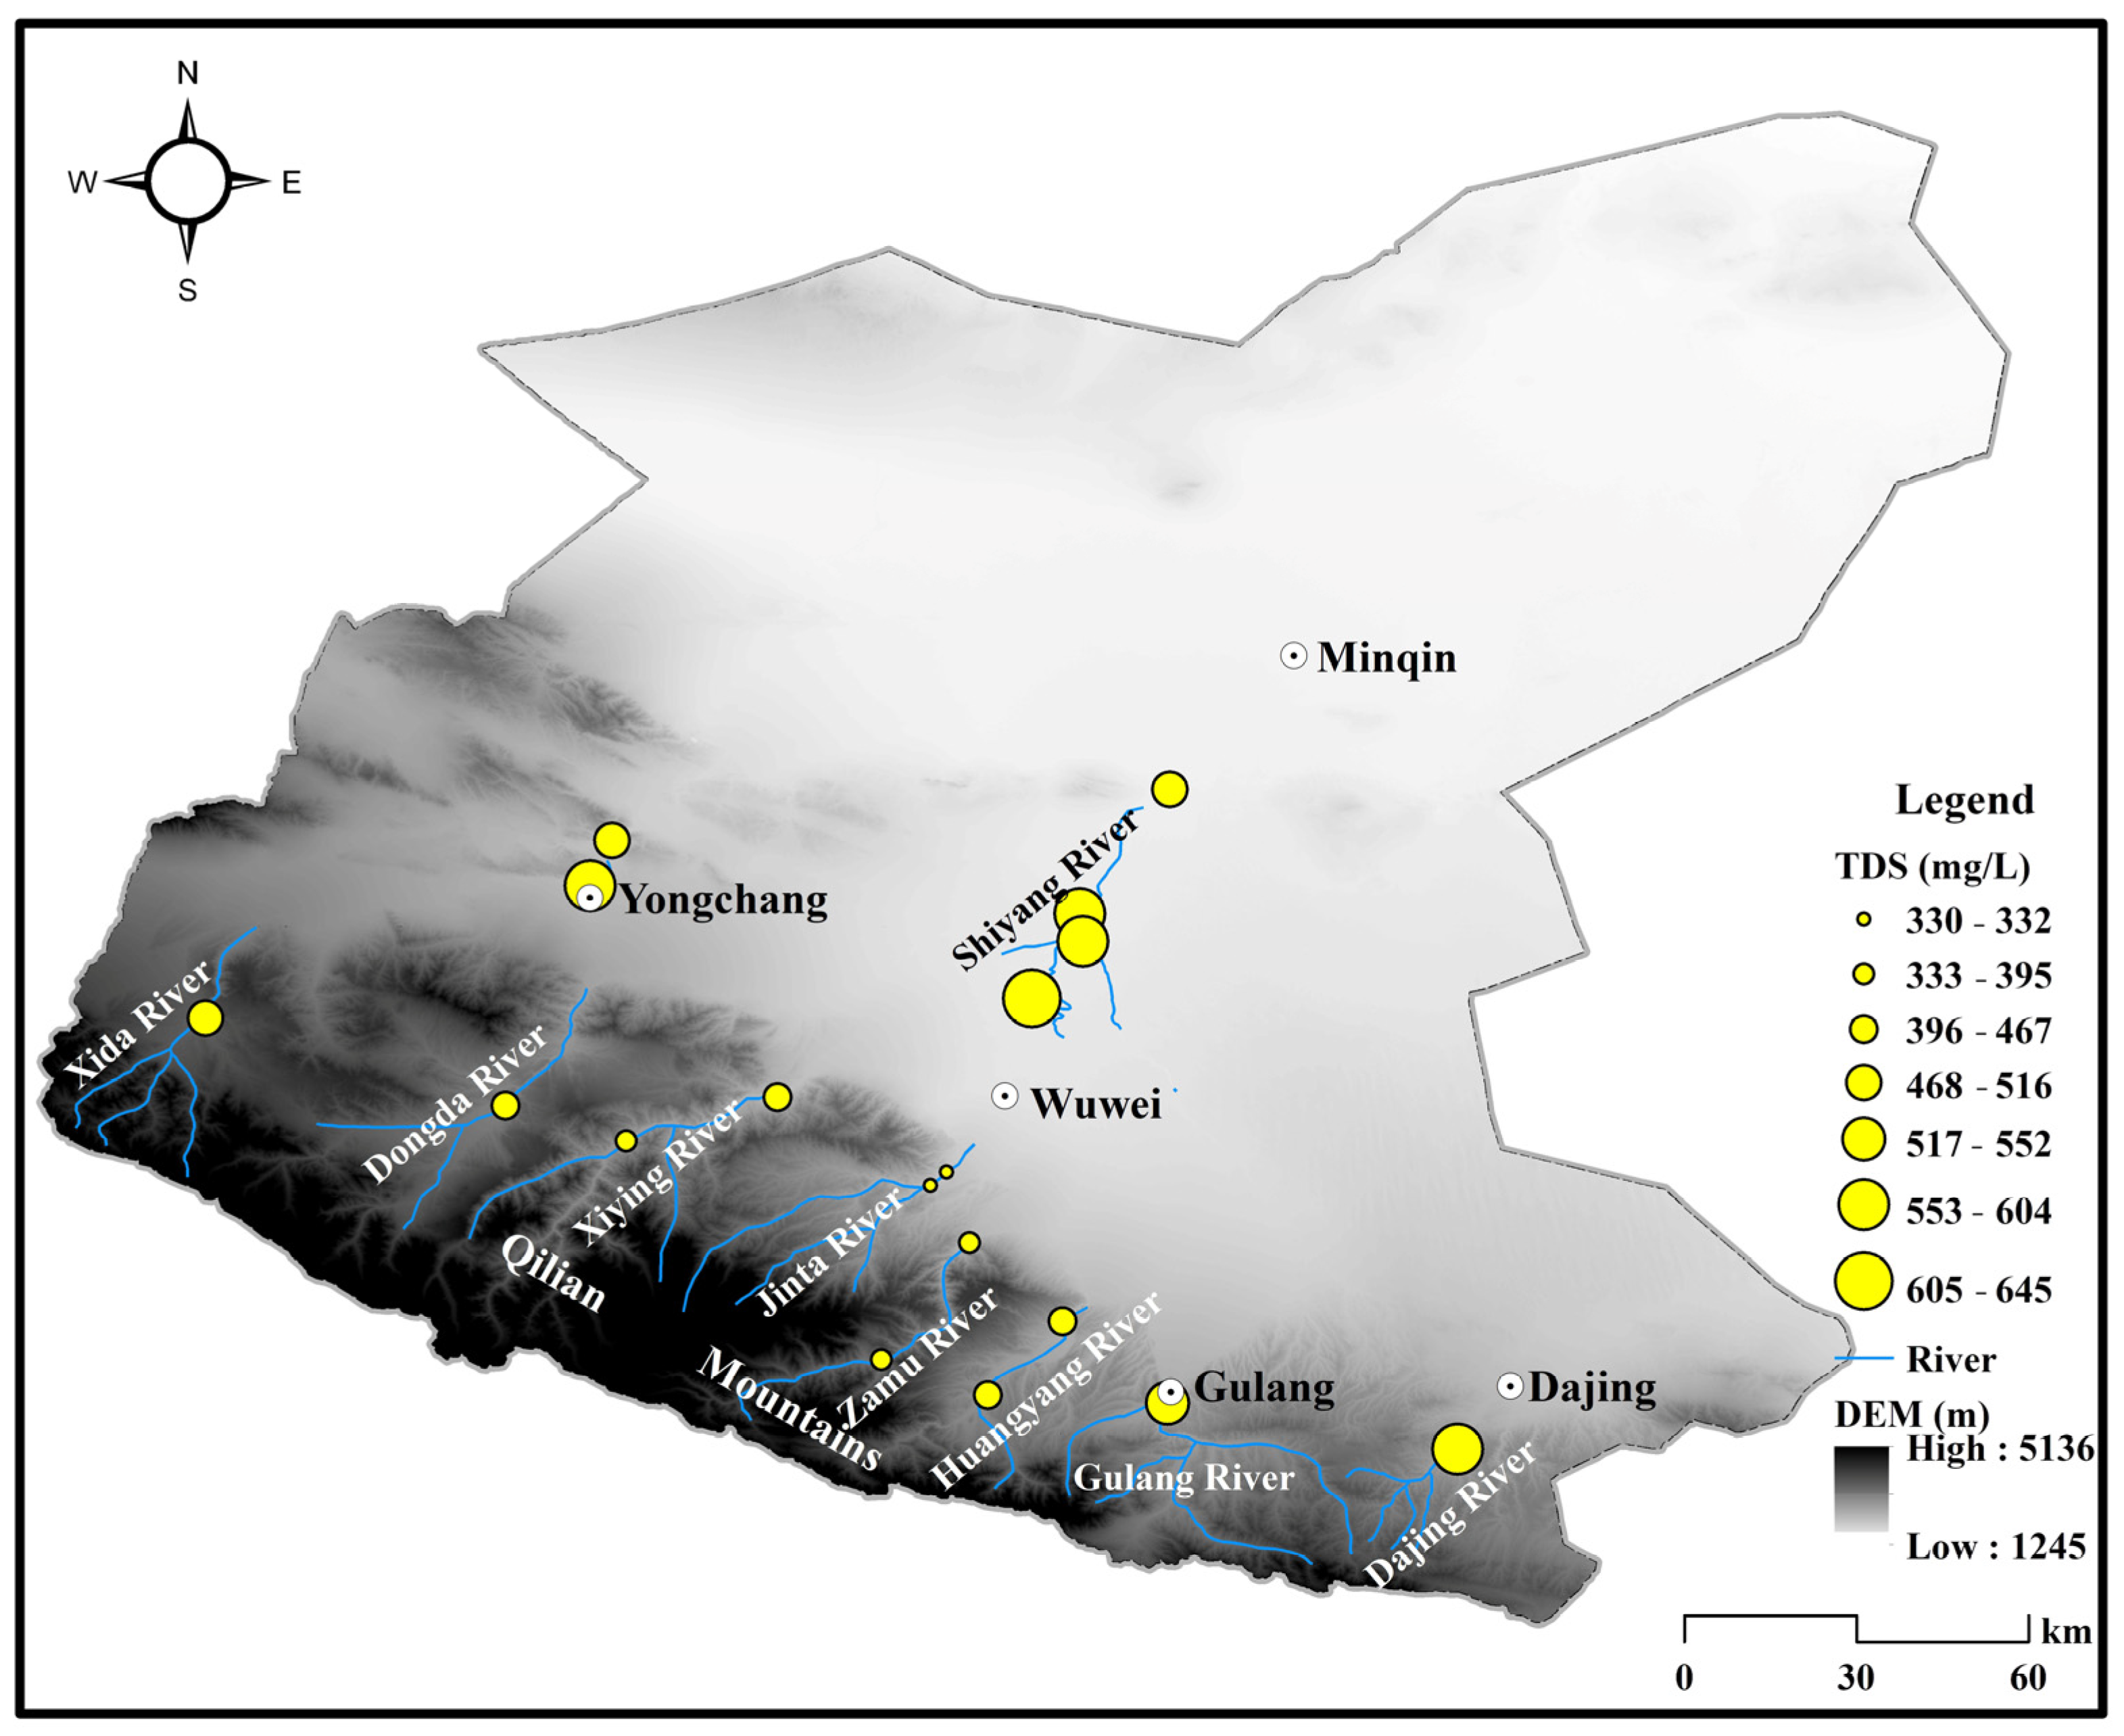
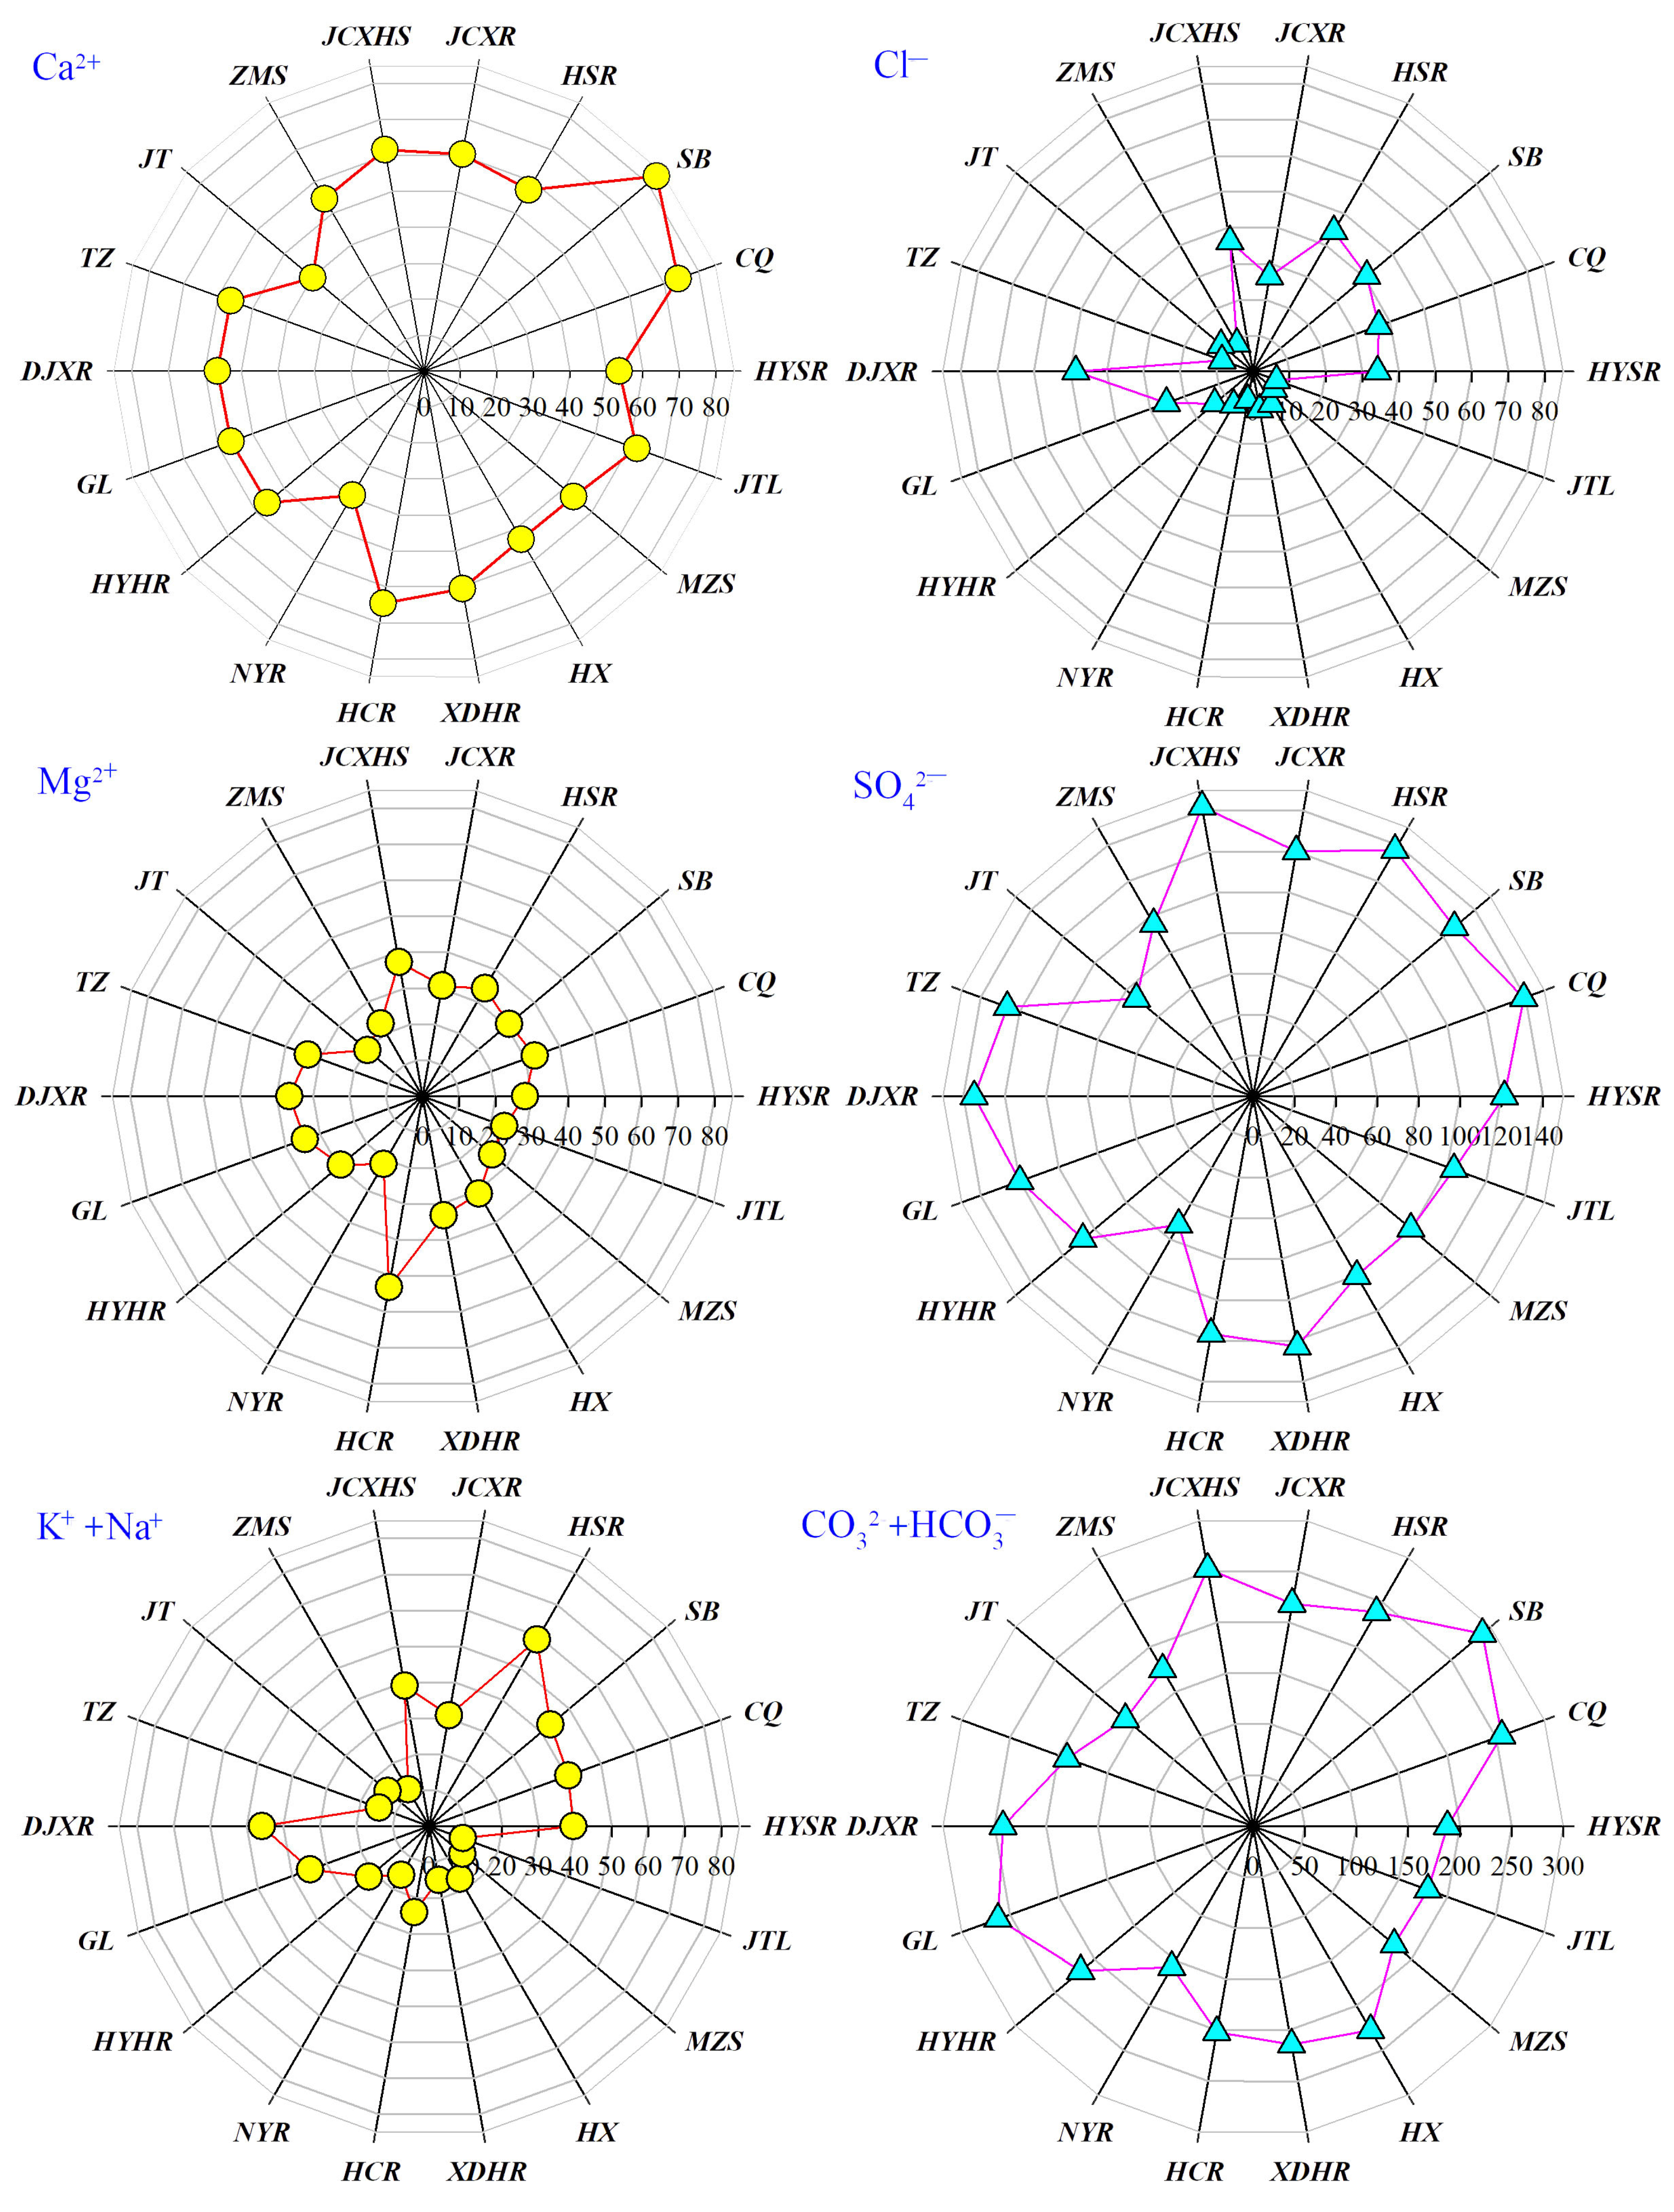
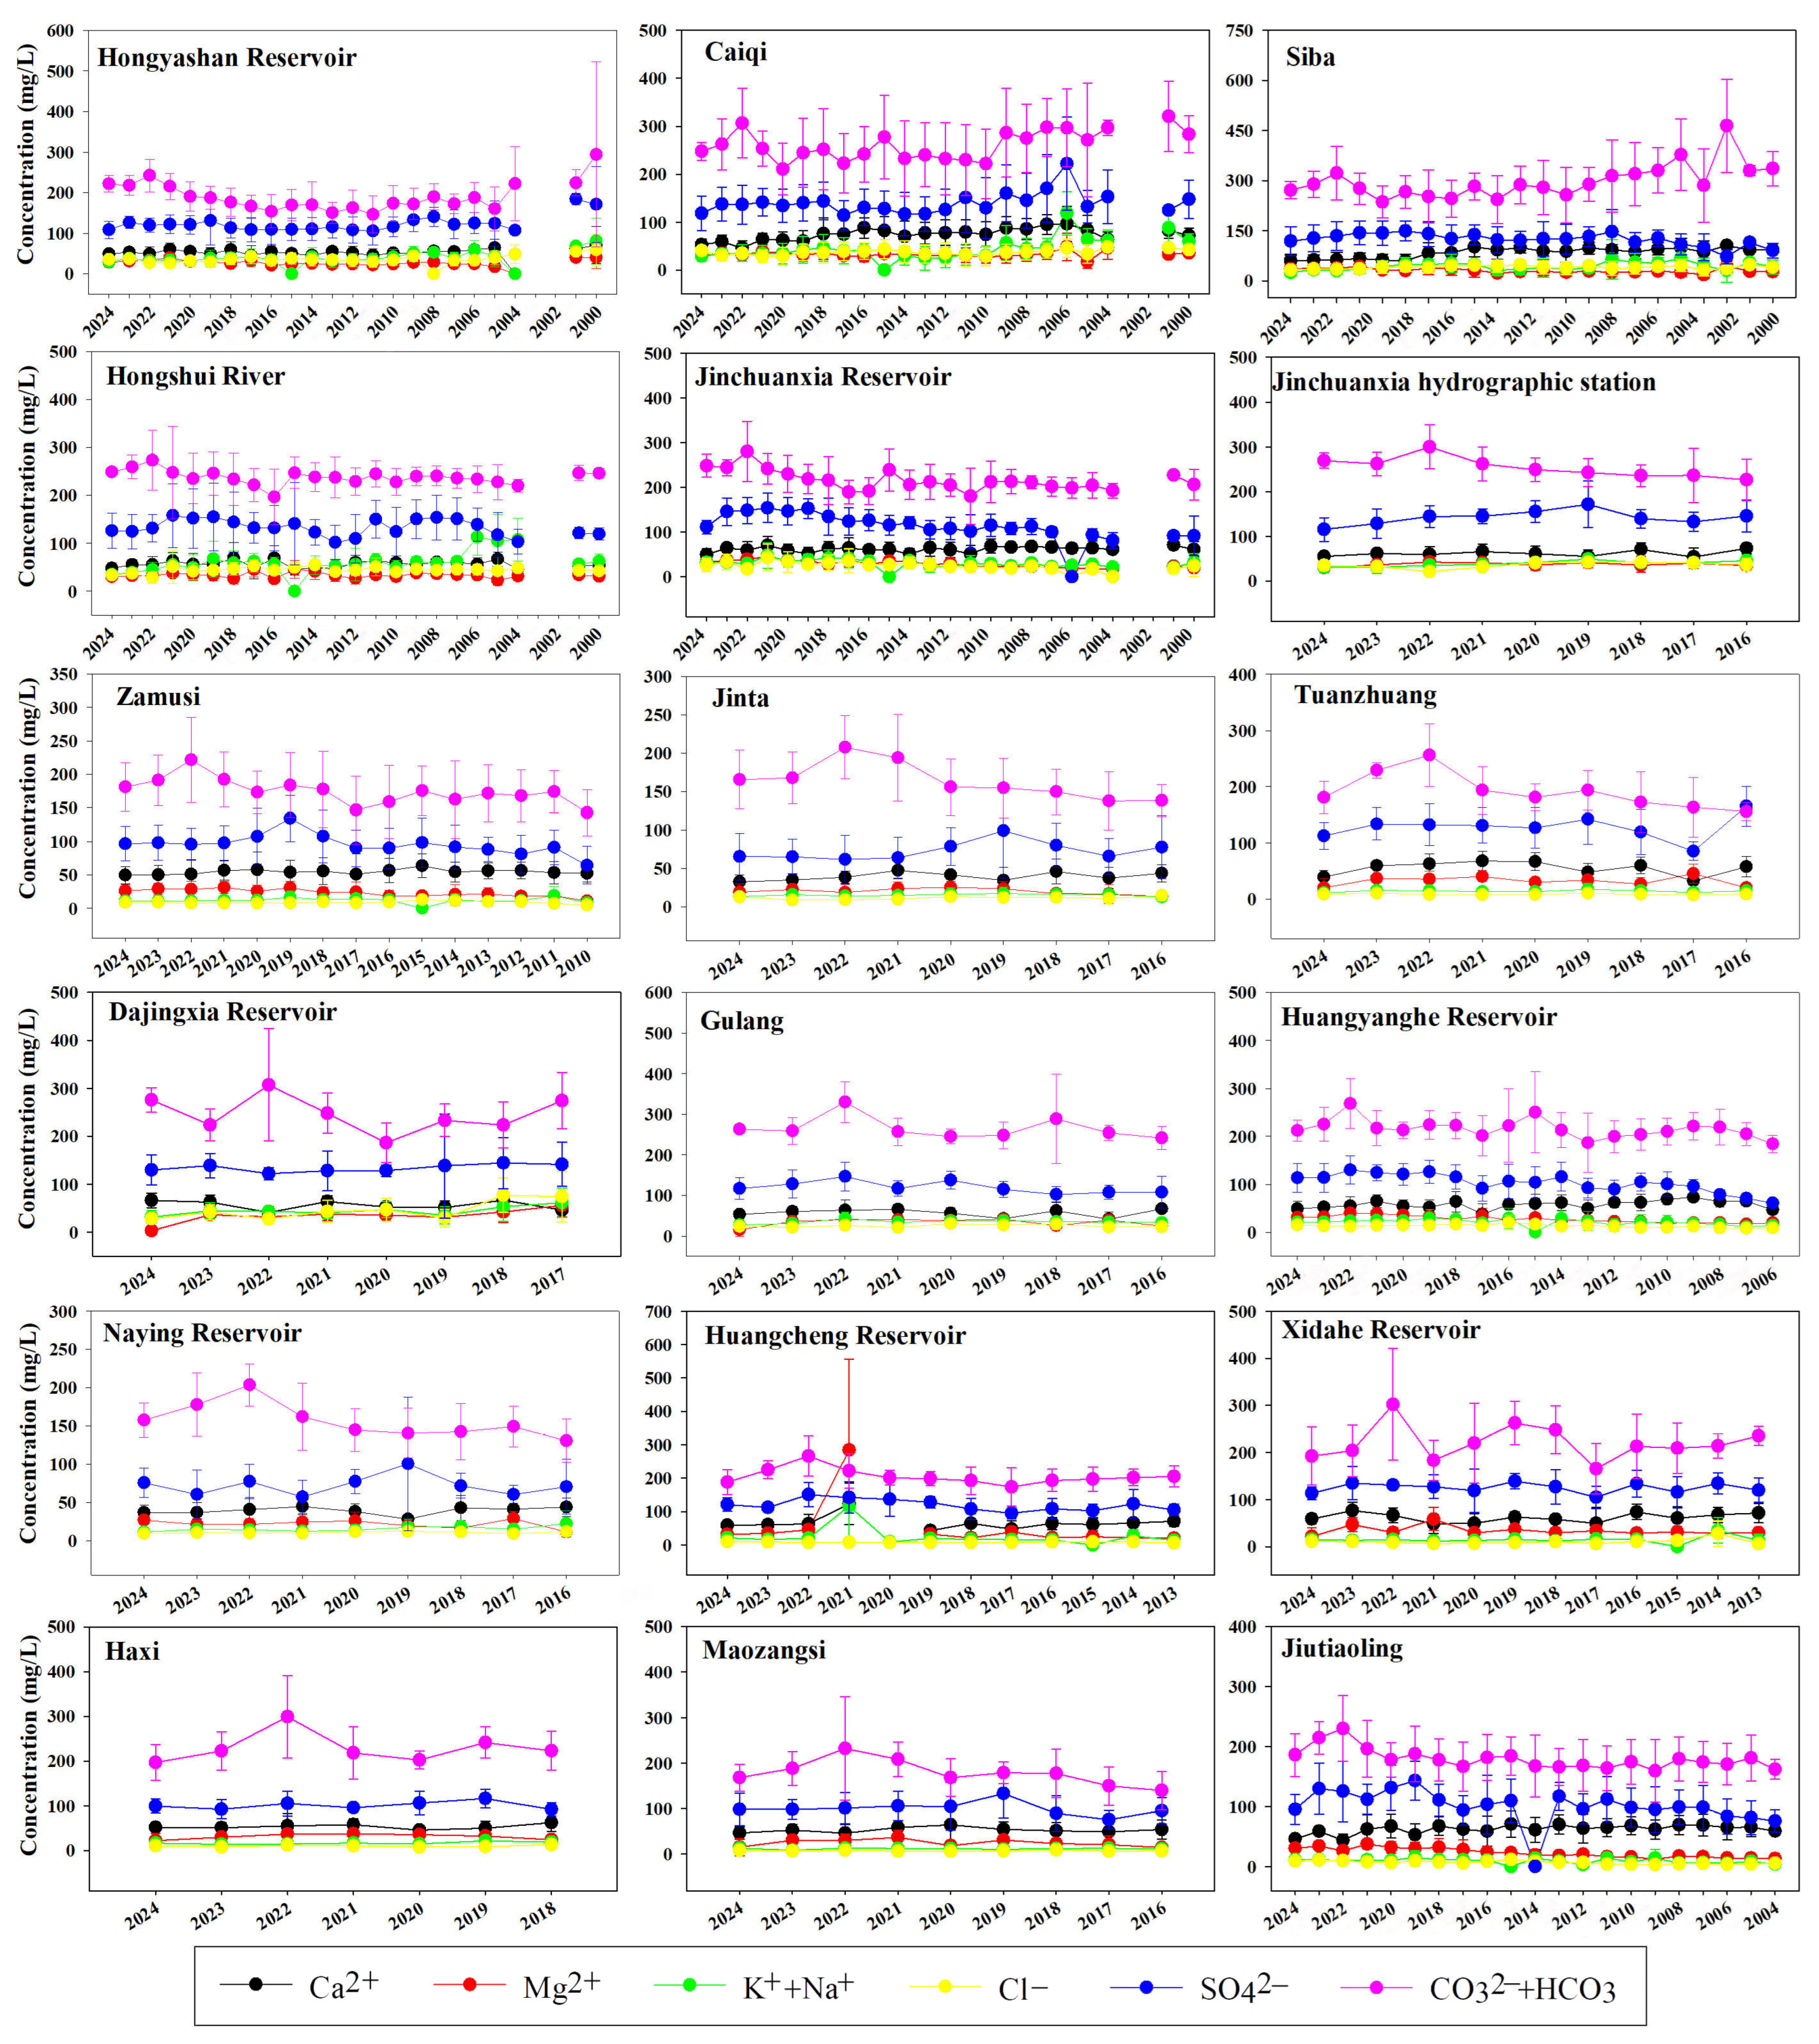
4.1. Spatiotemporal Distribution Characteristics of Surface Water Chemistry
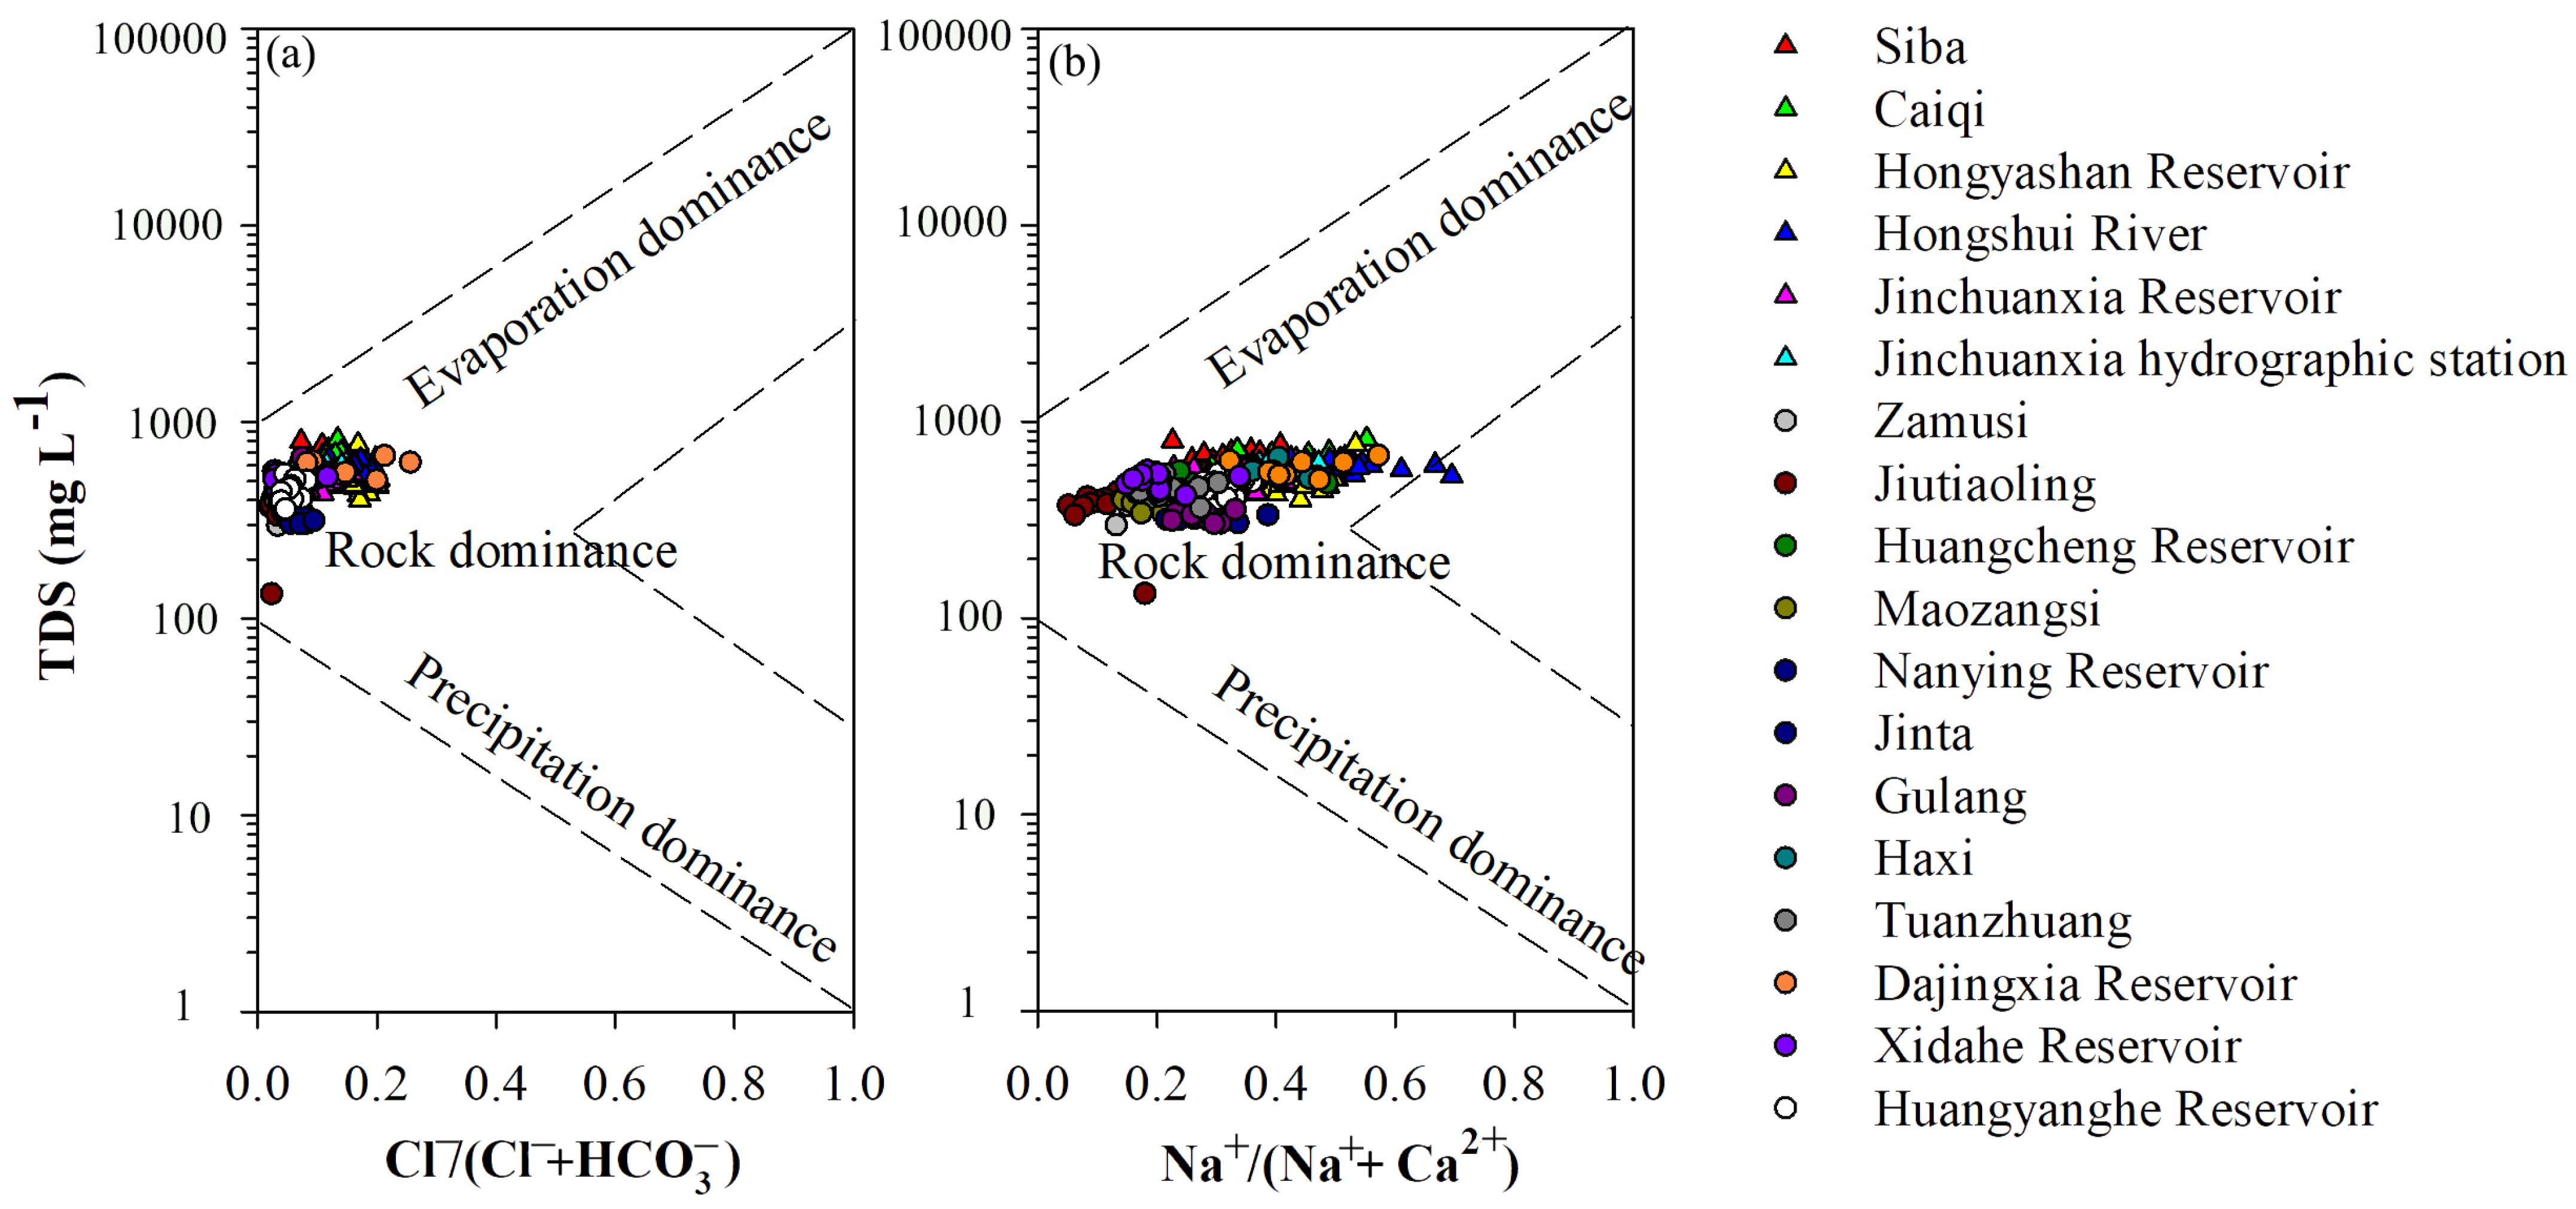
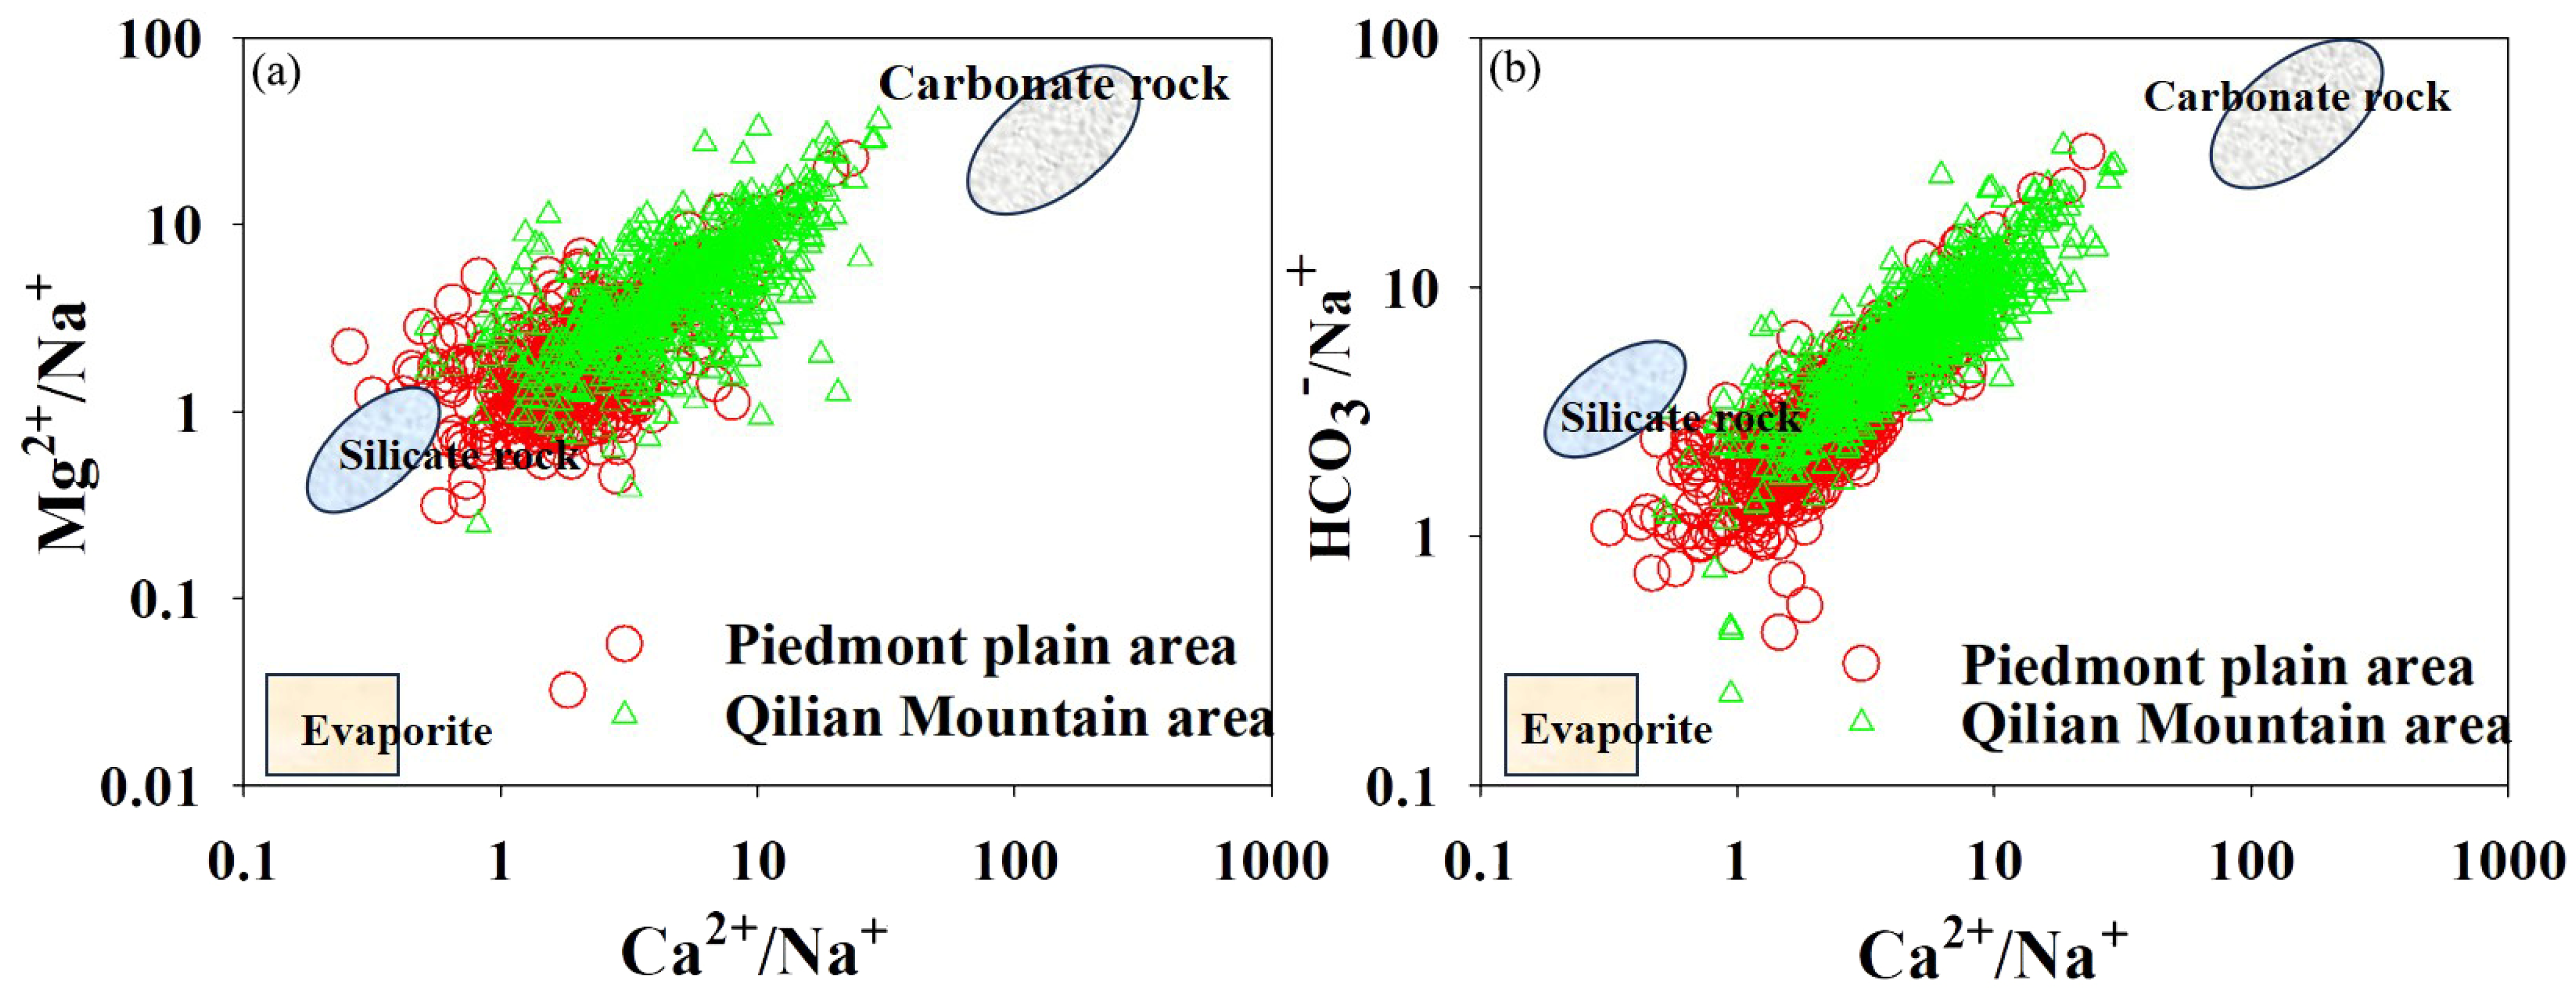
4.2. Surface Water Hydrochemical Types and Evolution Trends
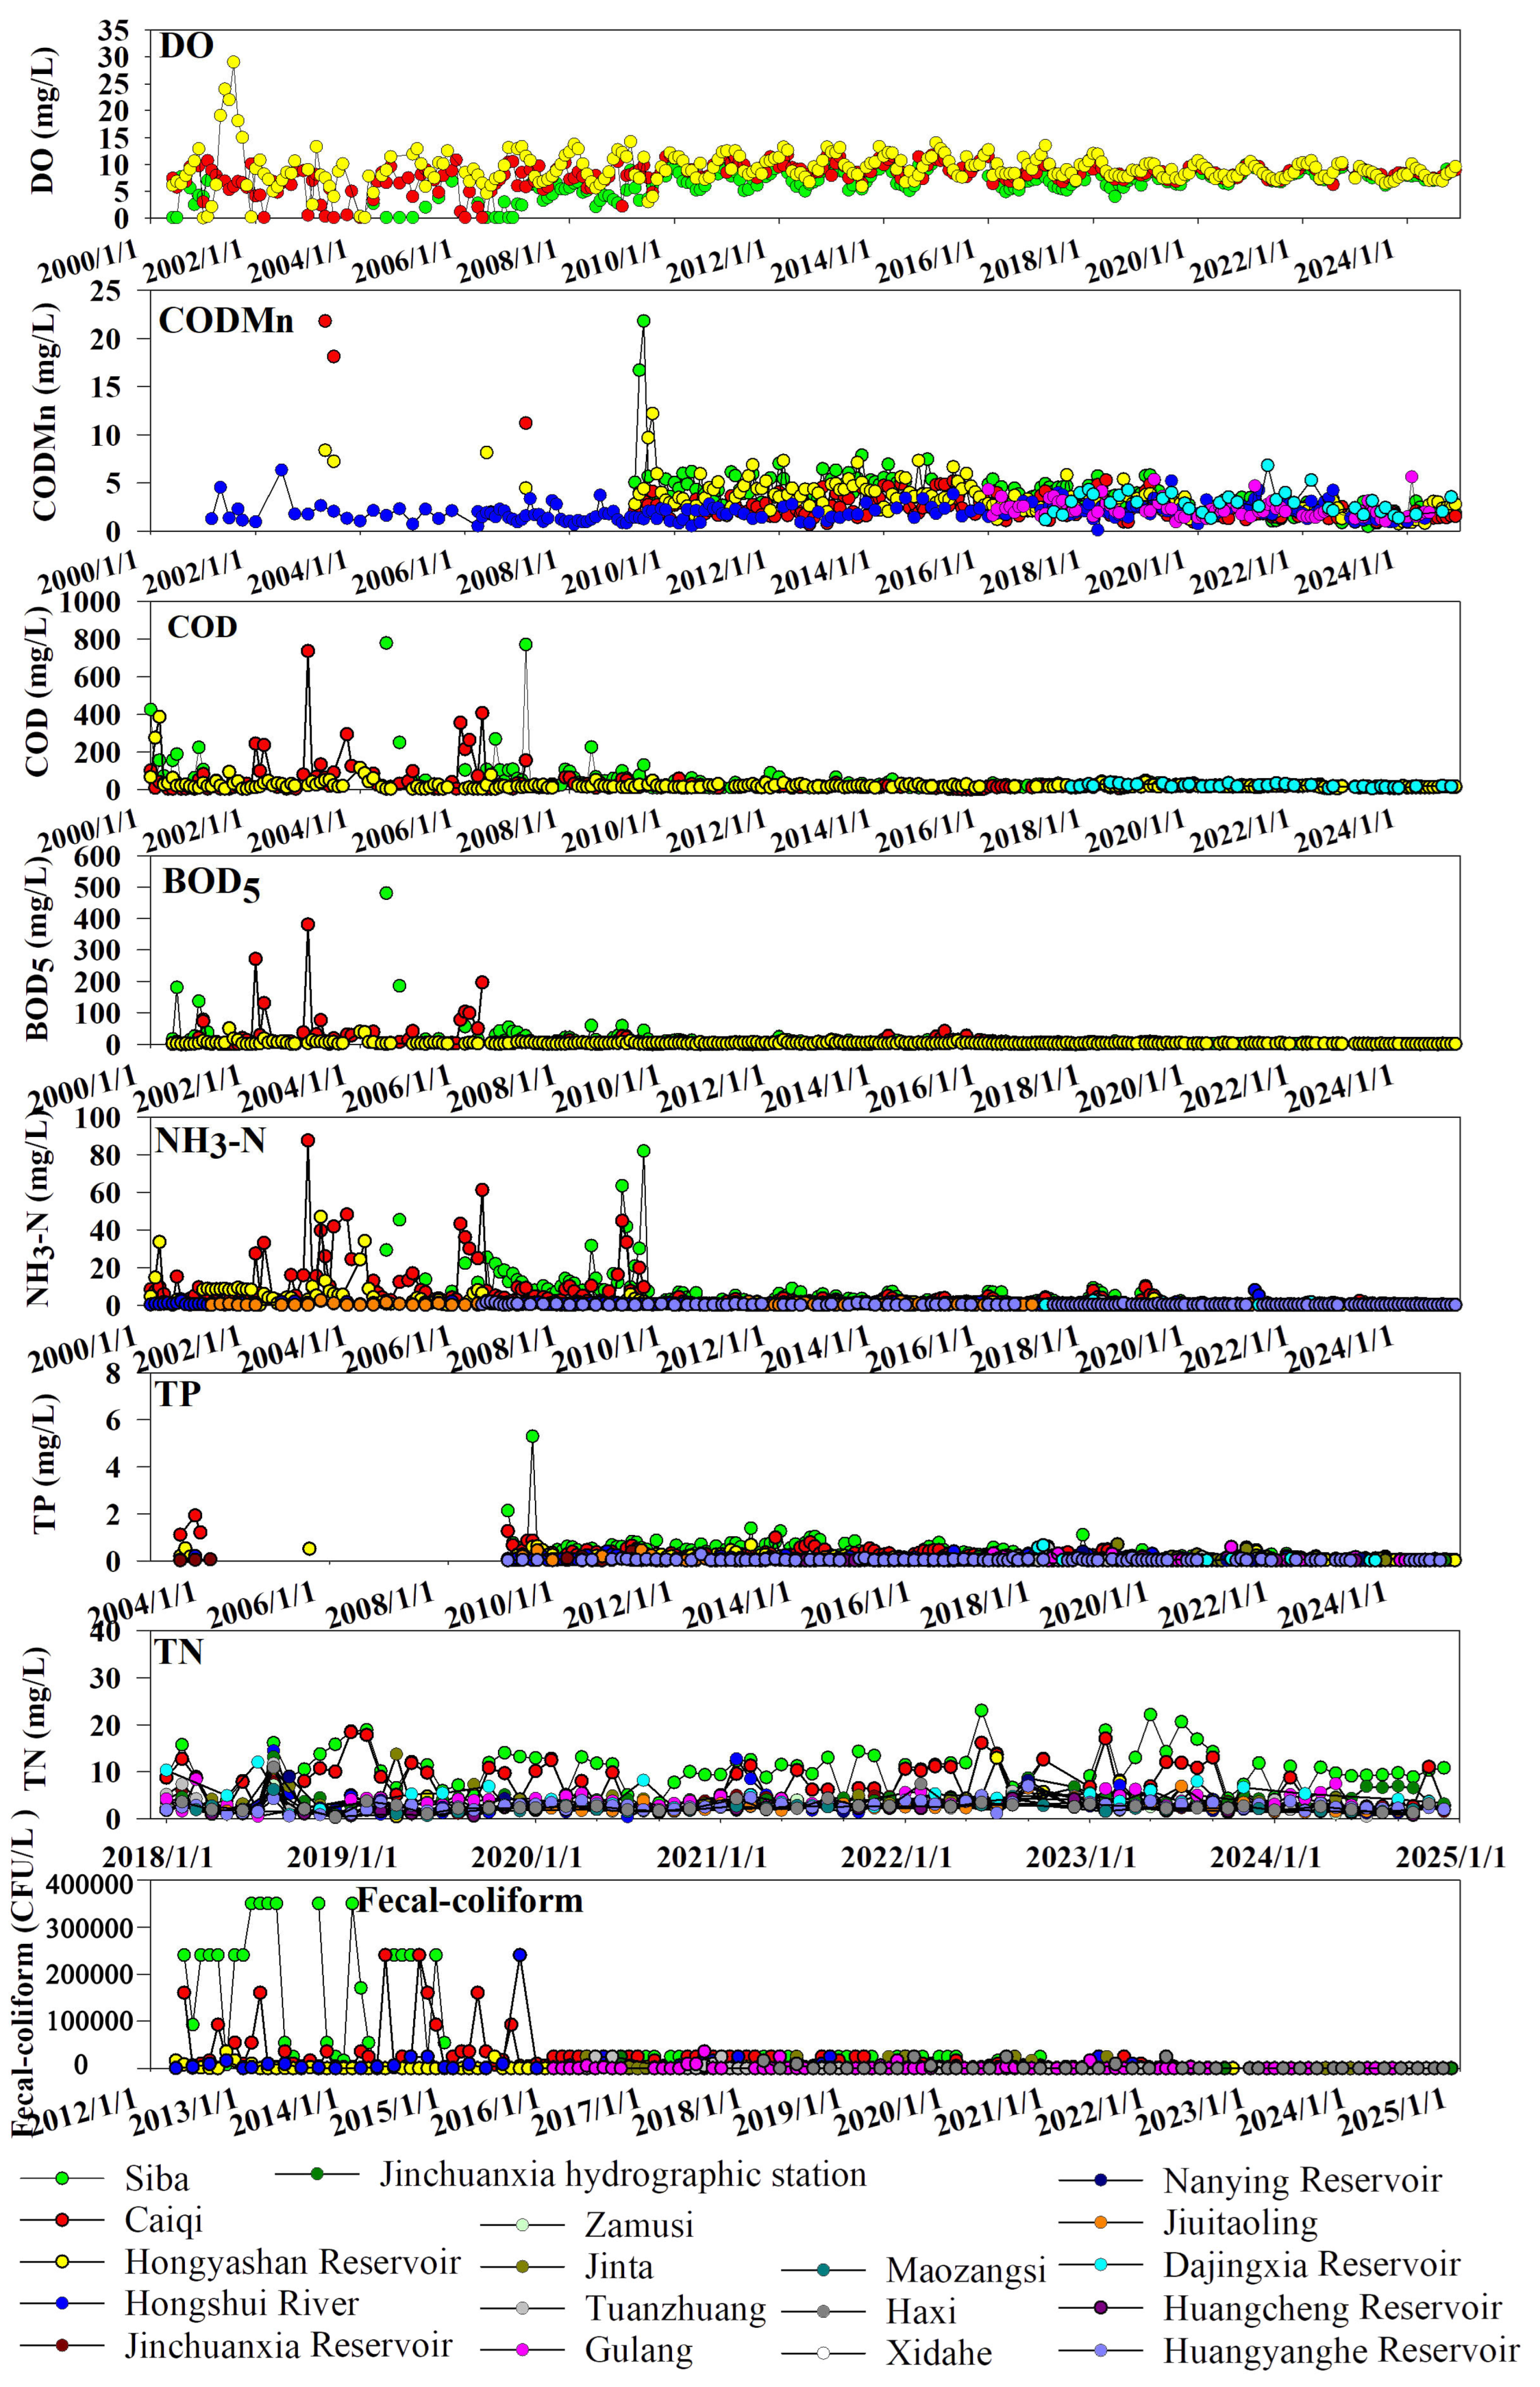
4.3. Analysis of Surface Water Quality Pollution Characteristics and Sources
5. Conclusions
Author Contributions
Funding
Data Availability Statement
Conflicts of Interest
References
- Obyazov, V.A.; Podlipskii, I.I.; Vinogradov, A.Y.; Kuchmin, A.V. Accumulated damage to the environment of Burnakovskaya depression in Nizhny Novgorod city as a source of long-term pollution of the Volga. Water Resour. 2020, 47, 763–771. [Google Scholar] [CrossRef]
- Jones, E.R.; Bierkens, M.F.P.; Puijenbroek, P.J.T.M.V.; Beek, L.P.H.; Wanders, N.; Sutanudjaja, E.H.; Vliet, M.T.H. Sub-Saharan Africa will increasingly become the dominant hotspot of surface water pollution. Nat. Water 2023, 1, 602–613. [Google Scholar] [CrossRef]
- Kiani, M.; Gheysari, M.; Mostafazadeh-Fard, B.; Majidi, M.M.; Karchani, K.; Hoogenboom, G. Effect of the interaction of water and nitrogen on sunflower under drip irrigation in an arid region. Agric. Water Manag. 2016, 171, 162–172. [Google Scholar] [CrossRef]
- Fathy, I.; Ahmed, A.; Abd-Elhamid, H.F. Integrated management of surface water and groundwater to mitigate flood risks and water scarcity in arid and semi-arid regions. J. Flood Risk Manag. 2021, 14, e12720. [Google Scholar] [CrossRef]
- Kaushal, S.S.; Groffman, P.M.; Likens, G.E.; Belt, K.T.; Stack, W.P.; Kelly, V.R. Increased salinization of fresh water in the northeastern united states. Proc. Natl. Acad. Sci. USA 2005, 102, 13517–13520. [Google Scholar] [CrossRef] [PubMed]
- Alaghmand, S.; Beecham, S.; Hassanli, A. A review of the numerical modelling of salt mobilization from groundwater-surface water interactions. Water Resour. 2013, 40, 325–341. [Google Scholar] [CrossRef]
- Jeong, C.; Jeon, W.H.; Kim, D.H.; Song, S.M.; Lee, J.Y.; Hyun, S.P. Effect of rainfall on spatiotemporal variation of hydrochemical and isotopic characteristics of the Coastal Lagoon (Songjiho) and groundwater in Korea. J. Hydrol. Reg. Stud. 2025, 58, 102303. [Google Scholar] [CrossRef]
- Boadou, A.K.; Anornu, G.; Adiaffi, B.; Gibrilla, A. Hydrochemical characteristics and sources of groundwater pollution in Soubré and Gagnoa counties, Cte d’ivoire. Groundw. Sustain. Dev. 2024, 26, 101199. [Google Scholar]
- Shiretorova, V.G.; Nikitina, E.P.; Bazarsadueva, S.V.; Taraskin, V.V.; Budaeva, O.D.; Nimbueva, N.B. Current state of lake Kotokel (eastern Cisbaikalia, Russia): Hydrochemical characteristics, water quality, and trophic status. Water 2025, 17, 545. [Google Scholar] [CrossRef]
- Savenko, A.V.; Savenko, V.S.; Efimov, V.A.; Pokrovskii, O.S. Hydrochemical characteristics of waters of the mouth section of the Kolyma River in the modern period. Water Resour. 2025, 52, 129–146. [Google Scholar] [CrossRef]
- Lambert, S.J.; Davy, A.J. Water quality as a threat to aquatic plants: Discriminating between the effects of nitrate, phosphate, boron and heavy metals on charophytes. New Phytol. 2010, 189, 1051–1059. [Google Scholar] [CrossRef] [PubMed]
- Dulsat-Masvidal, M.; Ciudad, C.; Infante, O.; Mateo, R.; Lacorte, S. Water pollution threats in important bird and biodiversity areas from Spain. J. Hazard. Mater. 2023, 448, 130938. [Google Scholar] [CrossRef] [PubMed]
- Li, Y.L.; Qiu, X.C. Environmental vapacity and total pollutant control in Shahu Lake. Bull. Soil Water Conserv. 2019, 39, 272–277. (In Chinese) [Google Scholar]
- Zhang, Y. Hadrochemical Characteristics and Influencing Factors of Reservoirs Under Different Environmental Background in Shiyang River Basin. Master’s Thesis, Northwest Normal University, Lanzhou, China, 2020. (In Chinese). [Google Scholar]
- Yang, Y.Y. Analysis of Water Environment Factors and Assessment of Water Environmental Quality in Heihe Basin. Master’s Thesis, Ningxia University, Yinchuan, China, 2020. (In Chinese). [Google Scholar]
- Drogue, N.N.; Dazy, J. Geological factors affecting the chemical characteristics of the thermal waters of the carbonate karstified aquifers of Northern Vietnam. Hydrol. Earth Syst. Sci. 2000, 42, 332–340. [Google Scholar] [CrossRef]
- Skoulikidis, N.; Amaxidis, Y.; Bertahas, I.; Laschou, S.; Gritzalis, K. Analysis of factors driving stream water composition and synthesis of management tools—A case study on small/medium greek catchments. Sci. Total Environ. 2006, 362, 205–241. [Google Scholar] [CrossRef]
- Zakhem, B.A.; Hafez, R. Climatic factors controlling chemical and isotopic characteristics of precipitation in Syria. Hydrol. Process. 2010, 24, 2641–2654. [Google Scholar] [CrossRef]
- Angyal, Z.; Gombas, E.S.; Adam, G.; Kardos, L. Effects of land use on chemical water quality of three small streams in Budapest. Open Geosci. 2016, 8, 133–142. [Google Scholar] [CrossRef]
- Gholizadeh, M.H.; Melesse, A.M.; Reddi, L. Water quality assessment and apportionment of pollution sources using apcs-mlr and pmf receptor modeling techniques in three major rivers of South Florida. Sci. Total Environ. 2016, 566–567, 1552–1567. [Google Scholar] [CrossRef]
- Wei, H.M. Research on Water Resources Management of the Shiyang River. Master’s Thesis, Xi’an University of Technology, Xi’an, China, 2004. (In Chinese). [Google Scholar]
- Zhang, X.P. Building of the Marketable Pollution Permits System of the Shiyang River Basin. Master’s Thesis, Lanzhou University, Lanzhou, China, 2009. (In Chinese). [Google Scholar]
- Xu, S.L.; Ge, Z.R.; Xie, Y.Y. A Systematic Rethinking on water issues of arid regions of western China. Bull. Chin. Acad. Sci. 2016, 26, 323–332. (In Chinese) [Google Scholar]
- Wang, L.; Wei, W.; Sun, G.; Fu, B.J.; Chen, L.D.; Feng, X.M.; Ciais, P.; Mitra, B.; Wang, L.X. Effects of inter-basin transfers on watershed hydrology and vegetation greening in a large inland river basin. J. Hydrol. 2024, 635, 131234. [Google Scholar] [CrossRef]
- Zhu, Z.X. Research on Water Environment Chemical Characteristics in the Middle and Lower Reaches of Shiyang River Basin. Groundwater 2015, 37, 79–81. (In Chinese) [Google Scholar]
- Zhang, W.H. The Influence of River Connectivity on Solute Transport in the Shiyang River Basin. Master’s thesis, Northwest Normal University, Lanzhou, China, 2024. (In Chinese). [Google Scholar]
- Qi, S.; Shu, H.P.; Feng, Q.; Zhu, M.; Liu, W.; He, J.H. Quantifying recharge sources to groundwater to an oasis area: Implications for strengthening water resource management under changing environmental conditions. Hydrol. Process. 2023, 37, e15049. [Google Scholar] [CrossRef]
- Qi, S.; Feng, Q.; Shu, H.P.; Liu, W.; Zhu, M.; Zhang, C.Q.; Yang, L.S.; Yin, Z.L. Redistribution effect of irrigation on shallow groundwater recharge source contributions in an arid agricultural region. Sci. Total Environ. 2023, 865, 161106. [Google Scholar] [CrossRef] [PubMed]
- Li, R.; Zhu, G.F.; Lu, S.Y.; Sang, L.Y.; Meng, G.J.; Chen, L.H.; Jiao, Y.Y.; Wang, Q.Q. Effects of urbanization on the water cycle in the Shiyang River basin: Based on a stable isotope method. Hydrol. Earth Syst. Earth Syst. 2023, 27, 4437–4452. [Google Scholar] [CrossRef]
- Piper, A. A graphic procedure in the geochemical interpretation of water analyses. Chem. Hydrogeol. 1983, 50, 914–918. [Google Scholar]
- Shuaibu, A.; Kalin, R.M.; Phoenix, V.; Lawal, I.M. Geochemical evolution and mechanisms controlling groundwater chemistry in the transboundary Komadugu-Yobe Basin, Lake Chad region: An integrated approach of chemometric analysis and geochemical modeling. J. Hydrol. Reg. Stud. 2025, 57, 102098. [Google Scholar] [CrossRef]
- Zhang, H.; Gao, W.; Shi, M.; Hou, Z.; Yang, R.; Gao, Z. Evolution of groundwater hydrochemical characteristics and origin analysis in yimeng revolutionary old district. Water Resour. 2025, 52, 332–341. [Google Scholar] [CrossRef]
- Wold, S.; Lindgren, F.; Rosen, K. Principal Component Analysis. In Methods and Applications of Principal Component Analysis; Nova Science Publishers Inc: Hauppauge, NY, USA, 1987; pp. 17–30. [Google Scholar]
- Gewers, F.L.; Ferreira, G.R.; Arruda, H.F.D.; Silva, F.N.; Comin, C.H.; Amancio, D.R.; Costa, L.D. Principal Component Analysis: A Natural Approach to Data Exploration. ACM Comput. Surv. 2021, 54, 1–34. [Google Scholar] [CrossRef]
- Feng, X.C. Hydrochemical and Stable Isotopic Characteristics and Analysis of Water Supply Sources in the Kashi River Mountain Area of Ili. Master’s Thesis, Xinjiang Normal University, Urumqi, China, 2022. (In Chinese). [Google Scholar]
- Zhang, Z.; Jia, W.; Zhu, G.; Shi, Y.; Zhang, F. Hydrochemical characteristics and ion sources of river water in the upstream of the Shiyang river, China. Environ. Earth Sci. 2021, 80, 614. [Google Scholar] [CrossRef]
- Ren, X.; Zhang, Z.; Yu, R.; Li, Y.; Li, Y.; Zhao, Y. Hydrochemical variations and driving mechanisms in a large linked river-irrigation-lake system. Environ. Res. 2023, 225, 115596. [Google Scholar] [CrossRef]
- Sureyaguli, A. Spatial and Temporal Variations of the Surface Water Chemical Components of the Lower Reaches of Tarim River After Ecological Water Conveyance. Master’s Thesis, Huazhong University of Science and Technology, Wuhan, China, 2012. (In Chinese). [Google Scholar]
- Xiao, J.Y.; Zhao, P.; Li, W.H. Spatial characteristic and controlling factors of surface water hydrochemistry in the Tarim River Basin. Arid. Land Geogr. 2016, 39, 33–40. [Google Scholar]
- Wu, Y.; Wu, P.; Lu, Y.; Lu, Y.; Wang, Z.; Li, M. The impact of water diversion projects on total phosphorus content in large shallow lake bays: A case study of the Xinmeng river project in the Taihu lake basin, China. J. Water Resour. Plan. Manag. 2025, 151, 05025005. [Google Scholar] [CrossRef]
- Dong, F.; Huang, A.; Peng, W.; Liu, X. Study on effect of different reservoir water diversion modes on river water quality improvement. IOP Conf. Ser. Earth Environ. Sci. 2021, 826, 012021. [Google Scholar] [CrossRef]
- Dragon, K.; Marciniak, M. Chemical composition of groundwater and surface water in the arctic environment (Petuniabukta region, central Spitsbergen). J. Hydrol. 2010, 386, 160–172. [Google Scholar] [CrossRef]
- Sun, Y.Q.; Qian, H.; Zhang, L.; Zhang, Q. Natural-Water Hydrochemistry Classification and Hydrochemistry Rule Research Based on Rectangle Hydrochemistry Diagram. J. Earth Sci. Environ. 2007, 29, 75–79. (In Chinese) [Google Scholar]
- Xu, S.L. The Study of Chemical Weathering in the Upstream of the Yellow River Basin. Master’s Thesis, Guizhou University, Guiyang, China, 2016. (In Chinese). [Google Scholar]
- Gibbs, R.J. Mechanisms controlling world water chemistry. Science 1970, 170, 1088–1090. [Google Scholar] [CrossRef]
- Bolgov, M.V.; Kulik, A.K.; Hiep, N.T.; Chau, V.T.M.; Thu, T.T.L.; Balkushkin, R.N.; Vypritskiy, A.A.; Vasilchenko, A.A. Groundwater chemistry in the mekong river delta. Water Resour. 2024, 51, S282–S292. [Google Scholar] [CrossRef]
- Oinam, J.D.; Ramanathan, A.L.; Sing, G. Geochemical and statistical evaluation of groundwater in imphal and thoubal district of manipur, india. J. Asian Earth Sci. 2012, 48, 136–149. [Google Scholar] [CrossRef]
- Gaillardet, J.; Dupré, B.; Louvat, P.; Allègre, C.J. Global silicate weathering and CO2 consumption rates deduced from the chemistry of large rivers. Chem. Geol. 1999, 159, 3–30. [Google Scholar] [CrossRef]
- Meng, X.Q.; Nie, Z.L.; Wang, Z.; Liu, X.Q. The chemical characteristics and formation mechanism of groundwater in the Shiyang River Basin. Sci. Technol. Innov. 2022, 15, 58–60. (In Chinese) [Google Scholar]
- Ye, H.M.; Li, G.P.; Yuan, X.Y.; Wu, F.F.; Zeng, R.N.; Liu, Y.B. Hydro-chemical characteristics and source contribution for small mountainous basin: A case studyin the Jiuquxi basin, Wuyishan. Environ. Chem. 2016, 35, 581–589. (In Chinese) [Google Scholar]
- Ma, J.Z.; Li, X.H.; Huang, T.M.; Edmunds, W.M. Chemical evolution and recharge characteristics of water resources in the Shiyang River Basin. Resour. Sci. 2005, 27, 117–122. (In Chinese) [Google Scholar]
- Ye, X.M.; Chang, Z.Z.; Chen, X.; Huang, H.Y.; Ma, Y.; Zhang, J.Y. Hazard of pathorgenic microorganisms in discharge from livestock and poultry breeding fams. J. Ecol. Rural. Environ. 2007, 23, 66–70. (In Chinese) [Google Scholar]
- Zhou, J.; Cai, S.H. Water quality detection and pollution control measures in drinking water protection zone. Environ. Sci. Manag. 2021, 46, 108–112. [Google Scholar]
- Qi, S.; Feng, Q.; Zhu, M.; Shu, H.P.; Liu, W.; Yang, L.S.; Yin, Z.L.; Zhang, C.Q. Source apportionment of nitrates in different aquifers in an arid region, northwestern China. J. Clean. Prod. 2022, 374, 133969. [Google Scholar] [CrossRef]


| Samplings | Na+ | Ca2+ | Mg2+ | K+ | HCO3− | SO42− | Cl− | TDS | ||
|---|---|---|---|---|---|---|---|---|---|---|
| mg/L | ||||||||||
| Siba | Mean | 33.13 | 70.48 | 35.94 | 7.49 | 269.55 | 134.75 | 39.06 | 642.42 | |
| Max | 108 | 125 | 98.2 | 21.8 | 448 | 197 | 67.79 | 1240 | ||
| Min | 5.25 | 21.2 | 8.33 | 2.16 | 111 | 42.6 | 7.85 | 198 | ||
| SD | 16.26 | 26.67 | 13.42 | 3.22 | 56.93 | 37.51 | 12.65 | 164 | ||
| Caiqi | Mean | 33.75 | 67 | 34.29 | 10.81 | 250.69 | 139.26 | 35.51 | 599.78 | |
| Max | 97.2 | 154 | 96.7 | 86.1 | 424 | 329 | 64.79 | 1070 | ||
| Min | 2.78 | 20 | 1.56 | 1.7 | 96.7 | 43.5 | 5.97 | 222 | ||
| SD | 20.88 | 27.47 | 13.53 | 16.58 | 64.78 | 49.41 | 16.13 | 183.92 | ||
| Hongyashan Reservoir | Mean | 30.55 | 52.85 | 30.82 | 5.68 | 195.1 | 117.76 | 33.34 | 472.87 | |
| Max | 68.4 | 100 | 59.3 | 17.2 | 283 | 306 | 61.99 | 737 | ||
| Plain area | Min | 8.33 | 15.9 | 9.17 | 1.31 | 89.8 | 39.7 | 5.63 | 143 | |
| SD | 13.74 | 15.86 | 9.46 | 2.65 | 42.51 | 30.92 | 12.85 | 104.74 | ||
| Hongshui River | Mean | 49.14 | 57.97 | 33.58 | 13.47 | 238.08 | 139.05 | 43.77 | 597.65 | |
| Max | 114 | 115 | 71.7 | 81 | 516 | 312 | 154.22 | 1270 | ||
| Min | 13.2 | 19.5 | 5.37 | 1.34 | 98.1 | 63.7 | 3.94 | 368 | ||
| SD | 22.63 | 20.64 | 11.41 | 19.75 | 54.26 | 51.38 | 16.99 | 132.21 | ||
| Jinchuanxia Reservoir | Mean | 32.32 | 59.9 | 35.58 | 4.59 | 227.09 | 138.01 | 30.91 | 519.77 | |
| Max | 98.4 | 116 | 63.8 | 13.7 | 433 | 228 | 118.17 | 1110 | ||
| Min | 10.6 | 16.2 | 9.07 | 0.88 | 128 | 69.2 | 9.04 | 113 | ||
| SD | 15.73 | 16.53 | 10.66 | 2.24 | 46.35 | 31.75 | 19.55 | 111.38 | ||
| Jinchuanxia hydrographic station | Mean | 34.82 | 61.49 | 37.71 | 4.47 | 252.74 | 142.26 | 36.13 | 595.05 | |
| Max | 63.3 | 93.3 | 67.4 | 13.6 | 411 | 298 | 60.39 | 947 | ||
| Min | 2.82 | 7.41 | 7.85 | 0.68 | 51.30 | 50.10 | 6.26 | 414.00 | ||
| SD | 11.26 | 15.67 | 10.34 | 2.15 | 42.37 | 32.93 | 11.56 | 86.67 | ||
| Plain area | Mean | 35.57 | 61.71 | 34.65 | 7.79 | 239.06 | 135.24 | 36.43 | 576.82 | |
| Max | 114.00 | 154.00 | 98.20 | 86.10 | 516.00 | 329.00 | 154.22 | 816.67 | ||
| Min | 2.78 | 7.41 | 1.56 | 0.6786 | 51.3 | 39.70 | 3.9441 | 401.91 | ||
| SD | 18.24 | 21.87 | 11.75 | 11.29 | 56.92 | 40.66 | 15.71 | 81.09 | ||
| Zamusi | Mean | 8.70 | 53.18 | 26.24 | 3.71 | 178.2 | 101.66 | 8.26 | 385.69 | |
| Max | 25.30 | 123.00 | 60.90 | 15.00 | 333.00 | 190.00 | 22.53 | 608.00 | ||
| Min | 1.95 | 19.40 | 5.39 | 0.48 | 61.60 | 43.10 | 3.18 | 152.00 | ||
| SD | 4.64 | 19.87 | 10.53 | 2.18 | 49.6 | 33.09 | 3.29 | 93.75 | ||
| Jinta | Mean | 11.83 | 40.22 | 20.23 | 3.6 | 161.32 | 75.37 | 11.03 | 334.44 | |
| Max | 31.8 | 74.2 | 48.2 | 9.69 | 281 | 264 | 23.03 | 588 | ||
| Min | 2.87 | 17.6 | 3.13 | 0.4 | 88.5 | 16.7 | 3.94 | 176 | ||
| SD | 6.07 | 12.48 | 9.28 | 1.82 | 44.18 | 35.02 | 4.26 | 77.93 | ||
| Tuanzhuang | Mean | 10.81 | 56.99 | 34.31 | 3.89 | 191.61 | 126.78 | 9.02 | 455.19 | |
| Max | 28.1 | 102 | 67.1 | 14 | 337 | 218 | 27.54 | 894 | ||
| Min | 2.82 | 18 | 6.83 | 1 | 45.8 | 59.3 | 3.67 | 195 | ||
| SD | 5.44 | 18.69 | 11.9 | 2.34 | 49.24 | 37.71 | 3.24 | 108.82 | ||
| Gulang | Mean | 29.73 | 56.29 | 35.72 | 5.13 | 261.67 | 119.42 | 24.95 | 552.04 | |
| Max | 59 | 100 | 60.2 | 12.2 | 534 | 193 | 62.29 | 805 | ||
| Mountainous region | Min | 3.55 | 21.4 | 11.6 | 2.11 | 146 | 64.5 | 7.85 | 345 | |
| SD | 12.17 | 17.54 | 11.03 | 2.12 | 49.59 | 29.12 | 9.89 | 89.39 | ||
| Nanying Reservoir | Mean | 11.96 | 39.16 | 21.44 | 3.6 | 156.92 | 71.88 | 10.37 | 329.6 | |
| Max | 51.9 | 73.5 | 39.7 | 9.24 | 231 | 250 | 18.23 | 592 | ||
| Min | 2.57 | 21.2 | 4.57 | 0.76 | 82.3 | 29.3 | 3.66 | 188 | ||
| SD | 8.27 | 12.87 | 8.87 | 1.95 | 37.58 | 34.88 | 3.83 | 83.28 | ||
| Jiutiaoling | Mean | 7.79 | 57.65 | 30.39 | 3.62 | 187.76 | 113.33 | 8.05 | 394.92 | |
| Max | 23 | 99.9 | 60.1 | 14.2 | 288 | 209 | 26.24 | 574 | ||
| Min | 1.86 | 22.9 | 7.33 | 0.84 | 70.8 | 55.6 | 2.49 | 84.8 | ||
| SD | 4.18 | 20.08 | 10.84 | 2.39 | 42.61 | 36.84 | 4.1 | 105.07 | ||
| Dajingxia Reservoir | Mean | 39.62 | 56.44 | 38.49 | 6.94 | 239.78 | 135.85 | 50.11 | 581 | |
| Max | 92.2 | 84 | 81.4 | 12.5 | 442 | 300 | 134.19 | 874 | ||
| Min | 5.86 | 13.7 | 9.15 | 0.85 | 140 | 73.7 | 7.6 | 367 | ||
| SD | 20.03 | 16.97 | 16.59 | 2.55 | 58.88 | 45.18 | 32.73 | 141.31 | ||
| Huangcheng Reservoir | Mean | 26.98 | 63.65 | 66.18 | 3.29 | 201.32 | 116.36 | 7.71 | 450.44 | |
| Max | 231 | 190 | 590 | 9.32 | 338 | 216 | 13.92 | 649 | ||
| Min | 3.97 | 21.1 | 10.8 | 0.1 | 61.6 | 55.6 | 4.64 | 240 | ||
| SD | 51.89 | 36.97 | 126.7 | 2.03 | 49.21 | 31.76 | 1.89 | 79.37 | ||
| Huangyanghe Reservoir | Mean | 19.09 | 53.84 | 33.42 | 4.53 | 220.93 | 115.88 | 14.86 | 467.4 | |
| Max | 53.8 | 100 | 59 | 15.7 | 349 | 181 | 52.17 | 702 | ||
| Min | 2.72 | 13.1 | 7.81 | 1.19 | 82.7 | 36.3 | 3.26 | 181 | ||
| SD | 8.64 | 17.78 | 9.51 | 2.38 | 38.28 | 27.99 | 6.63 | 86.77 | ||
| Maozangsi | Mean | 8.59 | 53.85 | 25.87 | 3.3 | 178.51 | 100.08 | 7.3 | 390.35 | |
| Max | 21.7 | 141 | 66.1 | 8.12 | 390 | 221 | 16.02 | 575 | ||
| Min | 2.2 | 20.7 | 4.44 | 0.49 | 86.6 | 41.8 | 3.38 | 174 | ||
| SD | 5.08 | 21.84 | 12.88 | 1.67 | 52.37 | 37.15 | 2.2 | 101.02 | ||
| Haxi | Mean | 12.43 | 53.19 | 32.39 | 4.39 | 230.46 | 101.55 | 9.87 | 456.22 | |
| Max | 29.3 | 101 | 52.1 | 15.1 | 448 | 154 | 21.93 | 807 | ||
| Min | 3.08 | 24.4 | 5.85 | 1.36 | 127 | 60.8 | 4.48 | 305 | ||
| SD | 5.49 | 15.76 | 8.53 | 2.53 | 54.11 | 20.35 | 4.91 | 83.04 | ||
| Xidahe Reservoir | Mean | 10.98 | 57.93 | 35.11 | 3.35 | 212.33 | 122.28 | 8.51 | 487.2 | |
| Max | 40.1 | 107 | 94.6 | 7.87 | 386 | 174 | 17.92 | 796 | ||
| Min | 1.01 | 15.1 | 12.1 | 1.02 | 63.6 | 29.9 | 4.05 | 144 | ||
| SD | 5.46 | 22.87 | 13.74 | 1.8 | 68.92 | 29.2 | 3.61 | 106.98 | ||
| Mountainous region | Mean | 15.68 | 53.05 | 32.06 | 4.06 | 199.78 | 107.50 | 13.24 | 436.55 | |
| Max | 231.00 | 190.00 | 590.00 | 15.70 | 534.00 | 300.00 | 134.19 | 673.33 | ||
| Min | 1.01 | 13.10 | 3.13 | 0.00 | 45.80 | 16.70 | 2.49 | 133.30 | ||
| SD | 17.23 | 20.65 | 33.98 | 2.31 | 57.44 | 37.78 | 12.91 | 83.33 | ||
| Components | Eigenvalue | Variance Explained Ratio (%) | Cumulative Explained Variance Ratio (%) |
|---|---|---|---|
| 1 | 4.204 | 60.06 | 60.06 |
| 2 | 0.909 | 12.985 | 73.044 |
| 3 | 0.766 | 10.938 | 83.983 |
| 4 | 0.576 | 8.226 | 92.208 |
| 5 | 0.482 | 6.887 | 99.095 |
| 6 | 0.039 | 0.558 | 99.653 |
| 7 | 0.024 | 0.347 | 100 |
| Components | |||
|---|---|---|---|
| 1 | 2 | 3 | |
| CODMn | 0.213 | −0.297 | 0.071 |
| COD | 0.204 | −0.371 | 0.097 |
| CODMn | 0.207 | 0.019 | −0.55 |
| AN | 0.208 | 0.042 | −0.544 |
| TP | 0.163 | 0.227 | 0.491 |
| TN | 0.108 | 0.904 | 0.015 |
| FCB | 0.163 | −0.051 | 0.673 |
Disclaimer/Publisher’s Note: The statements, opinions and data contained in all publications are solely those of the individual author(s) and contributor(s) and not of MDPI and/or the editor(s). MDPI and/or the editor(s) disclaim responsibility for any injury to people or property resulting from any ideas, methods, instructions or products referred to in the content. |
© 2025 by the authors. Licensee MDPI, Basel, Switzerland. This article is an open access article distributed under the terms and conditions of the Creative Commons Attribution (CC BY) license (https://creativecommons.org/licenses/by/4.0/).
Share and Cite
Wang, H.; Wu, S.; Xu, J.; Zhang, L.; Li, K.; Li, J.; Shu, H.; Chu, J. Study on the Surface Water Chemical Composition and Water Quality Pollution Characteristics of the Shiyang River Basin, China. Hydrology 2025, 12, 132. https://doi.org/10.3390/hydrology12060132
Wang H, Wu S, Xu J, Zhang L, Li K, Li J, Shu H, Chu J. Study on the Surface Water Chemical Composition and Water Quality Pollution Characteristics of the Shiyang River Basin, China. Hydrology. 2025; 12(6):132. https://doi.org/10.3390/hydrology12060132
Chicago/Turabian StyleWang, Haifeng, Shaoqing Wu, Jihai Xu, Lixia Zhang, Kuijing Li, Jisheng Li, Heping Shu, and Jihua Chu. 2025. "Study on the Surface Water Chemical Composition and Water Quality Pollution Characteristics of the Shiyang River Basin, China" Hydrology 12, no. 6: 132. https://doi.org/10.3390/hydrology12060132
APA StyleWang, H., Wu, S., Xu, J., Zhang, L., Li, K., Li, J., Shu, H., & Chu, J. (2025). Study on the Surface Water Chemical Composition and Water Quality Pollution Characteristics of the Shiyang River Basin, China. Hydrology, 12(6), 132. https://doi.org/10.3390/hydrology12060132