Article

Analysis of Runoff Variability and Periodicity in the Qinghai Lake Basin

1
School of Economics and Management, Beijing Jiaotong University, Beijing 100044, China
2
School of Soil and Water Conservation, Beijing Forestry University, Beijing 100083, China
*
Author to whom correspondence should be addressed.
Hydrology 2025, 12(4), 83; https://doi.org/10.3390/hydrology12040083
Submission received: 14 January 2025 / Revised: 31 March 2025 / Accepted: 7 April 2025 / Published: 10 April 2025
(This article belongs to the Section Ecohydrology)

Abstract

This study, based on hydrological station data and wavelet analysis, explores the periodic variation characteristics and trends of the two main tributaries (Buha River and Shaliu River) in the Qinghai Lake Basin from 1960 to 2016. Wavelet transform is used to analyze the runoff data, revealing long-term periodic fluctuations and their correlation with precipitation changes. The study finds that, from 2003 to 2016, the daily peak flow and daily minimum flow of the two rivers increase compared to the period from 1960 to 2003, though the magnitude and trends of the increase differ. At the monthly scale, runoff patterns show that June to October is the main period for concentrated runoff in the basin, with July and August being the peak months. Additionally, interannual runoff changes for both rivers show a gradually increasing trend amid fluctuations, with varying fluctuation intensities observed in different years. Wavelet analysis results indicate that the main periodicity of runoff is 23 years, closely linked to changes in precipitation. This study reveals the periodic variation patterns of runoff in the Qinghai Lake Basin, providing valuable insights for watershed water resource management and hydrometeorological forecasting.

1. Introduction

Changes in hydrological processes, particularly the spatiotemporal variations and periodic characteristics of runoff, are central to understanding the effects of climate change and human activities on the ecological environment [1,2,3]. Recently, with the intensification of global climate change and the increasing impact of land use changes, the complexity and non-linearity of hydrological processes have become even more pronounced [4,5,6]. Global research has demonstrated that runoff is influenced not only by climate factors, such as precipitation and temperature, but also by human activities like land use changes and vegetation cover, with these effects being particularly evident in arid and semi-arid regions [7,8].
Wavelet analysis, as a powerful tool for processing non-stationary signals, has emerged as a prominent method for hydrological time series analysis since its introduction to the field in the late 20th century. Unlike traditional Fourier analysis, which only provides global frequency resolution, wavelet analysis enables localized examination in both time and frequency domains. This makes it well-suited for detecting abrupt changes, identifying multi-scale periodic structures, and capturing localized dynamic features within hydrological series [9,10]. Under the dual influence of long-term climate change and intensified human activities, hydrological variables such as precipitation, runoff, and evapotranspiration often exhibit strong non-stationarity and multi-scaled variability [11]. Traditional approaches struggle to effectively decompose and interpret such complex dynamics. Wavelet analysis, through multi-level decomposition, allows the identification of dominant components including long-term trends, mid-term oscillations, and short-term fluctuations. Its advantages in trend detection, periodic analysis, and change-point identification have led to its widespread application in diverse hydroclimatic regions, such as arid zones, plateaus, and tropical monsoon areas [12,13]. Particularly in analyzing processes like precipitation–runoff relationships, wavelet-based methods enhance the structural understanding of time series and provide a crucial scale-dependent foundation for subsequent modeling and forecasting.
In practical applications, wavelet analysis has been extensively used to identify periodicities and diagnose trends in key hydrological elements such as precipitation, runoff, and evapotranspiration. For instance, Continuous Wavelet Transform (CWT) is frequently employed to extract dominant periodicities and their temporal evolution from non-stationary hydrological series, effectively revealing the timing and persistence of multi-scale fluctuations [13,14]. In trend analysis, CWT is often combined with the Mann–Kendall test to improve the statistical robustness and reliability of trend detection [15]. Additionally, Wavelet Coherence (WTC) and Cross Wavelet Transform (XWT) serve as important extensions, enabling the exploration of coupled relationships across multiple time scales between climatic drivers (e.g., precipitation, temperature, and the North Atlantic Oscillation index) and hydrological response variables. These approaches help uncover phase differences, lag effects, and potential causal pathways [16,17,18]. In recent years, researchers have further explored critical aspects of wavelet analysis, including the selection of mother wavelets, decomposition level settings, and model integration strategies. For example, Maheswaran [19] and Khosa [20] proposed a hybrid prediction approach that combines the redundant à trous wavelet transform with a non-linear Volterra model, which was subsequently expanded into a multi-wavelet–Volterra framework. They also incorporated Bayesian Model Averaging (BMA) to integrate outputs from multiple wavelet models, significantly improving the accuracy and stability of runoff predictions at daily, weekly, and monthly scales [11]. These methodologies have been widely adopted to identify dominant periodic components within watersheds, construct multi-scale driving mechanism maps, and show promising potential for hydrological modeling under the influence of extreme climate events [12].
The Qinghai Lake Basin (QLB), as the largest inland lake watershed in China, holds significant ecological and water resource value [21,22,23,24,25]. The variation in runoff within this basin is influenced by both monsoon precipitation and snowmelt, making it a representative example of the plateau arid region [26,27]. In recent years, with the increasing pressures of climate change and human activities, the hydrological characteristics of the QLB—especially the spatiotemporal variability of runoff—have become a focal point of research in hydrology and environmental science [28,29,30]. While existing studies have examined the interannual fluctuations and seasonal changes in runoff [31,32,33,34], most focus primarily on linear trends, neglecting a deeper exploration of the inherent periodic fluctuations within runoff. Capturing these periodic changes, particularly within the context of complex climate variations, remains a key challenge.
Therefore, this study aims to investigate the periodic characteristics of runoff in the Qinghai Lake Basin (QLB) and identify the driving mechanisms behind these patterns using wavelet analysis. By uncovering the multi-scale periodic components in the basin’s runoff variation, this research will provide more accurate predictive tools and theoretical support for regional water resource management and ecological protection. Ultimately, the findings will offer valuable scientific evidence to guide the rational allocation of water resources and promote the sustainable management of the region’s ecological environment.

2. Materials and Methods

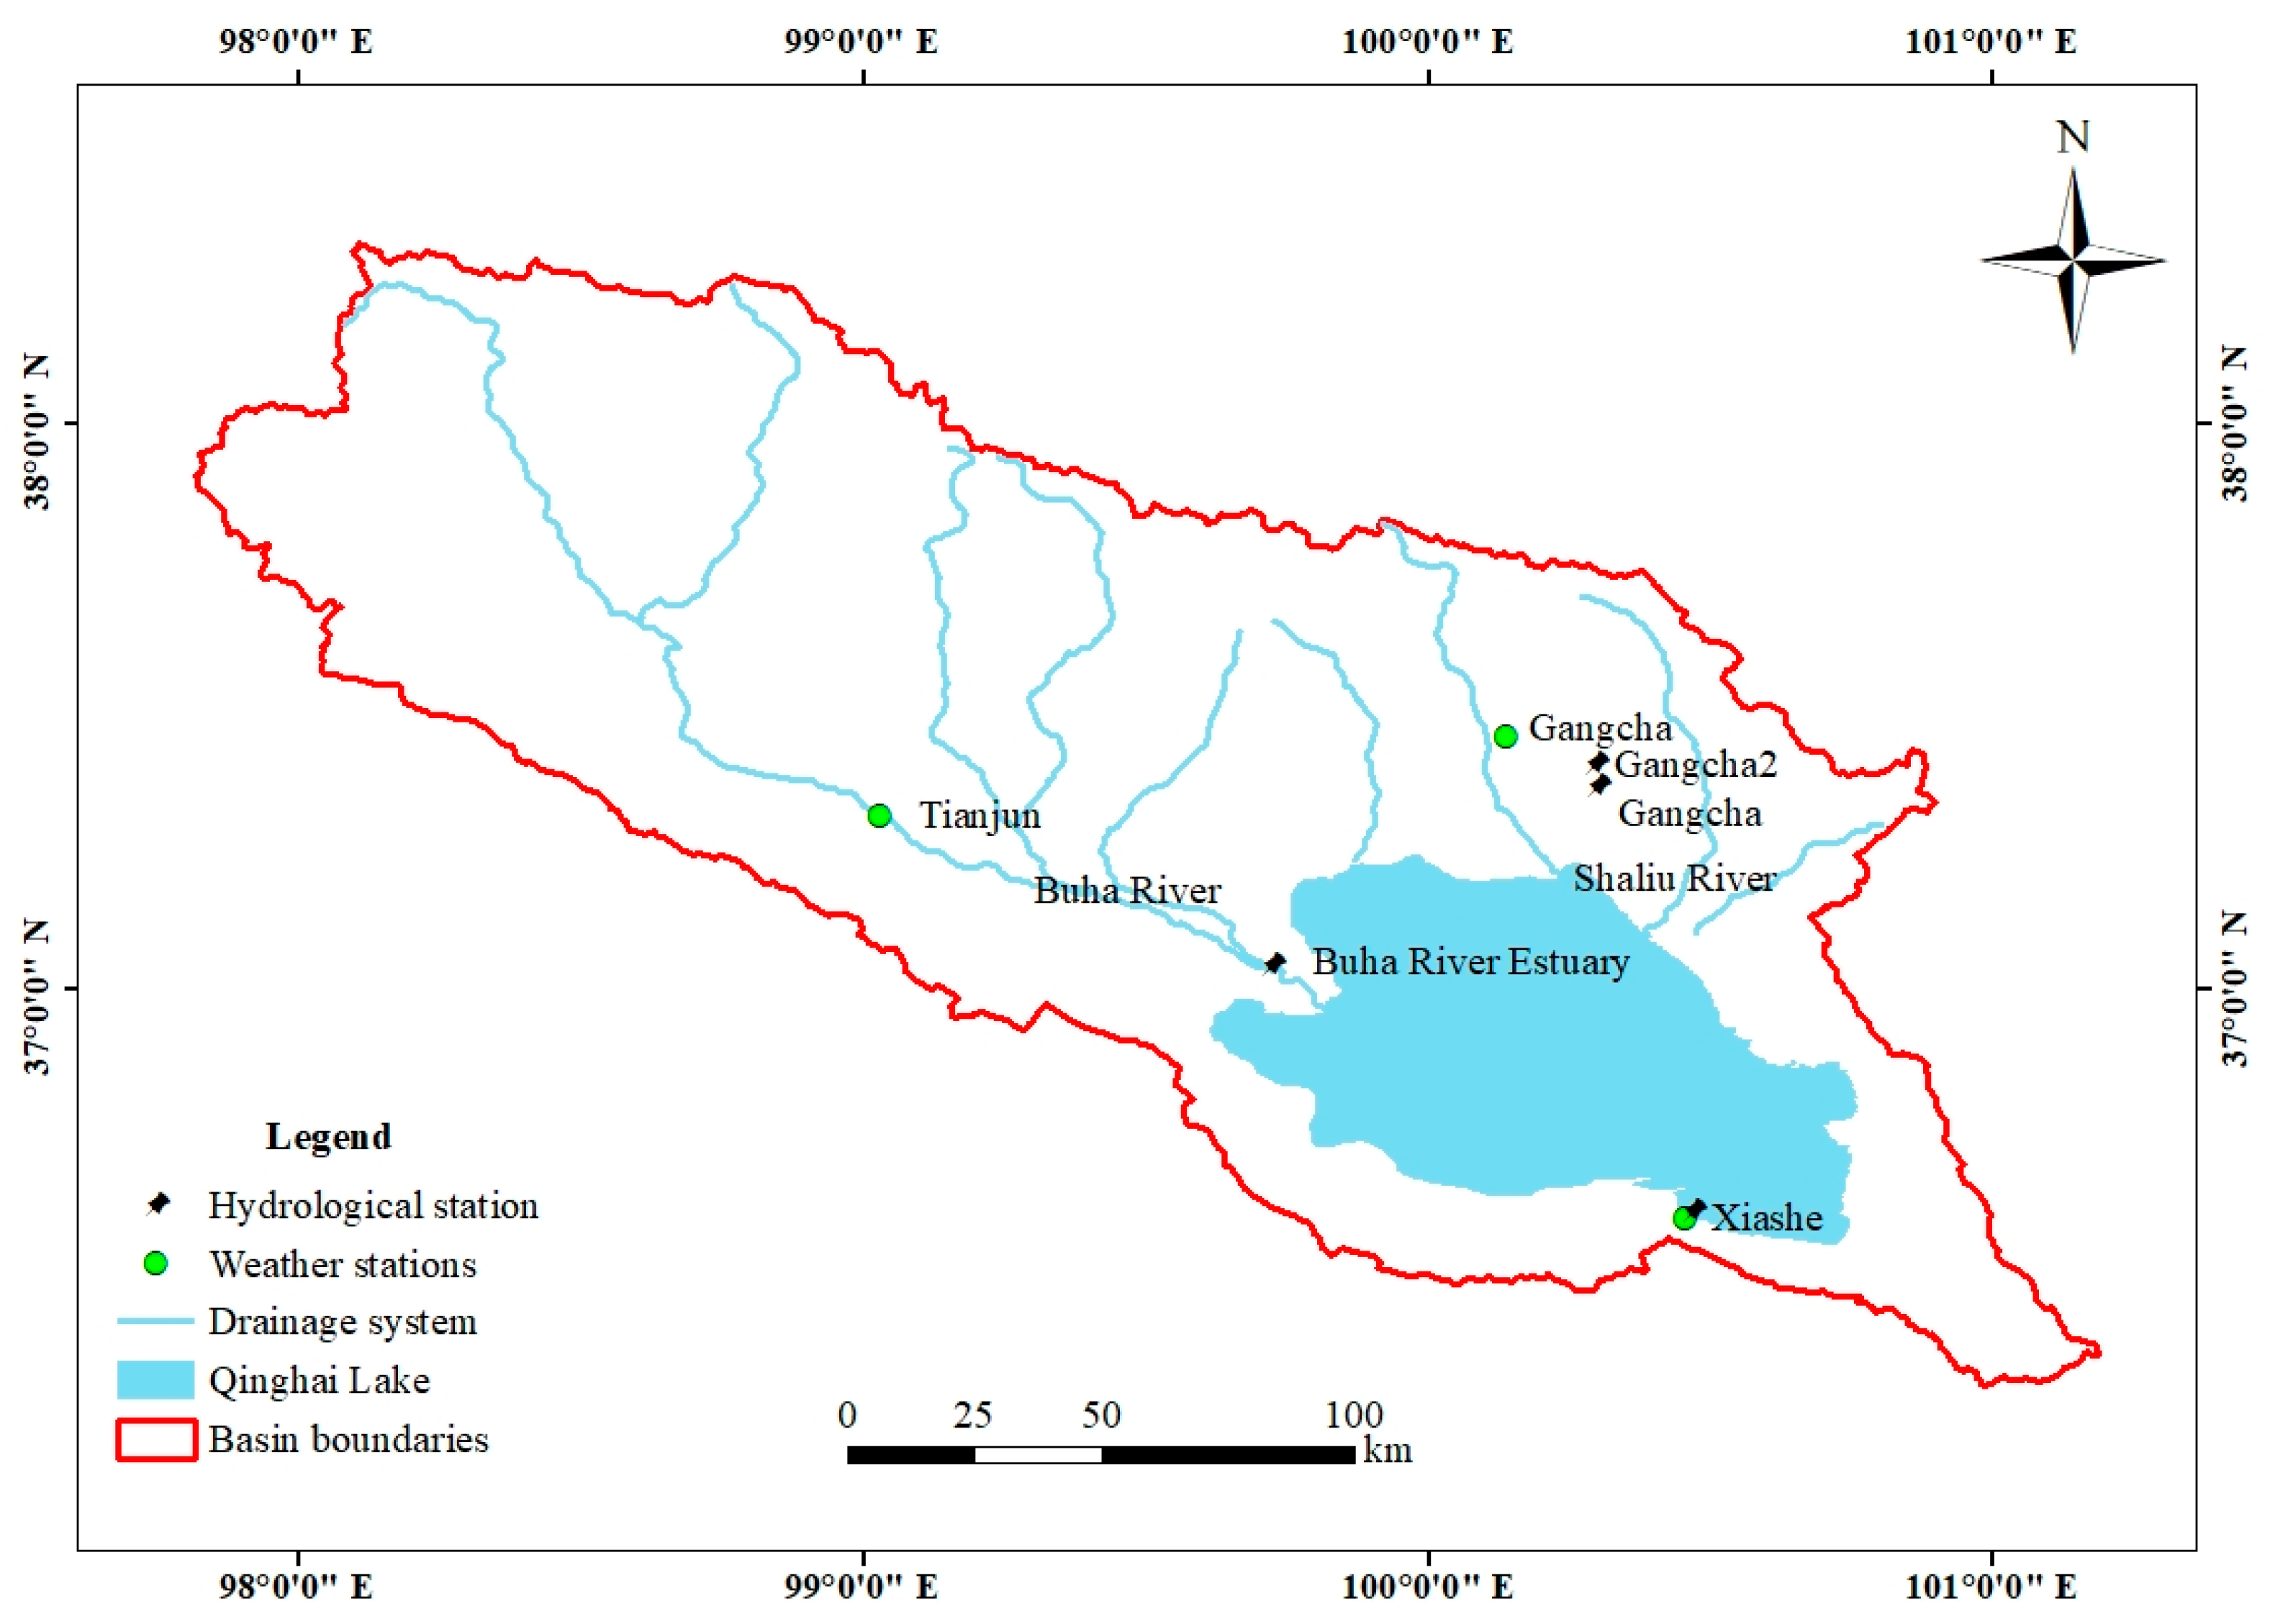
2.1. Regional Background and Study Area

The Qinghai Lake Basin (QLB), located on the northeastern edge of the Qinghai-Tibet Plateau in China, spans the coordinates E97°50′–101°20′, N36°15′–38°20′, with a drainage area of 29,600 km2. The topography of the basin is complex, with a low central area surrounded by mountains. The southeastern part of the basin has a higher elevation, while the northwest is lower. The Qinghai Lake Basin was formed under the long-term influence of the Himalayan tectonic movements, which has led to the development of numerous mountain ranges and plains. At the southeastern part of the basin lies Qinghai Lake, the largest inland lake and the largest saline lake in China, situated between E99°36′–100°46′ and N36°32′–37°15′. The surface area of Qinghai Lake accounts for about 16% of the total area of the basin. In recent years, the area of the lake has continuously increased, with the main lake and its subsidiary lakes now covering an area of approximately 4441.22 km2.
The Qinghai Lake Basin is located at the intersection of China’s eastern monsoon zone, the northwestern arid region, and the southwestern high-cold region, and it belongs to a typical plateau semi-arid and cold climate. The annual average temperature ranges from −0.8 °C to 1.1 °C, with a large daily temperature variation. Precipitation is unevenly distributed, decreasing from the east and south to the west and north. The vast water surface of Qinghai Lake has a significant moderating effect on the regional climate, leading to higher temperatures around the lake, with a longer frost-free period compared to the surrounding mountainous areas.
The river network in the QLB is asymmetrically distributed, with high-density networks and larger runoff in the northwest, north, and southwest, while the southeast and south have a lower density and smaller runoff. The main rivers flowing into Qinghai Lake include the Buha River, Shaliu River, Hargai River, Heima River, and Daotang River. Among these, the Buha River, located in the northwest, has the largest inflow, followed by the Shaliuhe River and the Hargai River along the northern shore. These three rivers account for more than 75% of the total inflow to the lake. The annual distribution of river runoff is uneven, with more than 80% of the annual runoff occurring from June to September, primarily supplied by atmospheric precipitation.
Qinghai Lake has an elevation of 3194.5 m, with a maximum depth of 29.5 m and an average depth of 17.3 m. During the wet period, the salinity of the water body generally ranges from 8.38 to 11.93 g/L. Most parts of the lake, especially in the eastern region, where there is a lack of external freshwater input, have salinity levels exceeding 11 g/L. In contrast, the salinity is notably lower in the western river mouth areas where freshwater inflows occur. In addition to the main lake, more than 70 small lakes larger than 0.03 km2 are distributed within the basin, mainly in the upper Buha River source region in the western part (freshwater lakes) and the southeastern lakeshore areas (saline lakes). Snow in the basin is distributed above 4700–4800 m, with less than 300 km2 of perennial snow cover, accounting for only 1% of the total basin area. The basin contains 22 glaciers, most of which are located in the upstream areas of the Buha River, including Yangkangqu and Xigelqu. Remote sensing data show that, from 1990 to 2010, the glacier area reduced from 15.4 km2 to 8.9 km2, with an average annual loss of 0.13 million m3 [35]. Groundwater in the basin is replenished by the surrounding mountain areas, with the northern part being richer in groundwater resources than the southern part. The depth to groundwater is generally less than 15 m, with aquifer thickness ranging from 20 to 70 m, and the mineralization degree of groundwater is less than 0.5 g/L.
In recent years, the Qinghai Lake Basin has experienced significant changes, including an increase in temperature and precipitation. The rise in temperature has extended the growing season and promoted the improvement of grassland vegetation, while the increase in precipitation has provided adequate moisture for vegetation, further supporting ecological restoration. Overall, the changes in temperature and precipitation have had a positive impact on vegetation growth in the Qinghai Lake Basin, enhancing the region’s ecological productivity and stability [24].

2.2. Data Collection

The Qinghai Lake Basin has numerous rivers, and its river network is highly unevenly distributed. Among these rivers, 48 have a watershed area larger than 5 km2 and flow directly into Qinghai Lake. The five largest rivers in terms of discharge—Buha River, Shaliu River, Harge River, Wuharalan River, and Heima River—account for 83% of the total surface water runoff entering the lake. The hydrological station data used in this study are as follows:
The hydrological data include daily, monthly, and annual runoff values, as well as flood peak monitoring data for three stations: Buha River Estuary Station, Gangcha Station, and Gangcha 2 Station (after the closure of Gangcha Station, a new station was established, and the time series data were seamlessly continued. From then on, both Gacha Station and Gacha 2 Station will be referred to as Gacha Station). The time series are as follows: 1960–2016, 1960–1975, and 1976–2016. The Buha River Estuary Station controls a drainage area of 14,337 km2, while Gangcha Station (including Gangcha 2 Station) controls a drainage area of 1442 km2. Information on the main hydrological stations is shown in Table 1.
Meteorological data from Buha Estuary rainfall station data, time series: 1962–2016, daily scale. The study area site information is shown in Figure 1.

2.3. Mann–Kendall Non-Parametric Trend Test

The Mann–Kendall non-parametric trend test is widely used in time series trend analysis of meteorological and hydrological data, as it is unaffected by data distribution and outliers [36,37]. For a time series, the statistical value S is calculated as follows:
S = i = 1 n 1 j = i + 1 n s g n x j x i
s g n ( x ) = 1 , i f x j x i > 0 0 , i f x j x i = 0 1 , i f x j x i < 0
In this equation, xi and xj represent the i-th and j-th data values in the time series, and n refers to the total length of the time series or the number of data points. When n ≥ 8, the mean (E(S)) and variance (Var(S)) of the statistic S can be calculated as:
E S = 0
V a r ( S ) = n ( n 1 ) ( 2 n + 5 ) 18
The standardization of S can be calculated using the following formula to obtain the Z statistic:
Z = S 1 V a r ( S ) , i f S > 0 0 i f S = 0 S + 1 V a r ( S ) , i f S < 0
Assuming that the original sequence shows no trend, the Z statistic can be used to test the trend of the data series on the time scale. After performing a two-tailed test and given a significance level α, the critical value at the significance level can be obtained from the table. If Z > 0, it indicates an upward trend for the variable; otherwise, a downward trend. If Z exceeds the critical value, the null hypothesis H is rejected; otherwise, the null hypothesis is accepted.

2.4. Mann–Kendall Change Point Test

The Mann–Kendall statistical test can be used to detect change points in a data series. The specific method is as follows:
S k = i = 1 k j = 1 i 1 α i j ( k = 2 , 3 , 4 , , n )
α i j = 1 0 x i > x j x i x j 1 j i
In this equation, Sk represents the statistic at the k-th stage, which is employed to detect change points in the time series. αij denotes the coefficient that quantifies the relationship between the i-th and j-th data points in the time series.
The statistical variable UFK is defined as:
U F K = S k E S k V a r ( S k ) k = 1 , 2 , 3 , , n
The variable x is arranged in reverse order, while satisfying the following conditions:
U B K = U F K k = n + 1 k ( k   =   1 ,   2 ,   ,   n )
If the UFK curve lies in the range greater than 0, it indicates that the variable exhibits an increasing trend; conversely, it indicates a decreasing trend. When the UFK curve crosses the critical values at the 0.05 or 0.01 significance levels, it suggests that the variable shows a significant trend of change. If the UFK curve intersects the UBK curve within the critical value range, the time point corresponding to this intersection is the time at which the time series undergoes a change point.

2.5. Wavelet Analysis

Hydrological processes are the result of the combined effects of various climatic factors and underlying surface conditions. High non-linearity and multi-time scales are key characteristics of hydrological time series, which consist of both deterministic and random components. Wavelet analysis, originally used in signal processing and analysis, is capable of extracting the local characteristics of time series from both the time and frequency domains. It has been effectively applied in the study of climate change and hydrological processes, making it particularly suitable for analyzing the multi-time-scale non-linear variation characteristics of hydrological time series.
If ψ ( t ) L 2 R satisfies the admissibility condition, then Ψ(t) is the mother wavelet and ψ ^ ( ω ) is its Fourier transform. By applying this transformation method, the mother wavelet function is scaled and translated to obtain the continuous wavelet:
ψ a , b ( t ) = a 1 2 ψ ( t b a )
In the equation, t represents time, a , b R , a > 0 . For any function f ( t ) L 2 ( R ) , The continuous wavelet transform of its mother wavelet function ψ a , b ( t ) can be expressed as:
W f ( a , b ) = a 1 / 2 + f ( t ) ψ ¯ ( t b a ) d t
In the equation, W f ( a , b ) represents the wavelet coefficient; a represents the scaling factor; b represents the translation factor, which reflects the shift in time; ψ ¯ ( t b a ) represents the complex conjugate of ψ ¯ ( t b a ) .
Based on the fact that the time series of variables predominantly follows a discrete distribution, its wavelet coefficients are expressed as:
W f ( a , b ) = a 1 / 2 k = 1 N f ( k Δ t ) ψ ¯ ( k Δ t b a )
where k = 1, 2,…, N; Δt is the sampling interval.
Functions such as Haar, Daubechies, and symlet can be used as the basis wavelet for wavelet decomposition and reconstruction, and in this paper the quasi-symmetric symlet wavelet is used.
The formula for calculating the wavelet variance is as follows:
V a r ( a ) = + W f ( a , b ) 2 d b
where V a r ( a ) is the wavelet variance and W f ( a , b ) is the wavelet coefficient.
The binary wavelet transform discretizes the scale parameter as a power function of 2, i.e., a = 2 j , j Z . Let V j be the multi-resolution analysis and ϕ , ψ represent the corresponding scale function and wavelet function, respectively. To analyze the signal f ( t ) , let f V J , J be the maximum number of layers of wavelet decomposition, which can be decomposed as:
f ( t ) = K S J , K ϕ J , K t + k d J , K ψ J , K t + k d J 1 , K ψ J 1 , K t + + k d 1 , K ψ 1 , K t
where S J , K is the scale factor and d j , k is the wavelet coefficient. It can also be simplified and expressed as:
f ( t ) = S J + D J + D J 1 + + D j + D 1
where S J = K S J , K ϕ J , K t , D j = k d J , K ψ J , K t , j = 1 , 2 , , J .
The multi-decomposition of the signal f ( t ) can be expressed as follows:
S J 1 = S J + D J
where S corresponds to the coarsest scale. S j 1 = S j + D j , S J , S j 1 , , S 1 is a sequence of multi-resolution approximations to the function f ( t ) . The multi-resolution decomposition is: S J , D J , D J 1 , D j , D 1 .

3. Results

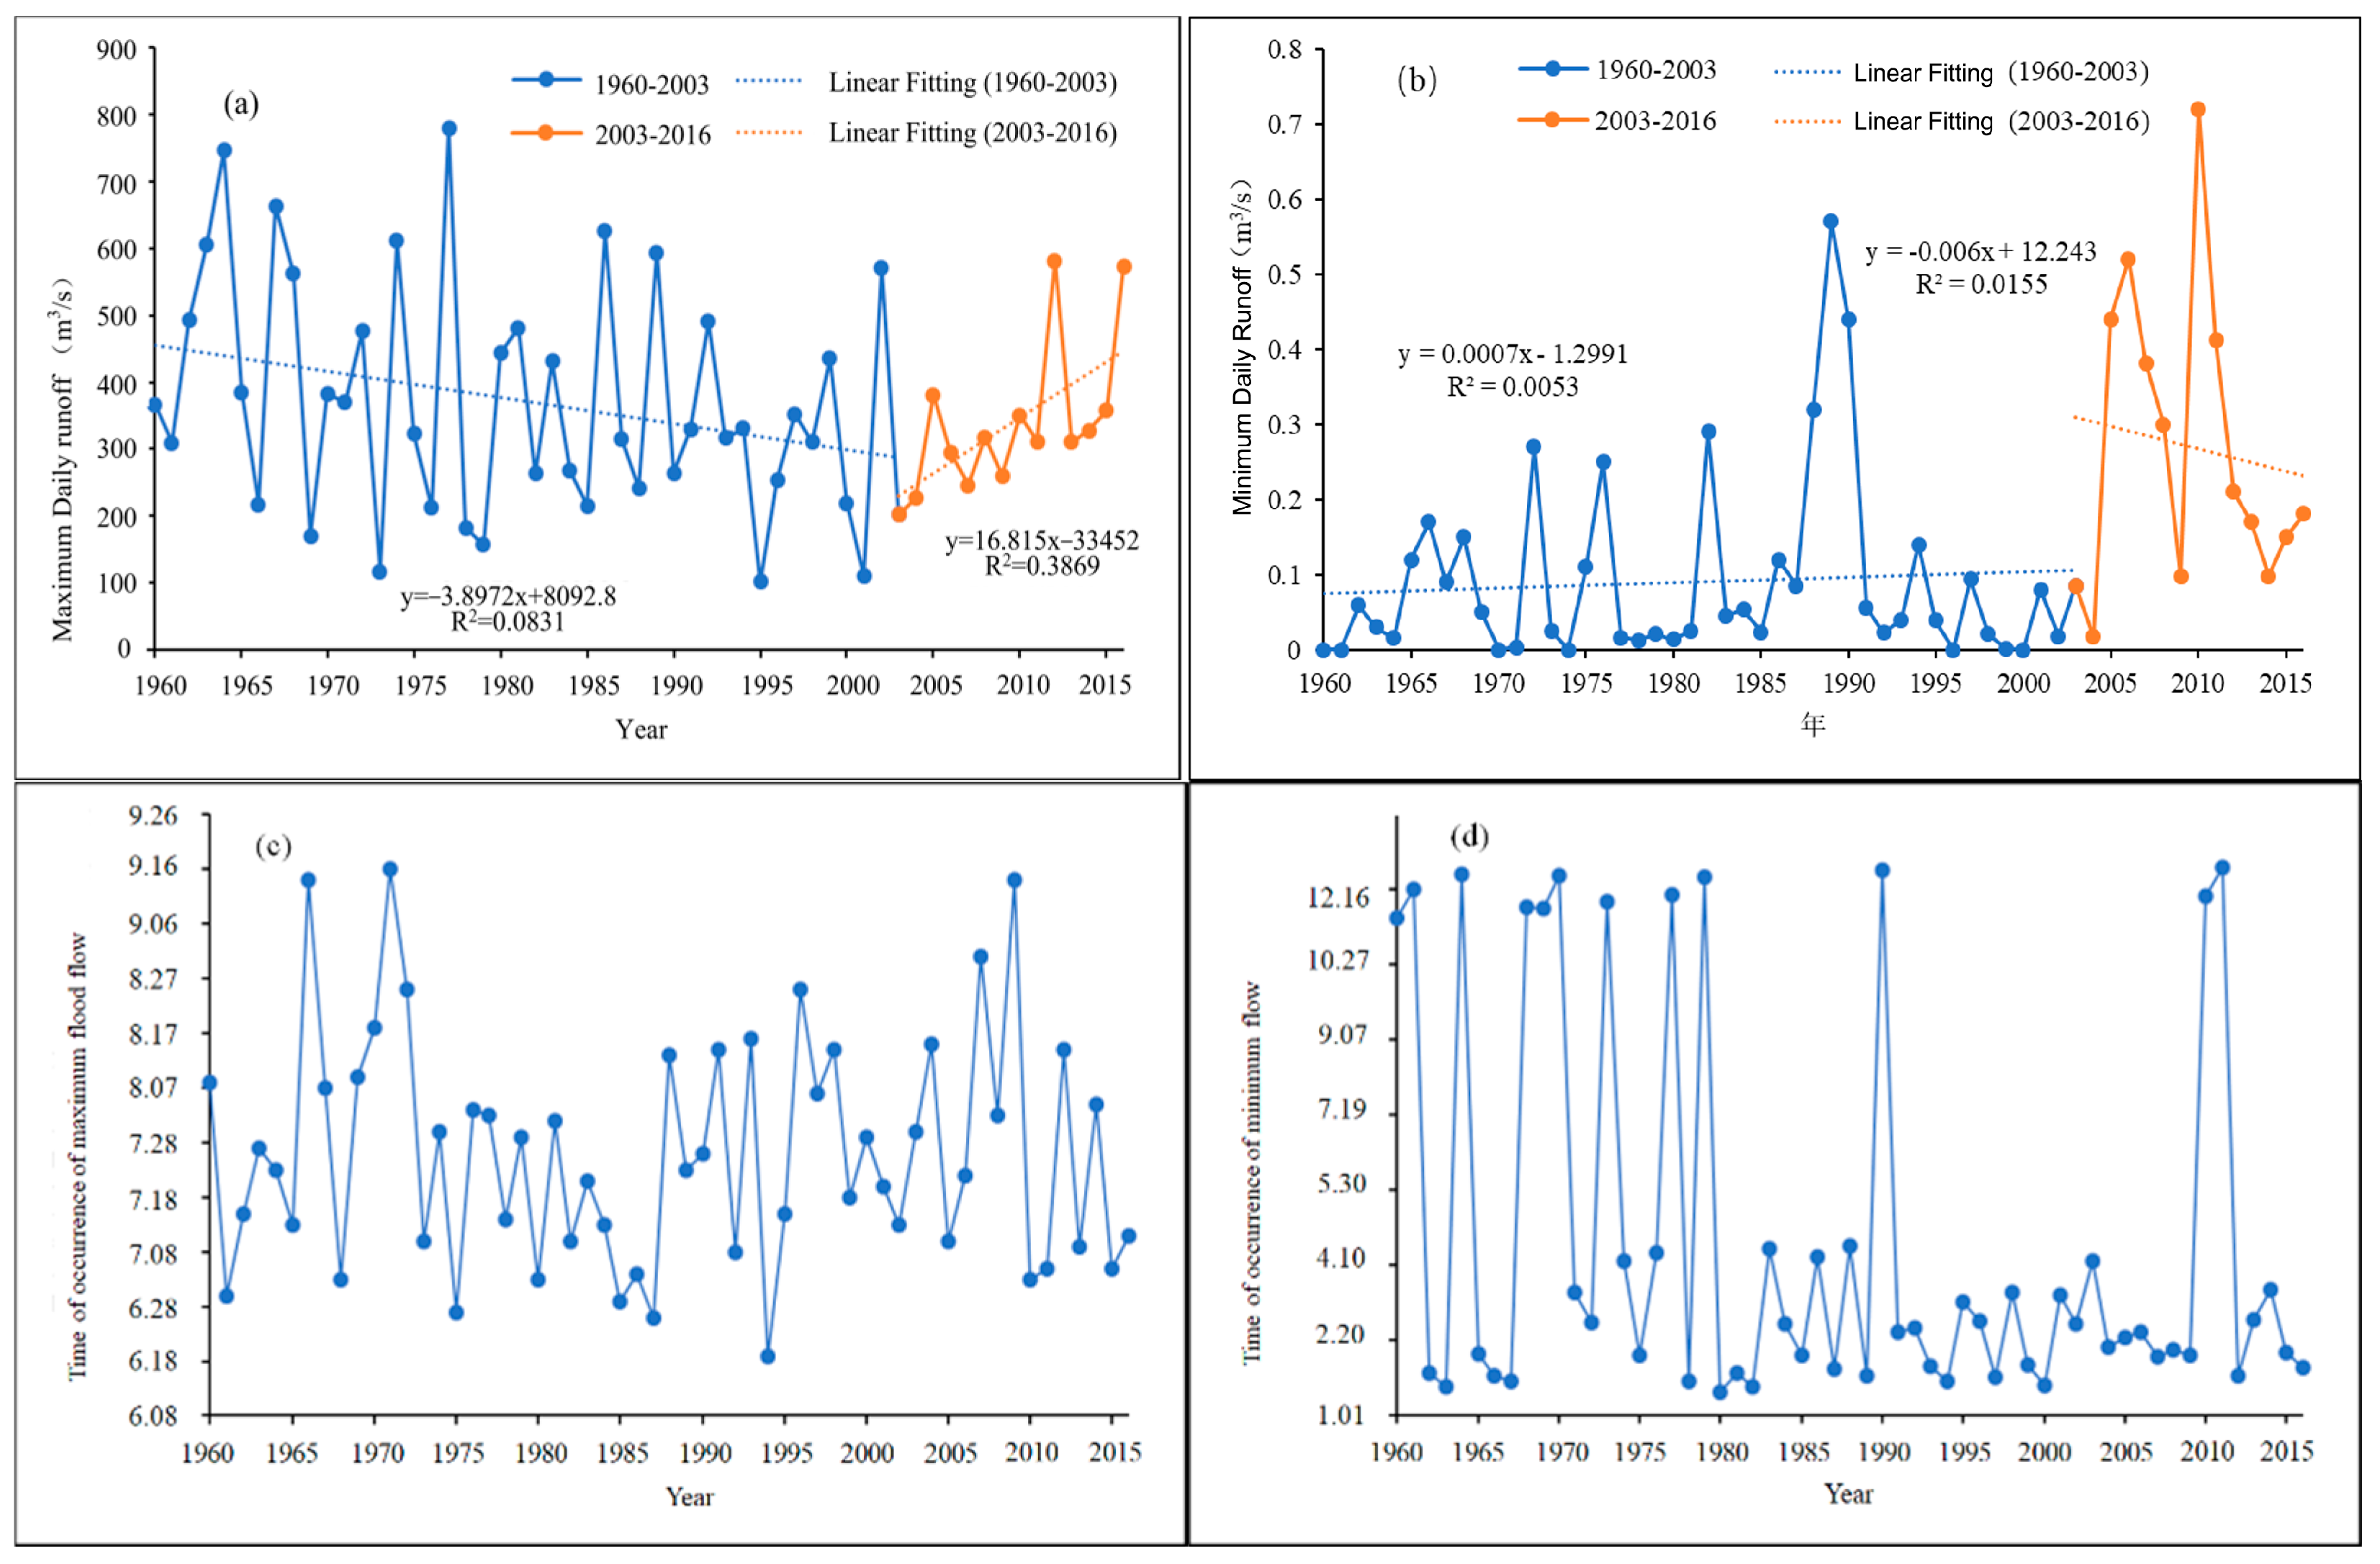
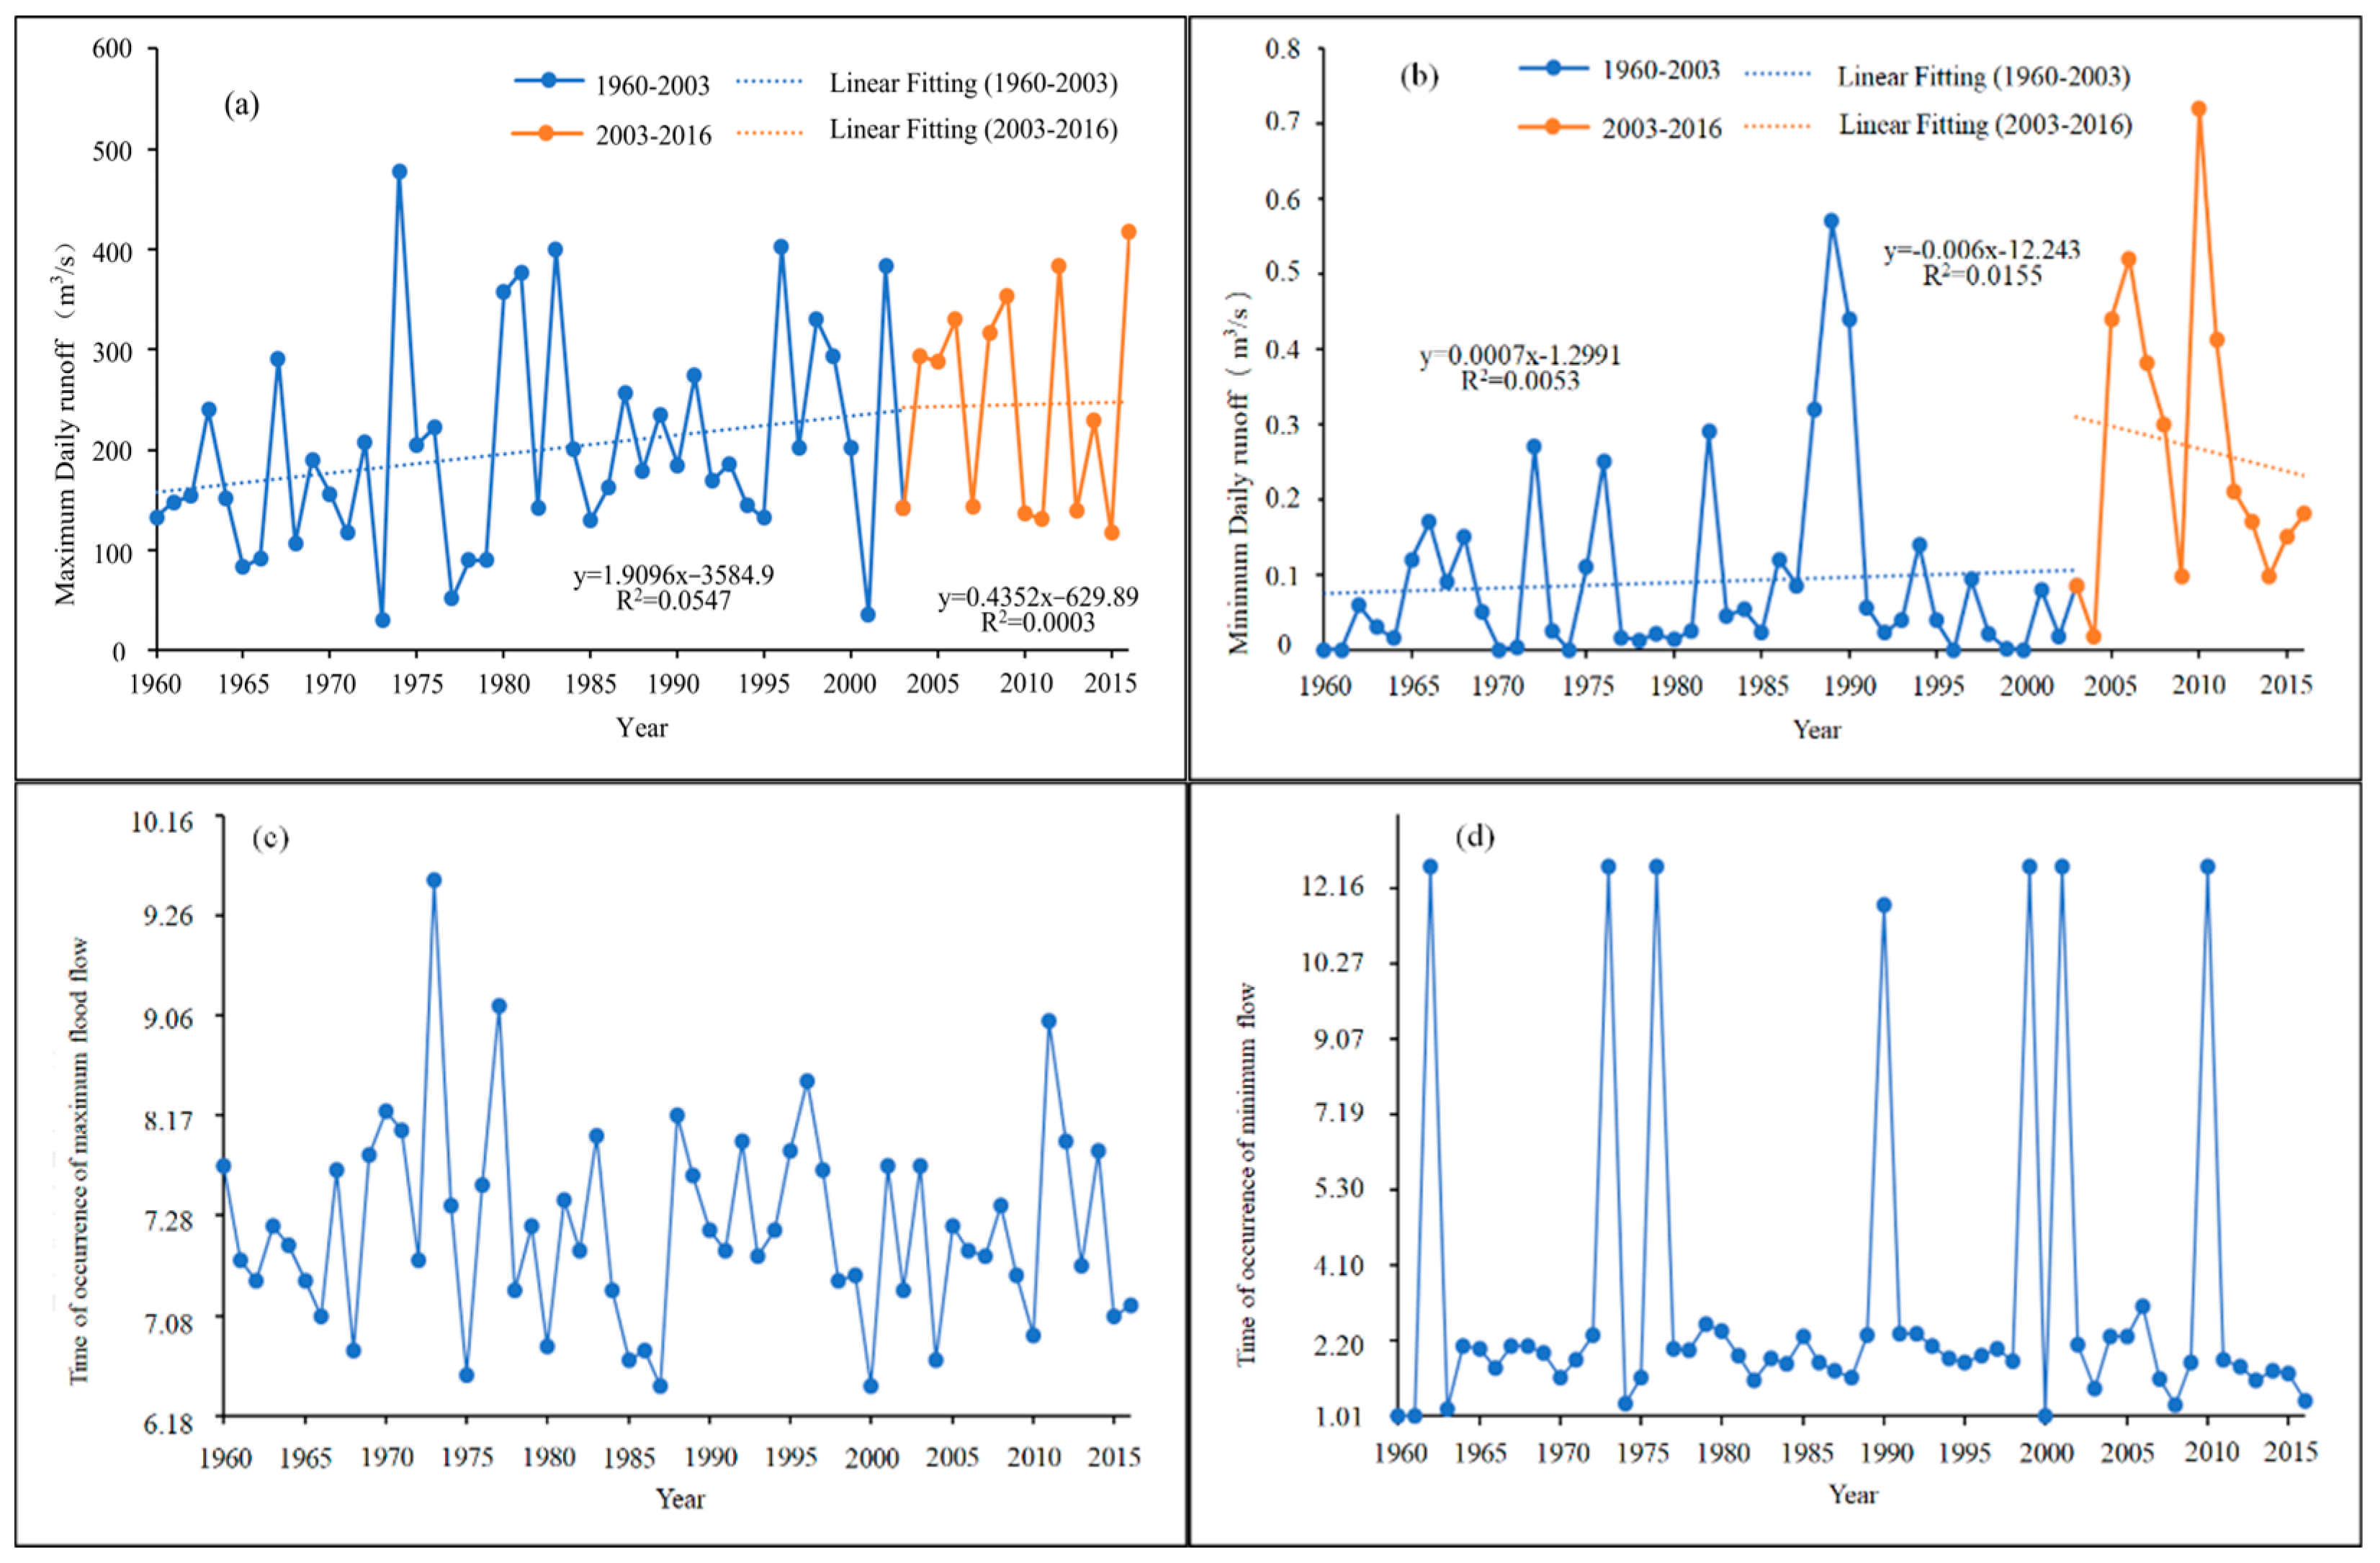
3.1. Daily Runoff Variations

The daily runoff in different periods exhibits complex variations, and its regularity is difficult to discern. This study focuses on analyzing the daily extreme runoff values (peak daily discharge and minimum daily discharge) and their occurrence times (Figure 2 and Figure 3), which helps to understand the evolution of hydrological processes in the watershed.
The trend of the daily peak discharge in the Buha River is shown in Figure 2a, where the trend is clearly divided into two phases: Phase I, from 1960 to 2003, shows a declining trend with significant fluctuations, with a linear trend rate of −3.90 m3/s/a; Phase II, from 2003 to 2016, shows an increasing trend, with a linear trend rate of 16.82 m3/s/a. As shown in Figure 2b, the trend of the daily minimum runoff in the Buha River is clearly divided into two phases: Phase I, from 1960 to 2003, shows a declining trend with fluctuations, with a linear trend rate of −0.08 m3/s/10a; Phase II, from 2003 to 2016, shows a significant increase, with a linear trend rate of 0.37 m3/s/10a. Figure 3a shows that the daily peak discharge in the Shaliuhe River in Phase I (1960–2003) and Phase II (2003–2016) shows a slightly increasing trend with fluctuations. In contrast to the Buha River, the upward trend in Phase II of the Shaliu River weakens, with the linear trend rates of the extreme phases being: Phase II (0.44 m3/s/a) < Phase I (1.91 m3/s/a), and the average level in Phase II is higher than in Phase I. The trend of the daily minimum runoff in the Shaliu River is shown in Figure 3b. Phase I shows a weak upward trend with a linear trend rate of 0.007 m3/s/10a. In contrast to the Buha River, Phase II shows a declining trend, with a linear trend rate of −0.06 m3/s/a. The average level in Phase II is higher than in Phase I. Therefore, from 2003 to 2016, the daily peak discharge and daily minimum discharge in the two major tributaries of the QLB increased compared to 1960–2003, but the trends and magnitudes of increase differ.
Between 2003 and 2016, the daily peak flow and daily minimum flow of the two main tributaries of the Qinghai Lake Basin increased compared to the period from 1960 to 2003. However, the rate and extent of increase differed. This variation is closely related to factors such as the climate response of each tributary, water resource development, and watershed management measures. Rising temperatures may lead to greater snowmelt, which in turn affects peak flow changes. Changes in precipitation and precipitation intensity may also cause fluctuations in runoff. Water resource development projects, such as reservoir construction and water diversion projects, as well as soil and water conservation measures, may influence runoff and water resources in the basin. The differences in the changes of the Buha River and Shaliu River during Phase II may be linked to the regulation of water management infrastructure. Additionally, natural factors within the watershed, such as vegetation cover, groundwater levels, and soil moisture, may influence the hydrological processes.
The timing of the extreme flow values also differs between the two rivers. The daily peak discharge in the Buha River typically occurs between late June and early September, while the minimum daily runoff occurs mainly from mid-December to early April. In contrast, the daily peak discharge in the Shaliu River typically occurs between late June and mid-August, and the largest minimum daily runoff occurs mainly from late December to early February. Due to the large catchment area and long confluence time of the Buha River, the occurrence time span of extreme runoff is larger than that of the Shaliu River.

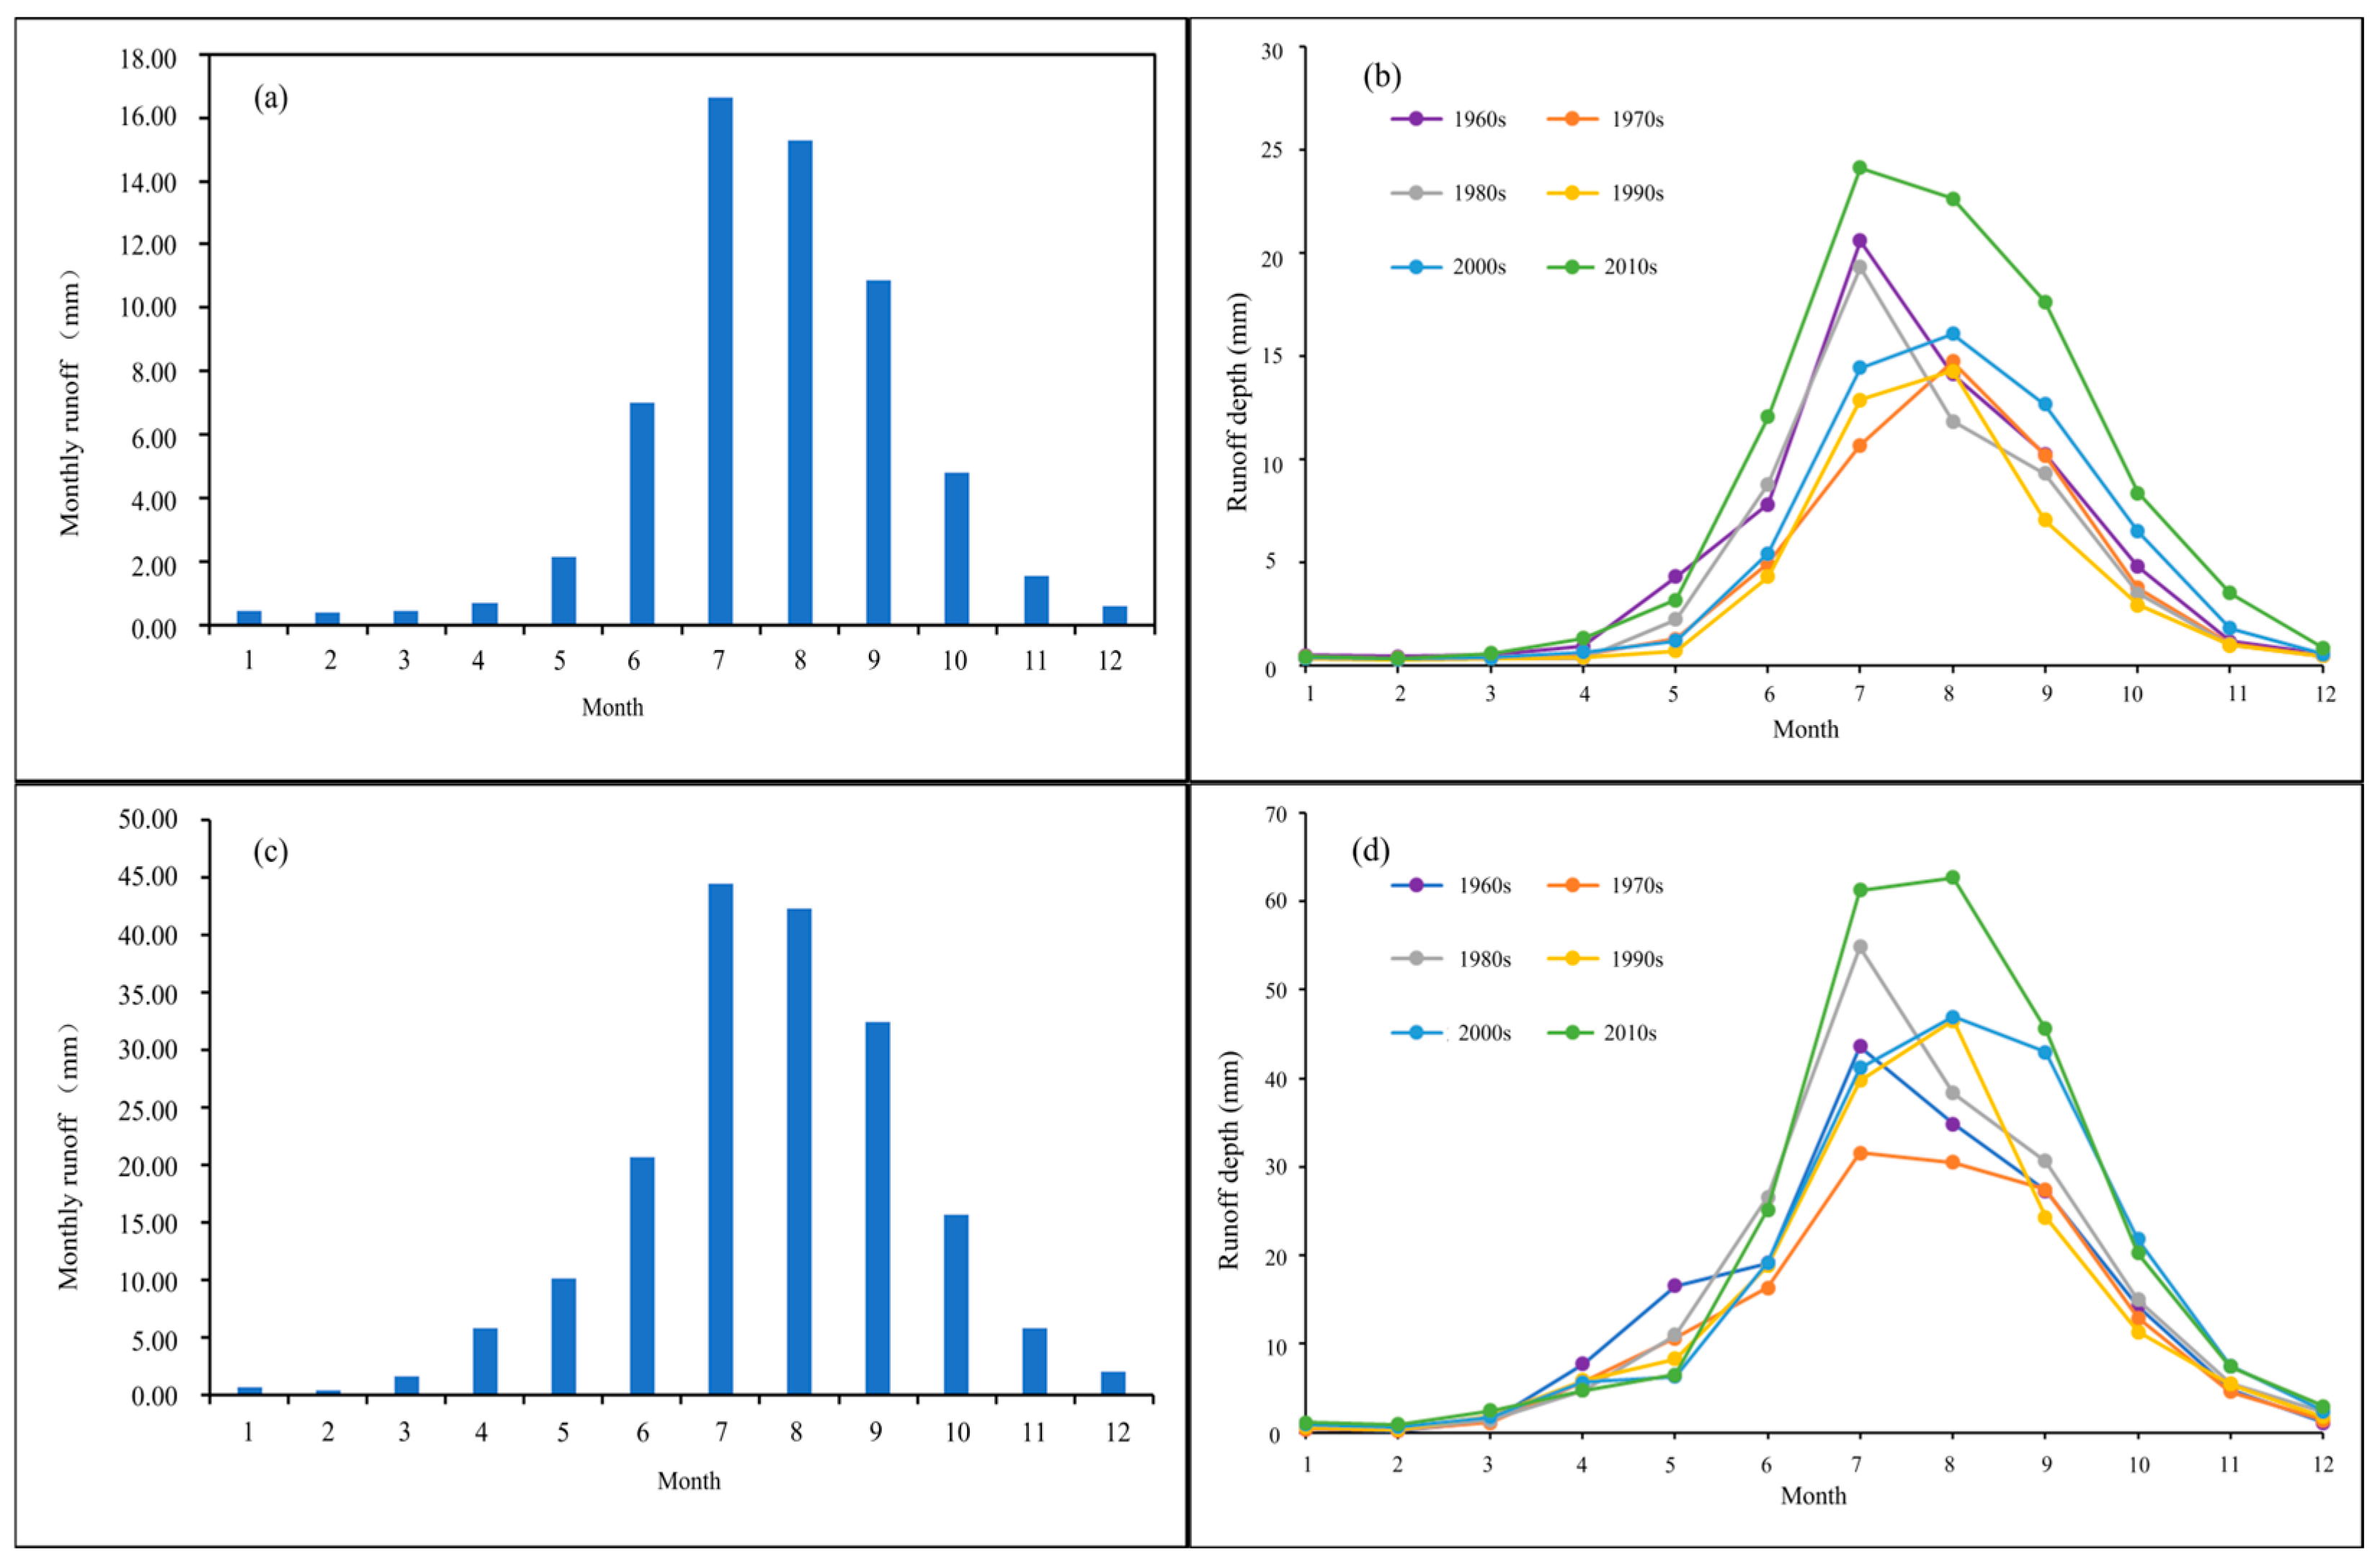
3.2. Seasonal Runoff Variations

Using multi-year daily runoff data from the Buha and Shaliu rivers, the multi-year average monthly runoff for each month was calculated, with the results shown in Figure 4. The monthly runoff distribution is highly uneven, with the majority concentrated between June and October, accounting for 89.90% and 85.50% of the total annual runoff, respectively. July exhibits the highest runoff, followed by August. In the Qinghai Lake Basin, the main precipitation season occurs from June to October, with July and August typically being the peak months for both the flood and rainy seasons. During this period, precipitation is abundant while evaporation remains relatively low, allowing most of the precipitation to convert into runoff, which leads to concentrated runoff in these months. Moreover, both the intensity and frequency of rainfall reach their highest levels during this time. Due to the significant amount of snow and ice stored in the mountains within the Buha River and Shaliu River basins, rising summer temperatures lead to large amounts of meltwater entering the rivers. In particular, snowmelt tends to peak in July and August, further intensifying the concentration of runoff.

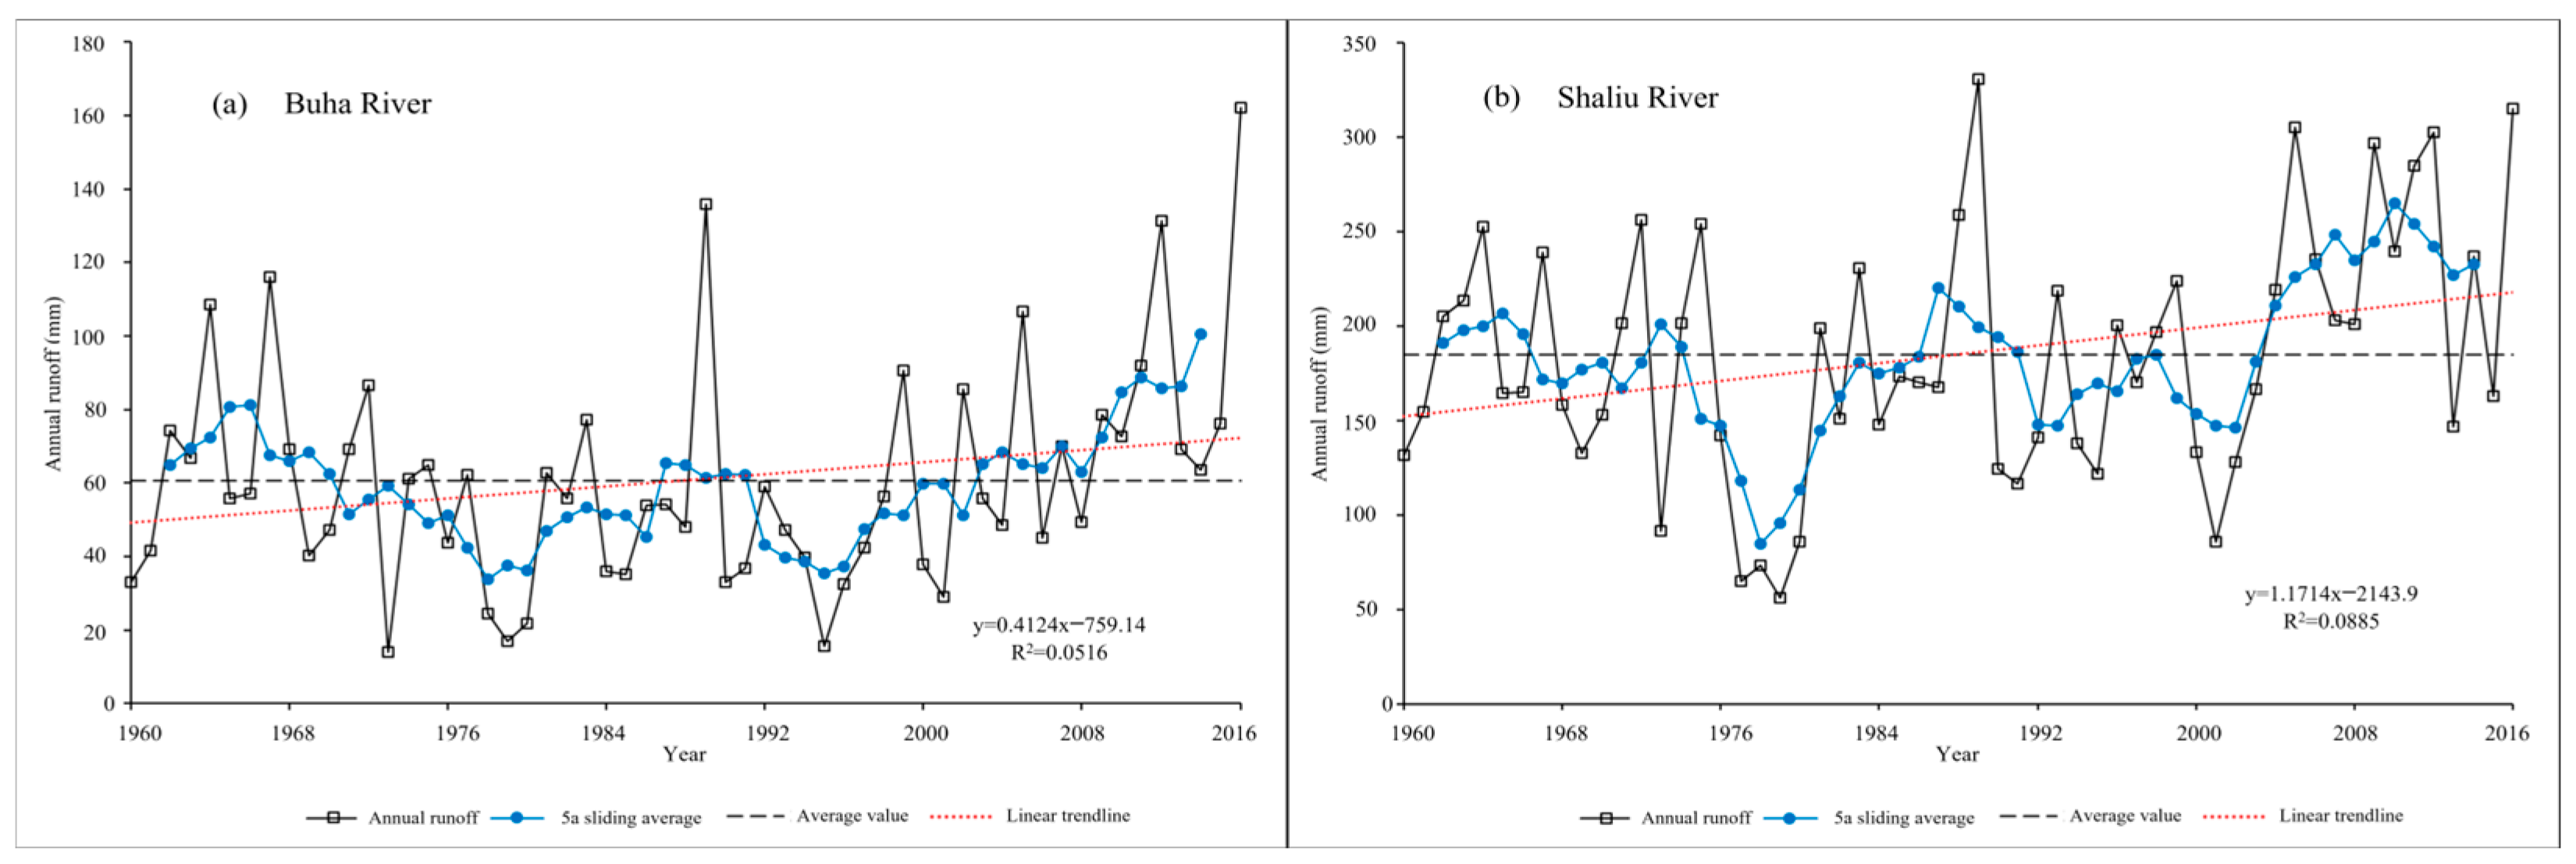
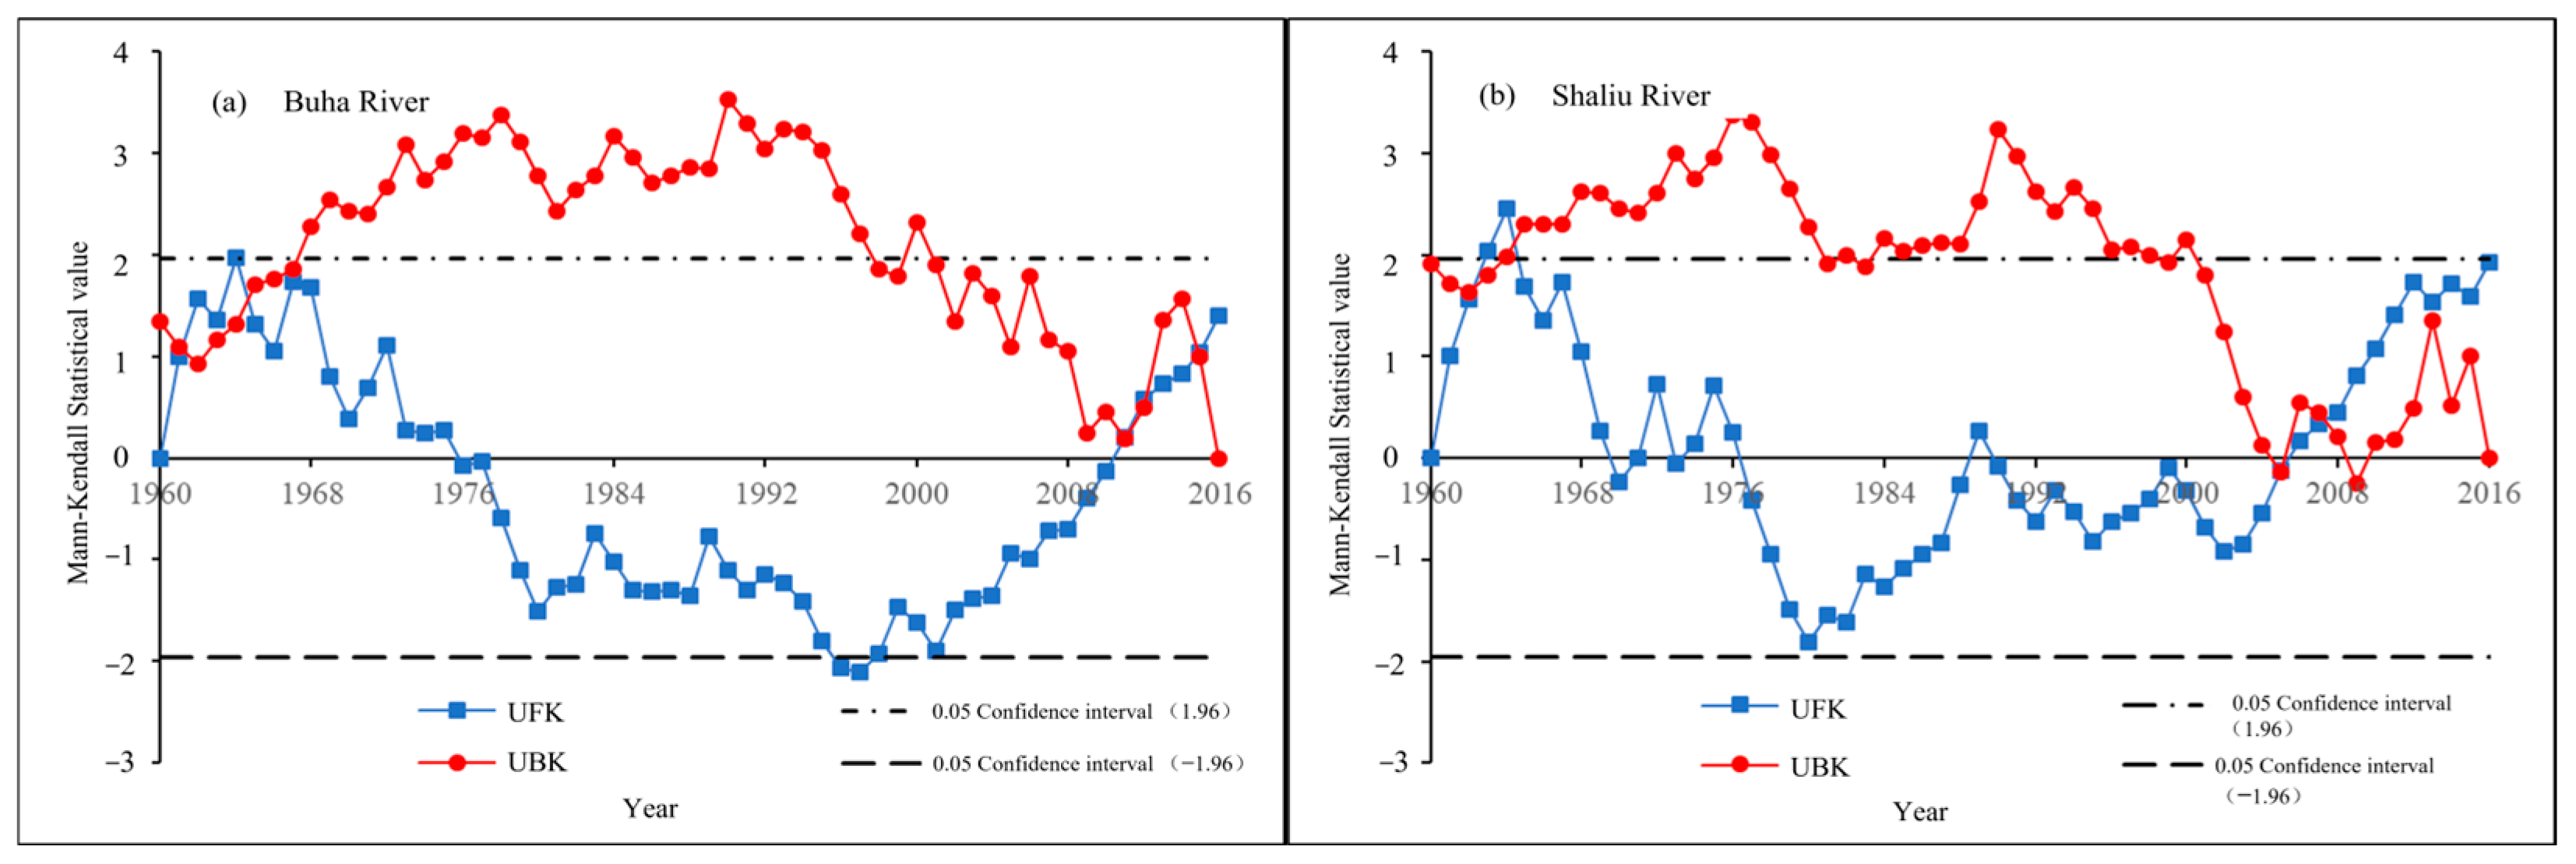
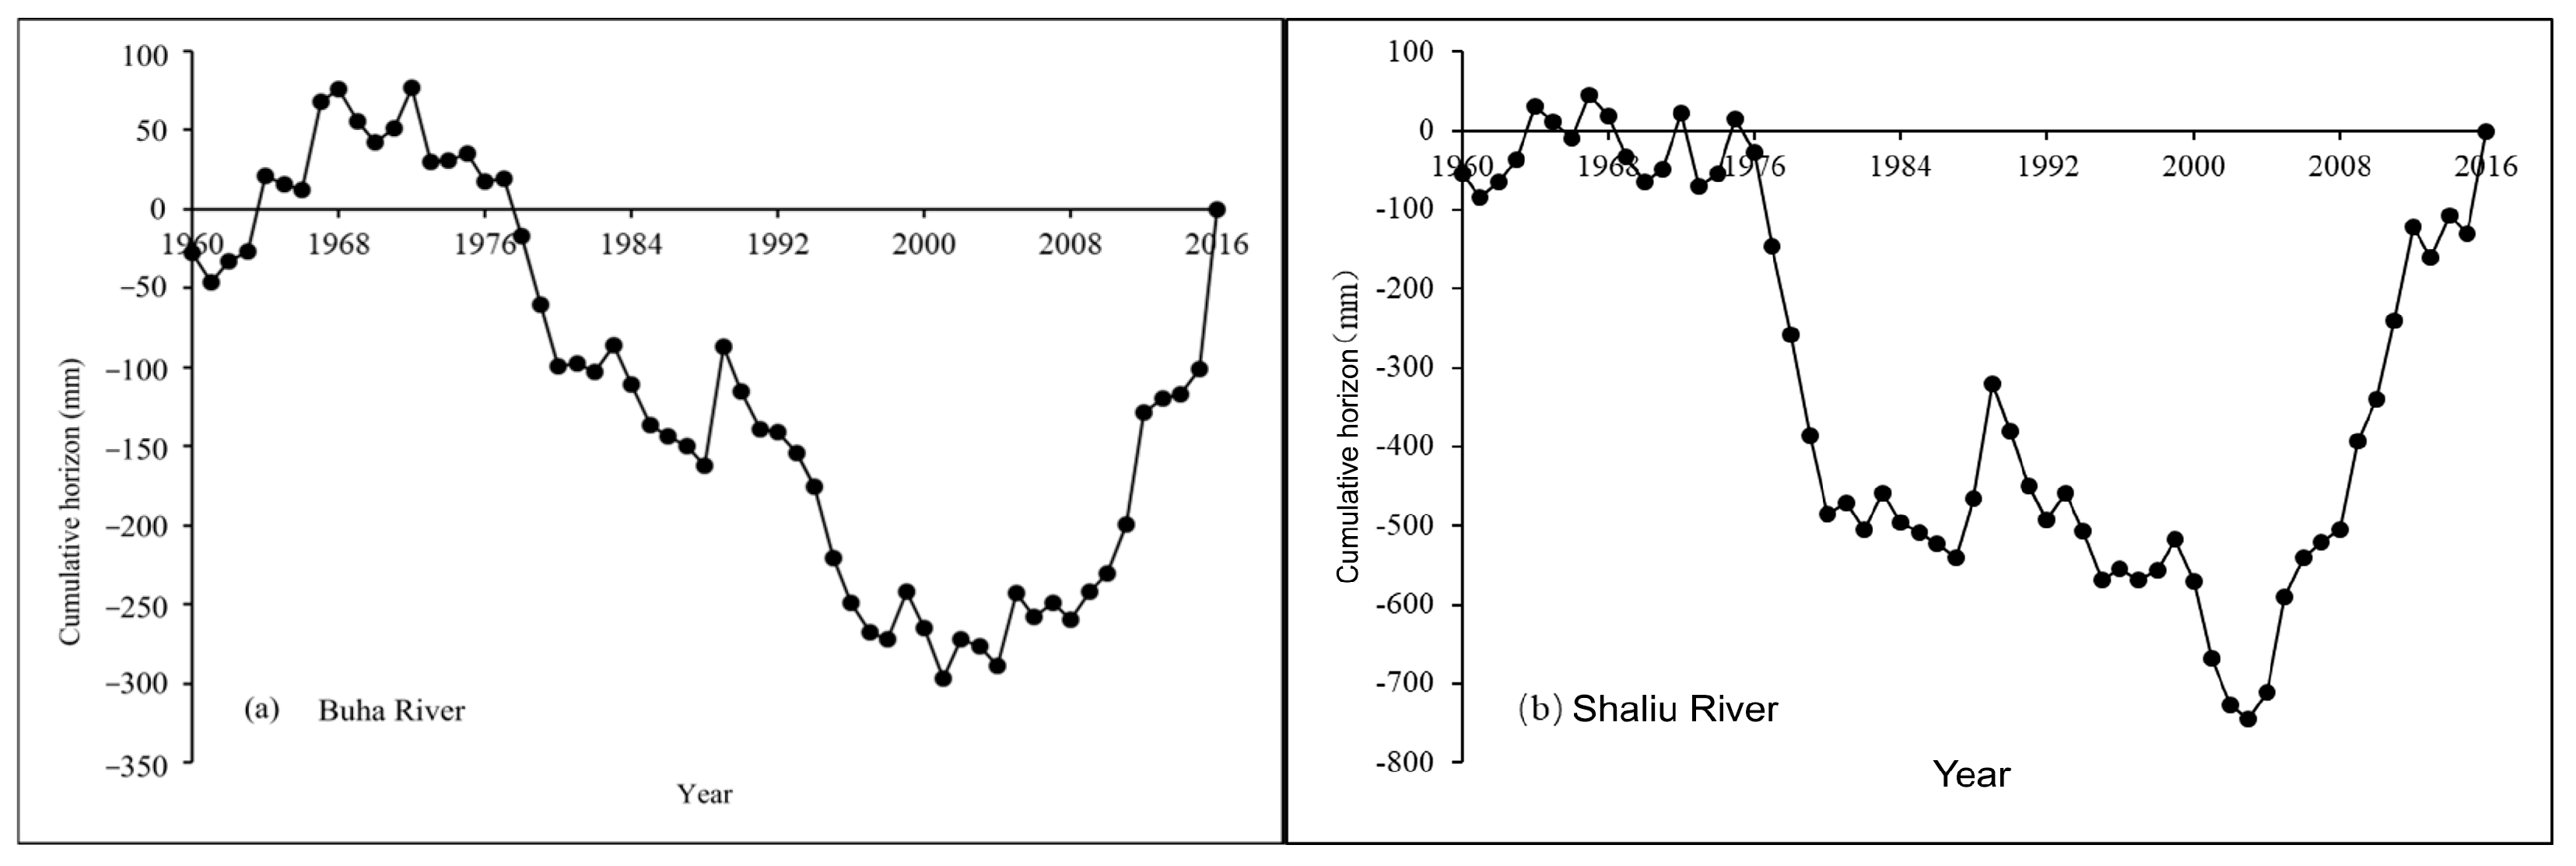
3.3. Interannual Runoff Variations

Based on daily runoff data from three hydrological stations in the Buha and Shaliu rivers from 1960 to 2016, a detailed analysis of the interannual runoff depth variation trend was conducted, with the results shown in Figure 5, where (a) is the Buha River and (b) is the Shaliu River. The multi-year average runoff depth in the Buha River and Shaliu River basins is 60.72 mm and 184.95 mm, respectively. From the perspective of interannual variation trends over the entire study period, the runoff depth in both rivers shows a gradual increase amidst fluctuations, with linear trend slopes of 0.41 and 1.17, respectively, indicating an increase in runoff depth of 0.41 mm and 1.17 mm annually. The Mann–Kendall trend test for the annual runoff of the Buha and Shaliu rivers yields Z values of 1.36 and 1.91, with |Z| < 1.96, which means the increasing trend is not significant at the 0.05 confidence level.
The coefficients of variation (CVs) of the annual runoff data series for the Buha and Shaliu rivers are 0.50 and 0.35, indicating large interannual fluctuations. The maximum and minimum annual runoff values for the Buha River are 162.20 mm (2016) and 13.90 mm (1973), respectively; for the Shaliu River, they are 330.90 mm (1989) and 56.40 mm (1979), respectively.
A 5-year moving average analysis of the annual runoff from 1960 to 2016 shows that the annual runoff trends of the Buha and Shaliu rivers are relatively consistent. Both rivers experienced a significant decline in the 1960s and 1970s, an increasing trend in the 1980s (with the Shaliu River showing a stronger increase than the Buha River), a brief decline from 1990 to 1995, and a noticeable increase since 1995. The annual runoff depth of the Buha River and Shaliu River generally exhibits an upward trend. However, due to the complex interactions of various factors, there is considerable interannual variability, with some periods showing a downward trend. This reflects the combined effects of natural environmental changes and human activities.
The Mann–Kendall mutation point test for the annual runoff of the Buha River (Figure 6) shows that the UFK statistics for the Buha River annual runoff are negative from 1977 to 2010, indicating a downward trend, while UFK is positive from 1960 to 1976 and from 2011 to 2016, indicating an upward trend. Although the UFK and UBK statistics intersect only at the two ends of the time series, specifically in 1961, 1965, 2011, 2012, and 2015, no definitive mutation point appears as these intersections are at the start and end of the data series. For the Shaliu River, the UFK statistics for annual runoff are negative from 1977 to 2005, indicating a downward trend, while UFK is positive from 1960 to 1976 and from 2006 to 2016, indicating an upward trend. The intersection of the UFK and UBK statistics occurs in 2005 and lies within the 0.05 significance level confidence interval, meaning the Shaliu River runoff series underwent a mutation in 2005.
Additionally, the cumulative anomaly method was used to further analyze the development trends and mutation points of the annual runoff of the two rivers (Figure 7). The results indicate mutation points in 2004 for the Buha River and 2003 and 2007 for the Shaliu River. Therefore, the mutation point of the Buha River runoff is identified in 2004, while the Shaliu River’s runoff underwent a mutation starting in 2003. The mutation in the Buha River occurred one year later than in the Shaliu River, which is related to the larger catchment area and longer confluence time of the Buha River.

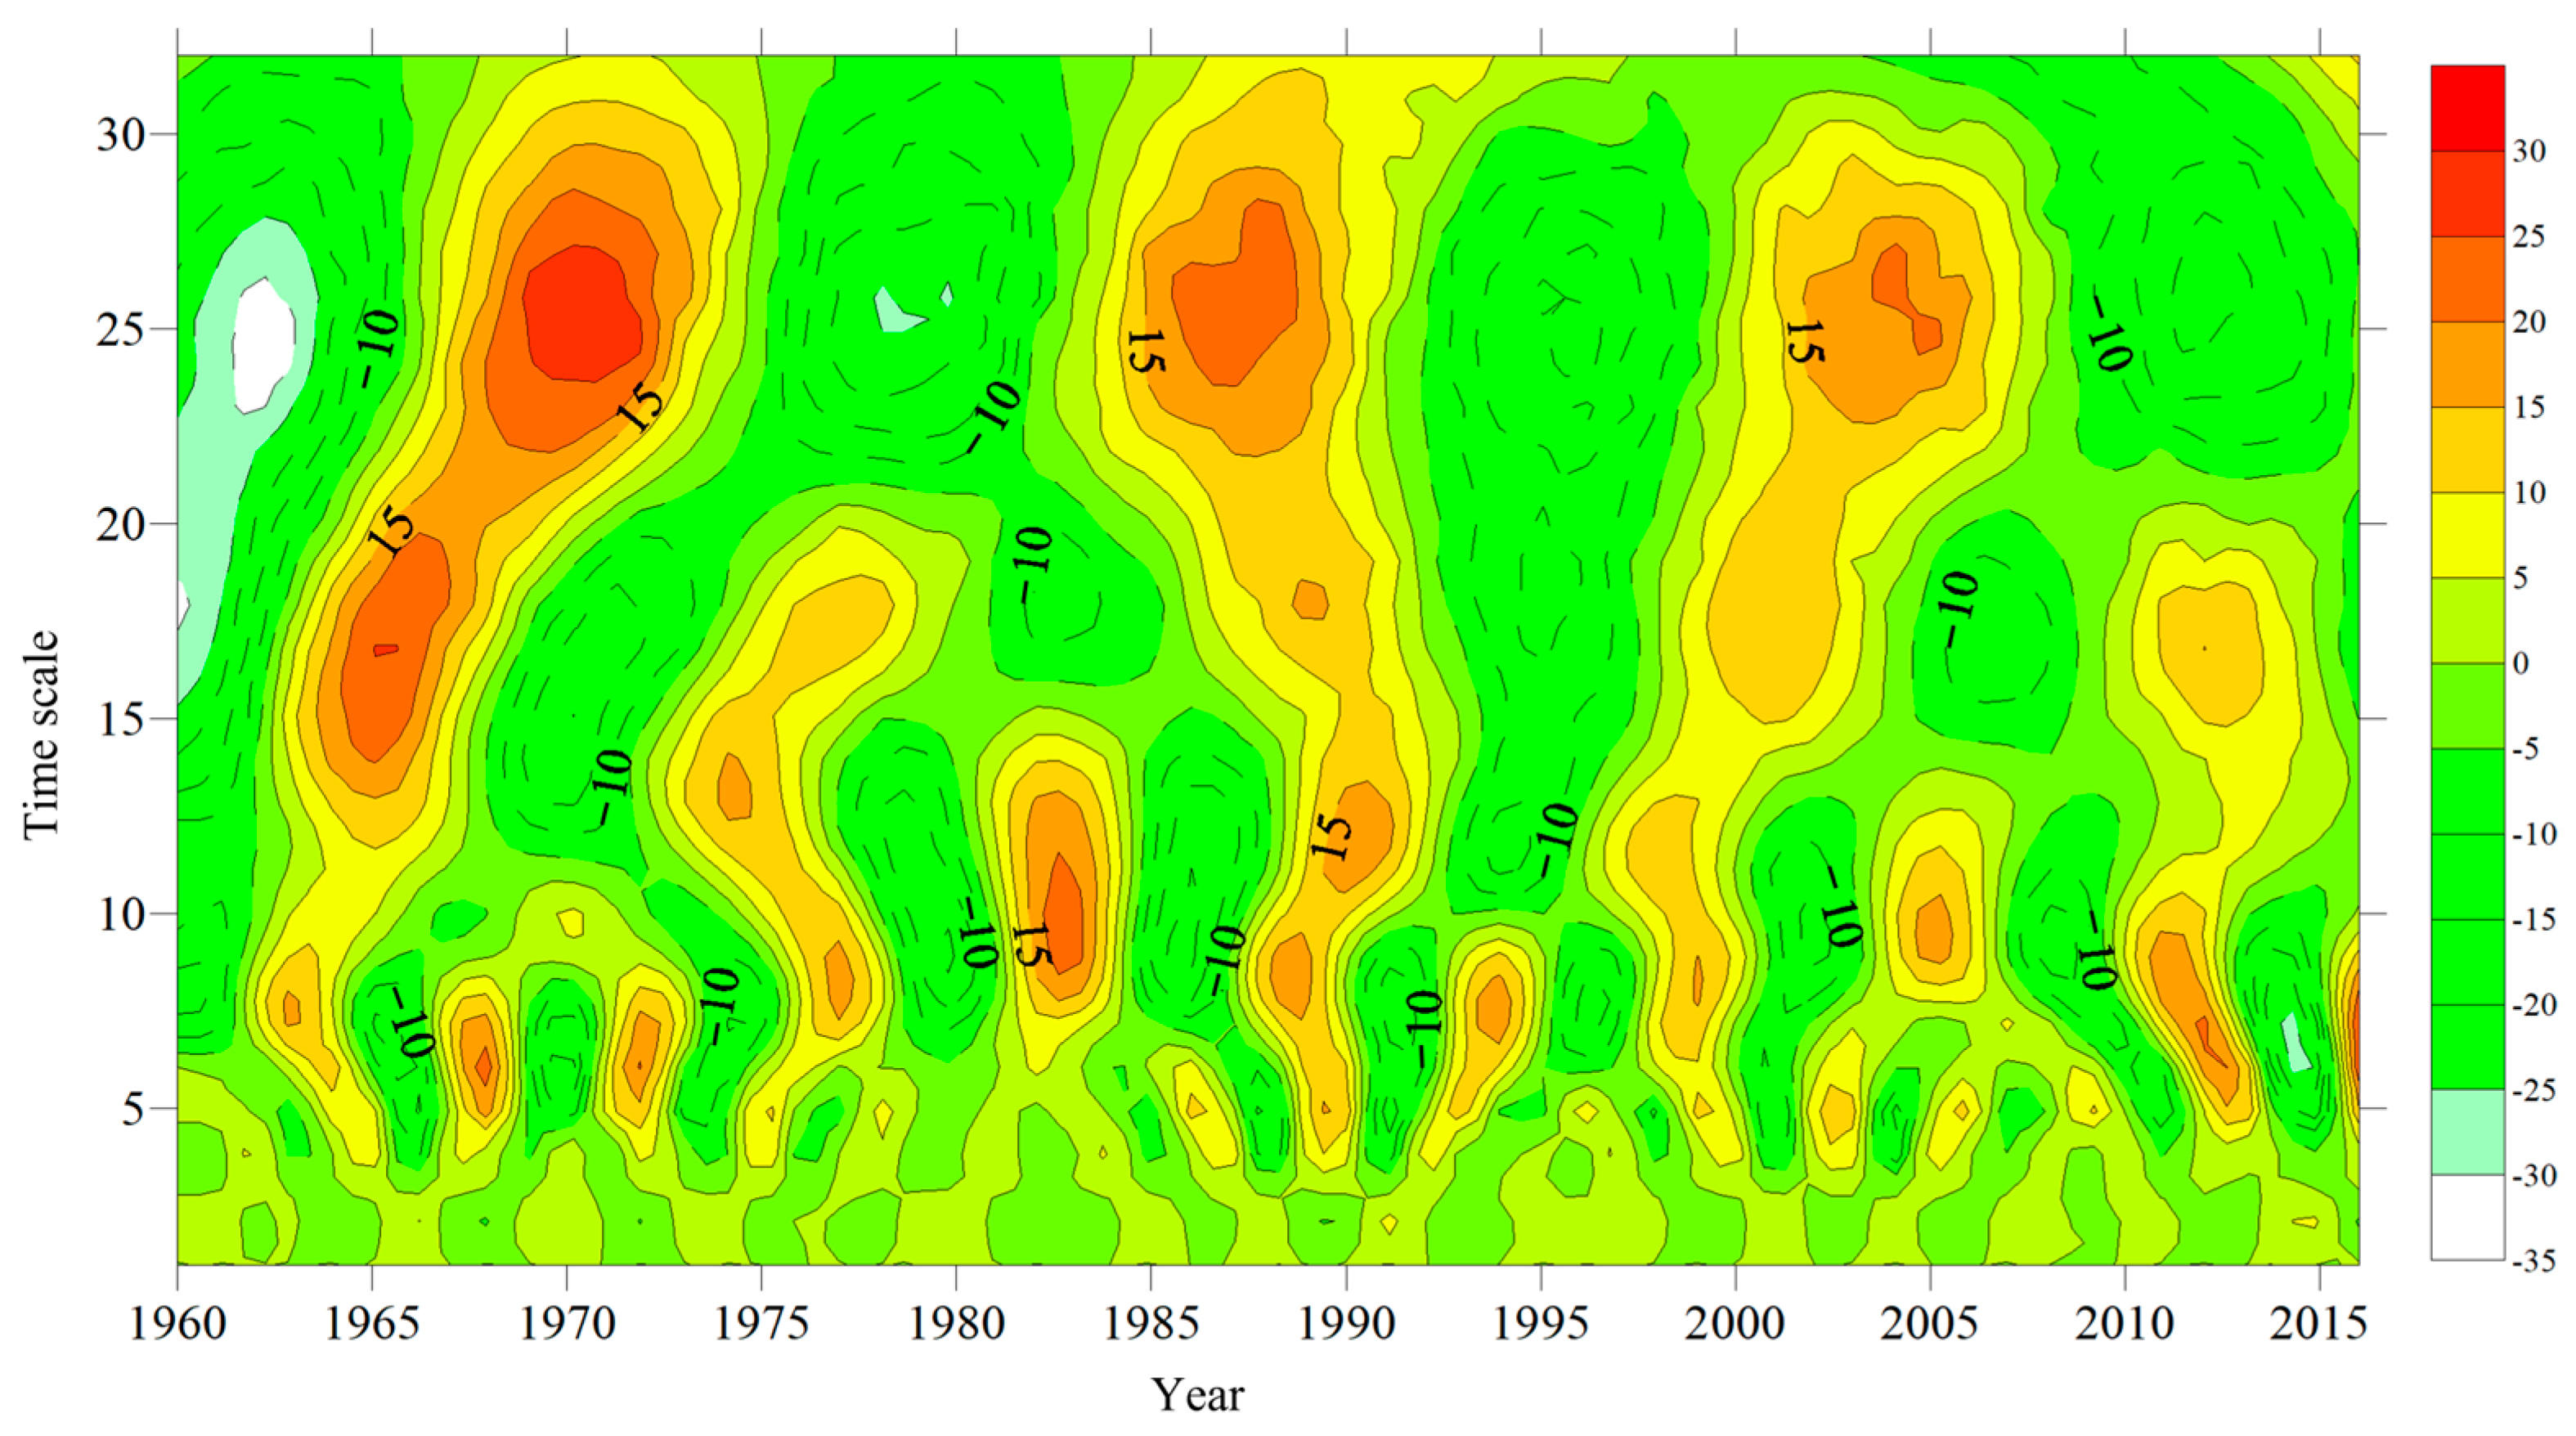
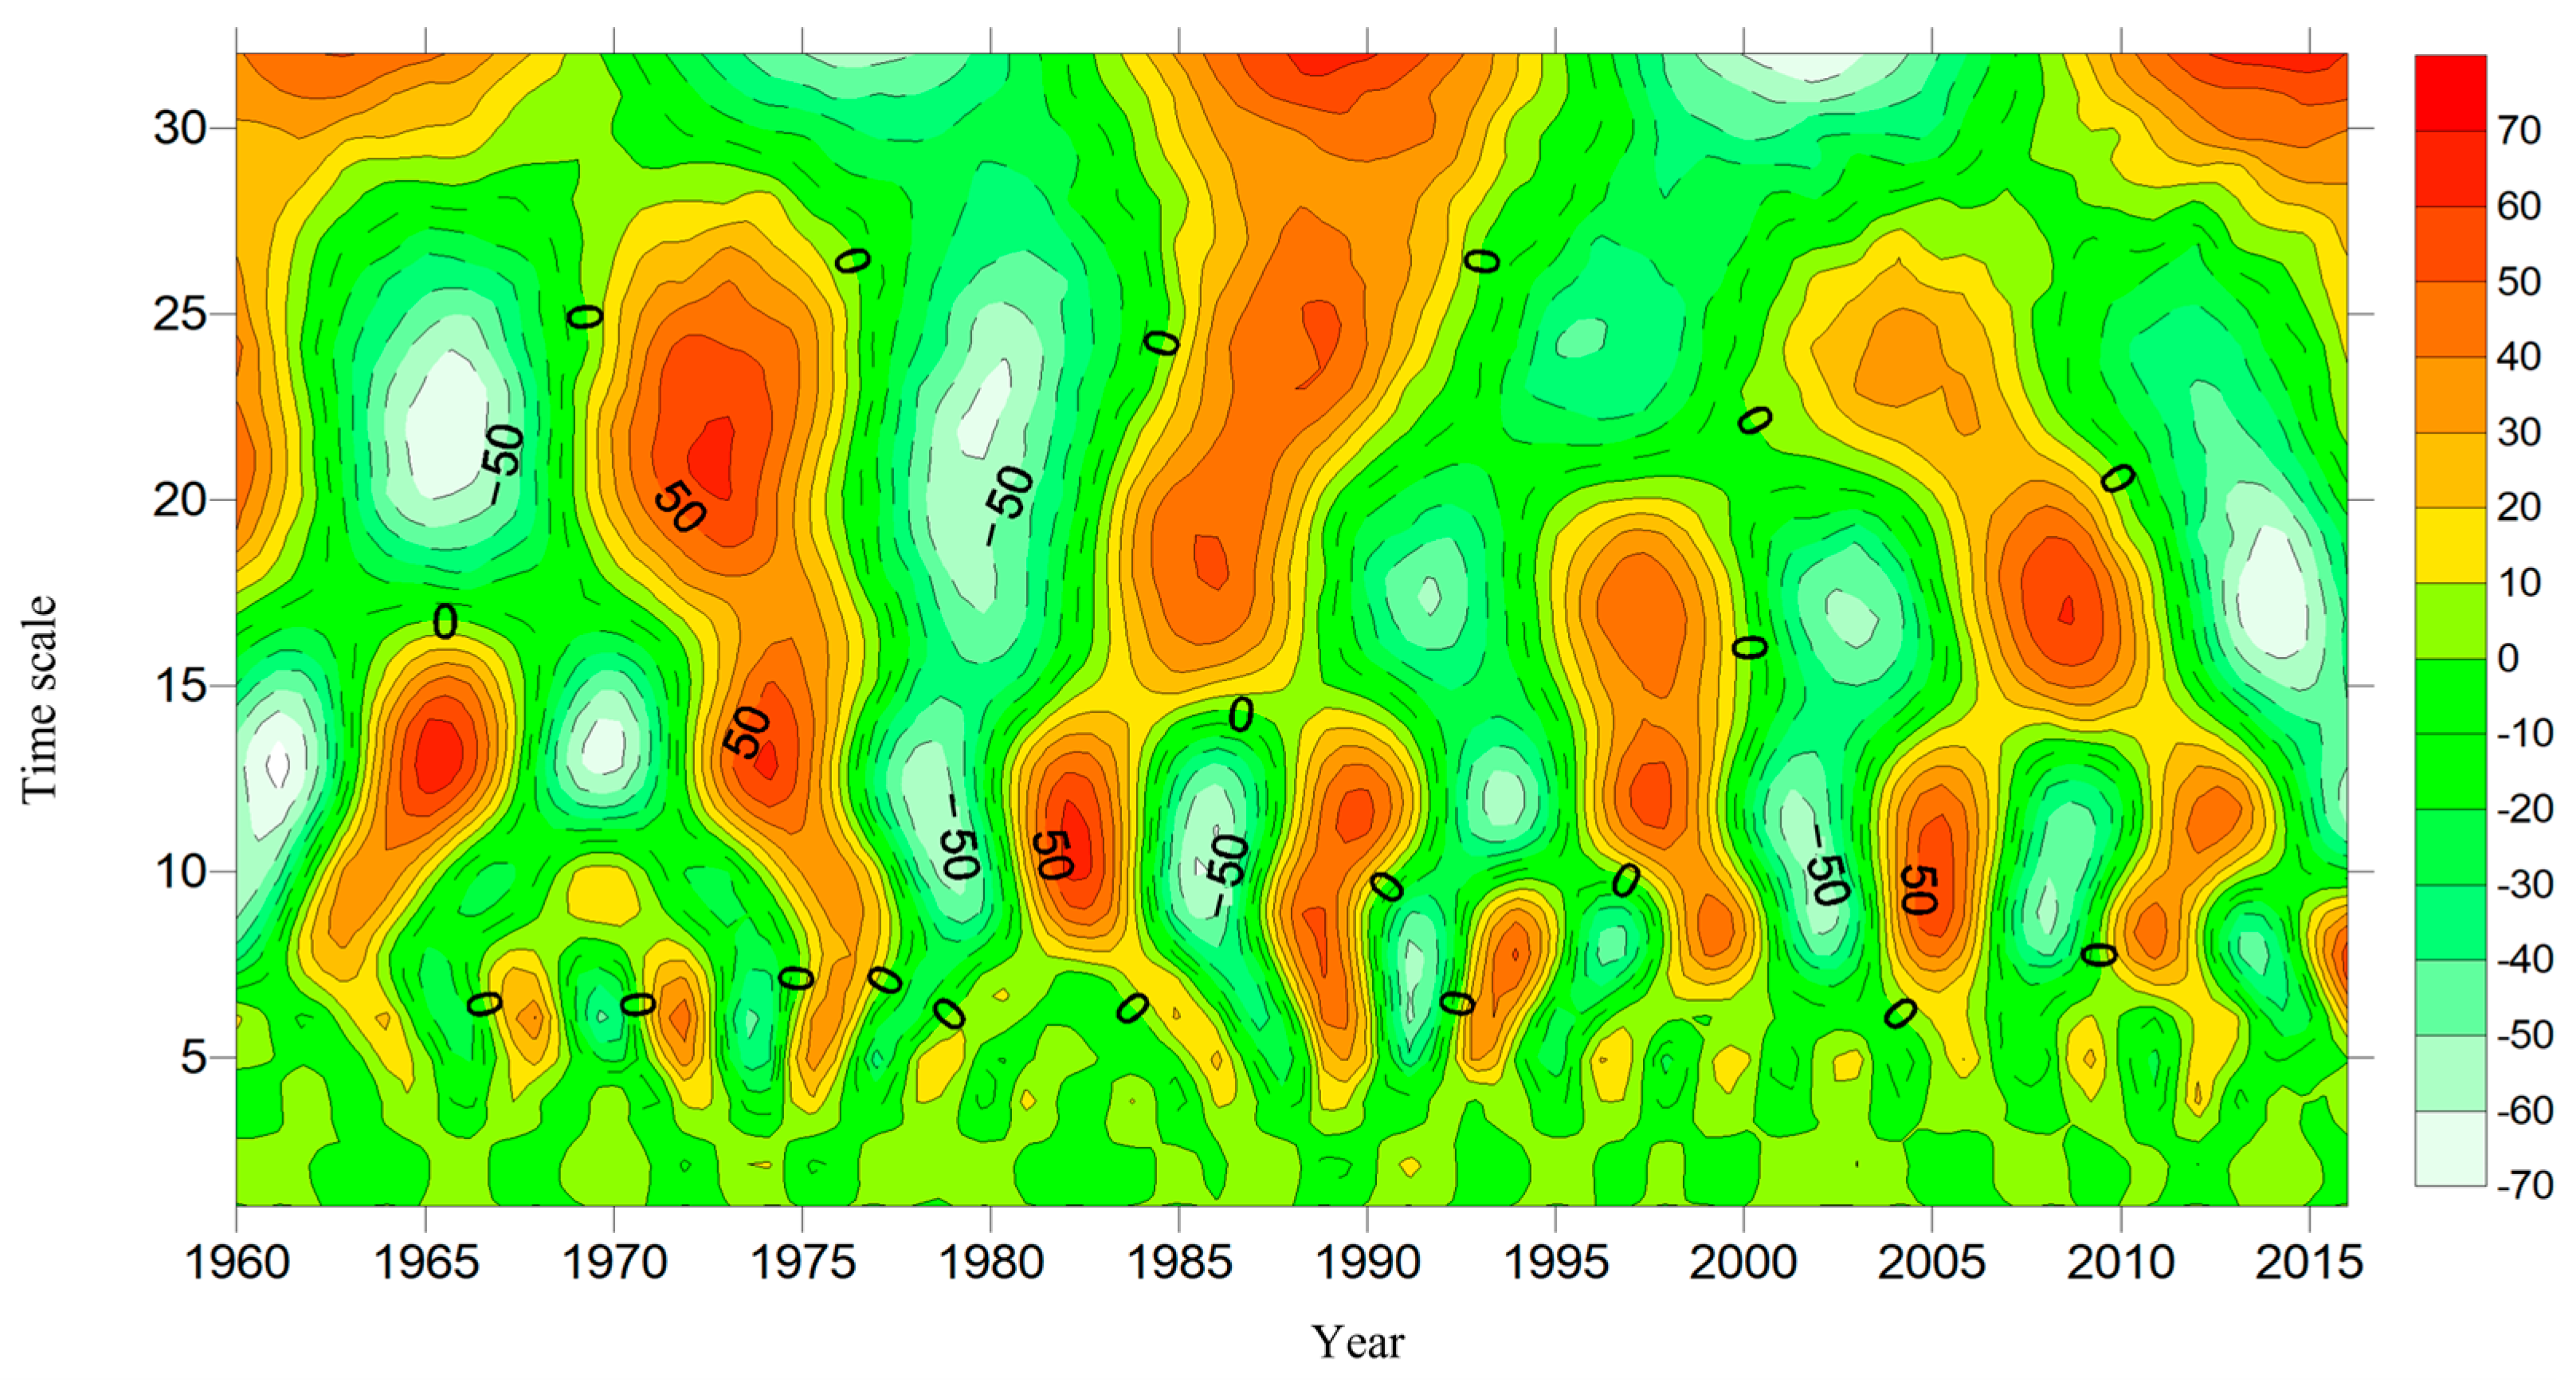
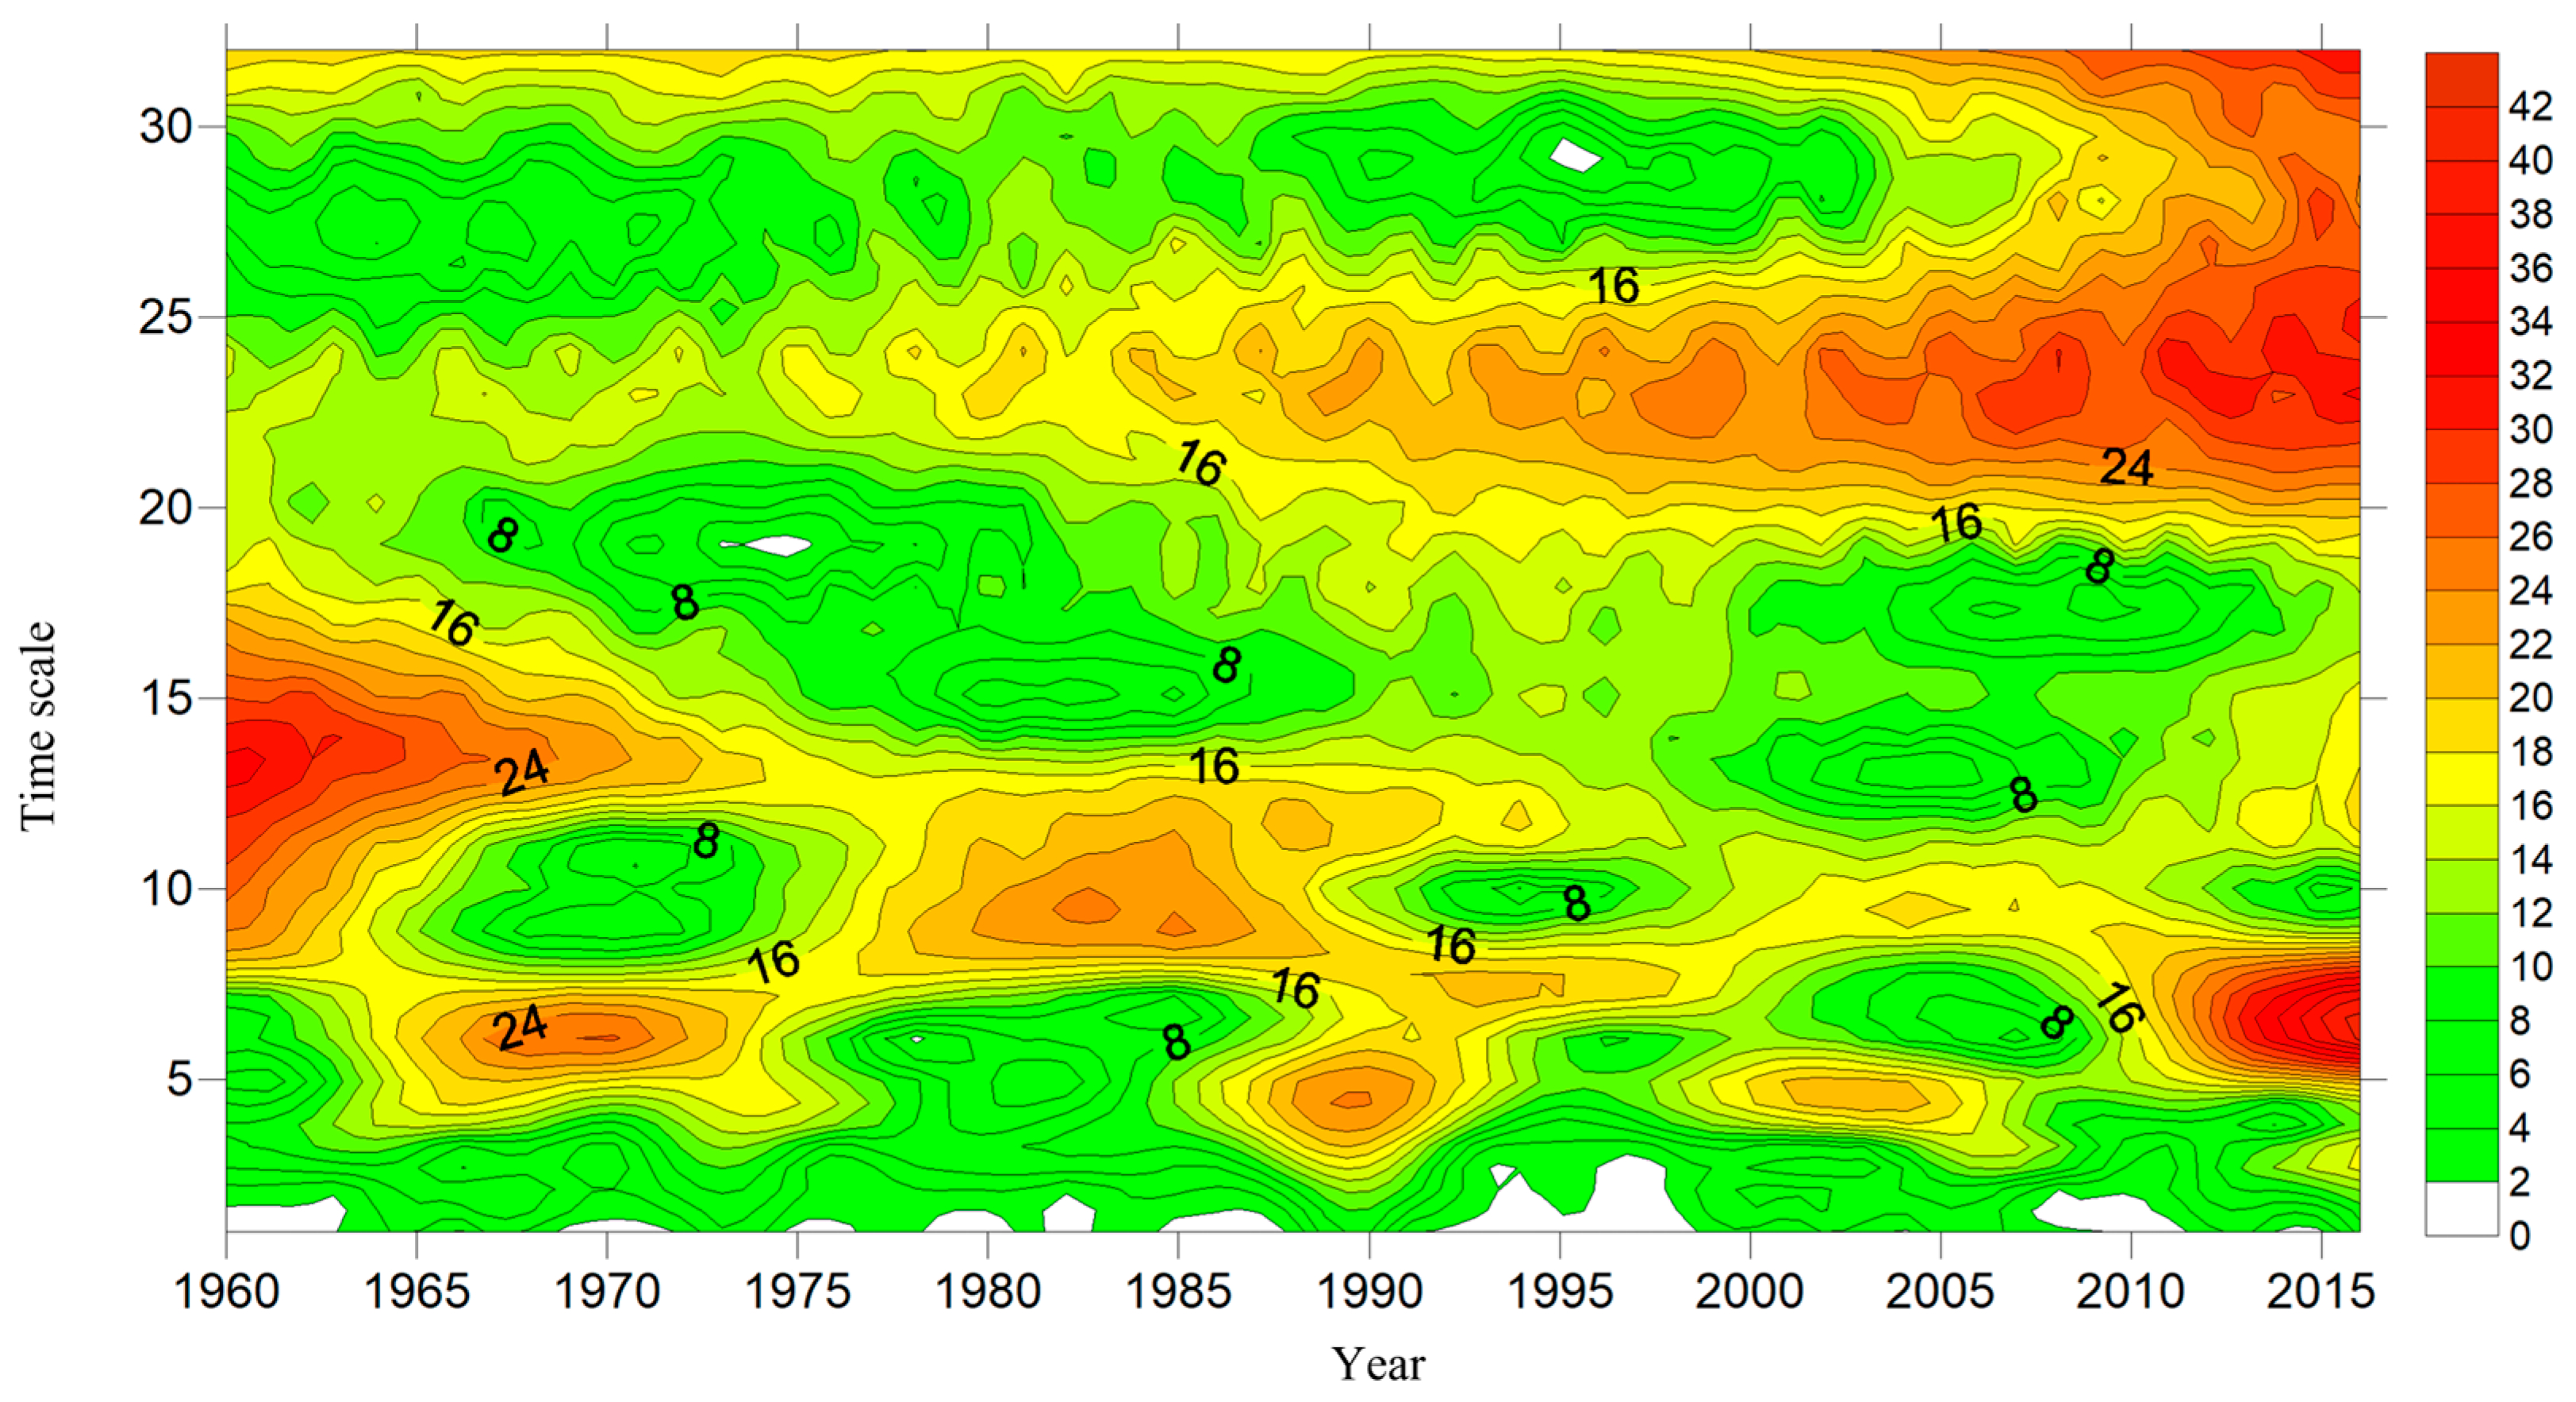
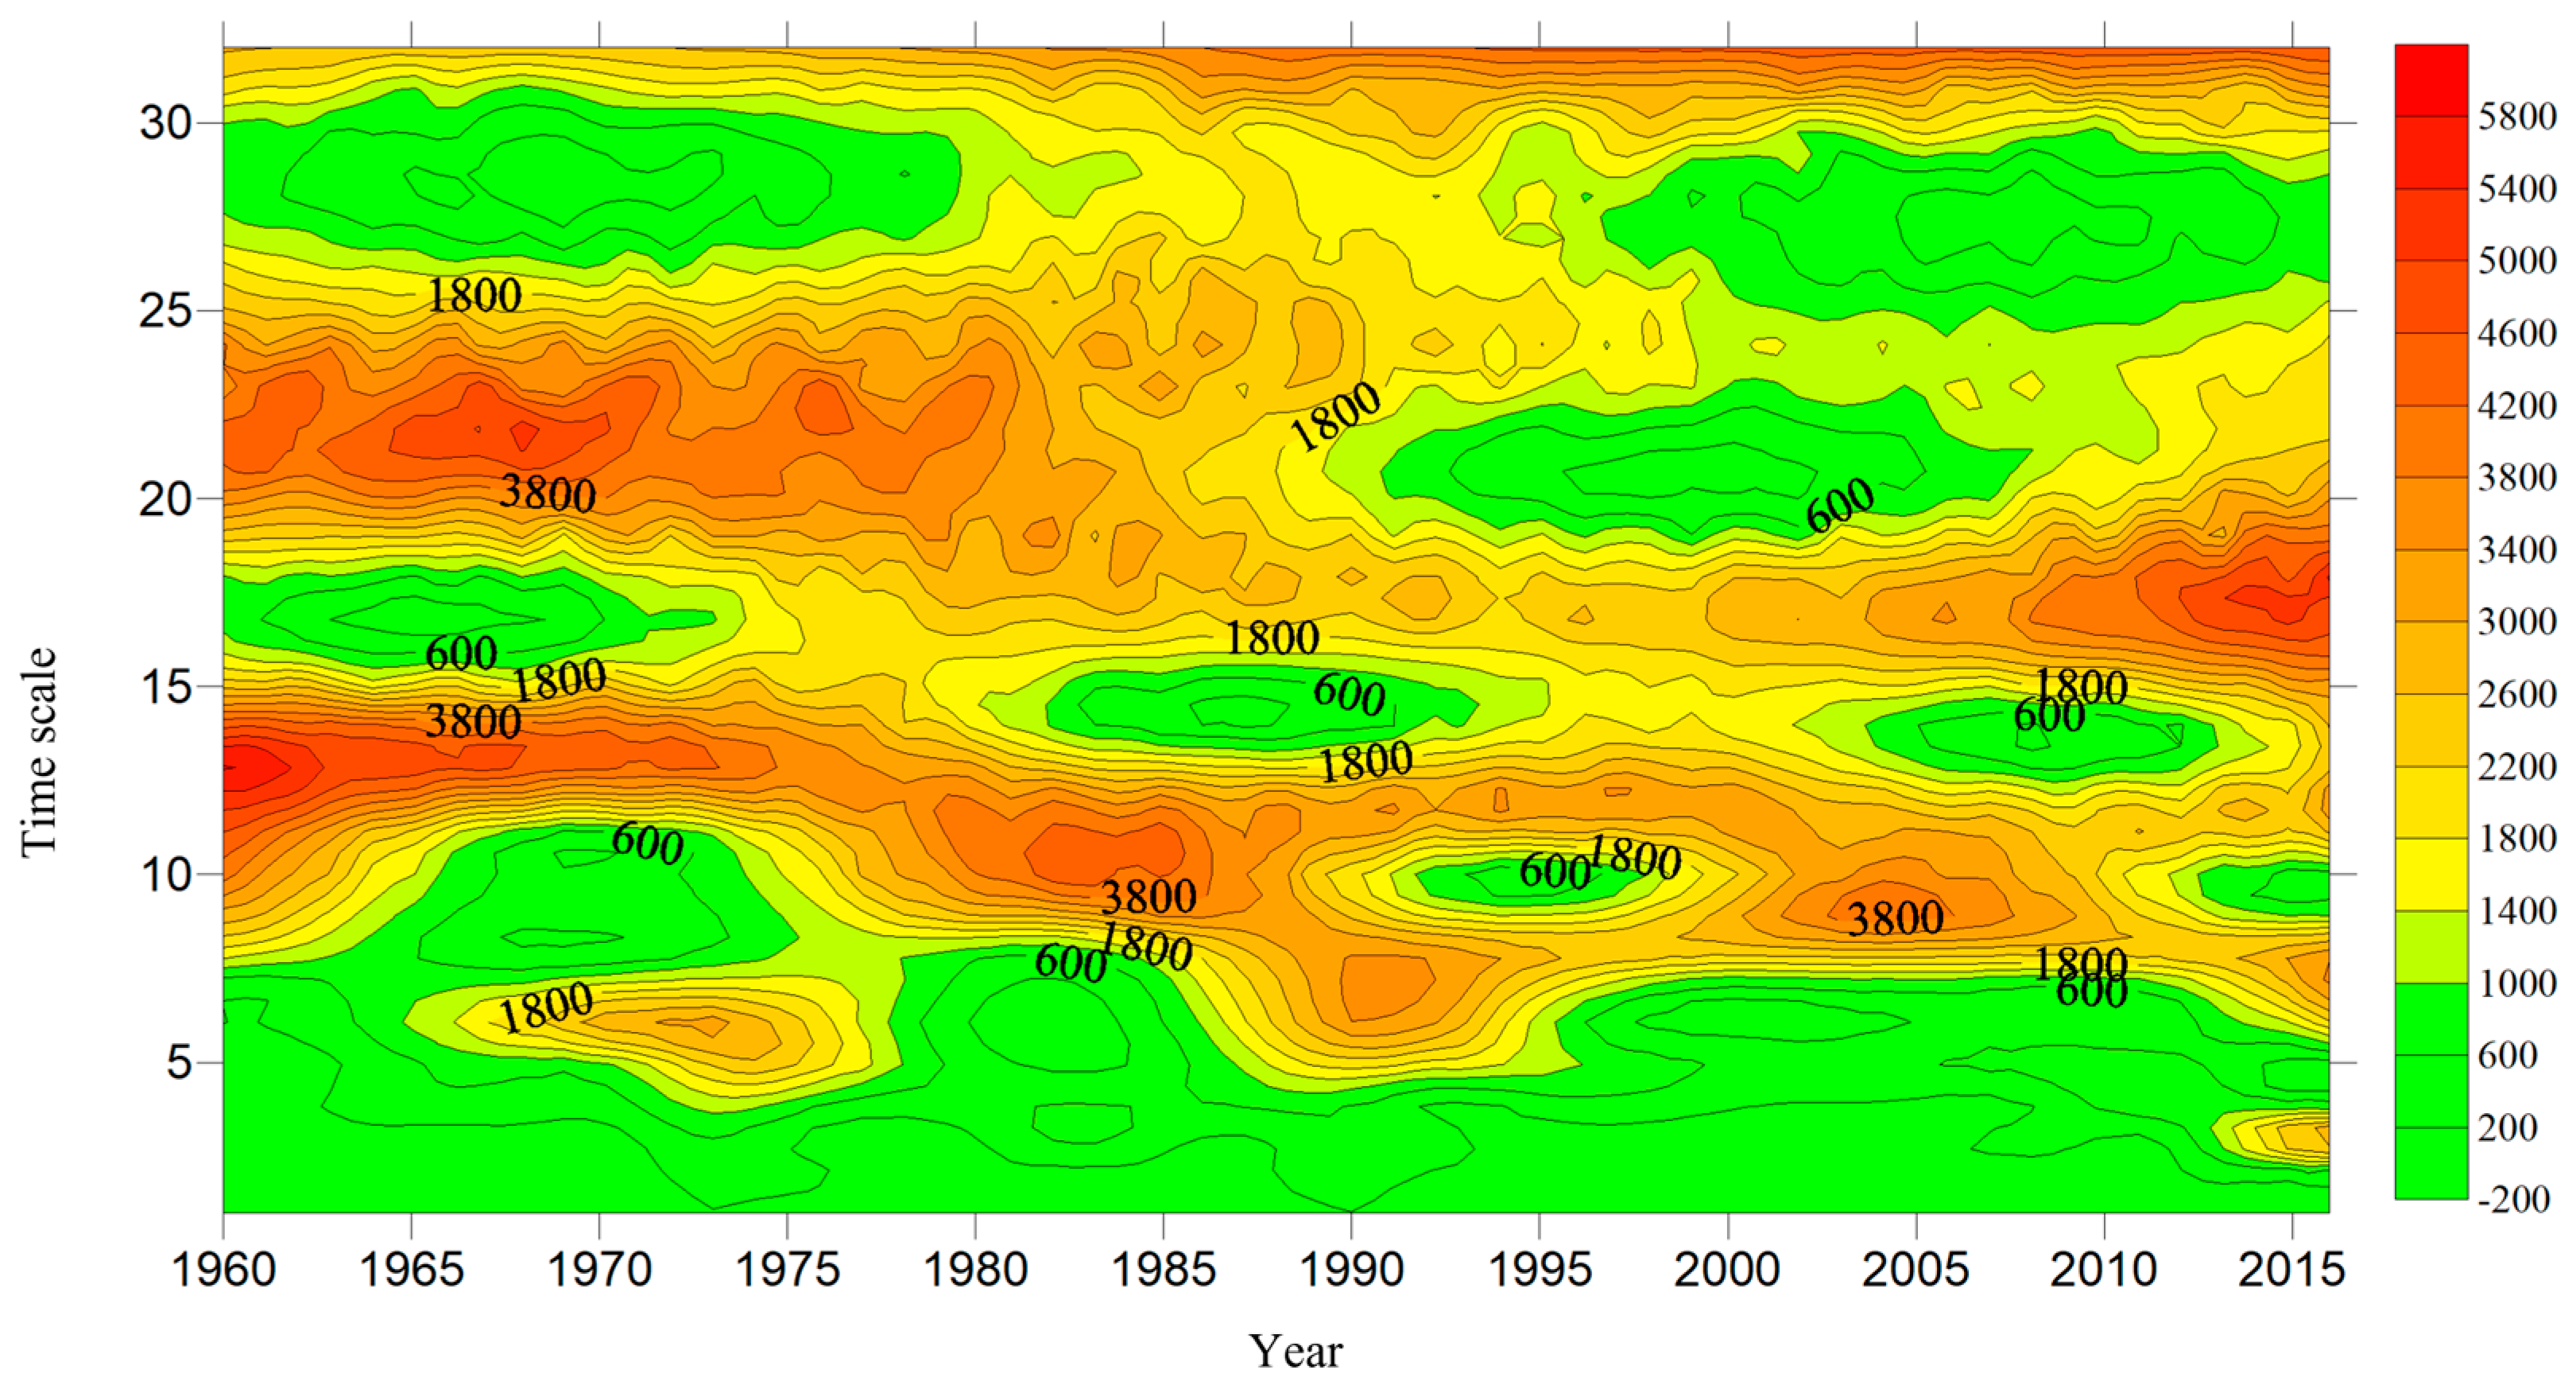
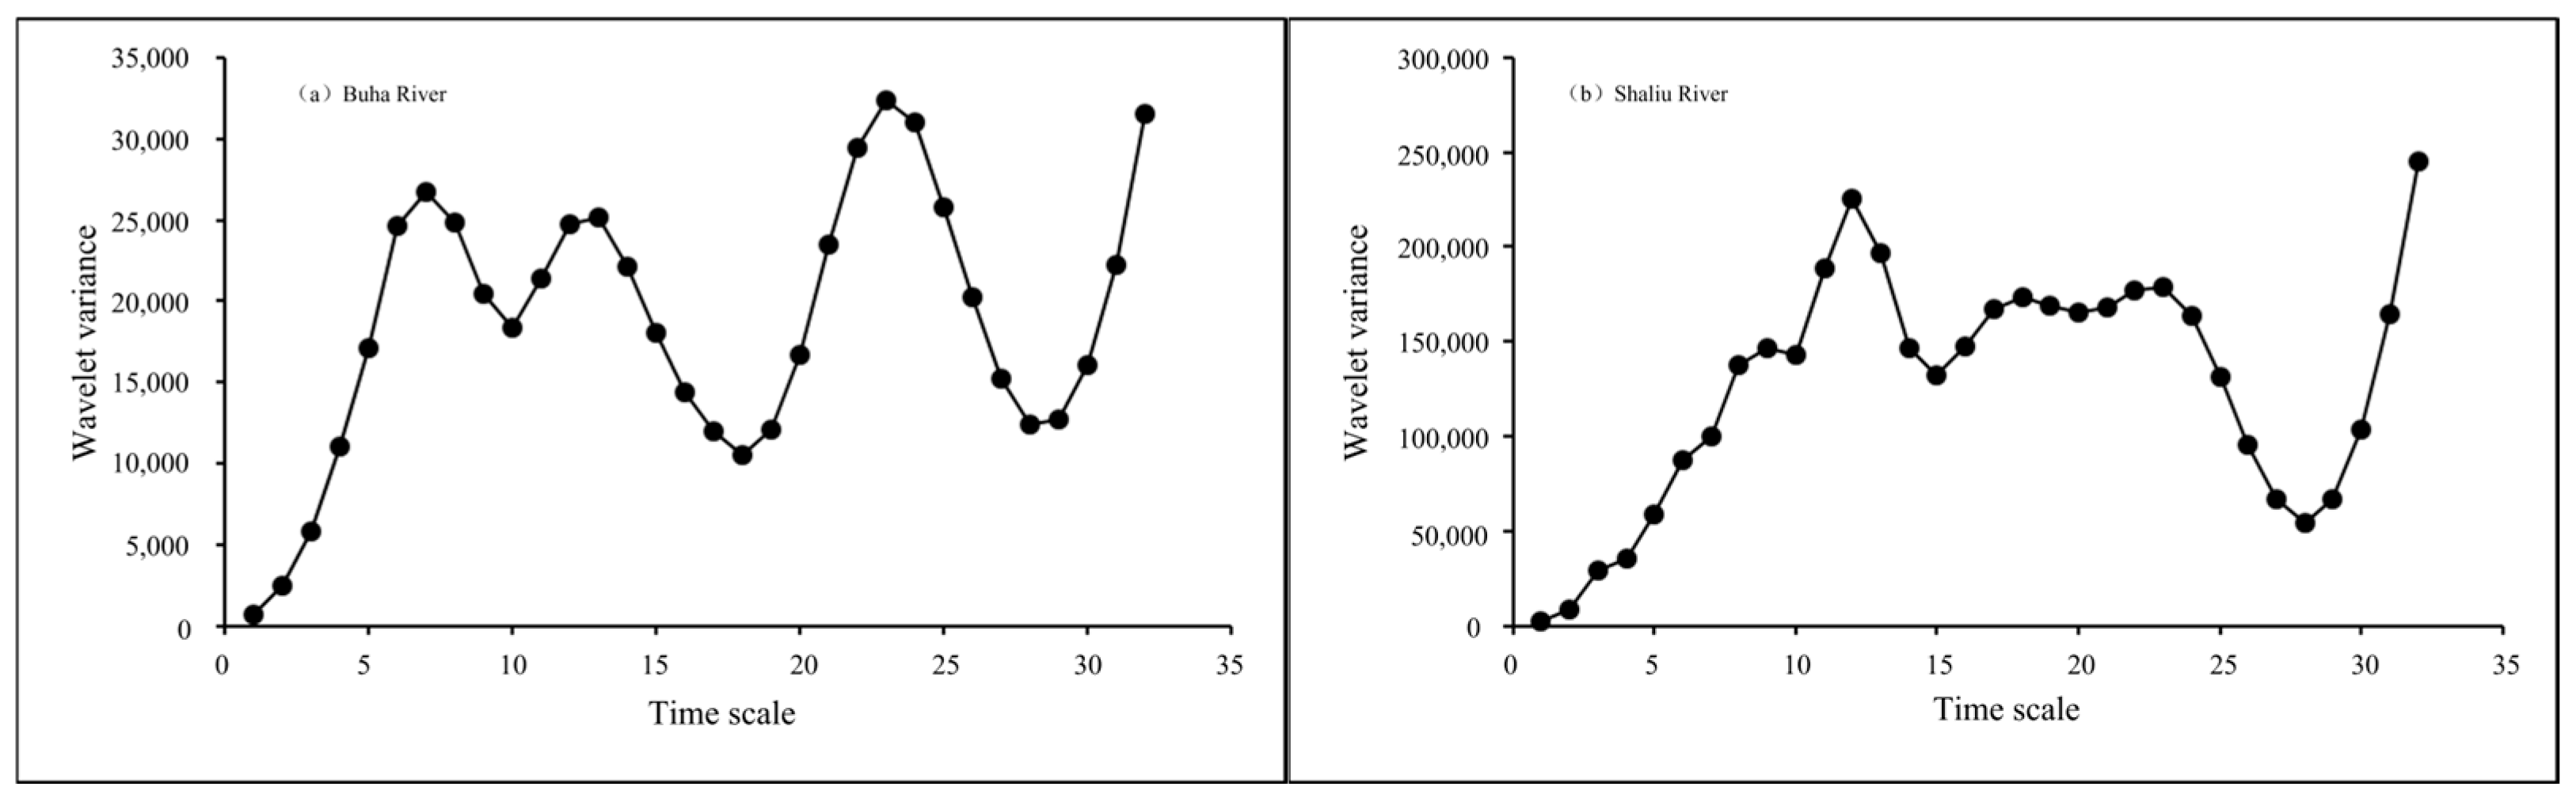
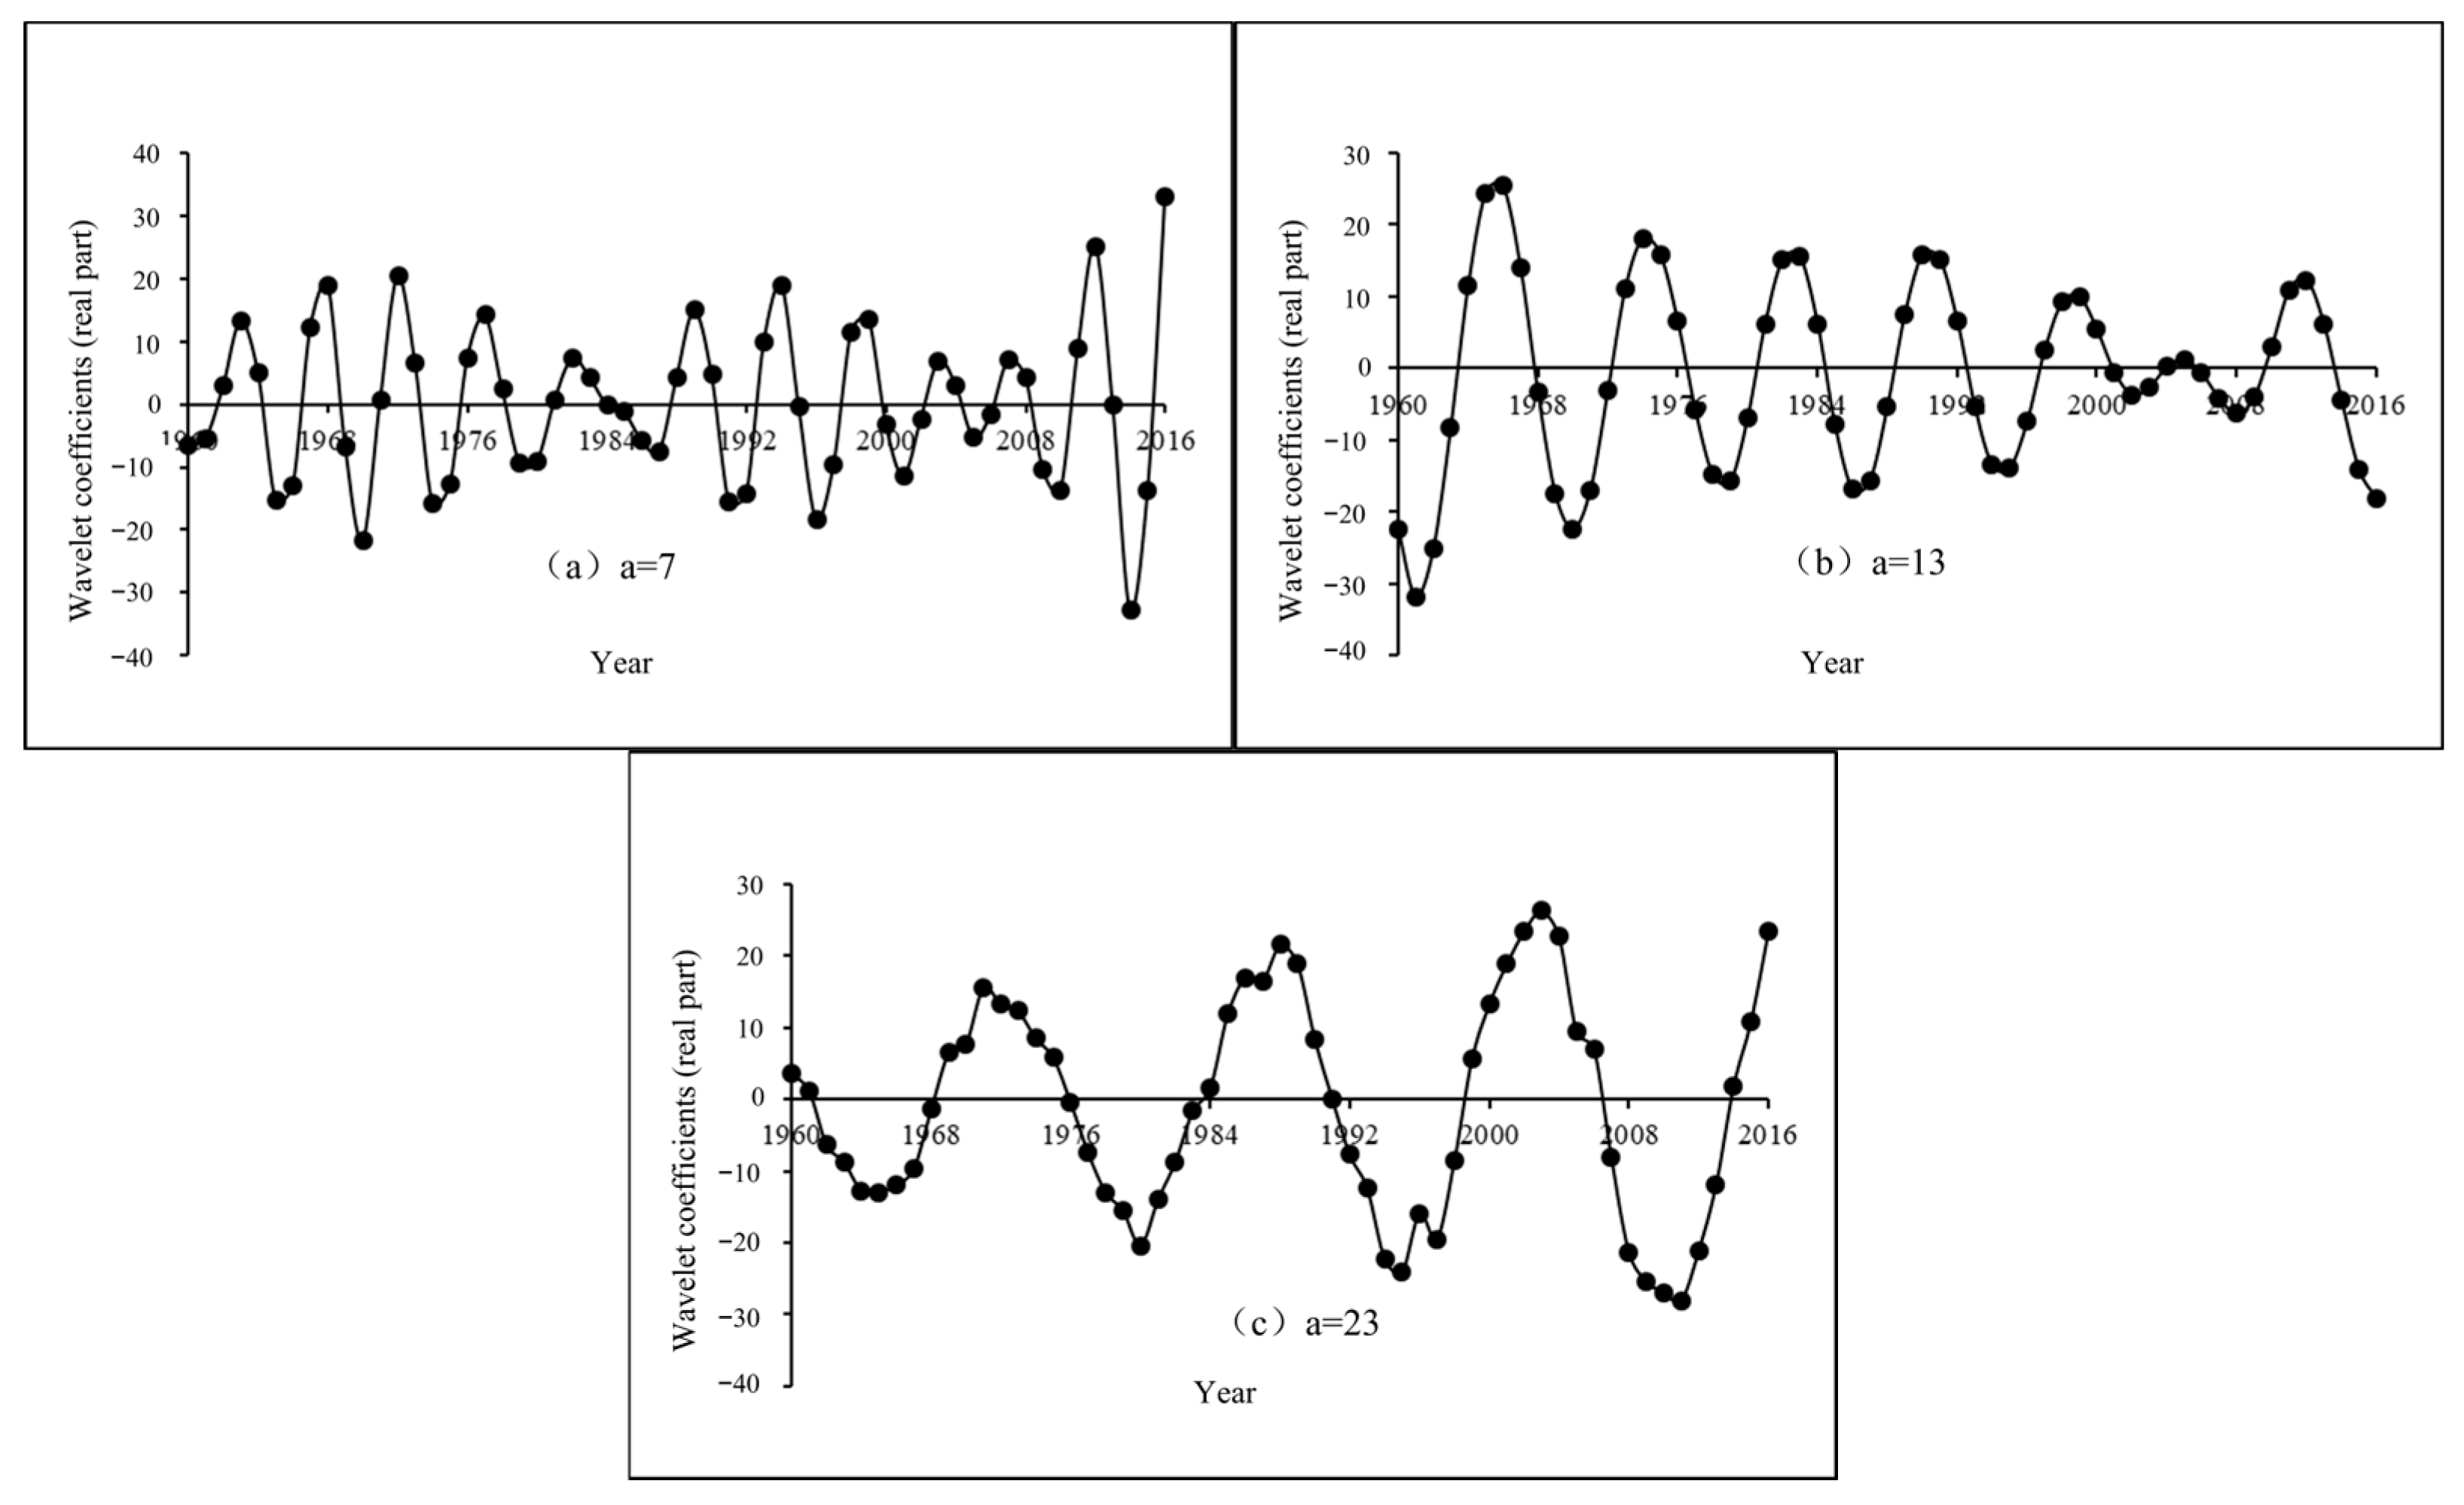
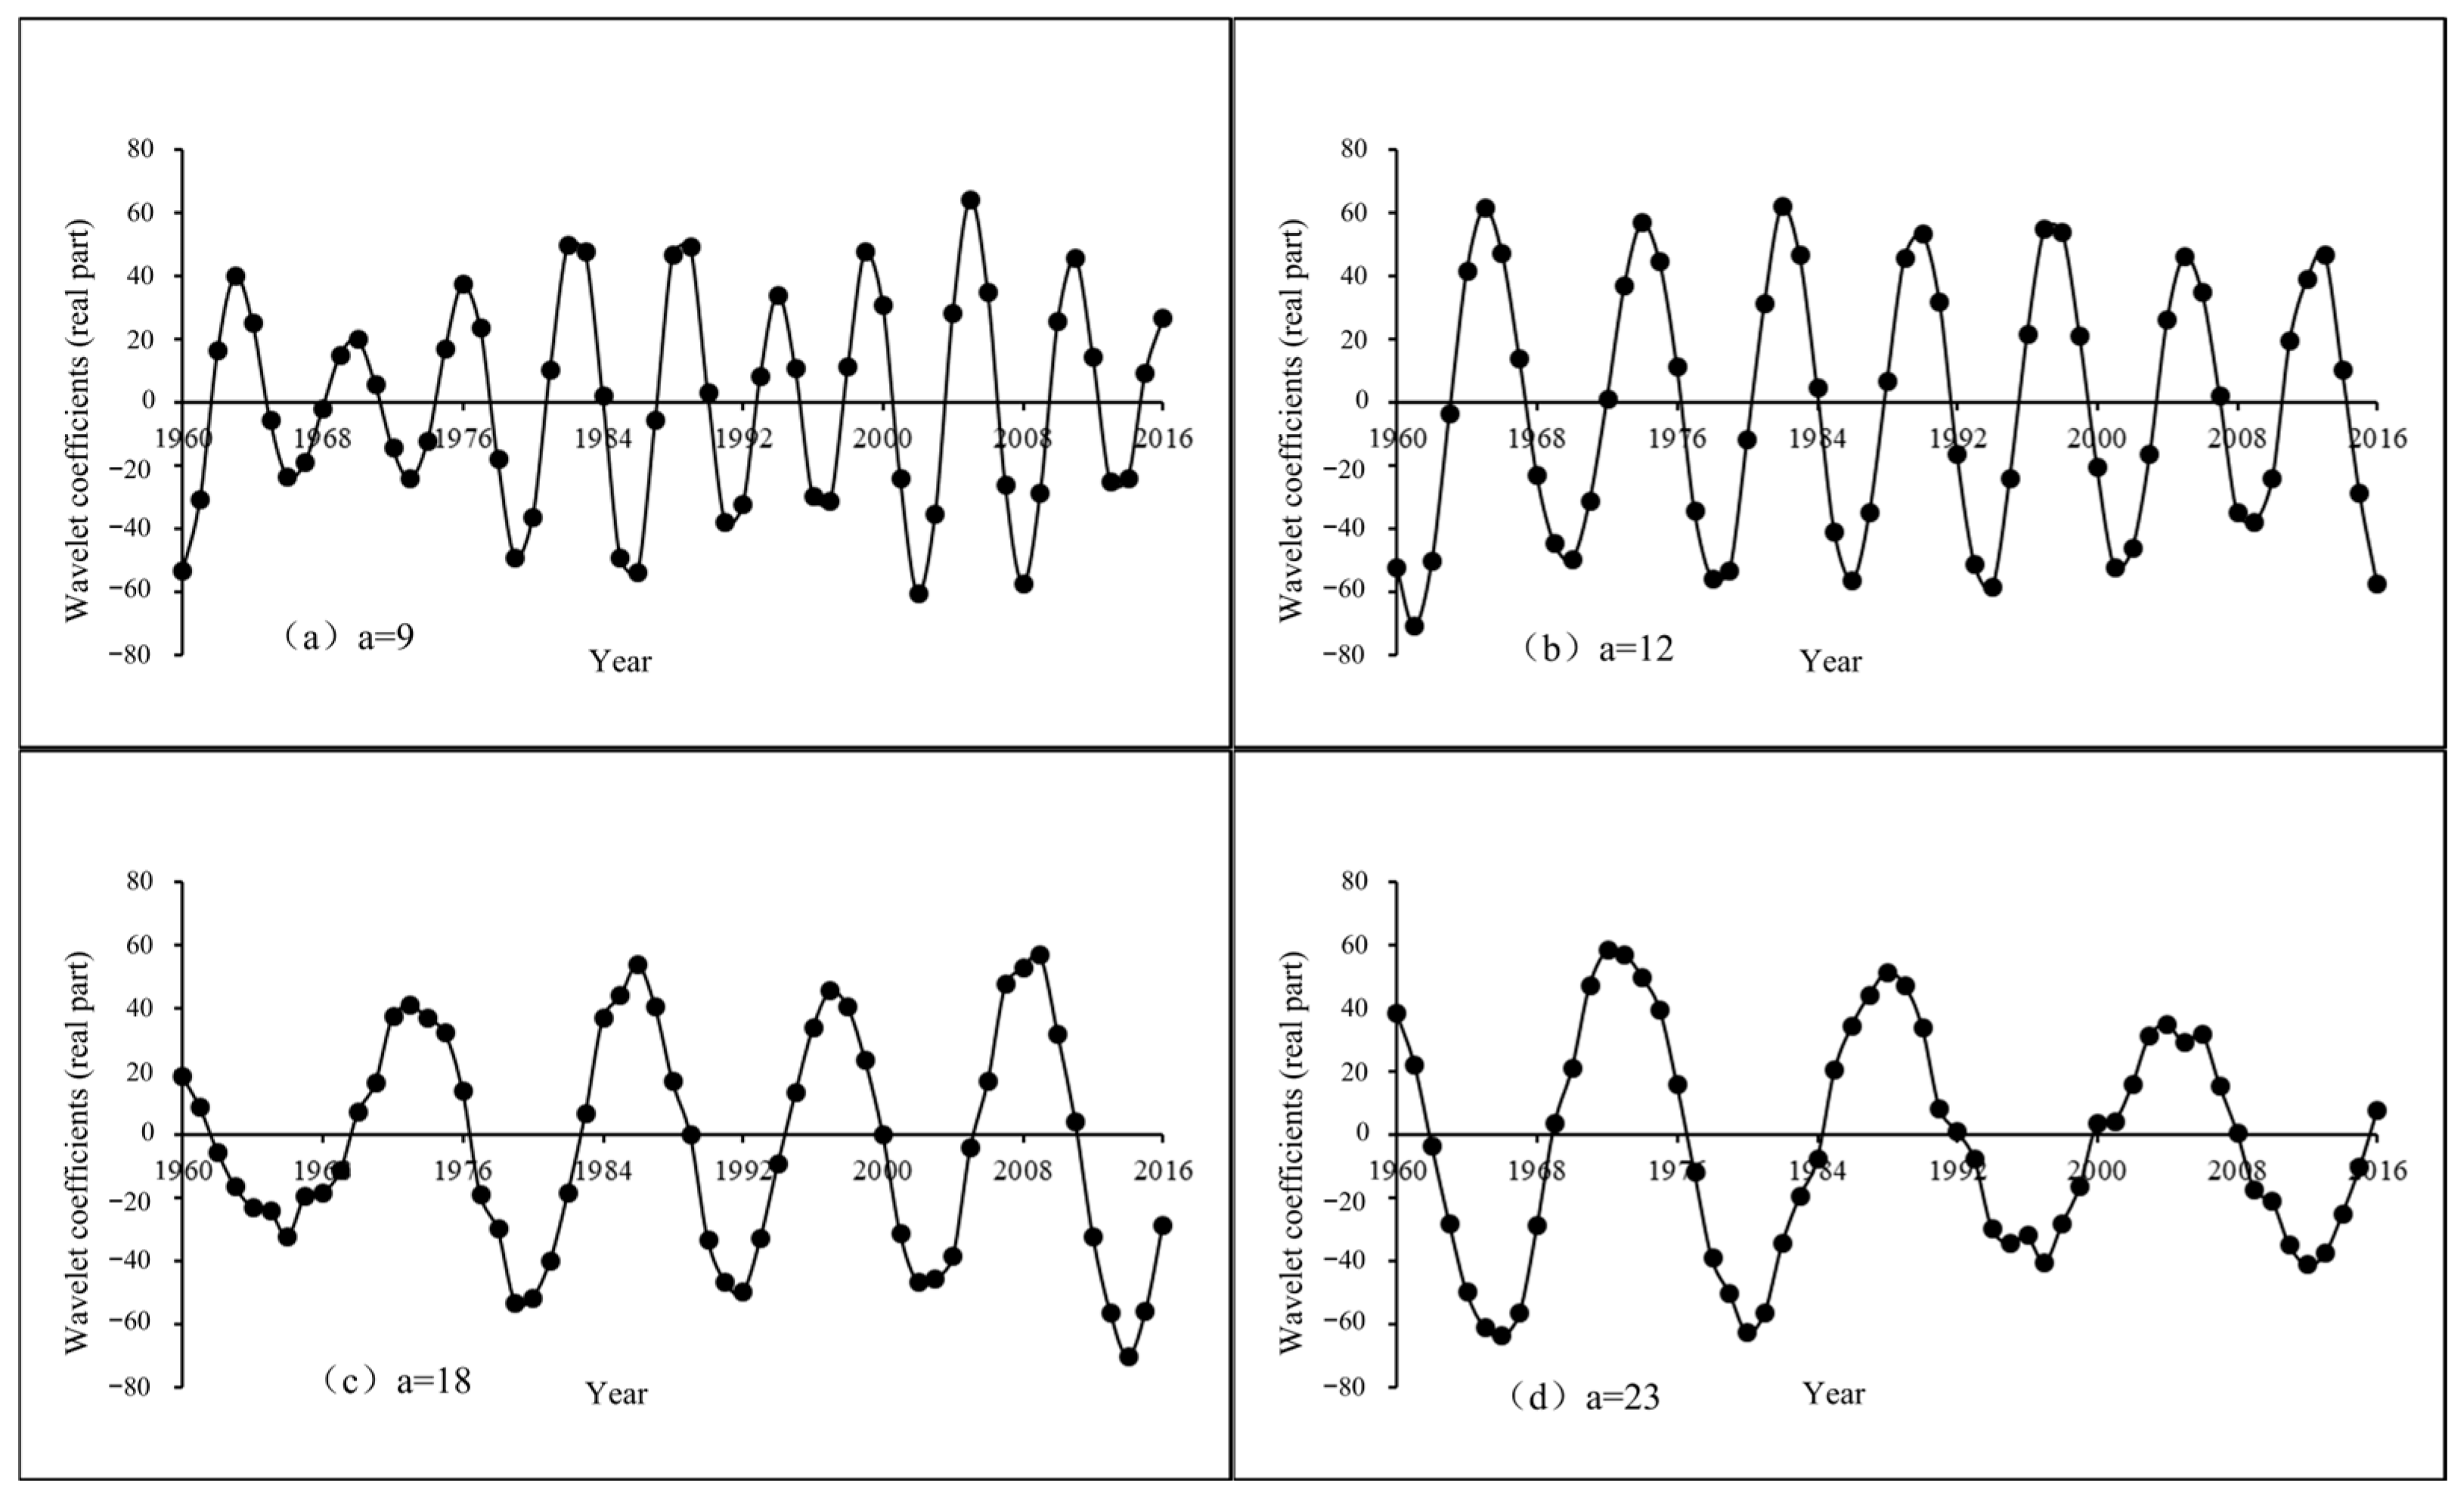
3.4. Periodic Variations of River Runoff

River runoff exhibits characteristics such as trend, periodicity, randomness, abrupt changes, and non-linearity, as well as multi-time-scale behavior, making it difficult to accurately grasp its variation patterns and characteristics. For rivers with significant fluctuations in runoff, it is hard to identify patterns simply by examining the runoff time series. However, the multi-scale runoff analysis method based on wavelet analysis can analyze the non-linear variation trends of runoff at different time scales, thus deepening the study of runoff evolution patterns. This method is also essential in exploring the coupling relationship between runoff and climate factors.
To minimize the interference from noise in the runoff data series, the “Extension” function in MATLAB 2014a was used to stretch the data series on both sides, and the extended portion was removed during the Morlet wavelet transform. Utilizing the plotting functions in MATLAB 2014a, the wavelet coefficient real part, modulus, and modulus squared contour maps of annual runoff variations in the Buha and Shaliu rivers were generated. The horizontal axis represents the time domain scale, and the vertical axis represents the frequency domain scale.
The contour map of the wavelet coefficient real part reflects the periodic variation trends of annual runoff at different time scales. As shown in Figure 8 and Figure 9, positive wavelet coefficients indicate a period of higher runoff, representing a wet year; zero values indicate an abrupt change; negative wavelet coefficients indicate a period of lower runoff, representing a dry year. The contour map of the Buha River annual runoff wavelet transform real part is shown in Figure 8. At the 19–27a scale, with 23a as the center of oscillation, runoff exhibits quasi-5 oscillations alternating between wet and dry periods. At the 8–18a scale, with 13a as the center of oscillation, quasi-8 oscillations alternate between wet and dry periods, with no such periodic variation before 1975. At the 5–9a scale, with 7a as the center of oscillation, no periodic variation occurred between 1975 and 1985, and the periodic variation gradually disappeared after 2010. The contour map of the Shaliu River annual runoff wavelet transform real part is shown in Figure 10. At the 19–28a scale, with 23a as the center of oscillation, runoff exhibits quasi-6 oscillations alternating between wet and dry periods. At the 15–19a scale, with 18a as the center of oscillation, quasi-5 oscillations alternate between wet and dry periods, with no such periodic variation before 1985. At the 8–16a scale, with 12a as the center of oscillation, runoff exhibits quasi-14 oscillations alternating between wet and dry periods. At the 3–10a scale, with 5a as the center of oscillation, runoff experiences frequent oscillations.
The wavelet coefficient modulus contour map reflects the distribution of energy density of the corresponding periodic cycles at different time scales in the time domain. The larger the modulus value, the stronger the periodicity at the corresponding scale. The distribution of wavelet coefficient modulus contours is shown in Figure 10 and Figure 11. The wavelet coefficient modulus contour distribution for the Buha River annual runoff indicates that the periodic variation at the 19–27a scale is the most obvious, spanning the entire study period; at the 8–18a scale, it only covers 1960–1975; and at the 5–9a scale, it only covers 2010–2015. The wavelet coefficient modulus contour distribution for the Shaliu River annual runoff indicates that the periodic variation at the 19–28a scale is the most obvious, spanning the entire study period; at the 15–19a scale, it only covers 1985–2016; and at the 8–16a scale, it only covers 1960–2010.
The wavelet coefficient real part modulus squared reflects the oscillation energy at different scales, equivalent to the wavelet energy spectrum. As shown in Figure 12, the energy at the 19–27a scale of the Buha River is the strongest, with the most significant periodicity, especially after 1985, when the periodicity becomes more pronounced. The 8–18a scale also shows strong energy, but its periodicity is more limited. The energy at the 5–9a scale is weaker, occupying almost the entire study period (1965–2015), but it is strongest only between 2010 and 2015. As shown in Figure 13, the energy at the 19–28a scale for the Shaliu River is the strongest, with the most significant periodicity, especially before 1990. The 15–19a scale shows strong energy, particularly after 1980. The energy at the 8–16a scale is next, covering almost the entire study period, while the energy at the 3–10a scale is weaker, occupying the entire study period with higher energy only between 1975 and 1990.
The wavelet variance can reflect the distribution of signal fluctuation energy across time scales. The main periods of runoff variation in the data series can be obtained from the variance contribution in the frequency domain. From the wavelet variance test results shown in Figure 14, the main periods of runoff variation in the Buha River are 23a, 13a, and 7a, while the main periods for the Shaliu River are 23a, 18a, 12a, and 9a.
Based on these main periods, the annual runoff wavelet coefficient real part variation process lines were plotted. Figure 15 shows the wavelet coefficient real part variation process lines at different time scales for the Buha River. Figure 15a shows the 7-year time scale variation process. In this short period, the wavelet coefficient alternates frequently between positive and negative values, indicating drastic fluctuations in the runoff between wet and dry periods, with 12 wet and 12 dry years from 1960 to 2016. Figure 15b shows the 13-year time scale variation process, where the alternation between wet and dry periods is less pronounced, with 7 wet and 8 dry years. Figure 15c shows the 23-year time scale variation process, where the alternation is further attenuated, with 5 wet and 4 dry years.
Figure 16 shows the wavelet coefficient real part variation process lines at different time scales for the Shaliu River. Figure 16a shows the 9-year time scale variation process, where the wavelet coefficient alternates frequently between positive and negative values, indicating drastic fluctuations in runoff, with 9 wet and 9 dry years from 1960 to 2016. Figure 16b shows the 12-year time scale variation process, where the alternation is less pronounced, with 7 wet and 7 dry years. Figure 16c shows the 18-year time scale variation process, with 4 wet and 5 dry years. Figure 16d shows the 23-year time scale variation process, with 3 wet and 4 dry years. The results suggest that, as the time scale increases, the alternation between wet and dry years becomes less pronounced, and the intensity of annual runoff evolution gradually weakens.

4. Discussion

Since the 20th century, global climate warming has become increasingly evident [38], and human activities such as large-scale water resource development, land use changes, and the construction of hydraulic facilities have directly or indirectly impacted the watershed’s hydrological processes [39,40]. These activities have led to spatial and temporal imbalances in water distribution, large interannual fluctuations in river runoff, and frequent flooding and droughts in watersheds, severely hindering societal production and development. Climate change, along with changes in underlying surfaces and vegetation, has contributed to varying degrees of runoff change in the QLB [41].

4.1. Impact of Climate Change on Runoff Variability

By combining meteorological data collected from weather stations and the runoff variation patterns discussed earlier, the study divides the analysis into four periods: 1960–1993, 1994–2016, 1960–2003, and 2004–2016, to preliminarily explore the response relationships between runoff and climate indicators in each period. As shown in Table 2, the correlation between annual precipitation (P) and annual runoff (Q) is significantly positive in most periods except 2004–2016. The correlation between average wind speed (U) and Q is negative, with the highest correlation in the 1960–1993 period. Since 1994, the correlation between U and Q has decreased significantly compared to the period before 1994. Temperature (T) has a higher correlation with Q in the 1960–1993 and 1994–2016 periods, which aligns with a temperature shift around 1993. The correlation between Q and sunshine duration (SSD) is only significant in the 2004–2016 period but fails to meet the 0.05 significance level, while in other periods, the correlation is weak and negative but not significant. The correlation between Q and relative humidity (RHU) is generally positive, and the correlation before the temperature shift is stronger. Potential evapotranspiration (ET0) shows a significant negative correlation with Q, exhibiting a similar pattern to RHU. Except for 2004–2016, net radiation (Rn) and Q have a negative correlation. For the 2004–2016 period, no significant correlation is found between runoff and climatic factors, likely due to the abrupt changes in runoff starting in 2003, which provided too few samples for a reliable analysis.
Overall, runoff (Q) is significantly positively correlated with precipitation (P) and relative humidity (RHU) and negatively correlated with potential evapotranspiration (ET0), net radiation (Rn), and wind speed (U), with varying correlation coefficients across different periods. Wang’s research findings suggest that, in response to rising temperatures and increasing humidity trends on the Tibetan Plateau, runoff and runoff coefficients have increased by 9.13 mm per decade. Precipitation accounted for 72.08% of this increase, while temperature contributed 27.92% [41].

4.2. Impact of Underlying Surface and Land Use Changes on Runoff Variability

Dynamic changes in the watershed’s underlying surface lead to variations in hydrological factors such as infiltration, evapotranspiration, and runoff, thus altering the runoff processes in the watershed [42]. While human activities such as water extraction and the construction of hydraulic engineering projects have direct effects on runoff and water levels, their influence on hydrological processes is relatively small and often negligible. However, human activities also indirectly affect runoff by influencing local climate conditions, vegetation, and soil properties in the watershed, which in turn affects hydrological processes.
The Qinghai Lake Basin spans a large area, with its central region characterized by relatively flat terrain. The time required for runoff generation and convergence is typically longer, making it more dependent on the specific characteristics of the watershed. In recent decades, significant changes in land use have occurred in the basin, likely driven by alterations in vegetation and soil conditions. Increased precipitation promotes vegetation growth, which enhances the condition of the underlying surface, improving surface runoff generation and convergence and leading to increased runoff. Vegetation changes can alter the basin’s runoff generation and convergence mechanisms. Specifically, changes in vegetation type and coverage affect surface roughness, which in turn alters the redistribution of precipitation. Additionally, long-term shifts in vegetation can change soil structure and characteristics, which subsequently impact the water cycle.

5. Conclusions

Based on observed hydrological data from the Buha River and Shaliu River in the Qinghai Lake Basin from 1960 to 2016, this study employed the Morlet continuous wavelet transform to systematically analyze the interannual variation characteristics and periodic patterns of basin runoff. The results show that, during the period from 2003 to 2016, both the daily peak flow and daily minimum flow of the two main tributaries increased compared to the period from 1960 to 2003, though the magnitude and trend of changes differed significantly between the rivers. Intra-annual runoff distribution was highly concentrated between June and October, with July and August constituting the main flood season and contributing over 85% of the annual runoff, demonstrating a typical pattern of seasonal concentration. Wavelet analysis revealed a multi-scale periodic structure in the runoff time series, with a dominant cycle of 23 years. Additionally, the Buha River exhibited 13-year and 7-year cycles, while the Shaliu River showed periodic components of 23, 18, 12, and 9 years. These periodicities closely aligned with regional precipitation trends. The study also found that fluctuations between wet and dry periods occurred frequently at shorter time scales, while alternating patterns became more subdued at longer scales, indicating typical non-stationary and scale-dependent behavior. Overall, the application of wavelet transform in this study effectively identified the dominant runoff periodicities and their temporal evolution in the Qinghai Lake Basin, enhancing the understanding of the complex hydrological processes in plateau lake basins. The findings provide a multi-scale scientific basis for water resource regulation, hydrological modeling, and watershed ecological protection strategies.

Author Contributions

Conceptualization, P.Y. and Y.W.; methodology, P.Y. and Y.W.; formal analysis, P.Y.; resources, H.G. and X.Y.; data curation, P.Y. and Y.F.; writing—original draft preparation, P.Y.; writing—review and editing, P.Y. and Y.W.; supervision, H.G. and X.Y.; project administration, X.Y.; funding acquisition, X.Y. All authors have read and agreed to the published version of the manuscript.

Funding

This research was funded by the National Natural Science Foundation of China (42230714, U2243202).

Data Availability Statement

Data subject to third party restrictions.

Conflicts of Interest

The authors declare no conflicts of interest.

References

  1. Wörman, A.; Lindström, G.; Åkesson, A.; Riml, J. Drifting Runoff Periodicity during the 20th Century Due to Changing Surface Water Volume. Hydrol. Process. 2010, 24, 3772–3784. [Google Scholar] [CrossRef]
  2. Xiao, H.; Zhang, J.; Xu, M. Study on Temporal Variability of Hydrological Elements in the Daqing River Basin, China. J. Hydrol. Eng. 2023, 28, 04023032. [Google Scholar] [CrossRef]
  3. Zhou, W.; Zhu, Z.; Xie, Y.; Cai, Y. Impacts of Rainfall Spatial and Temporal Variabilities on Runoff Quality and Quantity at the Watershed Scale. J. Hydrol. 2021, 603, 127057. [Google Scholar] [CrossRef]
  4. Fan, C.; Song, C.; Li, W.; Liu, K.; Cheng, J.; Fu, C.; Chen, T.; Ke, L.; Wang, J. What Drives the Rapid Water-Level Recovery of the Largest Lake (Qinghai Lake) of China over the Past Half Century? J. Hydrol. 2021, 593, 125921. [Google Scholar] [CrossRef]
  5. Wang, C.; Qiu, Y.; Fan, F.; Li, B.; Niu, D.; Shu, P. Rapid Environmental Changes in the Lake Qinghai Basin during the Late Holocene. Front. Earth Sci. 2023, 11, 1125302. [Google Scholar] [CrossRef]
  6. Mao, B.; Wang, X.; Liu, Z.; Jia, S.; Wang, C.; Lv, Q.; Ji, X. Evolution and Periodicity of Watershed-Scale Runoff: Insight from the Spatiotemporal Variety in Intensive Anthropogenic Activities Region. Water Resour. Manag. 2025, 39, 1855–1871. [Google Scholar] [CrossRef]
  7. Aryal, S.K.; Silberstein, R.P.; Fu, G.; Hodgson, G.; Charles, S.P.; McFarlane, D. Understanding Spatio-Temporal Rainfall-Runoff Changes in a Semi-Arid Region. Hydrol. Process. 2020, 34, 2510–2530. [Google Scholar] [CrossRef]
  8. Wu, Q.; Xie, T.; Liu, C.; Li, W.; Zhang, L.; Ran, G.; Xu, Y.; Tang, Y.; Han, Z.; Hu, C. Improving the Understanding of Rainfall-Runoff Processes: Temporal Dynamic of Event Runoff Response in Loess Plateau, China. J. Environ. Manag. 2025, 375, 123436. [Google Scholar] [CrossRef]
  9. Labat, D. Recent Advances in Wavelet Analyses: Part 1. A Review of Concepts. J. Hydrol. 2005, 314, 275–288. [Google Scholar] [CrossRef]
  10. Sang, Y.-F. A Review on the Applications of Wavelet Transform in Hydrology Time Series Analysis. Atmos. Res. 2013, 122, 8–15. [Google Scholar] [CrossRef]
  11. Adamowski, J.; Prokoph, A. Assessing the Impacts of the Urban Heat Island Effect on Streamflow Patterns in Ottawa, Canada. J. Hydrol. 2013, 496, 225–237. [Google Scholar] [CrossRef]
  12. Sang, Y.-F.; Singh, V.P.; Sun, F.; Chen, Y.; Liu, Y.; Yang, M. Wavelet-Based Hydrological Time Series Forecasting. J. Hydrol. Eng. 2016, 21, 06016001. [Google Scholar] [CrossRef]
  13. Chou, C.-M. Wavelet-Based Multi-Scale Entropy Analysis of Complex Rainfall Time Series. Entropy 2011, 13, 241–253. [Google Scholar] [CrossRef]
  14. Sang, Y.-F.; Wang, D.; Wu, J.-C.; Zhu, Q.-P.; Wang, L. Wavelet-Based Analysis on the Complexity of Hydrologic Series Data under Multi-Temporal Scales. Entropy 2011, 13, 195–210. [Google Scholar] [CrossRef]
  15. Chong, K.L.; Lai, S.H.; El-Shafie, A. Wavelet Transform Based Method for River Stream Flow Time Series Frequency Analysis and Assessment in Tropical Environment. Water Resour. Manag. 2019, 33, 2015–2032. [Google Scholar] [CrossRef]
  16. Schaefli, B.; Maraun, D.; Holschneider, M. What Drives High Flow Events in the Swiss Alps? Recent Developments in Wavelet Spectral Analysis and Their Application to Hydrology. Adv. Water Resour. 2007, 30, 2511–2525. [Google Scholar] [CrossRef]
  17. Szolgayova, E.; Parajka, J.; Bloeschl, G.; Bucher, C. Long Term Variability of the Danube River Flow and Its Relation to Precipitation and Air Temperature. J. Hydrol. 2014, 519, 871–880. [Google Scholar] [CrossRef]
  18. Liu, H.-L.; Bao, A.-M.; Chen, X.; Wang, L.; Pan, X. Response Analysis of Rainfall-Runoff Processes Using Wavelet Transform: A Case Study of the Alpine Meadow Belt. Hydrol. Process. 2011, 25, 2179–2187. [Google Scholar] [CrossRef]
  19. Maheswaran, R.; Khosa, R. Comparative Study of Different Wavelets for Hydrologic Forecasting. Comput. Geosci. 2012, 46, 284–295. [Google Scholar] [CrossRef]
  20. Rathinasamy, M.; Adamowski, J.; Khosa, R. Multiscale Streamflow Forecasting Using a New Bayesian Model Average Based Ensemble Multi-Wavelet Volterra Nonlinear Method. J. Hydrol. 2013, 507, 186–200. [Google Scholar] [CrossRef]
  21. Cui, B.-L.; Li, X.-Y. Runoff Processes in the Qinghai Lake Basin, Northeast Qinghai-Tibet Plateau, China: Insights from Stable Isotope and Hydrochemistry. Quat. Int. 2015, 380, 123–132. [Google Scholar] [CrossRef]
  22. Ding, C.; Guo, Z.; Chen, K.; Fan, L.; Zhan, Y.; Kuang, X.; Cui, B.; Zheng, C. The Effect of Seasonally Frozen Ground on Rainfall Infiltration and Groundwater Discharge in Qinghai Lake Basin, China. Front. Water 2024, 6, 1495763. [Google Scholar] [CrossRef]
  23. Wang, H.; Qi, Y.; Lian, X.; Zhang, J.; Yang, R.; Zhang, M. Effects of Climate Change and Land Use/Cover Change on the Volume of the Qinghai Lake in China. J. Arid Land 2022, 14, 245–261. [Google Scholar] [CrossRef]
  24. Wang, X.; Liang, T.; Xie, H.; Huang, X.; Lin, H. Climate-Driven Changes in Grassland Vegetation, Snow Cover, and Lake Water of the Qinghai Lake Basin. J. Appl. Remote Sens. 2016, 10, 036017. [Google Scholar] [CrossRef]
  25. Zhang, J.; Qi, Y.; Yang, R.; Ma, X.; Zhang, J.; Qi, W.; Guo, Q.; Wang, H. Impacts of Climate Change and Land Use/Cover Change on the Net Primary Productivity of Vegetation in the Qinghai Lake Basin. Int. J. Environ. Res. Public Health 2023, 20, 2179. [Google Scholar] [CrossRef]
  26. Liu, W.; Xie, C.; Wang, W.; Yang, G.; Zhang, Y.; Wu, T.; Liu, G.; Pang, Q.; Zou, D.; Liu, H. The Impact of Permafrost Degradation on Lake Changes in the Endorheic Basin on the Qinghai-Tibet Plateau. Water 2020, 12, 1287. [Google Scholar] [CrossRef]
  27. Dong, H.; Song, Y.; Zhang, M. Hydrological Trend of Qinghai Lake over the Last 60 Years: Driven by Climate Variations or Human Activities? J. Water Clim. Chang. 2019, 10, 524–534. [Google Scholar] [CrossRef]
  28. Zhang, Z.; Cong, Z.; Gao, B.; Li, G.; Wang, X. The Water Level Change and Its Attribution of the Qinghai Lake from 1960 to 2020. J. Hydrol.-Reg. Stud. 2024, 52, 101688. [Google Scholar] [CrossRef]
  29. Fu, C.; Wu, H.; Zhu, Z.; Song, C.; Xue, B.; Wu, H.; Ji, Z.; Dong, L. Exploring the Potential Factors on the Striking Water Level Variation of the Two Largest Semi-Arid-Region Lakes in Northeastern Asia. Catena 2021, 198, 105037. [Google Scholar] [CrossRef]
  30. Chang, B.; He, K.-N.; Li, R.-J.; Sheng, Z.-P.; Wang, H. Linkage of Climatic Factors and Human Activities with Water Level Fluctuations in Qinghai Lake in the Northeastern Tibetan Plateau, China. Water 2017, 9, 552. [Google Scholar] [CrossRef]
  31. Cui, B.-L.; Li, X.-Y. Stable Isotopes Reveal Sources of Precipitation in the Qinghai Lake Basin of the Northeastern Tibetan Plateau. Sci. Total Environ. 2015, 527, 26–37. [Google Scholar] [CrossRef] [PubMed]
  32. Wang, X.; Gao, B. Frozen Soil Change and Its Impact on Hydrological Processes in the Qinghai Lake Basin, the Qinghai-Tibetan Plateau, China. J. Hydrol.-Reg. Stud. 2022, 39, 100993. [Google Scholar] [CrossRef]
  33. Chang, B.; He, K.; Li, R.; Wang, H.; Wen, J. Trends, Abrupt Changes, and Periodicity of Streamflow in Qinghai Province, the Northeastern Tibetan Plateau, China. Pol. J. Environ. Stud. 2018, 27, 545–555. [Google Scholar] [CrossRef]
  34. Lan, Y.; Zhao, G.; Zhang, Y.; Wen, J.; Hu, X.; Liu, J.; Gu, M.; Chang, J.; Ma, J. Response of Runoff in the Headwater Region of the Yellow River to Climate Change and Its Sensitivity Analysis. J. Geogr. Sci. 2010, 20, 848–860. [Google Scholar] [CrossRef]
  35. Liu, B. Characterization of Spatial and Temporal Changes of Grasslands and Lakes in Qinghai Lake Basin under the Background of Climate Change. Ph.D. Thesis, Lanzhou University, Lanzhou, China, 2016. [Google Scholar]
  36. Gholami, H.; Moradi, Y.; Lotfirad, M.; Gandomi, M.A.; Bazgir, N.; Shokrian Hajibehzad, M. Detection of Abrupt Shift and Non-Parametric Analyses of Trends in Runoff Time Series in the Dez River Basin. Water Supply 2022, 22, 1216–1230. [Google Scholar] [CrossRef]
  37. Tosunoglu, F.; Kisi, O. Trend Analysis of Maximum Hydrologic Drought Variables Using Mann–Kendall and Şen’s Innovative Trend Method. River Res. Appl. 2017, 33, 597–610. [Google Scholar] [CrossRef]
  38. Liu, Z.; Yao, Z.; Wang, R.; Yu, G. Estimation of the Qinghai-Tibetan Plateau Runoff and Its Contribution to Large Asian Rivers. Sci. Total Environ. 2020, 749, 141570. [Google Scholar] [CrossRef]
  39. Zhang, L.; Nan, Z.; Wang, W.; Ren, D.; Zhao, Y.; Wu, X. Separating Climate Change and Human Contributions to Variations in Streamflow and Its Components Using Eight Time-Trend Methods. Hydrol. Process. 2019, 33, 383–394. [Google Scholar] [CrossRef]
  40. Zheng, H.; Miao, C.; Zhang, G.; Li, X.; Wang, S.; Wu, J.; Gou, J. Is the Runoff Coefficient Increasing or Decreasing after Ecological Restoration on China’s Loess Plateau? Int. Soil Water Conserv. Res. 2021, 9, 333–343. [Google Scholar] [CrossRef]
  41. Wang, Y.; Ye, A.; Zhang, Y.; Yang, F. The Quantitative Attribution of Climate Change to Runoff Increase over the Qinghai-Tibetan Plateau. Sci. Total Environ. 2023, 897, 165326. [Google Scholar] [CrossRef]
  42. Liu, Z.; Yao, Z.; Huang, H.; Wu, S.; Liu, G. Land use and climate changes and their impacts on runoff in the Yarlung Zangbo river basin, China. Land Degrad. Dev. 2014, 25, 203–215. [Google Scholar] [CrossRef]
Figure 1. The distribution map of weather stations and hydrological stations in Qinghai Lake Basin.
Hydrology 12 00083 g001
Figure 2. Trends of daily flood flow and daily minimum runoff in the Buha River and the time of their occurrence.
Hydrology 12 00083 g002
Figure 3. Trends of daily flood flow and daily minimum runoff in Shaliu River and the time of their occurrence.
Hydrology 12 00083 g003
Figure 4. Intra-annual distribution of runoff for (a,b) Buha River and (c,d) Shaliu River.
Hydrology 12 00083 g004
Figure 5. Interannual variability of runoff in the Buha River and the Shaliu River.
Hydrology 12 00083 g005
Figure 6. M-K mutation test for annual runoff of Buha River and Shaliu River.
Hydrology 12 00083 g006
Figure 7. Test for sudden change in cumulative distance level of annual runoff in the Buha River and Shaliu River.
Hydrology 12 00083 g007
Figure 8. Contour map of the real part of the wavelet transform of the annual runoff of the Buha River.
Hydrology 12 00083 g008
Figure 9. Contour map of real part of wavelet transform of annual runoff of Shaliu River.
Hydrology 12 00083 g009
Figure 10. Contour map of the real mode of the wavelet coefficients of the annual runoff of the Buha River.
Hydrology 12 00083 g010
Figure 11. Contour map of the real part mode of the wavelet coefficients of the annual runoff in the Shaliu River.
Hydrology 12 00083 g011
Figure 12. Contour map of the real part of the wavelet coefficients of the Buha River annual runoff modulus.
Hydrology 12 00083 g012
Figure 13. Shaliu River annual runoff wavelet coefficient real part of the mode-square contour plot.
Hydrology 12 00083 g013
Figure 14. Wavelet variance of annual runoff in the Buha and Shaliu River.
Hydrology 12 00083 g014
Figure 15. Process line of the real part of the wavelet coefficients of the annual runoff of the Buha River at different time scales.
Hydrology 12 00083 g015
Figure 16. Process line of real part variation of wavelet coefficients of annual runoff at different time scales in Shaliu River.
Hydrology 12 00083 g016
Table 1. Key Hydrological Stations in the Qinghai Lake Basin.
Hydrological StationRiver NameDrainage Area
(km2)
Flow
(m3/s)
Annual Runoff
(108 m3)
Runoff Depth
(mm)
Runoff Modulus
[10⁻3 m3/(s·km2)]
Buha River EstuaryBuha River14,33725.67.8356.31.79
GangchaShaliu River1,4427.22.51157.54.99
Table 2. Correlation Analysis of Climate Indicators and Annual Runoff in the Buha River Basin (1960–2016).
PeriodTPUSSDRHUET0
1960–20160.170.72 **−0.42 **−0.190.47 **−0.50 **
1960–2003−0.190.72 **−0.39 **−0.030.71 **−0.73 **
2004–20160.39−0.10−0.080.55−0.440.37
1960–1993−0.34 *0.74 **−0.53 **−0.090.76 **−0.78 **
1994–20160.49 *0.70 **−0.15−0.320.00−0.13
1960–20160.170.72 **−0.42 **−0.190.47 **−0.50 **
Note: T is average temperature (°C), P is annual precipitation (mm), U is average annual wind speed (m/s), SSD is annual sunshine duration (h), RHU is relative humidity (%), ET0 is potential evapotranspiration (mm), and Rn is net radiation (MJ/m2); * indicates significance at the 0.05 level, ** indicates significance at the 0.01 level.
Disclaimer/Publisher’s Note: The statements, opinions and data contained in all publications are solely those of the individual author(s) and contributor(s) and not of MDPI and/or the editor(s). MDPI and/or the editor(s) disclaim responsibility for any injury to people or property resulting from any ideas, methods, instructions or products referred to in the content.

