
Combining Hydro-Geochemistry and Environmental Isotope Methods to Evaluate Groundwater Quality and Health Risk (Middle Nile Delta, Egypt)

 , ,
, ,  , and
, and
Abstract
1. Introduction
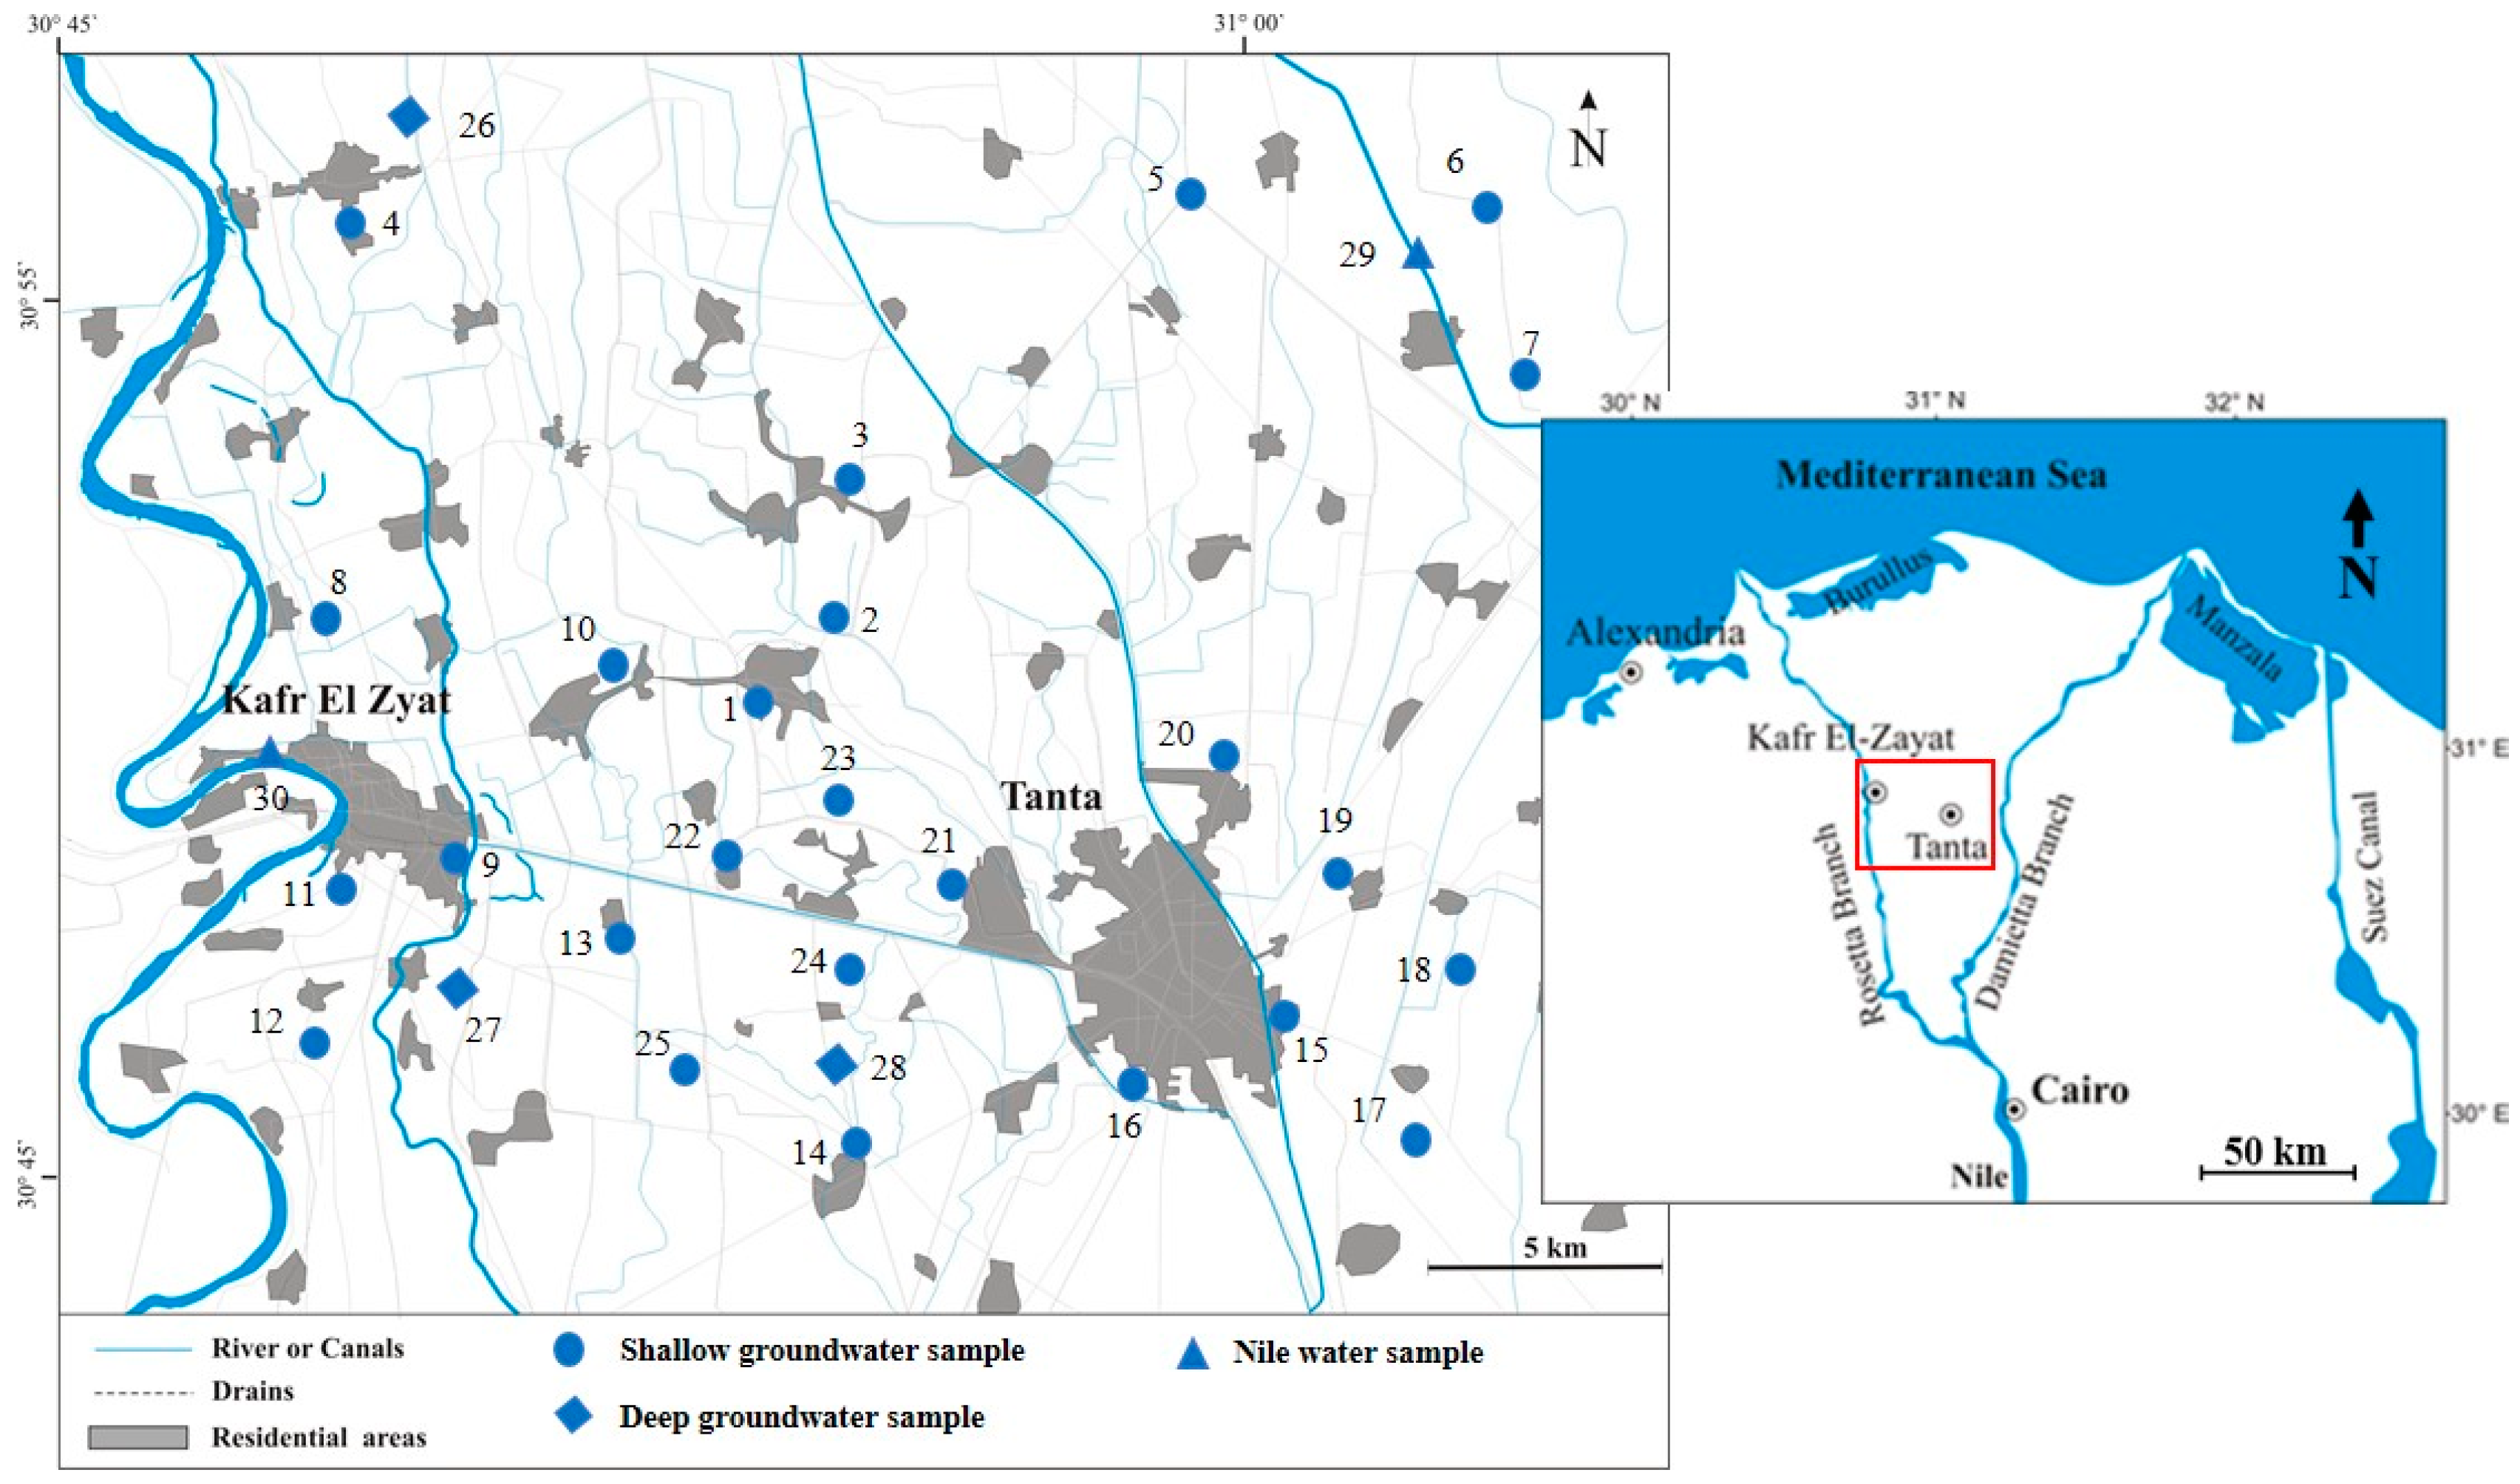
Study Area
2. Materials and Methods
2.1. Field Work and Laboratory Analyses
2.2. Groundwater Quality Assessment
2.3. Health Risk Estimation
3. Results
3.1. Physicochemical Parameters (pH, Eh, TDS, and TH)
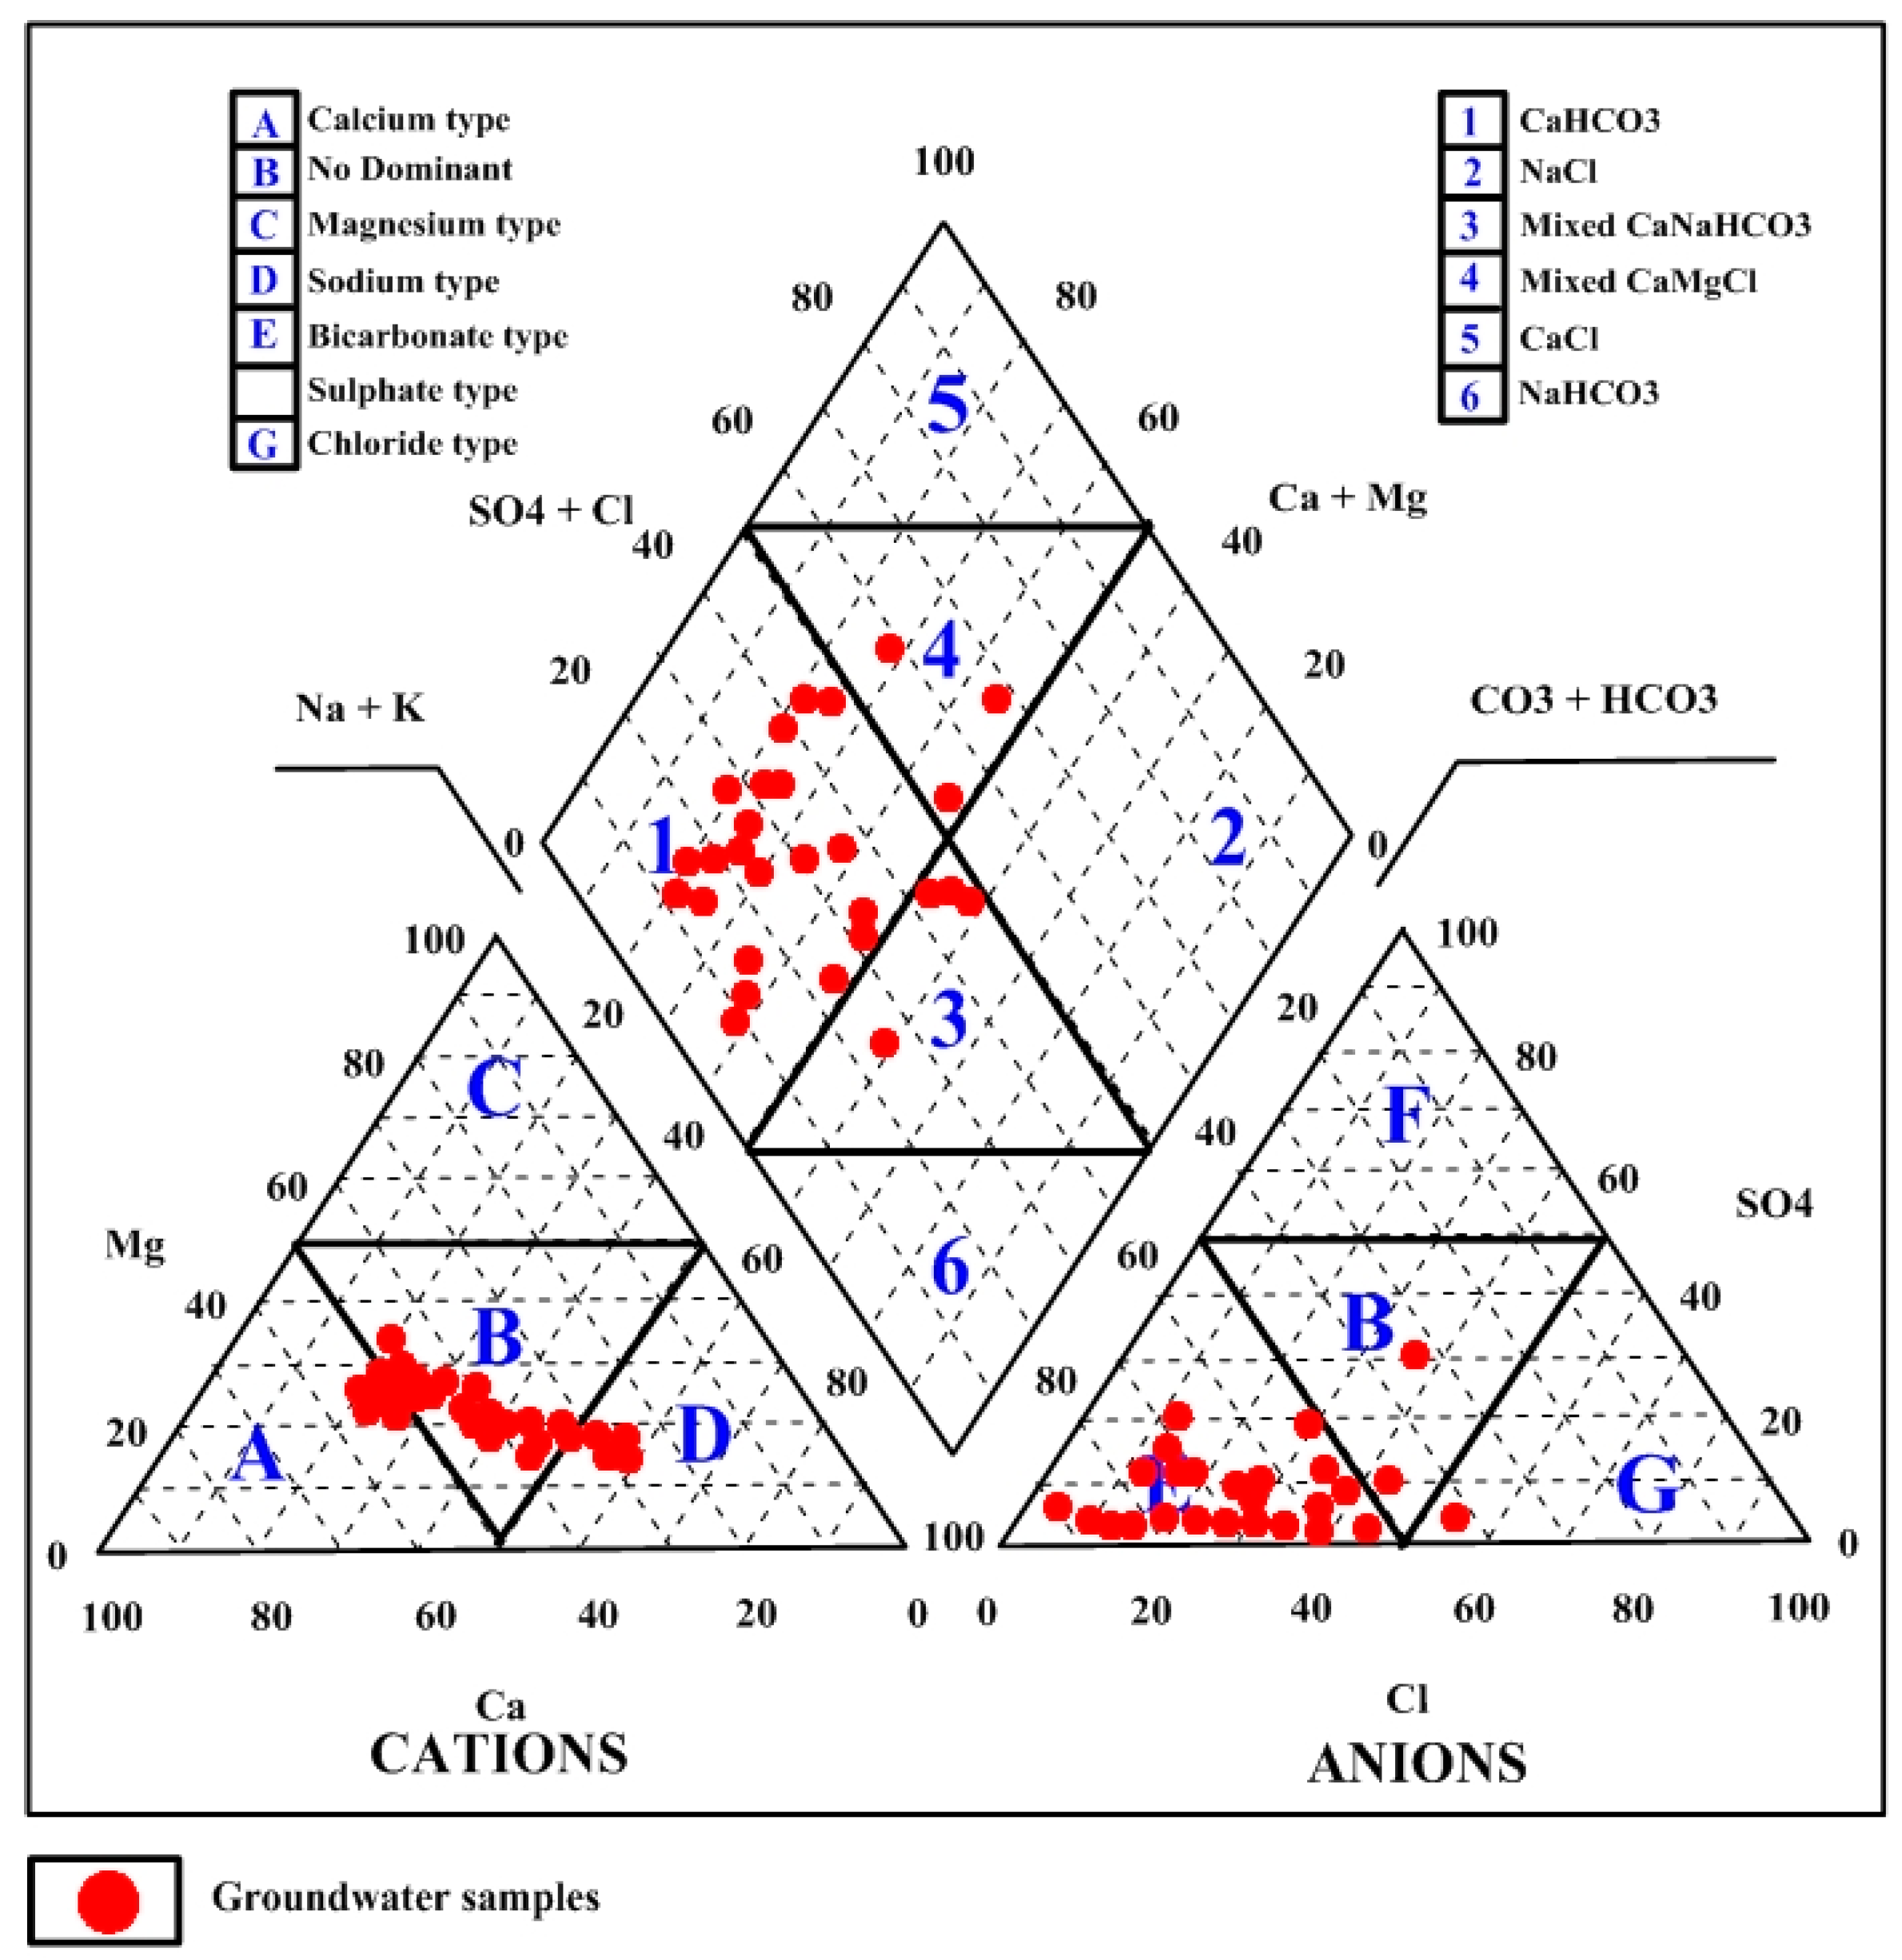
3.2. Major Ions
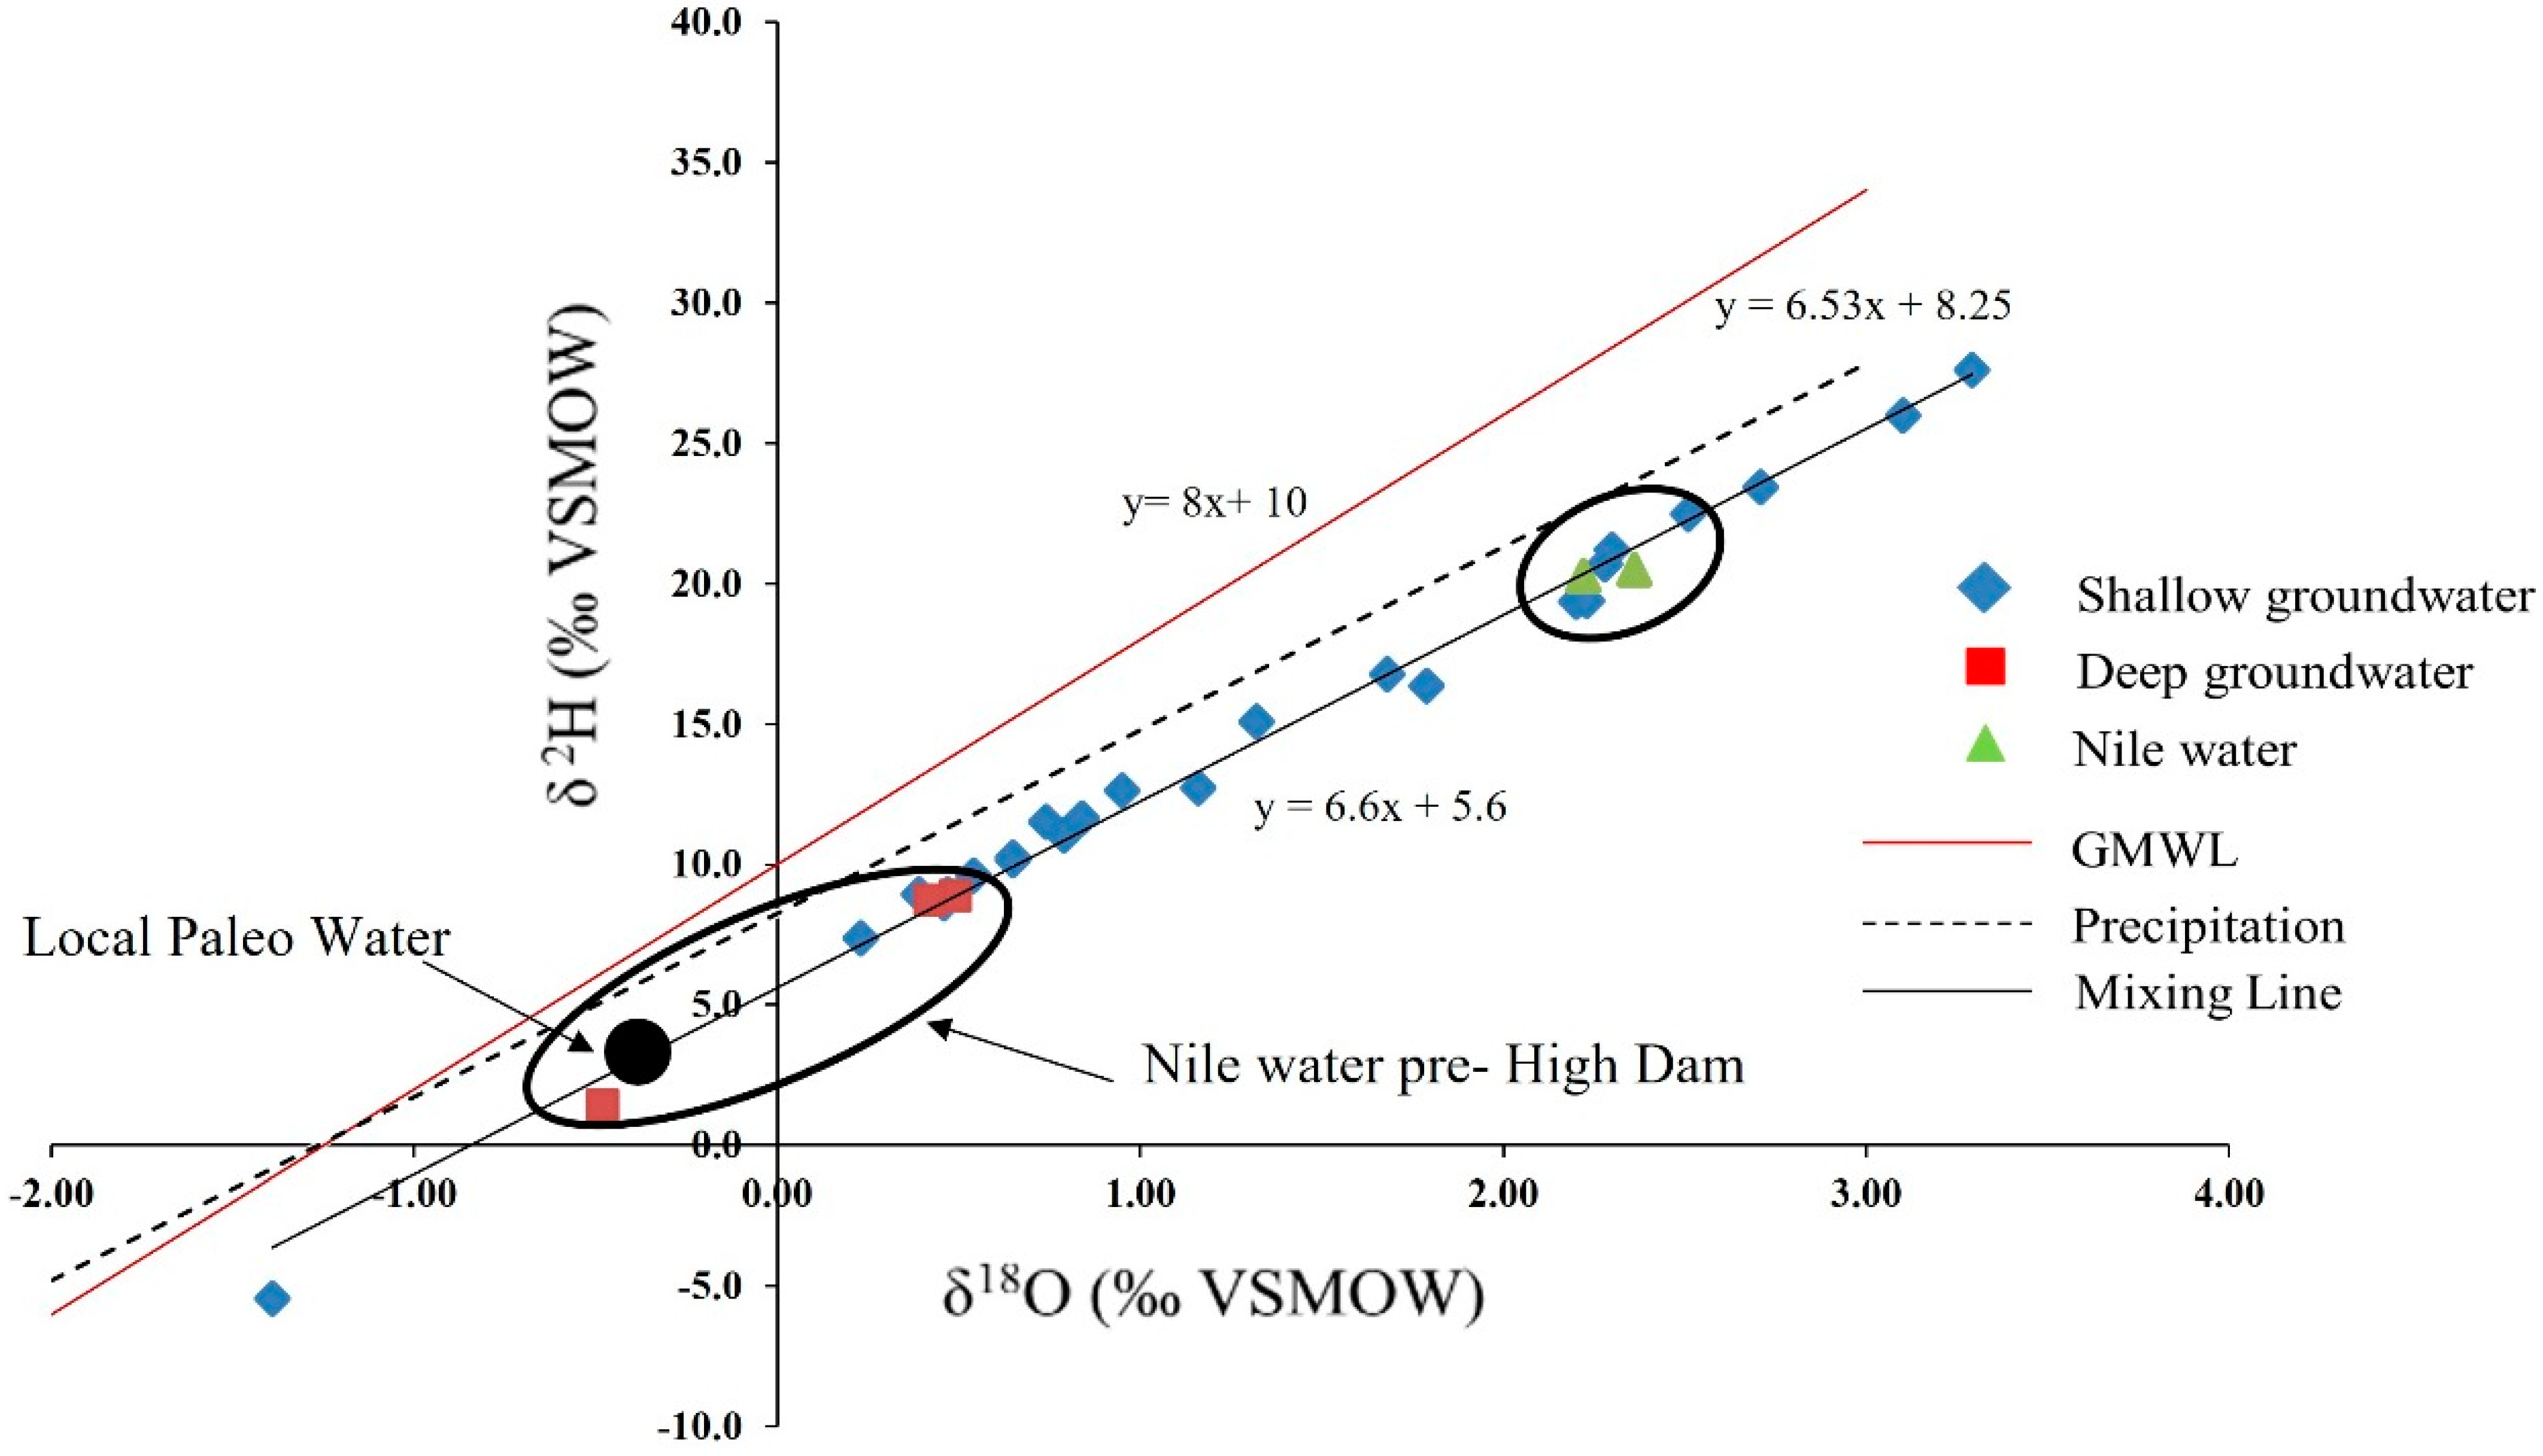
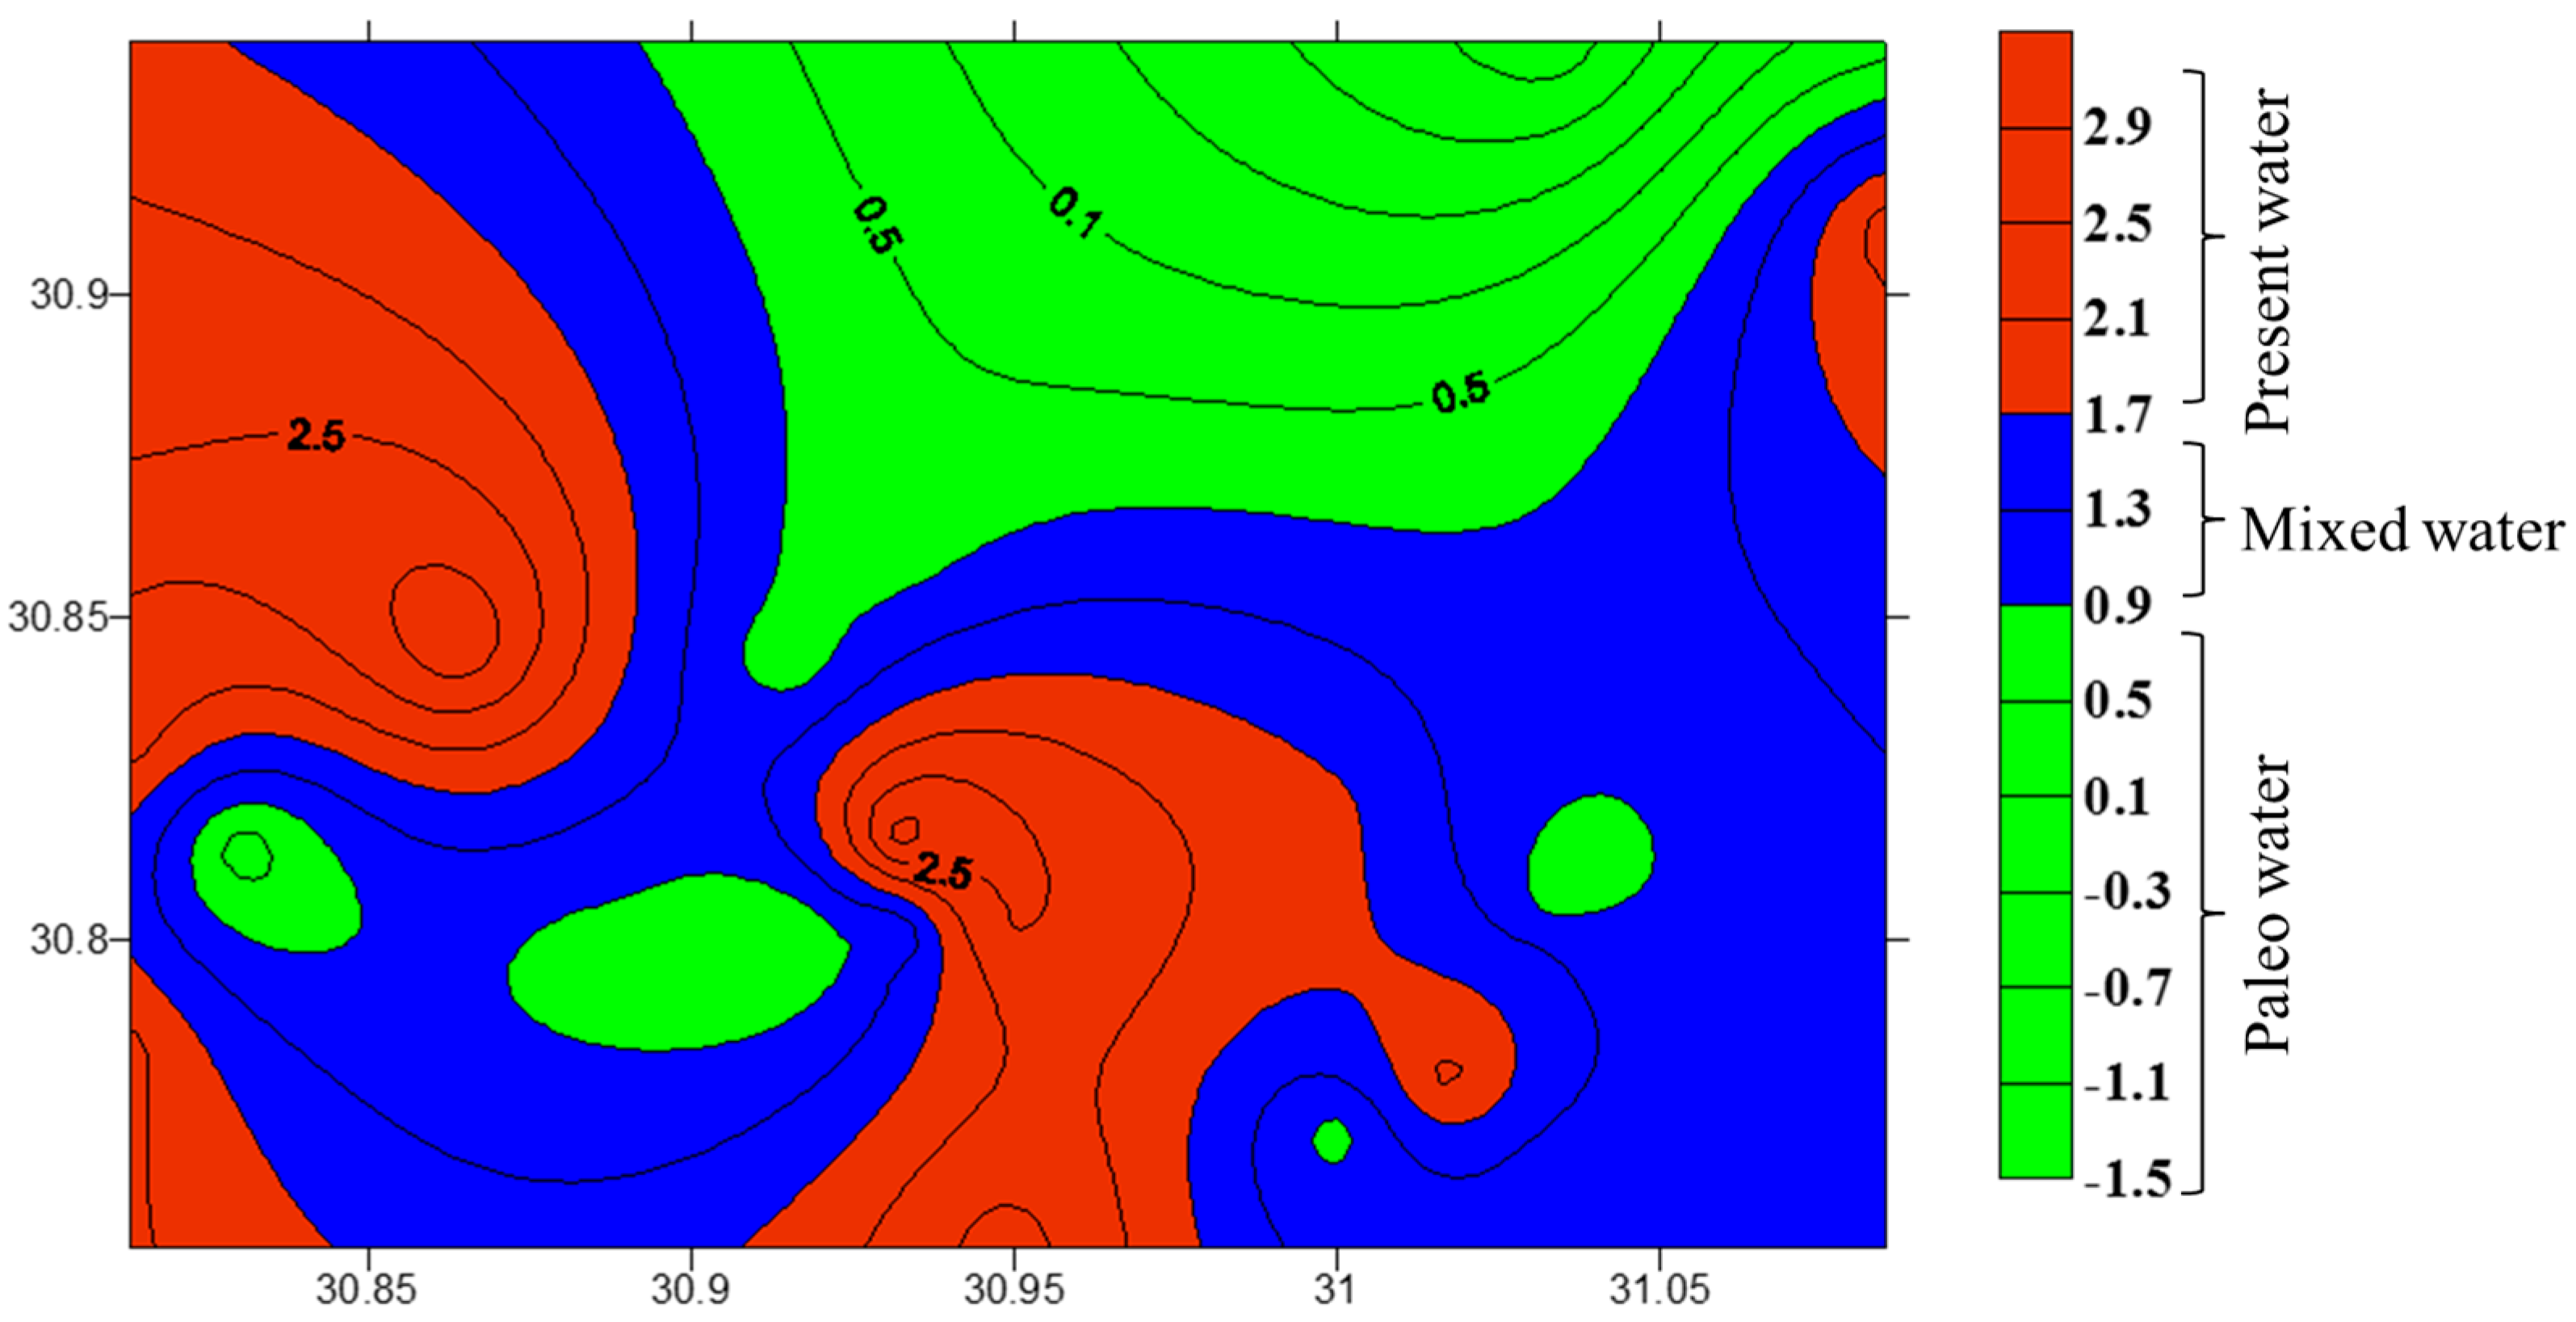
3.3. Stable Isotopes
3.4. Heavy Metal Contents
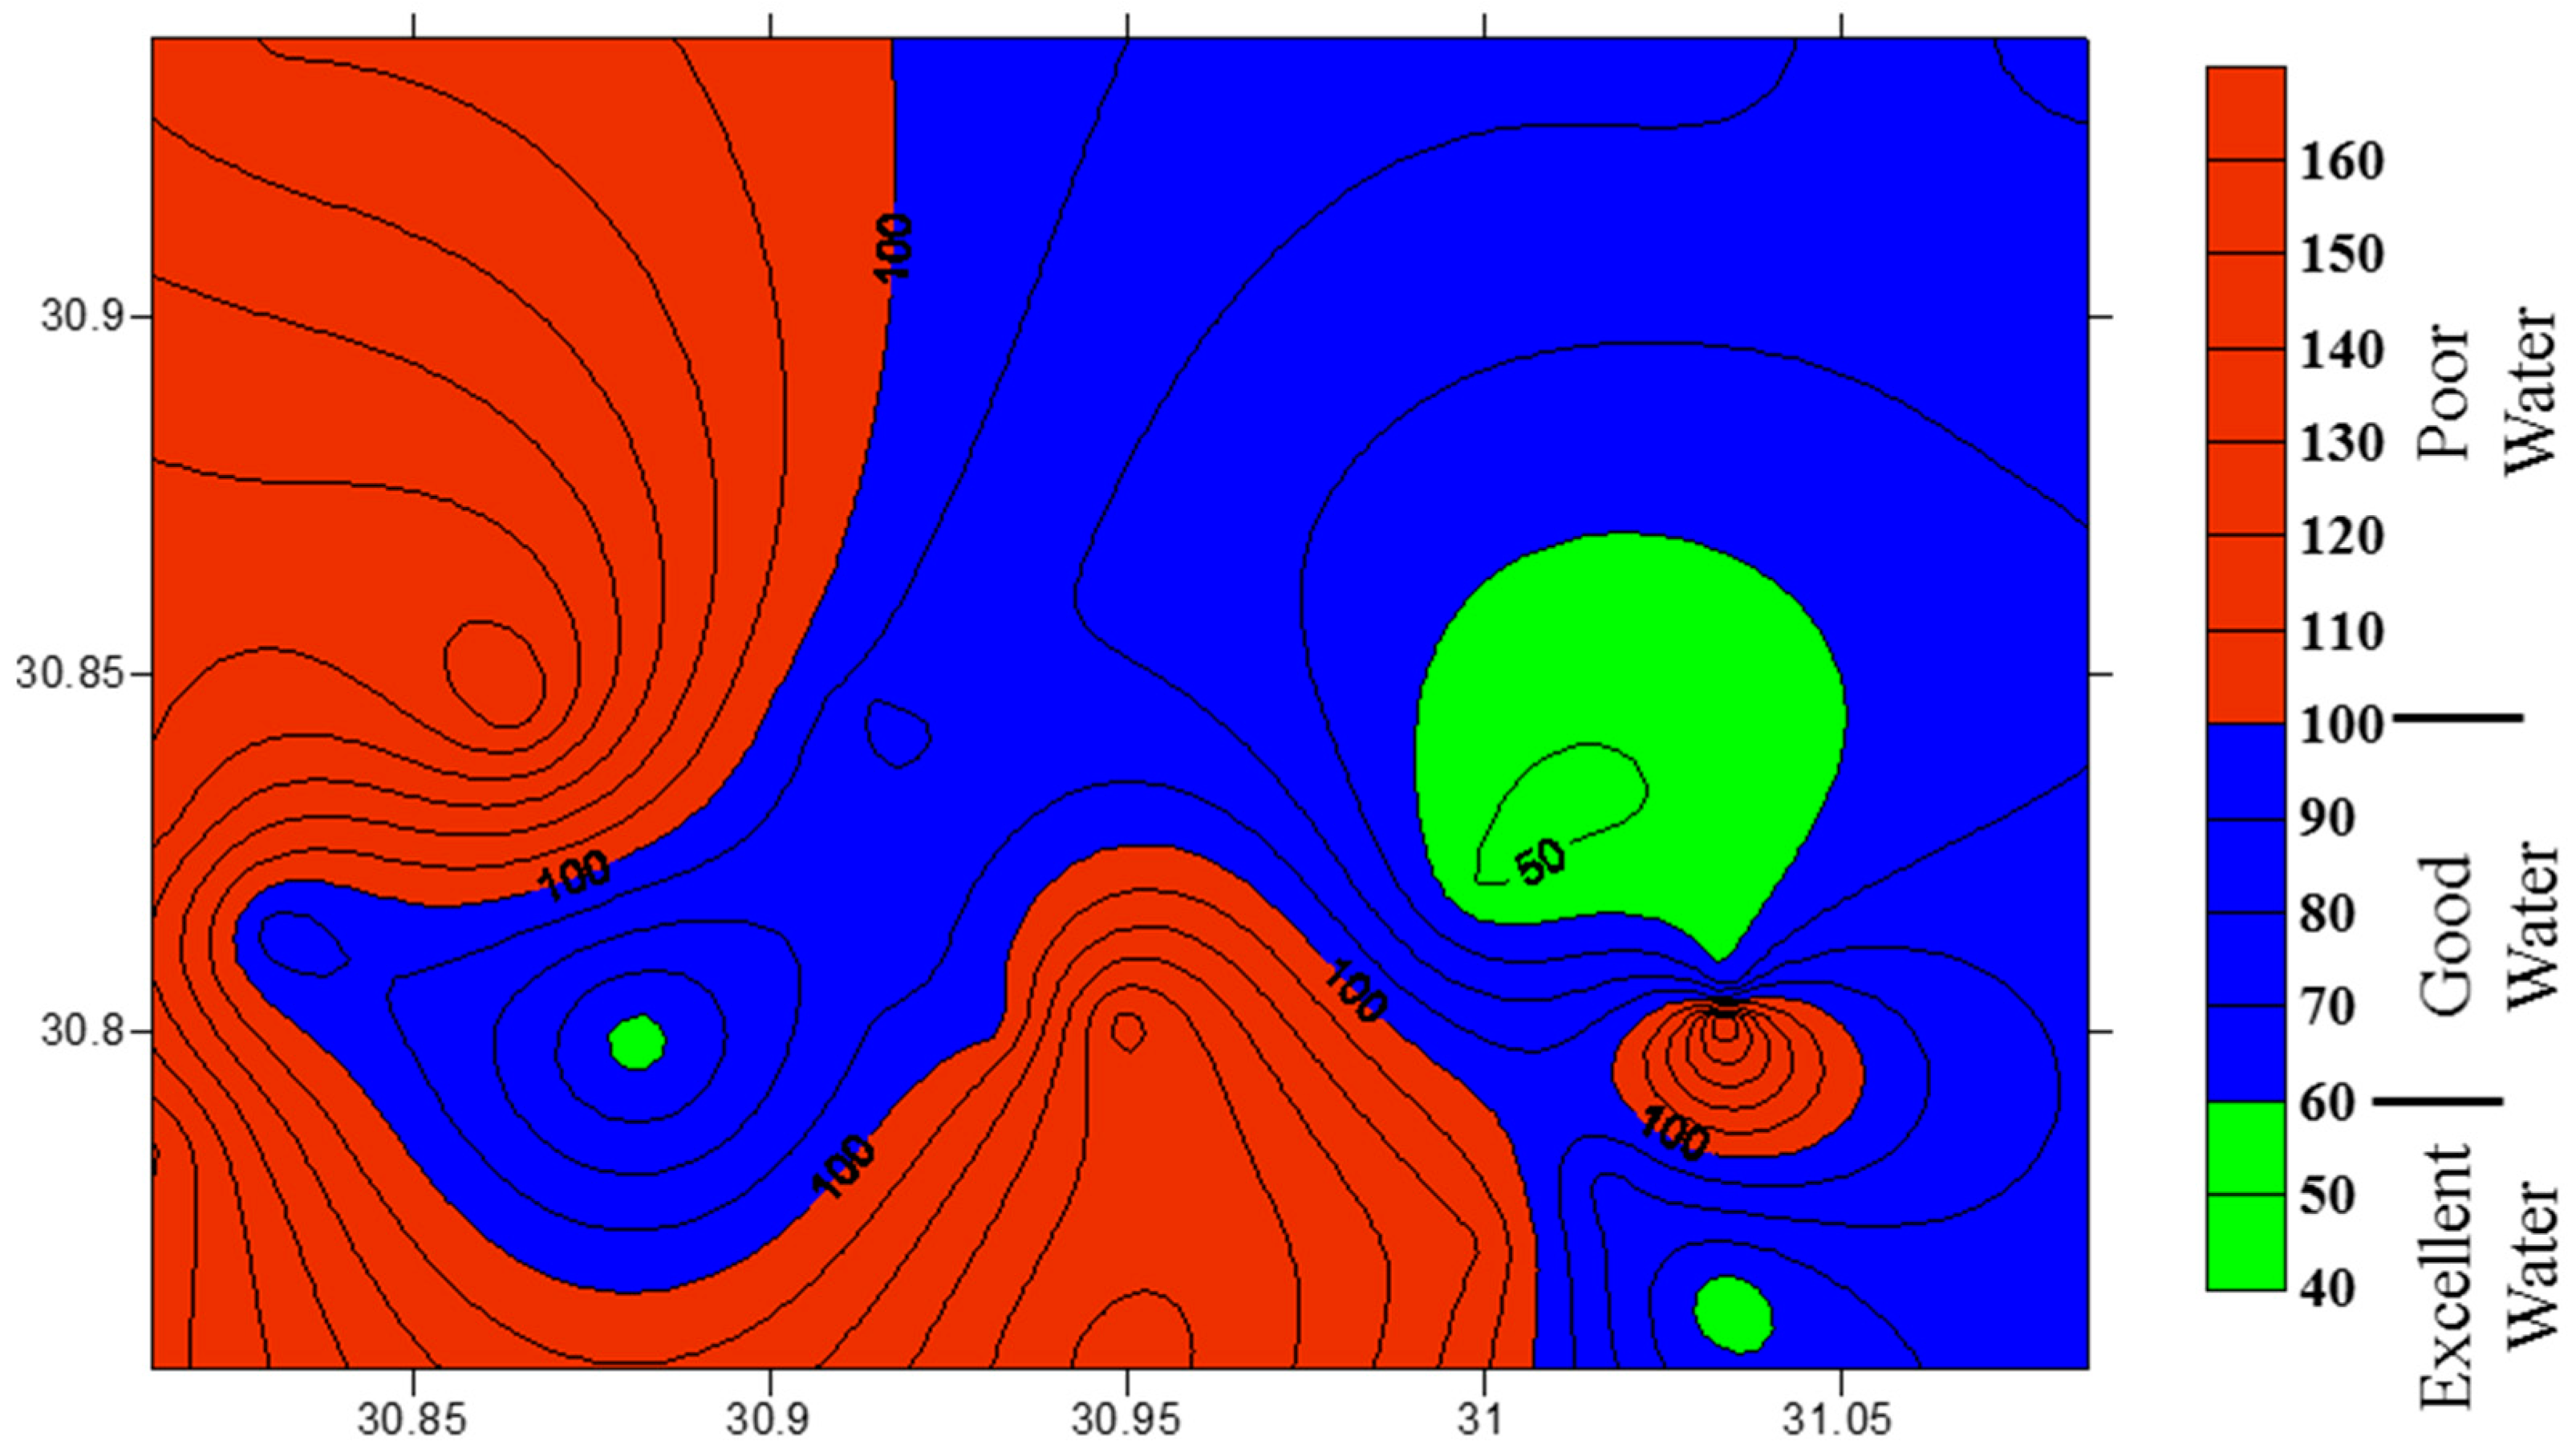
3.5. Water Quality Assessment
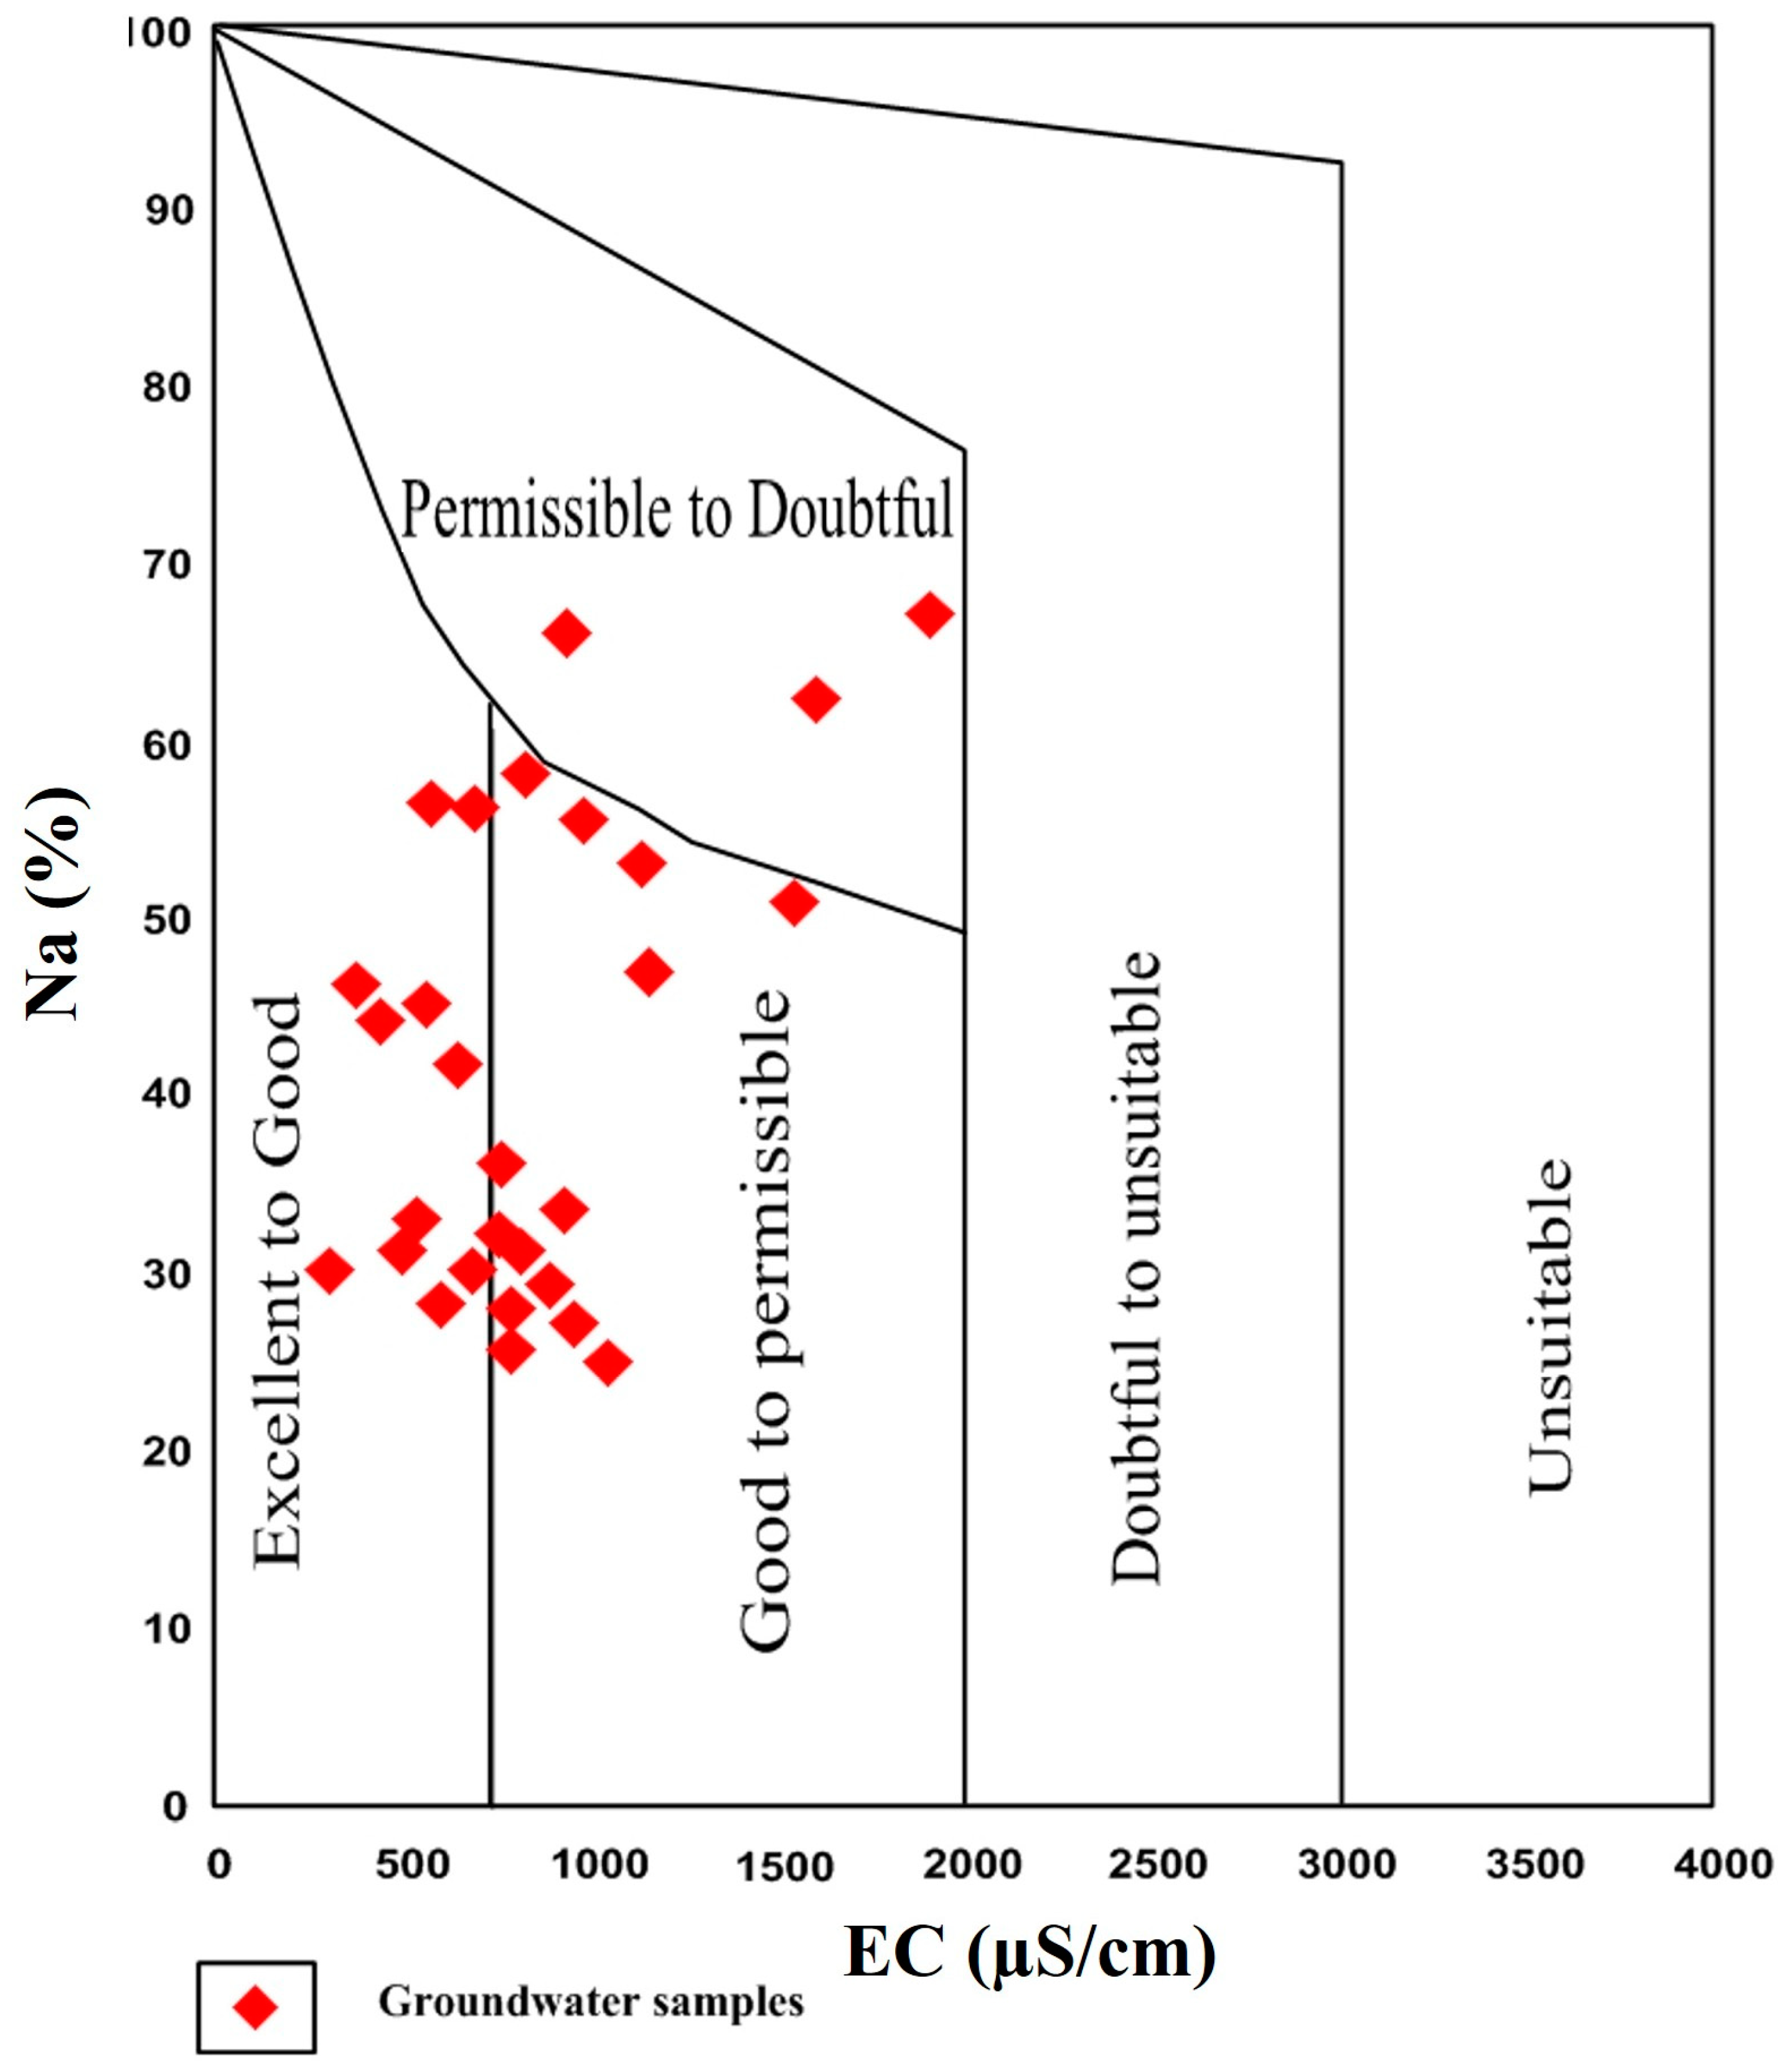
3.6. Irrigation Suitability
3.7. Health Risk Assessment
4. Discussion
5. Conclusions
6. Recommendations and Way Forward
Author Contributions
Funding
Data Availability Statement
Acknowledgments
Conflicts of Interest
References
- Aeschbach-Hertig, W.; Gleeson, T. Regional strategies for the accelerating global problem of groundwater depletion. Nat. Geosci. 2012, 5, 853–861. [Google Scholar] [CrossRef]
- Wang, X.; Xiao, C.; Yang, W.; Liang, X.; Zhang, L.; Zhang, J. Analysis of the quality, source identification and apportionment of the groundwater in a typical arid and semi-arid region. J. Hydrol. 2023, 625, 130169. [Google Scholar] [CrossRef]
- Pastén-Zapata, E.; Ledesma-Ruiz, R.; Harter, T.; Ramírez, A.I.; Mahlknecht, J. Assessment of sources and fate of nitrate in shallow groundwater of an agricultural area by using a multi-tracer approach. Sci. Total. Environ. 2014, 470–471, 855–864. [Google Scholar] [CrossRef]
- Wang, S.; Tang, C.; Song, X.; Wang, Q.; Zhang, Y.; Yuan, R. The impacts of a linear wastewater reservoir on groundwater recharge and geochemical evolution in a semi-arid area of the Lake Baiyangdian watershed, North China Plain. Sci. Total. Environ. 2014, 482, 325–335. [Google Scholar] [CrossRef]
- Akhtar, N.; Syakir Ishak, M.I.; Bhawani, S.A.; Umar, K. Various natural and anthropogenic factors responsible for water quality degradation: A review. Water 2021, 13, 2660. [Google Scholar] [CrossRef]
- Zeydalinejad, N.; Javadi, A.A.; Webber, J.L. Global perspectives on groundwater infiltration to sewer networks: A threat to urban sustainability. Water Res. 2024, 262, 122098. [Google Scholar] [CrossRef] [PubMed]
- Arumugam, K.; Elangovan, K. Hydrochemical characteristics and groundwater quality assessment in Tirupur Region, Coimbatore District, Tamil Nadu, India. Environ. Geol. 2009, 58, 1509–1520. [Google Scholar] [CrossRef]
- Nagaraju, A.; Sunil Kumar, K.; Thejaswi, A. Assessment of groundwater quality for irrigation: A case study from Bandalamottu lead mining area, Guntur District, Andhra Pradesh, South India. Appl. Water Sci. 2014, 4, 385–396. [Google Scholar] [CrossRef]
- Lghoula, M.; Maqsoudb, A.; Hakkouc, R.; Kchikacha, A. Hydrogeochemical behavior around the abandoned Kettara mine site, Morocco. J. Geochem. Expl. 2014, 144, 456–467. [Google Scholar] [CrossRef]
- Abu Khatita, A.M.; de Wall, H.; Koch, R. Anthropogenic particle dispersions in topsoils of the Middle Nile Delta: A preliminary study on the contamination around industrial and commercial areas in Egypt. Environ. Earth. Sci. 2016, 75, 264. [Google Scholar] [CrossRef]
- Dinis, M.D.L.; Fiúza, A. Mitigation of uranium mining impacts—a review on groundwater remediation technologies. Geosciences 2021, 11, 250. [Google Scholar] [CrossRef]
- Mor, S.; Ravindra, K.; Dahiya, R.P.; Chandra, A. Leachate characterization and assessment of groundwater pollution near municipal solid waste landfill site. Environ. Monit. Assess. 2006, 118, 435–456. [Google Scholar] [CrossRef] [PubMed]
- Parameswari, K.; Mudgal, B.V. Geochemical investigation of groundwater contamination in Perungudi dumpsite, South India. Arab. J. Geosci. 2013, 7, 1363–1371. [Google Scholar] [CrossRef]
- Gómez-Puentes, F.J.; Reyes-López, J.A.; López, D.L.; Carreón-Diazconti, C.; Belmonte-Jiménez, S. Geochemical processes controlling the groundwater transport of contaminants released by a dump in an arid region of México. Environ. Earth. Sci. 2014, 7, 1609–1621. [Google Scholar] [CrossRef]
- Parvin, F.; Tareq, S.M. Impact of landfill leachate contamination on surface and groundwater of Bangladesh: A systematic review and possible public health risks assessment. Appl. Water Sci. 2021, 11, 100. [Google Scholar] [CrossRef] [PubMed]
- Diaw, M.; Faye, S.; Stichler, W.; Maloszewski, P. Isotopic and geochemical characteristics of groundwater in the Senegal River delta aquifer: Implication of recharge and flow regime. Environ. Earth. Sci. 2012, 66, 1011–1020. [Google Scholar] [CrossRef]
- Chandrajith, R.; Chaturangani, D.; Abeykoon, S.; Barth, J.A.C.; Geldern, R.; Edirisinghe, E.A.N.V.; Dissanayake, C.B. Quantification of groundwater–seawater interaction in a coastal sandy aquifer system: A study from Panama, Sri Lanka. Environ. Earth. Sci. 2014, 72, 867–877. [Google Scholar] [CrossRef]
- Wang, F.; Song, K.; He, X.; Peng, Y.; Liu, D.; Liu, J. Identification of groundwater pollution characteristics and health risk assessment of a landfill in a low permeability area. Int. J. Environ. Res. Public Health 2021, 18, 7690. [Google Scholar] [CrossRef]
- Elazhary, M.A.E.; Sabet, H.S.; Abu Khatita, A.M.; Shehata, A.F.; El-Hemamy, S.T. Using hydrogeochemical and geographic information system methods as an environmental approach for evaluating coastal aquifers in the west northern coast of Egypt. Egypt. J. Geol. 2023, 67, 95–110. [Google Scholar] [CrossRef]
- Fida, M.; Li, P.; Alam, S.K.; Wang, Y.; Nsabimana, A.; Shrestha, P.S. Review of Groundwater Nitrate Pollution from Municipal Landfill Leachates: Implications for Environmental and Human Health and Leachate Treatment Technologies. Expo. Health 2024, 16, 1225–1249. [Google Scholar] [CrossRef]
- Schullehner, J.; Hansen, B.; Thygesen, M.; Pedersen, C.B.; Sigsgaard, T. Nitrate in drinking water and colorectal cancer risk: A nationwide population-based cohort study. Int. J. Cancer 2018, 143, 73–79. [Google Scholar] [CrossRef] [PubMed]
- Wongsasuluk, P.; Chotpantarat, S.; Siriwong, W.; Robson, M. Heavy metal contamination and human health risk assessment in drinking water from shallow groundwater wells in an agricultural area in Ubon Ratchathani province, Thailand. Environ. Geochem. Health 2013, 36, 169–182. [Google Scholar] [CrossRef] [PubMed]
- Abuzaid, A.S.; Jahin, H.S. Implications of irrigation water quality on shallow groundwater in the Nile Delta of Egypt: A human health risk prospective. Environ. Technol. Innov. 2021, 22, 101383. [Google Scholar] [CrossRef]
- Hossain, M.E.; Shahrukh, S.; Hossain, S.A. Chemical Fertilizers and Pesticides: Impacts on Soil Degradation, Groundwater, and Human Health in Bangladesh. In Environmental Degradation: Challenges and Strategies for Mitigation, 2nd ed.; Singh, V.P., Yadav, S., Yadav, K.K., Yadava, R.N., Eds.; Springer International Publishing: Cham, Switzerland, 2022; Volume 104, pp. 63–92. [Google Scholar] [CrossRef]
- Dugan, S.T.; Muhammetoglu, A.; Uslu, A. A combined approach for the estimation of groundwater leaching potential and environmental impacts of pesticides for agricultural lands. Sci. Total Environ. 2023, 901, 165892. [Google Scholar] [CrossRef]
- Kasem, A.M.; Xu, Z.; Jiang, H.; Liu, W.; Zhang, J.; Nosair, A.M. Nitrate source and transformation in groundwater under urban and agricultural arid environment in the southeastern Nile Delta, Egypt. Water 2024, 16, 22. [Google Scholar] [CrossRef]
- Edition, F. Guidelines for drinking-water quality. WHO Chron. 2011, 38, 104–108. [Google Scholar]
- Siegel, F.R. Environmental Geochemistry of Potentially Toxic Metals, 1st ed.; Springer: Berlin, Germany, 2002; p. 218. [Google Scholar] [CrossRef]
- Gomes, M.; Ralph, T.J.; Humphries, M.S.; Graves, B.P.; Kobayashi, T.; Gore, D.B. Waterborne contaminants in high intensity agriculture and plant production: A review of on-site and downstream impacts. Sci. Total Environ. 2025, 958, 178084. [Google Scholar] [CrossRef]
- Chen, F.; Yao, L.; Mei, G.; Shang, Y.; Xiong, F.; Ding, Z. Groundwater quality and potential human health risk assessment for drinking and irrigation purposes: A case study in the semiarid region of north China. Water 2021, 13, 783. [Google Scholar] [CrossRef]
- Prapanchan, V.N.; Subramani, T.; Karunanidhi, D.; Gopinathan, P. Groundwater quality assessment for drinking and irrigation purposes and its human health risks in the Sevathur mine region, south India. Desalination Water Treat. 2024, 320, 100883. [Google Scholar] [CrossRef]
- Schulte, P.; van Geldern, R.; Freitag, H.; Karim, A.; Négrel, P.; Petelet-Giraud, E.; Probst, A.; Probst, J.L.; Telmer, K.; Veizer, J.; et al. Applications of stable water and carbon isotopes in watershed research: Weathering, carbon cycling, and water balances. Earth. Sci. Rev. 2011, 109, 20–31. [Google Scholar] [CrossRef]
- Yousif, M.; van Geldern, R.; Bubenzer, O. Hydrogeological investigation of shallow aquifers in an arid data-scarce coastal region (El Daba’a, northwestern Egypt). Hydrogeol. J. 2016, 24, 159–179. [Google Scholar] [CrossRef]
- Liao, F.; Wang, G.; Yi, L.; Shi, Z.; Cheng, G.; Kong, Q.; Liu, C. Identifying locations and sources of groundwater discharge into Poyang Lake (eastern China) using radium and stable isotopes (deuterium and oxygen-18). Sci. Total Environ. 2020, 740, 140163. [Google Scholar] [CrossRef] [PubMed]
- Mao, H.; Wang, G.; Shi, Z.; Liao, F.; Xue, Y. Spatiotemporal variation of groundwater recharge in the lower reaches of the Poyang Lake Basin, China: Insights from stable hydrogen and oxygen isotopes. J. Geophys. Res. Atmos. 2021, 126, e2020JD033760. [Google Scholar] [CrossRef]
- Ahmed, M.; Chen, Y.; Khalil, M.M. Isotopic composition of groundwater resources in arid environments. J. Hydrol. 2022, 609, 127773. [Google Scholar] [CrossRef]
- Dhanasekarapandian, M.; Chandran, S.; Devi, D.S.; Kumar, V. Spatial and temporal variation of groundwater quality and its suitability for irrigation and drinking purpose using GIS and WQI in an urban fringe. J. Afr. Earth. Sci. 2016, 124, 270–288. [Google Scholar] [CrossRef]
- Ambrosino, M.; El-Saadani, Z.; Khatita, A.A.; Mingqi, W.; Palarea-Albaladejo, J.; Cicchella, D. Geochemical speciation, ecological risk and assessment of main sources of potentially toxic elements (PTEs) in stream sediments from Nile River in Egypt. Water 2023, 15, 2308. [Google Scholar] [CrossRef]
- Egbueri, J.C.; Unigwe, C.O.; Omeka, M.E.; Ayejoto, D.A. Urban groundwater quality assessment using pollution indicators and multivariate statistical tools: A case study in southeast Nigeria. Int. J. Environ. Anal. Chem. 2023, 103, 3324–3350. [Google Scholar] [CrossRef]
- Atwia, M.G.; Abou Heleika, M.M.; El-Shishtawy, A.M.; Sharp, J.M. Hydrostratigraphy of the Central Nile Delta, Egypt, Using Geoelectric Measurements. EGS AGU EUG Jt. Assem. 2003, 5, 6–11. [Google Scholar]
- Gemail, K.S.; El-Shishtawy, A.M.; El-Alfy, M.; Ghoneim, M.F.; Abd El-Bary, M.H. Assessment of aquifer vulnerability to industrial waste water using resistivity measurements: A case study along El-Gharbyia main drain, Nile Delta, Egypt. J. Appl. Geophys. 2011, 75, 140–150. [Google Scholar] [CrossRef]
- Bennett, P.C.; El Shishtawy, A.M.; Sharp, J.M.; Atwia, M.G. Source and migration of dissolved manganese in the Central Nile Delta Aquifer, Egypt. J Afr. Earth. Sci. 2014, 96, 8–20. [Google Scholar] [CrossRef]
- Negm, A.M.; Sakr, S.; Abd-Elaty, I.; Abd-Elhamid, H.F. An Overview of Groundwater Resources in Nile Delta Aquifer. In The Handbook of Environmental Chemistry; Negm, A., Ed.; Groundwater in the Nile Delta; Springer: Cham, Switzerland, 2018; Volume 73, pp. 3–44. [Google Scholar] [CrossRef]
- Arafa, N.A.; Salem, Z.E.S.; Ghorab, M.A.; Soliman, S.A.; Abdeldayem, A.L.; Moustafa, Y.M.; Ghazala, H.H. Evaluation of groundwater sensitivity to pollution using GIS-based modified DRASTIC-LU model for sustainable development in the Nile Delta Region. Sustainability 2022, 14, 14699. [Google Scholar] [CrossRef]
- Shi, Q.; Gao, Z.; Guo, H.; Zeng, X.; Sandanayake, S.; Vithanage, M. Hydrogeochemical factors controlling the occurrence of chronic kidney disease of unknown etiology (CKDu). Environ. Geochem. Health 2023, 45, 2611–2627. [Google Scholar] [CrossRef] [PubMed]
- Ahmad, A.; van der Wens, P.; Baken, K.; de Waal, L.; Bhattacharya, P.; Stuyfzand, P. Arsenic reduction to< 1 µg/L in Dutch drinking water. Environ. Int. 2020, 134, 105253. [Google Scholar] [CrossRef]
- Chen, R.; Chai, X.; Zhang, Y.; Zhou, T.; Xia, Y.; Jiang, X.; Chen, C. Novel role of FTO in regulation of gut–brain communication via Desulfovibrio fairfieldensis-produced hydrogen sulfide under arsenic exposure. Gut Microbes 2025, 17, 2438471. [Google Scholar] [CrossRef]
- Richter, F.; Kloster, S.; Wodschow, K.; Hansen, B.; Schullehner, J.; Kristiansen, S.M.; Petersen, M.M.; Strandberg-Larsen, K.; Ersbøll, A.K. Maternal exposure to arsenic in drinking water and risk of congenital heart disease in the offspring. Environ. Int. 2022, 160, 107051. [Google Scholar] [CrossRef]
- Maity, J.P.; Vithanage, M.; Kumar, M.; Ghosh, A.; Mohan, D.; Ahmad, A.; Bhattacharya, P. Seven 21st century challenges of arsenic-fluoride contamination and remediation. In Groundwater for Sustainable Development; Elsevier B.V.: Amsterdam, The Netherlands, 2021; Volume 12. [Google Scholar] [CrossRef]
- Nshimiyimana, C.; Thakur, N.; Alalawy, A.I.; Zheng, Y.; Kareri, T.; Salama, E.S. Low-water quality and non-communicable disease nexus: Health impacts, mechanisms, and advanced water treatment approaches. J. Environ. Chem. Eng. 2025, 13, 115744. [Google Scholar] [CrossRef]
- Rizzini, A.; Vessani, F.; Coccetta, V.; Milad, G. Stratigraphy and Sedimentation of a Neogene—Quaternary Section in the Nile Delta Area (A.R.E.). Mar. Geol. 1978, 27, 327–348. [Google Scholar] [CrossRef]
- Coutellier, V.; Stanley, D.J. Late Quaternary stratigraphy of the Eastern Nile Delta, Egypt. Mar. Geol. 1987, 77, 257–275. [Google Scholar] [CrossRef]
- Stanley, D.J.; Warne, A.G. Nile delta: Recent geological evolution and human impact. Science. 1993, 260, 628–634. [Google Scholar] [CrossRef]
- Zaghloul, Z.M.; Taha, A.A.; Hegab, O.; El Fawal, F. The Neogene—Quaternary sedimentary basins of the Nile Delta. Egyptian J. Geol. 1977, 21, 1–19. [Google Scholar]
- Kashef, A.I. Salt-water intrusion in the Nile Delta. Ground Water 1983, 21, 160–167. [Google Scholar] [CrossRef]
- Salem, Z.E.; Hasan, S.S.; Sefelnasr, A.M. Health risk assessment of groundwater use for drinking in West Nile Delta, Egypt. Sci. Rep. 2025, 15, 7414. [Google Scholar] [CrossRef]
- Khan, M.A.; Akhtar, R.; Ahmad, I. Assessing Groundwater Contamination, Health Risk And Health Cost: A Regression Analysis And Fuzzy AHP Approach. Spectr. Eng. Sci. 2025, 3, 452–477. [Google Scholar]
- RIGW. Hydrological Map of Egypt, SCAL 1: 500,000. Nile Delta; Research Institute for the Groundwater: El Kanater Ek Khairia, Egypt, 1992; p. 39. [Google Scholar]
- Salem, Z.E. Natural and human impacts on the groundwater under an Egyptian village, central Nile Delta: A case study of Mehallet Menouf. In Proceedings of the Thirteenth International Water Technology Conference (IWTC 13), Hurghada, Egypt, 12 March 2009; pp. 1397–1414. [Google Scholar]
- Bandara, S.; Rajapaksha, A.U.; Kandasamy, A.; Hettithanthri, O.; Magana-Arachchi, D.; Wanigatunge, R.; Vithanage, M. Food-mediated exposure of Hofmeister ions in Oryza sativa (Rice) from selected CKDu endemic regions in Sri Lanka. Environ. Geochem. Health 2023, 45, 8417–8432. [Google Scholar] [CrossRef]
- Masoud, A.A. Geotechnical evaluation of the alluvial soils for urban land management zonation in Gharbiya governorate, Egypt. J. Afr. Earth. Sci. 2015, 101, 360–374. [Google Scholar] [CrossRef]
- Sawyer, G.N.; McCartly, D.L.; Parkin, G. Chemistry for Environmental Engineering and Science, 5th ed.; McGraw Hill: New York, NY, USA, 2003; p. 752. [Google Scholar]
- Van Geldern, R.; Barth, J.A.C. Optimization of instrument setup and post-run corrections for oxygen and hydrogen stable isotope measurements of water by isotope ratio infrared spectroscopy (IRIS). Limnol. Oceanogr: Methods. 2012, 10, 1024–1036. [Google Scholar] [CrossRef]
- Clark, I.D.; Fritz, P. Environmental Isotopes in Hydrogeology; CRC Press/Lewis Publishers: Boca Raton, FL, USA, 1997; p. 328. [Google Scholar]
- Vasanthavigar, M.; Srinivasamoorthy, K.; Vijayaragavan, K.; Ganthi, R.R.; Chidambaram, S.; Anandhan, P.; Manivannan, R.; Vasudevan, S. Application of water quality index for groundwater quality assessment: Thirumanimuttar sub-basin, Tamilnadu, India. Environ. Monit. Assess. 2010, 171, 595–609. [Google Scholar] [CrossRef]
- Singh, V.; Singh, U.C. Assessment of groundwater quality of parts of Gwalior (India) for agricultural purposes. Indian. Indian. J. Sci. Technol. 2008, 1, 1–5. [Google Scholar] [CrossRef]
- Wilcox, L.V. Classification and Use of Irrigation Waters; Circular 969; USDA: Washington, DC, USA, 1955.
- Peplow, D.; Edmonds, R. Health risks associated with contamination of groundwater by abandoned mines near Twisp in Okanogan County, Washington, USA. Environ. Geochem. Health 2004, 26, 69–79. [Google Scholar] [CrossRef]
- Dissanayake, C.B.; Chandrajith, R. Introduction to Medical Geology; Springer: Berlin, Germany, 2009; p. 297. [Google Scholar] [CrossRef]
- Li, P.; Wu, J.; Qian, H.; Lyu, X.; Liu, H. Origin and assessment of groundwater pollution and associated health risk: A case study in an industrial park, northwest China. Environ. Geochem. Health 2014, 36, 693–712. [Google Scholar] [CrossRef]
- Fajčíková, K.; Cvečková, V.; Stewart, A.; Rapant, S. Health risk estimates for groundwater and soil contamination in the Slovak Republic: A convenient tool for identification and mapping of risk areas. Environ. Geochem. Health 2014, 36, 973–986. [Google Scholar] [CrossRef] [PubMed]
- USEPA (US Environmental Protection Agency). Risk Assessment Guidance for Superfund, 1989, Volume I: Human Health Evaluation Manual (Part A); EPA 540/1-89/002; US Environmental Protection Agency, Office of Emergency and Remedial Response: Washington, DC, USA, 1989.
- USEPA (US Environmental Protection Agency). Guidelines for Carcinogen Risk Assessment; EPA/630/P-03/001F; United States Environmental Protection Agency, Risk Assessment Forum: Washington, DC, USA, 2005.
- Lu, S.G.; Tang, C.; Rengel, Z. Combined effects of waterlogging and salinity on electrochemistry, water-soluble cations and water dispersible clay in soils with various salinity levels. Plant Soil 2004, 264, 231–245. [Google Scholar] [CrossRef]
- Durvey, V.S.; Sharma, L.L.; Saini, V.P.; Sharma, B.K. Handbook on the Methodology of Water Quality Assessment Rajasthan; Agriculture University: Jaipur City, India, 1991. [Google Scholar]
- Agrawal, V.; Jagetai, M. Hydrochemical assessment of groundwater quality in Udaipur city, Rajasthan, India. In Proceedings of the National Conference on Dimensions of Environmental Stress in India; Department of Geology, MS University: Baroda, India, 1997; pp. 151–154. [Google Scholar]
- Sengupta, P. Potential health impacts of hard water. Int. J. Prev. Med. 2013, 4, 866–875. [Google Scholar] [PubMed Central]
- Kozisek, F. Regulations for calcium, magnesium or hardness in drinking water in the European Union member states. Regul. Toxicol. Pharmacol. 2020, 112, 104589. [Google Scholar] [CrossRef]
- USEP Drinking Water Advisory: Consumer Acceptability Advice and Health Effects Analysis on Sodium EPA 822-R-03-006; US Environmental Protection Agency Office of Water (4304T), Health and Ecological Criteria Division: Washington, DC, USA, 2003.
- Piper, A.M. A graphical interpretation of water analysis. Trans. Am. Geophys. Union 1944, 25, 914–928. [Google Scholar] [CrossRef]
- Sultan, M.; Sturchio, N.C.; Gheith, H.; Hady, Y.A.; Anbeawy, M. Chemical and Isotopic Constraints on the Origin of Wadi El-Tarfa Ground Water, Eastern Desert, Egypt. Groundwater 2000, 38, 743–751. [Google Scholar] [CrossRef]
- Sadek, M.A.; Samie, S.G. Pollution vulnerability of the quaternary aquifer near Cairo, Egypt, as indicated by isotopes and hydrochemistry. J. Hydrogeol. 2001, 9, 273–281. [Google Scholar] [CrossRef]
- Geirnart, W.; Leaven, M.P. Composition and history of groundwater in the western Nile delta. J. Hydrol. 1992, 138, 169–189. [Google Scholar] [CrossRef]
- Aly, A.I.M.; Froehlich, K.; Nada, A.; Awad, M.; Hamza, M.; Salem, W.M. Study of environmental isotope distribution in the Aswan High Dam Lake (Egypt) for estimation of evaporation of lake water and its recharge to adjacent groundwater. Environ. Geochem. Health 1993, 15, 37–49. [Google Scholar] [CrossRef]
- Chandrajith, R.; Diyabalanage, S.; Premathilake, K.M.; Hanke, C.; van Geldern, R.; Barth, J.A.C. Controls of evaporative irrigation return flows in comparison to seawater intrusion in coastal karstic aquifers in northern Sri Lanka: Evidence from solutes and stable isotopes. Sci. Total. Environ. 2016, 548–549, 421–428. [Google Scholar] [CrossRef]
- Rozanski, K.; Araguás-Araguás, L.; Gonfiantini, R. Isotopic patterns in modern global precipitation. In Climate Change in Continental Isotopic Records; Swart, P.K., Lohmann, K.L., McKenzie, J., Savin, S., Eds.; American Geophysical Union: Washington, DC, USA, 1993; pp. 1–37. [Google Scholar]
- Awad, M.A.; Hamza, M.S.; Atwa, S.M.; Sallouma, M.K. Isotopic and hydrogeochemical evaluation of groundwater at Qusier-Safaga area, eastern desert, Egypt. Environ. Geochem. Health 1996, 18, 47–54. [Google Scholar] [CrossRef]
- Abu Khatita, A.M.; Koch, R.; Bamousa, A.O. Sources identification and contamination assessment of heavy metals in soil of Middle Nile Delta, Egypt. J. Taibah Univ. Sci. 2020, 14, 750–761. [Google Scholar] [CrossRef]
- Thomas, J.; Rose, T. Environmental isotopes in hydrogeology. Environ. Earth Sci. 2003, 43, 532. [Google Scholar] [CrossRef]
- Edmunds, W.M.; Guendouz, A.H.; Mamou, A.; Moulla, A.; Shand, P.; Zouari, K. Groundwater evolution in the Continental Intercalaire aquifer of southern Algeria and Tunisia: Trace element and isotopic indicators. Appl. Geochem. 2003, 18, 805–822. [Google Scholar] [CrossRef]
- Kendall, C.; McDonnell, J.J. (Eds.) Isotope Tracers in Catchment Hydrology; Elsevier: Amsterdam, The Netherlands, 2012. [Google Scholar]
- Apostoli, P.; Cornelis, R.; Duffus, J.; Hoet, P.; Lison, D.; Templeton, D.M. Elemental Speciation in Human Health Risk Assessment. Environment Health Criteria 234; WHO: Geneva, Switzerland, 2006. [Google Scholar]
- USEPA (US Environmental Protection Agency). Ground Water and Drinking Water. 2012. Available online: https://www.epa.gov/ground-water-and-drinking-water (accessed on 27 January 2025).
- Wasserman, G.A.; Liu, X.; Parvez, F.; Ahsan, H.; Levy, D.; Factor-Litvak, P.; Kline, J.; Van Geen, A.; Slavkovich, V.; LoIacono, N.J.; et al. Water manganese exposure and children’s intellectual function in Araihazar, Bangladesh. Environ. Health. Persp. 2006, 114, 124–129. [Google Scholar] [CrossRef] [PubMed]
- Nádaská, G.; Lesny, J.; Michalik, I. Environmental aspect of manganese chemistry. Health. Environ. J. 2010, 100702-A, 1–16. [Google Scholar]
- Crossgrove, J.; Zheng, W. Manganese toxicity upon overexposure. NMR Biomed. 2004, 17, 544–553. [Google Scholar] [CrossRef]

| Parameter | WHO * Standards | Weight, wi | Relative Weight, Wi |
|---|---|---|---|
| pH | 7 | 3 | 0.06 |
| TDS (mg/L) | 500 | 5 | 0.11 |
| Na+ (mg/L) | 200 | 2 | 0.04 |
| Mg2+ (mg/L) | 30 | 3 | 0.06 |
| Ca2+ (mg/L) | 75 | 3 | 0.06 |
| Cl− (mg/L) | 250 | 5 | 0.11 |
| (mg/L) | 250 | 4 | 0.09 |
| Fe (mg/L) | 0.3 | 4 | 0.09 |
| Mn (mg/L) | 0.4 | 4 | 0.09 |
| Cu (mg/L) | 2 | 2 | 0.04 |
| Zn (mg/L) | 5 | 3 | 0.06 |
| As (mg/L) | 0.01 | 4 | 0.09 |
| Pb (mg/L) | 0.01 | 5 | 0.11 |
| ∑wi = 47 | ∑Wi = 1.0 |
| S. No. | pH | Eh (mV) | EC (µS/cm) | TDS (mg/L) | TH (mg/L CaCO3) | K+ (mg/L) | Na+ (mg/L) | Ca2+ (mg/L) | Mg2+ (mg/L) | (mg/L) | (mg/L) | Cl− (mg/L) | As (µg/L) | Cu (µg/L) | Cr (µg/L) | Fe (µg/L) | Mn (µg/L) | Pb (µg/L) | Sr (µg/L) | Zn (µg/L) | δ2HH2O (‰) | δ18OH2O (‰) |
|---|---|---|---|---|---|---|---|---|---|---|---|---|---|---|---|---|---|---|---|---|---|---|
| Shallow Groundwater | ||||||||||||||||||||||
| 1 | 8.1 | −14 | 624 | 411.5 | 254.3 | 4.6 | 31 | 70.8 | 19 | 273 | 1.2 | 73.9 | 0.5 | 1.24 | 0.52 | 270 | 670 | 2.4 | 490 | 170 | 8.61 | 0.46 |
| 2 | 7.9 | 3 | 710 | 451.2 | 315.8 | 3.6 | 43 | 82.4 | 27 | 273 | 1.1 | 136.1 | 0.5 | 0.54 | 1.13 | 360 | 690 | 0.5 | 690 | 2200 | 11.03 | 0.79 |
| 3 | 7.99 | 12 | 823 | 553 | 242.2 | 3.5 | 36 | 64.3 | 20 | 265 | 0.6 | 77.1 | 0.6 | 0.5 | 0.67 | 600 | 670 | 0.6 | 450 | 310 | 10.25 | 0.65 |
| 4 | 7.98 | −5 | 1572 | 1002 | 353.8 | 5.4 | 200 | 96 | 28 | 525 | 88.6 | 195.0 | 0.5 | 0.5 | 0.82 | 410 | 1000 | 0.5 | 720 | 890 | 16.78 | 1.68 |
| 5 | 7.86 | 0 | 931 | 595 | 226.1 | 3.9 | 110 | 57.8 | 20 | 331 | 23.9 | 124.7 | 0.5 | 1.07 | 0.98 | 63 | 770 | 0.9 | 689 | 482 | −5.44 | −1.39 |
| 6 | 7.8 | 0 | 1004 | 651 | 262.4 | 3.5 | 110 | 65.8 | 24 | 299 | 43.3 | 154.8 | 0.5 | 0.5 | 0.96 | 240 | 410 | 0.5 | 810 | 260 | 8.94 | 0.39 |
| 7 | 7.78 | −1 | 776 | 500 | 298.6 | 3.1 | 55 | 75.4 | 27 | 397 | 48.9 | 34.2 | 0.5 | 0.56 | 0.50 | 420 | 530 | 0.5 | 750 | 4600 | 20.68 | 2.28 |
| 8 | 7.93 | −9 | 1161 | 752 | 339.1 | 5.0 | 130 | 95 | 25 | 516 | 50.7 | 109.5 | 0.5 | 1.3 | 0.50 | 19 | 1700 | 0.5 | 750 | 12.8 | 21.19 | 2.3 |
| 9 | 7.92 | −7 | 800 | 523 | 311.0 | 3.9 | 36 | 83.7 | 25 | 292 | 0.7 | 111.1 | 0.7 | 0.5 | 2.18 | 990 | 460 | 0.5 | 540 | 520 | 7.38 | 0.23 |
| 10 | 8.21 | 20 | 961 | 614 | 211.7 | 4.1 | 140 | 57 | 17 | 479 | 51.8 | 54.2 | 0.5 | 57.6 | 0.70 | 240 | 530 | 9.4 | 440 | 630 | 27.61 | 3.29 |
| 11 | 8.12 | −12 | 928 | 607 | 354.4 | 5.0 | 47 | 99.5 | 26 | 310 | 32.8 | 126 | 0.5 | 4.5 | 0.97 | 640 | 530 | 0.5 | 710 | 230 | 8.94 | 0.47 |
| 12 | 7.89 | −4 | 1957 | 1274 | 442.0 | 41.0 | 260 | 110 | 41 | 678 | 203 | 209 | 0.5 | 2.5 | 0.50 | 57.3 | 1600 | 0.5 | 1300 | 600 | 19.36 | 2.2 |
| 13 | 8.11 | −13 | 523 | 338.6 | 195.3 | 3.3 | 28 | 53.7 | 15 | 232 | 2.8 | 48.7 | 0.5 | 0.5 | 0.70 | 180 | 410 | 1.0 | 360 | 520 | 11.08 | 0.79 |
| 14 | 7.43 | 23 | 1057 | 681.6 | 466.6 | 3.8 | 48 | 110 | 47 | 511 | 64.9 | 66.3 | 0.5 | 0.9 | 0.50 | 100 | 1700 | 0.6 | 640 | 1600 | 23.45 | 2.71 |
| 15 | 7.97 | −7 | 558 | 356.5 | 319.6 | 3.4 | 52 | 87.2 | 25 | 407 | 3.6 | 72.3 | 1.4 | 0.5 | 0.50 | 290 | 1300 | 0.5 | 690 | 949 | 11.51 | 0.74 |
| 16 | 7.52 | 15 | 1198 | 788.5 | 367.9 | 4.5 | 110 | 100 | 29 | 680 | 26 | 21.8 | 0.5 | 1.06 | 0.72 | 13.4 | 630.4 | 1.2 | 890 | 280 | 19.38 | 2.23 |
| 17 | 7.9 | −5 | 419 | 274 | 132.1 | 2.8 | 36 | 36.5 | 10 | 169 | 19 | 39.9 | 0.5 | 0.65 | 1.55 | 340 | 360 | 0.5 | 330 | 150 | 12.62 | 0.95 |
| 18 | 7.58 | 12 | 1571 | 1104 | 496 | 4.2 | 180 | 130 | 42 | 342 | 280 | 230 | 0.5 | 1.07 | 1.25 | 450 | 1500 | 1.0 | 940 | 1400 | 12.74 | 1.16 |
| 19 | 7.88 | 0 | 571 | 378 | 192.4 | 2.2 | 53 | 52.5 | 15 | 340 | 8.4 | 17.5 | 0.63 | 0.91 | 1.34 | 150 | 520 | 0.7 | 450 | 409 | 10.16 | 0.65 |
| 20 | 7.97 | 9 | 654 | 424 | 142.1 | 2.1 | 60 | 35.6 | 13 | 245 | 120 | 250 | 0.5 | 2.17 | 0.50 | 16.8 | 220.3 | 0.5 | 380 | 390 | 16.36 | 1.79 |
| 21 | 7.96 | −4 | 656 | 438.4 | 243.6 | 5.7 | 55 | 61.6 | 22 | 313 | 73.2 | 28 | 0.9 | 5.76 | 1.91 | 1100 | 1300 | 2.2 | 480 | 840 | 22.49 | 2.51 |
| 22 | 8.07 | −7 | 795 | 518 | 322.5 | 4.0 | 50 | 86.7 | 26 | 454 | 1.7 | 46 | 0.5 | 0.5 | 0.50 | 18.7 | 970 | 0.5 | 590 | 400 | 9.6 | 0.54 |
| 23 | 8.1 | −11 | 721 | 487 | 213.5 | 4.6 | 90 | 54.4 | 19 | 385 | 45.1 | 38.2 | 0.5 | 0.87 | 0.58 | 510 | 850 | 1.9 | 430 | 57.8 | 25.98 | 3.1 |
| 24 | 8.08 | −11 | 804 | 531 | 345.5 | 4.1 | 43 | 95.9 | 26 | 448 | 1.6 | 55 | 0.5 | 0.5 | 0.50 | 369.8 | 1100 | 0.6 | 690 | 160 | 15.07 | 1.32 |
| 25 | 7.97 | −5 | 981 | 641 | 401.0 | 4.5 | 49 | 110 | 31 | 551 | 0.7 | 45.6 | 0.5 | 0.5 | 0.50 | 21.4 | 1000 | 0.5 | 760 | 150 | 11.64 | 0.84 |
| Min | 7.43 | −14 | 419 | 274 | 132 | 2.1 | 28 | 35.6 | 10 | 169.4 | 0.6 | 17.5 | 0.5 | 0.5 | 0.5 | 13.4 | 220.3 | 0.5 | 330 | 12.8 | −5.44 | −1.39 |
| Max | 8.21 | 23 | 1957 | 1274 | 496 | 41 | 260 | 130 | 47 | 680 | 280 | 250 | 1.4 | 57.6 | 2.2 | 1100 | 1700 | 9.4 | 1300 | 4600 | 27.61 | 3.29 |
| avg. | 7.9 | −0.4 | 930 | 609 | 299 | 6.6 | 86.6 | 79.1 | 25 | 391.3 | 54.6 | 97.4 | 0.6 | 5.4 | 0.89 | 332.6 | 864 | 1.4 | 651 | 845 | 14.1 | 1.2 |
| Deep Groundwater | ||||||||||||||||||||||
| 26 | 7.8 | 3 | 936 | 608 | 324.8 | 4.29 | 53 | 84.3 | 28 | 226 | 15.0 | 175 | 0.5 | 0.5 | 0.5 | 170 | 790 | 0.07 | 730 | 11 | 8.74 | 0.42 |
| 27 | 7.87 | 0 | 446 | 288 | 147.5 | 6.22 | 35 | 39.4 | 12 | 241 | 0.6 | 24.7 | 0.5 | 5.4 | 0.67 | 160 | 370 | 0.5 | 270 | 5.9 | 1.4 | −0.48 |
| 28 | 8 | −8 | 351 | 233 | 126.3 | 3.25 | 16 | 34.4 | 9.9 | 163 | 0.8 | 22.7 | 0.5 | 0.5 | 0.5 | 210 | 340 | 0.5 | 240 | 5.8 | 8.89 | 0.49 |
| Min | 7.8 | −8 | 351 | 232 | 126.2 | 3.2 | 16 | 34.4 | 9.9 | 162.6 | 0.6 | 22.7 | 0.5 | 0.5 | 0.5 | 160 | 340 | 0.07 | 240 | 5.8 | 1.4 | −0.48 |
| Max | 8 | 3 | 936 | 608 | 324.7 | 6.2 | 53 | 84.3 | 28 | 240.6 | 15 | 175 | 0.5 | 5.4 | 0.67 | 210 | 790 | 0.5 | 730 | 11 | 8.89 | 0.49 |
| avg. | 7.8 | −2 | 604 | 394 | 209.9 | 4.6 | 34.6 | 55.36 | 17.56 | 206.5 | 6.4 | 84.02 | 0.5 | 2.46 | 0.56 | 182 | 526 | 0.32 | 442 | 7.9 | 5.8 | 0.08 |
| Nile Water | ||||||||||||||||||||||
| 29 | 8.07 | 5 | 476 | 279 | 139.6 | 5.4 | 36 | 36.3 | 12 | 203 | 27 | 22.1 | 0.5 | 2.07 | 3.6 | 440 | 71.9 | 0.53 | 310 | 8.4 | 20.3 | 2.22 |
| 30 | 8.25 | −18 | 658 | 394 | 176.6 | 7.5 | 56 | 44.6 | 16 | 240 | 44.7 | 47 | 0.6 | 1.05 | 0.8 | 100 | 98.3 | 0.50 | 389 | 4.8 | 20.5 | 2.36 |
| pH | Eh | EC | TDS | TH | K | Na | Ca | Mg | HCO3 | SO4 | Cl | Cr | Mn | Fe | Cu | Zn | As | Sr | Pb | |
|---|---|---|---|---|---|---|---|---|---|---|---|---|---|---|---|---|---|---|---|---|
| pH | 1.00 | |||||||||||||||||||
| Eh | −0.57 | 1.00 | ||||||||||||||||||
| EC | −0.37 | 0.23 | 1.00 | |||||||||||||||||
| TDS | −0.38 | 0.24 | 1.00 | 1.00 | ||||||||||||||||
| TH | −0.48 | 0.16 | 0.77 | 0.78 | 1.00 | |||||||||||||||
| K | −0.02 | −0.08 | 0.60 | 0.58 | 0.33 | 1.00 | ||||||||||||||
| Na | −0.20 | 0.18 | 0.89 | 0.89 | 0.48 | 0.63 | 1.00 | |||||||||||||
| Ca | −0.41 | 0.09 | 0.75 | 0.76 | 0.99 | 0.28 | 0.46 | 1.00 | ||||||||||||
| Mg | −0.59 | 0.28 | 0.77 | 0.78 | 0.97 | 0.38 | 0.49 | 0.92 | 1.00 | |||||||||||
| HCO3 | −0.27 | 0.18 | 0.72 | 0.70 | 0.68 | 0.45 | 0.63 | 0.68 | 0.65 | 1.00 | ||||||||||
| SO4 | −0.36 | 0.30 | 0.70 | 0.73 | 0.46 | 0.48 | 0.75 | 0.41 | 0.52 | 0.29 | 1.00 | |||||||||
| Cl | −0.18 | 0.13 | 0.62 | 0.62 | 0.39 | 0.32 | 0.57 | 0.36 | 0.40 | 0.07 | 0.66 | 1.00 | ||||||||
| Cr | 0.06 | 0.06 | −0.22 | −0.23 | −0.27 | −0.09 | −0.15 | −0.28 | −0.25 | −0.37 | 0.00 | −0.15 | 1.00 | |||||||
| Mn | −0.34 | 0.04 | 0.61 | 0.62 | 0.76 | 0.37 | 0.49 | 0.74 | 0.77 | 0.62 | 0.46 | 0.24 | −0.32 | 1.00 | ||||||
| Fe | 0.19 | −0.17 | −0.15 | −0.13 | −0.05 | −0.14 | −0.18 | −0.05 | −0.06 | −0.33 | 0.00 | −0.08 | 0.52 | −0.07 | 1.00 | |||||
| Cu | 0.31 | 0.40 | 0.04 | 0.03 | −0.15 | 0.00 | 0.21 | −0.15 | −0.15 | 0.14 | 0.05 | −0.11 | −0.03 | −0.11 | 0.00 | 1.00 | ||||
| Zn | −0.34 | 0.21 | 0.12 | 0.11 | 0.28 | −0.04 | 0.05 | 0.23 | 0.36 | 0.12 | 0.21 | 0.04 | −0.09 | 0.13 | 0.14 | −0.02 | 1.00 | |||
| As | 0.06 | −0.14 | −0.22 | −0.21 | 0.02 | −0.07 | −0.15 | 0.03 | −0.01 | −0.01 | −0.12 | −0.13 | 0.09 | 0.24 | 0.32 | −0.05 | 0.06 | 1.00 | ||
| Sr | −0.43 | 0.07 | 0.86 | 0.85 | 0.84 | 0.58 | 0.70 | 0.82 | 0.82 | 0.70 | 0.53 | 0.52 | −0.27 | 0.62 | −0.19 | −0.15 | 0.26 | −0.02 | 1.00 | |
| Pb | 0.34 | 0.33 | 0.01 | 0.01 | −0.16 | −0.05 | 0.19 | −0.15 | −0.16 | 0.15 | 0.04 | −0.18 | −0.04 | −0.07 | 0.06 | 0.95 | −0.02 | −0.03 | −0.18 | 1.00 |
| S. No | GWQI | Water Type |
|---|---|---|
| 1 | 77.2 | Good water |
| 2 | 85.4 | Good water |
| 3 | 82.2 | Good water |
| 4 | 118.9 | Poor water |
| 5 | 83.7 | Good water |
| 6 | 64.1 | Good water |
| 7 | 78.0 | Good water |
| 8 | 147.9 | Poor water |
| 9 | 83.0 | Good water |
| 10 | 169.2 | Poor water |
| 11 | 89.0 | Good water |
| 12 | 162.2 | Poor water |
| 13 | 54.0 | Good water |
| 14 | 155.4 | Poor water |
| 15 | 120.6 | Poor water |
| 16 | 76.1 | Good water |
| 17 | 52.9 | Good water |
| 18 | 165.9 | Poor water |
| 19 | 62.2 | Good water |
| 20 | 48.4 | Excellent water |
| 21 | 154.4 | Poor water |
| 22 | 90.6 | Good water |
| 23 | 94.8 | Good water |
| 24 | 110.0 | Poor water |
| 25 | 96.1 | Good water |
| 26 | 87.1 | Good water |
| 27 | 55.2 | Good water |
| 28 | 44.2 | Excellent water |
| S No. | Mn | Fe | Cu | As | Pb | Cr | Zn |
|---|---|---|---|---|---|---|---|
| 1 | 9.57 × 10⁻¹ | 2.57 × 10⁻² | 8.91 × 10⁻⁴ | 4.76 × 10⁻² | 1.91 × 10⁻² | 5.00 × 10⁻² | 1.62 × 10⁻² |
| 2 | 9.86 × 10⁻¹ | 3.43 × 10⁻² | 3.90 × 10⁻⁴ | 4.76 × 10⁻² | 3.97 × 10⁻³ | 1.07 × 10⁻¹ | 2.10 × 10⁻¹ |
| 3 | 9.57 × 10⁻¹ | 5.72 × 10⁻² | 3.57 × 10⁻⁴ | 5.71 × 10⁻² | 4.45 × 10⁻³ | 6.38 × 10⁻² | 2.95 × 10⁻² |
| 4 | 1.43 | 3.90 × 10⁻² | 3.57 × 10⁻⁴ | 4.76 × 10⁻² | 3.97 × 10⁻³ | 7.82 × 10⁻² | 8.48 × 10⁻² |
| 5 | 1.10 | 6.07 × 10⁻³ | 7.67 × 10⁻⁴ | 4.76 × 10⁻² | 6.80 × 10⁻³ | 9.36 × 10⁻² | 4.60 × 10⁻² |
| 6 | 5.86 × 10⁻¹ | 2.29 × 10⁻² | 3.57 × 10⁻⁴ | 4.76 × 10⁻² | 3.97 × 10⁻³ | 9.11 × 10⁻² | 2.48 × 10⁻² |
| 7 | 7.57 × 10⁻¹ | 4.00 × 10⁻² | 4.00 × 10⁻⁴ | 4.76 × 10⁻² | 3.97 × 10⁻³ | 4.76 × 10⁻² | 4.38 × 10⁻¹ |
| 8 | 2.43 | 1.81 × 10⁻³ | 9.14 × 10⁻⁴ | 4.76 × 10⁻² | 3.97 × 10⁻³ | 4.76 × 10⁻² | 1.23 × 10⁻³ |
| 9 | 6.57 × 10⁻¹ | 9.43 × 10⁻² | 3.57 × 10⁻⁴ | 6.88 × 10⁻² | 4.29 × 10⁻³ | 2.08 × 10⁻¹ | 4.95 × 10⁻² |
| 10 | 7.57 × 10⁻¹ | 2.29 × 10⁻² | 4.12 × 10⁻² | 4.76 × 10⁻² | 7.49 × 10⁻² | 6.65 × 10⁻² | 6.00 × 10⁻² |
| 11 | 7.57 × 10⁻¹ | 6.10 × 10⁻² | 3.28 × 10⁻³ | 4.76 × 10⁻² | 3.97 × 10⁻³ | 9.25 × 10⁻² | 2.19 × 10⁻² |
| 12 | 2.29 | 5.46 × 10⁻³ | 1.83 × 10⁻³ | 4.76 × 10⁻² | 3.97 × 10⁻³ | 4.76 × 10⁻² | 5.71 × 10⁻² |
| 13 | 5.86 × 10⁻¹ | 1.71 × 10⁻² | 3.57 × 10⁻⁴ | 4.76 × 10⁻² | 8.28 × 10⁻³ | 6.67 × 10⁻² | 4.95 × 10⁻² |
| 14 | 2.43 | 9.52 × 10⁻³ | 6.38 × 10⁻⁴ | 4.76 × 10⁻² | 5.01 × 10⁻³ | 4.76 × 10⁻² | 1.52 × 10⁻¹ |
| 15 | 1.86 | 2.76 × 10⁻² | 3.57 × 10⁻⁴ | 1.37 × 10⁻¹ | 3.97 × 10⁻³ | 4.76 × 10⁻² | 9.04 × 10⁻² |
| 16 | 9.01 × 10⁻¹ | 1.28 × 10⁻³ | 7.63 × 10⁻⁴ | 4.76 × 10⁻² | 9.32 × 10⁻³ | 6.88 × 10⁻² | 2.67 × 10⁻² |
| 17 | 5.14 × 10⁻¹ | 3.24 × 10⁻² | 4.65 × 10⁻⁴ | 4.76 × 10⁻² | 3.97 × 10⁻³ | 1.48 × 10⁻¹ | 1.43 × 10⁻² |
| 18 | 2.14 | 4.29 × 10⁻² | 7.65 × 10⁻⁴ | 4.99 × 10⁻² | 7.91 × 10⁻³ | 1.19 × 10⁻¹ | 1.33 × 10⁻¹ |
| 19 | 7.43 × 10⁻¹ | 1.43 × 10⁻² | 6.51 × 10⁻⁴ | 5.99 × 10⁻² | 5.86 × 10⁻³ | 1.27 × 10⁻¹ | 3.90 × 10⁻² |
| 20 | 3.15 × 10⁻¹ | 1.61 × 10⁻³ | 1.56 × 10⁻³ | 5.08 × 10⁻² | 3.97 × 10⁻³ | 4.76 × 10⁻² | 3.71 × 10⁻² |
| 21 | 1.86 | 1.05 × 10⁻¹ | 4.12 × 10⁻³ | 9.30 × 10⁻² | 1.73 × 10⁻² | 1.82 × 10⁻¹ | 8.00 × 10⁻² |
| 22 | 1.39 | 1.79 × 10⁻³ | 3.57 × 10⁻⁴ | 4.76 × 10⁻² | 3.97 × 10⁻³ | 4.76 × 10⁻² | 3.81 × 10⁻² |
| 23 | 1.21 | 4.86 × 10⁻² | 6.22 × 10⁻⁴ | 4.89 × 10⁻² | 1.49 × 10⁻² | 5.54 × 10⁻² | 5.50 × 10⁻³ |
| 24 | 1.57 | 3.52 × 10⁻² | 3.57 × 10⁻⁴ | 4.76 × 10⁻² | 5.03 × 10⁻³ | 4.76 × 10⁻² | 1.53 × 10⁻² |
| 25 | 1.43 | 2.04 × 10⁻³ | 3.57 × 10⁻⁴ | 4.76 × 10⁻² | 3.97 × 10⁻³ | 4.76 × 10⁻² | 1.43 × 10⁻² |
| Min. | 3.15 × 10⁻¹ | 1.28 × 10⁻³ | 3.57 × 10⁻⁴ | 4.76 × 10⁻² | 3.97 × 10⁻³ | 4.76 × 10⁻² | 1.23 × 10⁻³ |
| Max. | 2.43 | 1.05 × 10⁻¹ | 4.12 × 10⁻² | 1.37 × 10⁻¹ | 7.49 × 10⁻² | 2.08 × 10⁻¹ | 4.38 × 10⁻¹ |
| Avg. | 1.23 | 3.17 × 10⁻² | 3.85 × 10⁻³ | 5.78 × 10⁻² | 1.15 × 10⁻² | 8.53 × 10⁻² | 8.05 × 10⁻² |
| 26 | 1.13 | 1.62 × 10⁻² | 3.57 × 10⁻⁴ | 4.76 × 10⁻² | 5.64 × 10⁻⁴ | 5.16 × 10⁻² | 1.05 × 10⁻³ |
| 27 | 5.29 × 10⁻¹ | 1.52 × 10⁻² | 3.91 × 10⁻³ | 4.76 × 10⁻² | 3.97 × 10⁻³ | 6.45 × 10⁻² | 5.67 × 10⁻⁴ |
| 28 | 4.86 × 10⁻¹ | 2.00 × 10⁻² | 3.57 × 10⁻⁴ | 4.76 × 10⁻² | 3.97 × 10⁻³ | 4.87 × 10⁻² | 5.55 × 10⁻⁴ |
| Min. | 4.86 × 10⁻¹ | 1.52 × 10⁻² | 3.57 × 10⁻⁴ | 4.76 × 10⁻² | 5.64 × 10⁻⁴ | 4.87 × 10⁻² | 5.55 × 10⁻⁴ |
| Max. | 1.13 | 2.00 × 10⁻² | 3.91 × 10⁻³ | 4.76 × 10⁻² | 3.97 × 10⁻³ | 6.45 × 10⁻² | 1.05 × 10⁻³ |
| Avg. | 7.51 × 10⁻¹ | 1.73 × 10⁻² | 1.78 × 10⁻³ | 4.76 × 10⁻² | 2.61 × 10⁻³ | 5.56 × 10⁻² | 7.54 × 10⁻⁴ |
| RfD Mg/kg/day | 2.00 × 10⁻² | 3.00 × 10⁻¹ | 4.00 × 10⁻² | 3.00 × 10⁻⁴ | 3.60 × 10⁻³ | 3.00 × 10⁻³ | 3.00 × 10⁻¹ |
Disclaimer/Publisher’s Note: The statements, opinions and data contained in all publications are solely those of the individual author(s) and contributor(s) and not of MDPI and/or the editor(s). MDPI and/or the editor(s) disclaim responsibility for any injury to people or property resulting from any ideas, methods, instructions or products referred to in the content. |
© 2025 by the authors. Licensee MDPI, Basel, Switzerland. This article is an open access article distributed under the terms and conditions of the Creative Commons Attribution (CC BY) license (https://creativecommons.org/licenses/by/4.0/).
Share and Cite
Khatita, A.M.A.; van Geldern, R.; Bamousa, A.O.; Alexakis, D.E.; Ismail, E.; Abdellah, W.R.; Babikir, I.A.A. Combining Hydro-Geochemistry and Environmental Isotope Methods to Evaluate Groundwater Quality and Health Risk (Middle Nile Delta, Egypt). Hydrology 2025, 12, 72. https://doi.org/10.3390/hydrology12040072
Khatita AMA, van Geldern R, Bamousa AO, Alexakis DE, Ismail E, Abdellah WR, Babikir IAA. Combining Hydro-Geochemistry and Environmental Isotope Methods to Evaluate Groundwater Quality and Health Risk (Middle Nile Delta, Egypt). Hydrology. 2025; 12(4):72. https://doi.org/10.3390/hydrology12040072
Chicago/Turabian StyleKhatita, Atef M. Abu, Robert van Geldern, Abdullah O. Bamousa, Dimitrios E. Alexakis, Esam Ismail, Wael R. Abdellah, and Ibrahim A. A. Babikir. 2025. "Combining Hydro-Geochemistry and Environmental Isotope Methods to Evaluate Groundwater Quality and Health Risk (Middle Nile Delta, Egypt)" Hydrology 12, no. 4: 72. https://doi.org/10.3390/hydrology12040072
APA StyleKhatita, A. M. A., van Geldern, R., Bamousa, A. O., Alexakis, D. E., Ismail, E., Abdellah, W. R., & Babikir, I. A. A. (2025). Combining Hydro-Geochemistry and Environmental Isotope Methods to Evaluate Groundwater Quality and Health Risk (Middle Nile Delta, Egypt). Hydrology, 12(4), 72. https://doi.org/10.3390/hydrology12040072