Abstract
In the Republic of Djibouti (Horn of Africa), fractured volcanic aquifers serve as the primary water resource. The country’s climatic characteristics (arid climate, average rainfall of 140 mm/year, and absence of surface water) have led to intensive groundwater exploitation to meet increasing water demands. This study focuses on the Dalha basalts aquifer in the Dikhil region. The Dikhil region, located in the southwest of Djibouti and bordering Ethiopia, spans 7200 km2. Its population is estimated at 112,000 inhabitants. The Dalha aquifer is intensively exploited to supply the region and its capital, the city of Dikhil (35,000 inhabitants). The primary objective of this work is to assess the current resources of this aquifer using numerical modeling and its capacity to meet future water demands under the impact of climate change. The RCP 2.6 (Representative Concentration Pathway) was used to simulate the climate scenario up to 2100. Superficial recharge is estimated at 3.86 × 10⁶ m3/year. The current wellfield abstraction amounts to 2.34 × 10⁶ m3/year, accounting for 60% of the aquifer’s recharge. The simulation under RCP 2.6 indicates a declining trend in the water table. These findings highlight the fragile state of the Dalha aquifer, which is critical for the socioeconomic stability of the region. Given its current vulnerability, any increase in exploitation is unsustainable, despite the growing water demand in the Dikhil region. To tackle this challenge, we recommend conducting further studies to deepen the understanding of this system and implementing a real-time monitoring network to track aquifer changes.
1. Introduction
Groundwater resources in arid to semi-arid climates often serve as the sole water resource and are heavily utilized due to the scarcity of surface water and the ongoing social and economic development in these areas [1]. This vital and irreplaceable resource is already under significant strain as demands continue to rise [2,3,4,5]. Consequently, almost all aquifers face intense exploitation, often leading to uncontrolled overuse with potentially severe consequences. In such circumstances, insufficient or poor management may result in restrictions on aquifer use or even the cessation of exploitation altogether [6,7,8]. In these regions, the combined impacts of climate change, water scarcity, and declining water quality exacerbate the challenges, posing serious threats to regional growth and social stability [9]. Therefore, effective management strategies are essential to ensure the sustainable use of these aquifers, meeting water demands while supporting social and economic development. Numerical modeling of aquifers plays a pivotal role in analyzing their responses to various stresses, enabling informed and sustainable management practices [10,11].
This study focuses on the Dalha fractured basaltic aquifer located in the Dikhil region, one of the five administrative regions of the Republic of Djibouti (Ali Sabieh, Dikhil, Tadjourah, Obock, and Arta), situated in the Horn of Africa (Figure 1).
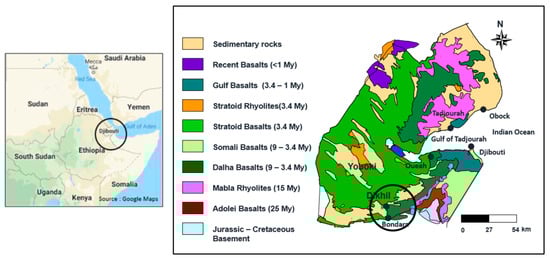
Figure 1.
Location of the Dalha basalts aquifer in the Republic of Djibouti.
Djibouti spans an area of 23,000 km2 and had a population of approximately 1,168,000 in 2024 [12]. The country experiences an arid climate characterized by high daytime temperatures and low irregular rainfall, averaging only 140 mm per year, which results in prolonged drought periods. The absence of perennial surface water exacerbates the harsh climatic conditions and has led to intensive groundwater exploitation, with an estimated extraction rate of 23 million m3 per year as of 2023 [13]. The consequences of overexploitation are evident, including a significant decline in groundwater levels and a noticeable degradation in quality [4].
The Dikhil region is located in the southwest of the country and has an area of 7200 km2, with a population of around 112,000. The region borders Ethiopia and relies heavily on market gardening as its main economic activity. The Dalha basalts aquifer serves as the sole water resource for the region, playing a critical role in both drinking water supply and agriculture. It is exploited through several wellfields, including those supplying the city of Dikhil, the regional capital, which has an estimated population of 35,000. However, the aquifer faces significant challenges due to intensive exploitation, including declining piezometric levels and deteriorating water quality, evidenced by rising chloride concentrations in some wellfields [14].
The primary goal of this study is to evaluate the current capacity of the Dalha aquifer to meet the present and future water demands and to assess its vulnerability to climate change. The methodology employed in this study involves the following:
- Developing a numerical model of the Dalha aquifer to evaluate its resources;
- Simulating rainfall patterns for the Republic of Djibouti up to 2100, based on the RCP 2.6 climate scenario provided by the IPCC;
- Estimating groundwater recharge using the simulated rainfall data;
- Analyzing the aquifer’s response to projected climate scenarios by incorporating the recharge data into the aquifer model.
2. Materials and Methods
2.1. Study Area
2.1.1. Geological Setting
The study area is situated in the southwestern region of Djibouti (Figure 1), extending between latitudes 11°00′00″ N and 11°15′00″ N and longitudes 42°20′00″ E and 42°41′00″ E. It lies at an elevation ranging from 400 to 800 m above sea level and spans an approximate area of 1200 km2. The area is traversed by several intermittent streams, locally known as wadis, including Awrawsa, Dadin, Mouloud, Cheykeyti, etc. It is bordered by the Hambocto wadi to the northeast, the Dabadere wadi to the south, the Mabla rhyolites to the east, the stratoid basalts series and Grand Bara depression to the north, and the sedimentary formations dating from the Plio-Pleistocene to Holocene to the west.
The geological formations in the study area (Figure 2) are predominantly composed of the Dalha basalts series (9–3.4 Ma) and the stratoid basalts series (3.4–1 Ma) of the Afar region, along with sedimentary formations. These sedimentary deposits include materials from tectonic depressions (e.g., Grand Bara) and valley fills, such as fluvial and lacustrine deposits, silts, alluvium, alluvial fans from current wadis, and piedmont conglomerates.
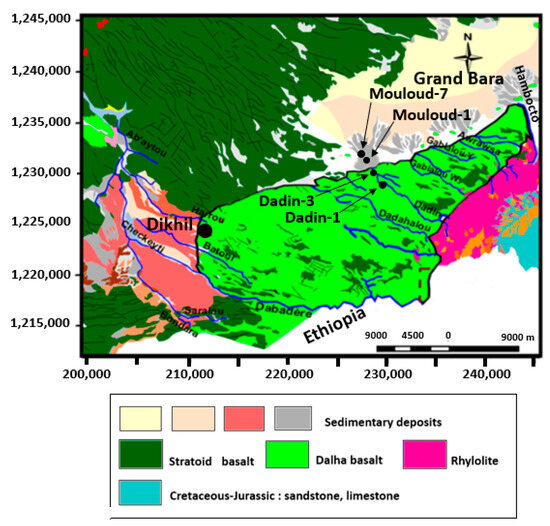
Figure 2.
Geological map of the study area. A cross-section passing through the wells Dadin-1, Dadin-3, Mouloud-1, and Mouloud-7 is shown in Figure 3.
The stratoid basalts series, which covers approximately two-thirds of the Republic of Djibouti, unconformably overlies both the Dalha basalts series and the sedimentary formations. The Dalha basalts series is characterized by a regular sequence of basalts flows, ranging in thickness from a few meters to over 10 m. Interspersed within these flows are layers of acidic lavas, primarily ignimbrites, as well as pumice, rhyolite flows, sedimentary lake deposits, and detrital limestones [15]. Between the basalt flows, scoria and paleosols can be found, often several meters thick, which indicate periods marking the cessation of volcanic activity.
South of the Gulf of Tadjourah, the Dalha basalts outcrops along a long SW-NE strip between the Bondara site on the Ethiopian border, south of Dikhil, and the locality of Oueah. In the study area, these basalts rest unconformably on the Mabla rhyolites to the east, and they are covered by the deposits of the alluvial fans of the wadis descending from the massifs towards the Grand Bara plain. The watersheds of the Dadin and Mouloud Yar wadis are generally of small dimensions and do not exceed 100 km2. The thickness of the volcanic formation is about 200 m in the study area.
There is no hydraulic relationship between the basalts and the substratum separated by a thick layer of clay that sometimes reaches several tens of meters [16,17]. Elsewhere, the Dalha basalts are in contact with the sedimentary formations of Gand Bara as well as the sedimentary basin of Dikhil and the stratoid basalts. A geological section passing through the Dadin and Mouloud boreholes (Figure 3) visualizes the structure and the strong heterogeneity of this aquifer system.
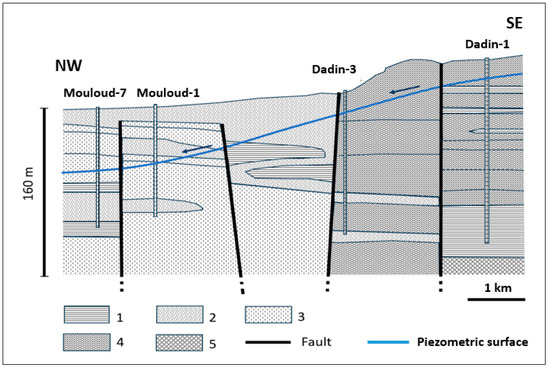
Figure 3.
NW–SE structural cross-section passing through the wells Dadin-1, Dadin-3, Mouloud-1, and Mouloud-7. 1: Clay, 2: alluvium, 3: stratoid basalts, 4: Dalha basalts, and 5: Mabla rhyolite.
A significant network of faults and fractures was formed during various tectonic episodes [18], which extensively impacted the Dalha basalts [19]. These basalts have also been heavily weathered, leading to the smoothing of rugged mountain landscapes.
Considering the stratigraphy, geological logs, historical and recent volcanic–tectonic activities, weathering processes, and hydrothermal effects, the structures of the basaltic reservoir exhibit significant heterogeneity. The highly weathered basalt surface, along with the extensive argillization indicated by red soils with carbonate concretions in some areas, greatly reduces infiltration capacity. In addition, the small dimensions, generally a few tens of square kilometers, of the watersheds of the wadis in the study area, mainly covering the Dalha basalts formations, lead to low inputs during flood periods, thereby limiting diffuse infiltration.
Infiltration predominantly occurs within alluvial aquifers along wadis during flows generated by rainfall. The alluvium in these wadis directly overlies the basalts and generally aligns with tectonic fractures. Under these conditions, wadi underflows serve as intermediaries for recharging the basaltic aquifer, primarily through tectonic faults and, to a lesser extent, via horizontal permeable layers [20,21].
2.1.2. Hydrogeological Setting
The Dalha basalts contain mainly unconfined groundwater exploited on the sites by an ensemble of 19 wells grouped in 3 parts (the eastern part, which includes the Awrassa wellfield and Dbol1 well, the central part with the Dadin wellfield and Mdk and Djg wells, and the western part with the Dikhil wellfield and Dbd2 well) (Figure 4). These are the only wells that currently exploit this aquifer. Their depth varies from 90 m/soil to 174 m/soil (Table 1). At the time of the piezometric measurements, 10 out of 19 wells were in operation, exploiting 6405 m3/d in total. This volume, which was extracted from the aquifer, corresponds to the current needs of the region, particularly to supply the city of Dikhil. It is noteworthy that more than half of the extraction is performed on the Dikhil catchment field (3400 m3/d out of 6405 m3/d).
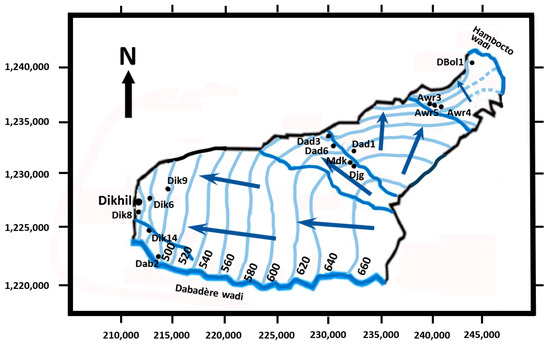
Figure 4.
Piezometric map of Dalha basalts aquifer.

Table 1.
Inventory of wells exploiting the Dalha aquifer. DD: drawdown (m).
The available piezometric data were obtained from these wells. Head data were measured while wells were in operation. The total amount of data is scant, but the resulting piezometric map (Figure 4) is a plausible interpretation of the available data. The piezometric surface of the groundwater reveals two primary flow directions: south–northwest (S–NW) and south–northeast (S–NE). This flow pattern indicates significant fracture permeability, as confirmed by the hydraulic parameter values deduced from pumping tests. Higher hydraulic gradients are observed in the Dikhil area, which are related to intensive groundwater extraction. In the eastern part, due to a lack of data, the head contours are rather hypothetical.
The piezometric map also points out an important feature of the aquifer, consisting of an inflow to the aquifer from the southeastern limit. The contact with the rhyolites to the south does not highlight any hydraulic relationship between these two formations. It is therefore considered an impermeable limit. The outlets of the system are represented as follows: (i) to the north, towards the Grand Bara, and (ii) to the west, towards the Dikhil plain.
According to pumping tests, the transmissivity of the Dalha basalts is lower than that of stratoid basalts and ranges between 12 and 864 m2/d. The transmissivity of stratoid basalts ranges between 12 and 27,000 m2/d. The transmissivity of Quaternary sedimentary rocks aquifers ranges between 10 and 4000 m2/d. The average value of the specific yield (ne, no dimension) of the Dalha basalts is 5.10−3 [22,23].
A comprehensive analysis of aquifer recharge conditions in the Republic of Djibouti (RoD), conducted by the BGR (Bundesanstalt für Geowissenschaften und Rohstoffe, Germany [20]), determined that the average rate of infiltration into aquifers ranges between 2% and 4% of total precipitation. In the arid climate of the RoD, evaporation (E) losses are substantial, significantly reducing the amount of precipitation that contributes to groundwater recharge. These findings by the BGR have been corroborated by subsequent studies [19,21,22,23].
2.1.3. Meteorological Data
The most comprehensive meteorological dataset, including rainfall and temperature records, was collected at the Djibouti International Airport (DIA) station between 1961 and 2014. Within the study area, only rainfall data were available from several stations, including Dikhil City, Assamo, Yoboki, and As Eyla. However, continuous records exist only for the Dikhil station, spanning 55 years from 1938 to 1993, with gaps during the 1942–1946 and 1978–1979 periods.
For the other stations, the rainfall measurements are incomplete and contain significant gaps. The annual rainfall data for the DIA and Dikhil stations are presented in Figure 5, with their statistical summaries provided in Table 2.
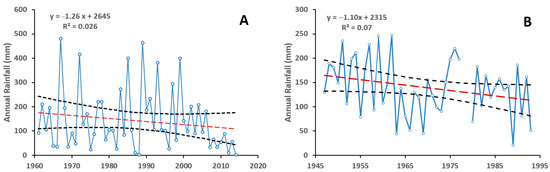
Figure 5.
Annual precipitation at DIA (Djibouti International Airport) (A) and at Dikhil station (B). Red dashed line: fitted linear model. Black dashed lines: 95% regression confidence interval.
Table 2.
Descriptive statistics of the series of annual rainfall values measured at the DIA and Dikhil stations. DIA: Djibouti International Airport, SD: standard deviation, and CV: coefficient of variation.
Both sites experience a pattern of alternating rainy and dry years, a well-known feature of regions with arid to semi-arid climates. These regions are typically marked by significant variability in annual and seasonal rainfall. In such climates, the total annual precipitation can fluctuate greatly from one year to the next, with some years experiencing above-average rainfall and others enduring prolonged droughts [24,25,26]. This variability poses great challenges for water resource management as water availability is unpredictable and often insufficient to meet consistent demands.
The annual averages are of the same order of magnitude as the 2 stations. However, the dispersion of the values is greater for the DIA station than for Dikhil. A linear model was fitted to the annual totals in order to identify a possible overall trend on an annual scale, together with the 95% regression confidence interval (Figure 5). The model clearly shows a downward trend in annual precipitation in both cases, with a negative slope coefficient (a = −1.26 at DIA and a = −1.10 at Dikhil). The coefficient of determination is, however, quite low (R2 = 0.025 at DIA and R2 = 0.069 at Dikhil), showing that the downward trend, even if it exists, does not have a simple linear form. This is confirmed by the 95% confidence interval for the regression. Figure 4 shows that high and low data values occur outside the confidence interval.
As mentioned above, the temperature was only measured at the DIA station. The annual averages of the monthly extreme values are reported in Figure 6. A noticeable overall increase in temperature has been recorded since the early 1960s, with positive linear model coefficients in both cases. The coefficients of determination are also significant (R2 = 0.36 and R2 = 0.56, respectively).
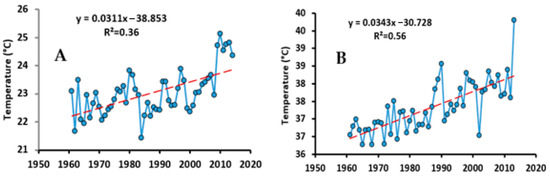
Figure 6.
Annual averages of temperature data measured at the DIA station (Djibouti International Airport). (A) Minimum values. (B) Maximum values. Red dashed line: linear regression.
The evolution of these two parameters highlights the clear impact of climate change in this region. With a marked decline in rainfall (−11 mm per decade) and a rise in temperature (+0.3 °C per decade), a substantial reduction in groundwater recharge is anticipated in the coming years.
2.2. Climate Change Scenario
Climate predictions for precipitation (P) and temperature (T) are generally produced on large scales using global climate models (GCMs). These models integrate key components necessary for simulating the climate system: (i) the atmospheric component, (ii) the oceanic component, and (iii) external forcings, such as greenhouse gases and aerosols. The external forcings are particularly uncertain due to their dependence on human activities. As a result, multiple climate scenarios have been developed based on projected greenhouse gas emissions. The uncertainty associated with these global scenarios is a subject of extensive discussion in the Water Sciences literature [27,28,29].
While global models are effective at representing large-scale climate patterns, they often struggle to capture local weather phenomena. However, localized climate scenarios are critical for socioeconomic stakeholders to evaluate the impacts of climate change on sectors like hydrology and agriculture. To address this, various downscaling methods are employed to refine GCM outputs to a smaller and more precise scale. These localized results are then used for climate change impact assessments.
In this study, climate modeling was conducted in partnership with the IGAD Climate Prediction and Application Center (IGAD-CPAC) located in Nairobi, Kenya. The selected global climate model (GCM) was the MPI-ESM (Max Planck Institute Earth System Model) [30,31], an advanced and widely utilized GCM developed by the Max Planck Institute for Meteorology. The downscaling of global climate scenarios to the scale of the Republic of Djibouti (RoD) was also carried out in collaboration with the IGAD-CPAC.
To simulate future climate conditions, a Representative Concentration Pathway (RCP) scenario is needed. RCPs represent projections of greenhouse gas emissions over time (2000–2100 in this study), based on various assumptions. Each RCP scenario provides a probabilistic estimate of the climate outcomes associated with a specific emission trajectory. In this study, RCP 2.6 was chosen as the working scenario. Among the four Representative Concentration Pathways (RCPs) developed to illustrate a range of potential greenhouse gas emission scenarios (RCP 2.6, RCP 4.5, RCP 6.0, and RCP 8.5), RCP 2.6 is a low-emission scenario characterized by strong mitigation efforts to significantly reduce greenhouse gas emissions. It represents an ambitious pathway, assuming that societies implement stringent measures to curb emissions and address climate change effectively. The selection of RCP 2.6 in this study is aligned with the priorities of the Republic of Djibouti, which emphasizes sustainable development and the promotion of renewable energy initiatives. The simulated rainfall series, based on the RCP 2.6 scenario, is shown in Figure 7, and its statistics are given in Table 3.
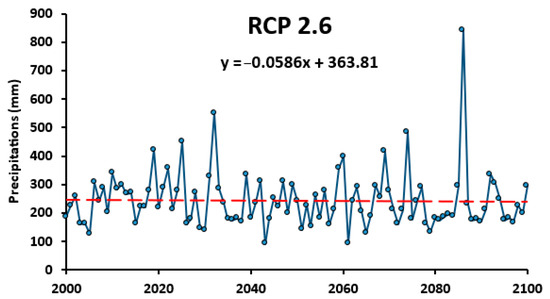
Figure 7.
Predictions of the RCP 2.6 climate scenario at the scale of the Republic of Djibouti. Red dashed line: linear regression.
Table 3.
Annual rainfall statistics predicted by climate scenario RCP 2.6. CI: Confidence interval; SD: standard deviation; and CV: coefficient of variation. Average, minimum, maximum, and SD are in mm.
This climate scenario also depicts a succession of dry and humid years, as in the observed rainfall series in Djibouti. An exceptional rainfall year (P = 820 mm in 2088) was generated in this scenario, while the observed maximum values were 481 mm/year at DIA (1961 to 2014) and 246 mm/year at Dikhil (1938 to 1993). The average rainfall simulated under RCP 2.6 (243 mm/year) was also higher than that observed at DIA (146 mm/year) and Dikhil (136 mm/year).
The trend (linear model) calculated on the predicted results of the RCP 2.6 scenario shows a slight decrease in rainfall. The slope coefficient (a = −0.058) is lower than at the DIA and Dikhil stations.
These results clearly show that scenario 2.6 reflects climate change in Djibouti and the worsening of climatic conditions. Nevertheless, it remains slightly more optimistic than the climate trends currently observed in Djibouti.
2.3. Modeling Approach
This study is based on the EPM (equivalent porous medium) approach, which enables the modeling of complex fractured aquifers, such as karst, volcanic, and crystalline aquifers, as a single equivalent porous medium. This assumption holds when fractures are highly dense and when the study is conducted on a sufficiently large scale. The approach has been successfully applied multiple times [32,33,34]. In this study, the MODFLOW model (version Modflow-2005, [35]) and the user interface Groundwater Vistas version 7 [36] were utilized. MODFLOW is one of the most widely used hydrogeological models for simulating groundwater flow. It employs the finite difference method, discretizing the groundwater domain into three-dimensional rectangular cells. The model computes groundwater flow and water level variations within these cells in response to factors such as water extraction, recharge, domain boundaries, and boundary conditions.
2.4. Model Calibration
Model calibration is a critical step in the modeling process, involving the adjustment of model parameters to accurately represent the known hydrodynamic behavior of the aquifer. Typically, piezometric data are used to evaluate and refine the calibration. In the case of the Dalha basalts aquifer, calibration was performed under steady-state conditions using spatial piezometric data as no time-series data were available for transient-state calibration. The hydrodynamic parameters involved in the groundwater flow equation include hydraulic conductivity (K, m/day) or transmissivity (T, m2/day), along with the storage coefficient (S, dimensionless) for transient flows. For unconfined flows, it is preferable to use hydraulic conductivity (K) to easily account for variations in the saturated thickness of the aquifer.
The calibration process focused on two key parameters: recharge and hydraulic conductivity. Given the scarcity of data, a stepwise procedure, which is well-documented in the literature [37,38,39,40], was implemented. This procedure helps mitigate issues related to parameter correlation and data limitations. Initial recharge values were set based on the existing knowledge of recharge mechanisms in RoD [19,20,21] and were subsequently refined through a trial-and-error approach.
The limited number of available hydraulic conductivity values makes precise spatialization challenging. Consequently, an inverse modeling approach was employed. Given the strong heterogeneity of the basalts, the selected inversion method was the PEST software version 14.0 [41] in conjunction with the pilot points method [42,43,44,45]. PEST employs optimization algorithms to minimize the difference between model simulations and observed data, identifying optimal parameter values. The pilot points method, introduced by De Marsily [42], offers an alternative to the zone-based calibration approach, which often results in unrealistic abrupt parameter changes. It also provides a more flexible and geostatistically robust method for parameter estimation.
Pilot points are discrete locations placed within the model domain, where parameters are explicitly estimated using an inverse modeling technique. These points serve as interpolation nodes, generating a continuous parameter field through kriging or other spatial interpolation methods. The calibrated solution is then validated against an error threshold. If the error exceeds the predefined threshold, the optimization process is repeated until an acceptable solution is achieved. To enhance stability, the method can be combined with regularization techniques [46]. The pilot points method has been effectively used for calibrating numerical models of highly heterogeneous conductivity fields [47,48,49].
2.5. Sustainable Yield Concept
To ensure the safe management of groundwater resources, the exploitation of wellfields must prioritize sustainability at the basin scale. Historically, groundwater management relied on the concept of Safe Yield, introduced in the early 20th century [50]. This approach suggested that groundwater withdrawals were sustainable as long as they did not exceed the annual natural recharge rate. However, the Safe Yield concept oversimplifies the complexities of aquifer dynamics. It fails to consider critical processes within the aquifer during water extraction and neglects groundwater’s essential role in the hydrological cycle. Unregulated abstraction can result in severe consequences, including an excessive depletion of groundwater, negative impacts on groundwater-fed surface water bodies (such as springs and base flows), and the degradation of groundwater-dependent ecosystems (such as wetlands and vegetation).
Over time, the limitations of Safe Yield led to its replacement with the broader concept of Sustainable Yield [51,52,53]. Sustainable Yield considers the long-term behavior of the entire hydrogeological system. It is defined as the volume of water that can be withdrawn annually without causing undesirable effects. This includes avoiding unacceptable declines in hydraulic head and preventing damage to other components of the hydrological cycle within the basin [54,55]. This approach emphasizes reserving a portion of natural recharge to maintain ecological integrity, including the preservation of surface waters and ecosystems [56,57]. Sustainable Yield requires that groundwater withdrawals remain significantly below natural recharge rates to sustain the quantity and quality of streams, springs, wetlands, and groundwater-dependent ecosystems. However, no universal consensus exists regarding the specific percentage of natural recharge that constitutes Sustainable Yield. Estimates suggest this percentage ranges from 30% to 40% on average [58,59], with less conservative approaches extending it up to 70%.
In this context, quantitative groundwater modeling has become an indispensable tool for achieving sustainable water resource management [60,61]. These models offer valuable insights into aquifer dynamics, allowing for the prediction of groundwater behavior under various stress scenarios, such as increased withdrawals, shifts in precipitation patterns, and changes in land use. Such predictive capabilities are critical for developing management strategies that balance human needs with ecological sustainability. Groundwater models help identify vulnerable areas and assess risks associated with over-extraction or contamination, enabling planners to implement effective conservation measures. Additionally, they play a key role in advancing integrated water resource management (IWRM) by incorporating socioeconomic factors into the decision-making process.
However, hydrogeological studies and aquifer modeling often face significant challenges stemming from data scarcity and quality (data accuracy and a lack of long time series). This situation is even more pronounced in data-scarce regions, further compounding these challenges. Despite these limitations, groundwater modeling remains a valuable methodology, providing essential support to address the complexities of groundwater management, even in areas with limited data availability [62,63].
2.6. Optimization Procedure of the Exploitation of the Dalha Aquifer
The optimization of the exploitation of the Dalha aquifer was performed using the calibrated numerical model with the PEST software [41]. The analysis involved the following steps:
- Extracting each section (eastern, central, and western) from the Dalha general model,
- Refining the sub-model,
- Simulating and optimizing pumping scenarios.
The sub-models were derived from the global model and refined progressively, using cell sizes of 1 m × 1 m around each well. This approach ensured that each pumping well was placed within a sufficiently small cell (1 m × 1 m), allowing for a more realistic simulation of drawdowns in the wells.
To analyze extraction scenarios in order to optimize the system’s exploitation, constraints were imposed on pumping rates and drawdowns in wells in the numerical model using the PEST software. The response of the system was then analyzed.
3. Results and Discussion
3.1. Conceptual Model of the Dalha Aquifer
3.1.1. Boundary Conditions and Gridding
The aquifer formed by the Dalha basalts is generally a continuous single-layer system. The intense fracturing of the basalts creates strong interconnectivity within the medium at the system scale. The groundwater in this system is unconfined, as illustrated by the hydrogeological cross-section in Figure 3. The top of the Dalha basalts aquifer corresponds to the topographic surface. To determine this, the ASTER DEM with a resolution of 90 m × 90 m was utilized. An average aquifer thickness of 200 m relative to the ground surface was established based on well depths.
The boundary conditions (BCs) are shown in Figure 8. The model domain (Dalha basalts) is limited:
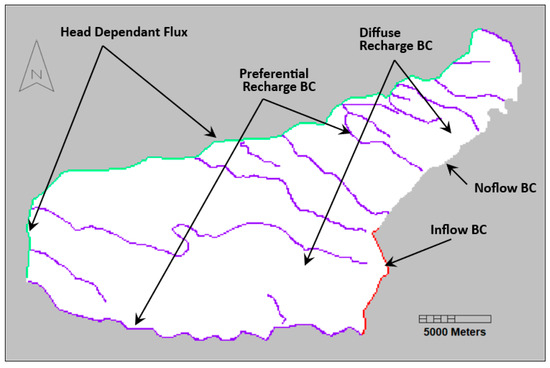
Figure 8.
Boundary conditions of the numerical model of the Dalha basalts aquifer.
- to the northeast by the Hambocto wadi,
- to the southeast by the Mabla rhyolites on which the Dalha basalts rest in discordance,
- to the south and southwest by the Dabadère wadi,
- to the north by the alluvial fans of the Grand Bara,
- and to the northwest by the stratoid basalts (see geological map of the study area, Figure 2).
The boundary conditions were defined based on the hydrogeological conditions of the flow domain (Figure 8). Thus, (i) the wadis were considered as places of preferential recharge of the aquifer, (ii) the contact with the Mabla rhyolites is a no-flow BC, (iii) the contact with the stratoid basalts and the sedimentary formations is represented by a mixed BC (Head Dependant Flux), and (iv) an inflow BC was set up on the SE border.
The dimensions of the study area are 26 km × 38 km. This area was discretized into uniform cells of 100 m × 100 m. The cells were then refined into subareas of the wellfields down to 5 m × 5 m, following the rule of thumb of a maximum ratio of 50% of adjacent cell sizes. Wells were introduced into the model using the Analytic Element procedure of the Groundwater Vistas version 7 software [36] used in this study. The active cells represented aquifer number 75135. This discretization was considered sufficient given the objectives of this study.
3.1.2. Recharge and Evaporation
In the basaltic systems of the RoD, the arid climate and the episodic flows of wadis during major rainfall events, such as storms or heavy downpours, give rise to two primary recharge mechanisms [19,20,21]:
- Diffuse Recharge. This occurs through the outcrop surface of the basalts. However, the surface of the Dalha basalts at outcrop locations is often significantly altered and, in some cases, argillized. These conditions severely limit the potential for substantial diffuse infiltration.
- Preferential Recharge. This occurs via the sedimentary formations in the wadi valleys. These formations contain alluvial interflow layers, which facilitate infiltration during wadi flow episodes. These sedimentary aquifers act as transfer zones, supplying water to the underlying basaltic aquifer through faults [16]. This recharge mechanism is the dominant process for basaltic aquifers. The volume of water infiltrated through these interflow aquifers constitutes the primary recharge source for the Dalha basalts aquifer.
Evaporation has not been specifically studied in the Republic of Djibouti. For this work, a uniform evaporation rate was applied across the entire surface of the Dalha aquifer. The value used was derived from literature sources [64,65,66]. The evaporation rate used was 15 mm/day. Due to the very high temperature prevailing in the area, the depth of evaporation extinction was set to 2 m based on results from experiments conducted in arid areas [67,68].
3.2. Simulation of Climate Change Impact up to 2100 Under RCP 2.6 Scenario
3.2.1. Dalha Model Calibration
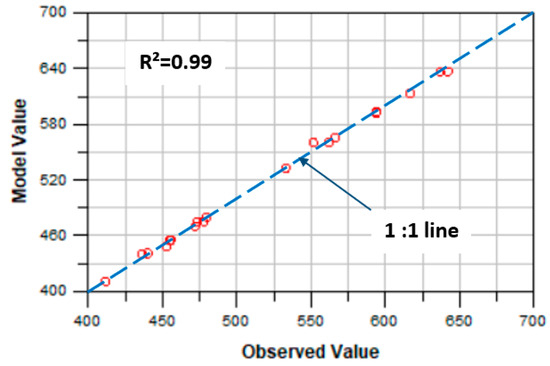
Figure 9.
Comparison of observed head values vs. simulated head values.
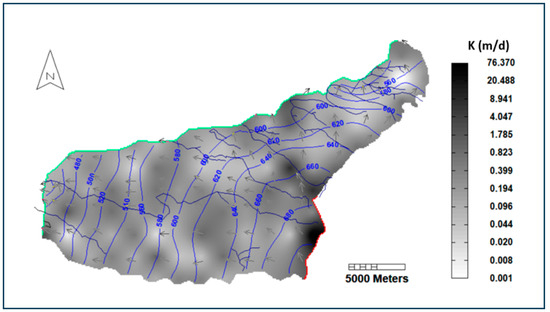
Figure 10.
Simulated piezometry and spatial distribution of hydraulic conductivity (K, m/d) of the aquifer obtained following model calibration.
Figure 9 demonstrates that the model calibration is relatively accurate, effectively simulating both the low and high values of the aquifer’s observed piezometry. The coefficient of determination (R2) is 0.99 and the Root Mean Square Error (RMSE) is 1.9 m. The hydraulic conductivity field derived from this calibration is presented in Figure 10. The values span five orders of magnitude, emphasizing the significant heterogeneity of the aquifer.
The piezometry simulated by the model, taking into account the pumpings, accurately represents the observed general flow pattern of the groundwater, with hydraulic gradients properly maintained. The inflow from the southeastern edge is clearly depicted on the map. The piezometric map shown in Figure 10 represents the aquifer’s average state. The water balance of the whole model is given in Table 4.
Table 4.
Water balance of the Dalha basalts aquifer simulated by the model.
The water balance indicates that the total flow within the aquifer is approximately 7.76 Mm3/year. Recharge accounts for 3.97 Mm3/year, comprising diffuse recharge (65,000 m3/year) and preferential recharge (3.91 Mm3/year). Notably, diffuse recharge constitutes only 1.6% of the total recharge and remains negligible. Evaporation losses from the water table are substantially reduced and amount to 0.11 mm3/year. This is related to the depth of the water table from the soil. After accounting for evaporation losses, effective infiltration amounts to 3.86 Mm3/year.
Based on data from the rainfall station at Dikhil, the average annual rainfall for the 1980s–1990s is estimated at 136 mm/year. This corresponds to an annual precipitation volume of 163 Mm3/year over the aquifer. The effective infiltration-to-raw rainfall ratio is 2.4%, aligning with previous assessments [19,20,21]. Additionally, significant contributions are observed from the southeastern upstream boundary, estimated at 2.6 Mm3/year.
The significant pumpings in the western part of the aquifer (Dikhil wellfield and Db2 well) cause a significant drawdown of the water table (simulated drawdowns between 37 m and 59 m, Table 1). On the Dadin wellfield, the drawdowns are moderate (1 m < DD < 7 m) with the current discharges. (Figure 11). Almost the entire western half of the aquifer is impacted by the pumpings at the Dikhil wellfield and the DB2 well.
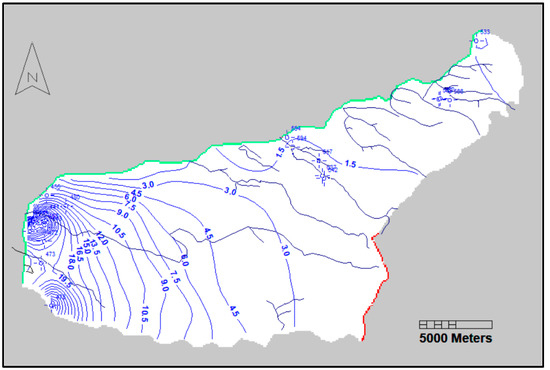
Figure 11.
Simulated drawdowns in the Dalha aquifer. See the Boundary Conditions in Fugure 8.
The total pumping volume across all wellfields simulated in the model is 2.34 Mm3/year, accounting for 60% of the aquifer’s average annual net recharge of 3.86 Mm3/year. The extracted volume is significant compared to the aquifer’s natural recharge, raising legitimate concerns about the sustainability of its exploitation.
For the Dalha basalts aquifer, current exploitation practices fall short of meeting the sustainable management criteria recommended in hydrogeology. The situation appears to be approaching overexploitation, raising serious concerns about the long-term viability of the aquifer. Nonetheless, the effective management of limited groundwater resources, especially in arid regions, is essential for meeting increasing demand while preventing depletion, which can lead to severe environmental and socioeconomic consequences [69,70,71].
3.2.2. Optimization of the Exploitation of the Dalha Aquifer Using the Numerical Model
To ensure the sustainability of this system, the following imperatives and constraints must be considered:
- The water supply for the regional capital, Dikhil, must remain secure.
- The significant drawdowns that are currently observed, caused by the discharge rates of the Dikhil wellfield and Db2 wells, need to be reduced.
- Areas where discharge rates could be increased need to be identified.
- It must be ensured that total extraction does not exceed a substantial portion of the aquifer’s average recharge, aligning with the concept of Sustainable Yield. This requires a balanced approach, reconciling the growing water demands driven by regional socioeconomic development with essential environmental considerations.
A global constraint in the wellfield optimization procedure was established in agreement with end-users (ONEAD, Office National de l’Eau et de l’Assainissement de Djibouti—National Office of Water and Sanitation of Djibouti), ensuring a reasonable compromise by maintaining the ratio of total exploitation to the basin’s recharge at around 50%. The technical constraint in this process involved limiting drawdowns at each well to a fixed value to prevent excessive groundwater depletion.
The optimization was performed using the procedure highlighted above. In the first scenario, all the available wells were used, and the following identical constraints were applied to each one:
- Maximum drawdown at each well: 20 m,
- Maximum pumping rate at each well: 1000 m3/d.
The results of the first scenario are reported in Table 5.
Table 5.
Optimized discharges of the wells exploiting the Dalha aquifer under the following constraints: (1) maximum drawdown of 20 m and (2) maximum abstraction rate of 1000 m3/d at each well.
This first scenario demonstrates that in the western part of the wellfield, the constraints introduced in well exploitation allow the overall extraction rate to be maintained while significantly reducing the environmental impact of pumping. Notably, the piezometric depression is substantially reduced.
However, at the aquifer scale, this scenario remains suboptimal. The total exploitation-to-recharge ratio stands at 79%, a value very high and far beyond the limits of the Sustainable Yield concept. Given the strong demand from end-users to maintain pumpings at the Dikhil wellfield, alternative scenarios were explored by imposing stricter constraints on the central and eastern well groups. This approach aimed to achieve a more acceptable total abstraction-to-recharge ratio.
The optimal scenario is presented in Table 6. This scenario involves a total aquifer extraction of 2.17 Mm3/year, representing 56% of the aquifer’s recharge. While this exceeds the target of limiting exploitation to 50% of the average recharge, the pressing water needs for regional development necessitate its adoption. Nevertheless, it is important to note that this scenario still improves the environmental impact of groundwater extraction.
Table 6.
Optimized discharges of the central and eastern wells exploiting the Dalha aquifer under the following constraints: (1) maximum drawdown of 10 m and (2) maximum abstraction rate of 500 m3/d at each well.
As noted, the Dalha basalts aquifer is hydraulically connected to the Grand Bara plain and the Dikhil basin sedimentary formations, as well as the stratoid basalts. The final optimized scenario (Table 6) will reduce abstractions and drawdowns in the Dalha aquifer, thus positively impacting groundwater flow to these downstream systems.
3.3. Transient Modeling and Climate Change Impact Analysis over the 2001–2100 Period
3.3.1. Preliminary Considerations
The initial piezometry used in transient modeling corresponds to the steady-state piezometry simulated by the model when no wells are operating in the aquifer. According to ONEAD, the region’s water demand could potentially double by 2100. However, the first key question remains whether the current exploitation of this aquifer can be sustained under future climate change conditions. Any increase in groundwater abstraction can only be considered at a later stage, depending on the response to this fundamental concern. The following approach was adopted in agreement with the end-users (ONEAD). It was first investigated whether the above-optimized pumping rate (Qtotal optimized = 2.17 Mm3/year) could be maintained within the framework of the impact of climate change. Any increase in discharge could then only be considered on the basis of previous results.
3.3.2. Recharge and Boundary Conditions of the Transient Model
The RCP 2.6 scenario was used for transient modeling up to 2100, as outlined previously. Recharge values introduced into the model for the simulation period (2001–2100) were adjusted based on the rainfall projections of the RCP 2.6 scenario.
The downstream boundary of the model, where the aquifer meets sedimentary formations and the stratoid basalts, was treated as a permanent condition. This boundary is represented by a mixed condition (General Head Boundary) linked to the regional flow gradient, which is a reasonable assumption for a stable regional gradient. The upstream inflow boundary at the southeastern edge of the model was adjusted in line with the RCP 2.6 scenario projections.
3.3.3. Predicted Results and Discussions on the Impact of Climate Change
The simulation was conducted at an annual time step, from 2001 to 2100. To monitor the evolution of the aquifer piezometry, the following wells, distributed in three parts, were recorded: DBol1, Dad6, Dik2, and Dbd2. The simulation was carried out with the wells operating according to the optimized scenario since the primary objective is to analyze the capacity of the aquifer to be able to provide this level of exploitation while taking into account climate change. The simulated trends are presented in Figure 12.
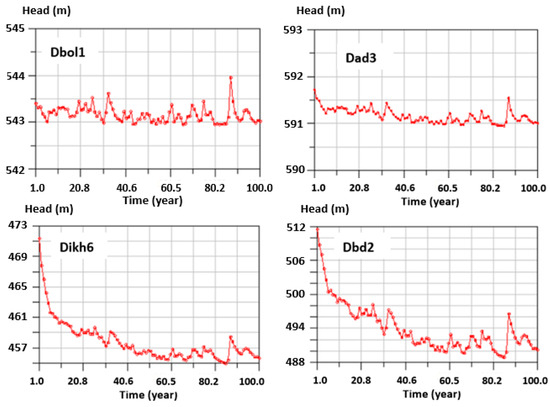
Figure 12.
Simulated piezometric evolutions on selected wells.
The following observations can be made:
- In the early years, a piezometric decline is observed over several consecutive years in the central and western regions, whereas the eastern region does not show this characteristic. The magnitude of this decline is relatively small (in the order of meters) in the central region. However, in the western region, it is significantly more pronounced, reaching up to ten meters. These variations in amplitude are attributed to differences in pumping rates, the hydraulic properties of the aquifer at various well locations, and the relatively low precipitation levels projected under the RCP 2.6 scenario during these initial years.
- The overall piezometric trend then shifts downward, with a slight decrease in the central and eastern regions but a much steeper decline in the west. Toward the later years, however, the trend stabilizes around an average value.
- The impact of heavy rainfall events (>400 mm) simulated under the RCP 2.6 scenario is clearly reflected in the data. However, it is notable that the aquifer depletes rapidly when followed by a dry year. The prolonged drought period from 2079 to 2085 is also distinctly evident in the records.
These results indicate that the aquifer is not capable of sustaining increased resource exploitation. Scenario 2 presents a viable alternative, ensuring continued aquifer use under environmentally sustainable conditions within the framework of projected climate change impacts by 2100.
4. Conclusions
This study focused on the Dalha basalts aquifer, located in the southwest of the Republic of Djibouti, within a highly arid climatic context. The primary objectives were to develop a numerical model of the aquifer to estimate its resources and assess the impact of climate change on its sustainability. This aquifer is a crucial water source for the Dikhil region, particularly for the regional capital, Dikhil, and for supporting economic activities.
A coherent conceptual framework and a numerical model of the system were developed based on the available data. Model calibration provided insights into the general hydrodynamic functioning and boundary conditions of the system. Effective recharge was estimated at 3.86 Mm3/year, representing 2.4% of average annual precipitation. The results indicated that the aquifer is currently overexploited, with 60% of the recharge being withdrawn. This overuse has led to a significant piezometric decline across the western part of the system, far from conditions of sustainable exploitation based on the Sustainable Yield concept.
To evaluate potential management strategies, various operating scenarios were analyzed, incorporating constraints on wells’ pumping rates and water table drawdowns. An optimal scenario was identified, reducing water table drawdowns while ensuring water supply to Dikhil city. This scenario proposed a total extraction of 2.17 Mm3/year, equivalent to 56% of the total recharge. While it is not a perfect solution, it offers a balance between reducing environmental impacts and maintaining water supply. However, given the high extraction/recharge ratio, any further increase in withdrawals is not feasible.
To assess the long-term sustainability of the aquifer, the RCP 2.6 climate scenario was applied as it aligns with national policy guidelines. The simulation, from 2001 to 2100, indicated a slight decline in rainfall, with alternating wet and dry years—consistent with typical arid-zone climate variability. Under these conditions, the aquifer model, including a total pumping of 2.17 Mm3/year, predicts a gradual decline in groundwater levels. However, the optimized exploitation strategy proposed in this study remains viable, provided that continuous monitoring is implemented. These findings confirm that the aquifer has reached its maximum sustainable exploitation level. To ensure long-term sustainability, water use must be carefully managed through the continuous monitoring of water levels and quality.
As previously mentioned, among the four climate scenarios, RCP 2.6. is the most favorable with regard to greenhouse gas reduction efforts, and therefore, the results of this study are likely to underestimate the impacts of climate change if future gas emissions exceed those associated with RCP2.6., as predicted in the context of the other RCPs (RCP 4.5, RCP 6.0, and RCP 8.5).
In developing the model, several simplifications and assumptions were made regarding its design. They stem from both a lack of data and the variable quality of the available data, challenges that are frequently encountered in developing countries [72,73,74]. For the Dalha aquifer, a significant limitation is the scarcity of piezometric measurements and their uneven distribution across the aquifer, with most data concentrated in the catchment areas.
The findings of this study highlight the critical situation of the Dalha basalts aquifer under current and future conditions. Based on numerical modeling, climate change impacts, and Sustainable Yield assessments, the following actions are recommended to enhance groundwater management and long-term water security in the Dikhil region:
- Real-Time Groundwater Monitoring: (i) Install automated sensors to track water levels and quality, focusing on overexploited areas like the Dikhil wellfield, and (ii) enable real-time data collection for early warnings on overuse.
- Enhanced Aquifer Characterization: (i) Conduct geophysical surveys to refine aquifer geometry and heterogeneity [75,76,77], (ii) expand hydrogeological tests for better model accuracy, and (iii) measure wadi flows and infiltration to improve recharge estimates.
- Artificial and Managed Aquifer Recharge (MAR): (i) Assess the feasibility of recharge during wet periods and (ii) identify optimal MAR zones to enhance aquifer resilience.
- Alternative Water Sources and Water Demand Management: (i) Explore rainwater harvesting and wastewater reuse to ease reliance on the aquifer and (ii) promote water-saving practices in agriculture, which is a major consumer.
- Capacity Building and Stakeholder Engagement: (i) Train local water authorities (e.g., ONEAD) in model operation and monitoring and (ii) encourage community participation in groundwater conservation.
- Regular Model Updates: (i) Continuously update the model with new data to refine forecasts and (ii) simulate additional climate scenarios (e.g., RCP 4.5 and RCP 8.5) for better preparedness.
This study underscores the critical importance of understanding climate change impacts on groundwater resources, particularly in arid regions. While uncertainties remain due to the limitations of climate models, the integration of climate projections with numerical aquifer modeling provides valuable insights into the future behavior of hydrogeological systems. This approach is essential for anticipating challenges and planning effective water resource management strategies, ensuring the sustainability of vital groundwater reserves.
The development of a comprehensive groundwater management plan is also recommended, including (i) the formulation and implementation of an integrated groundwater management strategy that balances water extraction with recharge rates and (ii) legal and institutional frameworks to regulate groundwater abstraction and enforce sustainable pumping limits.
Author Contributions
Conceptualization, M.R., M.J., and B.B.; methodology, M.R., M.J., and B.B.; software, M.R.; validation, M.R.; formal analysis, M.R.; investigation, M.R., M.J., and B.B.; resources, M.R., M.J., and B.B.; data curation, M.R., M.J., and B.B.; writing—review and editing, M.R.; visualization, M.R.; supervision, M.R.; project administration, M.R. and M.J.; funding acquisition, M.R. and M.J. All authors have read and agreed to the published version of the manuscript.
Funding
This research was funded by the Ministère de l’Habitat, de l’Urbanisme et de l’Environnement of the Republic of Djibouti.
Data Availability Statement
The data supporting this study are available on request from the corresponding author.
Acknowledgments
The authors would like to thank the IGAD-CPAC (Intergovernmental Authority on Development—Climate Prediction and Application Center) in Nairobi for their collaboration. They also thank the ANMD (Agence Nationale de la Météorologie de Djibouti) for providing meteorological data. The authors also acknowledge the comments of the two anonymous reviewers, which helped to improve the manuscript.
Conflicts of Interest
Moumtaz Razack was employed by the company Razack Groundwater Consulting (RGC). The remaining authors declare that the research was conducted in the absence of any commercial or financial relationships that could be construed as a potential conflict of interest.
Abbreviations
The following abbreviations are used in this manuscript:
| RoD | Republic of Djibouti |
| ONEAD | Office National de l’Eau et de l’Assainissement de Djibouti |
| RCP | Representative Concentration Pathway |
| IPCC | Intergovernmental Panel on Climate Change |
| DIA | Djibouti International Airport |
| IGAD-CPAC | Climate Prediction and Application Center |
| GCM | Global Climate Model |
References
- Mukherjee, A.; Saha, D.; Harvey, C.F.; Taylor, R.G.; Ahmed, K.M.; Bhanja, S.N. Groundwater systems of the Indian sub-continent. J. Hydrol. Reg. Stud. 2015, 4, 1–14. [Google Scholar]
- Watto, M.A.; Mugera, A.W. Econometric estimation of groundwater irrigation efficiency of cotton cultivation farms in Pakistan. J. Hydrol. Reg. Stud. 2015, 4, 193–211. [Google Scholar]
- Jalludin, M. Groundwater ressources and challenges of future water supply of the Republic of Djibouti under arid climate (Horn of Africa). In Aquifer Systems Management; CRC Press: Dijon, France, 2006. [Google Scholar]
- Steyl, G.; Dennis, I. Review of coastal-area aquifers in Africa. Hydrogeol. J. 2010, 18, 217–225. [Google Scholar]
- Walraevens, K.; Mjemah, I.C.; Mtoni, Y.; Van Camp, M. Sources of salinity and urban pollution in the Quaternary sand aquifers of Dar es Salaam, Tanzania. J. Afr. Earth Sci. 2015, 102, 149–165. [Google Scholar] [CrossRef]
- Golian, M.; Saffarzadeh, A.; Katibeh, H.; Mahdad, M.; Saadat, H.; Khazaei, M.; Sametzadeh, E.; Ahmadi, A.; Sharifi Teshnizi, E.; Samadi Darafshani, M.; et al. Consequences of groundwater overexploitation on land subsidence in Fars Province of Iran and its mitigation management programme. Water Environ. J. 2021, 35, 975–985. [Google Scholar] [CrossRef]
- Taucare, M.; Viguier, B.; Figueroa, R.; Daniele, L. The alarming state of Central Chile's groundwater resources: A paradigmatic case of a lasting overexploitation. Sci. Total Environ. 2024, 906, 167723. [Google Scholar] [CrossRef]
- Schuch, C.S.; Galvão, P.; de Melo, M.C.; Pereira, S. Overexploitation assessment in an urban karst aquifer: The case of Sete Lagoas (MG), Brazil. Environ. Res. 2023, 236 Pt 2, 116820. [Google Scholar] [CrossRef]
- Hinkel, J.; Brown, S.; Exner, L.; Nicholls, R.J.; Vafeidis, A.T.; Kebede, A.S. Sea-level rise impacts on Africa and the effects of mitigation andadaptation: An application of DIVA. Reg. Environ. Chang. 2012, 12, 207–224. [Google Scholar]
- Du, X.; Lu, X.; Hou, J.; Ye, X. Improving the Reliability of Numerical Groundwater Modeling in a Data-Sparse Region. Water 2018, 10, 289. [Google Scholar] [CrossRef]
- Razack, M.; Furi, W.; Fanta, F.; Shiferaw, A. Water Resource Assessment of a Complex Volcanic System Under Semi-Arid Climate Using Numerical Modeling: The Borena Basin in Southern Ethiopia. Water 2020, 12, 276. [Google Scholar] [CrossRef]
- Worldometer. Available online: www.worldometers.info/world-population/djibouti-population/ (accessed on 14 March 2025).
- Theodora. Available online: https://theodora.com/ (accessed on 14 March 2025).
- Aboubaker, M.; Jalludin, M.; Razack, M. Hydrochemistry of a complex volcano-sedimentary aquifer using major ions and environmental isotopes data: Dalha basalts aquifer, southwest of Republic of Djibouti. Environ. Earth Sci. 2013, 70, 3335–3349. [Google Scholar] [CrossRef]
- Demange, J.; Stieljes, L. Géologie de la région sud-ouest du TFAI (région Lac-Abhé-Lac Asal). Geology of the southwestern TFAI (Region of Lake Asal-Lake ABHE). Bull. BRGM 1975, 2, 83–114. (In French) [Google Scholar]
- Varet, J.; Gasse, F. Carte géologique de l'Afar central et méridional. Ethiopie et République de Djibouti; CNRS: Paris, France, 1978. [Google Scholar]
- Jalludin, M.; Anis, A.; Idriss, G.; Mohamed, I.; San Juan, B.; Gaulier, J.M.; Zotskina, E.; Gaffaneh, A.; Haga, A. Alimentation en eau potable de la ville d'Ali Sabieh. Etude hydrogéologique des basaltes de Dalha. Sci. Tech. 1990, 5, 13–21. [Google Scholar]
- Arthaud, F.; Choukroune, P.; Robineau, B. Tectonique, microtectonique et +volution structurale du golfe de Tadjourah et du sud de la D+pression Afar (R~publique de Djibouti). Bull. Soc. Géol. Fr. 1980, XXII, 909–915. [Google Scholar] [CrossRef]
- Jalludin, M. Geometric and Hydrodynamic Properties of Aquifers in Fissured Volcanic Environments Under Arid Climate. Republic of Djibouti. Ph.D. Thesis, University of Poitiers, Poitiers, France, 1993; 250p. (In French). [Google Scholar]
- BGR (Bundesanstalt für Geowissenschaften und Rohstoffe, Hanover, Germany). Inventaire et Mise en Valeur des Ressources en eau de la République de Djibouti. (Inventory and Evaluation of the Water Resources of the Republic of Djibouti). Unpublished work, 1982. [Google Scholar]
- Gamal-Eldin, H.A. Etude de l’aquifère Basaltique de la Zone de Captage de la Ville de Djibouti. République de Djibouti. Ph.D. Thesis, University Albert-Ludwig, Fribourg, Germany, 1988. [Google Scholar]
- Jalludin, M.; Razack, M. Analysis of pumping tests in fractured Dalha and stratiform basalts with regards to tectonics, hydrothermalisms and weathering. Republic of Djibouti. J. Hydrol. 1994, 155, 237–250. [Google Scholar] [CrossRef]
- Jalludin, M.; Razack, M. Assessment of hydraulic properties of sedimentary and volcanic aquifer systems under arid conditions in the Republic of Djibouti (Horn of Africa). Hydrogeol. J. 2004, 12, 159–170. [Google Scholar] [CrossRef]
- Yan, X.; Cheng, P.; Zhang, Q.; Li, X.; He, J.; Yan, X.; Zhao, W.; Wang, L. Comparisons of climate change characteristics in typical arid regions of the Northern Hemisphere. Front. Environ. Sci. 2022, 10, 1033326. [Google Scholar] [CrossRef]
- Allan, R.P.; Douville, H. An even drier future for the arid lands. Proc. Natl. Acad. Sci. USA 2023, 121, e2320840121. [Google Scholar] [CrossRef]
- Xu, L.; Zheng, C.; Ma, Y. Variations in precipitation extremes in the arid and semi-arid regions of China. Int. J. Climatol. 2020, 41, 1542–1554. [Google Scholar] [CrossRef]
- Giorgi, F.; Francisco, R. Evaluating uncertainties in the prediction of regional climate change. Geophys. Lett. 2000, 27, 1295–1298. [Google Scholar]
- Aggarwal, P.K.; Mall, R.K. Climate Change and Rice Yields in Diverse Agro-Environments of India. Effect of Uncertainties in Scenarios and Crop Models on Impact Assessment. Clim. Chang. 2002, 52, 331–343. [Google Scholar]
- Velázquez, J.A.; Schmid, J.; Ricard, S.; Muerth, M.; St-Denis, B.G.; Minville, M.; Chaumont, D.; Caya, D.; Ludwig, R.; Turcotte, R. An ensemble approach to assess hydrological models’ contribution to uncertainties in the analysis of climate change impact on water resources. Hydrol. Earth Sci. 2013, 17, 565–578. [Google Scholar]
- Mauritsen, T.; Bader, J.; Becker, T.; Behrens, J.; Bittner, M.; Brokopf, R.; Brovkin, V.; Claussen, M.; Crueger, T.; Esch, M. Developments in the MPI-M Earth System Model version 1.2 (MPI-ESM1.2) and Its Response to Increasing CO2 Concentrations. J. Adv. Model. Earth Syst. 2019, 11, 998–1038. [Google Scholar] [CrossRef] [PubMed]
- Marsland, S.J.; Haak, H.; Jungclaus, J.H.; Latif, M.; Röske, F. The Max Planck Institute global ocean/sea ice model with orthogonal curvilinear coordinates. Ocean Model. 2003, 5, 91–127. [Google Scholar] [CrossRef]
- Scanlon, B.R.; Mace, R.E.; Barrett, M.E.; Smith, B. Can we simulate regional groundwater flow in a karst system using equivalent porous media models? Case study, Barton Springs Edwards aquifer, USA. J. Hydrol. 2003, 276, 137–158. [Google Scholar] [CrossRef]
- Abusaada, M.; Sauter, M. Studying the flow dynamics of a karst aquifer system with an equivalent porous medium model. Ground Water 2013, 51, 641–650. [Google Scholar] [CrossRef]
- Fiorese, G.D.; Balacco, G.; Bruno, G.; Nikolaidis, N. Hydrogeological modelling of a coastal karst aquifer using an integrated SWAT-MODFLOW approach. Environ. Model. Softw. 2025, 183, 106249. [Google Scholar] [CrossRef]
- Harbaugh, A.W. MODFLOW-2005: The U.S. Geological Survey Modular Ground-Water Model—The Ground-Water Flow Process; U.S. Geological Survey Techniques and Methods 6–A16; USGS: Reston, VA, USA, 2005. [Google Scholar]
- Rumbaugh, J.O.; Rumbaugh, D.B. Guide to Using Groundwater Vistas (V7); Environmental Simulations, Inc.: Leesport, PA, USA, 2017; 495p. [Google Scholar]
- Hill, M.C. Methods and Guidelines for Effective Model Calibration; U.S. Geological Survey Water-Resources Investigations Report 98-4005; USGS: Denver, CO, USA, 1998; 91p. [Google Scholar]
- Knowling, M.J.; Werner, A.D. Estimability of recharge through groundwater model calibration: Insights from a field-scale steady-state example. J. Hydrol. 2016, 540, 973–987. [Google Scholar] [CrossRef]
- Hendricks Franssen, H.-J.; Stauffer, F.; Kinzelbach, W. Joint estimation of transmissivities and recharges–application: Stochastic characterization of well capture zones. J. Hydrol. 2004, 294, 87–102. [Google Scholar] [CrossRef]
- Ehtiat, M.; Mousavi, S.J.; Vaghefi, S.A.; Ghaheri, A. Analysis of recharge conceptualization in inverse groundwater modeling. Hydrol. Sci. J. 2016, 61, 2789–2801. [Google Scholar] [CrossRef]
- Doherty, J. Calibration and Uncertainty Analysis for Complex Environmental Models. In PEST Complete Theory; Watermark Numerical Computing: Brisbane, Australia, 2015; ISBN 978-0-9943786-0-6. [Google Scholar]
- De Marsily, G. De l’Identification des Systèmes Hydrogéologiques. (On the Calibration of Hydrogeologic Systems). State Thesis, University of Paris 6, Paris, France, 1978; 201p. (In French). [Google Scholar]
- Certes, C.; de Marsily, G. Application of the pilot points method to the identification of aquifer transmissivity. Adv. Water Resour. 1991, 14, 284–300. [Google Scholar] [CrossRef]
- Lavenue, M.; de Marsily, G. Three-dimensional interference test interpretation in a fractured aquifer using the pilot-point inverse method. Water Resour. Res. 2001, 37, 2659–2675. [Google Scholar]
- Razack, M. Tackling Heterogeneity in Groundwater Numerical Modeling: A Comparison of Linear and Inverse Geostatitical Approaches. Example of a Volcanic Aquifer in the East African Rift. In Groundwater: Assessment, Modelling and Management; Thangarajan, M., Vijay, P.S., Eds.; CRC Press: Boca Raton, FL, USA; Taylor & Francis Group: Abingdon, UK, 2016; Section III, Chapter 14; pp. 213–227. [Google Scholar] [CrossRef]
- Doherty, J. Ground Water Model Calibration Using Pilot Points and Regularization. Ground Water 2003, 41, 170–177. [Google Scholar] [CrossRef] [PubMed]
- Kevin Hayley, J.; Schumacher, G.; MacMillan, J.; Boutin, L.C. Highly parameterized model calibration with cloud computing: An example of regional flow model calibration in northeast Alberta, Canada. Hydrogeol. J. 2014, 22, 729–737. [Google Scholar] [CrossRef]
- Jardani, A.; Dupont, J.P.; Revil, A.; Massei, N.; Fournier, M.; Laignel, B. Geostatistical inverse modeling of the transmissivity field of a heterogeneous alluvial aquifer under tidal influence. J. Hydrol. 2012, 472–473, 287–300. [Google Scholar] [CrossRef]
- Husam Musa Baalousha, H.M.; Fahs, M.; Ramasomanana, F.; Younes, A. Effect of Pilot-Points Location on Model Calibration: Application to the Northern Karst Aquifer of Qatar. Water 2019, 11, 679. [Google Scholar] [CrossRef]
- Lee, C.H. The determination of safe yield of underground reservoirs of the closed basin type. Trans. Am. Soc. Civil Eng. 1915, 78, 148–151. [Google Scholar]
- Todd, D.K. Ground Water Hydrology; John Wiley and Sons: New York, NY, USA, 1959; p. 336. [Google Scholar]
- Freeze, R.A.; Cherry, J.A. Groundwater; Prentice-Hall: London, UK, 1979; p. 604. [Google Scholar]
- Domenico, P. Concepts and Models in Groundwater Hydrology; McGraw-Hill: New York, NY, USA, 1972; p. 405. [Google Scholar]
- Sophocleous, M. From safe yield to sustainable development of water resources—The Kansas experience. J. Hydrol. 2000, 235, 27–43. [Google Scholar] [CrossRef]
- Alley, W.M.; Leake, S.A. The Journey from Safe Yield to Sustainability. Ground Water 2004, 42, 12–16. [Google Scholar] [CrossRef]
- Maimone, M. Defining and managing sustainable yield. Ground Water 2004, 42, 809–814. [Google Scholar] [CrossRef]
- Seward, P.; Xu, Y.; Brendock, L. Sustainable groundwater use, the capture principle, and adaptive management. Water SA 2006, 32, 473–482. [Google Scholar] [CrossRef][Green Version]
- Hahn, J.Y.; Lee, N.; Kim Hahn, C.; Lee, S. The groundwater resources and sustainable yield of Cheju volcanic island, Korea. Environ. Geol. 1997, 33, 43–52. [Google Scholar]
- Miles, J.C.; Chambet, P.D. Safe yield of aquifers. J. Water Resour. Plan. Manag. 1995, 121, 1–8. [Google Scholar] [CrossRef]
- Condon, L.E.; Kollet, S.; Bierkens, M.F.P.; Fogg, G.E.; Maxwell, R.M.; Hill, M.C. Global groundwater modeling and monitoring: Opportunities and challenges. Water Resour. Res. 2021, 57, e2020WR029500. [Google Scholar] [CrossRef]
- Secci, D.; Saysel, A.K.; Uygur, I.; Yoloğlu, O.C.; Zanini, A.; Copty, N.K. Modeling for sustainable groundwater management: Interdependence and potential complementarity of process-based, data-driven and system dynamics approaches. Sci. Total Environ. 2024, 951, 175491. [Google Scholar] [CrossRef] [PubMed]
- Rödiger, T.; Geyer, S.; Odeh, T.; Siebert, C. Data scarce modelling the impact of present and future groundwater development on Jordan multiaquifer groundwater resources. Sci. Total Environ. 2023, 870, 161729. [Google Scholar] [CrossRef] [PubMed]
- Gonçalvès, J.; Nutz, A.; Séraphin, P.; Chekireb, A.; Kabiri, L.; Deschamps, P. Dealing with hydrologic data scarcity: The case of the Tindouf basin. Comptes Rendus Géosci. 2023, 355, 281–300. [Google Scholar]
- Chakroun, H.; Zemni, N.; Benhmid, A.; Dellaly, V.; Slama, F.; Bouksila, F.; Berndtsson, R. Evapotranspiration in Semi-Arid Climate: Remote Sensing vs. Soil Water Simulation. Sensors 2023, 23, 2823. [Google Scholar] [CrossRef]
- Lehmann, P.; Berli, M.; Koonce, J.E.; Or, D. Surface evaporation in arid regions: Insights from lysimeter decadal record and global application of a surface evaporation capacitor (SEC) model. Geophys. Res. Lett. 2019, 46, 9648–9657. [Google Scholar] [CrossRef]
- Wythers, K.R.; Lauenroth, W.K.; Paruelo, J.M. Bare-soil evaporation under semi-arid field conditions. Soil Sci. Soc. Am. J. 1999, 63, 1341–1349. [Google Scholar] [CrossRef]
- Mughal, I.; Jadoon, K.Z.; Mai, M.P.; Al-Mashharawi, S.; Missimer, T.M. Experimental Measurement of Diffusive Extinction Depth and Soil Moisture Gradients in a Dune Sand Aquifer in Western Saudi Arabia: Assessment of Evaporation Loss for Design of an MAR System. Water 2015, 7, 6967–6982. [Google Scholar] [CrossRef]
- Shah, N.; Nachabe, M.; Ross, M. Extinction depth and evapotranspiration from ground water under selected land covers. Ground Water 2007, 45, 329–338. [Google Scholar]
- Drias, T.; Khedidja, A.; Belloula, M.; Badraddine, S.; Saibi, H. Groundwater modelling of the Tebessa-Morsott alluvial aquifer (northeastern Algeria): A geostatistical approach. Groundw. Sustain. Dev. 2020, 11, 100444. [Google Scholar] [CrossRef]
- García-Rodríguez, M.; Antón, L.; Martinez-Santos, P. Estimating groundwater resources in remote desert environments by coupling geographic information systems with groundwater modeling (Erg Chebbi, Morocco). J. Arid Environ. 2014, 110, 19–29. [Google Scholar]
- Roldán-Cañas, J.; Moreno-Pérez, M.F. Water and Irrigation Management in Arid and Semiarid Zones. Water 2021, 13, 2446. [Google Scholar] [CrossRef]
- Borzì, I. Modeling Groundwater Resources in Data-Scarce Regions for Sustainable Management: Methodologies and Limits. Hydrology 2025, 12, 11. [Google Scholar] [CrossRef]
- Rafik, A.; Brahim, Y.A.; Amazirh, A.; Ouarani, M.; Bargam, B.; Ouatiki, H.; Bouslihim, Y.; Bouchaou, L.; Chehbouni, A. Groundwater level forecasting in a data-scarce region through remote sensing data downscaling, hydrological modeling, and machine learning: A case study from Morocco. J. Hydrol. Reg. Stud. 2023, 50, 101569. [Google Scholar]
- Näschen, K.; Diekkrüger, B.; Leemhuis, C.; Steinbach, S.; Seregina, L.S.; Thonfeld, F.; van der Linden, R. Hydrological modeling in data-scarce catchments: The Kilombero floodplain in Tanzania. Water 2018, 10, 599. [Google Scholar] [CrossRef]
- Williams, J.H.; Paillet, F.L. Geophysical Logging for Hydrogeology; The Groundwater Project: Guelph, ON, Canada, 2023. [Google Scholar] [CrossRef]
- Sinan, M.; Razack, M. Estimation of the transmissivity field of a heterogeneous alluvial aquifer using transverse resistance. Application to the Haouz groundwater (Morocco) (In French). Rev. Sci. L'eau J. Water Sci. 2006, 19, 221–232. [Google Scholar] [CrossRef][Green Version]
- Frohlich, R.K.; Kelly, W.E. The relation between hydraulic transmissivity and transverse resistance in a complicated aquifer of glacial outwash deposits. J. Hydrol. 1985, 79, 215–229. [Google Scholar]


Disclaimer/Publisher’s Note: The statements, opinions and data contained in all publications are solely those of the individual author(s) and contributor(s) and not of MDPI and/or the editor(s). MDPI and/or the editor(s) disclaim responsibility for any injury to people or property resulting from any ideas, methods, instructions or products referred to in the content. |
© 2025 by the authors. Licensee MDPI, Basel, Switzerland. This article is an open access article distributed under the terms and conditions of the Creative Commons Attribution (CC BY) license (https://creativecommons.org/licenses/by/4.0/).