
Comparative Analysis of Spatiotemporal Variability of Groundwater Storage in Iraq Using GRACE Satellite Data


Abstract
1. Introduction
2. Materials and Methods
2.1. Study Area
2.2. Data Sources and Data Assembling
2.2.1. GRACE
2.2.2. Global Land Data Assimilation System (GLDAS)
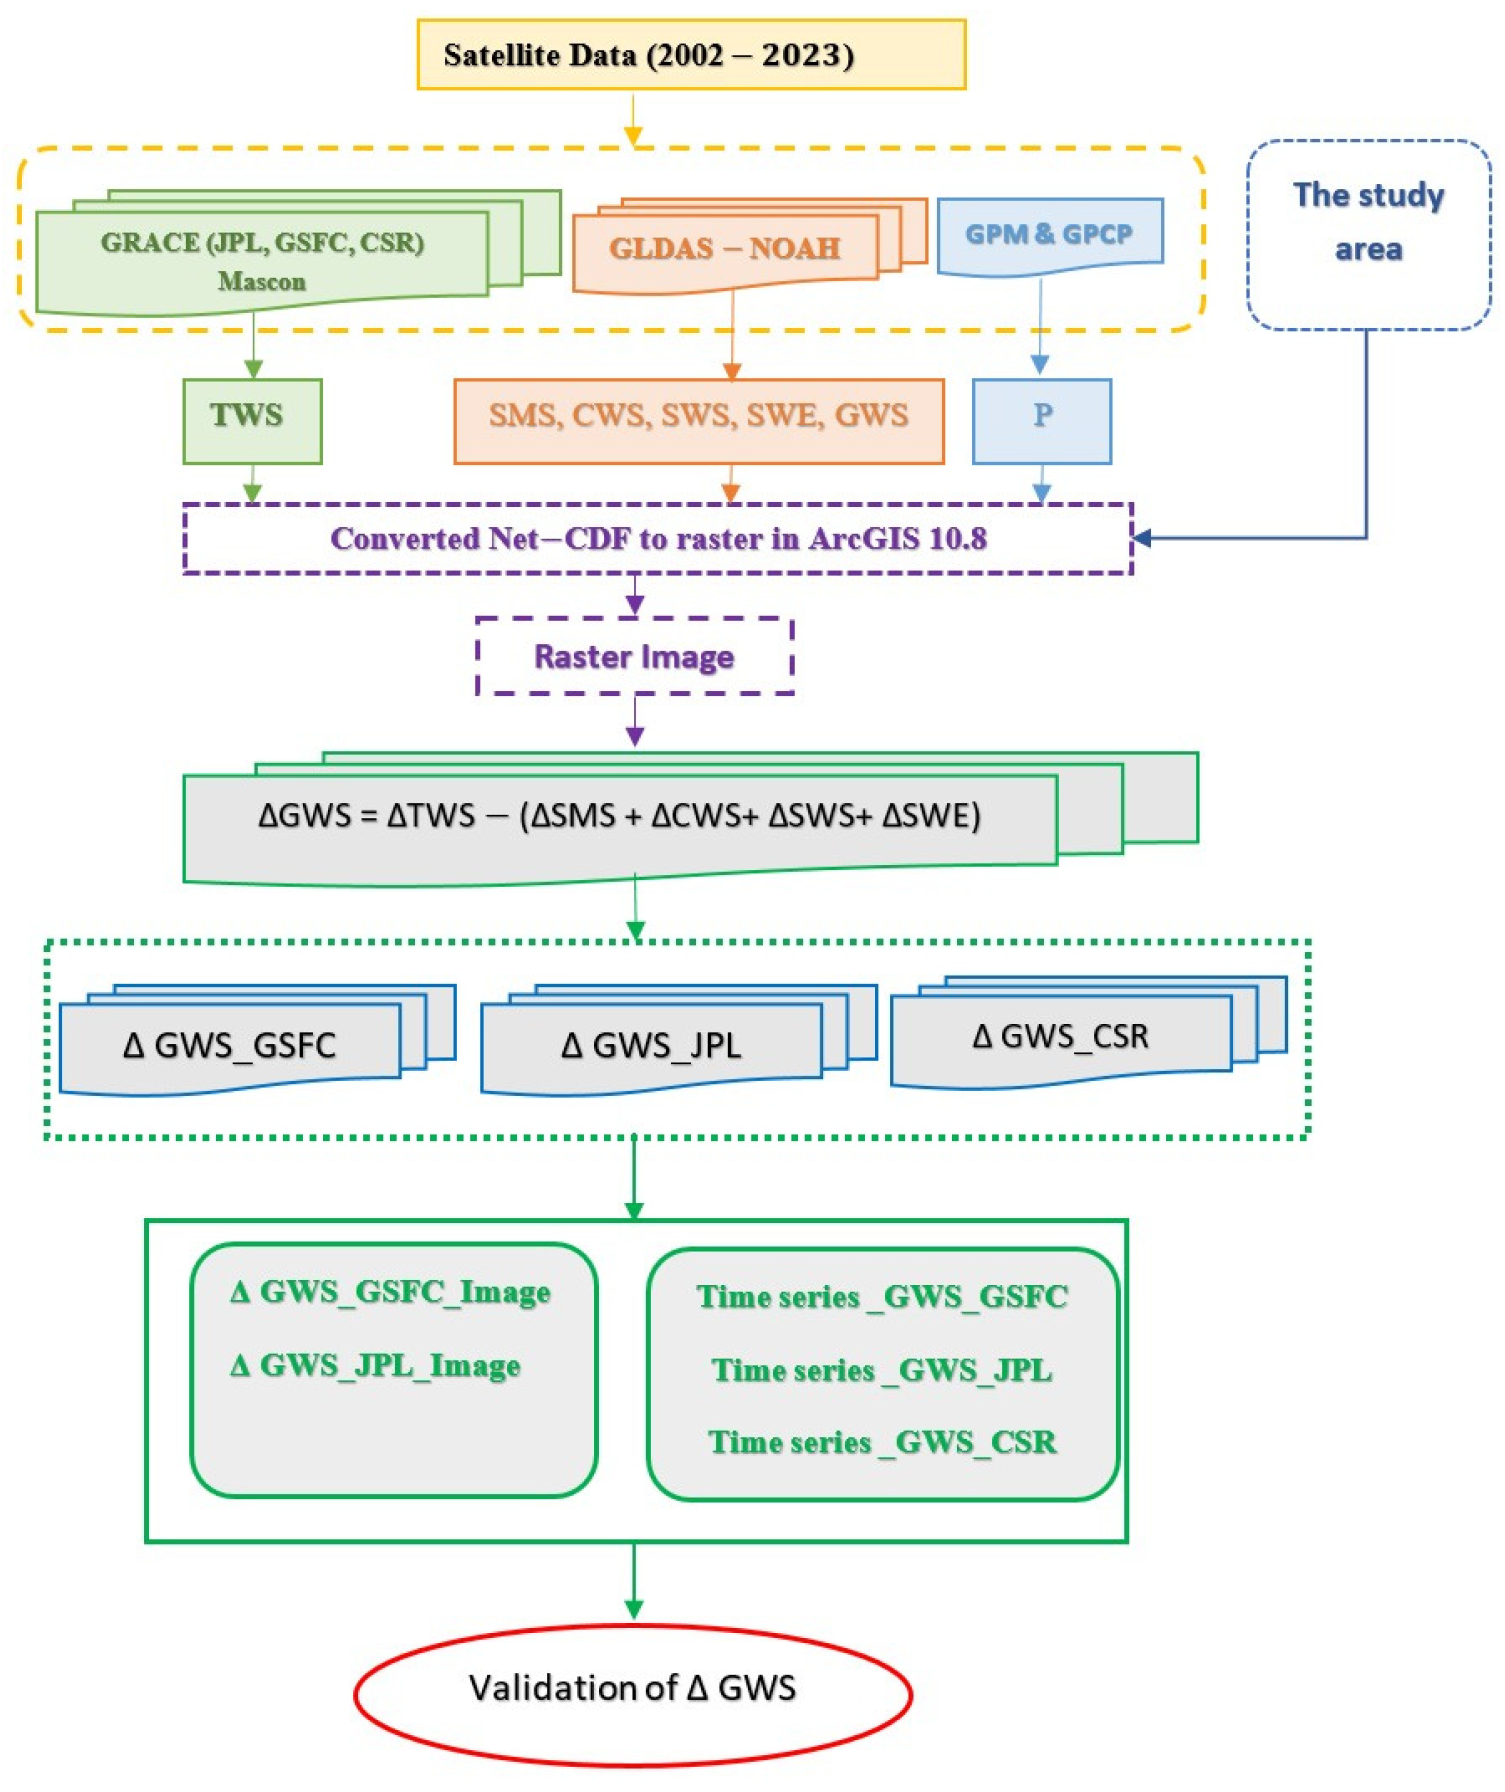
2.3. Methods
2.3.1. Computation of GRACE-Derived ΔGWS
2.3.2. Statistical Trend Analysis
3. Results and Discussion
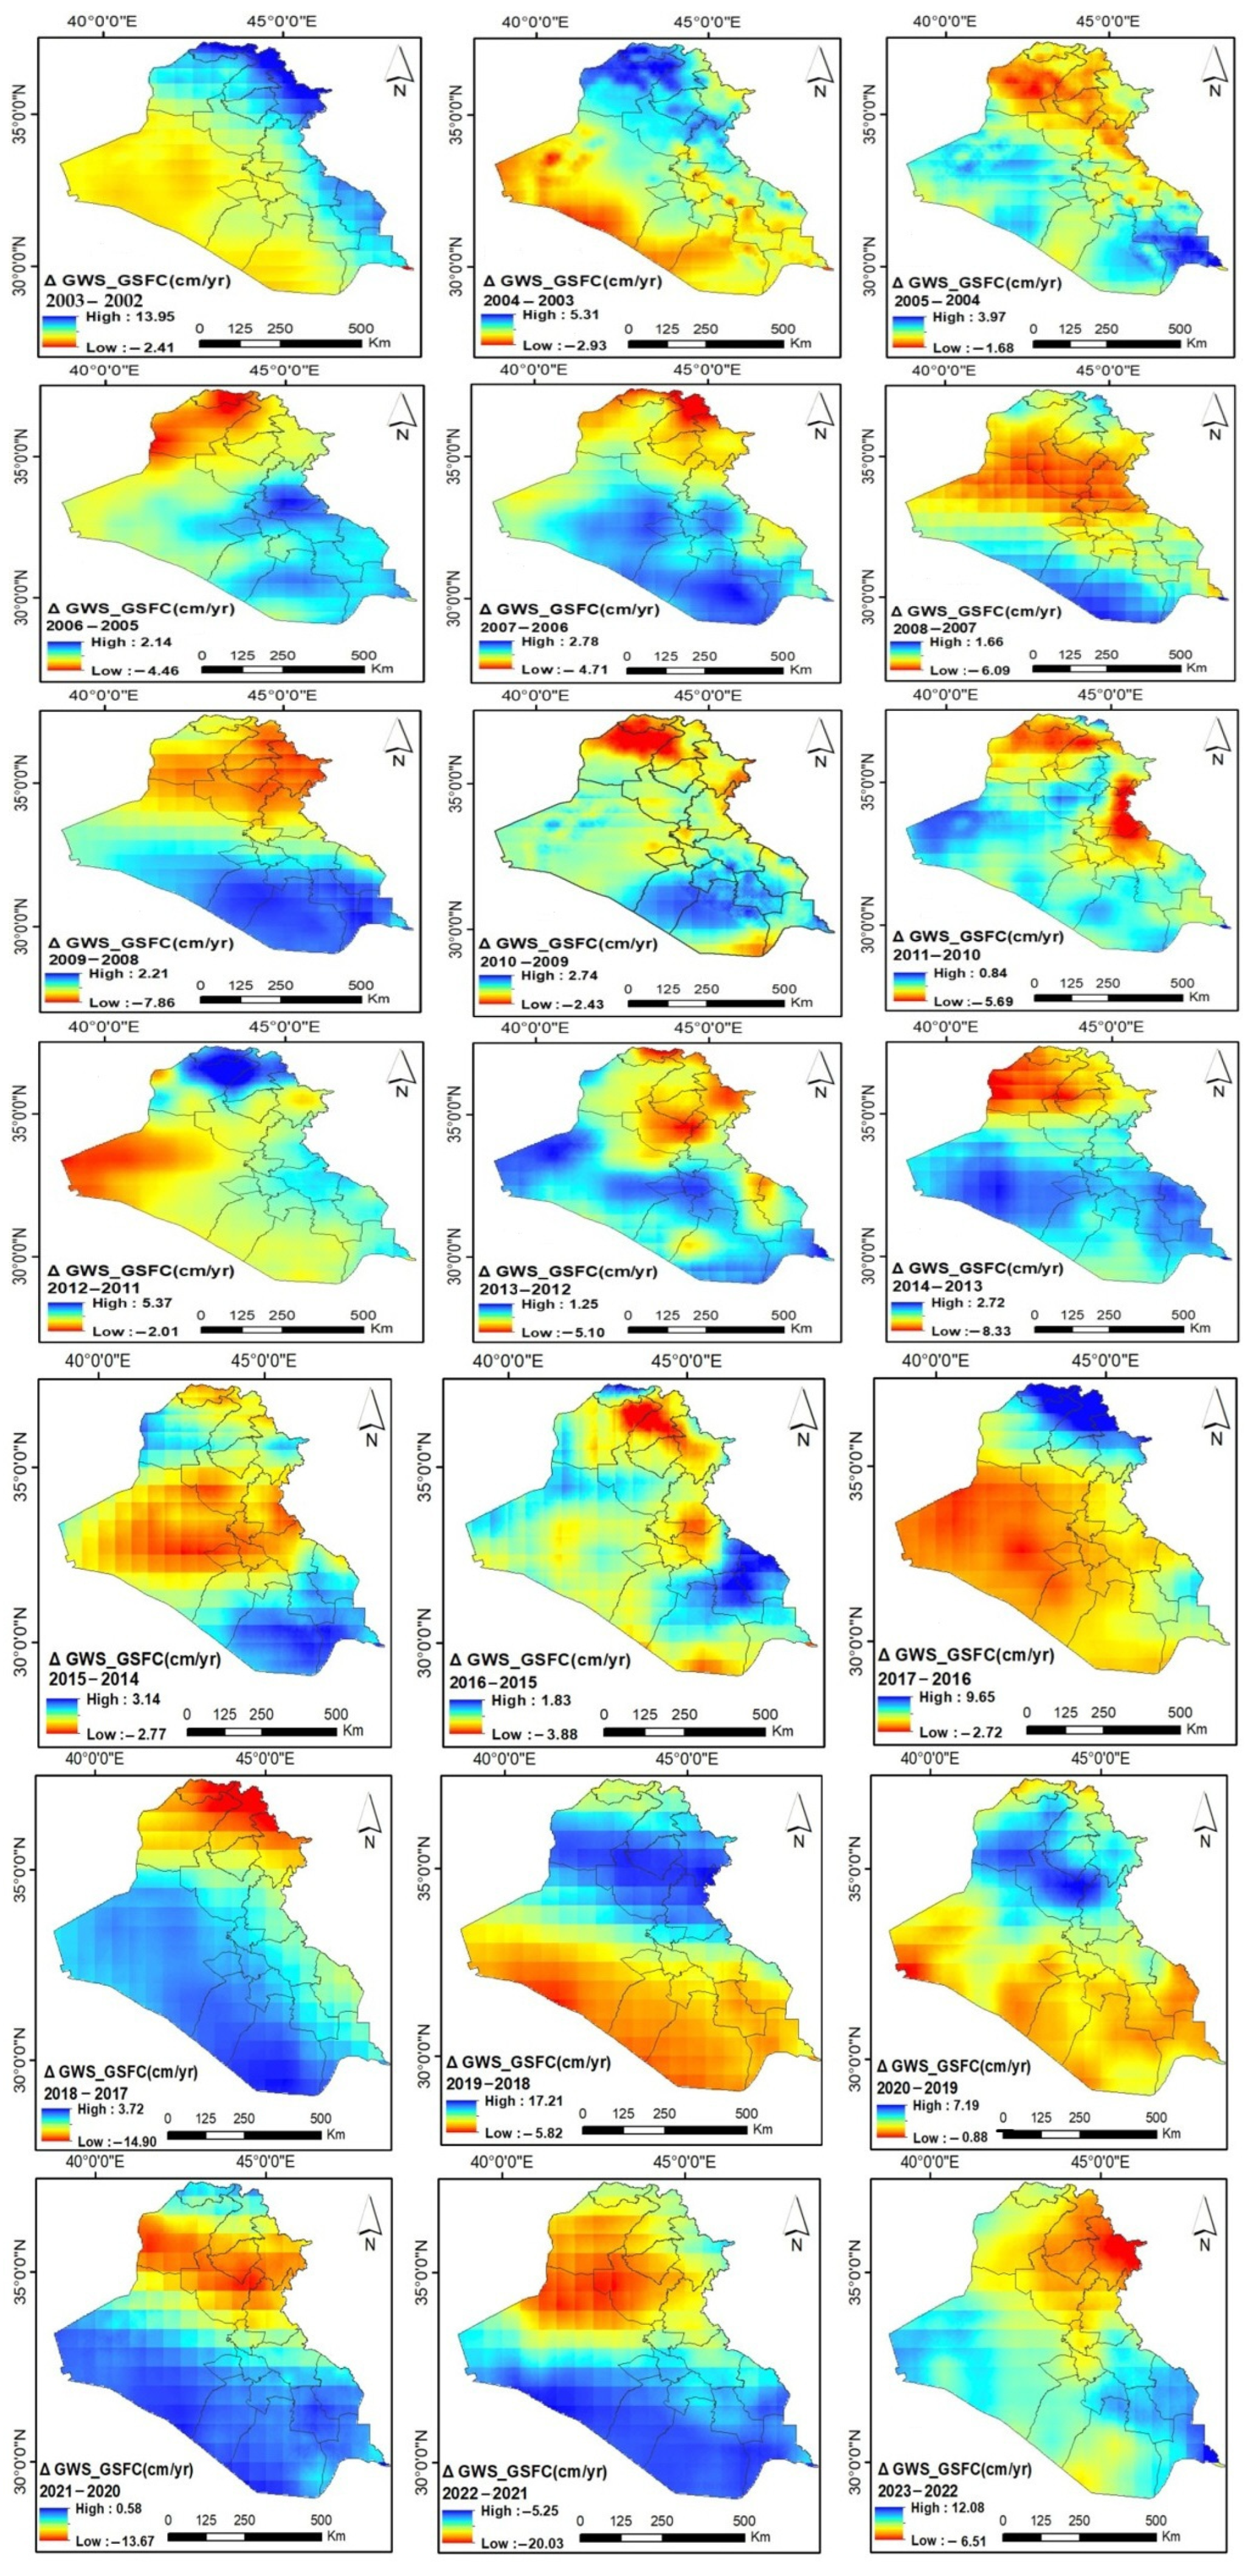
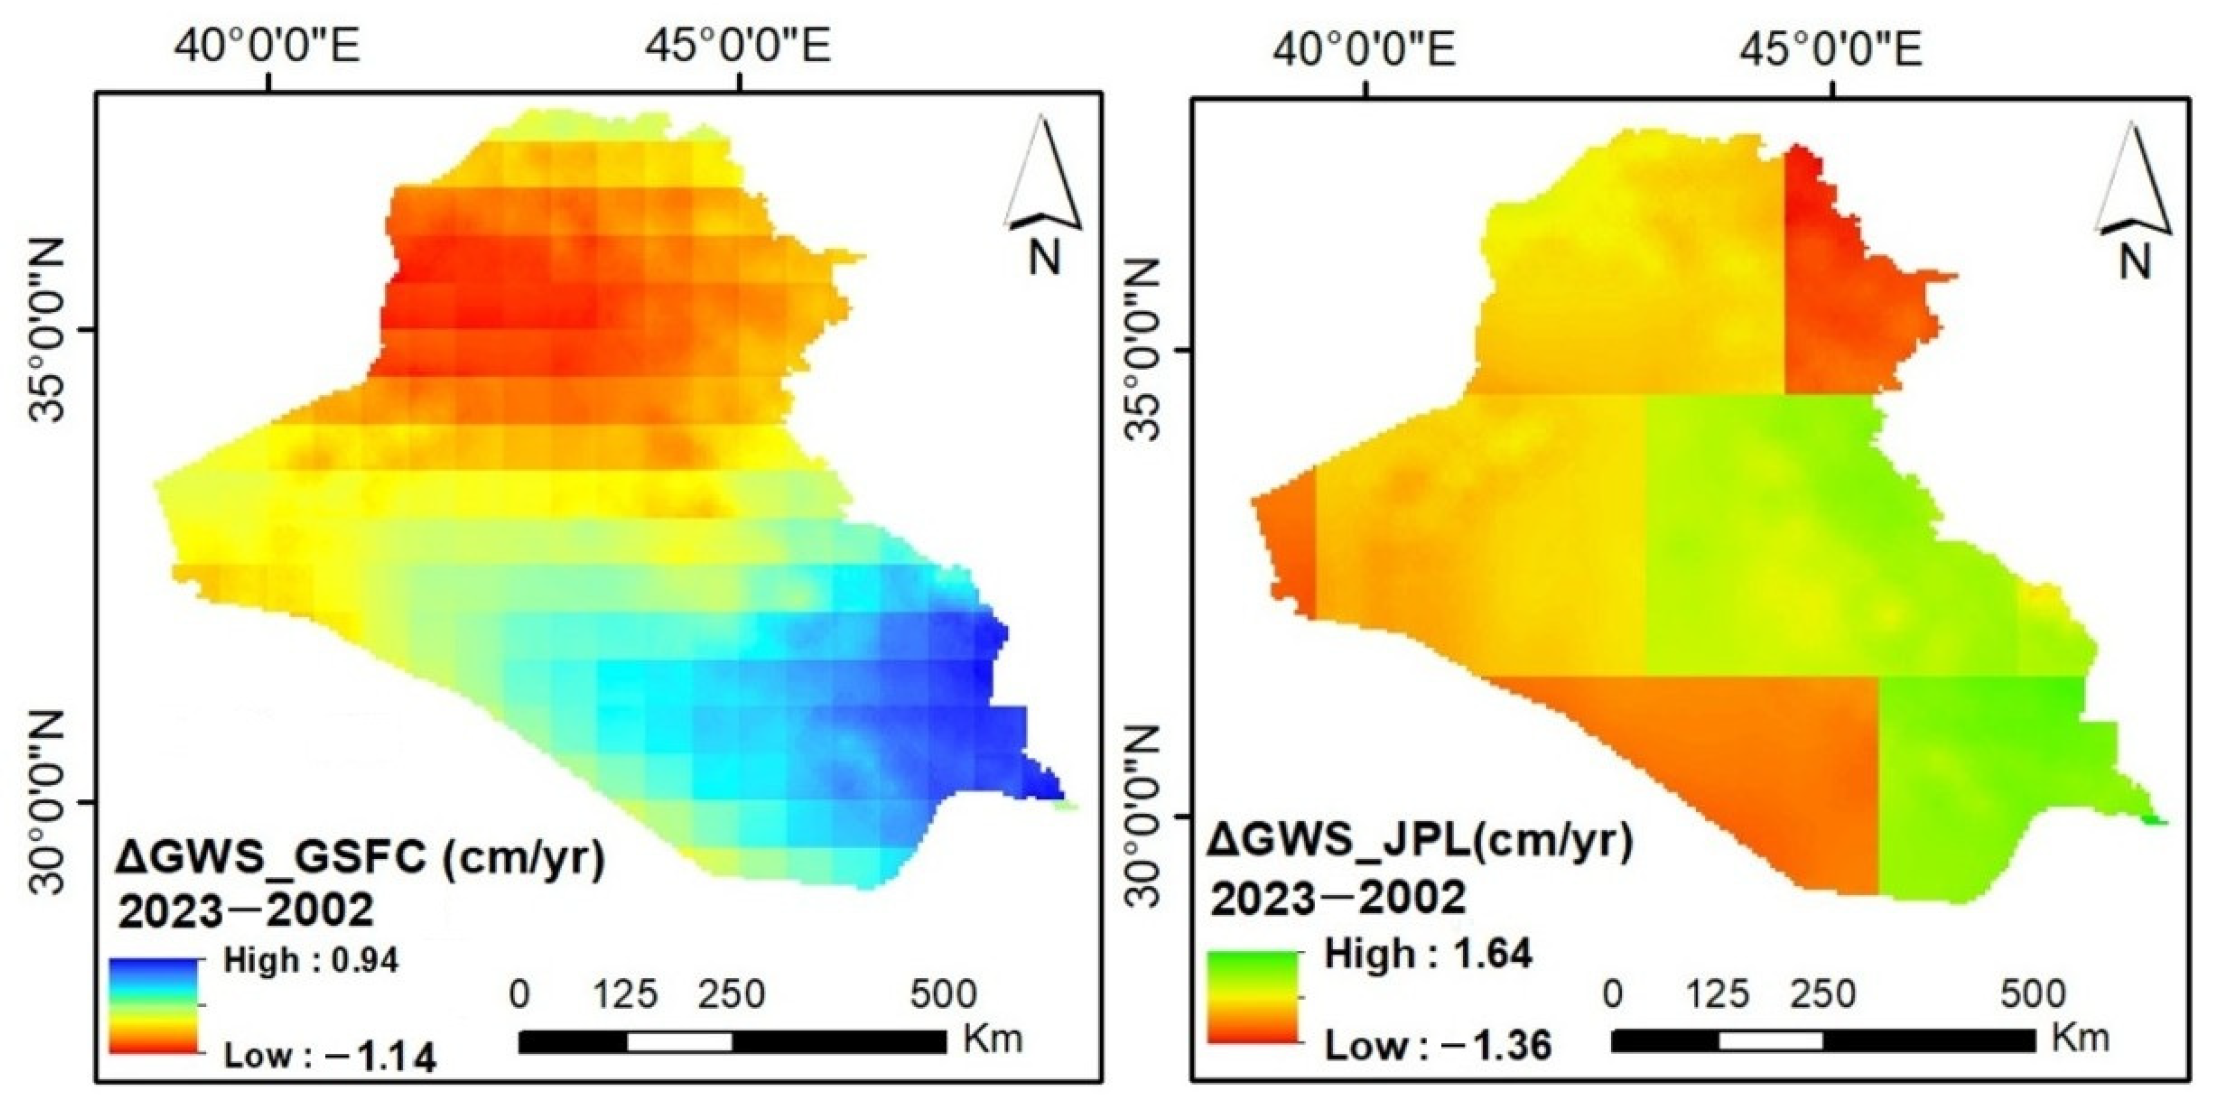
3.1. Computation of ΔGWS
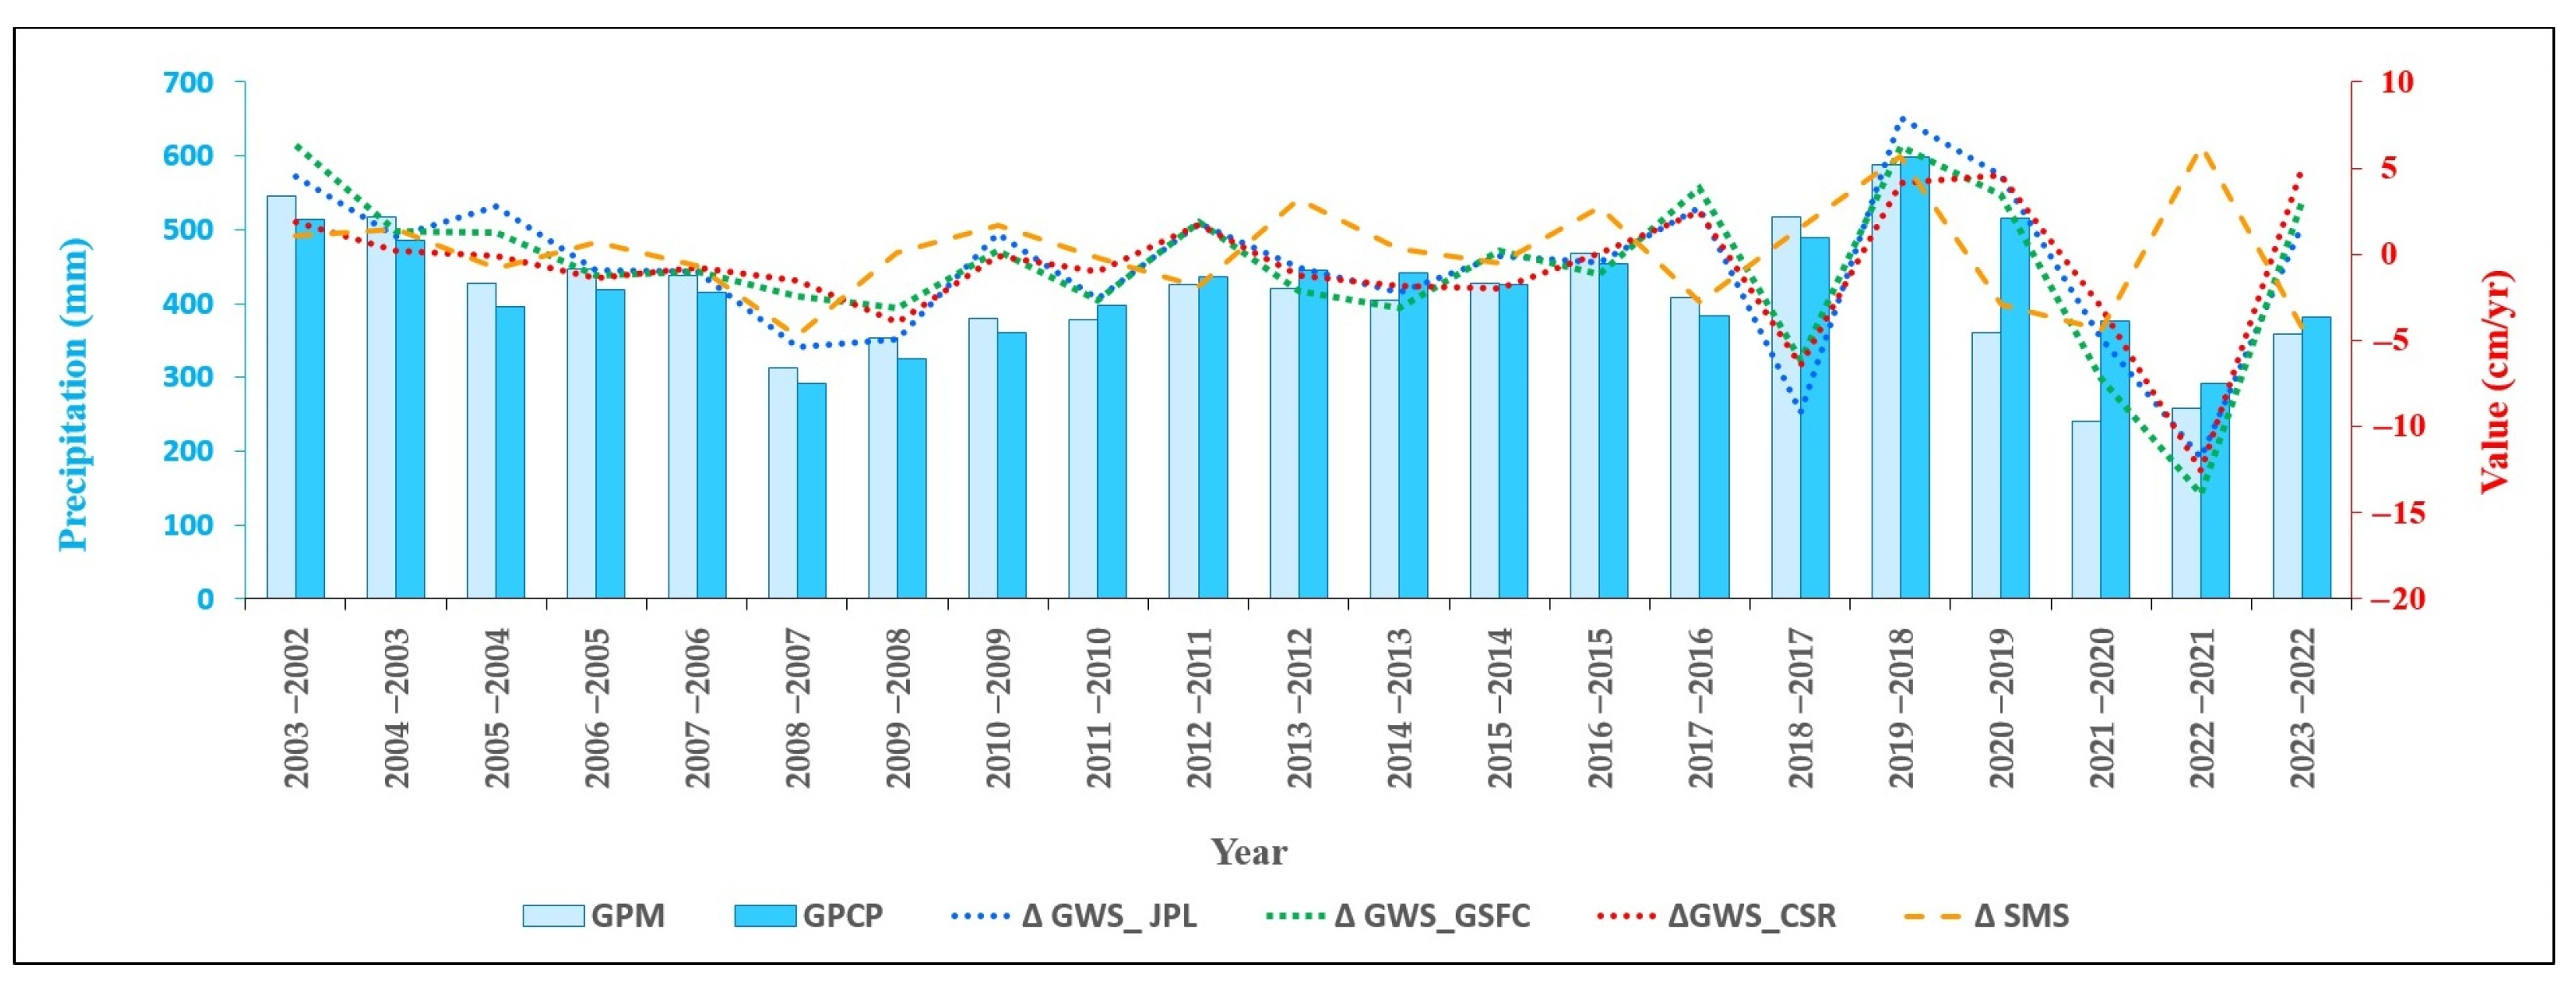
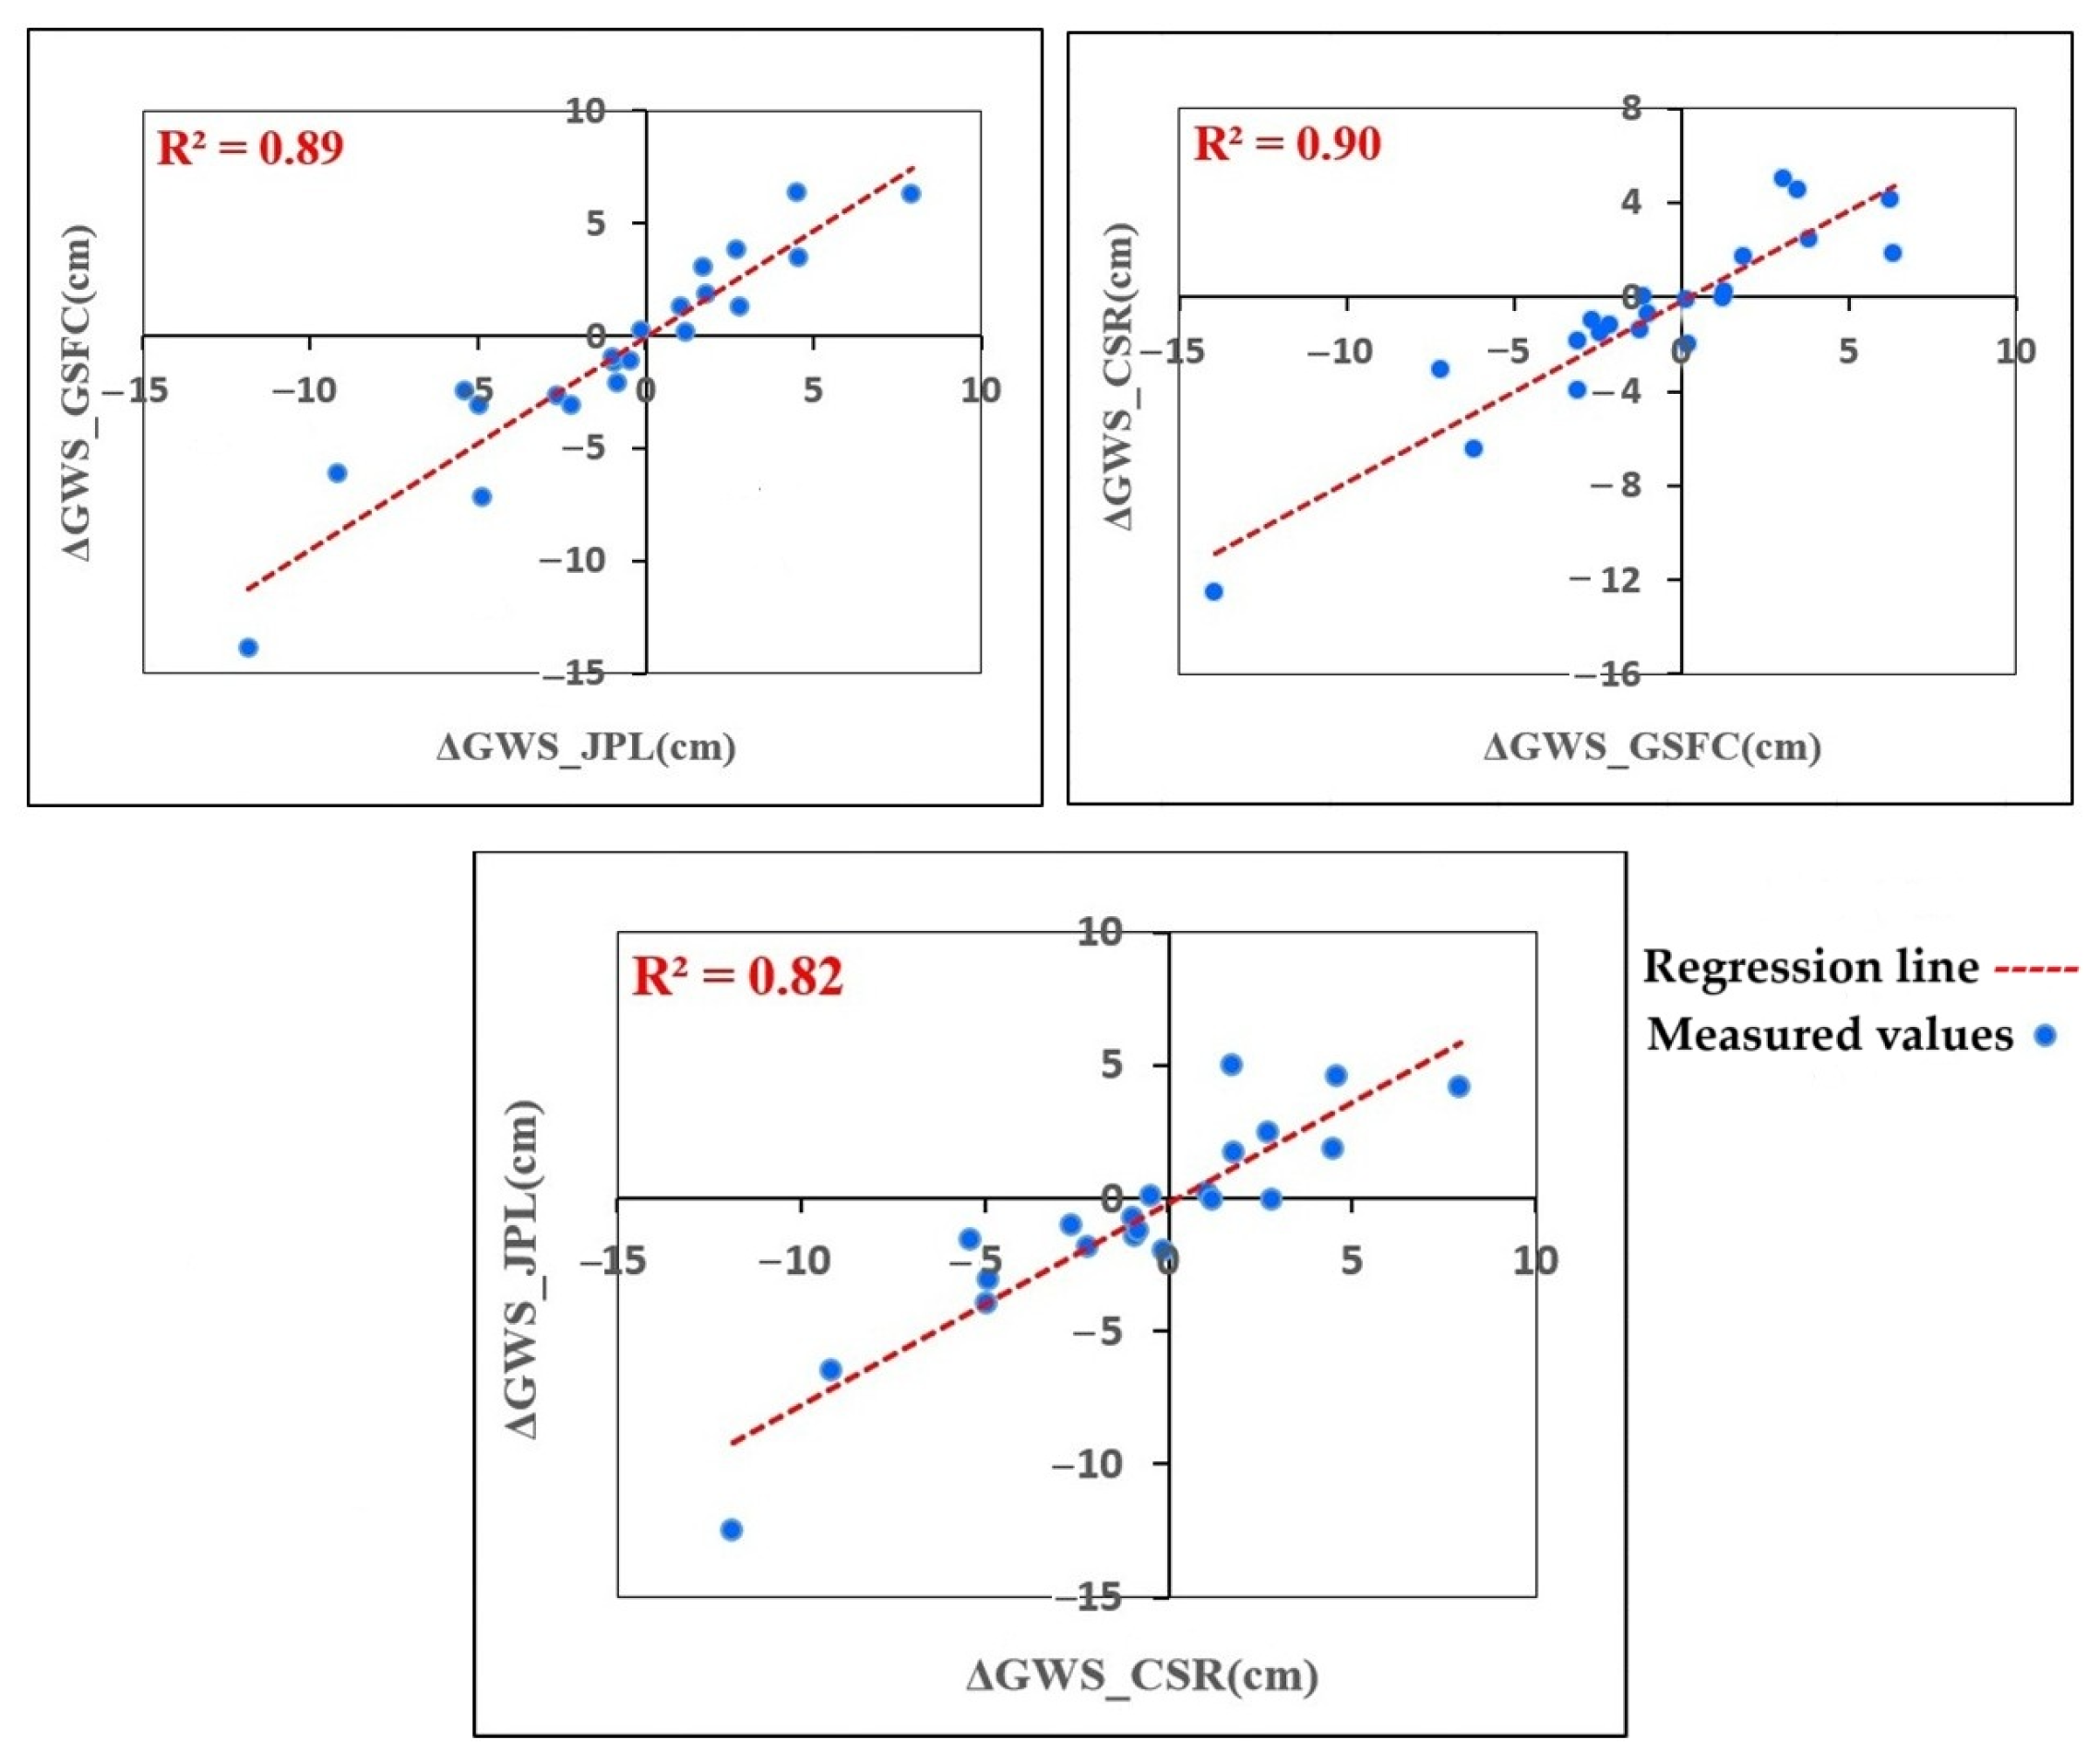
3.2. Validity Evaluation
4. Uncertainty Analysis
5. Conclusions
6. Recommendations
Author Contributions
Funding
Data Availability Statement
Conflicts of Interest
References
- World Economic Forum Annual Meeting 2011. Shared Norms for the New Reality, Davos-Klosters, Switzerland, 26–30 January 2011. Available online: https://www.weforum.org (accessed on 18 December 2024).
- Sahoo, S.; Swain, S.; Goswami, A.; Sharma, R.; Pateriya, B. Assessment of Trends and Multi-Decadal Changes in Groundwater Level in Parts of the Malwa Region, Punjab, India. Groundw. Sustain. Dev. 2021, 14, 100644. [Google Scholar] [CrossRef]
- AlJumaili, K.K.; Al-Khafaji, M.S.; Al-Awadi, A.T. Assessment of Evapotranspiration Estimation Models for Irrigation Projects in Karbala. Iraq. Eng. Technol. J. 2014, 32, 1149–1157. [Google Scholar] [CrossRef]
- Keulertz, M.; Mohtar, R. Water-Energy-Food Nexus in Libya, UAE, Egypt and Iraq. JSTOR 2022. Available online: https://www.jstor.org/stable/resrep39813 (accessed on 28 February 2025).
- Sayl, K.N.; Muhammad, N.S.; El-Shafie, A. Robust Approach for Optimal Positioning and Ranking Potential Rainwater Harvesting Structure (RWH): A Case Study of Iraq. Arab. J. Geosci. 2017, 10, 413. [Google Scholar] [CrossRef]
- Kandeel, A. Climate Change: The Middle East Faces a Water Crisis. Available online: http://www.mei.edu/content/article/climate-change-middle-east-faces-water-crisis (accessed on 2 January 2025).
- Muhaisen, N.; Khayyun, T.; Al-Mukhtar, M. Drought Forecasting Model for Future Climate Change Effects in a Regional Catchment Area in Northern Iraq. Eng. Technol. J. 2024, 42, 1–15. [Google Scholar] [CrossRef]
- Saeed, F.H.; Al-Khafaji, M.S.; Al-Faraj, F. Hydrologic Response of Arid and Semi-Arid River Basins in Iraq under a Changing Climate. J. Water Clim. Change 2022, 13, 1225–1240. [Google Scholar] [CrossRef]
- Saeed, F.H.; Al-Khafaji, M.S.; Al-Faraj, F.A.M.; Uzomah, V. Sustainable Adaptation Plan in Response to Climate Change and Population Growth in the Iraqi Part of Tigris River Basin. Sustainability 2024, 16, 2676. [Google Scholar] [CrossRef]
- Alwan, I.A.; Aziz, N.A.; Hamoodi, M.N. Potential Water Harvesting Sites Identification Using Spatial Multi-Criteria Evaluation in Maysan Province, Iraq. ISPRS Int. J. Geo-Inf. 2020, 9, 235. [Google Scholar] [CrossRef]
- Al-Gburi, M.R.G.; Al-Khatony, S.E.; Znad, R.K.; Al-Sumaidaie, M.A.H. Mapping of Groundwater Potential Zone Using GIS and Remote Sensing of Shwan Sub-Basin, Kirkuk, NE Iraq. Iraqi Geol. J. 2022, 55, 62–72. [Google Scholar] [CrossRef]
- Ethaib, S.; Zubaidi, S.L.; Al-Ansari, N. Evaluation Water Scarcity Based on GIS Estimation and Climate-Change Effects: A Case Study of Thi-Qar Governorate, Iraq. Cogent Eng. 2022, 9, 2075301. [Google Scholar] [CrossRef]
- Tarish, H.A.; Mahdi, M.S.; Croock, M.S. Wireless Sensor Network Structure for Ground Water Well’s Field in Karbala City. Int. J. Comput. Appl. 2017, 975, 8887. [Google Scholar]
- Gleick, P.H.; Howe, C.W. Water in Crisis: A Guide to the World’s Fresh Water Resources. Clim. Change 1995, 31, 119–122. [Google Scholar]
- Margat, J.; Van der Gun, J. Groundwater around the World: A Geographic Synopsis; CRC Press: Boca Raton, FL, USA, 2013; ISBN 1138000345. [Google Scholar]
- Ramjeawon, M.; Demlie, M.; Toucher, M. Analyses of Groundwater Storage Change Using GRACE Satellite Data in the Usutu-Mhlatuze Drainage Region, North-Eastern South Africa. J. Hydrol. Reg. Stud. 2022, 42, 101118. [Google Scholar] [CrossRef]
- Liu, L.; Chen, X.; Xu, G.; Shu, L. Use of Hydrologic Time-Series Data for Identification of Hydrodynamic Function and Behavior in a Karstic Water System in China. Hydrogeol. J. 2011, 8, 1577–1585. [Google Scholar] [CrossRef]
- Aziz, N.A.; Hasan, R.H.; Abdulrazzaq, Z.T. Optimum Site Selection for Groundwater Wells Using Integration between GIS and Hydrogeophysical Data. Eng. Technol. J. 2018, 36, 596–602. [Google Scholar] [CrossRef]
- Khalaf, A.G. Determination the suiTable locations for drilling wells for irrigation purpose by using geographic information system (GIS). Eng. Technol. J. 2016, 34, 80–89. [Google Scholar] [CrossRef]
- Aziz, N.A.; Alwan, I.A. An Accuracy Analysis Comparison of Supervised Classification Methods for Mapping Land Cover Using Sentinel 2 Images in the Al-Hawizeh Marsh Area, Southern Iraq. Geomat. Environ. Eng. 2021, 15, 5–21. [Google Scholar] [CrossRef]
- Alwan, I.A.; Karim, H.H.; Aziz, N.A. Investigate the Optimum Agricultural Crops Production Seasons in Salah Al-Din Governorate Utilizing Climate Remote Sensing Data and Agro-Climatic Zoning. Iraqi J. Sci. 2019, 60, 2087–2094. [Google Scholar] [CrossRef]
- Huang, C.; Chen, Y.; Zhang, S.; Wu, J. Detecting, Extracting, and Monitoring Surface Water from Space Using Optical Sensors: A Review. Rev. Geophys. 2018, 56, 333–360. [Google Scholar] [CrossRef]
- Cui, L.; Song, Z.; Luo, Z.; Zhong, B.; Wang, X.; Zou, Z. Comparison of Terrestrial Water Storage Changes Derived from GRACE/GRACE-FO and Swarm: A Case Study in the Amazon River Basin. Water 2020, 12, 3128. [Google Scholar] [CrossRef]
- Chen, W.; Xiong, Y.; Zhong, M.; Yang, Z.; Shum, C.K.; Li, W.; Liang, L.; Li, Q. Twenty-Year Spatiotemporal Variations of TWS over Mainland China Observed by GRACE and GRACE Follow-On Satellites. Atmosphere 2023, 14, 1717. [Google Scholar] [CrossRef]
- Masood, A.; Atiq, M.; Rahman, U.; Zia, M.; Rahman, U.; Waseem, M.; Sarwar, M.K.; Ali, W.; Farooq, R.; Almazroui, M.; et al. An Overview of Groundwater Monitoring through Point-To. Water 2022, 14, 565. [Google Scholar] [CrossRef]
- Alattar, M.H.; Troy, T.J.; Russo, T.A.; Boyce, S.E. Modeling the Surface Water and Groundwater Budgets of the US Using MODFLOW-OWHM. Adv. Water Resour. 2020, 143, 103682. [Google Scholar] [CrossRef]
- Binley, A.; Hubbard, S.S.; Huisman, J.A.; Revil, A.; Robinson, D.A.; Singha, K.; Slater, L.D. The Emergence of Hydrogeophysics for Improved Understanding of Subsurface Processes over Multiple Scales. Water Resour. Res. 2015, 51, 3837–3866. [Google Scholar] [CrossRef] [PubMed]
- Barthel, R.; Banzhaf, S. Groundwater and Surface Water Interaction at the Regional-Scale–a Review with Focus on Regional Integrated Models. Water Resour. Manag. 2016, 30, 1–32. [Google Scholar] [CrossRef]
- Ajami, H.; McCabe, M.F.; Evans, J.P.; Stisen, S. Assessing the Impact of Model Spin-up on Surface Water-groundwater Interactions Using an Integrated Hydrologic Model. Water Resour. Res. 2014, 50, 2636–2656. [Google Scholar] [CrossRef]
- Kumar, K.S.; Sridhar, V.; Varaprasad, B.J.S.; Chinnapa Reddy, K. Bridging the Data Gap between the GRACE Missions and Assessment of Groundwater Storage Variations for Telangana State, India. Water 2022, 14, 3852. [Google Scholar] [CrossRef]
- Sarkar, T.; Kannaujiya, S.; Taloor, A.K.; Champati Ray, P.K.; Chauhan, P. Integrated Study of GRACE Data Derived Interannual Groundwater Storage Variability over Water Stressed Indian Regions. Groundw. Sustain. Dev. 2020, 10, 100376. [Google Scholar] [CrossRef]
- Othman, A.; Abdelrady, A.; Mohamed, A. Monitoring Mass Variations in Iraq Using Time-Variable Gravity Data. Remote Sens. 2022, 14, 3346. [Google Scholar] [CrossRef]
- Voss, K.A.; Famiglietti, J.S.; Lo, M.; De Linage, C.; Rodell, M.; Swenson, S.C. Groundwater Depletion in the Middle East from GRACE with Implications for Transboundary Water Management in the Tigris-Euphrates-Western Iran Region. Water Resour. Res. 2013, 49, 904–914. [Google Scholar] [CrossRef]
- Mohamed, A.; Al Deep, M. Depth to the Bottom of the Magnetic Layer, Crustal Thickness, and Heat Flow in Africa: Inferences from Gravity and Magnetic Data. J. Afr. Earth Sci. 2021, 179, 104204. [Google Scholar] [CrossRef]
- Mohamed, A.; El Ella, E.M.A. Magnetic Applications to Subsurface and Groundwater Investigations: A Case Study from Wadi El Assiuti, Egypt. Int. J. Geosci. 2021, 12, 77. [Google Scholar] [CrossRef]
- Othman, A. Measuring and Monitoring Land Subsidence and Earth Fissures in Al-Qassim Region, Saudi Arabia: Inferences from InSAR. In Proceedings of the Advances in Remote Sensing and Geo Informatics Applications: Proceedings of the 1st Springer Conference of the Arabian Journal of Geosciences (CAJG-1), Hammamet, Tunisia, 12–18 November 2018; Springer: Berlin/Heidelberg, Germany, 2019; pp. 287–291. [Google Scholar]
- Alattar, M.H. Mapping Groundwater Dynamics in Iraq: Integrating Multi-Data Sources for Comprehensive Analysis. Model. Earth Syst. Environ. 2024, 10, 4375–4385. [Google Scholar] [CrossRef]
- Al-Ansari, N.; Saleh, S.; Abdullahand, T.; Ali Abed, S. Quality of Surface Water and Groundwater in Iraq. J. Earth Sci. Geotech. Eng. 2020, 11, 161–199. [Google Scholar] [CrossRef] [PubMed]
- Adamo, N.; Al-Ansari, N.; Sissakian, V.; Fahmi, K.J.; Abed, S.A. Climate Change: Droughts and Increasing Desertification in the Middle East, with Special Reference to Iraq. Engineering 2022, 14, 235–273. [Google Scholar] [CrossRef]
- Ali, E.H.; Bulqader, M.A.; Baker, Y.T. Measuring The Impact of Water Scarcity on Agricultural Economic Development in Iraq. Stallion J. Multidiscip. Assoc. Res. Stud. 2024, 3, 1–16. [Google Scholar] [CrossRef]
- Al-Ansari, N.; Adamo, N.; Hachem, A.H.; Sissakian, V.; Laue, J.; Abed, S.A. Causes of Water Resources Scarcity in Iraq and Possible Solutions. Engineering 2023, 15, 467–496. [Google Scholar] [CrossRef]
- Al-Ansari, N. Topography and Climate of Iraq. J. Earth Sci. Geotech. Eng. 2021, 11, 1–13. [Google Scholar] [CrossRef]
- Frenken, K. Irrigation in the Middle East Region in Figures AQUASTAT Survey-2008; Water Reports; FAO: Roma, Italy, 2009. [Google Scholar]
- Al-Jiburi, H.K.; Al-Basrawi, N.H. Hydrogeological Map of Iraq, Scale 1: 1000 000, 2013. Iraqi Bull. Geol. Min. 2015, 11, 17–26. [Google Scholar]
- Yousuf, M.A.; Rapantova, N.; Younis, J.H. Sustainable Water Management in Iraq (Kurdistan) as a Challenge for Governmental Responsibility. Water 2018, 10, 1651. [Google Scholar] [CrossRef]
- Longuevergne, L.; Scanlon, B.R.; Wilson, C.R. GRACE Hydrological Estimates for Small Basins: Evaluating Processing Approaches on the High Plains Aquifer, USA. Water Resour. Res. 2010, 46, W11517. [Google Scholar] [CrossRef]
- Morris, B.L.; Lawrence, A.R.L.; Chilton, P.J.C.; Adams, B.; Calow, R.C.; Klinck, B.A. Groundwater and Its Susceptibility to Degradation: A Global Assessment of the Problem and Options for Management. 2003. Available online: https://nora.nerc.ac.uk/id/eprint/19395 (accessed on 28 February 2025).
- Alsdorf, D.E.; Rodríguez, E.; Lettenmaier, D.P. Measuring Surface Water from Space. Rev. Geophys. 2007, 45. [Google Scholar] [CrossRef]
- Rast, M.; Johannessen, J.; Mauser, W. Review of Understanding of Earth’s Hydrological Cycle: Observations, Theory and Modelling. Surv. Geophys. 2014, 35, 491–513. [Google Scholar] [CrossRef]
- Huang, J. How the Regional Water Cycle Responds to Recent Climate Change in Northwest Aridzone of China? Doctoral Thesis, Hong Kong Baptist University, Hong Kong, 2017. [Google Scholar]
- Tapley, B.D.; Bettadpur, S.; Ries, J.C.; Thompson, P.F.; Watkins, M.M. GRACE Measurements of Mass Variability in the Earth System. Science 2004, 305, 503–505. [Google Scholar] [CrossRef]
- Feng, W.; Shum, C.K.; Zhong, M.; Pan, Y. Groundwater Storage Changes in China from Satellite Gravity: An Overview. Remote Sens. 2018, 10, 674. [Google Scholar] [CrossRef]
- Frappart, F.; Ramillien, G. Monitoring Groundwater Storage Changes Using the Gravity Recovery and Climate Experiment (GRACE) Satellite Mission: A Review. Remote Sens. 2018, 10, 829. [Google Scholar] [CrossRef]
- Rodell, M.; Houser, P.R.; Jambor, U.; Gottschalck, J.; Mitchell, K.; Meng, C.-J.; Arsenault, K.; Cosgrove, B.; Radakovich, J.; Bosilovich, M.; et al. The Global Land Data Assimilation System. Bull. Am. Meteorol. Soc. 2004, 85, 381–394. [Google Scholar] [CrossRef]
- Richey, A.S.; Thomas, B.F.; Lo, M.; Reager, J.T.; Famiglietti, J.S.; Voss, K.; Swenson, S.; Rodell, M. Quantifying Renewable Groundwater Stress with GRACE. Water Resour. Res. 2015, 51, 5217–5238. [Google Scholar] [CrossRef]
- Chao, N.; Luo, Z.; Wang, Z.; Jin, T. Retrieving Groundwater Depletion and Drought in the Tigris-Euphrates Basin Between 2003 and 2015. Groundwater 2018, 56, 770–782. [Google Scholar] [CrossRef]
- Taylor, R.G.; Scanlon, B.; Döll, P.; Rodell, M.; van Beek, R.; Wada, Y.; Longuevergne, L.; Leblanc, M.; Famiglietti, J.S.; Edmunds, M.; et al. Ground Water and Climate Change. Nat. Clim. Change 2013, 3, 322–329. [Google Scholar] [CrossRef]
- Joodaki, G.; Wahr, J.; Swenson, S. Estimating the Human Contribution to Groundwater Depletion in the Middle East, from GRACE Data, Land Surface Models, and Well Observations. Water Resour. Res. 2014, 50, 2679–2692. [Google Scholar] [CrossRef]
- Zens, J.; Flechtner, F.; Wickert, J.; Förste, C.; Stolle, C.; Grunwaldt, L.; Leicht, J.; Friedrich, D.; Itzerott, S. Nützliche Neue Begleiter Am Himmel: Satelliten Als Erdbeobachtungsinstrumente Haben Eine Lange Tradition Auf Dem Potsdamer Telegrafenberg. Syst. Erde 2017, 7, 6–11. [Google Scholar]
- Kornfeld, R.P.; Arnold, B.W.; Gross, M.A.; Dahya, N.T.; Klipstein, W.M.; Gath, P.F.; Bettadpur, S. GRACE-FO: The Gravity Recovery and Climate Experiment Follow-On Mission. J. Spacecr. Rockets 2019, 56, 931–951. [Google Scholar] [CrossRef]
- Wahr, J.; Swenson, S.; Zlotnicki, V.; Velicogna, I. Time-variable Gravity from GRACE: First Results. Geophys. Res. Lett. 2004, 31. [Google Scholar] [CrossRef]
- Moghim, S. Assessment of Water Storage Changes Using GRACE and GLDAS. Water Resour. Manag. 2020, 34, 685–697. [Google Scholar] [CrossRef]
- McStraw, T.C.; Pulla, S.T.; Jones, N.L.; Williams, G.P.; David, C.H.; Nelson, J.E.; Ames, D.P. An Open-Source Web Application for Regional Analysis of GRACE Groundwater Data and Engaging Stakeholders in Groundwater Management. JAWRA J. Am. Water Resour. Assoc. 2022, 58, 1002–1016. [Google Scholar] [CrossRef]
- Long, D.; Longuevergne, L.; Scanlon, B.R. Global Analysis of Approaches for Deriving Total Water Storage Changes from GRACE Satellites. Water Resour. Res. 2015, 51, 2574–2594. [Google Scholar] [CrossRef]
- Rahaman, M.M.; Thakur, B.; Kalra, A.; Ahmad, S. Modeling of GRACE-Derived Groundwater Information in the Colorado River Basin. Hydrology 2019, 6, 19. [Google Scholar] [CrossRef]
- Bonan, G.B.; Oleson, K.W.; Vertenstein, M.; Levis, S.; Zeng, X.; Dai, Y.; Dickinson, R.E.; Yang, Z.-L. The Land Surface Climatology of the Community Land Model Coupled to the NCAR Community Climate Model. J. Clim. 2002, 15, 3123–3149. [Google Scholar] [CrossRef]
- Deng, H.; Pepin, N.C.; Liu, Q.; Chen, Y. Understanding the Spatial Differences in Terrestrial Water Storage Variations in the Tibetan Plateau from 2002 to 2016. Clim. Change 2018, 151, 379–393. [Google Scholar] [CrossRef]
- Liu, F.; Kang, P.; Zhu, H.; Han, J.; Huang, Y. Analysis of Spatiotemporal Groundwater-Storage Variations in China from GRACE. Water 2021, 13, 2378. [Google Scholar] [CrossRef]
- Scanlon, B.R.; Longuevergne, L.; Long, D. Ground Referencing GRACE Satellite Estimates of Groundwater Storage Changes in the California Central Valley, USA. Water Resour. Res. 2012, 48. [Google Scholar] [CrossRef]
- Massoud, E.C.; Purdy, A.J.; Miro, M.E.; Famiglietti, J.S. Projecting Groundwater Storage Changes in California’s Central Valley. Sci. Rep. 2018, 8, 12917. [Google Scholar] [CrossRef] [PubMed]
- Landerer, F.W.; Swenson, S.C. Accuracy of Scaled GRACE Terrestrial Water Storage Estimates. Water Resour. Res. 2012, 48. [Google Scholar] [CrossRef]
- Cooley, S.S.; Landerer, F.W. Gravity Recovery and Climate Experiment Follow-on (GRACE-FO) Level-3 Data Product User Handbook; Jet Propulsion Laboratory California Institute of Technology: La Cañada Flintridge, CA, USA, 2019. [Google Scholar]
- Mohamed, A. Gravity Applications in Estimating the Mass Variations in the Middle East: A Case Study from Iran. Arab. J. Geosci. 2020, 13, 364. [Google Scholar] [CrossRef]
- Sen, P.K. Estimates of the Regression Coefficient Based on Kendall’s Tau. J. Am. Stat. Assoc. 1968, 63, 1379–1389. [Google Scholar] [CrossRef]
- Mann, H.B. Nonparametric Tests against Trend. Econom. J. Econom. Soc. 1945, 13, 245–259. [Google Scholar] [CrossRef]
- Fieller, E.C.; Hartley, H.O.; Pearson, E.S. Tests for Rank Correlation Coefficients. I. Biometrika 1957, 44, 470–481. [Google Scholar] [CrossRef]
- Ndlovu, M.S.; Demlie, M. Assessment of Meteorological Drought and Wet Conditions Using Two Drought Indices across KwaZulu-Natal Province, South Africa. Atmosphere 2020, 11, 623. [Google Scholar] [CrossRef]
- Patle, G.T.; Singh, D.K.; Sarangi, A.; Rai, A.; Khanna, M.; Sahoo, R.N. Time Series Analysis of Groundwater Levels and Projection of Future Trend. J. Geol. Soc. India 2015, 85, 232–242. [Google Scholar] [CrossRef]
- Sun, A.Y. Predicting Groundwater Level Changes Using GRACE Data. Water Resour. Res. 2013, 49, 5900–5912. [Google Scholar] [CrossRef]
- Chai, T.; Draxler, R.R. Root Mean Square Error (RMSE) or Mean Absolute Error (MAE)?—Arguments against Avoiding RMSE in the Literature. Geosci. Model Dev. 2014, 7, 1247–1250. [Google Scholar] [CrossRef]
- Zhang, X.-J.; Tang, Q.; Pan, M.; Tang, Y. A Long-Term Land Surface Hydrologic Fluxes and States Dataset for China. J. Hydrometeorol. 2014, 15, 2067–2084. [Google Scholar] [CrossRef]
- Gupta, H.V.; Sorooshian, S.; Yapo, P.O. Status of Automatic Calibration for Hydrologic Models: Comparison with Multilevel Expert Calibration. J. Hydrol. Eng. 1999, 4, 135–143. [Google Scholar] [CrossRef]
- Abou Rafee, S.A.; Uvo, C.B.; Martins, J.A.; Domingues, L.M.; Rudke, A.P.; Fujita, T.; Freitas, E.D. Large-Scale Hydrological Modelling of the Upper Paraná River Basin. Water 2019, 11, 882. [Google Scholar] [CrossRef]
- Moriasi, D.N.; Arnold, J.G.; Van Liew, M.W.; Bingner, R.L.; Harmel, R.D.; Veith, T.L. Model Evaluation Guidelines for Systematic Quantification of Accuracy in Watershed Simulations. Trans. ASABE 2007, 50, 885–900. [Google Scholar] [CrossRef]
- Skaskevych, A. A Comparison Study of Grace-Based Groundwater Modeling for Data-Rich and Data-Poor Regions; University of Missouri-Kansas City: Kansas City, MO, USA, 2014; ISBN 1321264976. [Google Scholar]
- Seraphin, P.; Gonçalvès, J.; Hamelin, B.; Stieglitz, T.; Deschamps, P. Influence of Intensive Agriculture and Geological Heterogeneity on the Recharge of an Arid Aquifer System (Saq–Ram, Arabian Peninsula) Inferred from GRACE Data. Hydrol. Earth Syst. Sci. 2022, 26, 5757–5771. [Google Scholar] [CrossRef]
- Al-Mohammdawi, J.A.Z. A Study of Terrestrial Water Storage of Iraq Using GRACE Satellite Data and GLDAS System. Ph.D. Thesis, College of Science, University of Basrah, Basra, Iraq, 2023, unpublished. 168p. [Google Scholar]
- Nikraftar, Z.; Parizi, E.; Saber, M.; Hosseini, S.M.; Ataie-Ashtiani, B.; Simmons, C.T. Groundwater Sustainability Assessment in the Middle East Using GRACE/GRACE-FO Data. Hydrogeol. J. 2024, 32, 321–337. [Google Scholar] [CrossRef]
- Mulder, G.; Olsthoorn, T.N.; Al-Manmi, D.A.M.A.; Schrama, E.J.O.; Smidt, E.H. Identifying Water Mass Depletion in Northern Iraq Observed by GRACE. Hydrol. Earth Syst. Sci. 2015, 19, 1487–1500. [Google Scholar] [CrossRef]
- Nanteza, J.; de Linage, C.R.; Thomas, B.F.; Famiglietti, J.S. Monitoring Groundwater Storage Changes in Complex Basement Aquifers: An Evaluation of the GRACE Satellites over E Ast A Frica. Water Resour. Res. 2016, 52, 9542–9564. [Google Scholar] [CrossRef]
- Döll, P.; Müller Schmied, H.; Schuh, C.; Portmann, F.T.; Eicker, A. Global-scale Assessment of Groundwater Depletion and Related Groundwater Abstractions: Combining Hydrological Modeling with Information from Well Observations and GRACE Satellites. Water Resour. Res. 2014, 50, 5698–5720. [Google Scholar] [CrossRef]
- Longuevergne, L.; Wilson, C.R.; Scanlon, B.R.; Crétaux, J.F. GRACE Water Storage Estimates for the Middle East and Other Regions with Significant Reservoir and Lake Storage. Hydrol. Earth Syst. Sci. 2013, 17, 4817–4830. [Google Scholar] [CrossRef]


| Variables | Data Type | Temporal Resolution | Spatial Resolution | Data Source |
|---|---|---|---|---|
| JPL Mascon | JPL-RL06.1v3 | 2002–2023 Monthly | 0.5° × 0.5° Resample 0.05° × 0.05° | https://podaac.jpl.nasa.gov/dataset/TELLUS_GRAC-GRFO_MASCON_GRID_RL06.1_V3. Available formats Net—CDF. Accessed on 16 April 2024 |
| GSFC Mascon | GSFC-RL06v02 | 2002–2023 Monthly | 0.5° × 0.5° Resample 0.05° × 0.05° | https://earth.gsfc.nasa.gov/geo/data/grace-mascons. Available format Net—CDF. Accessed on 16 April 2024 |
| CSR Mascon | CSR-RL06v03 | 2002–2023 Monthly | 1° × 1° | https://www2.csr.utexas.edu/grace/RL06_mascons.html Available format Net—CDF. Accessed on 5 February 2025 |
| SMS | GLDAS model NOAH025_Mv2.1 | 2002–2023 Monthly | 0.25° × 0.25° Resample 0.05° × 0.05° | https://giovanni.gsfc.nasa.gov/giovanni. Available format Net—CDF. Accessed on 16 April 2024 |
| SWE, SWS, CWS. | GLDAS model NOAH025_Mv2.1 | 2002–2023 Monthly | 0.25° × 0.25° Resample 0.05° × 0.05° | https://giovanni.gsfc.nasa.gov/giovanni. Available format Net—CDF. Accessed on 16 April 2024 |
| GPM | GPM_3IMERGM v07 | 2002–2023 Monthly | 0.1° × 0.1° | |
| GPCP | GPCPMON v3.2 | 2002–2023 Monthly | 0.5° × 0.5° |
| ΔGWS | r | p-Value |
|---|---|---|
| JPL | 0.78 | <0.01 |
| GSFC | 0.76 | <0.01 |
| CSR | 0.70 | <0.01 |
| ΔGWS | JPL | GSFC | CSR | |
|---|---|---|---|---|
| Parameter | ||||
| RMSE (mm) | 0.60 | 0.28 | 0.53 | |
| NSE | 0.89 | 0.93 | 0.76 | |
| Correlation coefficient (R) | 0.94 | 0.96 | 0.91 | |
| Coefficient of determinate R2 | 0.89 | 0.92 | 0.82 | |
| PBIAS | 1.63 | −0.75 | 3.08 | |
| Parameter | Pearson | Spearman | Kendall | ||||
|---|---|---|---|---|---|---|---|
| ΔGWS | Correlation | p-Value | Correlation | p-Value | Correlation | p-Value | |
| JPL | 0.94 | 1.1 × 10⁻¹⁰ | 0.94 | 1.3 × 10⁻¹⁰ | 0.80 | 3.91 × 10⁻⁷ | |
| GSFC | 0.96 | 2.1 × 10⁻⁹ | 0.96 | 1.5 × 10⁻⁸ | 0.85 | 1.83 × 10⁻⁶ | |
| CSR | 0.91 | 1.0 × 10⁻⁸ | 0.88 | 1.2 × 10⁻⁷ | 0.72 | 4.43 × 10⁻⁶ | |
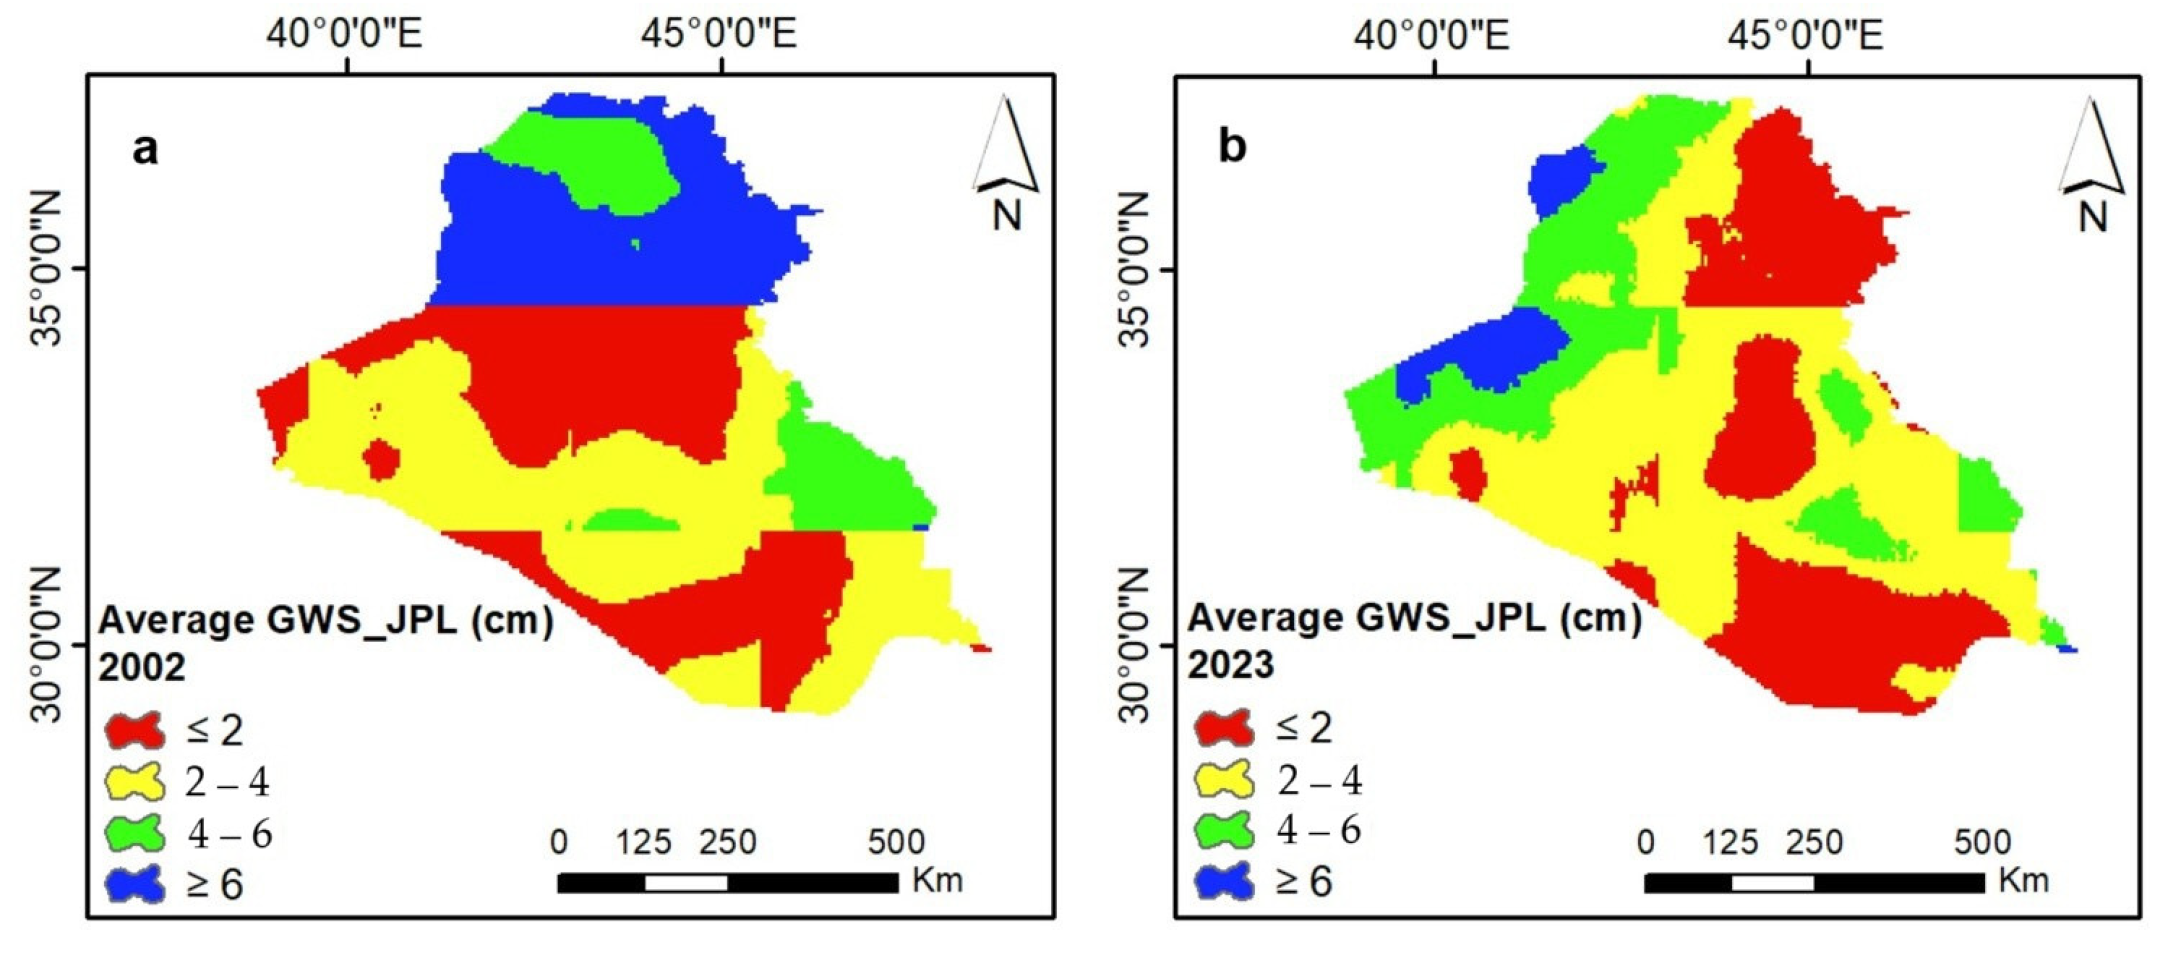
| Class | 2002 | 2023 | ||
|---|---|---|---|---|
| Ratio % | Area (Km2) | Ratio % | Area (Km2) | |
| ≤2 | 31 | 135,950 | 31 | 134,450 |
| 2–4 | 36 | 158,053 | 43 | 189,809 |
| 4–6 | 12 | 51,477 | 21 | 90,375 |
| ≥6 | 21 | 91,592 | 5 | 22,438 |
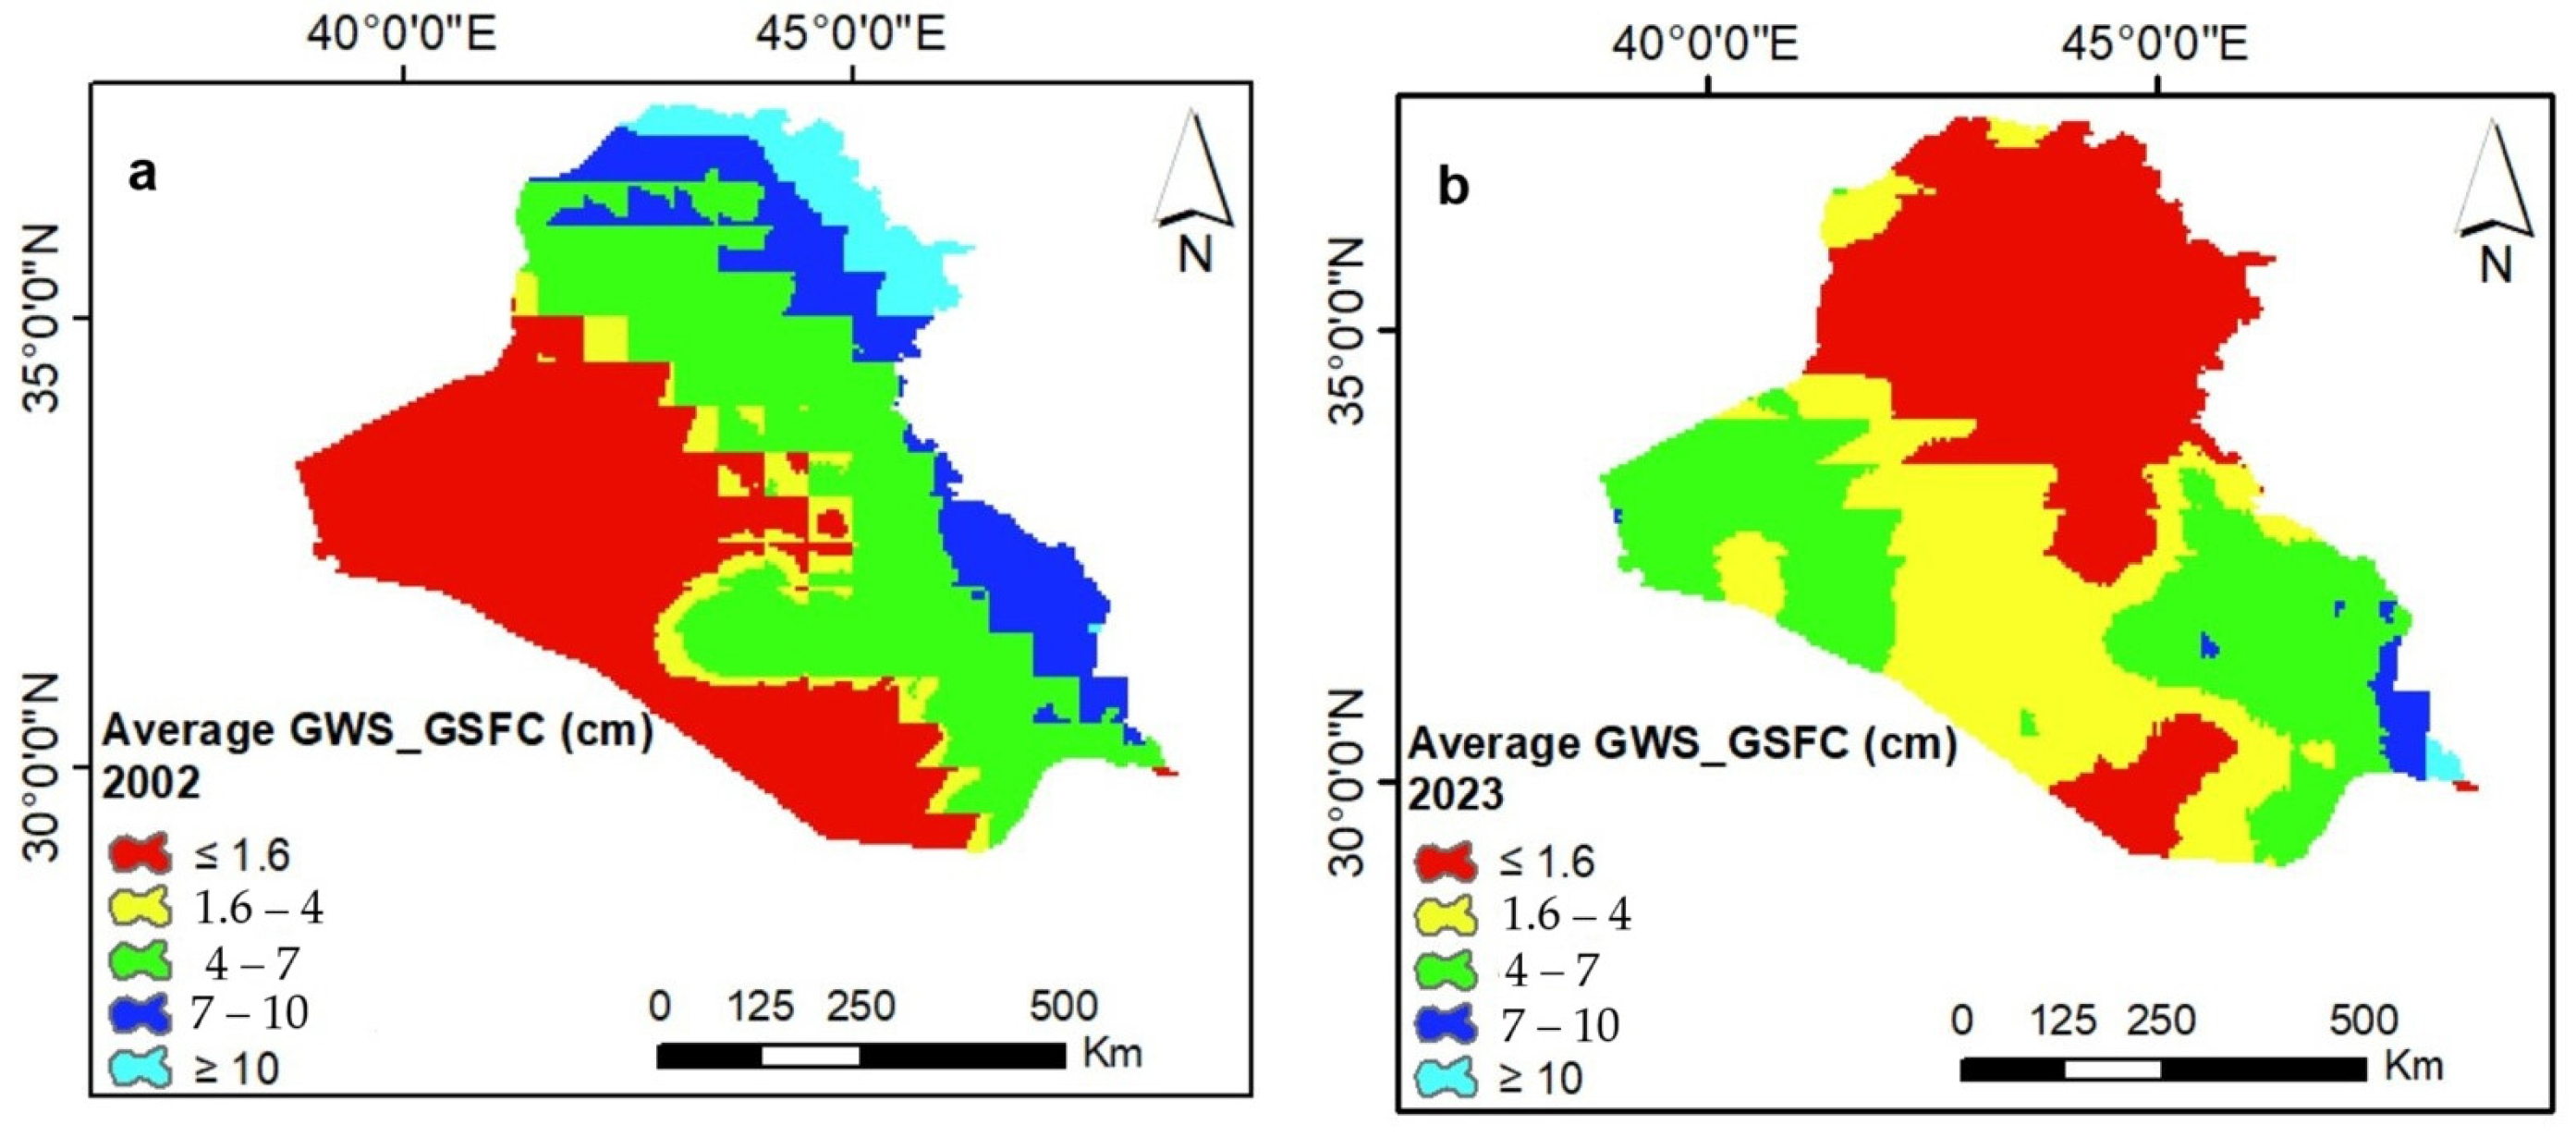
| Class | 2002 | 2023 | ||
|---|---|---|---|---|
| Ratio % | Area (Km2) | Ratio % | Area (Km2) | |
| ≤1.6 | 40 | 174,306 | 38 | 171,098 |
| 1.6–4 | 6 | 27,226 | 30 | 129,791 |
| 4–7 | 35 | 151,143 | 29 | 127,436 |
| 7–10 | 14 | 60,173 | 2 | 7194 |
| ≥10 | 5 | 24,224 | 1 | 1553 |
Disclaimer/Publisher’s Note: The statements, opinions and data contained in all publications are solely those of the individual author(s) and contributor(s) and not of MDPI and/or the editor(s). MDPI and/or the editor(s) disclaim responsibility for any injury to people or property resulting from any ideas, methods, instructions or products referred to in the content. |
© 2025 by the authors. Licensee MDPI, Basel, Switzerland. This article is an open access article distributed under the terms and conditions of the Creative Commons Attribution (CC BY) license (https://creativecommons.org/licenses/by/4.0/).
Share and Cite
Mohammed, H.K.; Alwan, I.A.; Al-Khafaji, M.S. Comparative Analysis of Spatiotemporal Variability of Groundwater Storage in Iraq Using GRACE Satellite Data. Hydrology 2025, 12, 69. https://doi.org/10.3390/hydrology12040069
Mohammed HK, Alwan IA, Al-Khafaji MS. Comparative Analysis of Spatiotemporal Variability of Groundwater Storage in Iraq Using GRACE Satellite Data. Hydrology. 2025; 12(4):69. https://doi.org/10.3390/hydrology12040069
Chicago/Turabian StyleMohammed, Hanan Kaduim, Imzahim A. Alwan, and Mahmoud Saleh Al-Khafaji. 2025. "Comparative Analysis of Spatiotemporal Variability of Groundwater Storage in Iraq Using GRACE Satellite Data" Hydrology 12, no. 4: 69. https://doi.org/10.3390/hydrology12040069
APA StyleMohammed, H. K., Alwan, I. A., & Al-Khafaji, M. S. (2025). Comparative Analysis of Spatiotemporal Variability of Groundwater Storage in Iraq Using GRACE Satellite Data. Hydrology, 12(4), 69. https://doi.org/10.3390/hydrology12040069