Article

Geogenic Contamination of Groundwater in a Highland Watershed: Hydrogeochemical Assessment, Source Apportionment, and Health Risk Evaluation of Fluoride and Nitrate

by
Kashif Alam
1,
Muhammad Nafees
1,
Wajid Ali
2,
Said Muhammad
2 and
Abdur Raziq
3,*
1
Department of Environmental Sciences, University of Peshawar, Peshawar 25120, Pakistan
2
National Centre of Excellence in Geology, University of Peshawar, Peshawar 25130, Pakistan
3
Department of Geography, Islamia College Peshawar, Peshawar 25120, Pakistan
*
Author to whom correspondence should be addressed.
Hydrology 2025, 12(4), 70; https://doi.org/10.3390/hydrology12040070
Submission received: 2 March 2025 / Revised: 21 March 2025 / Accepted: 23 March 2025 / Published: 26 March 2025

Abstract

Groundwater is one of the major sources of freshwater supply for drinking and domestic purposes. This study evaluates the hydrogeochemical processes, groundwater quality for human consumption, associated health risks from fluoride F and nitrate (NO3), and sources of dissolved solutes in a highland watershed in northern Pakistan. Groundwater samples (n = 51) were gathered and analyzed for a range of physicochemical parameters. To evaluate contamination, indices such as the nitrate pollution index (NPI) and fluoride pollution index (FPI) were applied, along with a composite groundwater pollution index to assess overall water quality. The findings revealed that total dissolved solid, turbidity, F, and K+ levels exceeded health-based thresholds in 20%, 1%, 4%, and 2% of samples, respectively. Among the water sources, handpumps were identified as the most contaminated. According to the NPI and composite index, 96% and 92% of the samples did not show significant contamination, respectively. However, the FPI results highlighted that 59% of the samples exhibited low F pollution, while 41% fell under medium pollution levels. While NO3 ingestion posed no notable health risks, F exposure presented significant concerns, with 58.8% of the samples posing risks, particularly for children. The dominant hydrochemical facies were Ca-Mg-HCO3, with the main influence on water chemistry by rock-water interactions and reverse ion exchange processes.

1. Introduction

Groundwater is a crucial resource because it serves as a source of drinking water for 2.5 billion people [1] and provides 40% of the water for crop irrigation [2]. The sustainable management of groundwater is critical for socio-economic development and achieving sustainable development goals [3]. However, this precious resource is imperiled by several factors, including climate change, over-abstraction, and, most importantly, natural and anthropogenic contamination [4,5,6]. Globally, more than 2 billion people currently reside in regions facing high water stress, a number which is projected to increase in the coming years [7,8]. Over 1 billion individuals lack access to clean and safe drinking water, and each year, approximately 3.4 million people die from diseases caused by the use of contaminated water [7]. Therefore, in addition to quantity, groundwater quality is of utmost importance as it is a crucial factor in limiting its use and therefore contributes to water scarcity.
Various issues of contamination have been highlighted by scientific studies worldwide [9,10,11]. Groundwater contaminants may emanate from diffuse sources such as land use for agricultural purposes or point sources such as industry [12,13]. Another important source is the natural geogenic contamination of groundwater with elements such as arsenic (As3+) and fluoride (F). Contaminants such as As3+, F, and NO3 may cause several health-based issues, while others may limit the potability of water and damage water supply systems [9,14].
Hydrogeochemical studies help in understanding the evolution of groundwater through natural settings [10,15,16,17]. Further, elaborating on the mechanisms that may have impacted groundwater chemistry over the years or the changes that may have arisen recently is a key element. These studies also enable envisaging the influence of anthropic activities on water [18,19]. Indexical approaches are effective tools employed by environmental studies to predict the impact of groundwater quality contamination and relay that information in easy-to-understand terms to policymakers, professionals, and the general public [14,20,21]. Various indices are commonly used for water quality assessment, incorporating either single or multiple components. In the case of single-component indices, the effect of an individual contaminant is conveyed, while composite indices combine multiple parameters into a single value, offering a comprehensive evaluation of overall water quality and associated issues and hazards [9,22]. These indices play a crucial role in developing informed policies for the better management and utilization of groundwater sources [23].
Source apportionment is a fundamental aspect of environmental research and plays a pivotal role in understanding the origins of pollutants in water sources [1]. Multivariate statistical techniques, such as correlation and factor analysis, are widely employed to assess the inter-relationships between hydrochemical parameters and identify potential sources of solutes or contaminants in groundwater [24]. Using these methods, researchers can acquire an understanding of the complex dynamics of water quality and inform effective mitigation strategies.
Health-based risks due to water consumption are a grave concern in South and West Asia [11,25]. Several studies have indicated that communities are at risk due to the consumption of groundwater contaminated with NO3 and F [26,27]. This issue is particularly acute in Pakistan, where recent investigations have highlighted the widespread contamination of groundwater and its profound implications for public health [28,29,30]. This study evaluates hydrogeochemical processes, groundwater suitability for human consumption, and health risks associated with exposure to F and NO3 in a highland watershed. It also identifies the sources of dissolved solutes to enhance understanding of groundwater quality dynamics. The study area, the Harunai Stream watershed in the Swat district of northern Pakistan, is characterized by a complex hydrogeological setting where both natural and anthropogenic factors influence groundwater composition. Previous research has documented concerns regarding groundwater contamination in the region [31]; however, no watershed-scale study has systematically assessed groundwater quality, contamination sources, and associated health risks. This study addresses this gap by integrating pollution indices, including the NPI, FPI, and PIG, with spatial distribution mapping and non-cancer risk assessment to evaluate patterns of groundwater contamination. The findings would contribute to groundwater resource management by offering a structured approach to identifying contamination risks and informing mitigation strategies in highland regions where groundwater serves as a primary source.

2. Materials and Methods
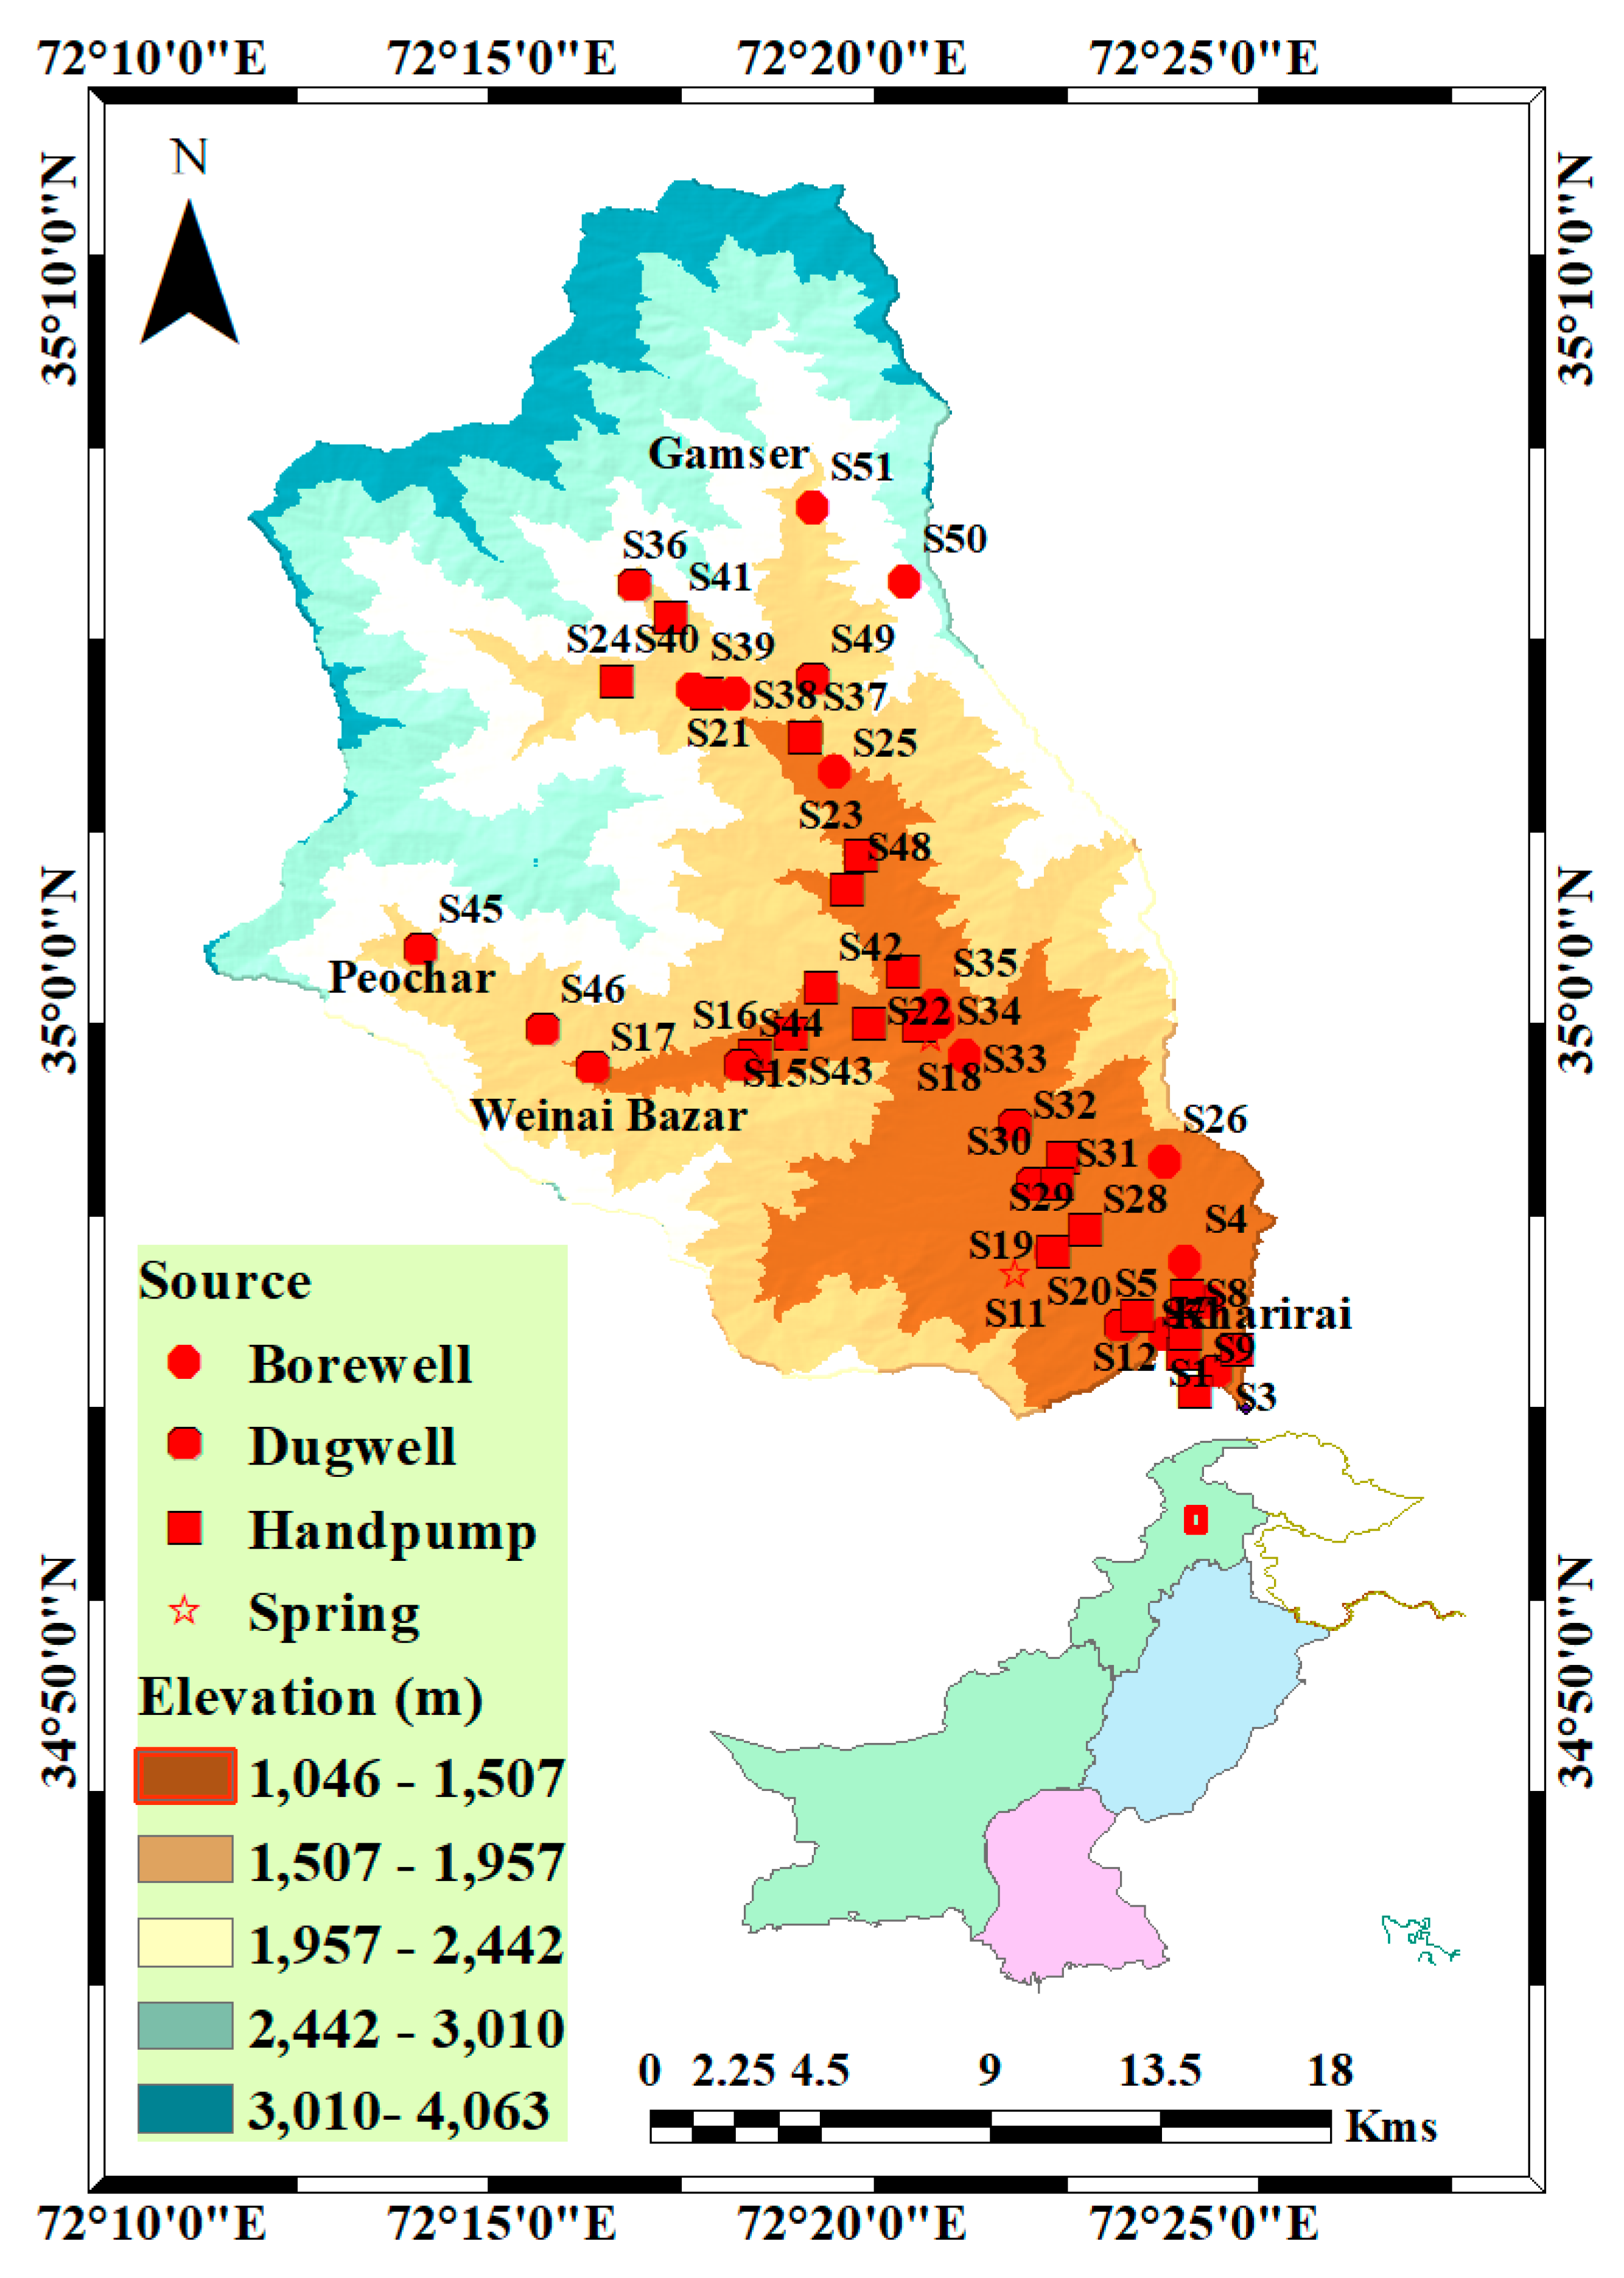
2.1. Study Area

The study area encompasses the Harunai Stream watershed (Figure 1), which acts as one of the primary tributaries of the Swat River. Geographically, it lies in the northwestern region of the Swat District, within northern Pakistan. The main town within the watershed, Matta, is situated approximately 20 km from the central city of Mingora. Covering a total area of 683 km2, the valley is characterized by its rural landscape, with its inhabitants engaged in agriculture, primarily cultivating a variety of crops and vegetables [32]. The elevation in the area ranges from 1046 to 4063 m above MSL, with an annual rainfall of 1050 to 1200 mm and an annual temperature range spanning from −2 °C to 38 °C [32,33]. The reliance on the Harunai Tributary for recharge and irrigation is significant. The local populace is predominantly involved in agriculture; groundwater is mostly extracted from heterogeneous alluvial deposits in the valley. Geologically, the study area consists of rocks from the Chilas complex (mafic–ultramafic rocks) and Kamilla Amphibolite (metamorphic rocks) [34].

2.2. Sample Collection and Laboratory Analysis

Samples (n = 51) were collected from various sources of groundwater, including tube wells, borewells, dug wells, springs, and handpumps, after flushing the source for 20 min. A global positioning system device was used to accurately determine the location of each sampling site. The collected samples were transported to the laboratory within 24 h and refrigerated. Temperature, pH, total dissolved solid (TDS), electrical conductivity (EC), and turbidity (Tur) measurements were carried out on the spot using a portable instrument. For the analysis of other parameters, such as total alkalinity (TA), chloride ( C l ), fluoride (F), nitrates (NO3)-, sulfate (SO42−), total hardness (TH), calcium (Ca2+), magnesium (Mg2+), sodium (Na+), and potassium (K+), standard methods were employed [35]. A comprehensive description of the analyzed parameters and the methodologies employed is provided in Supplementary Information (Table S1). To maintain the accuracy and reliability of the analysis, all instruments were calibrated before use according to the manufacturer’s instructions, blank sample corrections were performed periodically, and only analytical-grade reagents were utilized.

2.3. Indexical Techniques

To predict contamination from N O 3 and its associated risks, a single component index called the nitrate pollution index (NPI) was utilized. The NPI can be estimated using Equation (1) [25].
N P I = ( C s H A V ) H A V
where Cs is the concentration of N O 3 in a given sample, and HAV is the human acceptable value. In this study, a value of 10 mg/L was adopted for HAV following [25,36]. The gradation of the NPIs and their corresponding classifications are given in Supplementary Information (Table S2).
Similarly to NPI, the fluoride pollution index (FPI) was employed to assess the levels of F contamination and its environmental health implications. The FPI is an effective single-component index that enables the assessment of F contamination. The FPI is given by
F P I = W f + W H C O 3 + W N a / C a + W p H N
where Wf, WHCO3, WNa/Ca, and WpH are the weights assigned to the concentration of F , H C O 3 , the ratio of Na+/Ca2+, and pH values, respectively, while N is the total number of parameters. The weightage system of FPI is described in (Table S3). Based on FPI values groundwaters could be classified into low-pollution (1–2), medium-pollution (2–3), and high-pollution (3–4) classes.
Furthermore, to assess the composite effect of water quality indicators, the PIG was utilized. PIG estimations can be performed in five consecutive steps. First, all parameters are assigned a relative weight (RW) based on their supposed impact on water quality and human health [20]. In this study, an RW of 5 was assigned to TDS, Tur, F , S O 4 , and N O 3 . Moreover, Ca2+, Mg2+, and K+ were assigned an RW of 2, while TH and pH were assigned an RW of 3. Similarly, Na+ and TA had RW values of 4 and 1, respectively. The RW was assigned to each parameter after a survey of previously published research [10,37].
After the RW was assigned, the weight parameter (WP), which was the ratio of the RW for each parameter to the sum of the RWs for all the parameters, was calculated:
W P = R W R W
Furthermore, the state of concentration (SOC) is defined as the ratio of the concentration of each parameter to its admissible limit or guideline value:
S O C = C i n Q W Q S
The subindex value (SI) is acquired as the product of WP and SOC:
S I = W P × S O C
Finally, the sum of the SI values provides the PIG value that could be used to grade groundwater according to pollution class:
P I G = S I
The gradation according to the PIG values is given and explained in Supplementary Information (Table S4) [38].

2.4. Hydrogeochemical Evaluation

The ion exchange processes play a major role in shaping groundwater chemistry [39]. The determination of the chloro-alkaline indices (CAIs) I and II is an effective way of identifying these processes (Equations (7) and (8)).
C A I 1 = C l ( N a + + K + ) C l
C A I 2 = C l ( N a + + K + ) C O 3 2 + S O 4 2 + H C O 3 + N O 3
A negative CAI value suggests forward ion exchange; on the other hand, reverse ion exchange is indicated by positive values. A value of zero may indicate that cations are not exchanged and that the groundwater is in an equilibrium state with the aquifer [40].

2.5. Health Risk Assessment

Two age groups were selected for non-carcinogenic health risk assessment (children aged 6 years and adults aged 66 years) based on oral exposure to F and N O 3 . The methodology for the general risk assessment of these toxins was adopted from the United States Environmental Protection Agency. The first step was to estimate the chronic daily (mg/kg-d) intake for both age groups using Equation (9):
CDI = C × IR × AL × EF MBW × ED
In the above equation, C is the concentration of F and N O 3 in mg/L, IR is the water ingestion rate (2l/day), AL is the average lifetime (6 for children and 66 for adults), EF is the exposure frequency (365 days/year), and MBW is the mean body weight (18.8 kg for children and 66 kg for adults). The mean body weights and ALs were derived from a dataset published by the Pakistan Medical Health Research Council [41].
Furthermore, the non-carcinogenic risk posed by contaminants could be assessed using the hazard quotient (HQ), which is the ratio of the CDI to the reference dose (RfD mg/kg-day) of a given contaminant:
HQ = CDI RfD
The RfD for F and N O 3 in this study were 0.06 mg/kg-d and 1.6 mg/kg-d, respectively [42]. HQ values > 1 suggest that the particular contaminant poses non-carcinogenic risks to the given population.

2.6. Statistical Analysis

Spearman rank correlation analysis was performed to assess the degree of monotonic relationship between the parameters. Factor analysis with varimax rotation was performed to decompose the dataset into rotated components after log-normal transformation to facilitate source apportionment based on the acquired associations. Furthermore, hierarchical agglomerative cluster analysis was performed to assess the hydrochemical similarities and/or differences between different sample points. R software version 4.2.1 was used for statistical analysis and visualization. The Piper diagram was plotted in Python 3.11 using the package wqchartpy [43]. Spatial distribution mapping was performed using the inverse distance-weighted technique in ArcMap 10.3.

3. Results

3.1. General Description

Table 1 summarizes the results of the water quality analysis. The pH values indicated that water is slightly acidic to alkaline in nature, ranging between 6.8 and 8.3 (mean 7.5 ± 0.4), while the temperature (T) measurements ranged from 2.5 to 21.1 (17.9 ±2.6 °C), showing considerable variations across the area. The total dissolved solids (TDSs) and electrical conductivity (EC) of the dissolved constituents in water significantly varied, ranging from 123.7 to 1070 mg/L (449 ± 161 mg/L) and from 250 to 2146 (894 ± 308 µS/cm), respectively. The lowest and highest values for TDS and EC were recorded in the S21 (Biha) and S9 (Bar Sherpalam) areas, respectively. In the case of TDS, only 10 (20%) of the samples surpassed the 500 mg/L health-based guideline value established by USEPA, while only one sample (S9) surpassed the 1000 mg/L value [44]. Similarly, turbidity (Tur) showed great variation across the area, ranging from 0.2 to 6.0 (mean 1.4 ± 1.1 NTU). The highest and lowest turbidity values were recorded at the S44 (Bar Shawer) and S13 (Wainai) sampling points, respectively. Only one sample (2%, S44) of the total surpassed the five NTU limit [44], showing lower concerns of Tur-related risks. Likewise, the F concentration also showed considerable variations across the area spanning from 0.12 to 3.2 (mean 0.8 ± 0.6 mg/L). The highest and lowest concentrations of F were recorded for S16 (Koz Shawer) and S47 (Koza Bamakhel), respectively. In this case, only two samples (S25 and S47) located in the Labat and Koza Bamakhel areas violated the 1.5 mg/L health-based guideline values [44].
Furthermore, the TH measurements ranged from 84 to 805 (mean 299 ± 137 mg/L), indicating different degrees of hardness in the region. The lowest and highest values of TH were observed at S50 (Mandal Dag) and S7 (Pirkalay), respectively. The rest of the samples (16%, n = 8) were classified as hard (TH = 121–180 mg/L) or moderately hard (2%, TH = 61–120 mg/L) water. The Ca2+ and Mg2+ levels ranged from 20 to 212 (104 ± 51.6 mg/L) and from 48.8 to 652 (198 ± 106), respectively.
Moreover, Cl and TA varied from 23 to 178 (68.2 ± 37.7 mg/L) and from 115 to 378 (235 ± 78.8 mg/L), respectively. The NO3 levels were low (mean 4.8 ± 2.9 mg/L) but varied widely (0.9–13.0 mg/L), with the highest at S35 (Chamanlalai) and the lowest at S21 (Biha). The majority of the samples showed values lower than the health-based guideline values [44], except for S21 and S31, which had values above the 10 mg/L threshold limit, maintained by some [36] as an acceptable value for safe human consumption. Additionally, the SO42, K+, and Na concentrations ranged from 15 to 82 (mean 48 ± 15 mg/L), 1 to 23 (mean 2.5 ± 3.4 mg/L), and 3 to 89 (mean 26.8 ± 22.2 mg/L), respectively. All values for SO42− and Na+ were within the limits and did not pose any concern. However, in the case of K+, only one sample (S47, Koz Bamakhel) was above the guideline value (12 mg/L).

3.2. Comparison Between Sources

Table S5 compares water quality across sources based on mean values. The pH varied slightly, being highest in the borewells (7.55) and lowest in the springs (7.35), while temperature peaked in the springs (19.0 °C) and was the lowest in the borewells (16.9 °C). Handpumps had the highest TDS (482 mg/L) and EC (951 µS/cm), whereas the springs recorded the lowest values (TDS = 370 mg/L, EC = 745 µS/cm). Turbidity was highest in the handpumps (1.67 NTU) and lowest in the dug wells (1.06 NTU). The handpumps also exhibited the highest mean values for TA, TH, Ca2+, Mg2+, NO3, SO42, and K+, while the dug wells had the lowest for TH, K+, Ca2+, Mg2+, and SO42. The borewells had the highest F (0.85 mg/L) and lowest Cl (62 mg/L), whereas the dug wells had the lowest F (0.6 mg/L) and highest Cl (79.6 mg/L). Na+ was most concentrated in the borewells (32.2 mg/L) and least in the springs (19 mg/L).

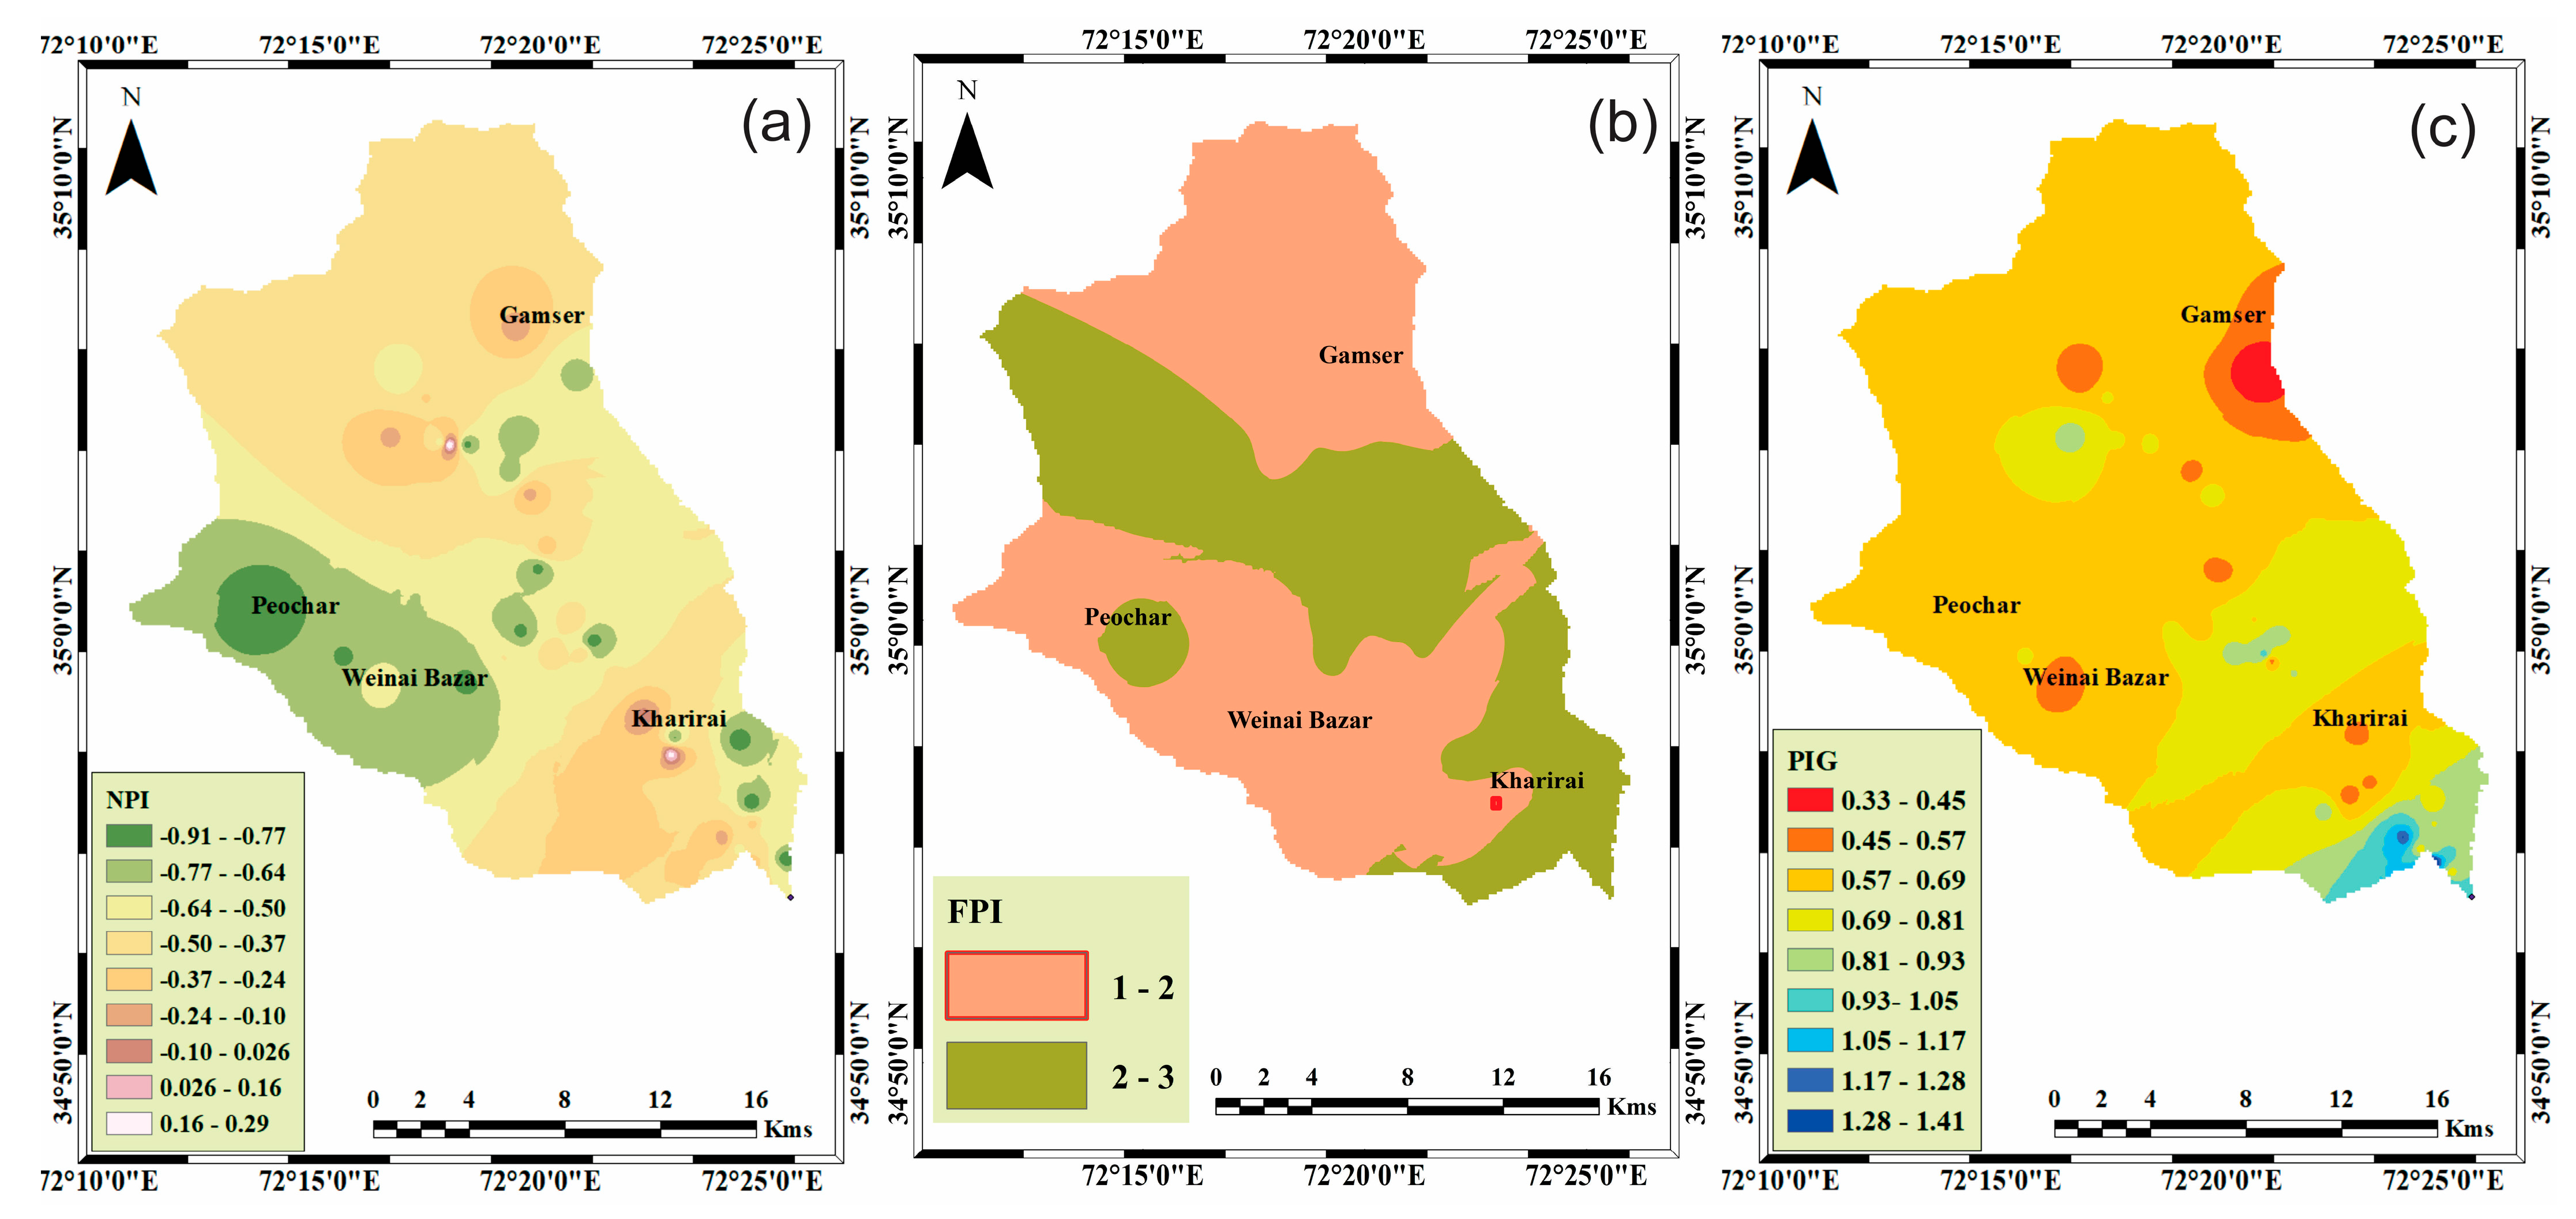
3.3. Indexical Approach

The results of the nitrate pollution index (NPI) estimations are depicted in Figure 2a. The NPI in the study area ranged from −0.91 to 0.29 (−0.51 ± 0.04). Based on the NPI classification given in Supplementary Information (Table S2), 96% (n = 49) of the samples was classified as clean, while only 4% (n = 2) was considered lightly polluted with NO3. The FPI values in the area ranged from 1.5 to 2.75 (2.04 ± 0.32). Based on the FPI values, the bulk of the samples (59%) in the study area was categorized in the low-pollution category (FPI = 1–2), while the rest of the samples (41%), suggested medium pollution (FPI = 2–3), indicating potential risks of F-based health ailments, as illustrated in Figure 2b. The results of the pollution index of groundwater (PIG) are presented in Figure 2c. The PIG values in the study area ranged from 0.33 to 1.41 (0.73 ± 0.03), indicating different levels of contamination. The classification of the samples based on the PIG values is shown in Supplementary Information (Table S4). The majority of the samples (92%) in the study area showed insignificant pollution, while only 6% and 2% of the samples showed low and moderate pollution, respectively.

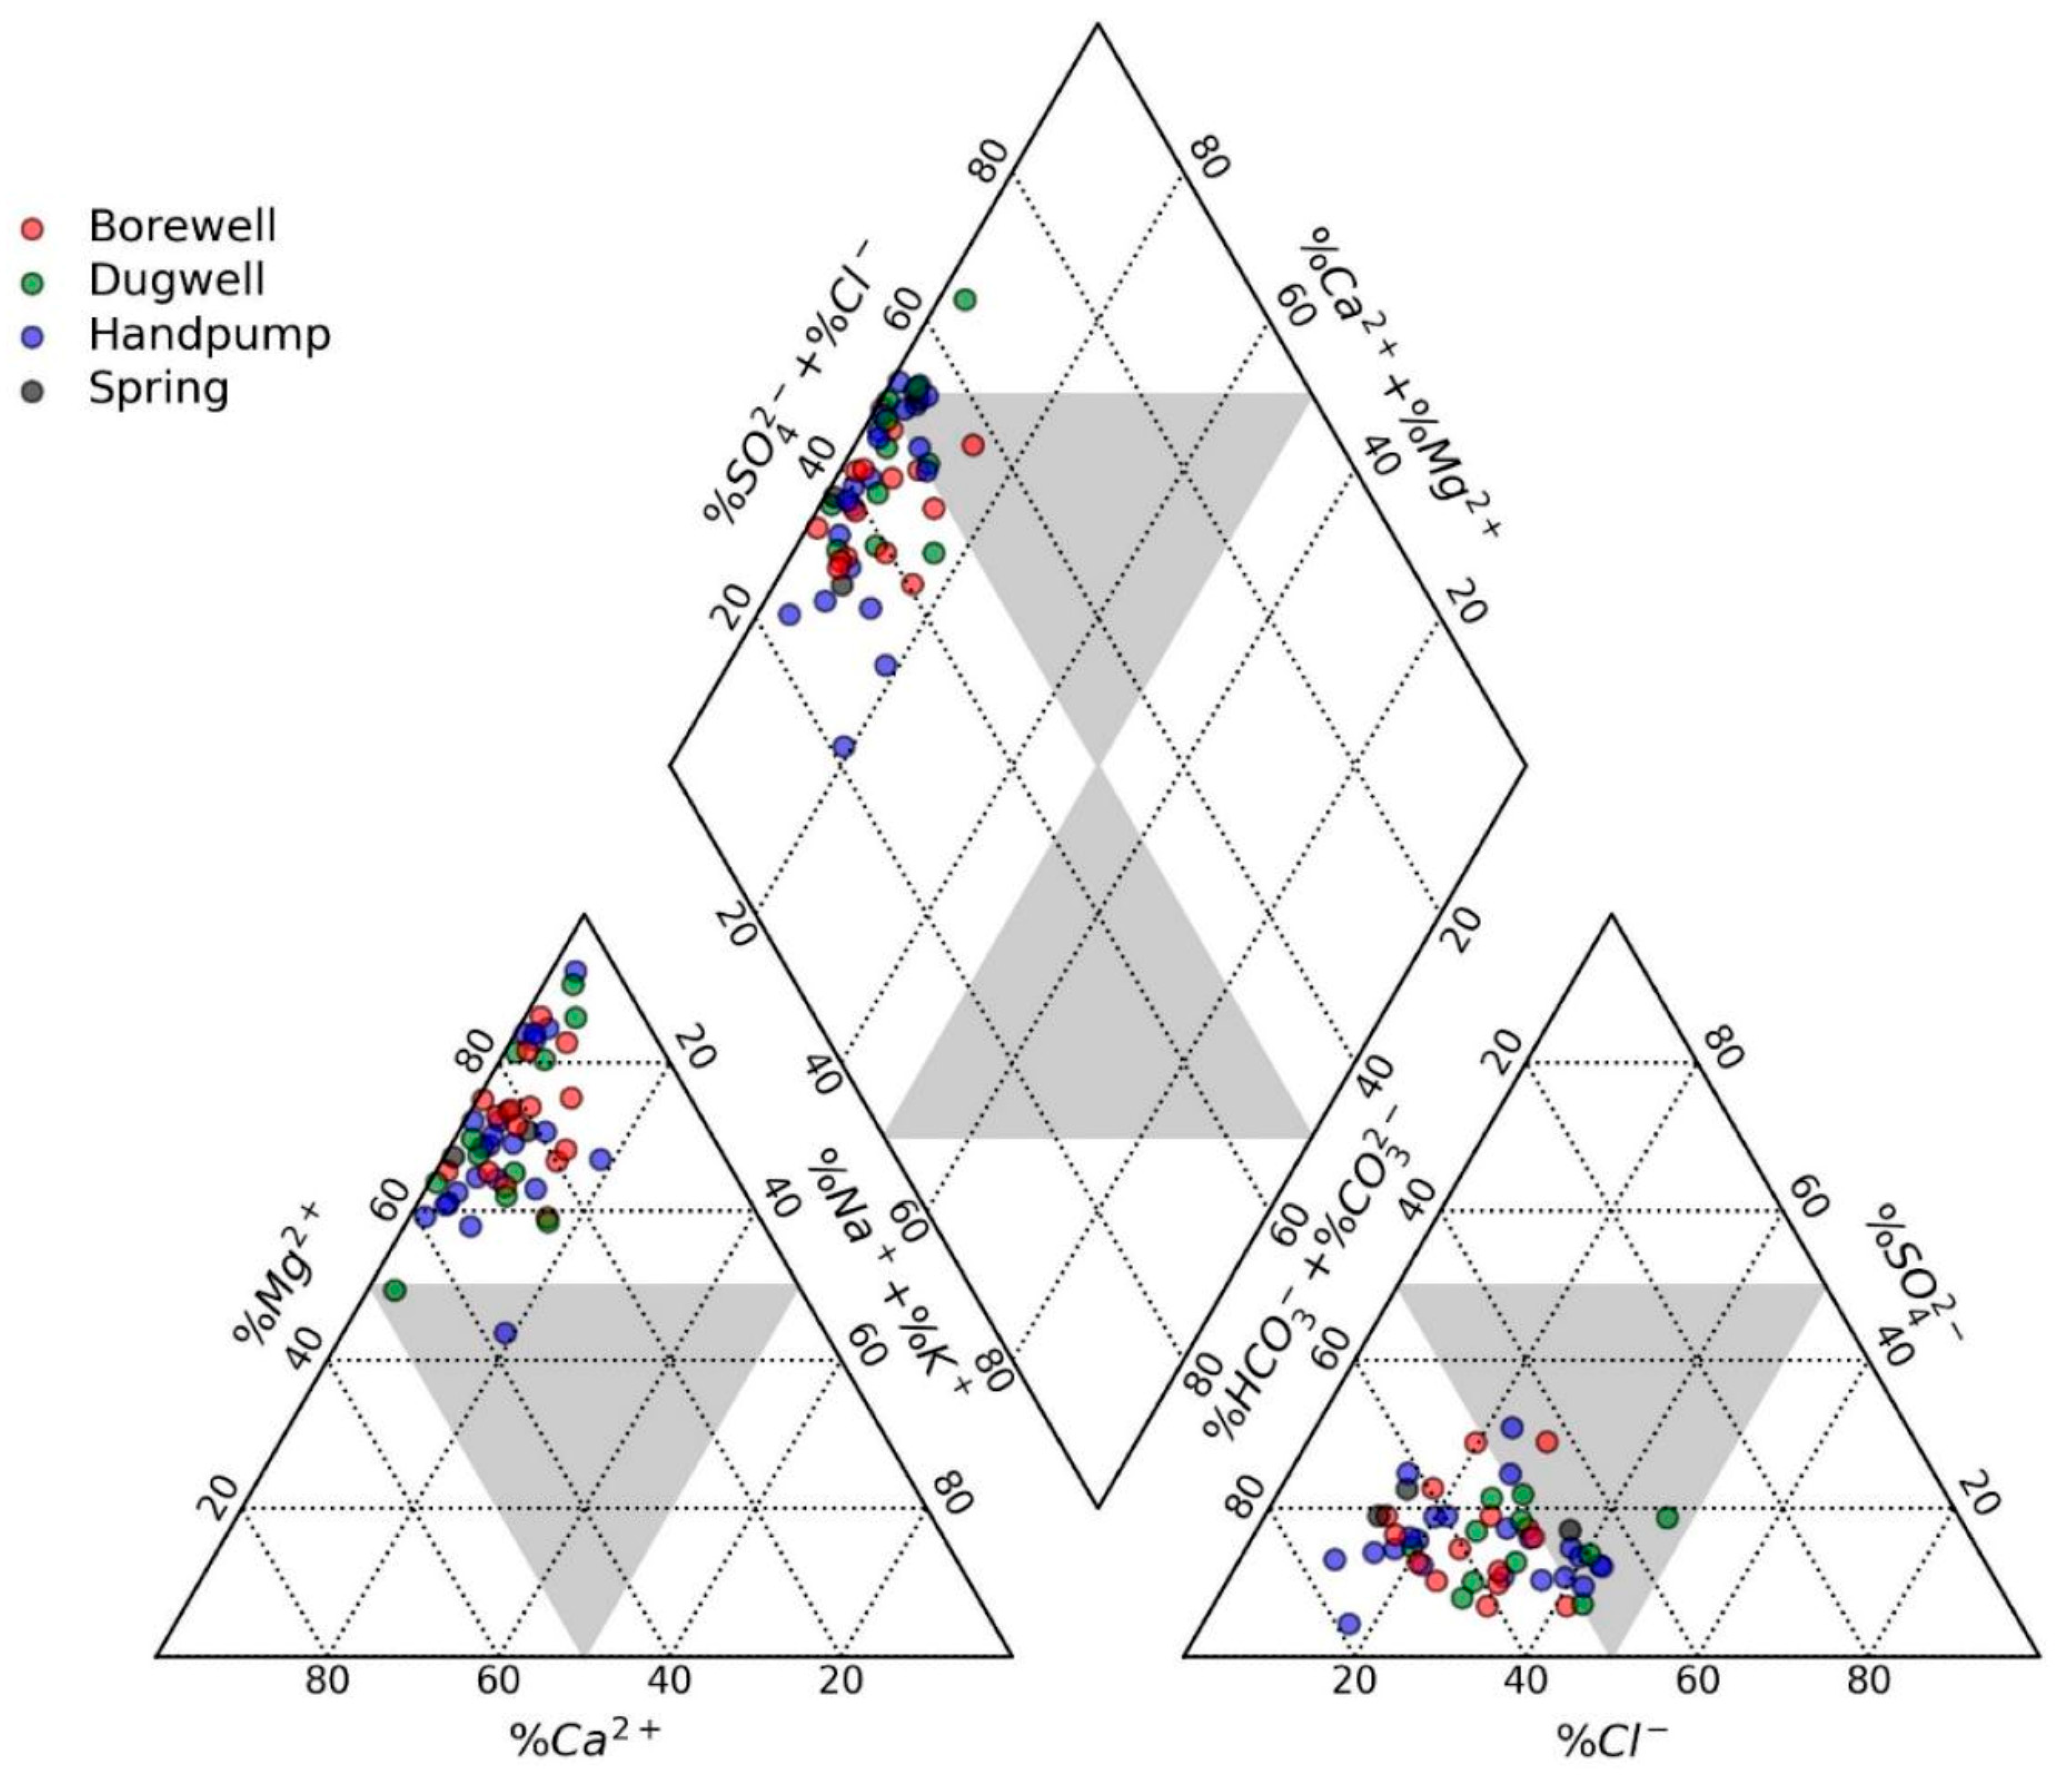
3.4. Hydrogeochemical Evolution

To determine the hydrochemical evolution of groundwater, the Piper diagram was employed [45]. Groundwater samples were plotted to illustrate the hydrogeochemical characteristics based on major cations and anions in the diagram (Figure 3). The relative dominance of cations is indicated by the triangle on the left hand. The results showed that Mg2+ was an abundant cation, followed by the mixed type; however, none of the samples were observed to be dominated by Na+ + K+. Similarly, the relative abundance of anions is shown in the triangular plot situated on the right. It was observed that HCO3 was the most abundant anion, with a few samples in the mixed-type zone. Furthermore, from the diamond plot used to infer the hydrochemical facies of the waters, it could be assumed that the dominant facies in the study area were of Ca-Mg-HCO3 type, followed by the Ca-Mg-Cl-SO4 type.
Furthermore, to examine the primary mechanisms influencing groundwater chemistry in the area, the Van Wirdum diagram was utilized (Figure 4a). The Van Wirdum diagram evaluates groundwater chemistry by collating it with four end members, i.e., the lithocline (LT: Ca-rich groundwater influenced by rock-water interactions), atmoline (AT: atmospheric influence), thalassocline (influence of brines), and monocline (Rh) water influenced by human impact [46]. The groundwater predominantly indicated that rock-water interactions were the primary mechanism influencing its nature, as most of the sample points were clustered around the LT [47]. However, it could be observed that the rest of the samples extended from the LT toward the Rh end member along the mixing line, indicating a longer residence time, mixing, and alterations along the flow path. Only three samples were found closer to the Rh end member, suggesting a relatively greater human impact. All these samples had a relatively higher concentration of NO3 than the other samples.
Additionally, the results of chloro-alkaline indices employed in this study are depicted in Figure 4b. The CAI-I ranged from −3.86 to 0.95 (mean 0.18), while the CAI-II varied from −0.81 to 0.85 (mean 0.13), indicating varied conditions. However, the bulk of the samples (n = 38, 75%) had values > 0, indicating that reverse ion exchange was the dominant process. The rest of the samples (25%) showed forward ion exchange.

3.5. Impacts on Health

The results of the health risk assessment are provided in Table 2. The CDI values for adults’ ingestion of NO3 ranged from 2.64 × 10⁻² to 1.38 × 10⁻¹ (mean 1.46 × 10⁻¹ mg/kg-d), suggesting lower daily intakes. However, the CDI values for children varied greatly over the area, ranging from 9.26 × 10⁻² to 1.38 × 100 (mean 5.13 × 10⁻¹ mg/kg-d), indicating varied levels of exposure. Similarly, the HQ values for adults ranged from 1.65 × 10⁻² to 2.46 × 10⁻¹ (mean 9.14 × 10⁻²), while those for children ranged from 5.78 × 10⁻² to 8.64 × 10⁻¹ (mean 3.21 × 10⁻¹). An HQ value above one suggested health risks to the given population.
Furthermore, the CDI for F oral intake in adults varied from 3.64 × 10³ to 9.70 × 10⁻² (mean 2.40 × 10⁻² mg/kg-d), while for children, it ranged from 1.28 × 10⁻² to 3.40 × 10⁻¹ (mean 7.98 × 10⁻² mg/kg-d). Likewise, children’s exposure to F via oral intake slightly exceeded that of adults. The HQ values calculated to assess health risks via F ingestion in adults ranged from 6.06 × 10⁻² to 1.62 × 100 (mean 3.82 × 10⁻¹, mg/kg-d), showing greater variation. In comparison, the HQ values for children ranged from 2.13 × 10⁻¹ to 5.67 × 100 (mean 1.34 × 100, mg/kg-d), showing extreme variations and indicating greater health risks.

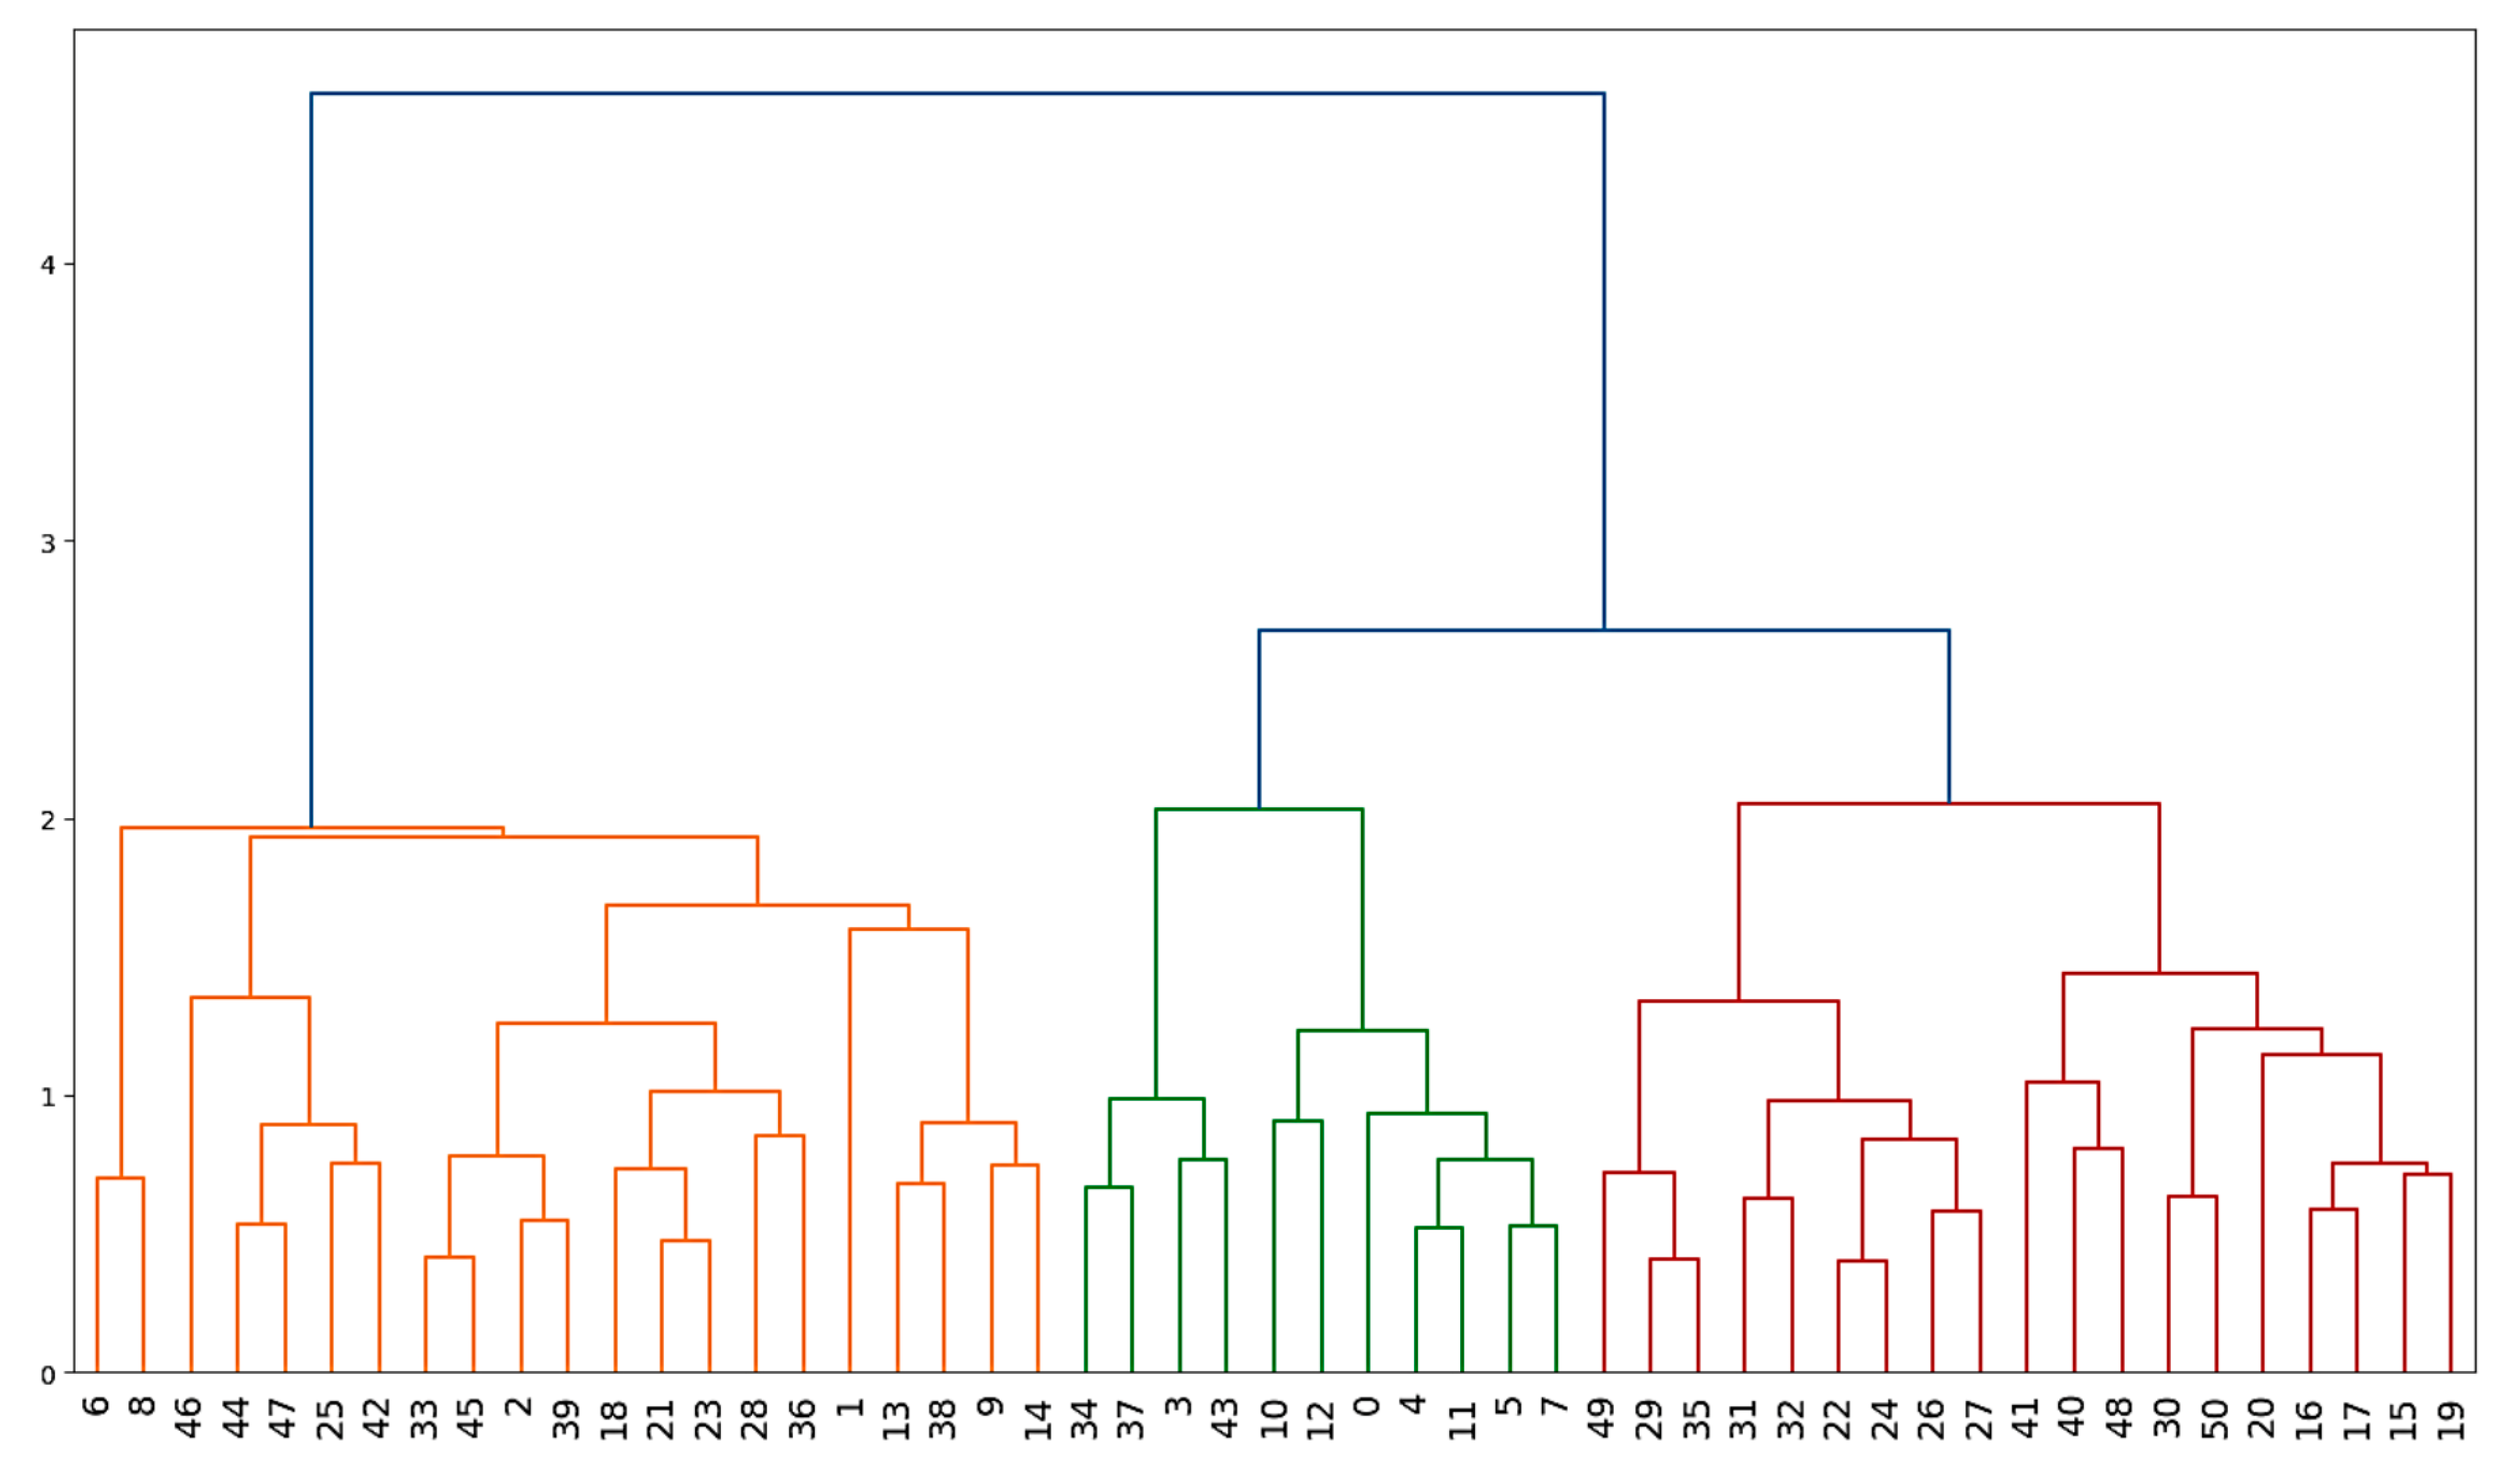
3.6. Cluster Analysis

An agglomerative hierarchical clustering analysis (HCA) technique with Euclidean distance and Ward linkages was used to cluster the sampling points based on hydrochemical similarities (Figure 5). The optimal number of clusters was obtained using the majority rule [48]. The HCA partitioned the dataset into three clusters (CI, CII, and CIII). The majority of the samples (n = 21) were clustered in CI, followed by CIII (n = 19), while CII had the lowest proportion of samples (n = 11).

4. Discussion

All parameters exhibited considerable variation across the area, suggesting variable water quality and localized influences. In general, most parameters remained within acceptable limits for potable water; however, a few samples exceeded regulatory thresholds for turbidity and TDS. Among the water quality indicators, fluoride (F) demonstrated the greatest variability, with concentrations ranging from deficient to excessive levels, highlighting potential health implications for both deficiency and overexposure. The mean F concentration in this study was far lower in comparison to a value obtained for the Khyber-Pakhtunkhwa province (1.8 ± 0.4 mg/L) [49]. F is also essential for dental growth among children, and lower values (<0.5) may result in dental caries and lower bone health [50]. The results obtained in this investigation indicated that 41% of the samples in the area had deficient concentrations of F and may pose health risks, especially for children.
Total hardness (TH) emerged as a significant concern for groundwater potability in the study area. A substantial proportion of the samples (82%, n = 42) were categorized as very hard (TH > 180 mg/L), indicating potential challenges related to water palatability and household use [51]. The remaining samples were classified as hard (16%, n = 8; TH = 121–180 mg/L) or moderately hard (2%; TH = 61–120 mg/L). The high prevalence of very hard water suggests potential implications for scaling in plumbing systems and adverse consumer acceptability [51].
Further multiple groundwater sources, including springs, handpumps, borewells, and tube wells, were examined. Variations in source depth influenced susceptibility to contamination, with shallower sources being more prone to pollution due to their closer interaction with surface activities and potential contaminant infiltration [52]. In general, the majority of the contaminants showed relatively higher mean values in handpump water, suggesting greater vulnerability to contamination. These results corroborate the findings of earlier studies conducted elsewhere [53].
The NPI was used to assess the levels of pollution caused by the NO3 concentration in the water. The NPI is a useful single-component tool that helps in the identification of contaminated samples beyond acceptable values [25]. The specific locations highlighted by the spatial distribution in the map (Figure 2a) may indicate the presence of local sources of contamination resulting in higher NO3 concentrations. Though the NPI values in the study suggested lower levels of contamination, these zones may need special attention in terms of preventative measures, as contamination may increase with the increase in agricultural activities and population.
Further, to envisage the pollution levels and potential risks posed by F concentrations in the area, FPI was used. The spatial distribution of FPI (Figure 2b) suggested that the areas of concern in terms of F pollution were Peochar in the west of the study area, along with the study area’s central, southern (Kharirai), and southeastern regions. This could be attributed to local geological influences, such as rocks with F-bearing minerals.
The PIG proposed by [38], on the other hand, provides an overview of contamination and associated risks by analyzing the composite effect of all the parameters [38]. The spatial distribution map (Figure 2c) shows that the areas exhibiting low-to-moderate contamination mostly occupy the lower regions of the watershed. This could be due to the accumulation of solutes near the mouth of the watershed, along the flow path.
The dominant facies in the study area was the Ca-Mg-HCO3 type, evolving along the flow path into the Ca-Mg-Cl-SO4 type. The dominance of Mg2+ over other cations in the study suggested a significant influence of mafic–ultramafic rock interactions with groundwater, likely due to the weathering and dissolution of Mg-bearing minerals [54]. Moreover, the ion exchange processes examined in this study by utilizing the chloro-alkaline indices either suggested the loss of Na+ + K+ or the subsequent gain of Ca2+ + Mg2+ from the aquifer media and vice versa (Equations (9)–(12)) [10]. In the former case, the process is called reverse ion exchange, while in the latter, it is called forward ion exchange [40]. The chloro-alkaline indices suggested that groundwater was mainly losing Na+ + K+ to the aquifer media while gaining Ca2+ + Mg2+. On the other hand, the rest of the samples (n = 13, 25%) exhibited an interchange of alkaline earth metals (Ca2+ and Mg2+) in the water with alkalis in the aquifer media. To further elaborate on the mechanism, the governing Equations (11)–(14) of the processes discussed above are as follows:
Ca 2 + + ( K 2 )   Na 2 clay   ( 2 K )   2 Na + +   Ca clay
Mg 2 + + ( K 2 )   Na 2 clay   ( 2 K )   2 Na + +   Mg   clay
( 2 K )   2 Na + +   Ca clay     Ca 2 + + ( K 2 )   Na 2 clay
( 2 K )   2 Na + +   Mg clay     Mg 2 + + ( K 2 )   Na 2 clay
Health risk assessments for adults and children were carried out based on the NO3 and F concentrations in groundwater [49]. Based on the results, it was surmised that exposure to NO3 did not pose health risks to either adults or children. However, only two samples (S25 and S47) had HQ values > 1, suggesting F-based health risks to adults in the area. Both of these samples belong to the Labat and Koza Bamakhel areas, which are located in the southeastern regions of the watershed. Further, a total of 30 samples (58.8%) had HQ values > 1, indicating potential health risks to children due to F ingestion. F exposure may cause a variety of health-related issues, including arthritis, bone damage, osteoporosis, and dental and skeletal fluorosis [55]. Immediate action is therefore required to safeguard communities from F-related health hazards.
Positive correlations (Figure 6) were observed between TDS-EC (0.93), Ca2+-TH (0.74), Mg2+-TH (0.91), Na+-TDS (0.6), Na+-EC (0.57), Na+-F (0.68), and Na+-K+ (0.58). In this study, correlation coefficients of 0.5–0.7 were interpreted as moderate correlations, whereas correlation coefficients above 0.7 were considered strong correlations. A strong positive correlation between TDS-EC, Ca2+-TH, and Mg2+-TH suggests that similar sources and processes influence these parameters in groundwater [55]. This may also suggest the major contribution of Mg2+ over Ca2+ to TH in the study area. Moreover, moderate correlations observed for Na+-TDS, Na+-EC, Na+-F, and Na+-K+ suggest that the interplay of sources and processes influences their concentrations [56].
Furthermore, factor analysis with varimax rotation was carried out to apportion sources of solutes in groundwater based on their associations [57] (Table 3). Before factor analysis, parallel analysis was carried out to obtain an optimal number of factors. The Kaiser–Meyer–Olkin (KMO) index obtained in this study was 0.6, indicating moderate sampling adequacy for factor analysis. Similarly, Bartlett’s test of sphericity was highly significant (p < 0.0001), confirming that the correlation matrix was not an identity matrix and that factor analysis was appropriate for the dataset [58]. Factor analysis divided the dataset into three distinct rotated components, explaining approximately 75% of the total variance. RC1 (30%) was strongly loaded with TDS, EC, F, K+, and Na+. Comparatively, RC2 (25%) was represented by strong loadings of TH, Ca2+, Mg2+, Cl, and TA. Similarly, RC3 (20%) was dominated by T, SO42−, and pH, while a strong negative loading was observed for Tur. The RC1 (the silicate mineral dissolution factor) had strong loadings for TDS, EC, F, K+, and Na+, while negative loadings of NO3 and SO42−, and marginal loadings of other parameters suggested that this component could be attributed to silicate mineral weathering.
RC2 (the mixed factor) carried strong loadings for TH, Ca2+, Mg2+, Cl, and HCO3, while it exhibited marginal and weak loadings for turbidity and NO3. However, the loadings for both turbidity and NO3 were the highest compared to the other components, indicating minimal contributions from other sources such as agriculture or erosion. Moreover, the negative loading of F and the strong positive loading of Ca2+ in RC2 could be used to deduce an inverse relationship between F and Ca2+, suggesting the association of high F concentrations in water with low Ca2+ contents [59,60]. It may therefore be concluded that groundwater in the study area is more influenced by natural and geogenic processes than by anthropic factors. Factor RC3, with strong loadings for T, SO42−, and pH and a strong negative loading for turbidity, suggested different hydrogeochemical processes mainly impacted by the T and pH of the water, responsible for the SO42− variations in the groundwater in the area.
The agglomerative hierarchical clustering algorithm is a commonly employed tool for partitioning sample points based on their hydrochemical similarities [61]. In terms of comparisons between mean values (Table 4), significantly high values for TDS, EC, TH, Ca2+, Mg2+, FPI, and PIG were recorded for CIII, suggesting higher contamination levels. Meanwhile, the mean values for Cl and HCO3 in CI were significantly greater than those in the other groups. The difference between the means of the rest of the parameters across the clusters was not statistically significant. Further, the clusters showed hydrochemical homogeneity; however, the clusters lacked spatial homogeneity, suggesting local sources and processes impacting the chemistry of groundwater in the area [62].

5. Conclusions

This study examined hydrogeochemical characteristics, groundwater suitability, and potential sources of contaminants using hydrochemical techniques, indices, and multivariate statistics. TDS, Tur, F, and K+ exceeded the health-based limits in 20%, 1%, 4%, and 2% of the samples, respectively. A majority of the samples (82%) were classified as very hard, indicating potential water potability issues. Comparing the parameters across the various sources investigated in this study revealed that handpumps were the most contaminated, while dug wells and springs had lower contamination levels. The NPI analysis conducted to assess contamination and potential risks from NO3 concentrations showed that 96% of the samples could be considered clean. Additionally, the FPI analysis indicated that 59% and 41% of the samples demonstrated low and medium pollution related to F concentrations, respectively. The PIG, a composite index, was utilized to evaluate the cumulative impact of parameters on the water quality. The results showed that 92% of the samples exhibited insignificant pollution in relation to environmental standards. Further health risk assessments were performed for NO3 and F concentrations for two age groups: children and adults. For NO3, no health-based risks were anticipated for either age group; however, F concentrations indicated that 58.8% of the samples presented health-based threats to children. The dominant hydrogeochemical facies in the study area was Ca-Mg-HCO3, followed by Ca-Mg-SO4-Cl. Rock-water interactions and reverse ion exchange are the dominant processes influencing groundwater geochemistry, with minimal influence from human impact. Among the three clusters identified by the agglomerative hierarchical clustering algorithm, CIII was the most contaminated. Future studies should assess heavy metal loads and organic contaminants in water and incorporate advanced geochemical techniques for the source apportionment of contaminants.

Supplementary Materials

The following supporting information can be downloaded at https://www.mdpi.com/article/10.3390/hydrology12040070/s1.

Author Contributions

K.A., data curation, fieldwork, laboratory analysis, data analysis, and writing of the original draft; M.N., conceptualization, supervision, technical guidance, and methodology; W.A., conceptualization, co-supervision, methodology, visualization, and writing, review, and editing; S.M., methodology, visualization, writing, review, and editing; and A.R., writing, review, and editing, technical guideline, visualization, and methodology. All authors have read and agreed to the published version of the manuscript.

Funding

This research received no external funding.

Data Availability Statement

The raw data supporting the conclusions of this article will be made available by the authors upon request.

Acknowledgments

The authors acknowledge the National Center of Excellence in Geology, University of Peshawar, the Department of Environmental Sciences, University of Peshawar, and the Department of Geography, Islamia College Peshawar.

Conflicts of Interest

The authors declare no conflicts of interest.

References

  1. Yadav, P.; Sreekesh, S.; Nandimandalam, J.R. Groundwater Quality and Its Suitability in the Semi-Arid River Basin in India: An Analysis of Hydrogeochemical Processes Using Multivariate Statistics. Environ. Model. Assess. 2025, 1–22. [Google Scholar]
  2. Gleeson, T.; Cuthbert, M.; Ferguson, G.; Perrone, D. Global Groundwater Sustainability, Resources, and Systems in the Anthropocene. Annu. Rev. Earth Planet. Sci. 2020, 48, 431–463. [Google Scholar] [CrossRef]
  3. Lall, U.; Josset, L.; Russo, T. A Snapshot of the World’s Groundwater Challenges. Annu. Rev. Environ. Resour. 2020, 45, 171–194. [Google Scholar] [CrossRef]
  4. Lapworth, D.J.; Boving, T.B.; Kreamer, D.K.; Kebede, S.; Smedley, P.L. Groundwater Quality: Global Threats, Opportunities and Realising the Potential of Groundwater. Sci. Total Environ. 2022, 811, 152471. [Google Scholar]
  5. Mukherjee, I.; Singh, U.K. Hydrogeochemical Characterizations and Quality Evaluation of Groundwater in the Major River Basins of a Geologically and Anthropogenically Driven Semi-Arid Tract of India. Sci. Total Environ. 2022, 805, 150323. [Google Scholar] [CrossRef]
  6. Sekar, S.; Surendran, S.; Roy, P.D.; Kamaraj, J. Groundwater Geochemistry and Irrigation Suitability in the Semi-Arid Melur Block of Madurai District, South India. Environ. Earth Sci. 2025, 84, 139. [Google Scholar] [CrossRef]
  7. Tzanakakis, V.A.; Paranychianakis, N.V.; Angelakis, A.N. Water Supply and Water Scarcity. Water 2020, 12, 2347. [Google Scholar] [CrossRef]
  8. Wang, M.; Bodirsky, B.L.; Rijneveld, R.; Beier, F.; Bak, M.P.; Batool, M.; Droppers, B.; Popp, A.; van Vliet, M.T.H.; Strokal, M. A Triple Increase in Global River Basins with Water Scarcity Due to Future Pollution. Nat. Commun. 2024, 15, 880. [Google Scholar]
  9. Samtio, M.S.; Hakro, A.A.A.D.; Jahangir, T.M.; Mastoi, A.S.; Lanjwani, M.F.; Rajper, R.H.; Lashari, R.A.; Agheem, M.H.; Noonari, M.W. Impact of Rock-Water Interaction on Hydrogeochemical Characteristics of Groundwater: Using Multivariate Statistical, Water Quality Index and Irrigation Indices of Chachro Sub-District, Thar Desert, Sindh, Pakistan. Groundw. Sustain. Dev. 2023, 20, 100878. [Google Scholar] [CrossRef]
  10. Boualem, B.; Egbueri, J.C. Graphical, Statistical and Index-Based Techniques Integrated for Identifying the Hydrochemical Fingerprints and Groundwater Quality of In Salah, Algerian Sahara. Environ. Geochem. Health 2024, 46, 158. [Google Scholar] [CrossRef]
  11. Bouselsal, B.; Satouh, A.; Egbueri, J.C. Evaluating Water Quality, Mineralization Mechanisms, and Potential Health Risks of Nitrate Contamination in the Continental Intercalaire Aquifer of Reggane, Algeria. Environ. Earth Sci. 2024, 83, 539. [Google Scholar] [CrossRef]
  12. Jain, C.K.; Singh, S. Best Management Practices for Agricultural Nonpoint Source Pollution: Policy Interventions and Way Forward. World Water Policy 2019, 5, 207–228. [Google Scholar] [CrossRef]
  13. Yu, G.; Wang, J.; Liu, L.; Li, Y.; Zhang, Y.; Wang, S. The Analysis of Groundwater Nitrate Pollution and Health Risk Assessment in Rural Areas of Yantai, China. BMC Public Health 2020, 20, 437. [Google Scholar] [CrossRef]
  14. Aravinthasamy, P.; Karunanidhi, D.; Jayasena, H.C.; Subramani, T. Assessment of Groundwater Fluoride and Human Health Effects in a Hard Rock Province of South India: Implications from Pollution Index Model (PIM) and Geographical Information System (GIS) Techniques. Environ. Geochem. Health 2024, 46, 326. [Google Scholar] [CrossRef]
  15. Şehnaz, Ş.; Şener, E.; Davraz, A.; Varol, S. Hydrogeological and Hydrochemical Investigation in the Burdur Saline Lake Basin, Southwest Turkey. Chem. der Erde 2020, 80, 125592. [Google Scholar] [CrossRef]
  16. Rani, A.; Parashar, K.; Meena, R.; Sharma, S.K.; Tiwari, K.K.; Ajaykumar, V.; Mondal, N.C. Hydrochemical Characteristics and Potential Health Risks of Nitrate, Fluoride, and Uranium in Kota District, Rajasthan, India. Environ. Sci. Pollut. Res. 2023, 30, 82485–82505. [Google Scholar] [CrossRef]
  17. Liu, J.; Gao, Z.; Feng, J.; Wang, M. Identification of the Hydrochemical Features, Genesis, Water Quality and Potential Health Hazards of Groundwater in Dawen River Basin, North China. Ecol. Indic. 2023, 149, 110175. [Google Scholar] [CrossRef]
  18. Fuentes-Rivas, R.M.; Santacruz-De Leon, G.; Ramos-Leal, J.A.; Alvarez-Bastida, C.; Moran-Ramirez, J. Hydrogeochemical Processes, and Health Risk Assessment of Groundwater, in Santa María Del Rio Aquifer: A Case Study of San Luis Potosí Valley, Mexico. Groundw. Sustain. Dev. 2024, 26, 101268. [Google Scholar] [CrossRef]
  19. Abadi, H.T.; Alemayehu, T.; Berhe, B.A. Hydrogeochemical Characterization of Groundwater in Mountainous Catchment and Its Suitability for Drinking Purposes in Irob, Tigray, Northern Ethiopia. Water Pract. Technol. 2024, 19, 1495–1512. [Google Scholar] [CrossRef]
  20. El Mountassir, O.; Bahir, M.; Ouazar, D.; Chehbouni, A.; Carreira, P.M. Temporal and Spatial Assessment of Groundwater Contamination with Nitrate Using Nitrate Pollution Index (NPI), Groundwater Pollution Index (GPI), and GIS (Case Study: Essaouira Basin, Morocco). Environ. Sci. Pollut. Res. 2022, 29, 17132–17149. [Google Scholar] [CrossRef]
  21. Salazar-Rojas, T.; Cejudo-Ruiz, F.R.; Gutiérrez-Soto, M.V.; Calvo-Brenes, G. Assessing Heavy Metal Pollution Load Index (PLI) in Biomonitors and Road Dust from Vehicular Emission by Magnetic Properties Modeling. Environ. Sci. Pollut. Res. 2023, 30, 91248–91261. [Google Scholar] [CrossRef]
  22. Panneerselvam, B.; Karuppannan, S.; Muniraj, K. Evaluation of Drinking and Irrigation Suitability of Groundwater with Special Emphasizing the Health Risk Posed by Nitrate Contamination Using Nitrate Pollution Index (NPI) and Human Health Risk Assessment (HHRA). Hum. Ecol. Risk Assess. Int. J. 2020, 27, 1324–1348. [Google Scholar] [CrossRef]
  23. Golaki, M.; Gharehchahi, E.; Mahmoudi, N.; Rashidi, M.; Azhdarpoor, A. Assessing Water Quality of Kazerun County in Southwest Iran: Multi-Analytical Techniques, Deterministic vs. Probabilistic Water Quality Index, Geospatial Analysis, Fuzzy C-Means Clustering, and Machine Learning. Groundw. Sustain. Dev. 2024, 27, 101336. [Google Scholar] [CrossRef]
  24. Wheeler, S.; Henry, T.; Murray, J.; McDermott, F.; Morrison, L. Utilising CoDA Methods for the Spatio—Temporal Geochemical Characterisation of Groundwater; a Case Study from Lisheen Mine, South Central Ireland. Appl. Geochem. 2021, 127, 104912. [Google Scholar] [CrossRef]
  25. Belhouchette, H.; Boughariou, E.; Larayedh, O.; Bouri, S. Groundwater Quality Evaluation and Human Health Risks Assessment Using the WQI, NPI and HQnitrate Models: Case of the Sfax Intermediate Aquifer, Sahel Tunisia. Environ. Geochem. Health 2022, 44, 2629–2647. [Google Scholar] [CrossRef]
  26. Malik, A.; Yasar, A.; Tabinda, A.B.; Iftikhar, M.H.; Mukhtar, S. Health Risk Assessment of Nitrates and Fluorides Ingestion and Geochemical Evaluation of Groundwater Characteristics in Semi-Arid Regions. Int. J. Environ. Sci. Technol. 2024, 21, 8459–8486. [Google Scholar] [CrossRef]
  27. Zahra, A.; Ali, M.; Ali, N.; Khan, A.; Zairov, R.; Sinyashin, O.; Wang, Y.; Zafar, S.; Khan, F.-A. A Comprehensive Analysis of the Impact of Arsenic, Fluoride, and Nitrate—Nitrite Dynamics on Groundwater Quality and Its Health Implications. J. Hazard. Mater. 2025, 487, 137093. [Google Scholar]
  28. Ahmad, M.; Jamal, A.; Tang, X.W.; Al-Sughaiyer, M.A.; Al-Ahmadi, H.M.; Ahmad, F. Assessing Potable Water Quality and Identifying Areas of Waterborne Diarrheal and Fluorosis Health Risks Using Spatial Interpolation in Peshawar, Pakistan. Water 2020, 12, 2163. [Google Scholar] [CrossRef]
  29. Memon, A.G.; Mustafa, A.; Raheem, A.; Ahmad, J.; Giwa, A.S. Impact of Effluent Discharge on Recreational Beach Water Quality: A Case Study of Karachi-Pakistan. J. Coast. Conserv. 2021, 25, 37. [Google Scholar] [CrossRef]
  30. Fatima, S.U.; Khan, M.A.; Siddiqui, F.; Mahmood, N.; Salman, N.; Alamgir, A.; Shaukat, S.S. Geospatial Assessment of Water Quality Using Principal Components Analysis (PCA) and Water Quality Index (WQI) in Basho Valley, Gilgit Baltistan (Northern Areas of Pakistan). Environ. Monit. Assess. 2022, 194, 151. [Google Scholar] [CrossRef]
  31. Begum, S.; Shah, M.T.; Muhammad, S.; Khan, S. Role of Mafic and Ultramafic Rocks in Drinking Water Quality and Its Potential Health Risk Assessment, Northern Pakistan. J. Water Health 2015, 13, 1130–1142. [Google Scholar] [CrossRef] [PubMed]
  32. Barinova, S.; Ali, N.; Barkatullah, S.F.M. Ecological Adaptation to Altitude of Algal Communities in the Swat Valley (Hindu Cush Mountains, Pakistan). Expert. Opin. Environ. Biol. 2013, 2, 2. [Google Scholar]
  33. Bacha, M.S.; Muhammad, M.; Kılıç, Z.; Nafees, M. The Dynamics of Public Perceptions and Climate Change in Swat Valley, Khyber Pakhtunkhwa, Pakistan. Sustainability 2021, 13, 4464. [Google Scholar] [CrossRef]
  34. Kazmi, A.H.; Jan, M.Q. Geology and Tectonics of Pakistan; Graphic Publishers: Karachi, Pakistan, 1997; ISBN 9698375007. [Google Scholar]
  35. APHA. Standard Methods for the Examination of Water and Wastewater; American Public Health Association: Washington, DC, USA, 2017; Volume 23. [Google Scholar]
  36. Bishayee, B.; Chatterjee, R.P.; Ruj, B.; Chakrabortty, S.; Nayak, J. Strategic Management of Nitrate Pollution from Contaminated Water Using Viable Adsorbents: An Economic Assessment-Based Review with Possible Policy Suggestions. J. Environ. Manag. 2022, 303, 114081. [Google Scholar] [CrossRef]
  37. Wagh, V.; Mukate, S.; Muley, A.; Kadam, A.; Panaskar, D.; Varade, A. Study of Groundwater Contamination and Drinking Suitability in Basaltic Terrain of Maharashtra, India through Pig and Multivariate Statistical Techniques. J. Water Supply Res. Technol. AQUA 2020, 69, 398–414. [Google Scholar] [CrossRef]
  38. Rao, S.N. PIG: A Numerical Index for Dissemination of Groundwater Contamination Zones. Hydrol. Process. 2012, 26, 3344–3350. [Google Scholar] [CrossRef]
  39. Sreedevi, P.D.; Sreekanth, P.D.; Reddy, D.V. Recharge Environment and Hydrogeochemical Processes of Groundwater in a Crystalline Aquifer in South India. Int. J. Environ. Sci. Technol. 2022, 19, 4839–4856. [Google Scholar] [CrossRef]
  40. Fentahun, A.; Mechal, A.; Karuppannan, S.; Fentahun, A.; Mechal, A.; Karuppannan, S. Hydrochemistry and Quality Appraisal of Groundwater in Birr River Catchment, Central Blue Nile River Basin, Using Multivariate Techniques and Water Quality Indices. Environ. Monit. Assess. 2023, 195, 655. [Google Scholar] [CrossRef]
  41. Pakistan Health Research Council. Non-Communicable Diseases Risk Factors Survey—Pakistan; Pakistan Health Research Council: Islamabad, Pakistan, 2016; pp. 1–48. [Google Scholar]
  42. Thabrez, M.; Parimalarenganayaki, S. Hydrogeochemical Characterization and Non-Carcinogenic Health Risk Assessment of Fluoride and Nitrate-Affected Groundwater in Northern Parts of Tumkur District, Karnataka, India. Hum. Ecol. Risk Assess. Int. J. 2024, 30, 239–268. [Google Scholar] [CrossRef]
  43. Yang, J.; Liu, H.; Tang, Z.; Peeters, L.; Ye, M. Visualization of Aqueous Geochemical Data Using Python and WQChartPy. Groundwater 2022, 60, 555–564. [Google Scholar] [CrossRef]
  44. WHO. Guidelines for Drinking-Water Quality: First Addendum to the Fourth Edition; World Health Organization: Geneva, Switzerland, 2017; Volume 109, ISBN 9789241550017. [Google Scholar]
  45. Piper, A.M. A Graphic Procedure in the Geochemical Interpretation of Water-analyses. Eos Trans. Am. Geophys. Union 1944, 25, 914–928. [Google Scholar] [CrossRef]
  46. Van Wirdum, G. (Ed.) Vegetation and Hydrology of Floating Rich-Fens; Datawyse: Maastricht, The Netherlands, 1991; ISBN 9052910456. [Google Scholar]
  47. Amiri, V.; Bhattacharya, P.; Nakhaei, M. The Hydrogeochemical Evaluation of Groundwater Resources and Their Suitability for Agricultural and Industrial Uses in an Arid Area of Iran. Groundw. Sustain. Dev. 2021, 12, 100527. [Google Scholar] [CrossRef]
  48. Charrad, M.; Ghazzali, N.; Boiteau, V.; Niknafs, A. NbClust: An R Package for Determining the Relevant Number of Clusters in a Data Set. J. Stat. Softw. 2014, 61, 1–36. [Google Scholar] [CrossRef]
  49. Din, I.U.; Ali, W.; Muhammad, S.; Shaik, M.R.; Shaik, B.; Rehman, I.U.; Tokatli, C. Spatial Distribution and Potential Health Risk Assessment for Fluoride and Nitrate via Water Consumption in Pakistan. J. Geochem. Explor. 2024, 259, 107413. [Google Scholar] [CrossRef]
  50. Zhou, L.; Liang, W.; Meng, Y.; Zhao, X.; Guo, F.; Liu, L.; Li, W.; Teng, M.; Song, F.; Cao, Z. Overlooked Fluorine Deficiency in Children of South and East China May Be Exacerbated by Climate Change: Evidence from the National Assessment. J. Clean. Prod. 2024, 434, 140128. [Google Scholar]
  51. Valiallahi, J.; Yazdani, M. Evaluating Groundwater Quality by Examining Electrical Conductivity, Total Dissolved Solids, Total Hardness, and Turbidity Using Geographic Information Systems (GIS®): A Case Study of Selected Wells in the Taleghan Region, Iran. Appl. Water Sci. 2025, 15, 61. [Google Scholar]
  52. Toure, A.; Wenbiao, D. Physicochemical and Microorganism Analysis of Some Hand Pump Water in Pelengana, Segou, Mali. Appl. Water Sci. 2020, 10, 150. [Google Scholar] [CrossRef]
  53. Ravindra, K.; Thind, P.S.; Mor, S.; Singh, T.; Mor, S. Evaluation of Groundwater Contamination in Chandigarh: Source Identification and Health Risk Assessment. Environ. Pollut. 2019, 255, 113062. [Google Scholar] [CrossRef]
  54. Equeenuddin, S.M.; Pattnaik, B.K. Hydrogeochemical Evolution of Hexavalent Chromium at the Sukinda Ultramafic Complex in Eastern Part of India. Geochemistry 2020, 80, 125633. [Google Scholar] [CrossRef]
  55. Roy Chowdhury, N.; Majumder, S.; Ghosh, S.; Satheesh Babu, S.; Vidyadharan, V.; Samanta, J.; Bhowmick, S.; Kumar, S.; Roychowdhury, T. A Vivid Picture of the Distribution, Impact, and Consequences of Fluoride in Indian Perspective. In Ground Water Contamination in India: Adverse Effects on Habitats; Springer International Publishing: Cham, Switzerland, 2024; pp. 83–103. [Google Scholar]
  56. Zeng, J.; Han, G.; Hu, M.; Wang, Y.; Liu, J.; Zhang, S.; Wang, D. Geochemistry of Dissolved Heavy Metals in Upper Reaches of the Three Gorges Reservoir of Yangtze River Watershed during the Flood Season. Water 2021, 13, 2078. [Google Scholar] [CrossRef]
  57. Wali, S.U.; Alias, N.B.; Usman, A.A.; Umar, A.; Muhammad, N.; Kaoje, I.U.; Samaila, B.; Aliyu, B.; Ladan, H.M.; Atiku, M.; et al. Geostatistical and Multivariate Analysis of Phosphate Evolution and Its Relationship with Heavy Metals in Shallow Groundwater in a Semi-Arid Basin. Earth Sci. Inf. 2025, 18, 267. [Google Scholar] [CrossRef]
  58. Alam, A.; Singh, A. Groundwater Quality Assessment Using SPSS Based on Multivariate Statistics and Water Quality Index of Gaya, Bihar (India). Environ. Monit. Assess. 2023, 195, 687. [Google Scholar] [CrossRef]
  59. Zango, M.S.; Sunkari, E.D.; Abu, M.; Lermi, A. Hydrogeochemical Controls and Human Health Risk Assessment of Groundwater Fluoride and Boron in the Semi-Arid North East Region of Ghana. J. Geochem. Explor. 2019, 207, 106363. [Google Scholar] [CrossRef]
  60. Zainol, N.F.M.; Zainuddin, A.H.; Looi, L.J.; Aris, A.Z.; Isa, N.M.; Sefie, A.; Ku Yusof, K.M.K. Spatial Analysis of Groundwater Hydrochemistry through Integrated Multivariate Analysis: A Case Study in the Urbanized Langat Basin, Malaysia. Int. J. Environ. Res. Public Health 2021, 18, 5733. [Google Scholar] [CrossRef]
  61. Ebrahimi, P.; Guarino, A.; Allocca, V.; Caliro, S.; Avino, R.; Bagnato, E.; Capecchiacci, F.; Carandente, A.; Minopoli, C.; Santi, A.; et al. Hierarchical Clustering and Compositional Data Analysis for Interpreting Groundwater Hydrogeochemistry: The Application to Campi Flegrei Volcanic Aquifer (South Italy). J. Geochem. Explor. 2022, 233, 106922. [Google Scholar] [CrossRef]
  62. Ali, W.; Muhammad, S. Spatial Distribution of Contaminants and Water Quality Assessment Using an Indexical Approach, Astore River Basin, Western Himalayas, Northern Pakistan. Geocarto Int. 2022, 37, 14005–14026. [Google Scholar] [CrossRef]
Figure 1. Map of the study area showing sample sites.
Hydrology 12 00070 g001
Figure 2. (a) Spatial distribution of the nitrate pollution index (NPI), (b) spatial distribution of fluoride pollution, and (c) spatial distribution of the pollution index of groundwater (PIG).
Hydrology 12 00070 g002
Figure 3. Piper diagram showing the hydrochemical facies of groundwater in the area.
Hydrology 12 00070 g003
Figure 4. (a) Van Wirdum diagram showing the major mechanisms influencing groundwater chemistry (Lt: lithocline; At: Atmocline; Th: Thalassocline; and Rh: Rhine end member) and (b) plot showing the chloro-alkaline indices (CAI-I and CAI-II).
Hydrology 12 00070 g004
Figure 5. Dendrogram showing three clusters (CI, CII, and CIII, from left to right) obtained from agglomerative hierarchical cluster analysis.
Hydrology 12 00070 g005
Figure 6. Correlogram showing the results of Spearman rank correlation analysis.
Hydrology 12 00070 g006
Table 1. Descriptive statistics of water quality parameters (n = 51).
VariableMeanSD.MinPctl. 25Pctl. 75Max
TDS449.4161.2123.7368.5477.51070
EC894.2308.3250752.59722146
pH7.50.46.87.37.88.3
T17.92.62.517.31921.1
Tur1.41.10.211.46
F0.80.60.10.313.2
TH299137.384204345805
Ca2+103.751.62064.2132212
Mg2+198.2106.148.8135226652
Cl68.237.7234287178
TA235.478.8115159295.5378
NO34.82.90.92.66.313
SO42−4815153658.582
K+2.53.411323
Na+26.822.23114089
Table 2. Chronic daily intake (mg/kg/d) and hazard quotient for nitrate and fluoride via oral pathway.
AdultChildren
NitrateFluorideNitrateFluoride
CDI (Oral)Mean1.46 × 10−12.40 × 10−25.13 × 10−17.98 × 10⁻²
Min2.64 × 10−23.64 × 10³9.26 × 10−21.28 × 10−2
Max1.38 × 10−19.70 × 10−21.38 × 1003.40 × 10−1
HQ (Oral)Mean9.14 × 10−23.82 × 10−13.21 × 10−11.34 × 100
Min1.65 × 10−26.06 × 10−25.78 × 10−22.13 × 10−1
Max2.46 × 10−11.62 × 1008.64 × 10−15.67 × 100
Table 3. Results of the factor analysis (RC: rotated component).
VariableRC1RC2RC3
TDS0.90.150.1
EC0.880.20.12
pH0.050.080.4
T−0.2−0.10.75
Tur−0.050.3−0.7
F0.70.2−0.25
TH0.010.950.1
Ca2+−0.10.75−0.05
Mg2+0.080.880.1
Cl0.250.6−0.1
TA0.250.45−0.05
N O 3 −0.350.2-0.1
S O 4 2 −0.10.20.55
K+0.680.1−0.05
Na+0.75−0.1−0.25
Eigenvalue3.52.71.9
Variance (%)302520
Cumulative Variance (%)305575
Table 4. Comparison of mean values of parameters between clusters using the one-way ANOVA test.
ClustersIIIIII
VariableNMeanSDNMeanSDNMeanSDTest
TDS21437.51175.0618448.72135.5112471.16182.27F = 0.161
EC21874.38351.1118888.66226.9712937.08354.03F = 0.157
pH217.560.39187.410.36127.620.301F = 1.413
T2117.463.761818.261.11218.241.53F = 0.562
Tur211.591.34181.361.03121.30.66F = 0.333
F210.7890.65180.720.57120.740.45F = 0.057
TH21312.286107.6518210.2262.2512408.83179.42F = 10.69 ***
Ca2+215.7732.61183.571.82126.522.23F = 7.055 ***
Mg2+2116.6145.351811.544.221222.8813.49F = 7.742 ***
Cl212.221.15181.430.579122.131.25F = 3.229 **
HC O 3 213.6651.31183.491.229124.730.994F = 4.158 **
N O 3 210.1960.122180.210.128120.2210.131F = 0.217
S O 4 2 210.9460.27181.020.291121.050.406F = 0.554
K+210.0780.12180.0540.031120.060.047F = 0.396
Na+211.0711.02181.210.995121.250.884F = 0.166
PIG210.750.18180.60.13120.90.331F = 6.986 ***
NPI21−0.5490.2818−0.490.29412−0.4930.301F = 0.217
FPI212.040.31181.970.35122.30.24F = 0.218
Statistical significance markers: ** p < 0.05; and *** p < 0.01.
Disclaimer/Publisher’s Note: The statements, opinions and data contained in all publications are solely those of the individual author(s) and contributor(s) and not of MDPI and/or the editor(s). MDPI and/or the editor(s) disclaim responsibility for any injury to people or property resulting from any ideas, methods, instructions or products referred to in the content.

