
The Impact of a Clay-Core Embankment Dam Break on the Flood Wave Characteristics
 , ,
, ,
Abstract
1. Introduction
2. Materials and Methods
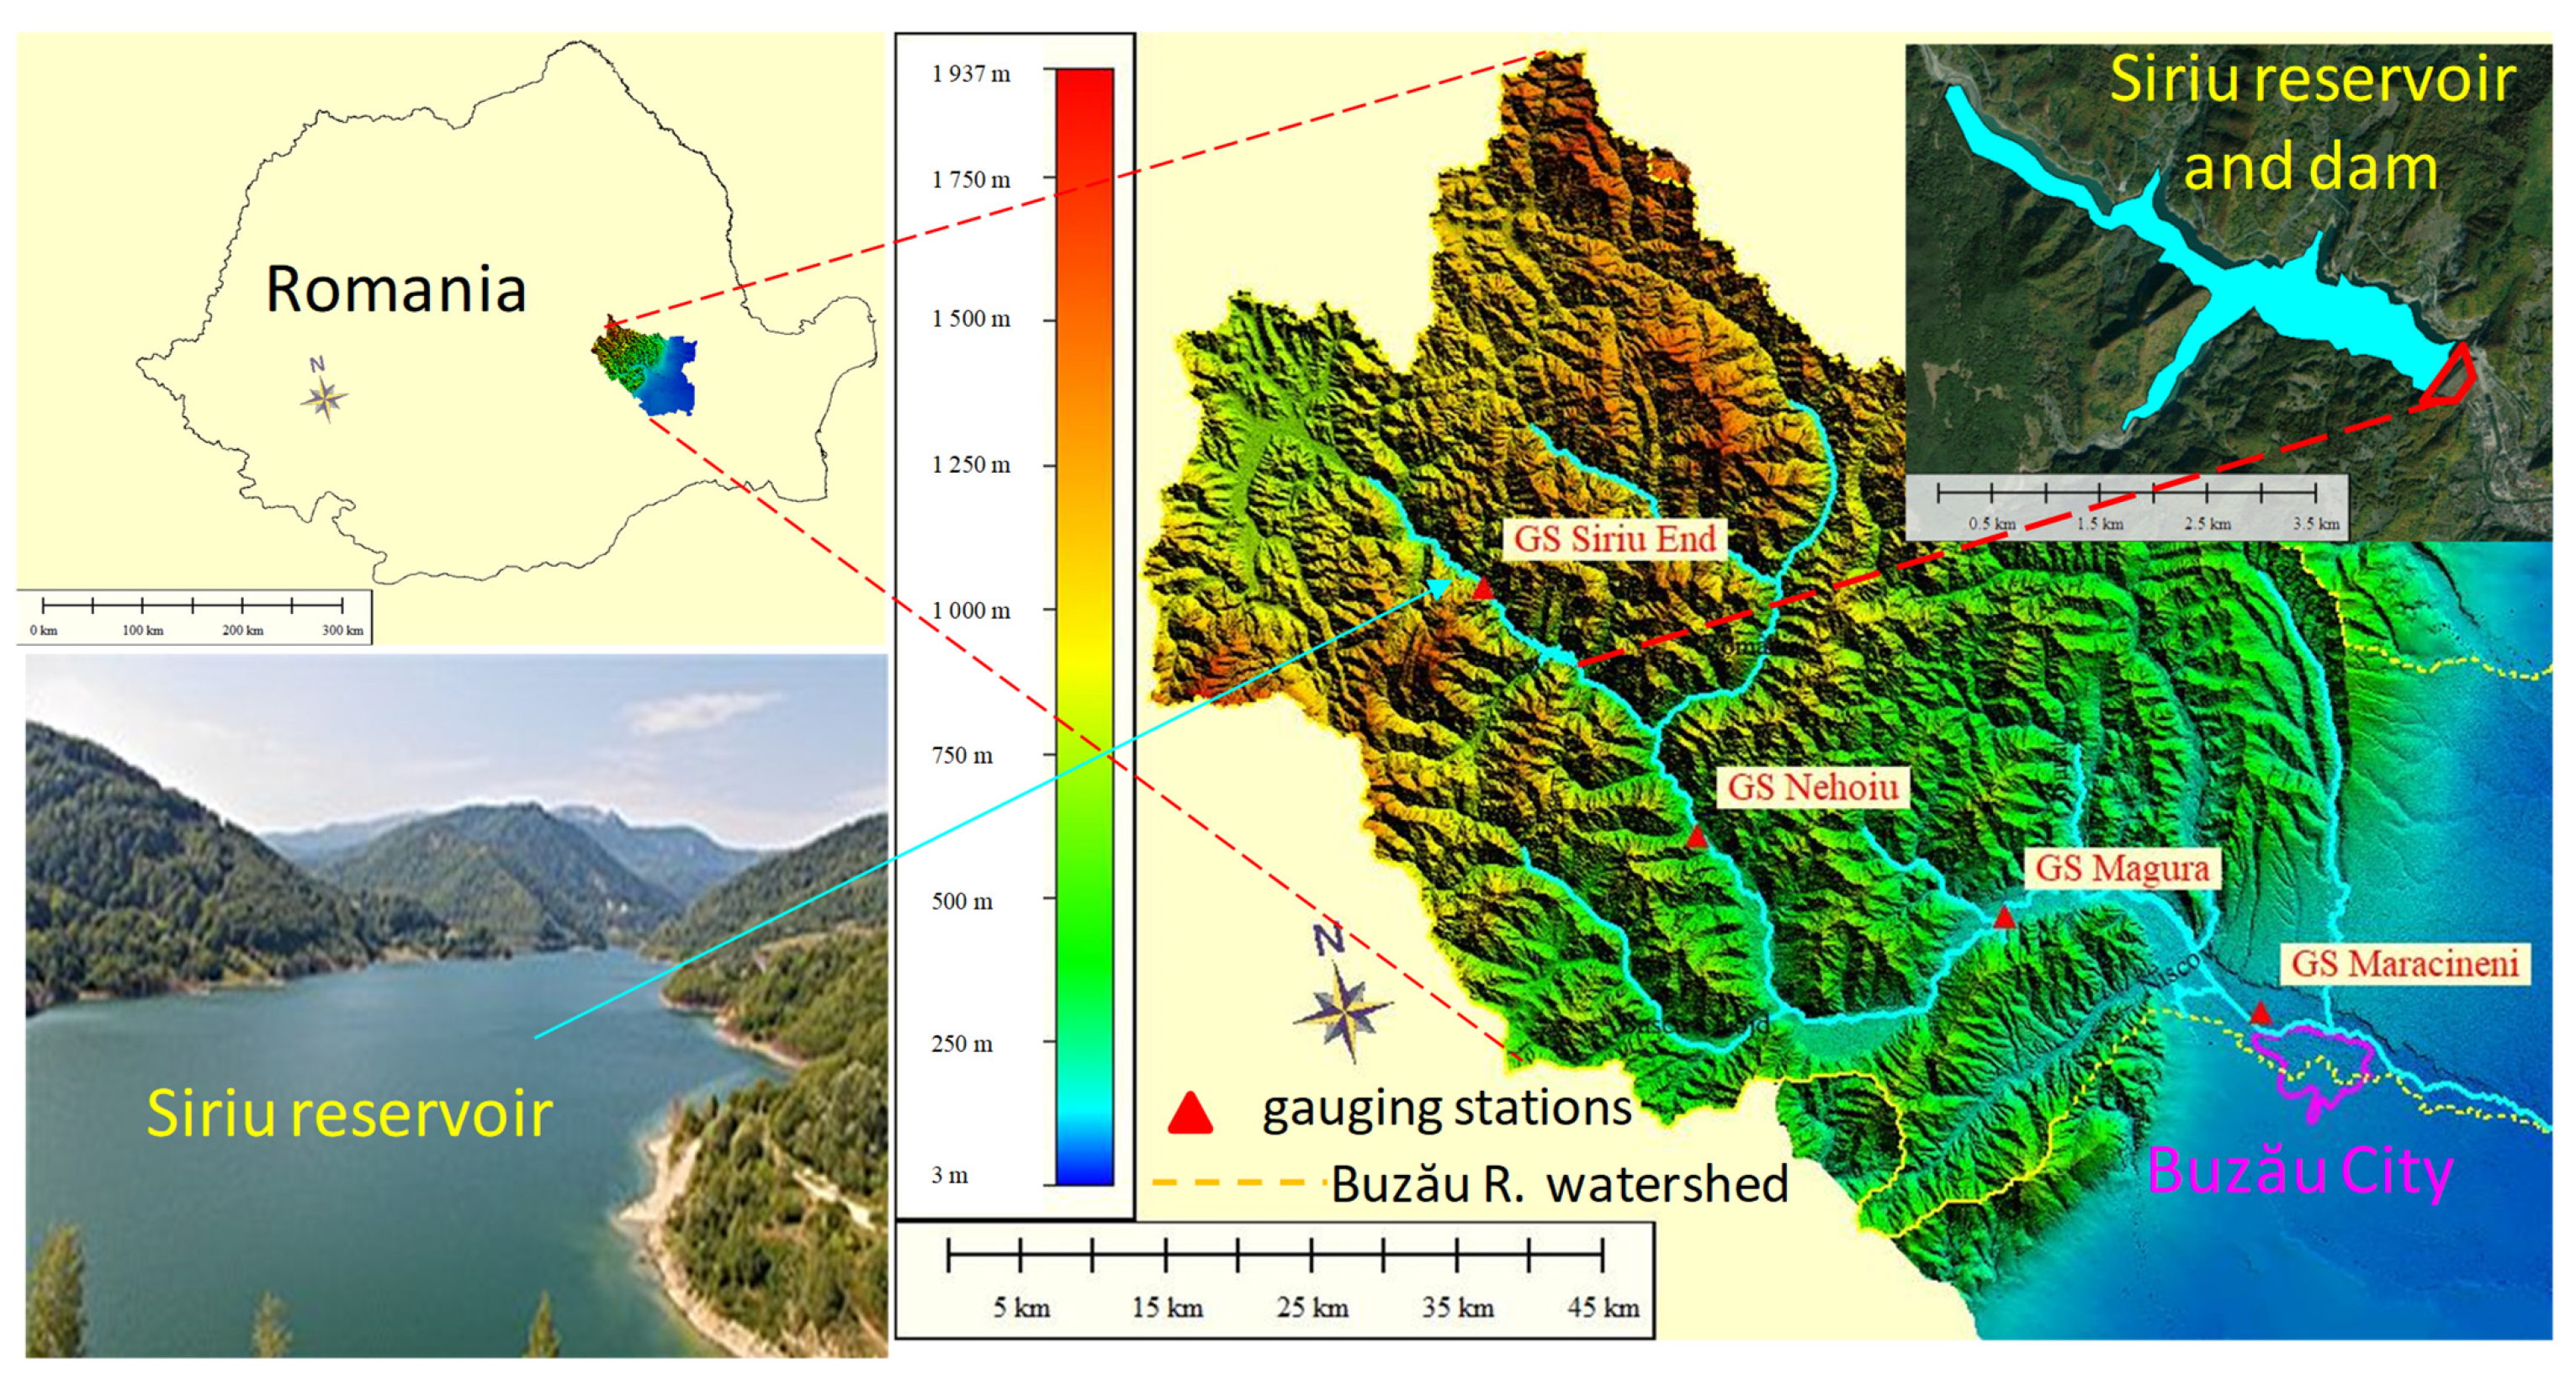
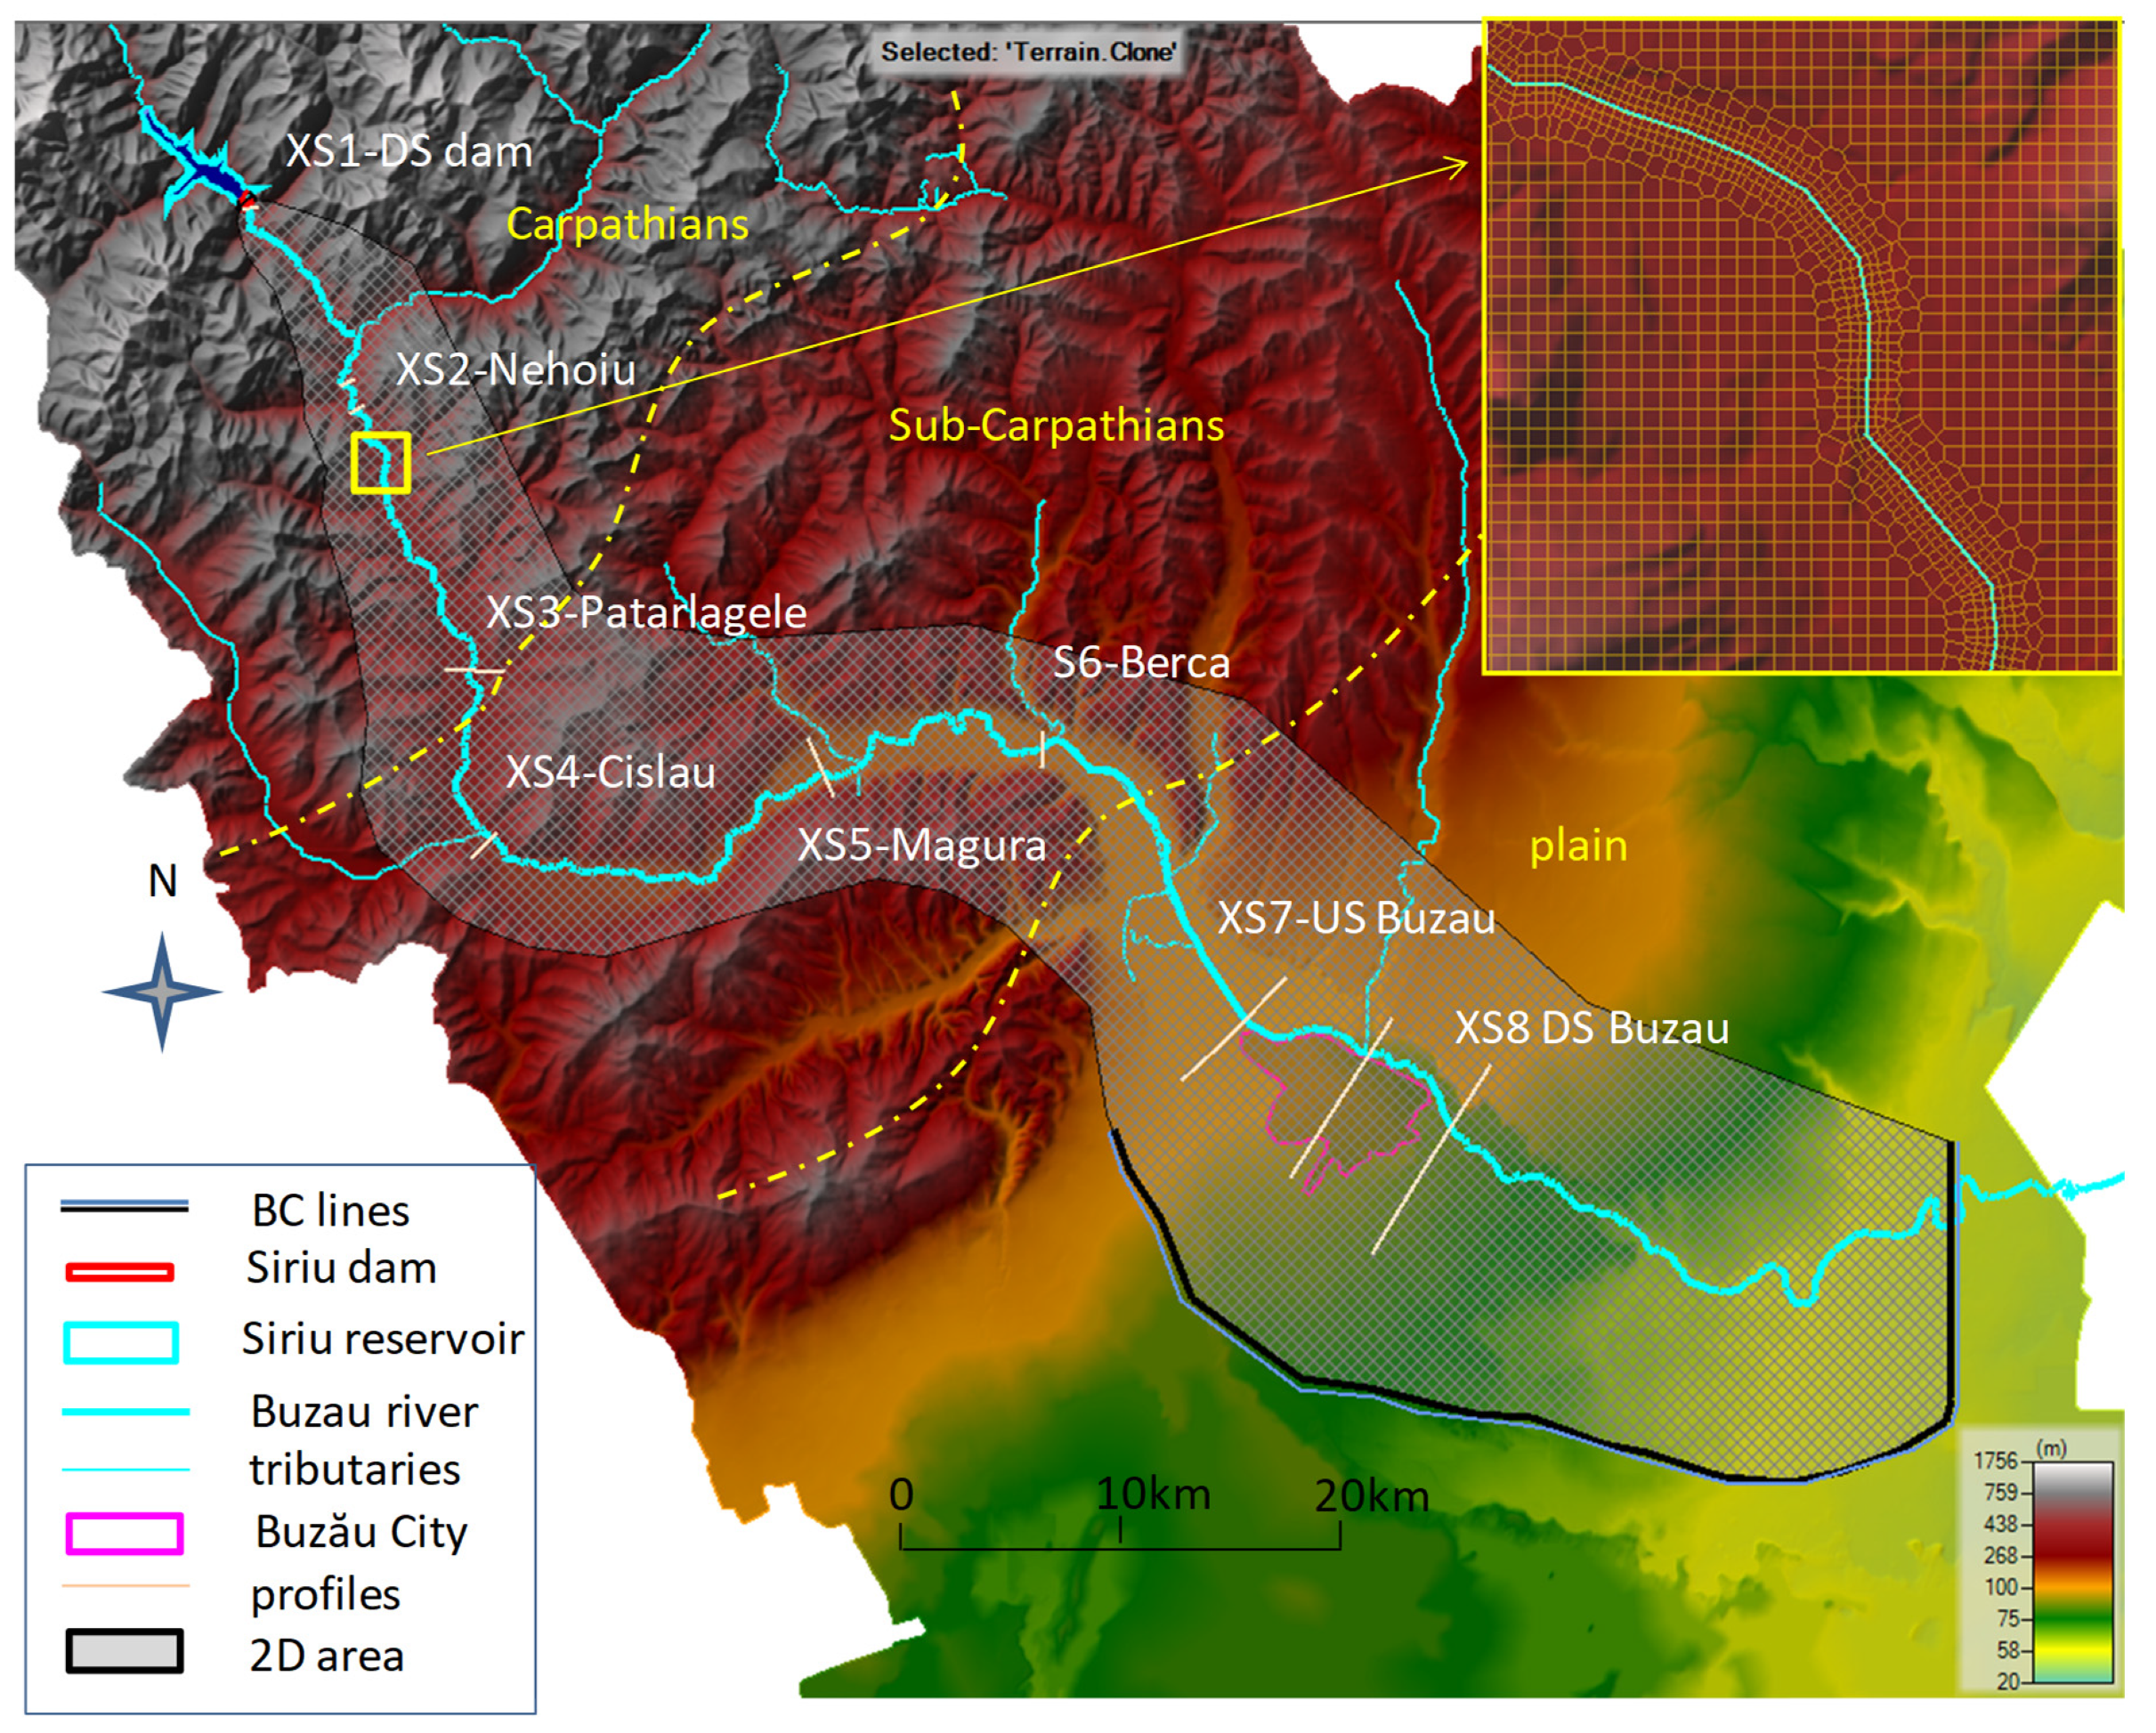
2.1. Study Area and Data
2.2. Development of the 2D Hydraulic Model
2.3. Dam Failure Scenarios
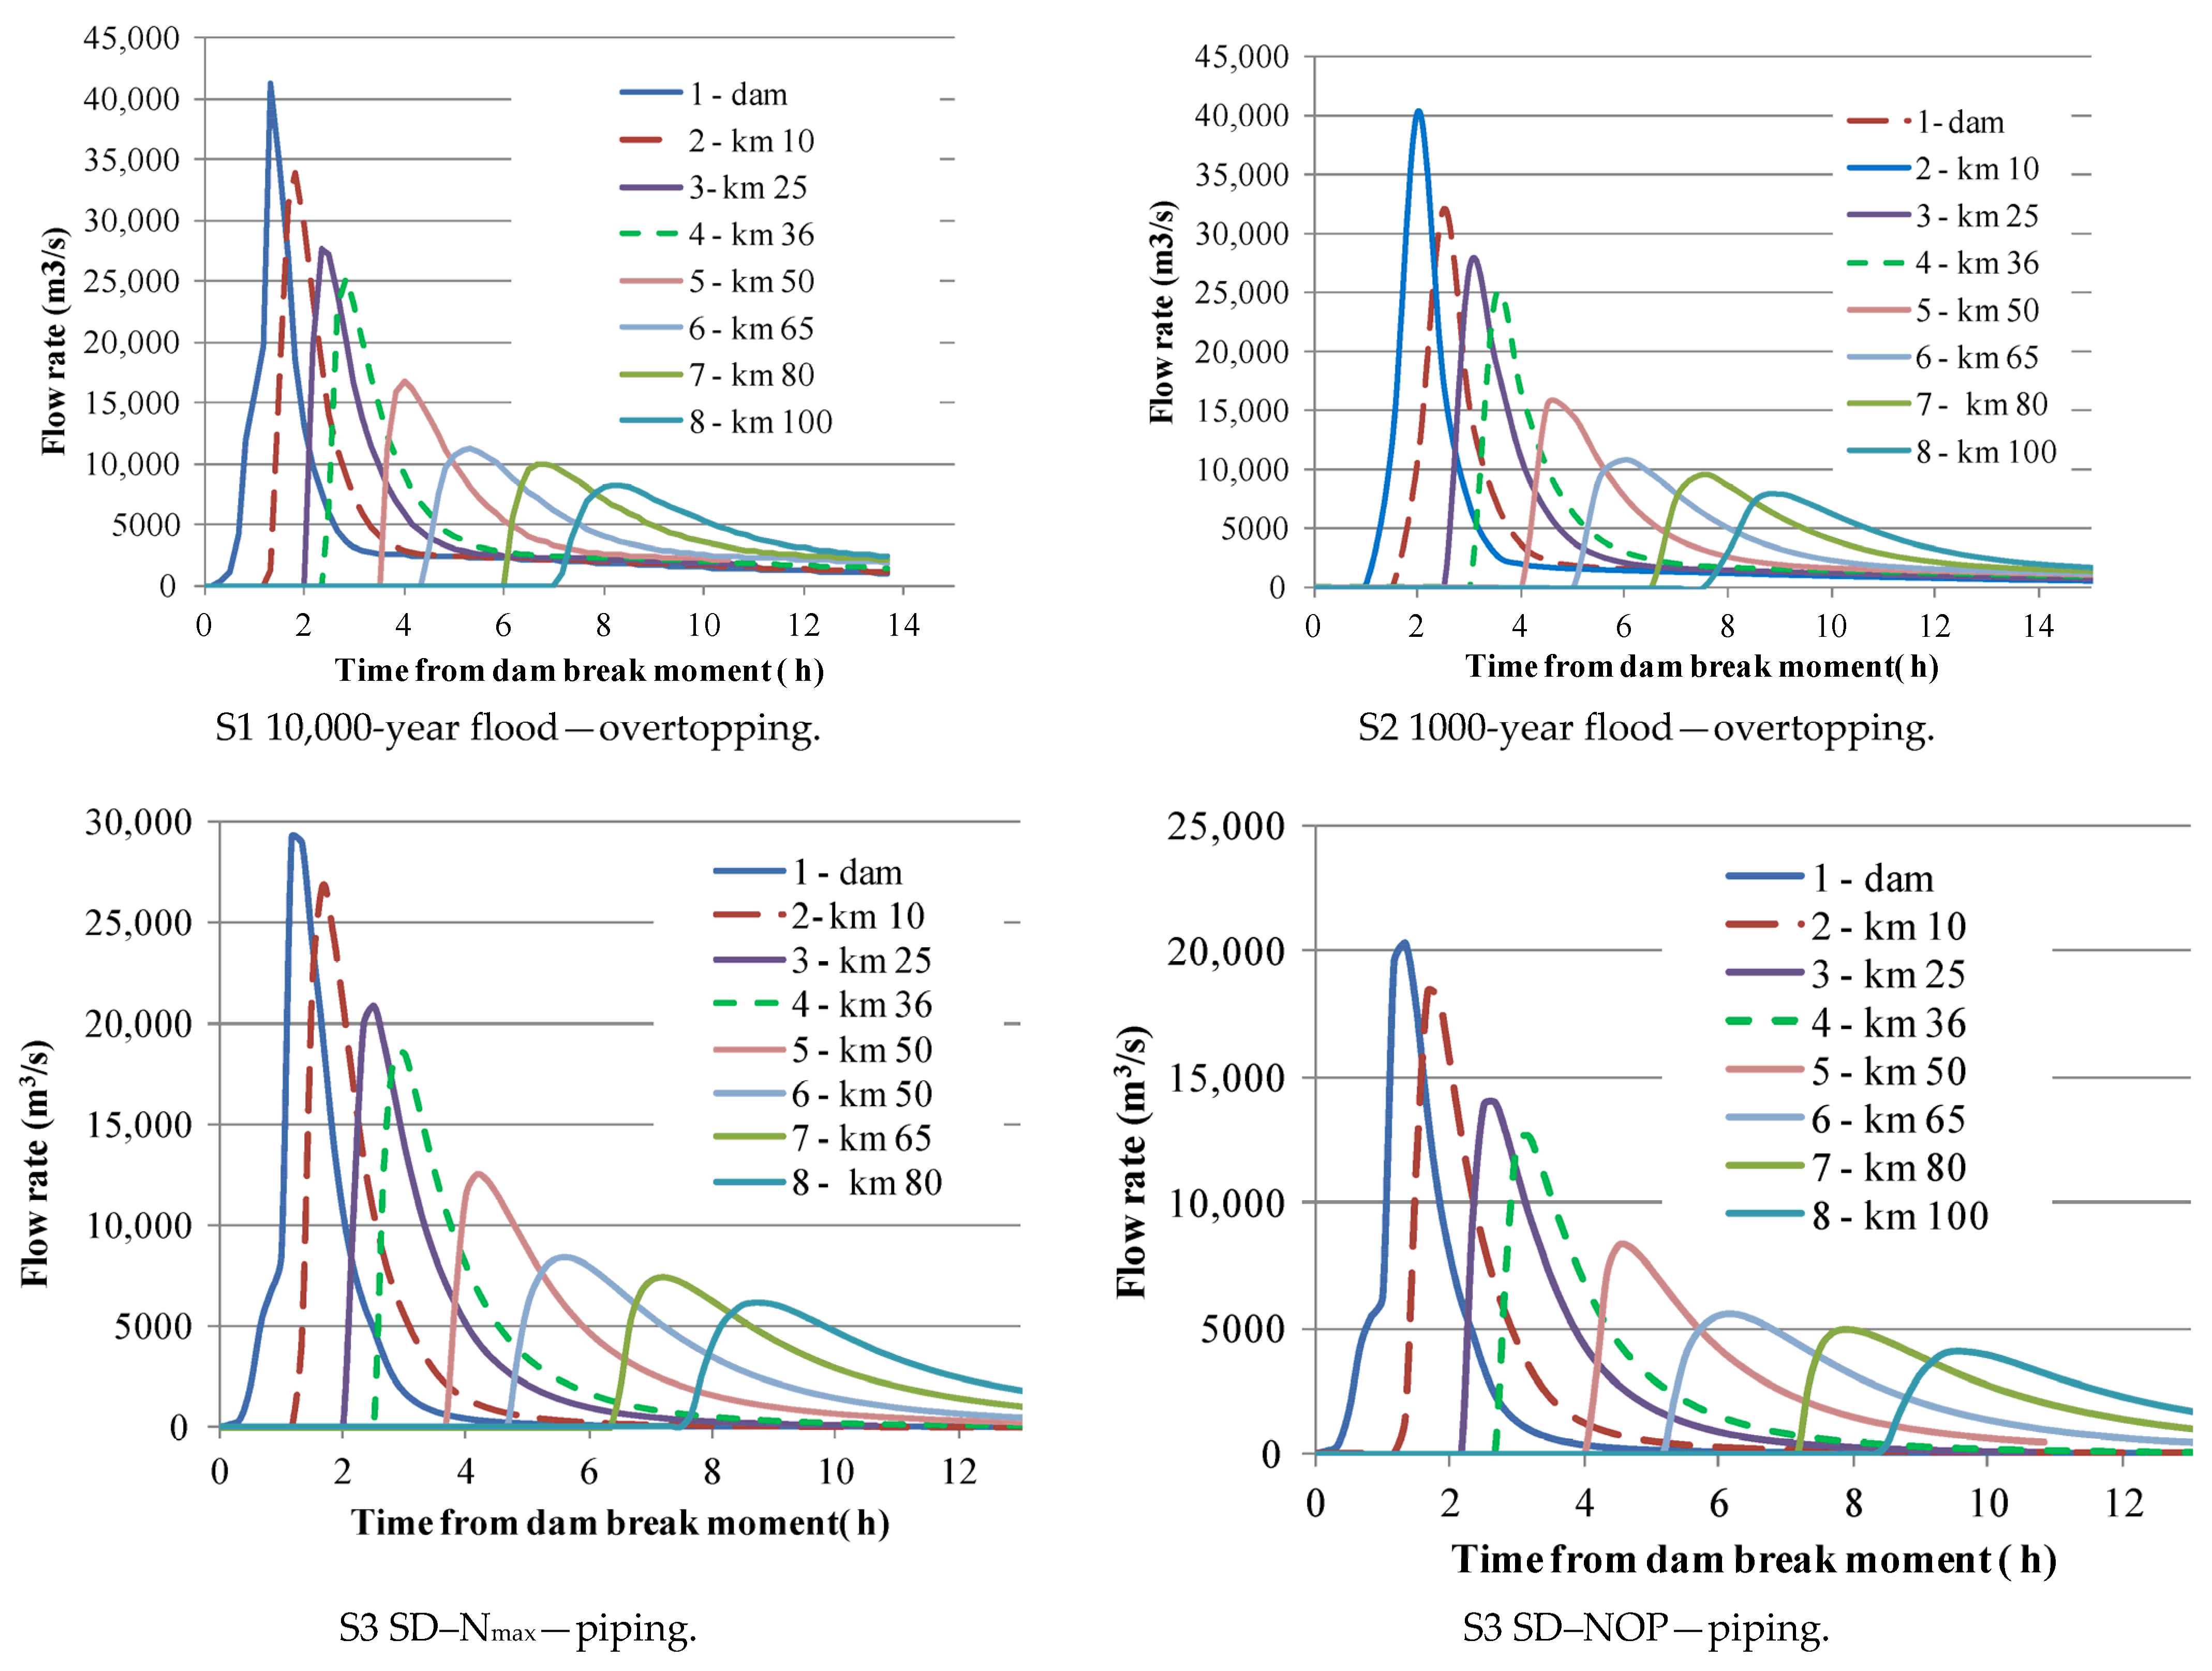
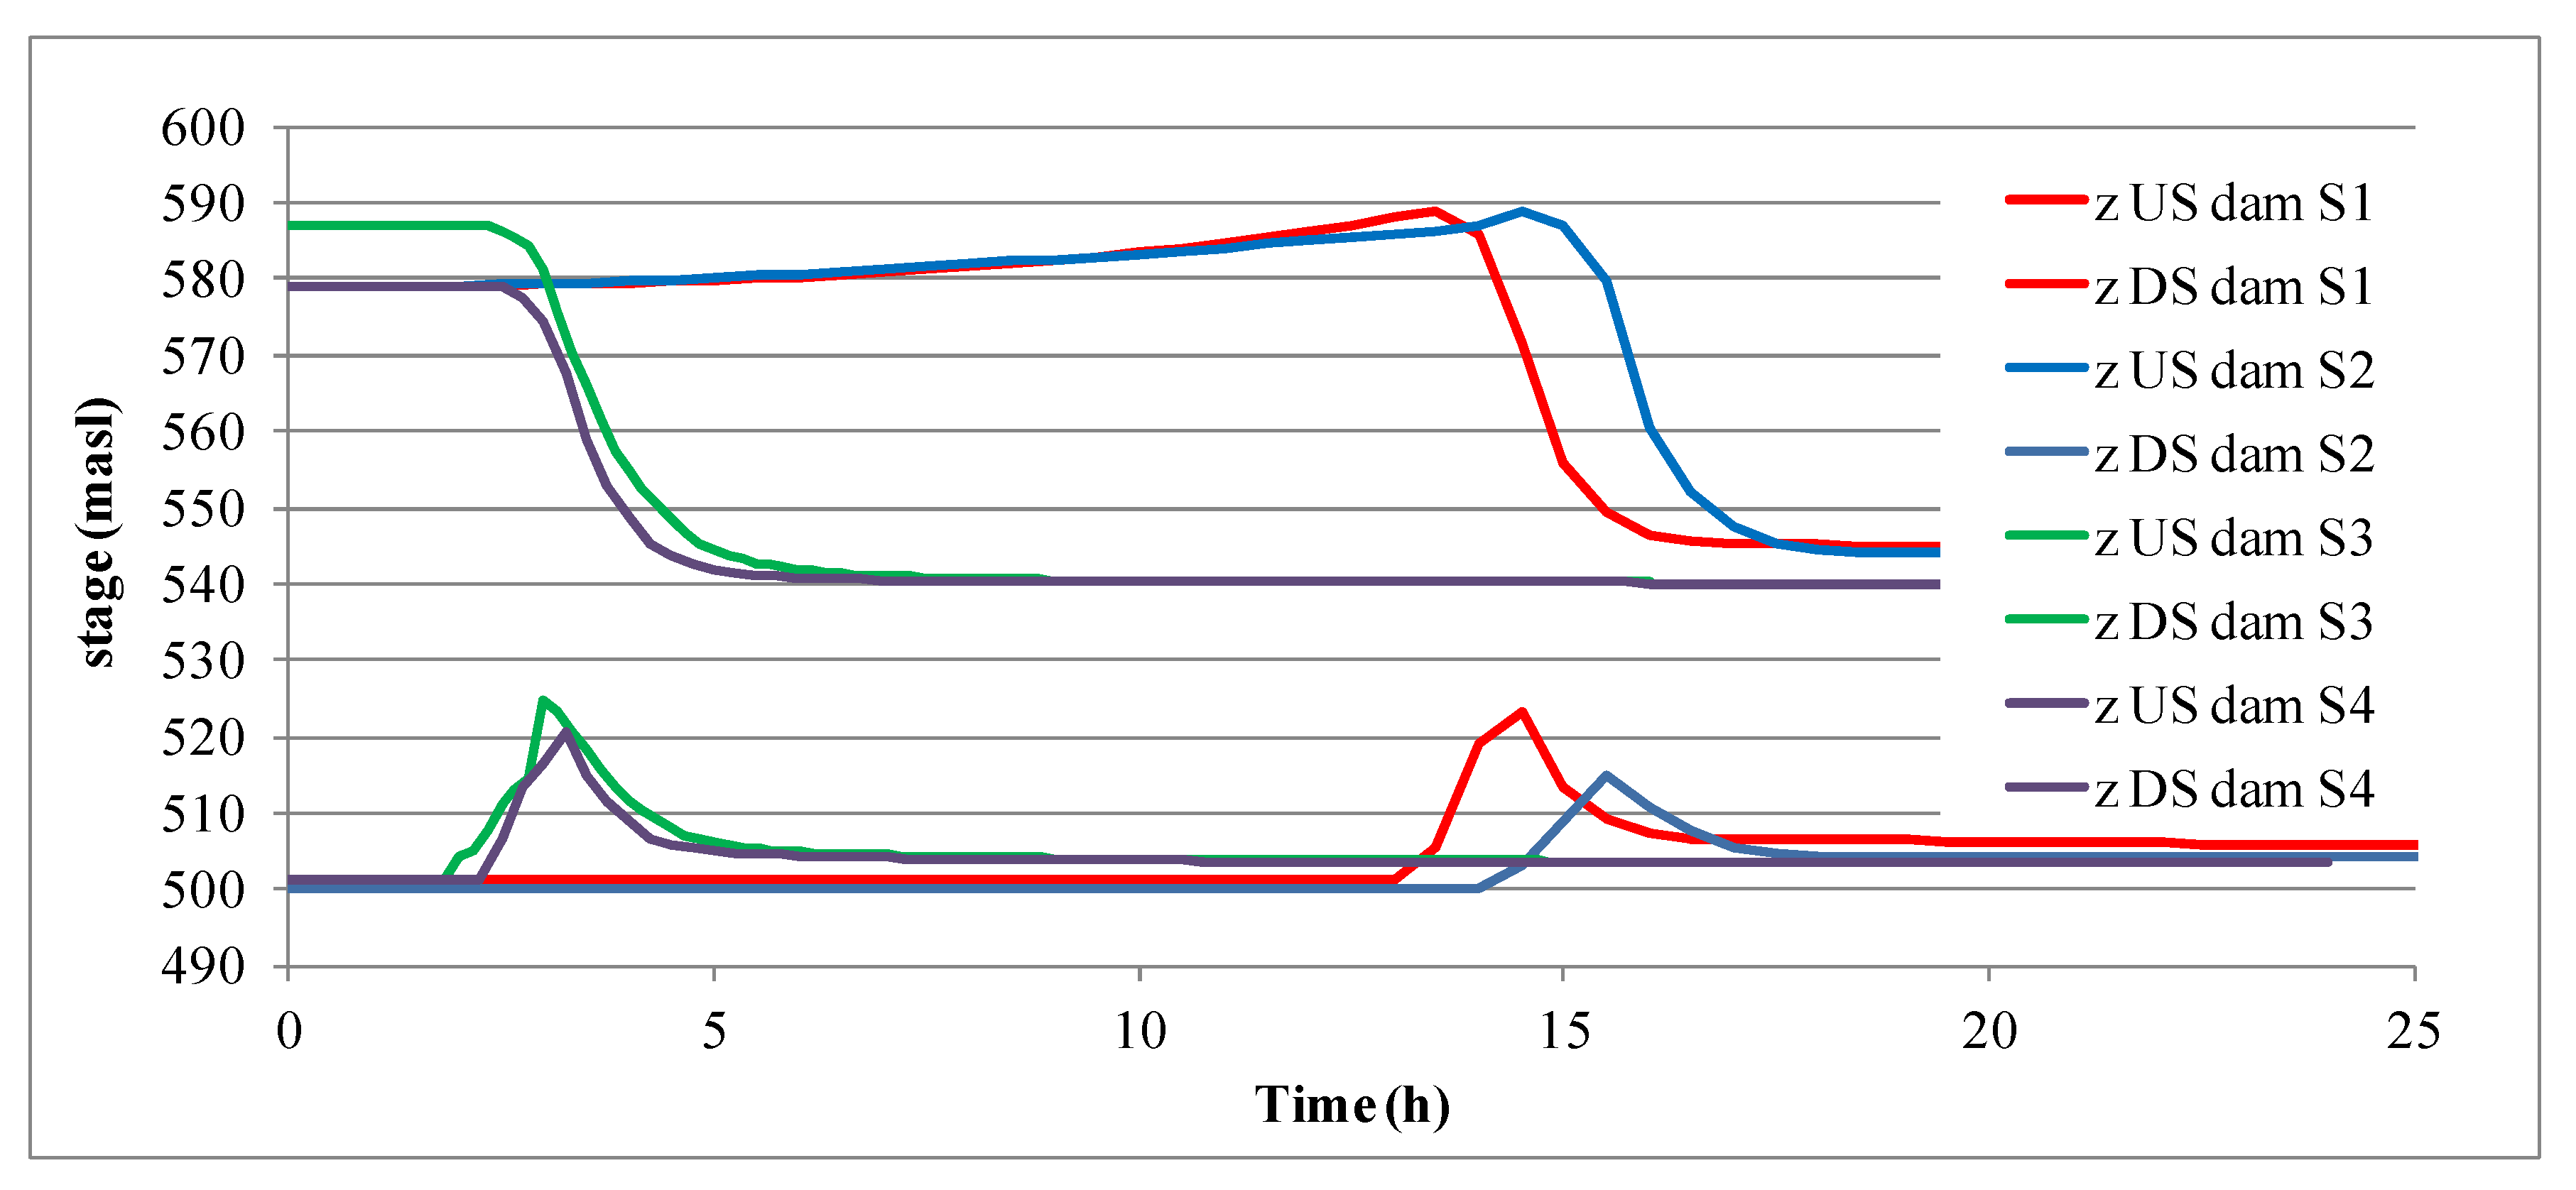
- For the overtopping failure mode, two extreme inflow scenarios are considered: S1 as the 10,000-year flood and S2 as the 1000-year flood. The reservoir fills up from NOP to the dam crest, which is subsequently overtopped. The breach starts when the water surface elevation exceeds the dam crest by 0.3 m. The water flowing through the trapezoidal breach washes out the downstream rockfill face (Figure 8b), and the dam core cracks along a horizontal plane. Next, it slides horizontally, as shown in Figure 8a,b. A time–breach progression curve (defined as a fraction of total breach progression as a function of the total time) is proposed and shown in Figure 8c. It was customized similarly to the one given by [43]. The breach shape is trapezoidal in Figure 8d, and therefore, the outflow is computed with the trapezoidal broad crested weir equation.
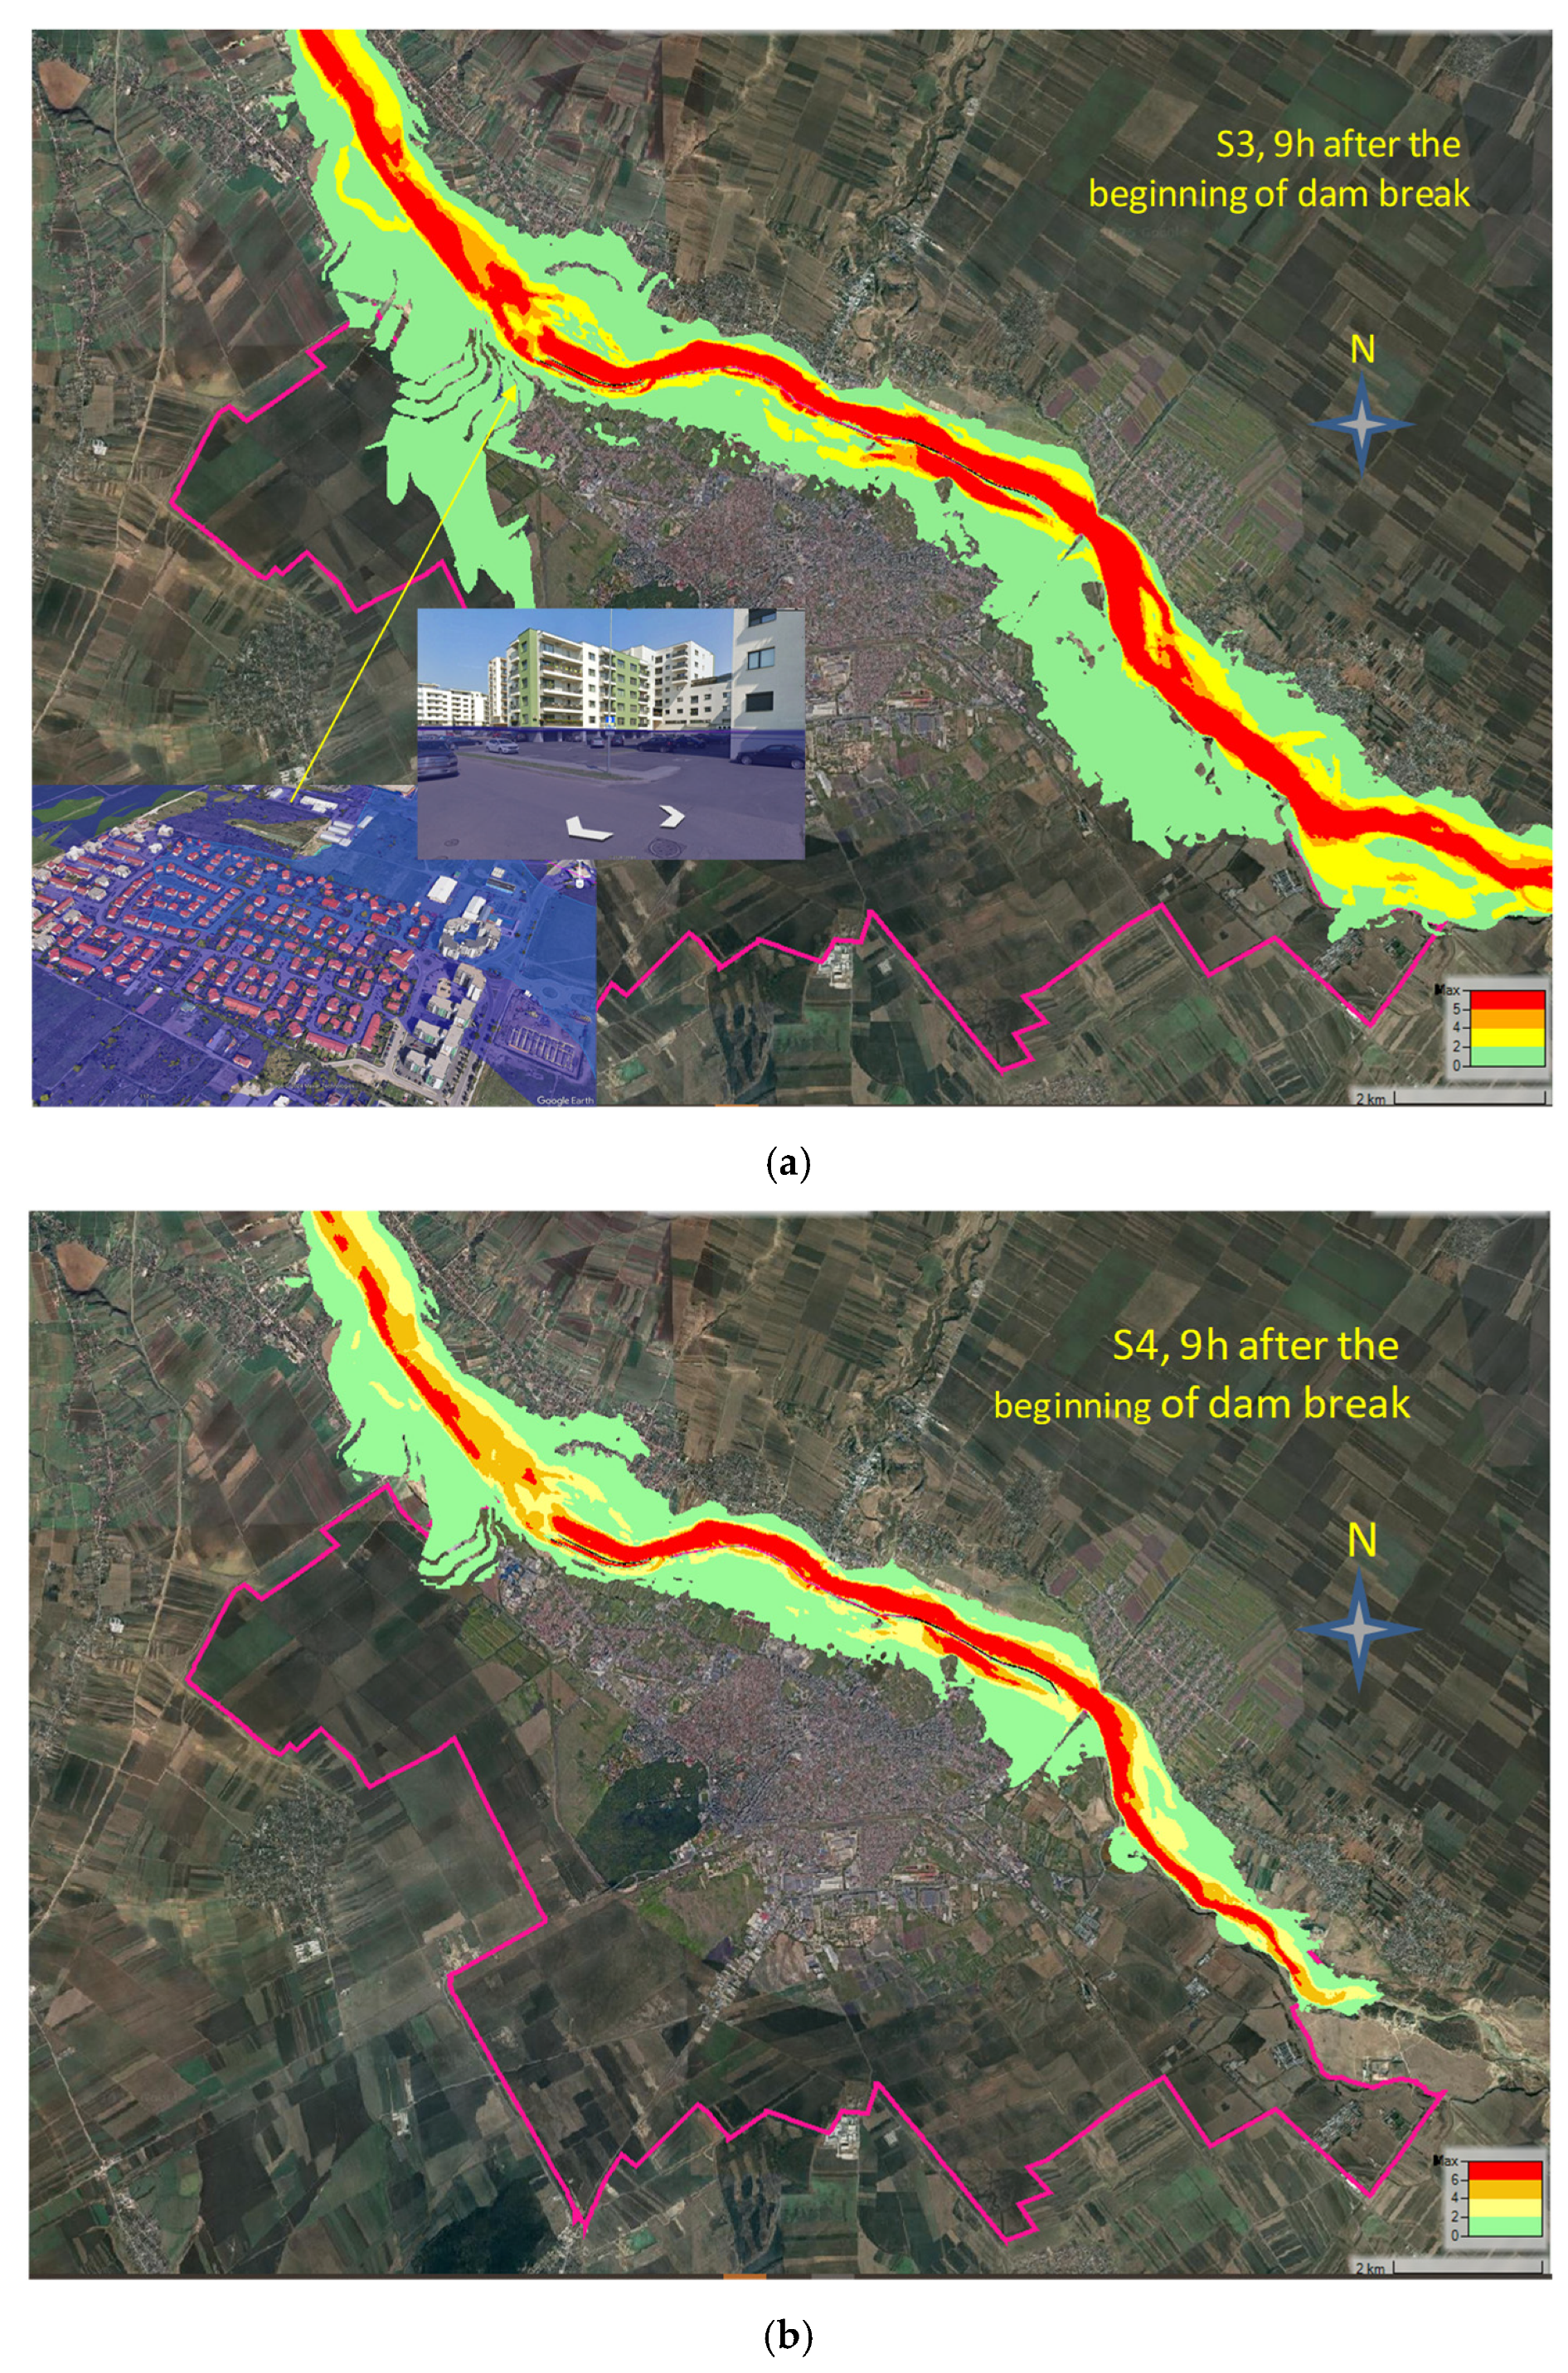
- For the piping failure mode, an erosive action of water is considered that had already initiated through the embankment when an earthquake or an act of sabotage occurs in the absence of a flood (sunny day scenario). The reservoir is full either to NOP (S3) or EFL (S4) levels. In this case, the triggering event generates, at a specific time, a rectangular closed channel (Figure 8e) in the clay core embankment (piping phase). The initial elevation of the hole was considered at 560 m.a.s.l.) The seepage flow through this initial pipe leads to a ceiling collapse [45] and transitions into a trapezoidal broad-crested weir (the overtopping phase). Therefore, the dam break outflow is computed with the orifice equation for the pipe stage and with the weir equation for the overtopping stage. In this failure mode, the same time–progression shape curve was considered as for the overtopping case [45] to analyze the influence of the other parameters on the results. The reservoir inflow is considered to be constant and equal to the multi-annual average flow rate
2.4. Equations
- is the bottom elevation in each computation cell, known from the given topography (considered fixed in time, which means no erosion or deposition occur);
- is the computed water depth;
- is the computed water surface elevation relative to the datum;
- and are the computed depth-averaged velocity components in the and directions, respectively;
- is a source/sink flux term;
- is the horizontal eddy viscosity coefficient;
- and are the horizontal bed shear stresses;
- the hydraulic radius.
2.5. Hazard Quantification
3. Results
4. Discussion
5. Conclusions
Author Contributions
Funding
Data Availability Statement
Conflicts of Interest
References
- Șelărescu, M.; Podani, M. Protection Against Floods (In Romanian–Apărarea Împotriva Inundațiilor); Editura Tehnică: Bucharest, Romania, 1993. [Google Scholar]
- Popa, M.C.; Peptenatu, D.; Drăghici, C.C.; Diaconu, D.C. Flood hazard mapping using the flood and flash-flood potential index in the Buzău river catchment, Romania. Water 2019, 11, 2116. [Google Scholar] [CrossRef]
- Martel, J.L.; Mailhot, A.; Brissette, F. Global and regional projected changes in 100-yr subdaily, daily, and multiday precipitation extremes estimated from three large ensembles of climate simulations. J. Clim. 2020, 33, 1089–1103. [Google Scholar] [CrossRef]
- Norwegian Meteorological Institute. Extreme Weather Events in Europe: Preparing for Climate Change Adaptation. 2013. Available online: https://real.mtak.hu/8366/1/EASAC_EWWG_Extreme_weather_report.pdf (accessed on 15 June 2024).
- Drobot, R.; Draghia, A.F.; Dinu, C.; Sîrbu, N.; Chendeș, V.; Mazilu, P. Adaptive Operating Rules for Flood Control of a Multi-Purpose Reservoir. Hydrology 2024, 11, 147. [Google Scholar] [CrossRef]
- Cea, L.; Costabile, P. Flood Risk in Urban Areas: Modelling, Management and Adaptation to Climate Change. A Review. Hydrology 2022, 9, 50. [Google Scholar] [CrossRef]
- Zhang, Y.; Li, Z.; Ge, W.; Wang, J.; Guo, X.; Wang, T.; Zhang, H. Evaluation of the water pollution risk of dam and dike-break floods in the inundated area. Environ. Sci. Pollut. Res. Int. 2022, 29, 76365–76377. [Google Scholar] [CrossRef]
- Gogoașe-Nistoran, D.E.; Popescu, D.M.; Panaitescu, V. Use of hydraulic modeling for river oil spills. 1. Travel time computation for quick response. UPB Sci. Bull. Ser. D 2008, 70, 263–270. Available online: https://www.scientificbulletin.upb.ro/rev_docs_arhiva/full46116.pdf (accessed on 10 August 2024).
- Popescu, D.-M.; Nistoran Gogoaşe, D.-E.; Panaitescu, V. Use of Hydraulic Modeling for Oil Spills. 2. Influence of response methods on travel time in a case study, & Panaitescu V. UPB Sci. Bull. Ser. D 2008, 70, 271–278. Available online: https://www.scientificbulletin.upb.ro/rev_docs_arhiva/full63206.pdf (accessed on 10 August 2024).
- Duffaut, P. The Traps Behind the Failure of Malpasset Arch Dam, France, in 1959. J. Rock Mech. Geotech. Eng. 2013, 5, 335–341. [Google Scholar] [CrossRef]
- Superchi, L.; Floris, M.; Ghirotti, M.; Genevois, R.; Jaboyedoff, M.; Stead, D. Technical Note: Implementation of a geodatabase of published and unpublished data on the catastrophic Vajont landslide. Nat. Hazards Earth Syst. Sci. 2010, 10, 865–873. Available online: www.nat-hazards-earth-syst-sci.net/10/865/2010 (accessed on 12 September 2024). [CrossRef]
- Graham, W. The Teton Dam Failure: An Effective Warning and Evacuation. ASDSO Annual Conferenc. Indian Wells: Association of State Dam Safety Officials. Available online: https://damfailures.org/wp-content/uploads/2015/07/075_The-Teton-Dam-Failure.pdf (accessed on 20 September 2024).
- You, L.; Chen, L.; Xu, M.; Tong, X. Review of dam-break research of earth-rock dam combining with dam safety management. Procedia Eng. 2012, 28, 382–388. [Google Scholar] [CrossRef]
- Partial Dam Failure Reported at 14 de Julho Hydroelectric Project in Brazil. 5 March 2024. Available online: https://www.hydroreview.com/dams-and-civil-structures/dam-safety/partial-dam-failure-reported-at-14-de-julho-hydroelectric-project-in-brazil/ (accessed on 20 May 2024).
- Costa, J.E. Floods from Dam Failures. Open-File Rep. No. 85-560; USGS: Denver, CO, USA, 1985. Available online: https://pubs.usgs.gov/of/1985/0560/report.pdf (accessed on 3 June 2024).
- Adamo, N.; Al-Ansari, N.; Sissakian, V.; Laue, J.; Knutsson, S. Dam safety problems related to seepage. J. Earth Sci. Geotech. Eng. 2020, 10, 191–239. [Google Scholar]
- ASCE/EWRI Task Committee on Dam/Levee Breaching. Earthen Embankment Breaching. J. Hydraul. Eng. 2011, 137, 1549–1564. [Google Scholar] [CrossRef]
- Aureli, F.; Maranzoni, A.; Petaccia, G. Advances in dam-break modeling for flood hazard mitigation: Theory, numerical models, and applications in hydraulic engineering. Water 2024, 16, 1093. [Google Scholar] [CrossRef]
- Gogoașe Nistoran, D.E.; Ionescu, C.S.; Simionescu Șt, M. Assessing the impact of an arch-dam breach magnitude and reservoir inflow on flood maps. J. Hydroinform. 2024, 26, 33–50. [Google Scholar] [CrossRef]
- Gogoașe Nistoran, D.E.; Ionescu, C.S.; Simionescu Șt, M. Influence of dam break scenarios on flood wave characteristics. Case study–Paltinu Dam, Romania. IOP Conf. Series. Earth Environ. Sci. 2023, 1136, 012031. [Google Scholar] [CrossRef]
- Maranzoni, A.; Tomirotti, M. Three-Dimensional Numerical Modelling of Real-Field Dam-Break Flows: Review and Recent Advances. Water 2023, 15, 3130. [Google Scholar] [CrossRef]
- Aureli, F.; Maranzoni, A.; Petaccia, G. Review of Historical Dam-Break Events and Laboratory Tests on Real Topography for the Validation of Numerical Models. Water 2021, 13, 1968. [Google Scholar] [CrossRef]
- Issakhov, A.; Abylkassymova, A.; Issakhov, A. Numerical study of the dam-break flood over natural rivers with macroscopic rocks on movable beds. Comput. Geotech. 2023, 164, 105793. [Google Scholar] [CrossRef]
- Federico, F.; Cesali, C. Effects of Dam Failure Mechanisms on Downstream Flood Propagation. In Dam Breach Modelling and Risk Disposal. ICED 2020. Springer Series in Geomechanics and Geoengineering; Zhang, J.M., Zhang, L., Wang, R., Eds.; Springer: Cham, Switzerland, 2020. [Google Scholar] [CrossRef]
- Mattas, C.; Karpouzos, D.; Georgiou, P.; Tsapanos, T. Two-Dimensional Modelling for Dam Break Analysis and Flood Hazard Mapping: A Case Study of Papadia Dam, Northern Greece. Water 2023, 15, 994. [Google Scholar] [CrossRef]
- Standard No. 4273-83 Importance Class Ranking, Romanian Standard (In Romanian, Incadrarea in Clase de Importanță). Available online: https://magazin.asro.ro/ro/standard/14319 (accessed on 31 January 2025).
- Methodology for Establishing the Potential Risk Classification of Dams (In Romanian) (2002)-Metodologia Privind Stabilirea Categoriilor de Importanţă a Barajelor NTLH-021. Available online: https://www.mdlpa.ro/userfiles/reglementari/Domeniul_XXV/25_11_NTLH_021.pdf (accessed on 18 May 2024).
- Zhong, Q.; Chen, S.; Deng, Z. A simplified physically-based model for core dam overtopping breach. Eng. Fail. Anal. 2018, 90, 141–155. [Google Scholar] [CrossRef]
- Musolino, G.; Ahmadian, R.; Falconer, R.A. Comparison of flood hazard assessment criteria for pedestrians with a refined mechanics-based method. J. Hydrol. X 2020, 9, 100067. [Google Scholar] [CrossRef]
- Tsai, C.W.; Yeh, J.J.; Huang, C.H. Development of probabilistic inundation mapping for dam failure induced floods. Stoch. Environ. Res. Risk Assess. 2019, 33, 91–110. [Google Scholar] [CrossRef]
- Ialomița-Buzău River Basin Administration. Preliminary Flood Risk Assessment (In Romanian: Evaluarea Preliminară a Riscului la Inundaţii). 2022. Available online: https://inundatii.ro/wp-content/uploads/2022/07/PFRA_Report_RO5_Buzau-Ialomita.pdf (accessed on 17 May 2024).
- Diaconu, D.C. Siriu Reservoir, Buzau River (Romania). Lakes Reserv. Ponds 2008, 1–2, 141–149. Available online: https://www.limnology.ro/Lakes/2008/20081215.pdf (accessed on 6 June 2024).
- Buzău-Ialomiţa Water Basin Administration. Flood Risk Management Plan (In Romanian: Planul de Management al Riscului la Inundaţii. 2022. Available online: https://www.mmediu.ro/app/webroot/uploads/files/RO5_FRMP_PMRI_BUZAU_IALOMITA.pdf (accessed on 17 May 2024).
- Georgescu, E.S.; Pomonis, A. New archival evidence on the 1977 Vrancea, Romania earthquake and its impact on disaster management and seismic risk. In Seismic Hazard and Risk Assessment; Vacareanu, R., Ionescu, C., Eds.; Springer Natural Hazards; Springer: Cham, Switzerland, 2018. [Google Scholar] [CrossRef]
- Popovici, A. Dams for Water Storage (In Romanian–Baraje Pentru Acumulari de Apă. Vomumul 2); Editura Tehnică: Bucharest, Romania, 1992; Volume 2. [Google Scholar]
- USACE-US Army Corps of Engineers. Hydraulic Engineering Center–River Analysis System, HEC-RAS, Hydraulic Reference Manual. 2022. Available online: https://www.hec.usace.army.mil/confluence/rasdocs/ras1dtechref/6.3/performing-a-dam-break-study-with-hec-ras/estimating-dam-breach-parameters/estimating-breach-parameters (accessed on 20 October 2024).
- USACE-US Army Corps of Engineers. Hydraulic Engineering Center–River Analysis System, HEC-RAS Software, Version 6.6. 2022. Available online: https://www.hec.usace.army.mil/software/hec-ras/download.aspx (accessed on 20 October 2024).
- NACLR-National Agency for Cadastre and Land Registration (In Romanian: Agenția Națională de Cadastru și Publicitate Imobiliară-ANCPI). Available online: https://geoportal.ancpi.ro/portal/apps/webappviewer/index.html?id=50289a41aafc4e01aefd131c2105e374 (accessed on 18 June 2024).
- Corine Land Cover 2018 Vector Dataset 100m, Copernicus, EU. Available online: https://land.copernicus.eu/en/map-viewer?dataset=0407d497d3c44bcd93ce8fd5bf78596a (accessed on 5 November 2024).
- Athani, S.S.; Solanki, C.H.; Dodagoudar, G.R. Seepage and Stability Analyses of Earth Dam Using Finite Element Method. Aquat. Procedia 2015, 4, 876–883. [Google Scholar] [CrossRef]
- Santos, K.G. Irrigation Engineering and Hydraulic Structures, 19th revised ed.; Khanna Publishers: Delhi, India, 2005. [Google Scholar]
- Zhang, L.M.; Xu, Y.; Jia, J.S. Analysis of earth dam failures: A database approach. Georisk Assess. Manag. Risk Eng. Syst. Geohazards 2009, 3, 184–189. [Google Scholar] [CrossRef]
- Zhong, Q.; Wang, L.; Chen, S.; Chen, Z.; Shan, Y.; Zhang, Q.; Ren, Q.; Mei, S.; Jiang, J.; Hu, L.; et al. Breaches of embankment and landslide dams-State of the art review. Earth-Sci. Rev. 2021, 216, 103597. [Google Scholar] [CrossRef]
- Normative on the Analysis and Assessment of Risk Due to Dams. (In Romanian: Normativ Privind Analiza și Evaluarea Riscului Asociat Barajelor), NP 132-2011. 2011. Available online: https://www.mdlpa.ro/userfiles/reglementari/Domeniul_XIX/19_17_NP_132_2011.pdf (accessed on 18 May 2024).
- Chen, S.S.; Zhong, Q.M.; Shen, G.Z. Numerical modeling of earthen dam breach due to piping failure. Water Sci. Eng. 2019, 12, 169–178. [Google Scholar] [CrossRef]
- Ionescu, C.S.; Gogoaşe Nistoran, D.E. Influence of reservoir shape upon the choice of Hydraulic vs. Hydrologic reservoir routing method, Conf. on Sustainable Solutions for Energy and Environment (EENVIRO 2018), Cluj Napoca, ROMANIA, OCT 09-13, 2018. In Book Series: E3S Web of Conferences; EDP Sciences: Les Ulis, France, 2019; Volume 85, p. 07001. [Google Scholar] [CrossRef]
- Grecu, F.; Ioana-Toroimac, G.; Molin, P.; Dramis, F. River channel dynamics in the contact area between the Romanian Plain and the Curvature Subcarpathians. Rev. Geomorfol. 2014, 16, 5–12. [Google Scholar]
- Ennouini, W.; Fenocchi, A.; Petaccia, G.; Persi, E.; Sibilla, S. A complete methodology to assess hydraulic risk in small ungauged catchments based on HEC-RAS 2D Rain-On-Grid simulations. Nat. Hazards 2024, 120, 7381–7409. [Google Scholar] [CrossRef]
- Flood Risk Management in Romania (In Romanian). Available online: https://harticiclul2.inundatii.ro/map@45.4391830,26.1489528,12z (accessed on 20 November 2024).
- Ferrari, A.; Vacondio, R.; Mignosa, P. High-resolution 2D shallow water modelling of dam failure floods for emergency action plans. J. Hydrol. 2023, 618, 129192. [Google Scholar] [CrossRef]
- Australian Institute for Disaster Resilience, Australian Government. Flood Hazard 2017. Available online: https://knowledge.aidr.org.au/media/3518/adr-guideline-7-3.pdf (accessed on 2 February 2025).
- Roșu, C.; Crețu, G. Accidental Floodings (In Romanian–Inundații Accidentale); H*G*A* Publishing House: Bucharest, Romania, 1998. [Google Scholar]
- Aureli, F.; Maranzoni, A.; Mignosa, P.; Ziveri, C. 2D numerical modelling for hydraulic hazard assessment: A dam-break case study 2D numerical modelling for hydraulic hazard assessment: A dam-break case study. In Proceedings of the International Conference on Fluvial Hydraulics River Flow 2008, Izmir, Turkey,, 3–5 September 2008. [Google Scholar]
- Chen, T.Y.K.; Capart, H. Kinematic wave solutions for dam-break floods in non-uniform valleys. J. Hydrol. 2020, 582, 124381. [Google Scholar] [CrossRef]
- Marangoz, H.O.; Anilan, T. Two-dimensional modeling of flood wave propagation in residential areas after a dam break with application of diffusive and dynamic wave approaches. Nat. Hazards 2021, 110, 429–449. [Google Scholar] [CrossRef]
- Doğan, E.; Temiz, T.; Sönmez, O.; Demirci, B.; Spor, P.; Cumhur, A. Dam failure analysis according to different methods in HEC-RAS, Gökçe Dam, Turkey. Acta Sci. 2024, 46, e64391. [Google Scholar] [CrossRef]
- Al-Fugara, A.; Mabdeh, A.N.; Alayyash, S.; Khasawneh, A. Hydrological and Hydrodynamic Modeling for Flash Flood and Embankment Dam Break Scenario: Hazard Mapping of Extreme Storm Events. Sustainability 2023, 15, 1758. [Google Scholar] [CrossRef]
- Beza, M.; Fikre, A.; Moshe, A. Dam breach modeling and downstream flood inundation mapping using HEC-RAS model on the proposed Gumara Dam, Ethiopia. Adv. Civ. Eng. 2023, 11, 78. [Google Scholar] [CrossRef]
- Hosseinzadeh-Tabrizi, S.A.; Ghaeini-Hessaroeyeh, M.; Ziaadini-Dashtekhaki, M. Numerical simulation of dam-breach flood waves. Appl. Water Sci. 2022, 12, 100. [Google Scholar] [CrossRef]
- Bharath, A.; Shivapur, A.V.; Hiremath, C.G.; Maddamsetty, R. Dam break analysis using HEC-RAS and HEC-GeoRAS: A case study of Hidkal dam, Karnataka state, India. Environ. Chall. 2021, 5, 100401. [Google Scholar] [CrossRef]


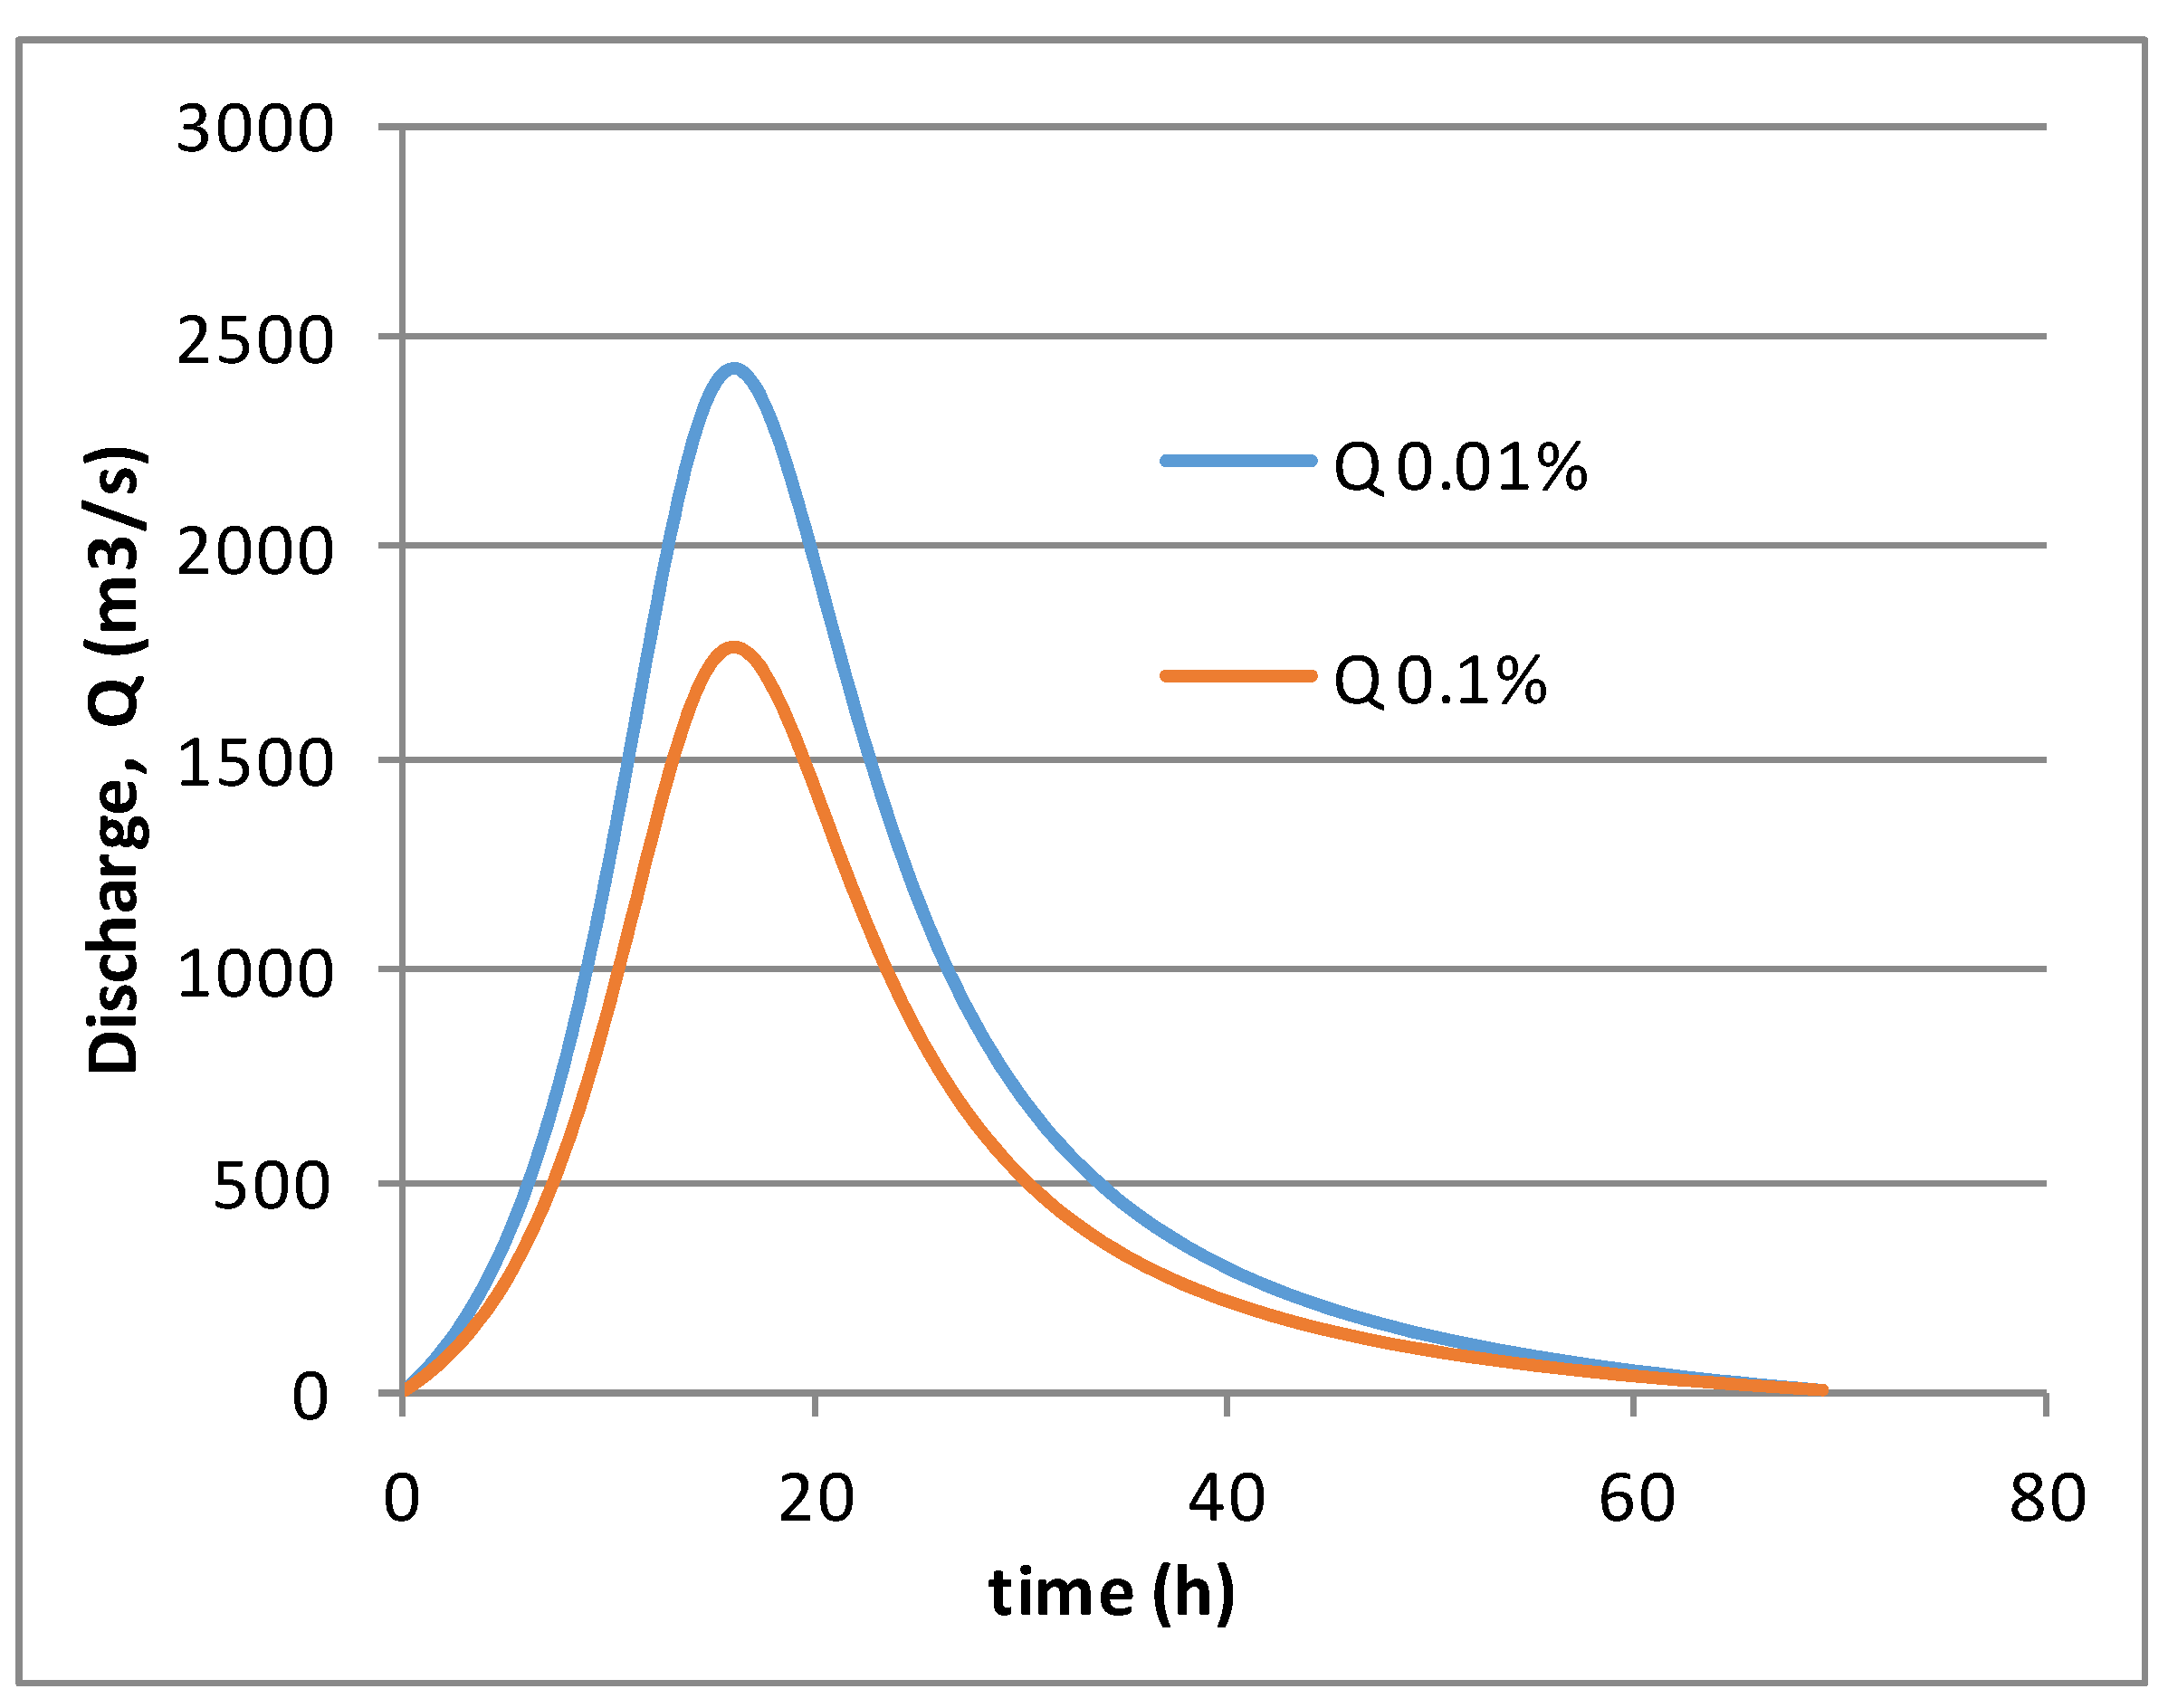
| Case | (m3/s) | (h) | Exceedance Probability | Return Period, T (yr) | Total Duration (h) |
|---|---|---|---|---|---|
| 1 | 2420 | 16 | 0.01% | 10,000 | 69 |
| 2 | 1765 | 16 | 0.1% | 1000 | 69 |
| Current No. | Characteristic Feature | Value (Meas. Unit) |
|---|---|---|
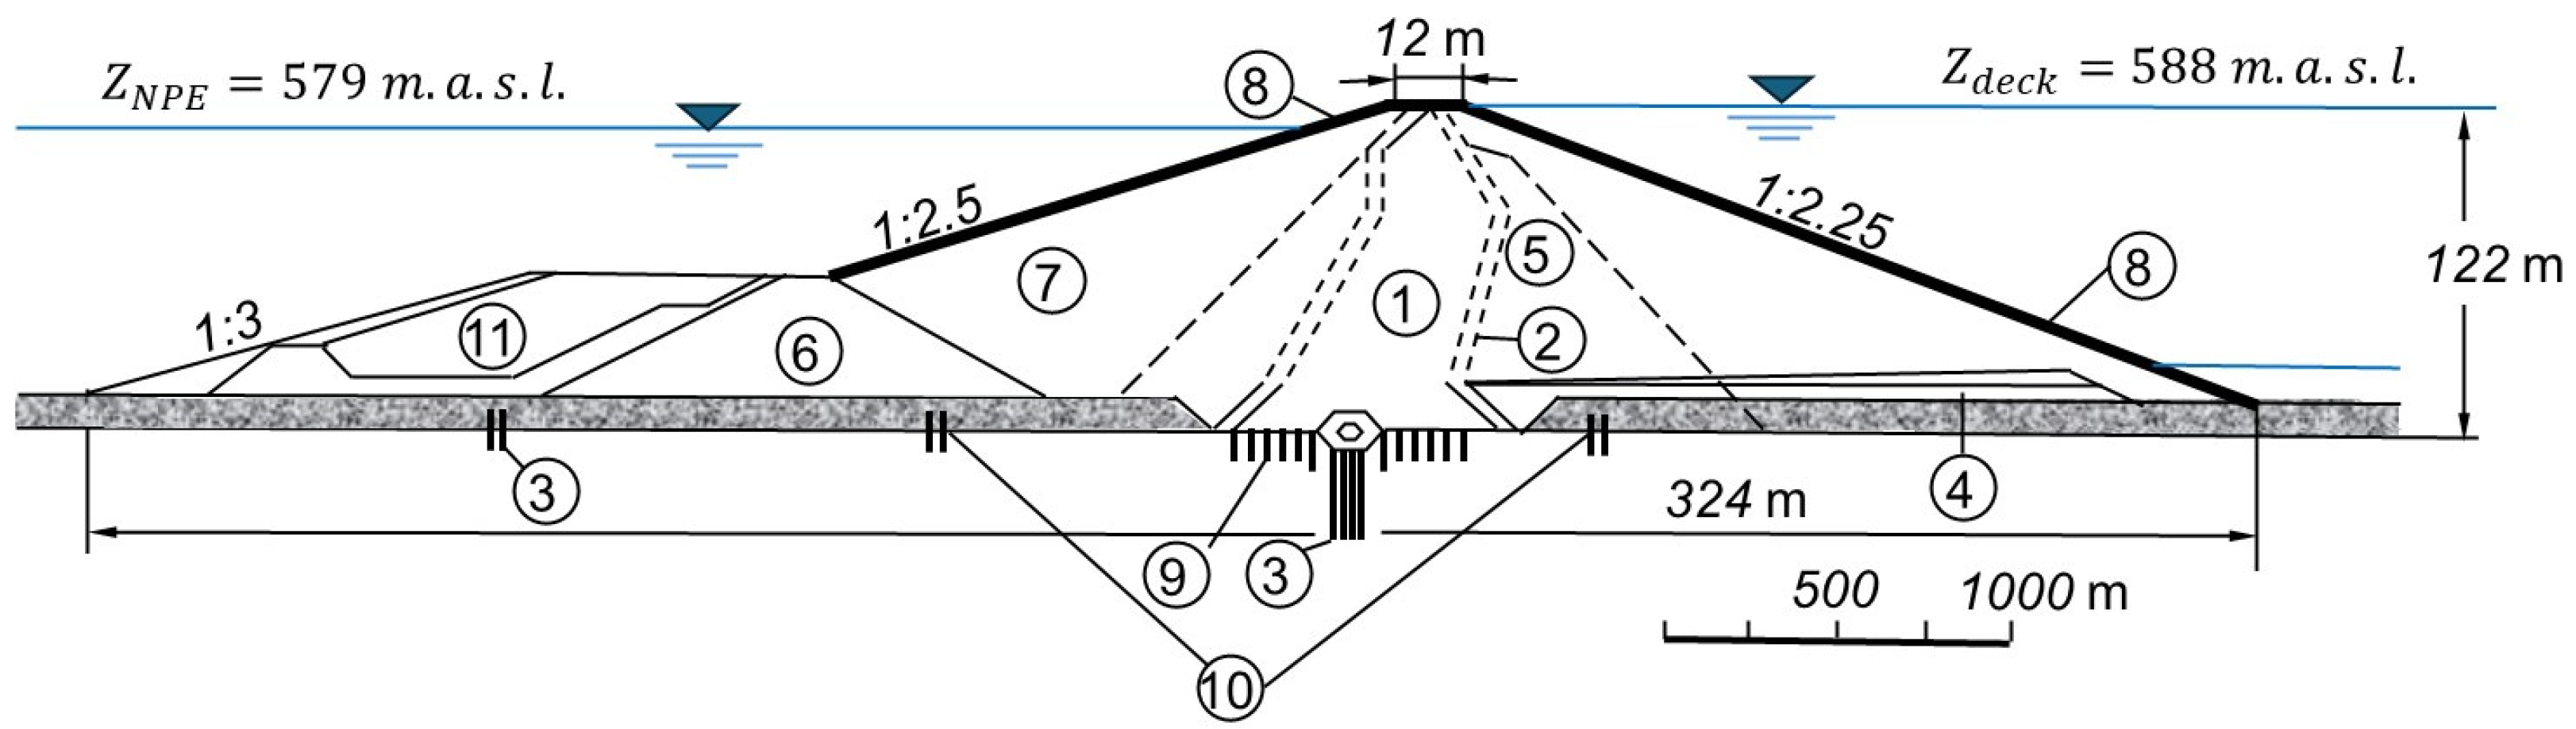
| 1 | Dam height | 121 m |
| 2 | Length at deck (top) | 570 m. |
| 3 | Length at the bottom | 824 m. |
| 4 | Deck (crest) elevation | 588 m.a.s.l. |
| 5 | Top of the gates’ elevation | 575 m.a.s.l. |
| 6 | Spillway elevation | 575 m.a.s.l. |
| 7 | Width at deck | 12 m |
| 6 | Average upstream slope (H:V) | 1:2.5 |
| 7 | Downstream slope (H:V) | 1:2.25 |
| 8 | Initial thalweg elevation at dam | 482 m.a.s.l. |
| 9 | Design peak discharge 0.1% | 1765 m3/s |
| 10 | Verification peak discharge 0.01% | 2420 m3/s |
| 11 | Density of the central core | 2039 kg/m3 |
| 12 | Volume of embankment material | 8.3 mil. m3 |
| Current No. | Characteristic Feature | Value (Measure Unit) |
|---|---|---|
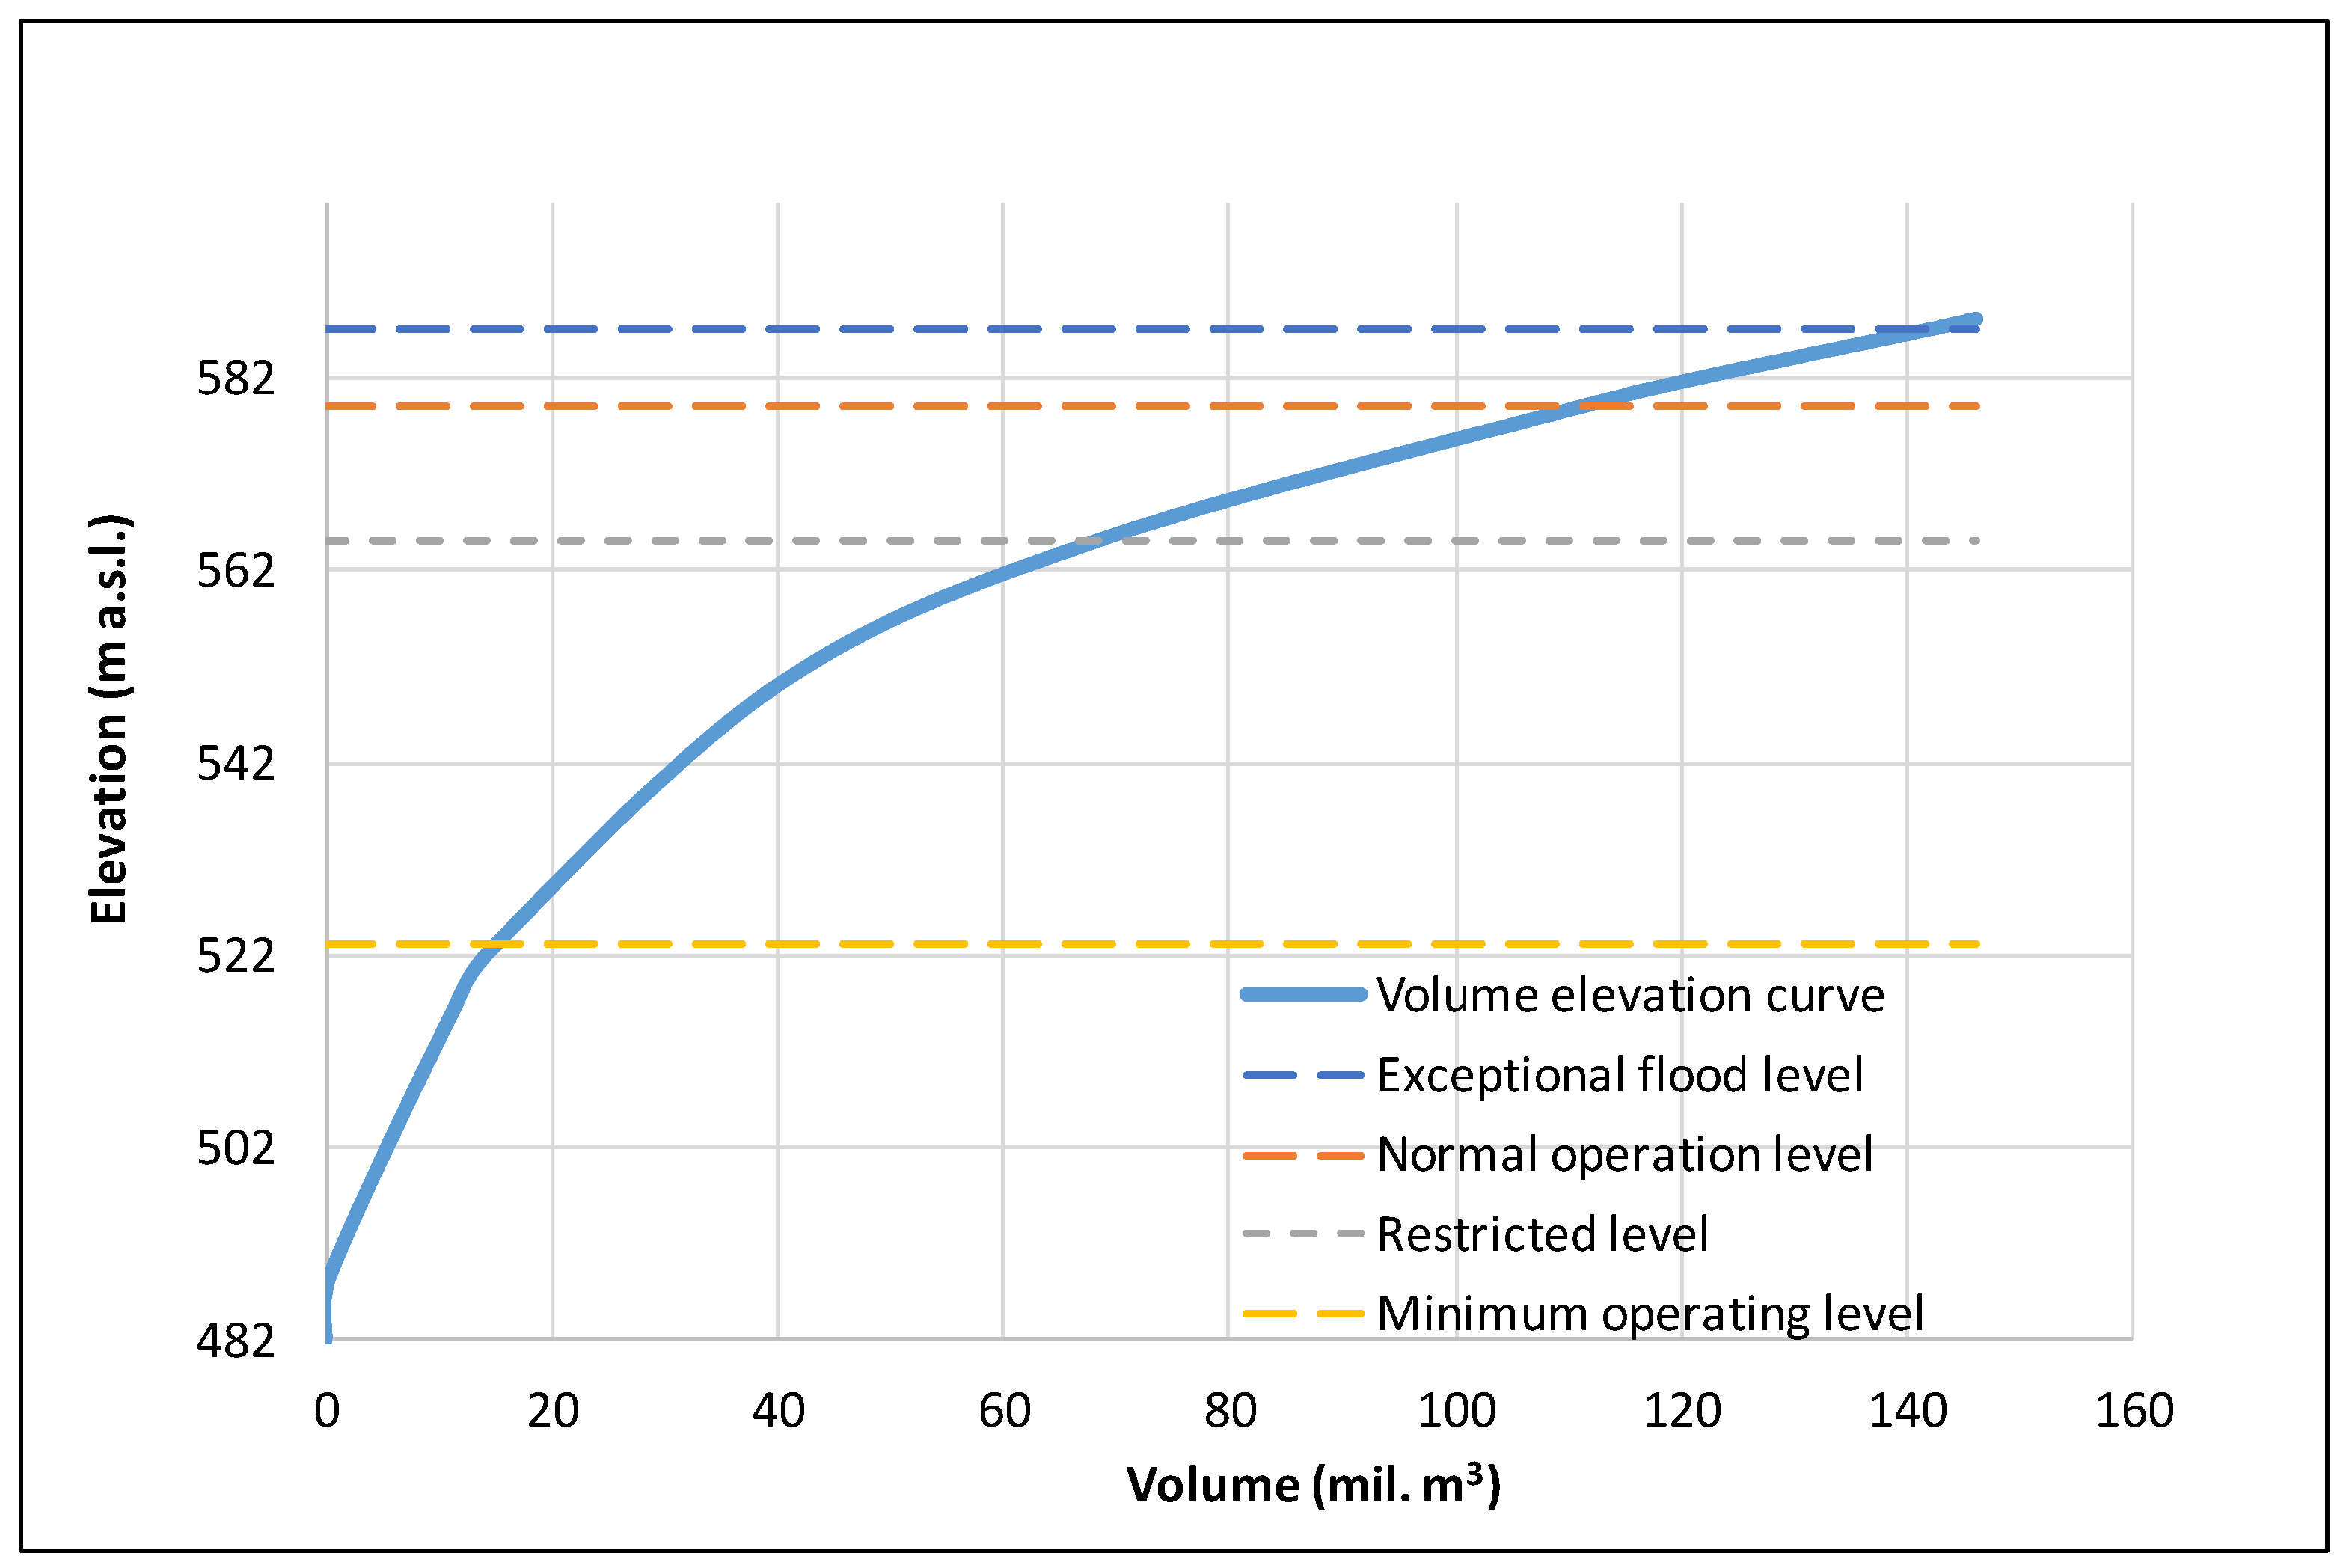
| 1 | Normal Operating Pool—NOP Level (or Full Reservoir Level—FRL) | 579 m.a.s.l. |
| 2 | Exceptional Flood Level—EFL | 587 m.a.s.l. |
| 3 | Minimum Operating Pool (mOP) Level | 523 m.a.s.l. |
| 4 | Total volume at NOP level | 111.38 (mil. m3) |
| 5 | Total volume at EFL level | 146 (mil. m3) |
| 6 | Restricted level | 565 m.a.s.l. |
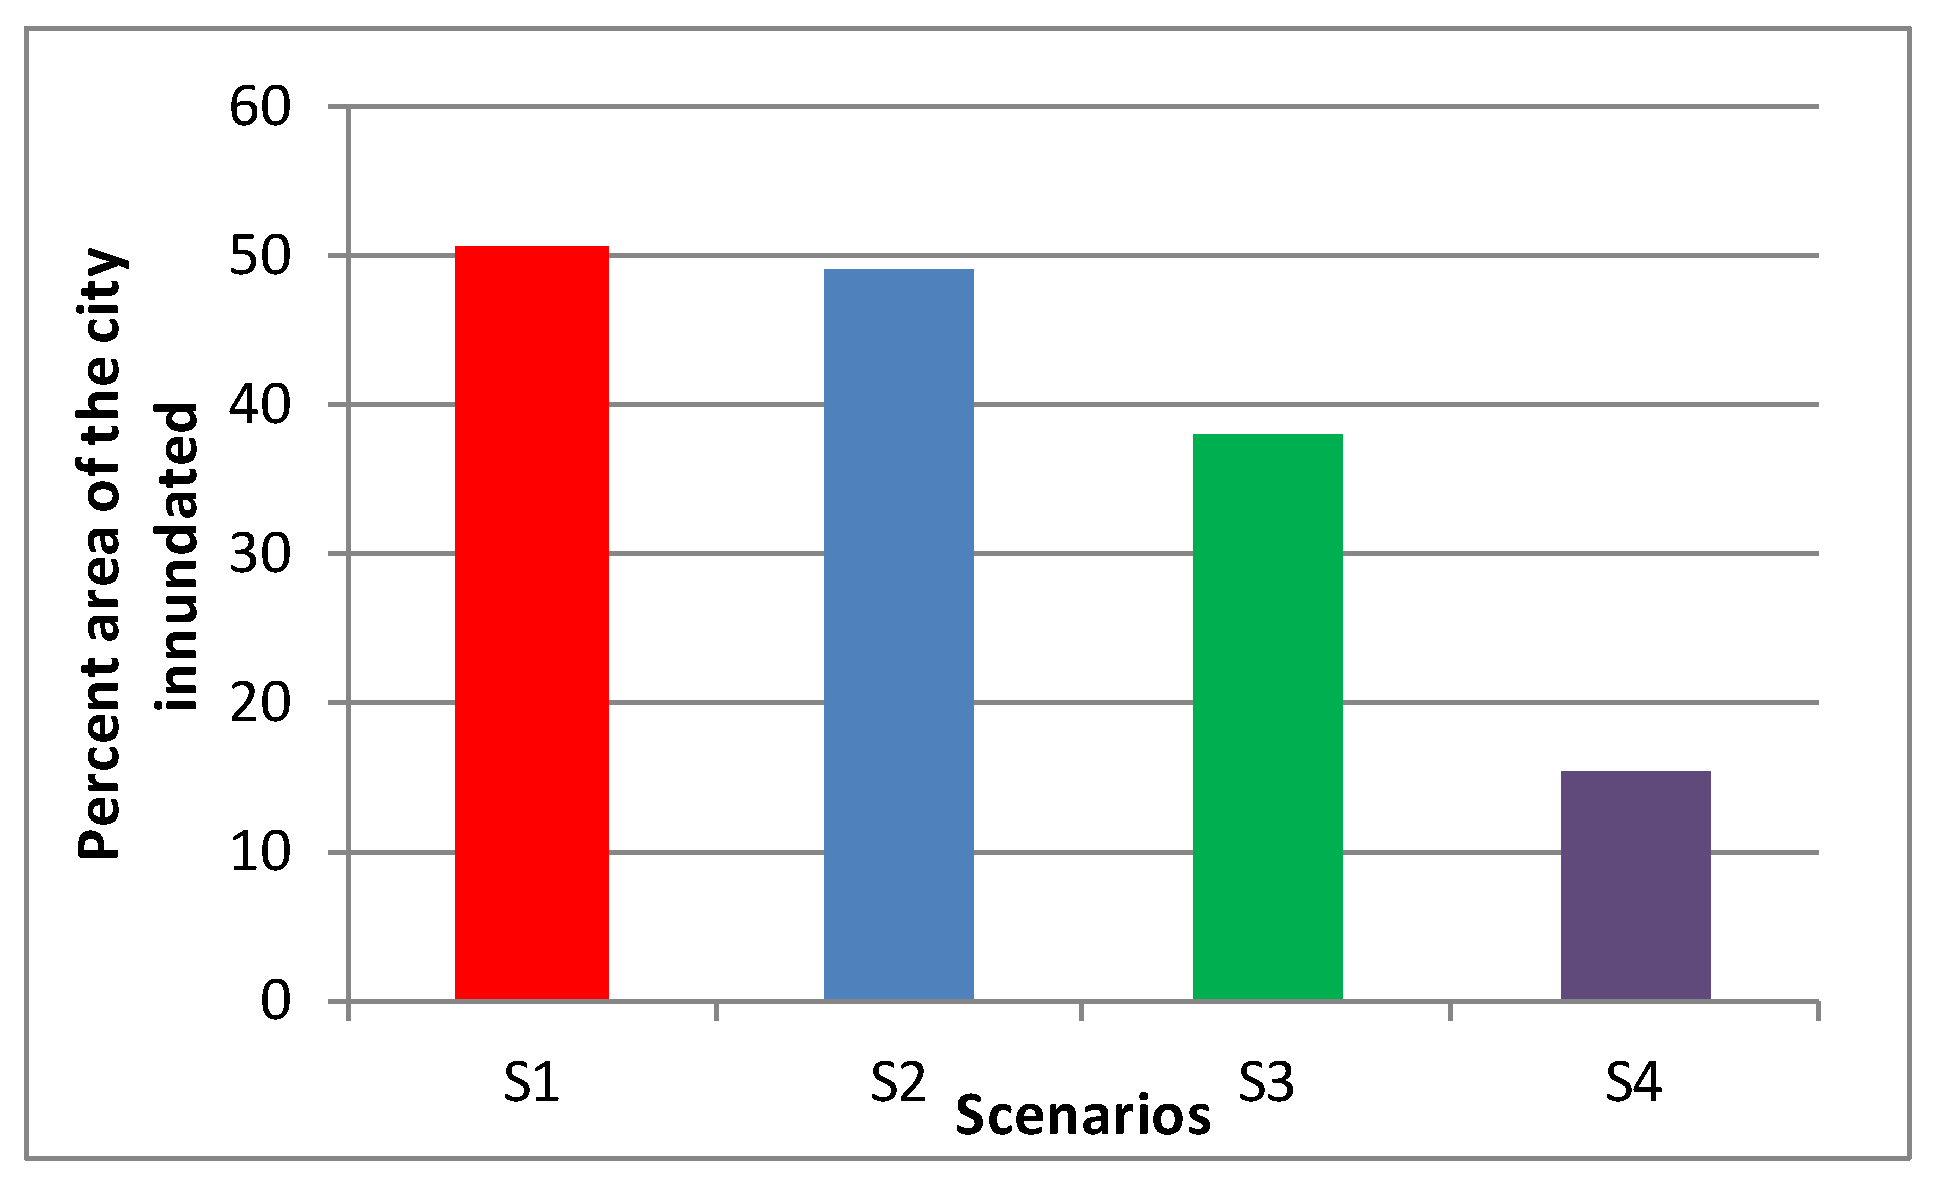
| Scenario | Overtopping | Piping | ||
|---|---|---|---|---|
| S1 | S2 | S3 | S4 | |
| Peak flood inflow, Q (m3/s) | 2420 | 1765 | 9.6 | 9.6 |
| Initial level in reservoir (m.a.s.l.) | 579 | 579 | 587 | 579 |
| Initial volume in reservoir (mil. m3) | 111.38 | 111.38 | 146 | 111.38 |
| Breach width at base, W (m) | 150 | 150 | 100 | 100 |
| Initial breach elevation (m.a.s.l.) | 588.3 | 588.3 | 560 | 560 |
| Breach formation time, Tb (h) | 2 | 2 | 2 | 2 |
| Breach slope H:V | 0.85 | 0.85 | 0.85 | 0.85 |
| Final breach elevation (m.a.s.l.) | 540 | 540 | 540 | 540 |
| Dam breach area/total (%) | 24 | 24 | 18 | 18 |
| Parameter | (m) | (m/s) | |
|---|---|---|---|
| Hazard Classification | |||
| Low (H1) | < 0.45 | < 1.5 | |
| Caution (H2) | 0.45 ÷ 0.8 | 1.5 ÷ 1.6 | |
| Moderate (H3) | 0.8 ÷ 1 | 1.6 ÷2 | |
| Significant (H4) | 1 ÷ 2 | 2 ÷3 | |
| Severe (H5) | 2 ÷ 5 | 3 ÷ 5 | |
| Extreme (H6) | >5 | >5 | |
| Parameter | (m2/s) | |
|---|---|---|
| Hazard Classification | ||
| Low (H1) | < 2 | |
| Moderate (H2) | 2÷4 | |
| Severe (H3) | 4÷6 | |
| Extreme (H4) | > 6 | |
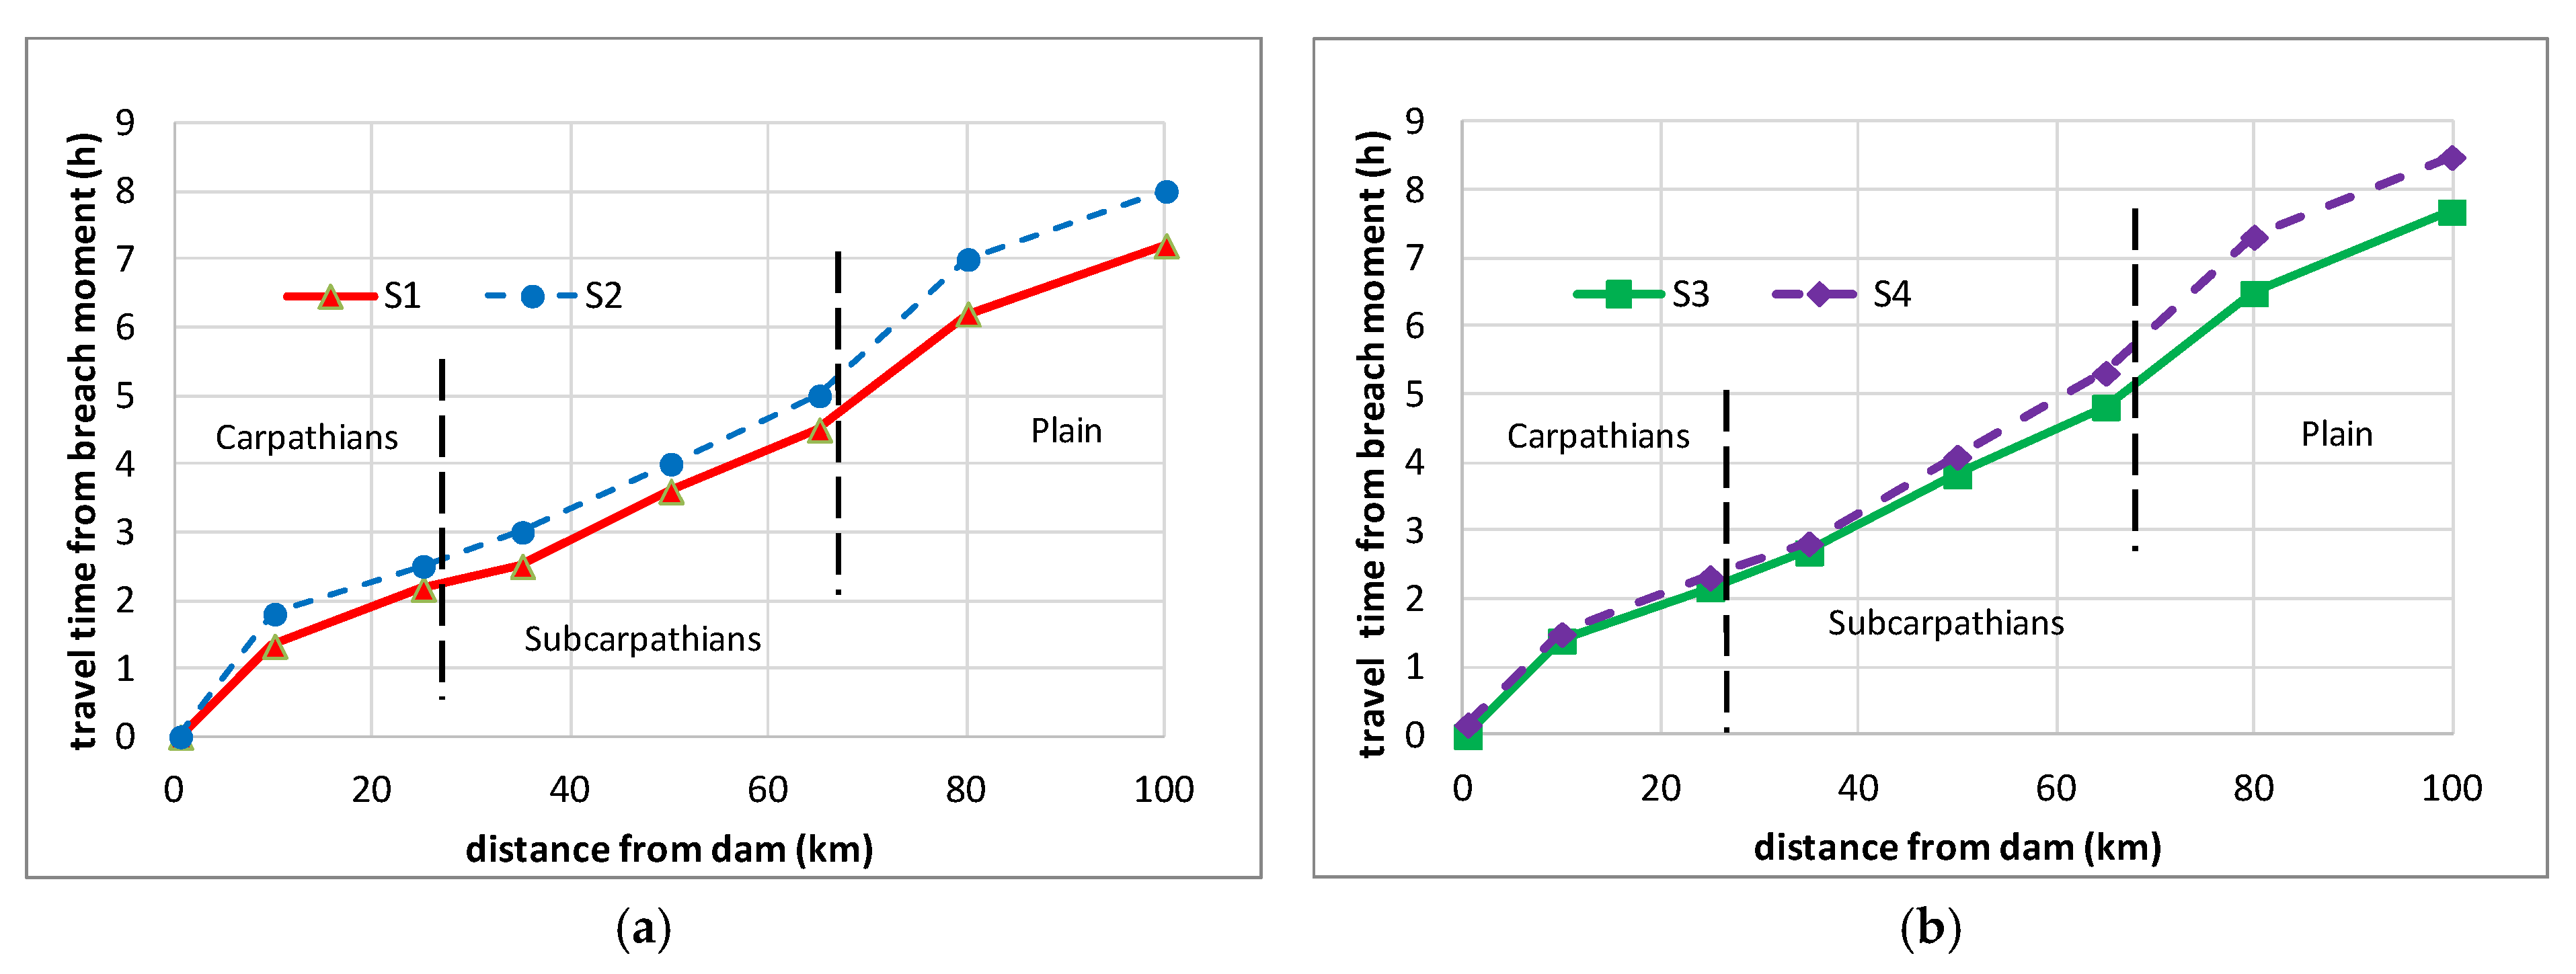
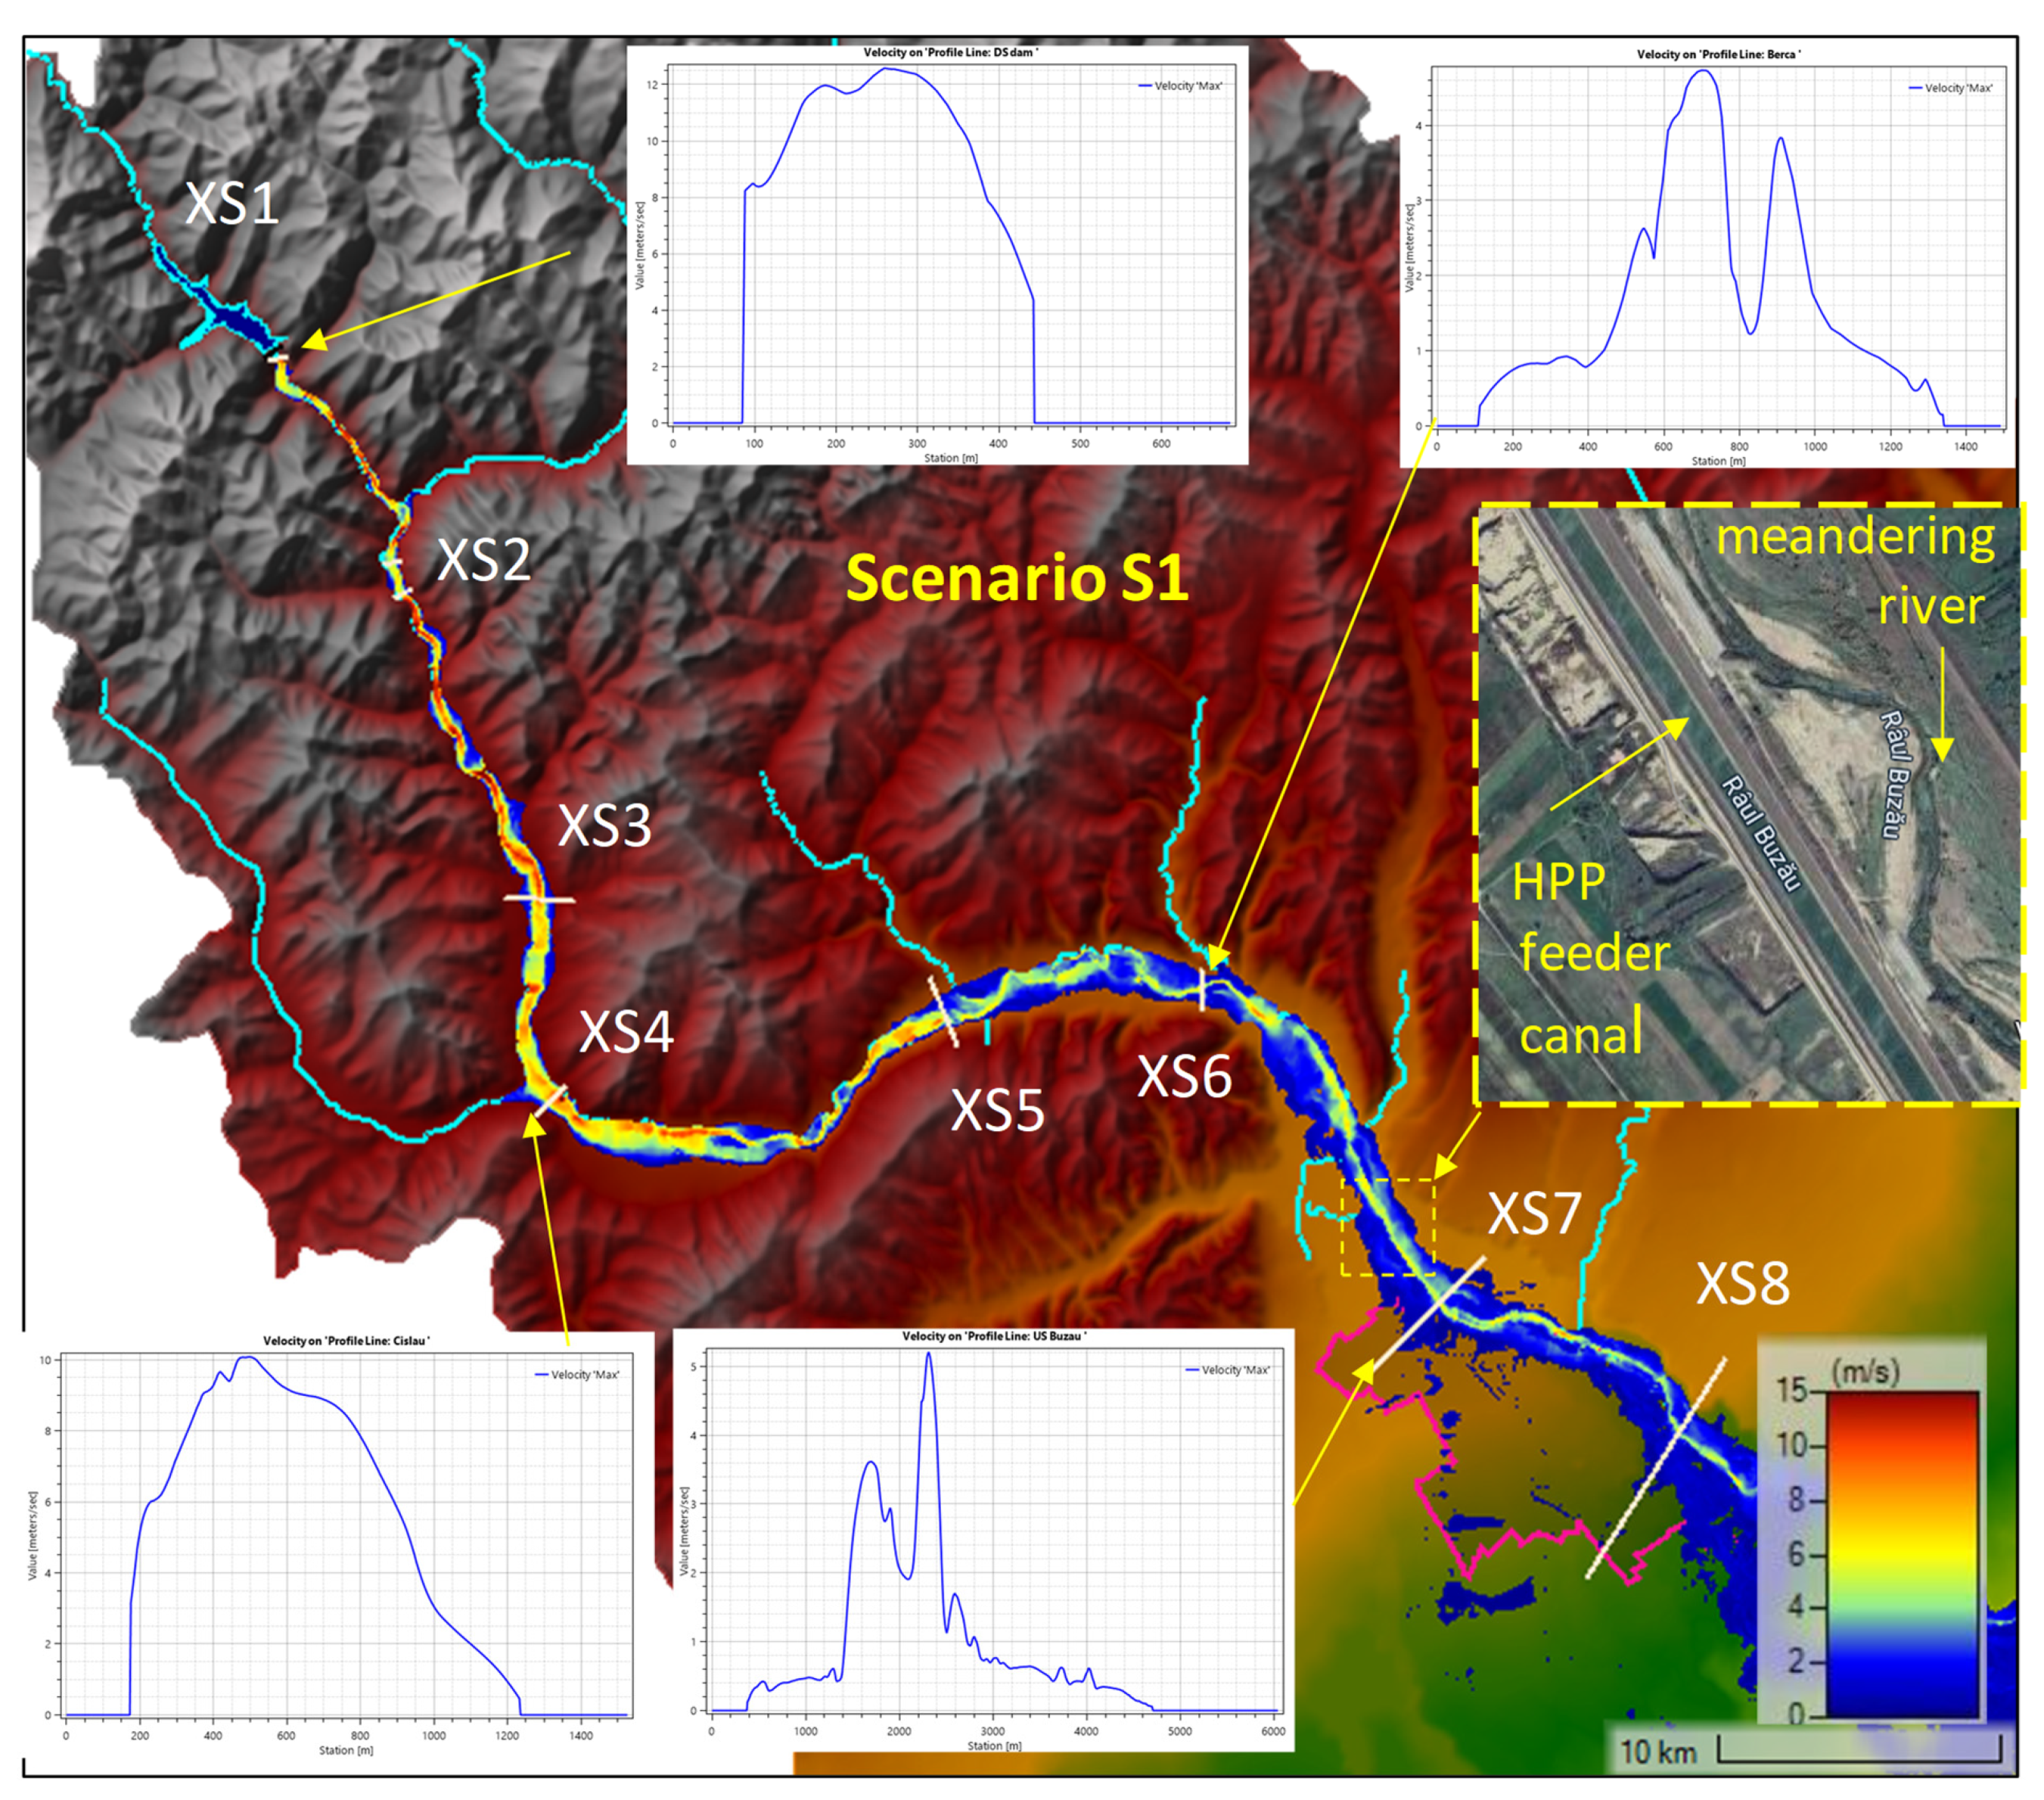
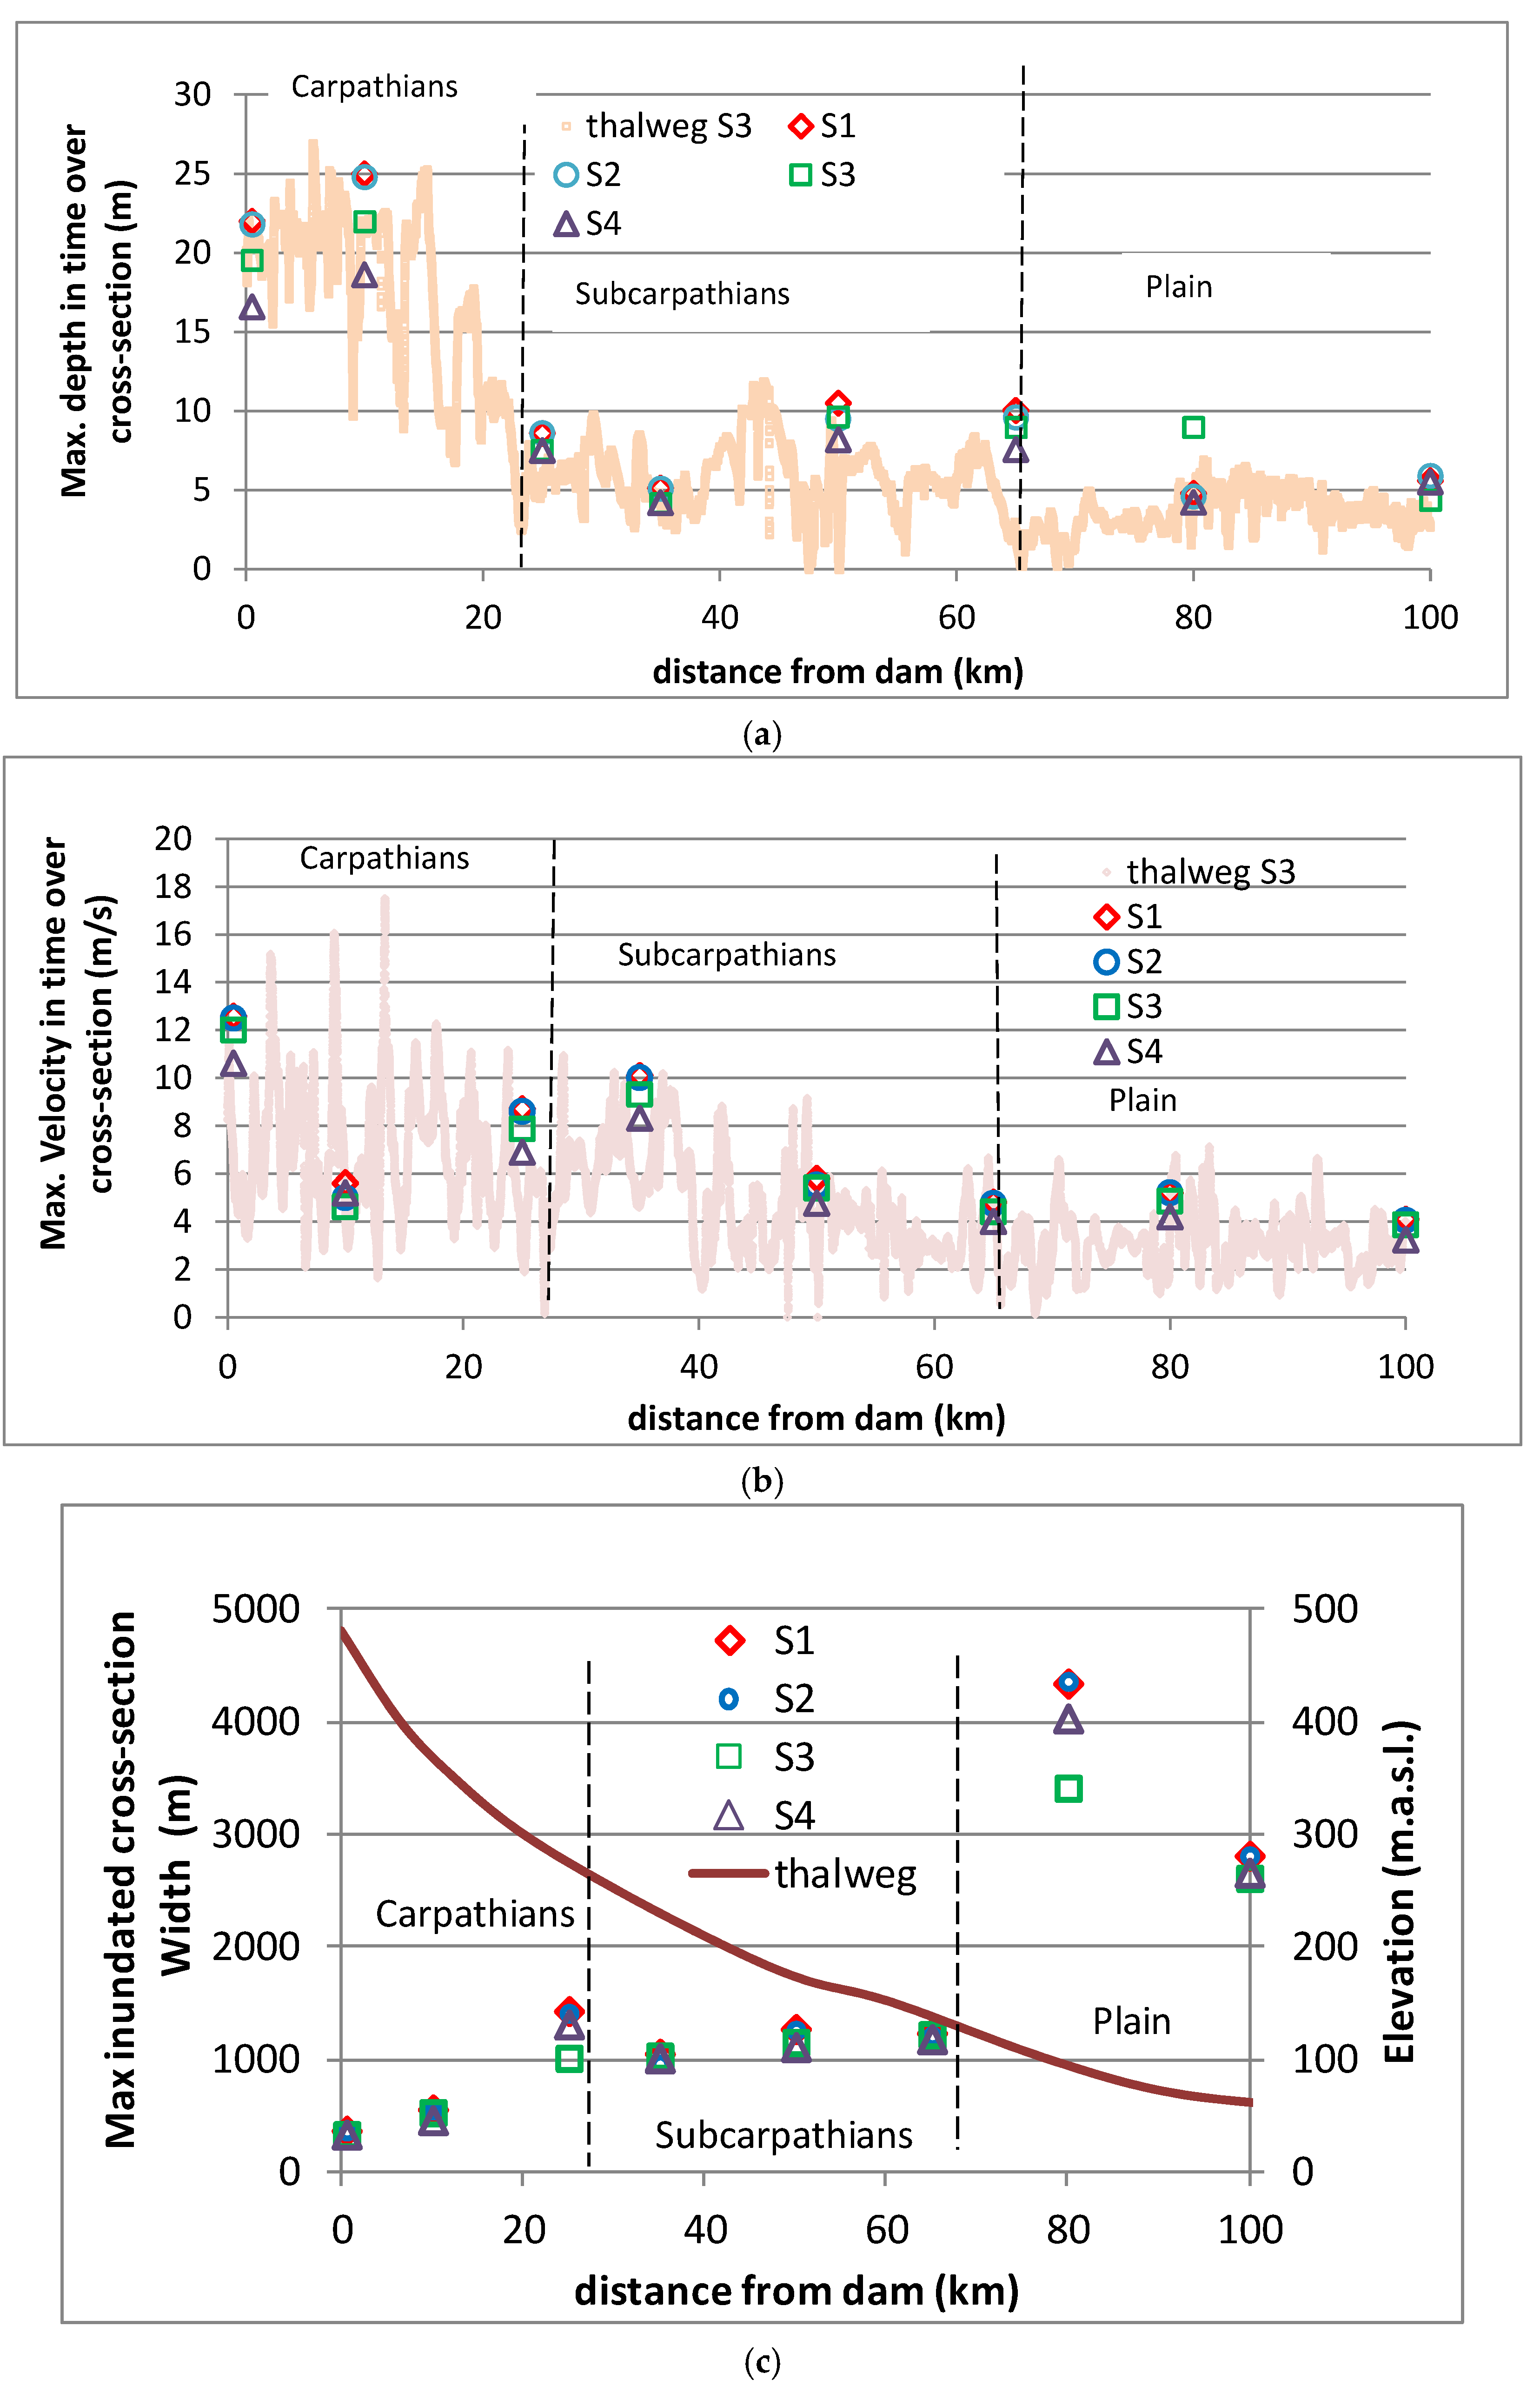
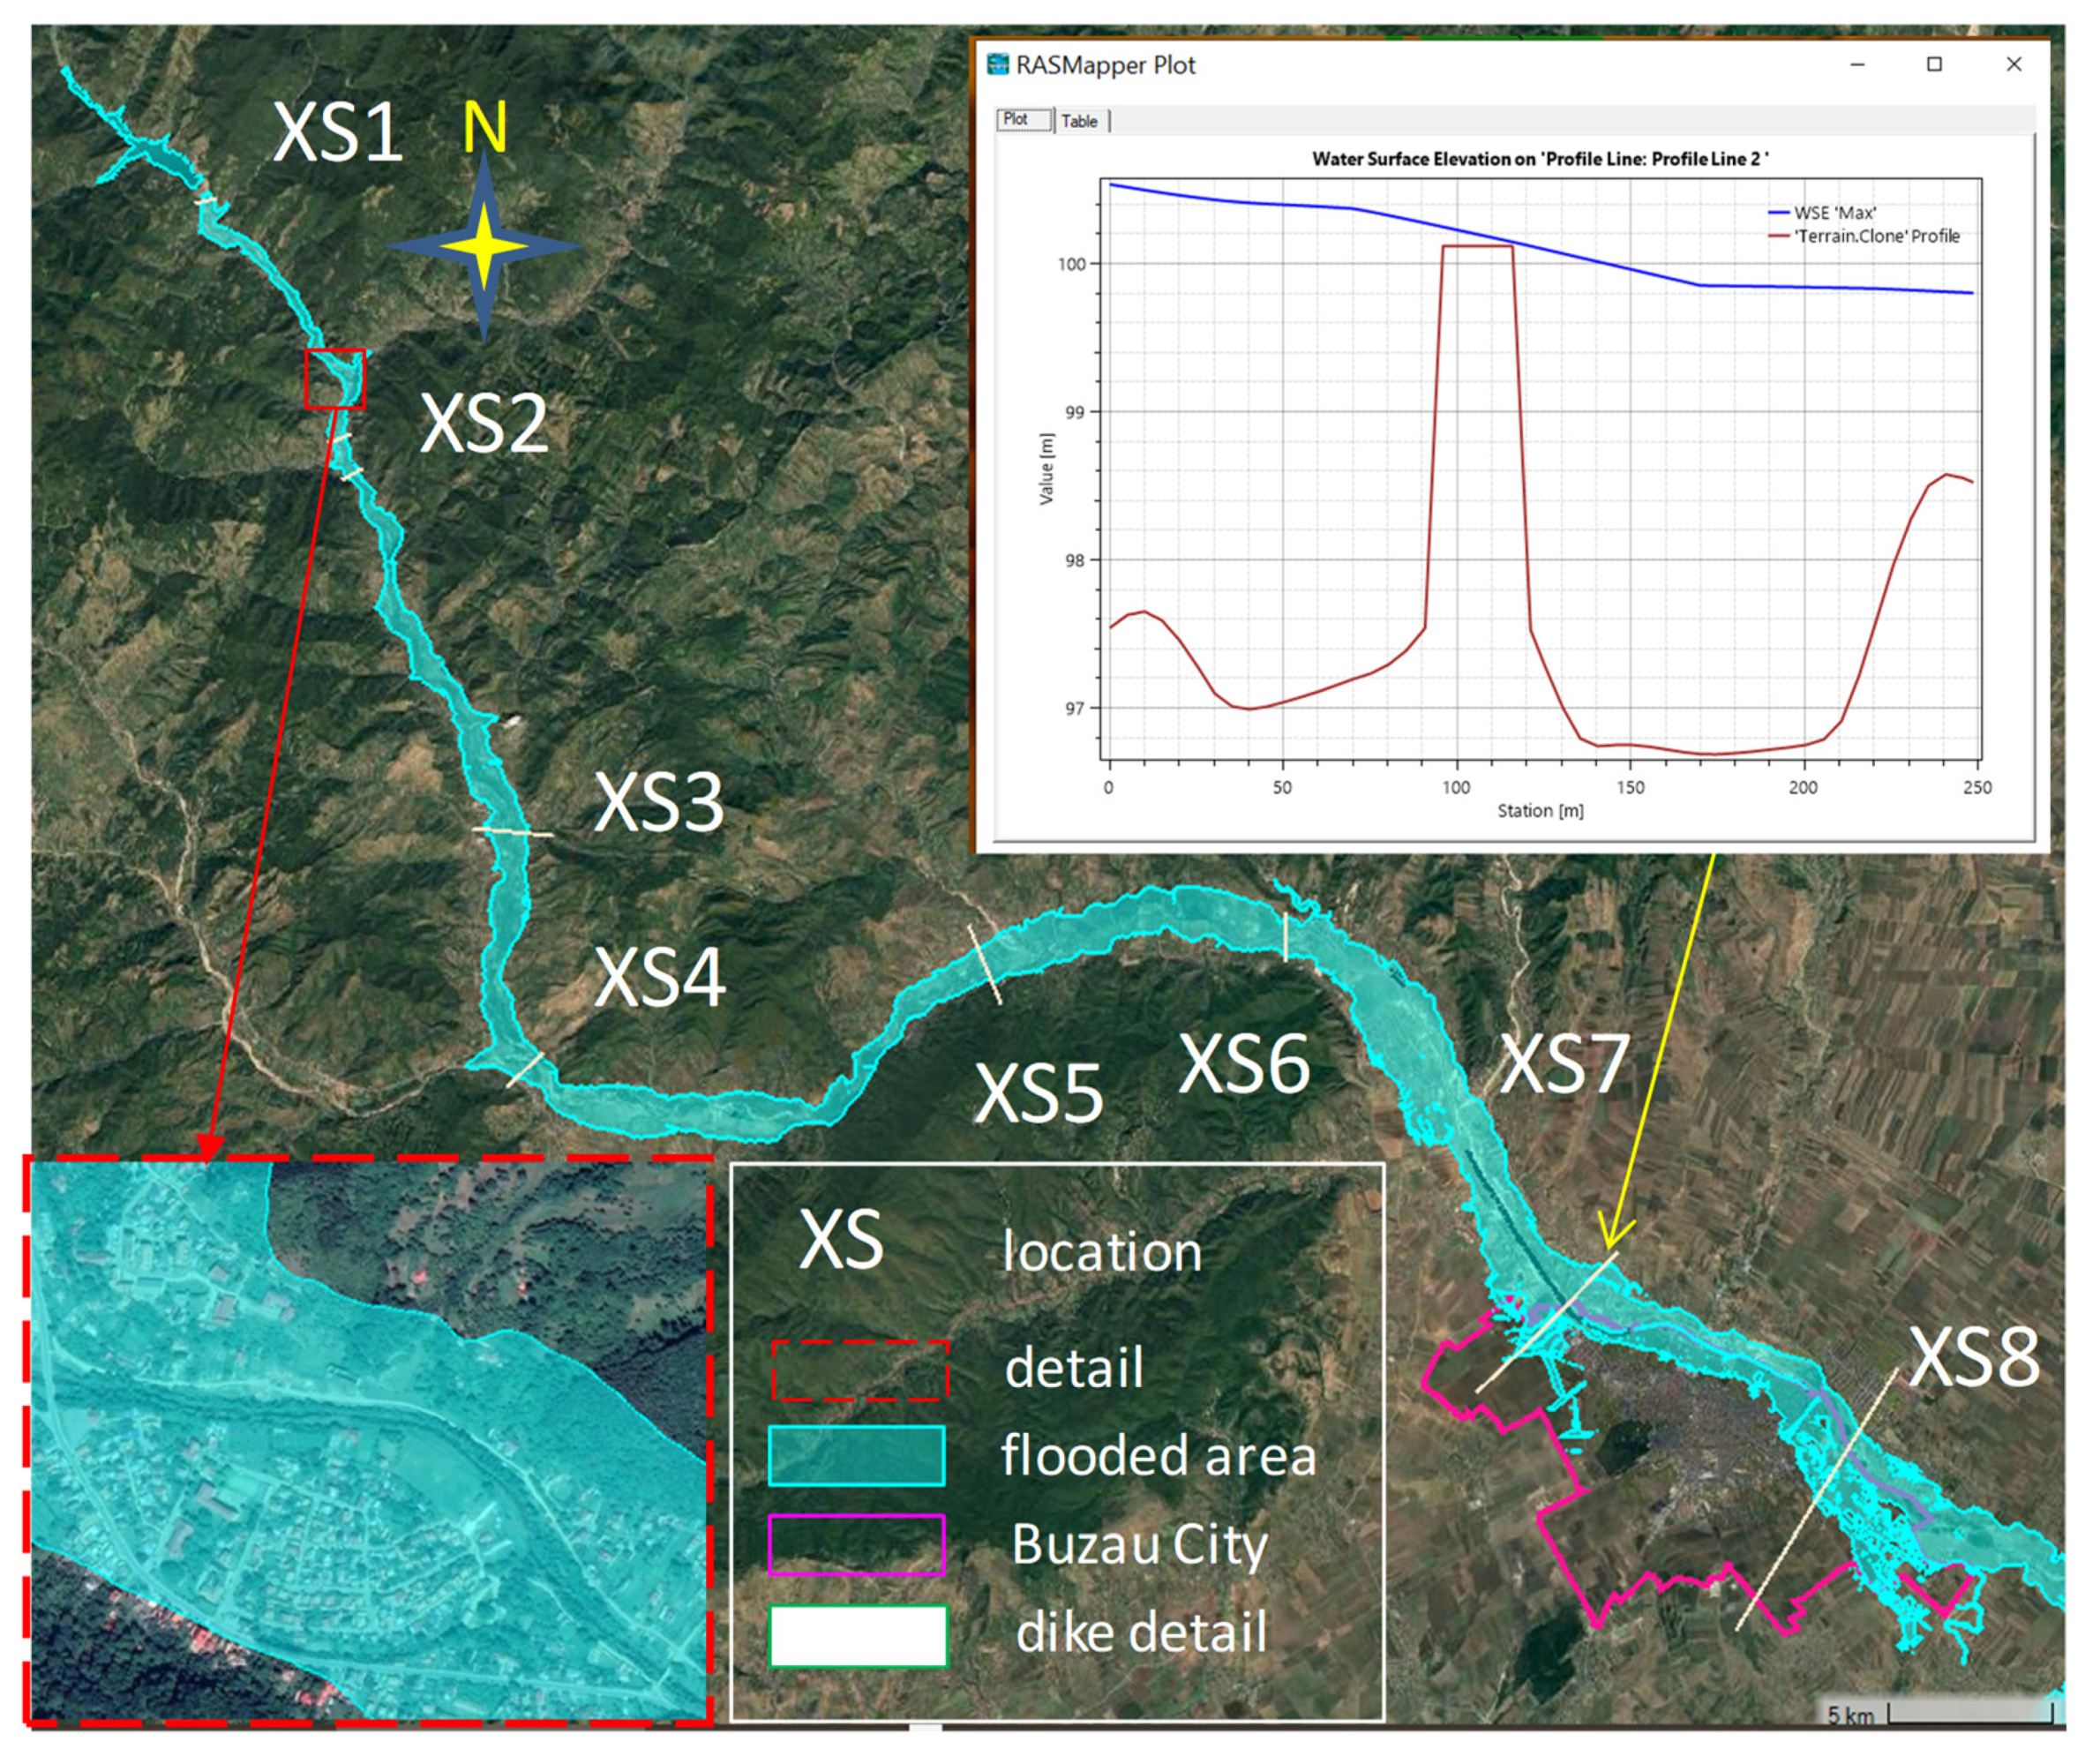
| Cross-Section (XS) Profile No. | Location | Distance from Dam(km) |
|---|---|---|
| 1 | DS dam | 0 |
| 2 | Nehoiu | 10 |
| 3 | Pătârlagele | 25 |
| 4 | Cislău | 36 |
| 5 | Măgura | 50 |
| 6 | Berca | 65 |
| 7 | Buzău US | 80 |
| 8 | Buzău DS | 100 |
| Dam, Country | Type of Dam | Failure Mode | Dam Height | ×103 | Max. Depth | Max. Vel. | Travel Velocity | Ref. No. |
|---|---|---|---|---|---|---|---|---|
| O/P | m | m3/s | m | m/s | Km/h | |||
| Siriu, Romania | Clay core | O P | 122 | 40 20–30 | 22–25 16–22 | 12 10–12 | 5–14 6.5–13.5 | - |
| Teton | Clay core | P | 93 | 47 | 29 | 54 | ||
| Atasu, Turkey | Rock fill | O | 116 | 33 | 40 | 10 | - | 55 |
| Gökçe, Turkey | Clay core | O P | 62 | 12 6 | 8 10 | 14.6 22 | 5.2 9.6 | 56 |
| Al Wala Jordan | Clay core | O P | 52 | 16.5 13 | 24.6 24.5 | - | - | 57 |
| Hidkal India | Earth | O P | 53.3 | 78.45 72.08 | 35 30.4 | - | 5.3 4.7 | 58 |
| Sattarkhan, Iran | Clay core | O P | 59 | - | 3.8 5 | 4.3 6.5 | - | 59 |
| Gumara, Ethiopia | Clay core | O P | 33 | 19.7 25.13 | 15 15 | 11.5 11.9 | - | 60 |
Disclaimer/Publisher’s Note: The statements, opinions and data contained in all publications are solely those of the individual author(s) and contributor(s) and not of MDPI and/or the editor(s). MDPI and/or the editor(s) disclaim responsibility for any injury to people or property resulting from any ideas, methods, instructions or products referred to in the content. |
© 2025 by the authors. Licensee MDPI, Basel, Switzerland. This article is an open access article distributed under the terms and conditions of the Creative Commons Attribution (CC BY) license (https://creativecommons.org/licenses/by/4.0/).
Share and Cite
Ionescu, C.-S.; Gogoașe-Nistoran, D.-E.; Baciu, C.A.; Cozma, A.; Motovilnic, I.; Brașovanu, L. The Impact of a Clay-Core Embankment Dam Break on the Flood Wave Characteristics. Hydrology 2025, 12, 56. https://doi.org/10.3390/hydrology12030056
Ionescu C-S, Gogoașe-Nistoran D-E, Baciu CA, Cozma A, Motovilnic I, Brașovanu L. The Impact of a Clay-Core Embankment Dam Break on the Flood Wave Characteristics. Hydrology. 2025; 12(3):56. https://doi.org/10.3390/hydrology12030056
Chicago/Turabian StyleIonescu, Cristina-Sorana, Daniela-Elena Gogoașe-Nistoran, Constantin Alexandru Baciu, Andrei Cozma, Iana Motovilnic, and Livioara Brașovanu. 2025. "The Impact of a Clay-Core Embankment Dam Break on the Flood Wave Characteristics" Hydrology 12, no. 3: 56. https://doi.org/10.3390/hydrology12030056
APA StyleIonescu, C.-S., Gogoașe-Nistoran, D.-E., Baciu, C. A., Cozma, A., Motovilnic, I., & Brașovanu, L. (2025). The Impact of a Clay-Core Embankment Dam Break on the Flood Wave Characteristics. Hydrology, 12(3), 56. https://doi.org/10.3390/hydrology12030056