Article

Drivers and Management of Nutrient Overload in Dams: Insights from Roodeplaat Dam, South Africa

by
Samkele Siphelele Mnyango
1,2,3,*,
Melusi Thwala
2,4,
Christoff Truter
5,
Nkosinathi Goodman Xulu
6,
Yolandi Schoeman
3,7 and
Paul Johan Oberholster
2,7
1
Sources Directed Studies, Department of Water and Sanitation, Pretoria 0001, South Africa
2
Centre for Environmental Management, University of the Free State, Bloemfontein 9300, South Africa
3
Centre for Mineral Biogeochemistry, University of the Free State, Bloemfontein 9300, South Africa
4
Science Advisory and Strategic Partnerships, Academy of Science of South Africa, Pretoria 0040, South Africa
5
Stellenbosch University Water Institute, Stellenbosch University, Stellenbosch 7602, South Africa
6
Department of Geography and Environmental Studies, University of Zululand, KwaDlangezwa 3886, South Africa
7
Ecological Engineering Institute of Africa, University of the Free State, Bloemfontein 9300, South Africa
*
Author to whom correspondence should be addressed.
Hydrology 2025, 12(3), 57; https://doi.org/10.3390/hydrology12030057
Submission received: 27 January 2025 / Revised: 4 March 2025 / Accepted: 10 March 2025 / Published: 13 March 2025

Abstract

Anthropogenic activities significantly threaten aquatic ecosystems, accelerating water quality deterioration through pollution, overexploitation, and habitat disturbance. Roodeplaat Dam in South Africa exemplifies these challenges, experiencing nutrient overload driven by malfunctioning wastewater treatment works (WWTWs), urban runoff, and agricultural activities. This study investigates the spatio–temporal dynamics of flow patterns and nutrient loads in Roodeplaat Dam, focusing on the interplay between nutrient pollution, land use, and land cover change (LULCC). A multi-site sampling approach was employed to assess total phosphorus (TP) and nitrate–nitrite (NO3 + NO2) loading, complemented by geospatial analysis of LULCC impacts over two decades. The study revealed that TP and NO3 + NO2 concentrations surpassed permissible limits at certain monitoring sites, particularly downstream of WWTWs during low-flow periods, demonstrating their substantial role in elevating nutrient levels. The study further revealed that extensive human-driven changes in the catchment area were key contributors to nutrient dynamics. These changes included a reduction in vegetation cover from 65% to 45.17%, an increase in soil exposure from 10.25% to 22.01%, and urban expansion from 26.56% to 32.32%. These alterations disrupt natural nutrient cycles, leading to increased runoff and potential eutrophication of water bodies. Thus, to address these challenges, this study underscores the need for an integrated strategy that combines nature-based solutions, enhanced wastewater treatment, stricter regulatory compliance, and adaptive management to mitigate pollution and improve water resource sustainability. The insights gained from this case study provide valuable guidance for managing similar systems in developing regions under increasing anthropogenic and climatic pressures.

1. Introduction

Aquatic ecosystems like lakes and dams provide essential socio-economic services, such as food security, tourism, and biodiversity conservation. They also serve as safe environments for living organisms [1]. However, they face severe challenges from nutrient enrichment, leading to eutrophication [2,3,4]. This process disrupts the composition and functioning of aquatic biota, degrading ecosystems vital for human health, food production, and biodiversity [5,6,7,8,9].
Globally, eutrophication poses significant challenges, including deteriorating water quality, biodiversity loss, public health risks, and reduced ecosystem functionality [10]. For instance, recently, an analysis revealed a significant variability of total phosphorus (TP) and total nitrogen (TN) concentrations across global lakes [11]: TP concentrations ranged from minimal values in numerous Canadian and US lakes to a maximum of 5049 μg/ℓ in Mexico. Similarly, TN concentrations exhibited wide variation, with the highest recorded value (29,755 μg/ℓ) in Laguna Cuitzeo Lake, Mexico. Median TP and TN concentrations were 20 and 670 μg/ℓ, respectively. Based on TN thresholds, less than 24% of the lakes were classified as hypereutrophic. Nutrient limitation analysis indicated that P was the primary limiting nutrient in approximately 76% of the lakes, while nitrogen limitation was observed in 8% and co-limitation in 16% of the lakes.
The primary drivers of eutrophication include fertilizers rich in phosphorus (P) and nitrogen (N), urbanization, industrial effluents, and untreated wastewater, which collectively lead to algal blooms and water quality degradation [12,13]. This degradation represents a formidable environmental problem as it intersects complex socio-ecological systems [14,15]. Beyond nutrient inputs, changes in river flow patterns exacerbate water quality issues by increasing river pollutant concentrations [16,17]. Similarly, Land Use Land Cover Change (LULCC) driven by agriculture, urbanization, forestry, and industrialization further compromises water security in terms of quantity and quality [18,19,20,21].
Roodeplaat Dam in South Africa exemplifies these issues, facing high nutrient loads from untreated wastewater, urban runoff, and agricultural activities [22]. Despite awareness since the 1970s, eutrophication has worsened, with invasive species like algae and water hyacinth disrupting land use, recreation, irrigation, and water purification [23,24,25,26,27,28,29]. Several interventions have been implemented to address these challenges, including effluent standards for WWTWs, algaecide applications, and catchment-based Resource Quality Objectives (RQOs) [29,30,31]. However, these measures have shown limited success due to insufficient understanding of nutrient loading sources and dynamics. For example, recent assessments reveal persistent non-compliance at local (Baviaanspoort and Zeekoegat) Wastewater Treatment Works (WWTWs), with cumulative risk ratings of 75% (high) and 65.6% (medium), respectively, highlighting the complexity of nutrient inputs and the need for more effective management strategies [32].
This study introduces a novel approach to investigate the dynamics of flow patterns and nutrient loading in subtropical dams in urban areas, using the Roodeplaat Dam as a case study. It integrates multi-decadal nutrient loading data, spatio–temporal land use analyses, and advanced statistical models such as Principal Component Analysis (PCA) and Comprehensive Pollution Index (CPI) to identify and quantify pollution sources. This comprehensive integration of diverse data sources and methodologies provides a more holistic understanding of nutrient dynamics in protected aquatic systems. The unique contribution of this research lies in its ability to bridge the gap in understanding the interactions between land use changes and nutrient dynamics in protected aquatic systems. By offering insights applicable to similar ecosystems in developing regions, this study provides valuable guidance for managing nutrient overload in dams under increasing anthropogenic and climatic pressures. Specifically, the objectives are to assess TP and nitrate–nitrite (NO3 + NO2) loading into Roodeplaat Dam over time, examine the impacts of LULCC on nutrient dynamics, and propose integrative strategies for nutrient reduction, incorporating Nature-based solutions (NBS), traditional engineering approaches, and climate change mitigation measures.

2. Materials and Methods

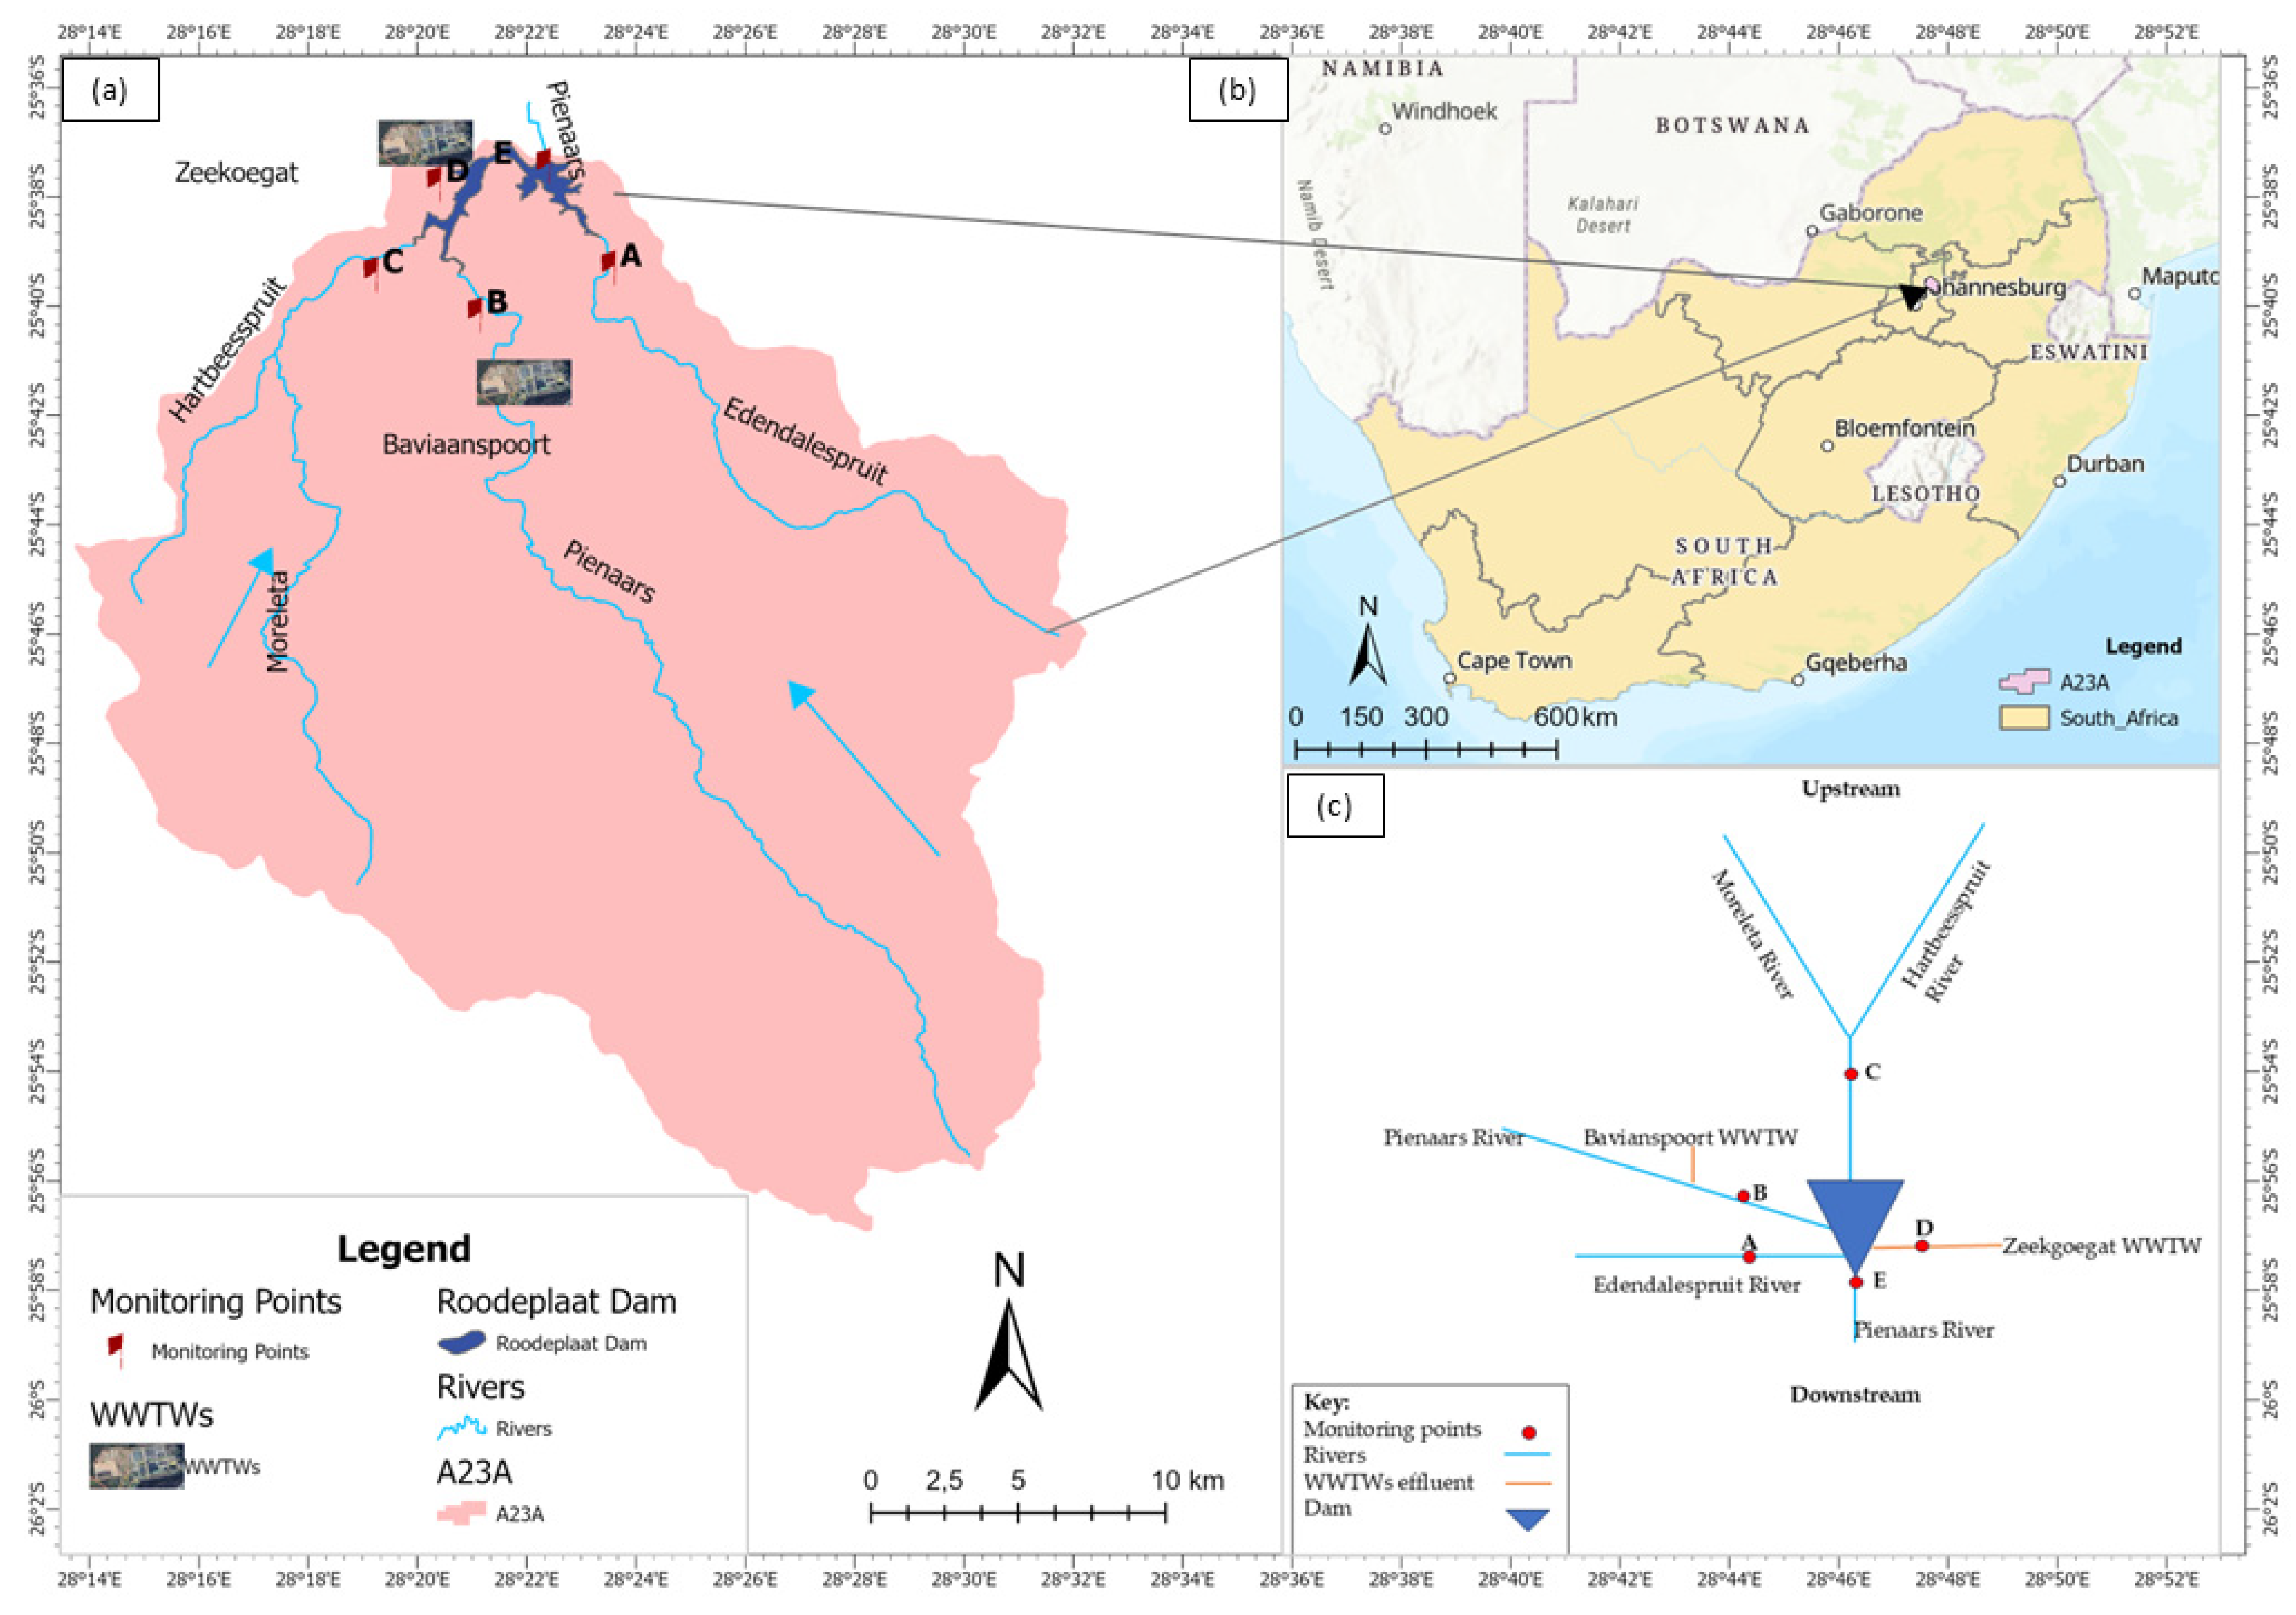
2.1. Study Area Description

The Roodeplaat Dam (25.6289° S, 28.3506° E) is located northeast of Pretoria, South Africa’s capital city, and plays a vital role in the economy of Gauteng Province (Figure 1). Situated within a nature reserve, the dam receives water from three main tributaries: the Pienaars River, Edendalespruit River, and Hartbeesspruit (Moreleta) River, as well as return flows from the Zeekoegat WWTW. The catchment area spans 668 km2, and the dam has a net capacity of 41.9 × 10⁶ m3, a mean depth of 10.6 m, a maximum depth of 43 m at the dam wall, and a water surface temperature ranging between 16 and 25 °C throughout the year [22]. Initially constructed for recreational purposes, the dam now supplements the water supply for surrounding areas, supporting the livelihoods of an estimated 5 million people within the catchment [33].
The quaternary catchment (A23A) is influenced by two primary point sources of pollution: the Baviaanspoort WWTW, located approximately 10 km upstream on the eastern bank of the Pienaars River, and the Zeekoegat WWTW, situated west of the dam, discharging effluent into the Rowing/Canoe Club area. Additionally, non-point source pollution poses significant challenges, including contributions from nearby settlements, agricultural activities, urbanization, and industrial effluents. The combination of point and non-point pollution sources amplifies nutrient loads, particularly during low-flow conditions when dilution is limited.
The dam’s location within a nature reserve highlights the delicate balance between water resource management and ecological conservation. Roodeplaat Dam provides essential ecosystem services, including habitat support for biodiversity, water provision, and recreational value. Its inclusion in a protected area makes it a unique case for examining the interplay between anthropogenic pressures and natural processes in a subtropical context.
This study area was selected due to its diverse land-use dynamics, which makes it an ideal case study for investigating the impacts of land-use changes on water quality. The findings have broader implications for rehabilitating eutrophic dams and informing sustainable water resource management practices across South Africa and regions with similar socio-ecological complexities.

2.2. Data Collection

Historical water quality data were sourced from the Water Management System (WMS) of the Republic of South Africa’s Department of Water and Sanitation (DWS). Water quality samples were collected biweekly following a sampling procedure set by [34,35], from October 2001 to September 2021, at five strategically selected monitoring sites representing key inflowing tributaries (Sites A–D) and the dam’s outflow (Site E), as shown in Figure 1 and summarized in Table 1. These sites were chosen to capture the contributions of major pollution sources and assess nutrient dynamics across the system, including point source inputs from WWTWs and non-point sources such as agricultural runoff and urban discharge. Sampling employed an integrated technique using a 5 m hosepipe and a surface grab sampling method, capturing data across depths from the surface to 5 m. The assumption that the epilimnion of the dam acts as a completely mixed water body allowed these samples to represent the overall water quality.
The key parameters analyzed were TP and NO3 + NO2, which were selected for their direct influence on eutrophication processes. Water quality data were organized in Microsoft Excel for subsequent analysis. Average daily flow data, recorded in megaliters per day (Mℓ/d), were retrieved from the DWS national hydrology database for the same period and converted to cubic meters per second (m3/s). Flow data were compiled for gauging stations listed in Table 1.
The five sampling sites were strategically selected to represent the dam’s major inflows and outflows, capturing diverse land use and pollution sources:
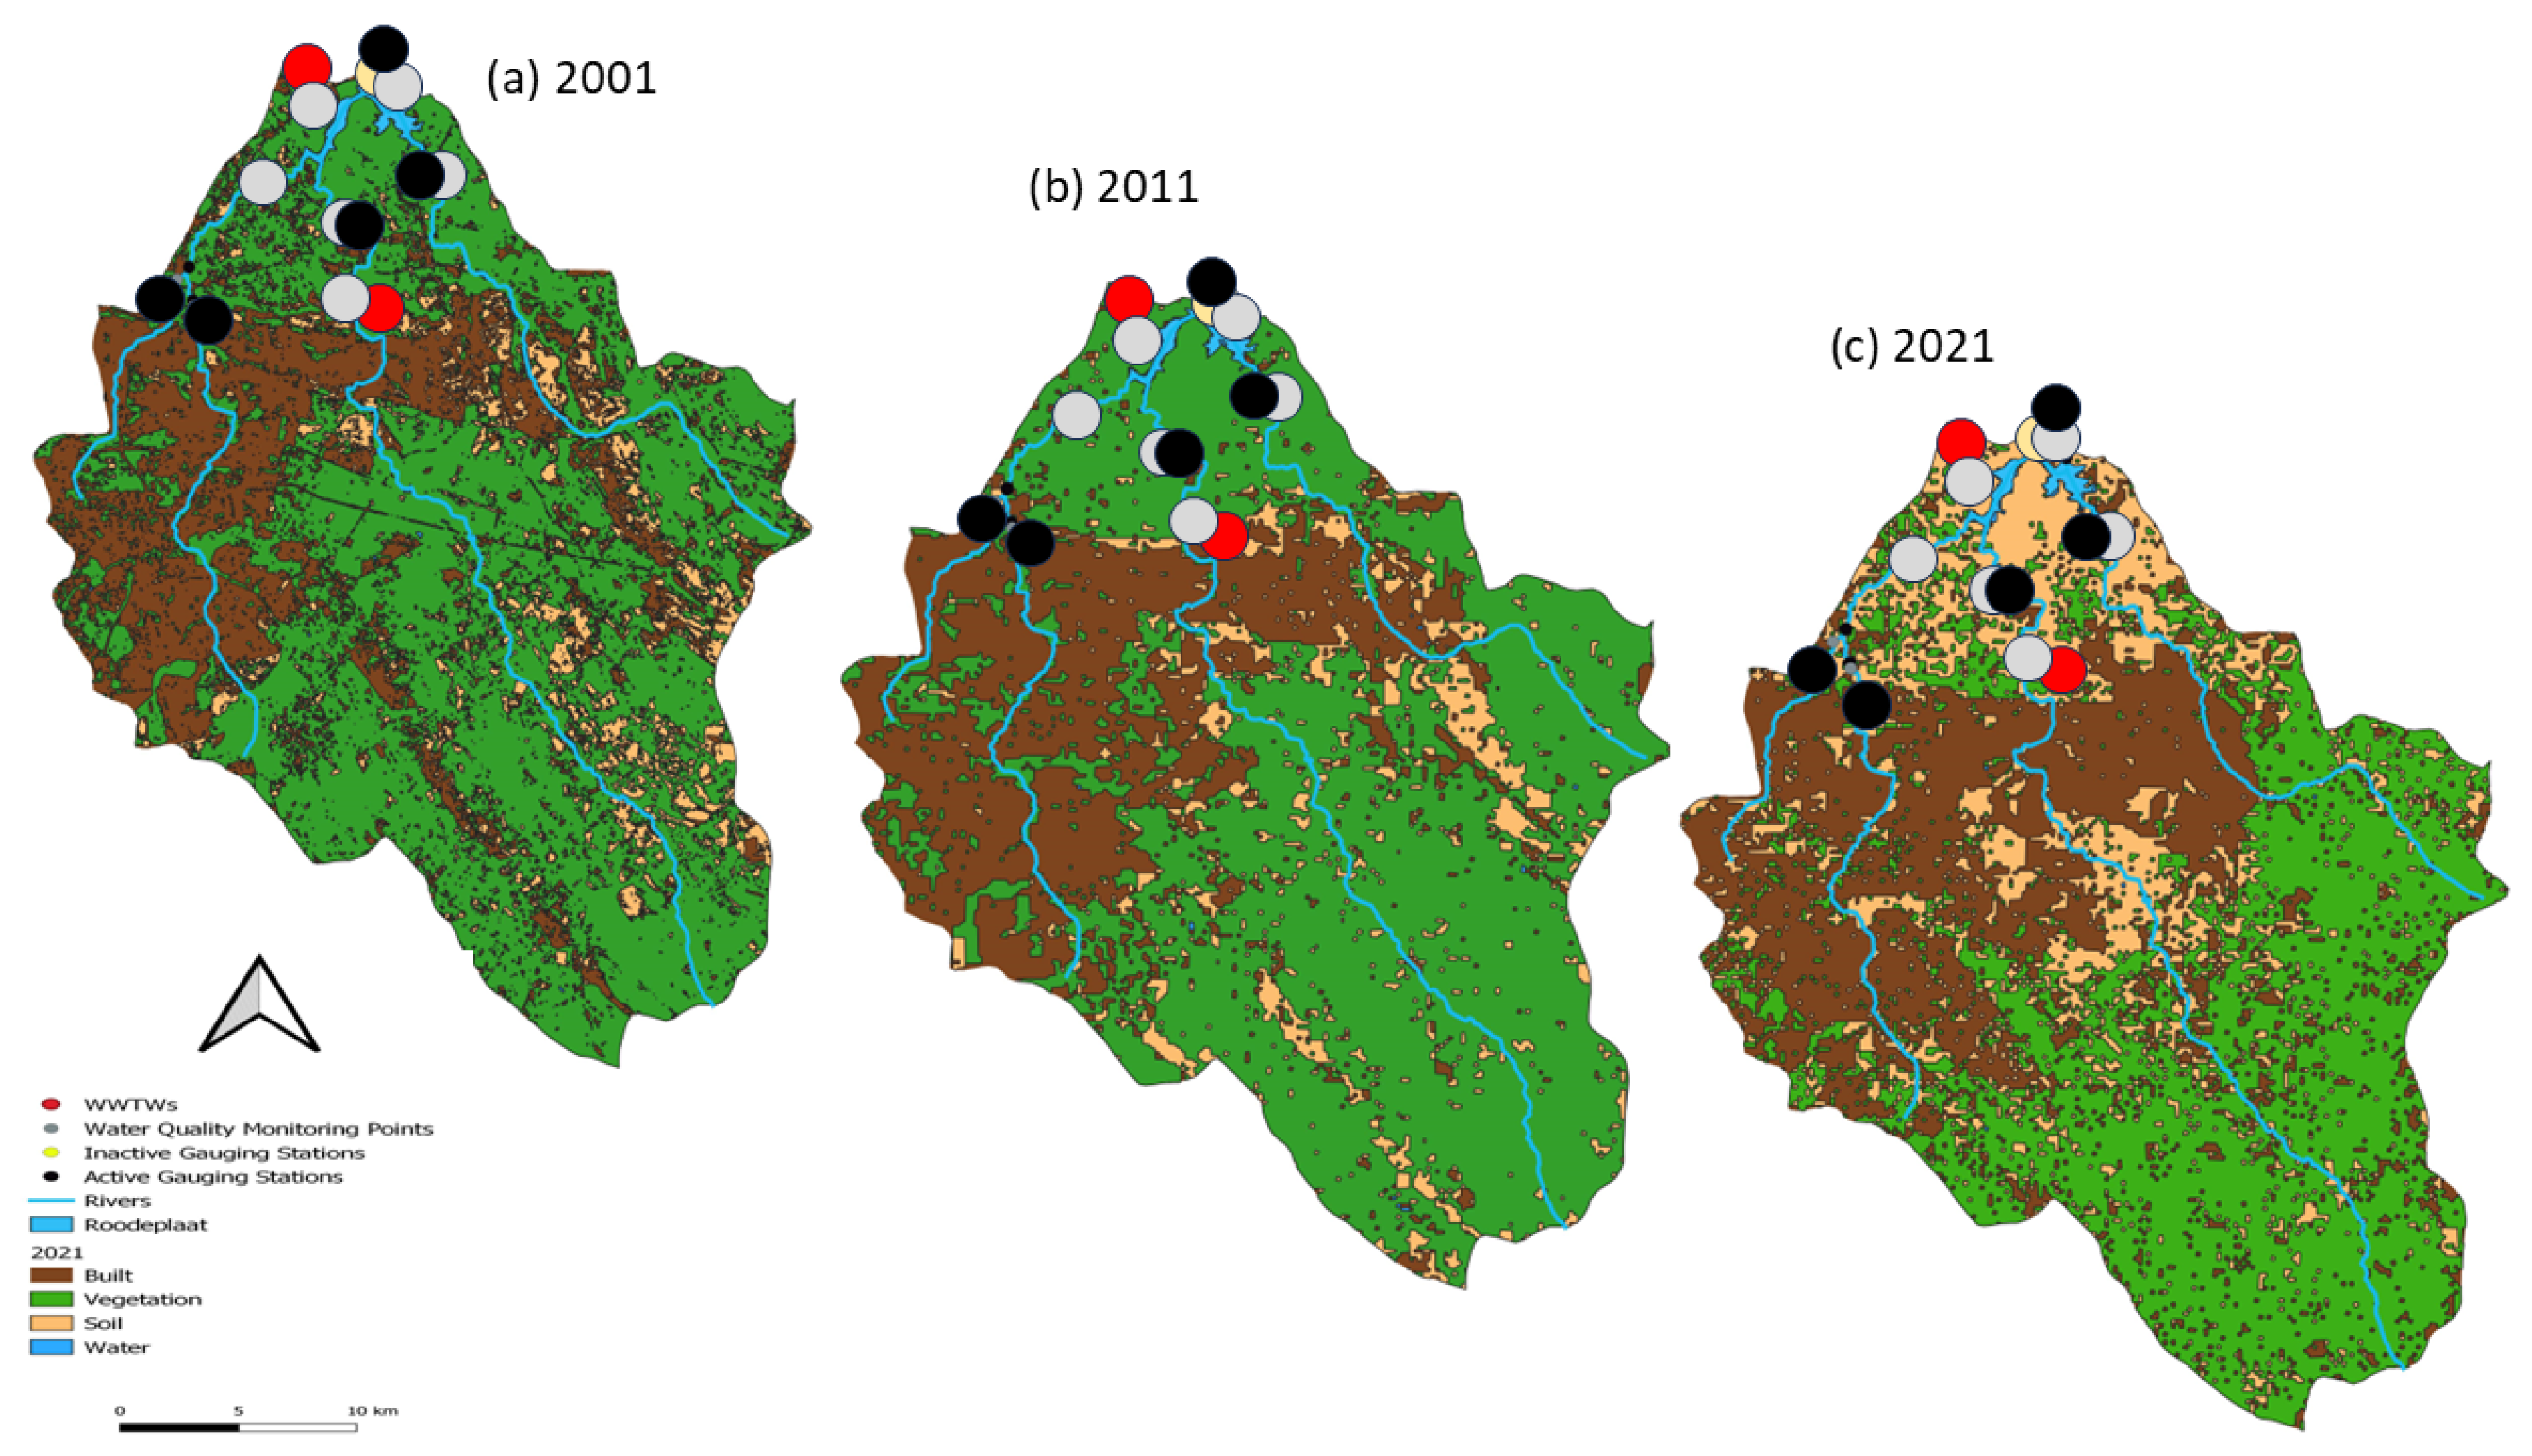
  • Site A captures contributions from Edendalespruit, influenced by agricultural runoff and small settlements.
  • Site B reflects upstream inputs from Pienaars River, including effluent from Baviaanspoort WWTW and upstream land use impacts.
  • Site C represents inputs from Hartbeesspruit and Moreleta Rivers, reflecting mixed urban and agricultural influences.
  • Site D assesses direct effluent contributions from the Zeekoegat WWTW.
  • Site E captures the cumulative effects of all inputs, representing the dam’s outflow and its impact on downstream users.
This site selection ensures comprehensive spatial coverage and provides insight into both point and non-point sources of pollution over a 20-year period, making the dataset representative of the dam’s nutrient dynamics.
The effluent flow from Zeekoegat WWTW (point D) was estimated using the mass balance approach (Equation (1)) derived from the conventional mass balance approach.
Q w w = ( Q D s + E L ) ( Q u s + P r )
where
is the summation, Qww is the estimated discharge effluent from WWTW, QDS is the dam’s outflow, E L is evaporation loss recorded at the dam, Q u s is the summation of upstream inflows into the dam, and P r is rainfall measured at the dam. Evaporation was measured daily using Symon’s tanks and American Class A-pans, and readings were subsequently uploaded on the HYDSTRA model. Each station comprises a rain gauge and at least one evaporation tank. Flow and gross evaporation were measured in m3/s.
The mass balance approach leverages upstream and downstream water quality data to identify variations in nutrient loads and estimate WWTW effluent contributions [1]. The estimated effluent flow was plotted against corresponding water quality concentrations at the discharge point. However, in this study, it was used to estimate effluent flow from the WWTW into the dam (Site D), using inflow into the dam as an upstream flow and outflow of the dam as a downstream flow (Table 1). The estimated effluent flow was plotted against the corresponding water quality concentrations collected at the discharge point.
LULCC was analyzed using Landsat 7 satellite imagery obtained from the United States Geological Survey (USGS) Earth Explorer portal (https://earthexplorer.usgs.gov/, accessed on 2 November 2024). High-resolution imagery from 2001 to 2021 was used to track changes in vegetation, urban areas, water bodies, and other land cover types within the quaternary catchment. The following steps ensured reproducibility and accuracy in data processing:
(a)
Image acquisition
Landsat 7 Enhanced Thematic Mapper Plus (ETM+) images were downloaded for two time periods: 2001–2011 and 2012–2021. Images with <10% cloud cover and representing the dry season were prioritized.
(b)
Pre-processing
Radiometric calibration and atmospheric correction were performed using the Landsat Ecosystem Disturbance Adaptive Processing System (LEDAPS) to ensure consistent spectral reflectance values. Geometric correction aligned images spatially with a root mean square error (RMSE) of less than 0.5 pixels.
(c)
Classification and analysis
A supervised classification approach using the Maximum Likelihood Algorithm categorized land cover into vegetation, urban areas, water bodies, and bare soil. Training samples were derived from the visual inspection of high-resolution imagery and field data. Accuracy assessment was conducted using independent ground truth points, achieving overall classification accuracy above 85% and a Kappa coefficient of 0.8.
(d)
Change detection
Post-classification comparisons quantified transitions between land cover classes, such as vegetation loss or urban expansion.
(e)
Validation and mapping
The final maps were validated with field observations and historical records. Outputs were visualized in ArcGIS Pro to highlight spatial and temporal changes in land cover across the catchment.
The LULCC analysis linked observed land cover changes to nutrient loading dynamics, providing critical insights into the drivers of eutrophication in Roodeplaat Dam.

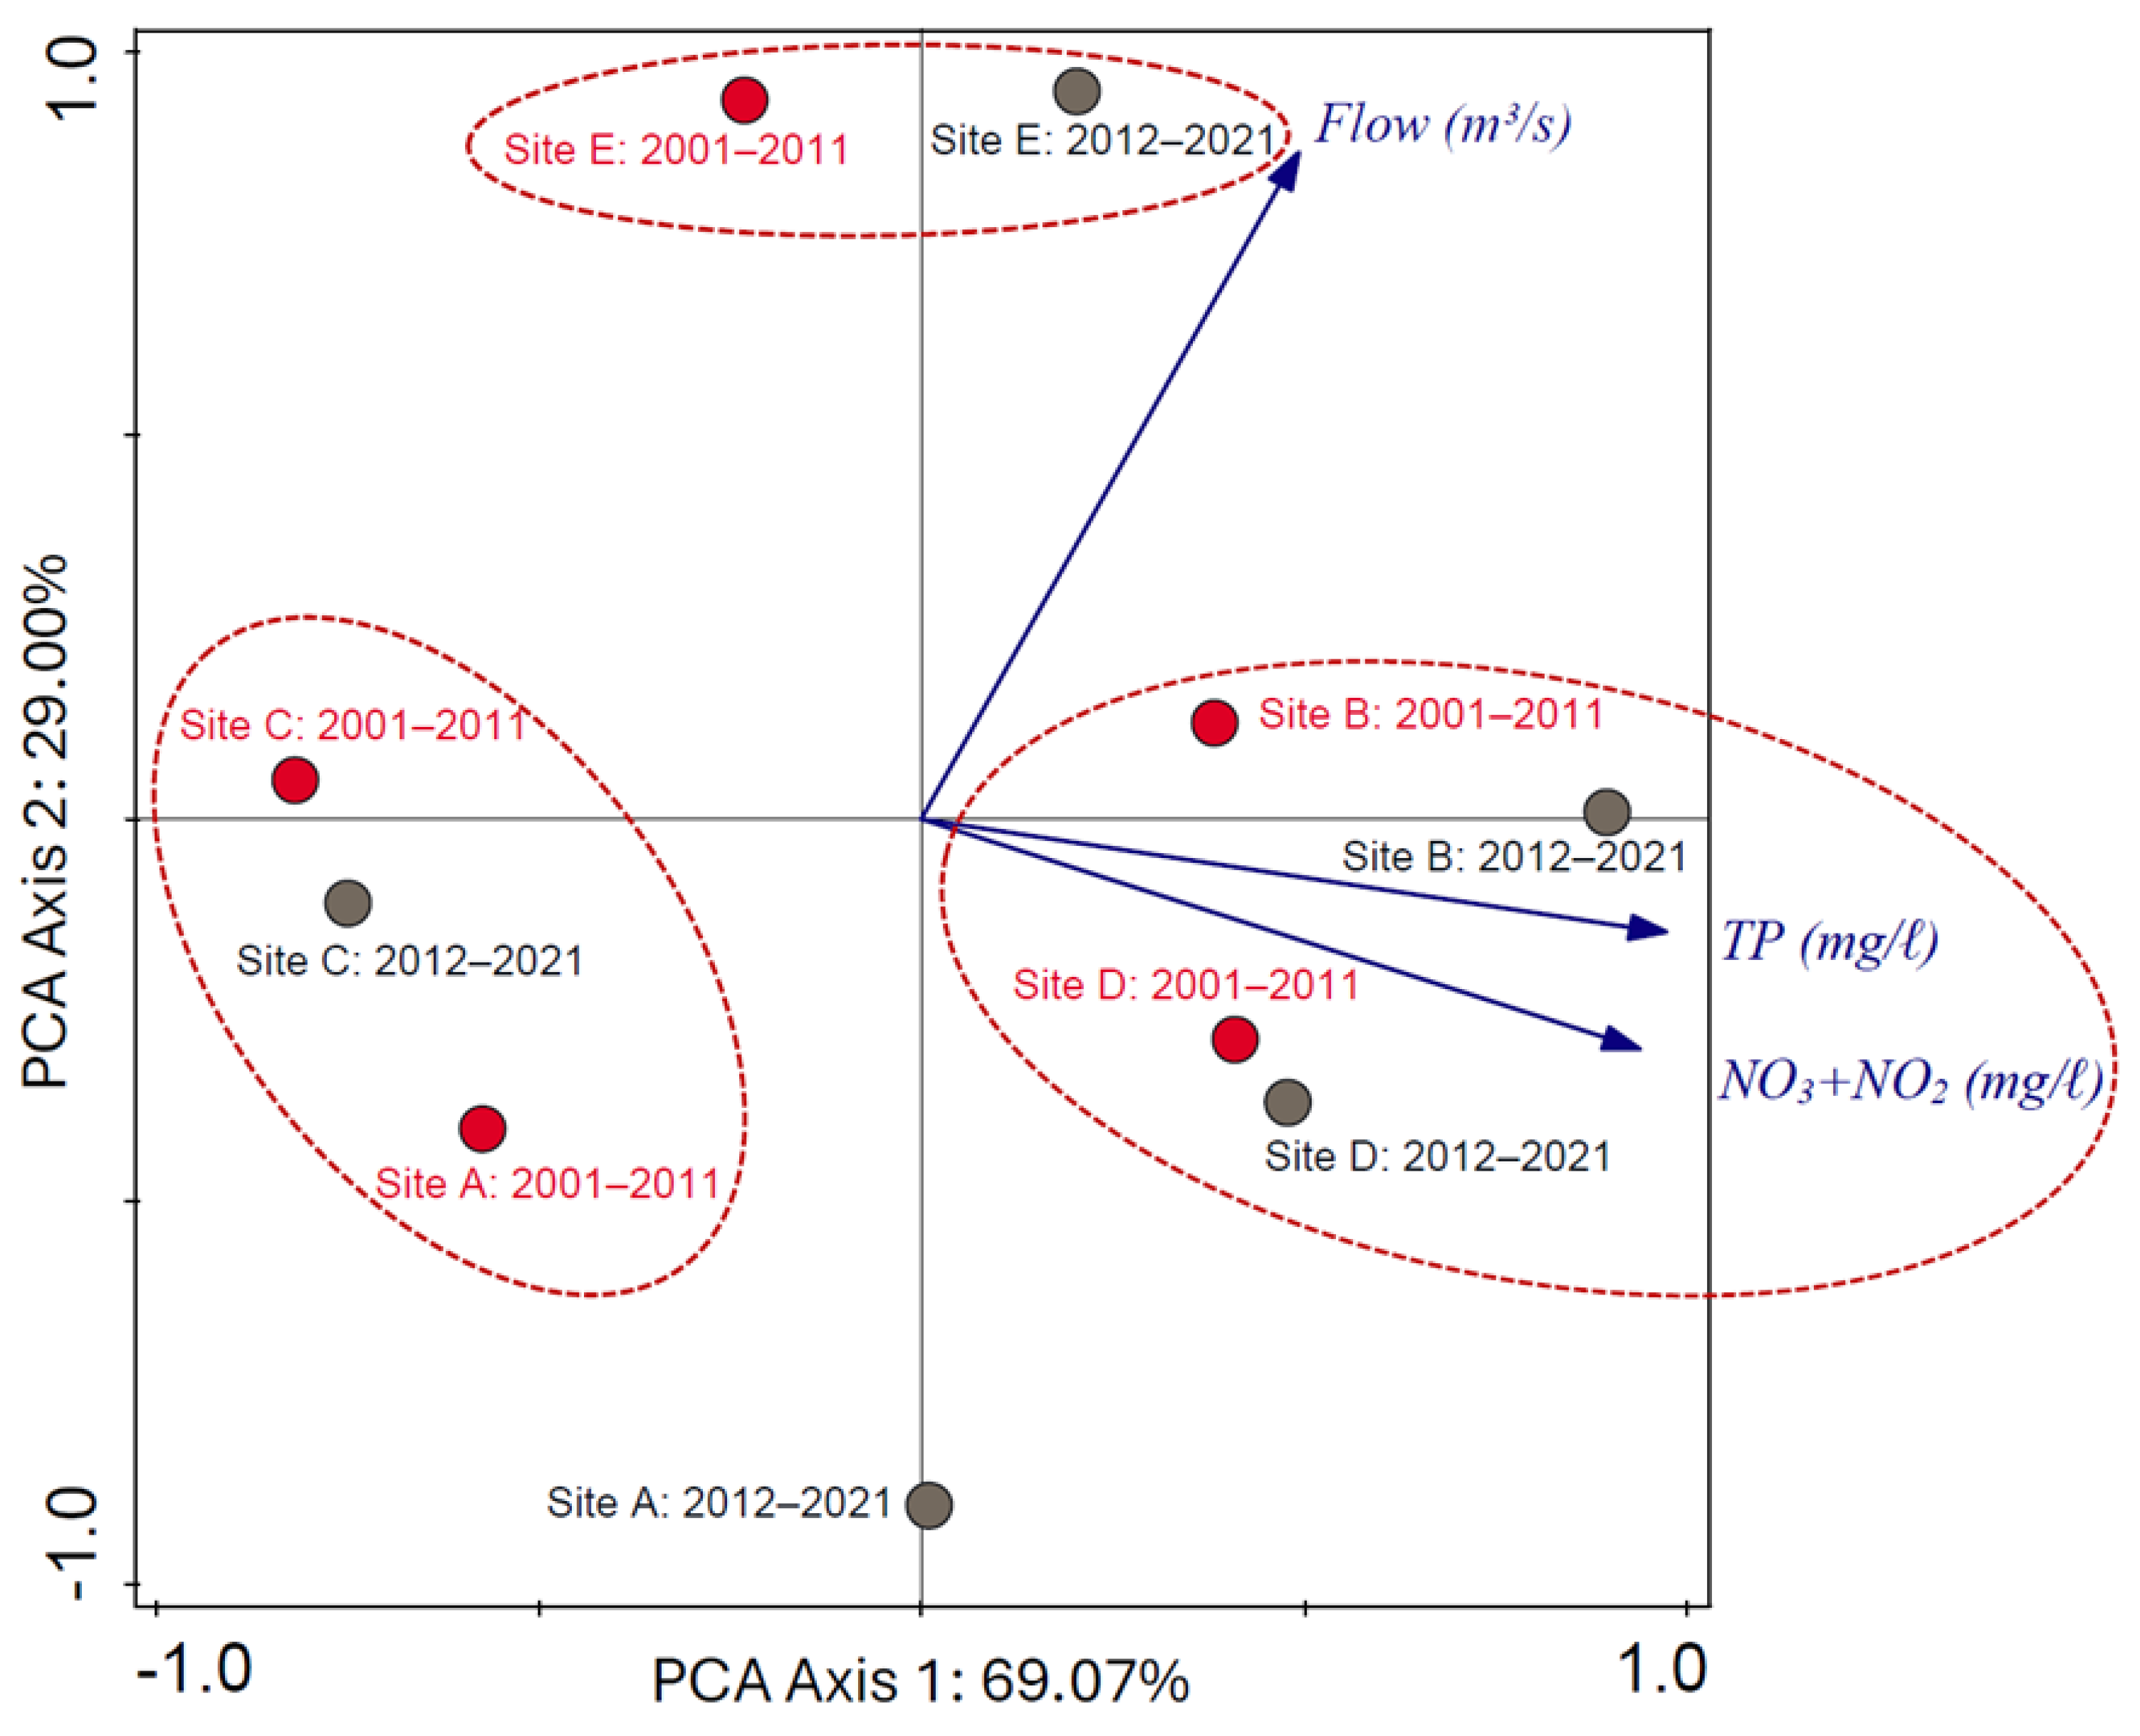
2.3. Mixed Models and Principal Component Analysis

Variation in NO3 + NO2 and TP loads were assessed using repeated measures mixed models in the Variance Estimation and Precision (VEPAC) package of Statistica V14.0.0.15 (Tibco Software, Palo Alto, CA, USA). The analysis utilized annual mean values for each sampling site. The calendar year was treated as a repeated measure, while locality (sampling site) was treated as a fixed effect to capture spatial variability. Pairwise differences were evaluated using Fisher’s Least Significant Difference (LSD) test to identify significant contrasts between sites. Data normality was assessed using normal probability plots of residuals, and non-normal data were rank-transformed before analysis to meet statistical assumptions. Results with p-values below 0.05 were considered statistically significant.
PCA was employed to evaluate relationships between sampling sites, nutrient levels, and flow rates over time. The analysis was performed for two distinct periods: 2001–2011 and 2012–2021, to assess temporal shifts in nutrient dynamics. The mean values for each of the five sampling sites during these periods were used as input data. The parameters analyzed included NO3 + NO2, TP, and flow rate.
PCAs were conducted using Canoco V5 (Microcomputer Power, Ithaca, NY, USA). Data were log-transformed and centered prior to analysis to normalize distributions and reduce the influence of outliers. Biplots were generated to visualize the relationships among sites and variables, highlighting clusters and trends over time. This approach allowed for the identification of key factors influencing nutrient loading and provided insights into temporal and spatial variability in water quality across the Roodeplaat Dam system.

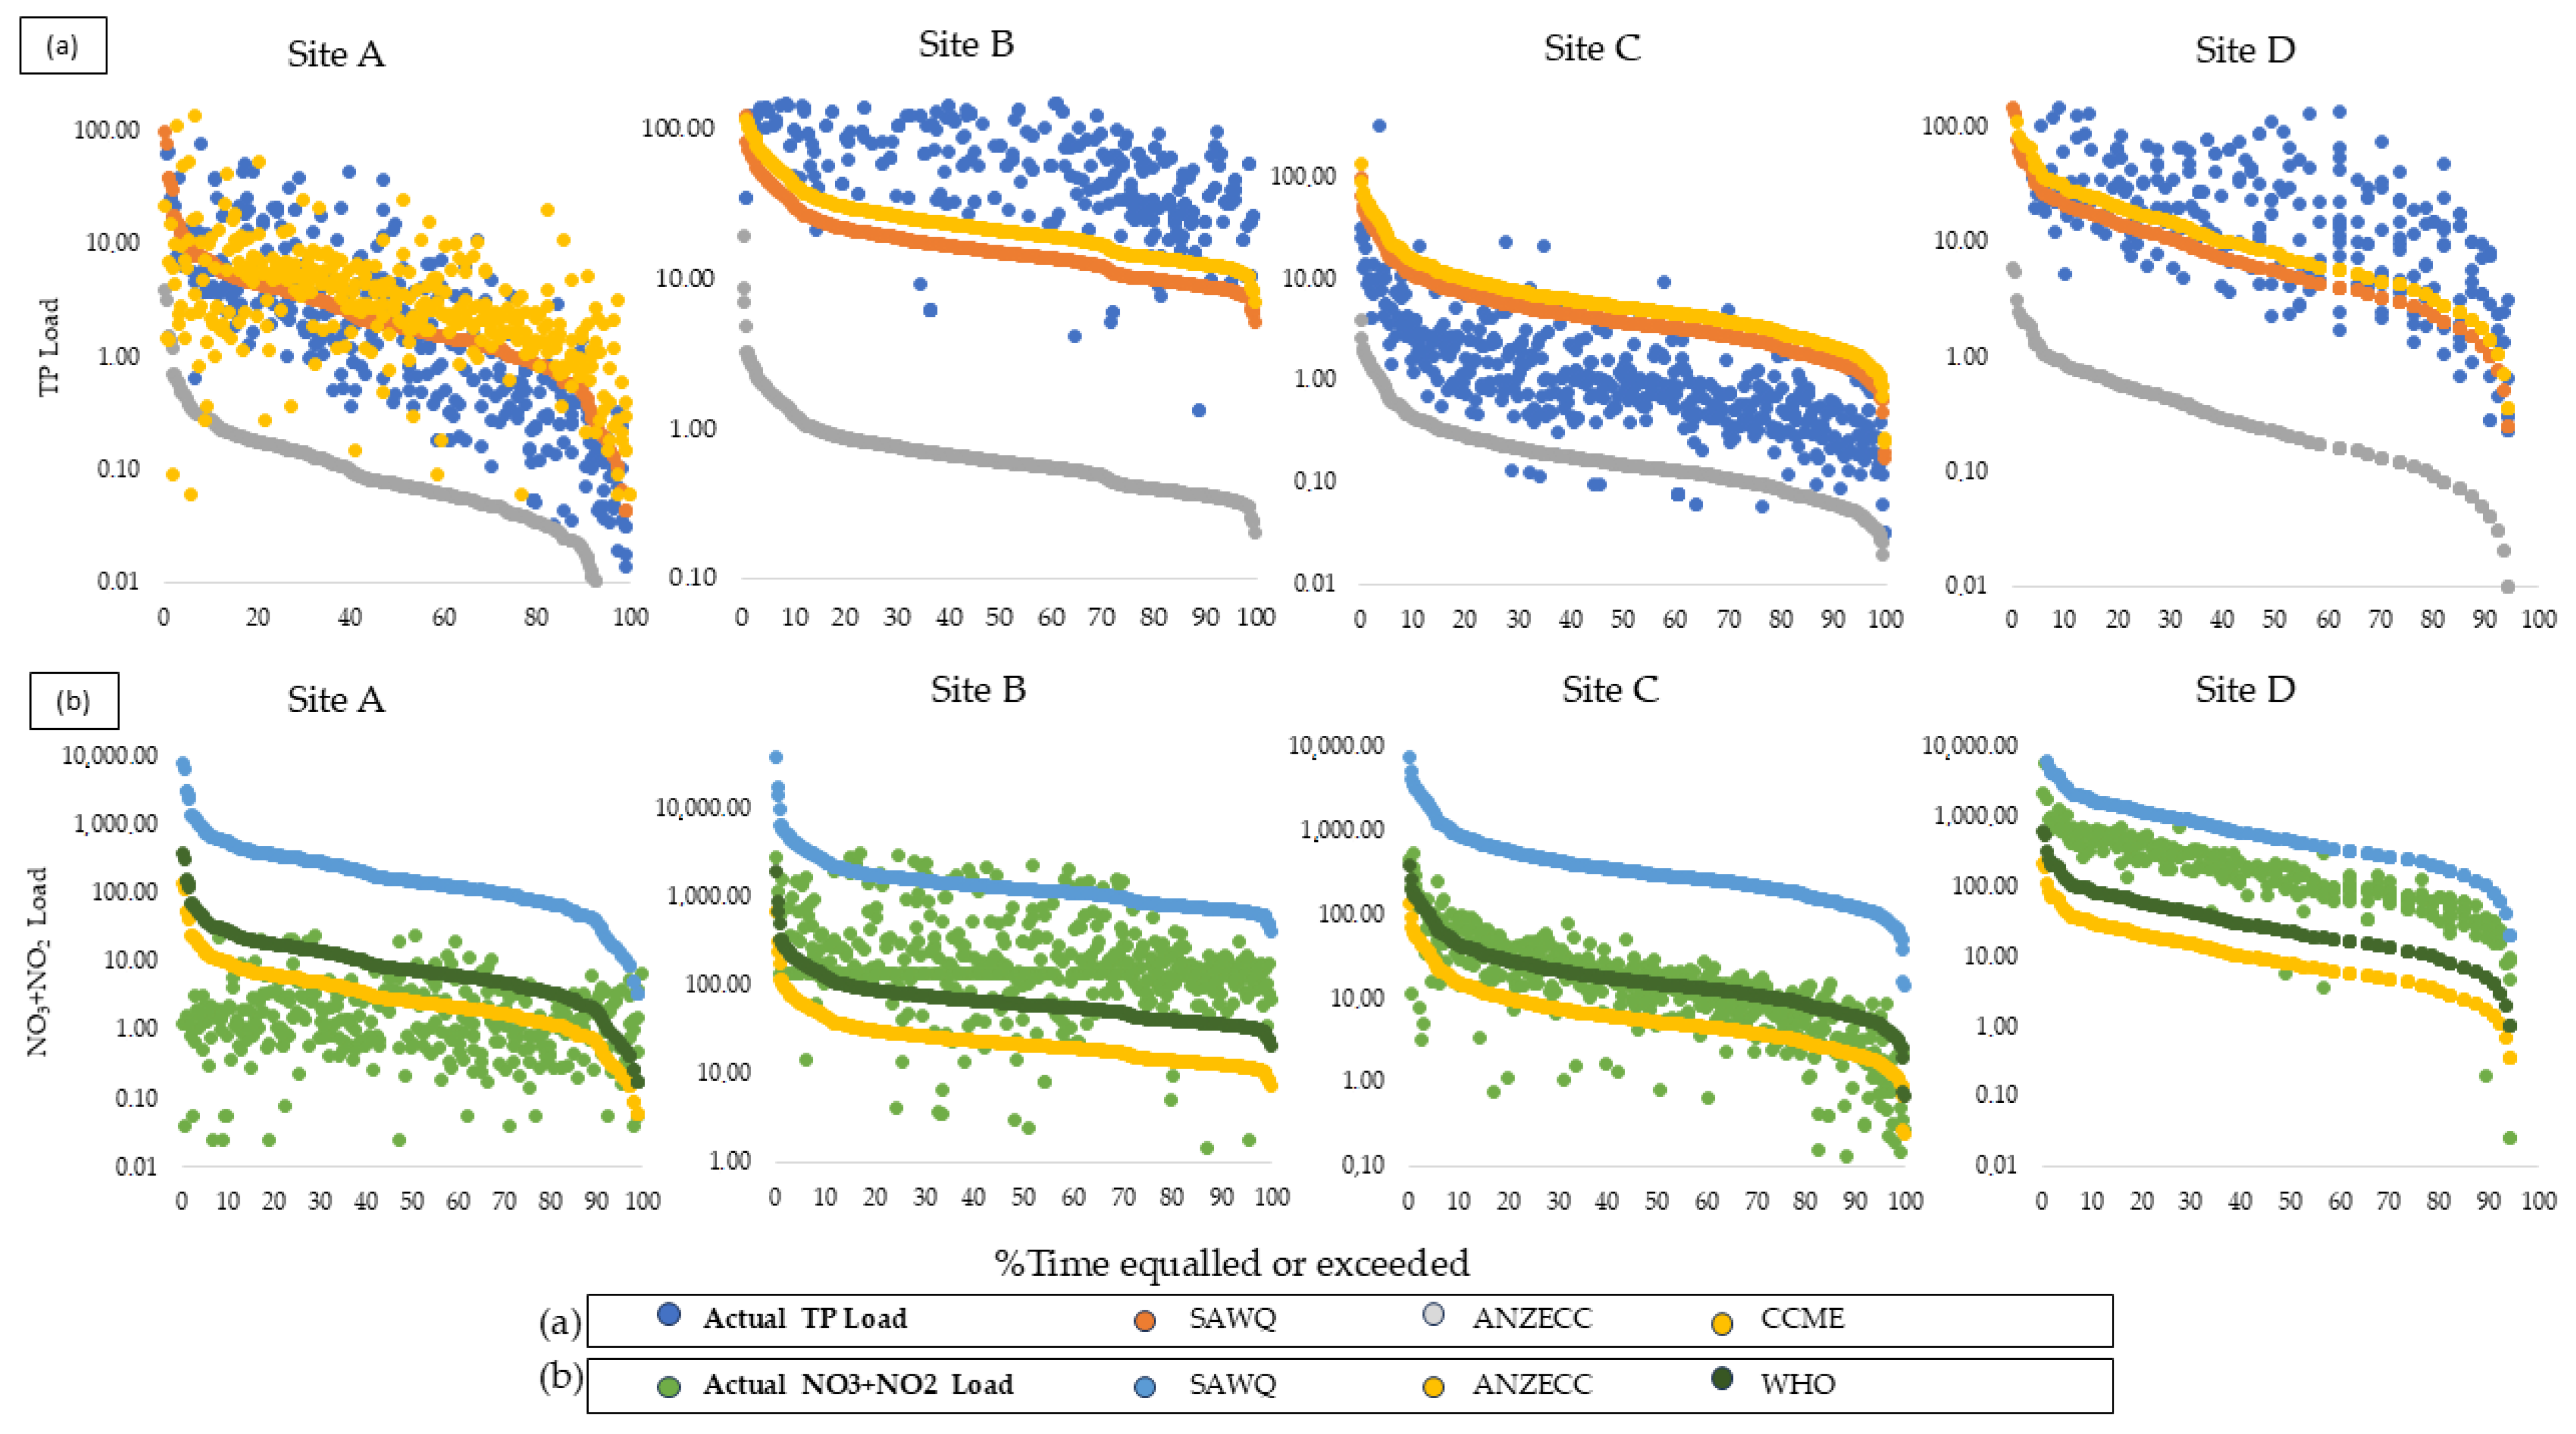
2.4. Comprehensive Pollution Index

The Pollution Index (PI) provides a valuable tool for quantifying the types and degrees of pollution in aquatic systems [36]. PI is particularly useful for calculating complex indices, such as the CPI, which offers a holistic assessment of pollution levels. CPI has proven effective for assessing dams in arid regions, highlighting its versatility in diverse hydrological and ecological contexts [37]. The CPI has been applied in various studies to evaluate surface water and groundwater systems [36,38]. This study used CPI to evaluate pollution levels in the inflowing tributaries of Roodeplaat Dam, a dam located within a nature reserve (Equation (2)).
C P I = 1 n i = 1 P I
where
CPI represents the Comprehensive Pollution Index, PI is the pollution index of individual parameters, and n is the number of parameters. The PI is calculated according to Equation (3).
P I = C i S i
where
Ci is the actual concentration of the ith parameter, and Si is the permitted South African Water Quality Standard (SAWQ) of the ith parameter (Table 2). CPI values were categorized into five pollution levels, as proposed by Son et al. [39]:
  • Category 1: CPI < 0.20 (pristine).
  • Category 2: CPI from 0.21–0.40 (less polluted).
  • Category 3: CPI from 0.4–1.00 (slightly polluted).
  • Category 4: CPI from 1.01–2.00 (moderately polluted).
  • Category 5: CPI > 2.01 (heavily polluted).
For this study, the fitness for the use of water resources was evaluated against the tolerable localized limits using SAWQ guidelines specified in Table 2. Any values exceeding these limits were classified as non-compliant, indicating potential risks to ecosystem health and human use.

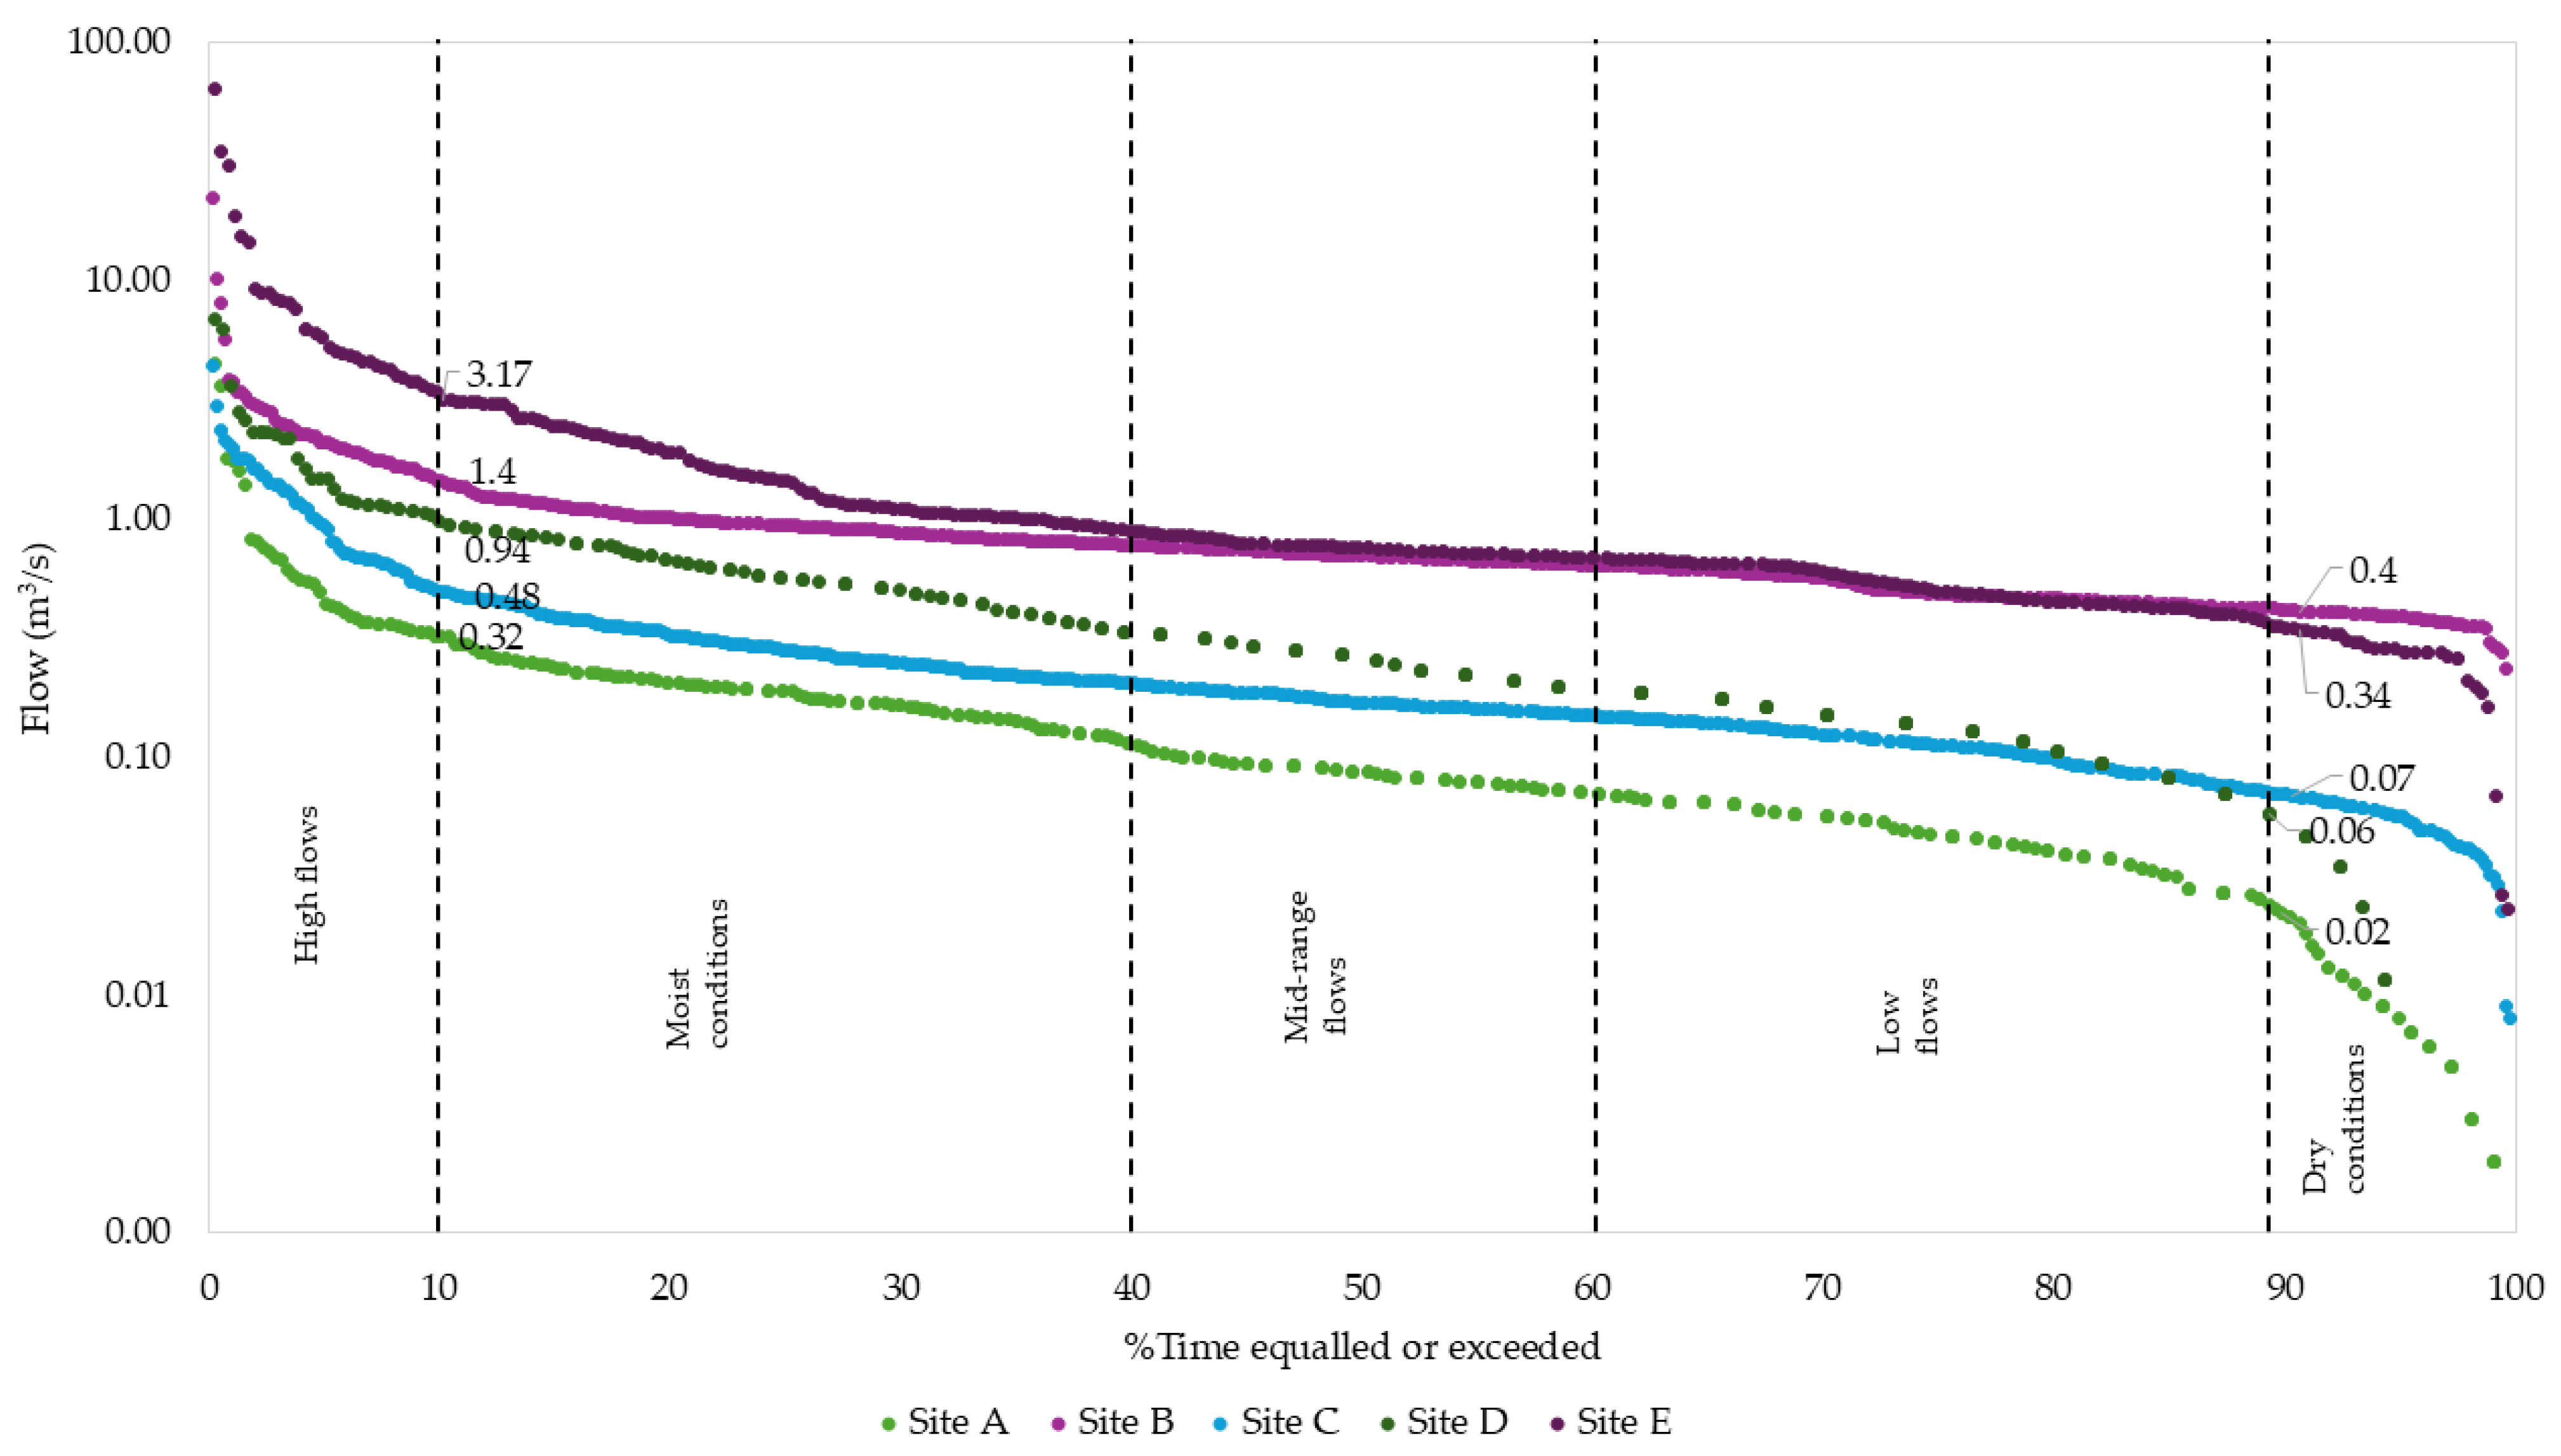
2.5. Estimation of Flows and Nutrient Loads Using Duration Curves

In this study, Load Duration Curves (LDCs) were used as an analytical tool to determine the relationship between water quality and flow, highlighting periods of compliance and exceedance relative to water quality standards. To generate LDCs, Flow Duration Curves (FDCs) were first established to analyze the cumulative frequency of discharge rates over time. FDCs were computed using the following steps:
  • Rank Flows: Daily average flow values were ranked in descending order, from the largest to the smallest, across the period of record.
  • Assign Ranks: Each discharge value was assigned a rank (M), starting with 1 for the highest flow.
  • Calculate Exceedance Probability: The probability (P) that a given flow would be equaled or exceeded was calculated using Equation (4).
    P = ( M n + 1 ) 100  
    where P is the exceedance probability, M is the assigned rank, and n is the total number of flow measurements.
The FDC was then divided into five hydrological classes to facilitate analysis:
  • High flows (0–10%)
  • Moist conditions (10–40%)
  • Mid-range conditions (40–60%)
  • Dry conditions (60–90%)
  • Low flows (90–100%)
Water quality data from flow gauge A2H027 were used to estimate nutrient loads from the Pienaars River into the dam. These data included both WWTW effluent and contributions from upstream catchment flows. Similarly, nutrient loads in the Edendalespruit were estimated using data from gauge A2H029, and those in the Hartbeesspruit were calculated based on records from gauges A2H028, A2H054, and A2H055. Loads were categorized into two groups: the actual (observed) load and the allowable (permissible) load. Actual loads were calculated by multiplying the actual concentrations of water quality variables by the corresponding flows and the conversion factor as depicted in Equation (5). In contrast, allowable loads were determined using the adjusted curve of LDC and thus represent the mass loading rate of pollutants that the waterbody can receive and remain in compliance with the SAWQ [40,41]. Subsequently, the LDC was calculated by multiplying the stream flow by the target water quality limit (Table 2) and the conversion factor [Equation (6)]. Moreover, internationally recognized water quality guidelines such as the World Health Organization (WHO) [42], Australian and New Zealand Conservation Council and the Agricultural and Resource Management Council for Australia and New Zealand (ANZECC), [43], and the Canadian Council of Ministers for the Environment (CCME) [44] guidelines were used to assess the level of water quality in the area.
The LDC was generated by plotting the exceedance probabilities (PP) calculated from Equation (4) on the x-axis against nutrient load values derived from Equations (5) and (6) on the y-axis. Observed loads above the LDC indicate exceedance of water quality limits, while those below indicates compliance. This technique is widely used for developing catchment protection plans and calculating Total Maximum Daily Loads (TMDLs).
For this study, fitness for use was evaluated at the tolerable limits defined for each parameter. Results showed that observed loads frequently exceeded allowable limits during low-flow periods, emphasizing the dominance of point source pollution under such conditions.
L a c t u a l = K   t = 1 n ( Q t × C t ) t  
L a l l o w a b l e = K   t = 1 n ( Q t × S t ) t  
where
denotes the summation, n is the number of days, Lx is the constituent load (kg per day), Q is the volumetric flow rate (m3/s), Ct is the actual water quality constituent (mg/ℓ), St is the Target Water Quality Limit (mg/ℓ), and K is the unit conversion factor (86.4 kg/d).

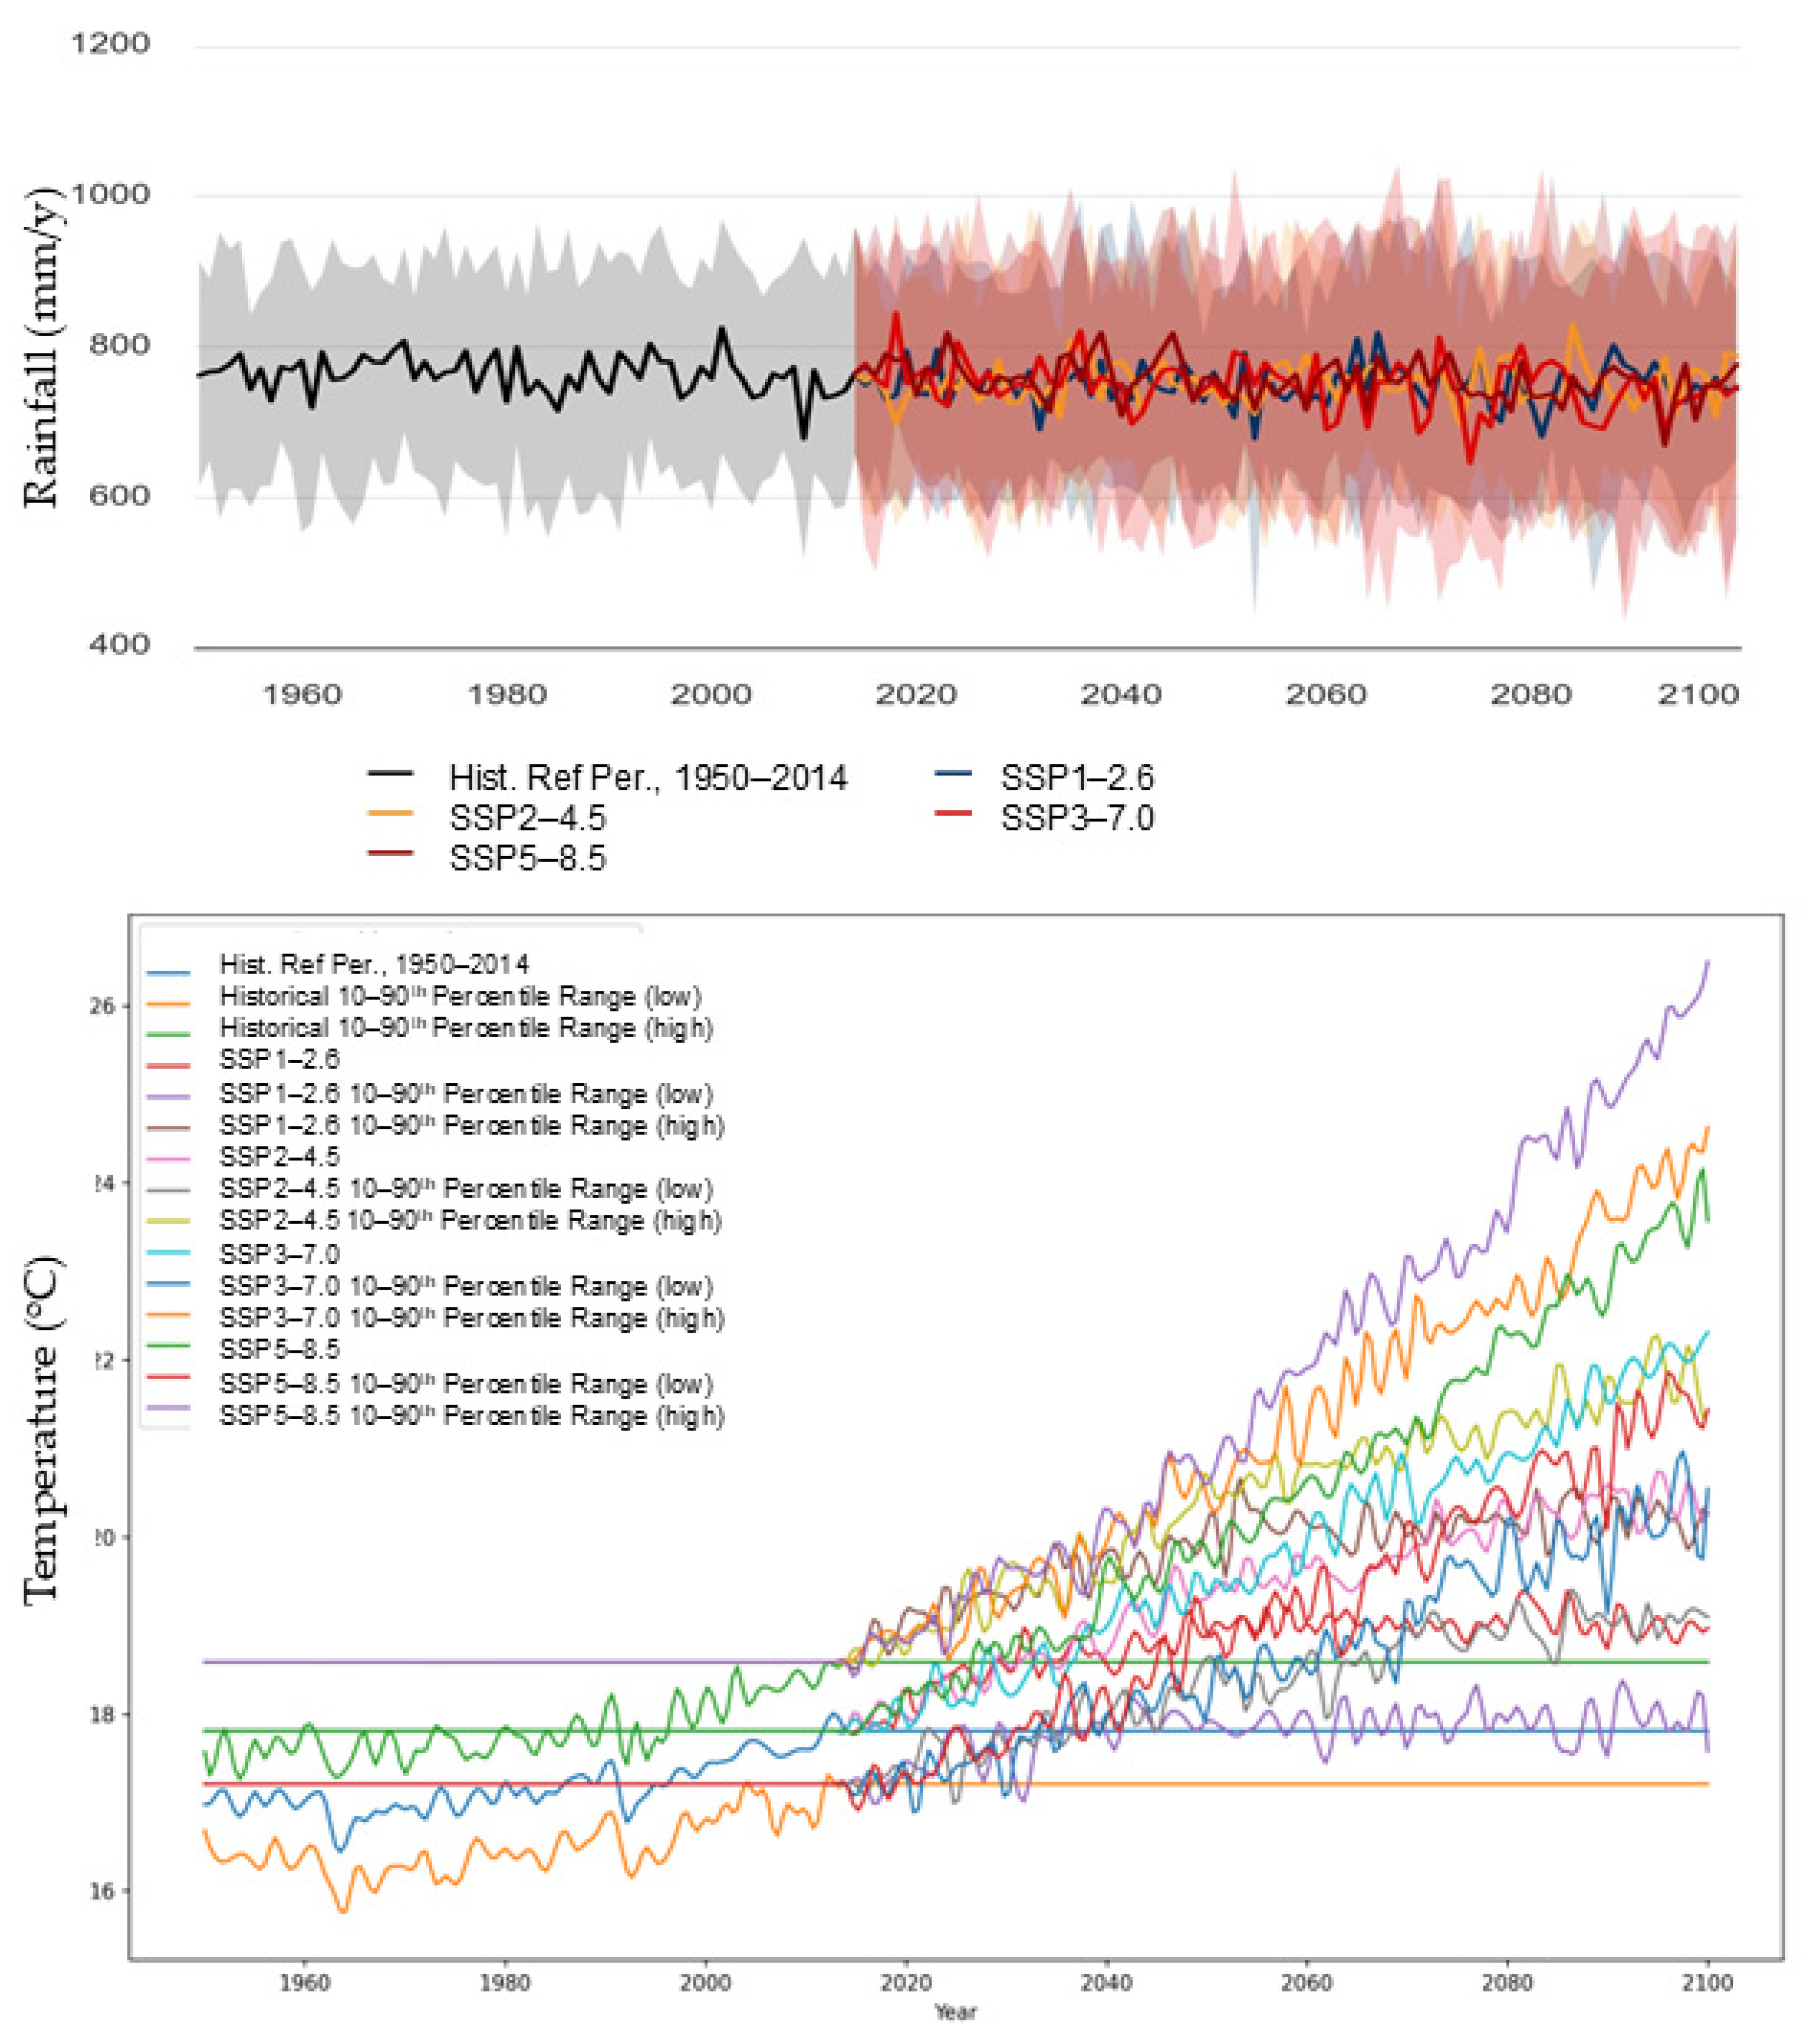
2.6. Coupled Model Inter-Comparison Project Projections

The Coupled Model Inter-comparison Project 6 (CMIP6) models are integral to modern climate research and form part of the globally implemented suite of tools developed under the World Climate Research Program’s Working Group on Coupled Modelling [45]. CMIP6 builds on its predecessor, CMIP5, and incorporates updates aligned with the Intergovernmental Panel on Climate Change (IPCC) Sixth Assessment Report (AR6) released in 2021. With contributions from approximately 100 global climate models developed by 49 different modelling groups, CMIP6 represents a significant expansion and refinement in climate modeling capabilities [46].
These models operate under various emissions scenarios based on Shared Socio-economic Pathways (SSPs), which outline a range of radiative forcing projections up to the year 2100. The SSP framework integrates socio-economic and environmental factors to provide a nuanced understanding of potential climate trajectories. The inclusion of multiple pathways enhances the robustness and applicability of CMIP6 outputs for assessing future risks and informing climate adaptation strategies.
For this study, projections were obtained from the World Bank’s Climate Change Knowledge Portal (https://climateknowledgeportal.worldbank.org/country/south-africa/climate-data-projections, accessed on 25 September 2024). The portal provides a comprehensive suite of indicators for analyzing future climate scenarios and assessing associated risks. Data are available in two forms:
  • Projected Mean: Represents expected climate conditions under specific SSPs.
  • Anomaly (Change): Highlights deviations from historical baselines.
The data are presented spatially and visually through seasonal cycles, time series, or heat plots, capturing seasonal and long-term changes across various time horizons. Temporal resolutions include annual, seasonal, and monthly outputs, providing flexibility for targeted analyses.
In this study, climate projections were generated as a multi-model ensemble at a resolution of 0.25° × 0.25° (approximately 25 km × 25 km). This resolution ensures that local-scale dynamics relevant to South Africa’s hydrology and nutrient-loading processes are adequately represented. By synthesizing outputs from multiple models, the ensemble approach reduces uncertainty and provides a range of the most plausible outcomes under each scenario.
Additionally, the CMIP6 projections analysis and associated uncertainties were managed. CMIP6 climate projections for the study include temperature and rainfall over the Gauteng province. Appropriate Earth System Models (ESMs) from the CMIP6 ensemble that best represent the study area’s climate conditions and relevant SSP scenarios to project future climate conditions were selected. The integrated climate projections illustrate the likely impact of future climate scenarios on nutrient dynamics. These were performed by involving downscaling climate data to match the spatial and temporal resolution. To manage uncertainties, an ensemble of multiple CMIP6 models was employed to capture a range of possible future climates, incorporate multiple SSP scenarios to address uncertainty in future socio-economic pathways and consider the natural variability within the climate system by using multiple initial condition ensembles from the selected models. This approach developed a more robust and reliable assessment of changing climate conditions on nutrient dynamics.
In summary, LDC, PCA, CPI and CMIP6 were all employed to provide holistic analysis by addressing various aspects of land cover patterns, climate projections and nutrient dynamics. LDC helped with understanding the distribution and variability of nutrient loads over time. PCA identified the most significant sources of variability and reduced the complexity of the data. CPI combined different climate projections to create a comprehensive view of future conditions. CMIP6 provided a wide range of climate models and scenarios to capture potential future climate conditions under different scenarios. Concurrently, these methodologies offer a robust framework for analyzing and predicting nutrient loads under changing climate conditions, ensuring a comprehensive and reliable assessment.

3. Results

3.1. Spatial and Temporary Variation in Nutrient Loads

NO3 + NO2 and TP loads varied significantly among the sampling locations over the 20-year study period, indicating distinct spatial patterns in nutrient loading (NO3 + NO2: F4,74 = 56.89, p < 0.001; TP: F4,74 = 97.87, p < 0.001). Post-hoc analysis revealed that nutrient loads at Sites B, D, and E were significantly higher than those at Sites A and C (p < 0.001), suggesting these sites are major contributors to nutrient enrichment in the dam. Notably, NO3 + NO2 loads did not differ significantly between Sites A and C or among Sites B, D, and E (p > 0.05). Similarly, TP loads were more variable across sites, with no significant difference observed between Sites D and E (p = 0.15).
The PCA biplot (Figure 2) illustrates relationships between sampling sites, nutrient levels, and flow rates. Sites B and D clustered in the ordinal space and association, reflecting elevated TP and NO3 + NO2 levels, likely due to effluent contributions from WWTWs. In contrast, Sites A and C observations formed distinct groupings, with Site A showing temporal shifts from 2001–2011 to 2012–2021, indicating increased nutrient loads in the latter period. Site E, representing the dam’s outflow, was distinct from other sites and closely associated with flow rate, reflecting the cumulative impact of upstream nutrient inputs.
Temporal analysis revealed that nutrient loads were consistently higher during the 2012–2021 period compared to 2001–2011. This increase aligns with observed land use changes, including urban expansion and reduced vegetation cover, which likely amplified non-point source pollution. The PCA biplot illustrates nutrient load and flow relationships among sampling sites across two decades (2001–2011 and 2012–2021). Sites B and D are associated with higher nutrient levels, reflecting point source pollution, while Sites A and C exhibit lower loads. Temporal shifts in Site A suggest increasing contributions over time. Site E, representing the dam’s outflow, highlights the cumulative impact of nutrient inputs and flow dynamics.

3.2. Comprehensive Pollution Index for Loads

The CPI was calculated using TP and NO3 + NO2 concentrations to assess nutrient pollution in the inflows and outflows of Roodeplaat Dam. The results in Table 3 highlight significant spatial variability in pollution levels across different tributaries and effluent sources. The Endendalespruit and Pienaars Rivers (downstream) were classified as slightly polluted, with CPI scores of 0.85 and 0.73, respectively. In contrast, the Pienaars River (upstream) and Zeekoegat WWTW effluent exhibited heavily polluted conditions, with CPI scores of 3.37 and 2.62, respectively. Conversely, the Hartbeesspruit River had the lowest CPI score of 0.19, indicating a less polluted status.
The results demonstrate the dominant influence of WWTWs on nutrient loading in the dam, with heavily polluted inflows primarily associated with effluent discharge. The slightly polluted downstream Pienaars River suggests some dilution of nutrient loads as water flows through the dam system.

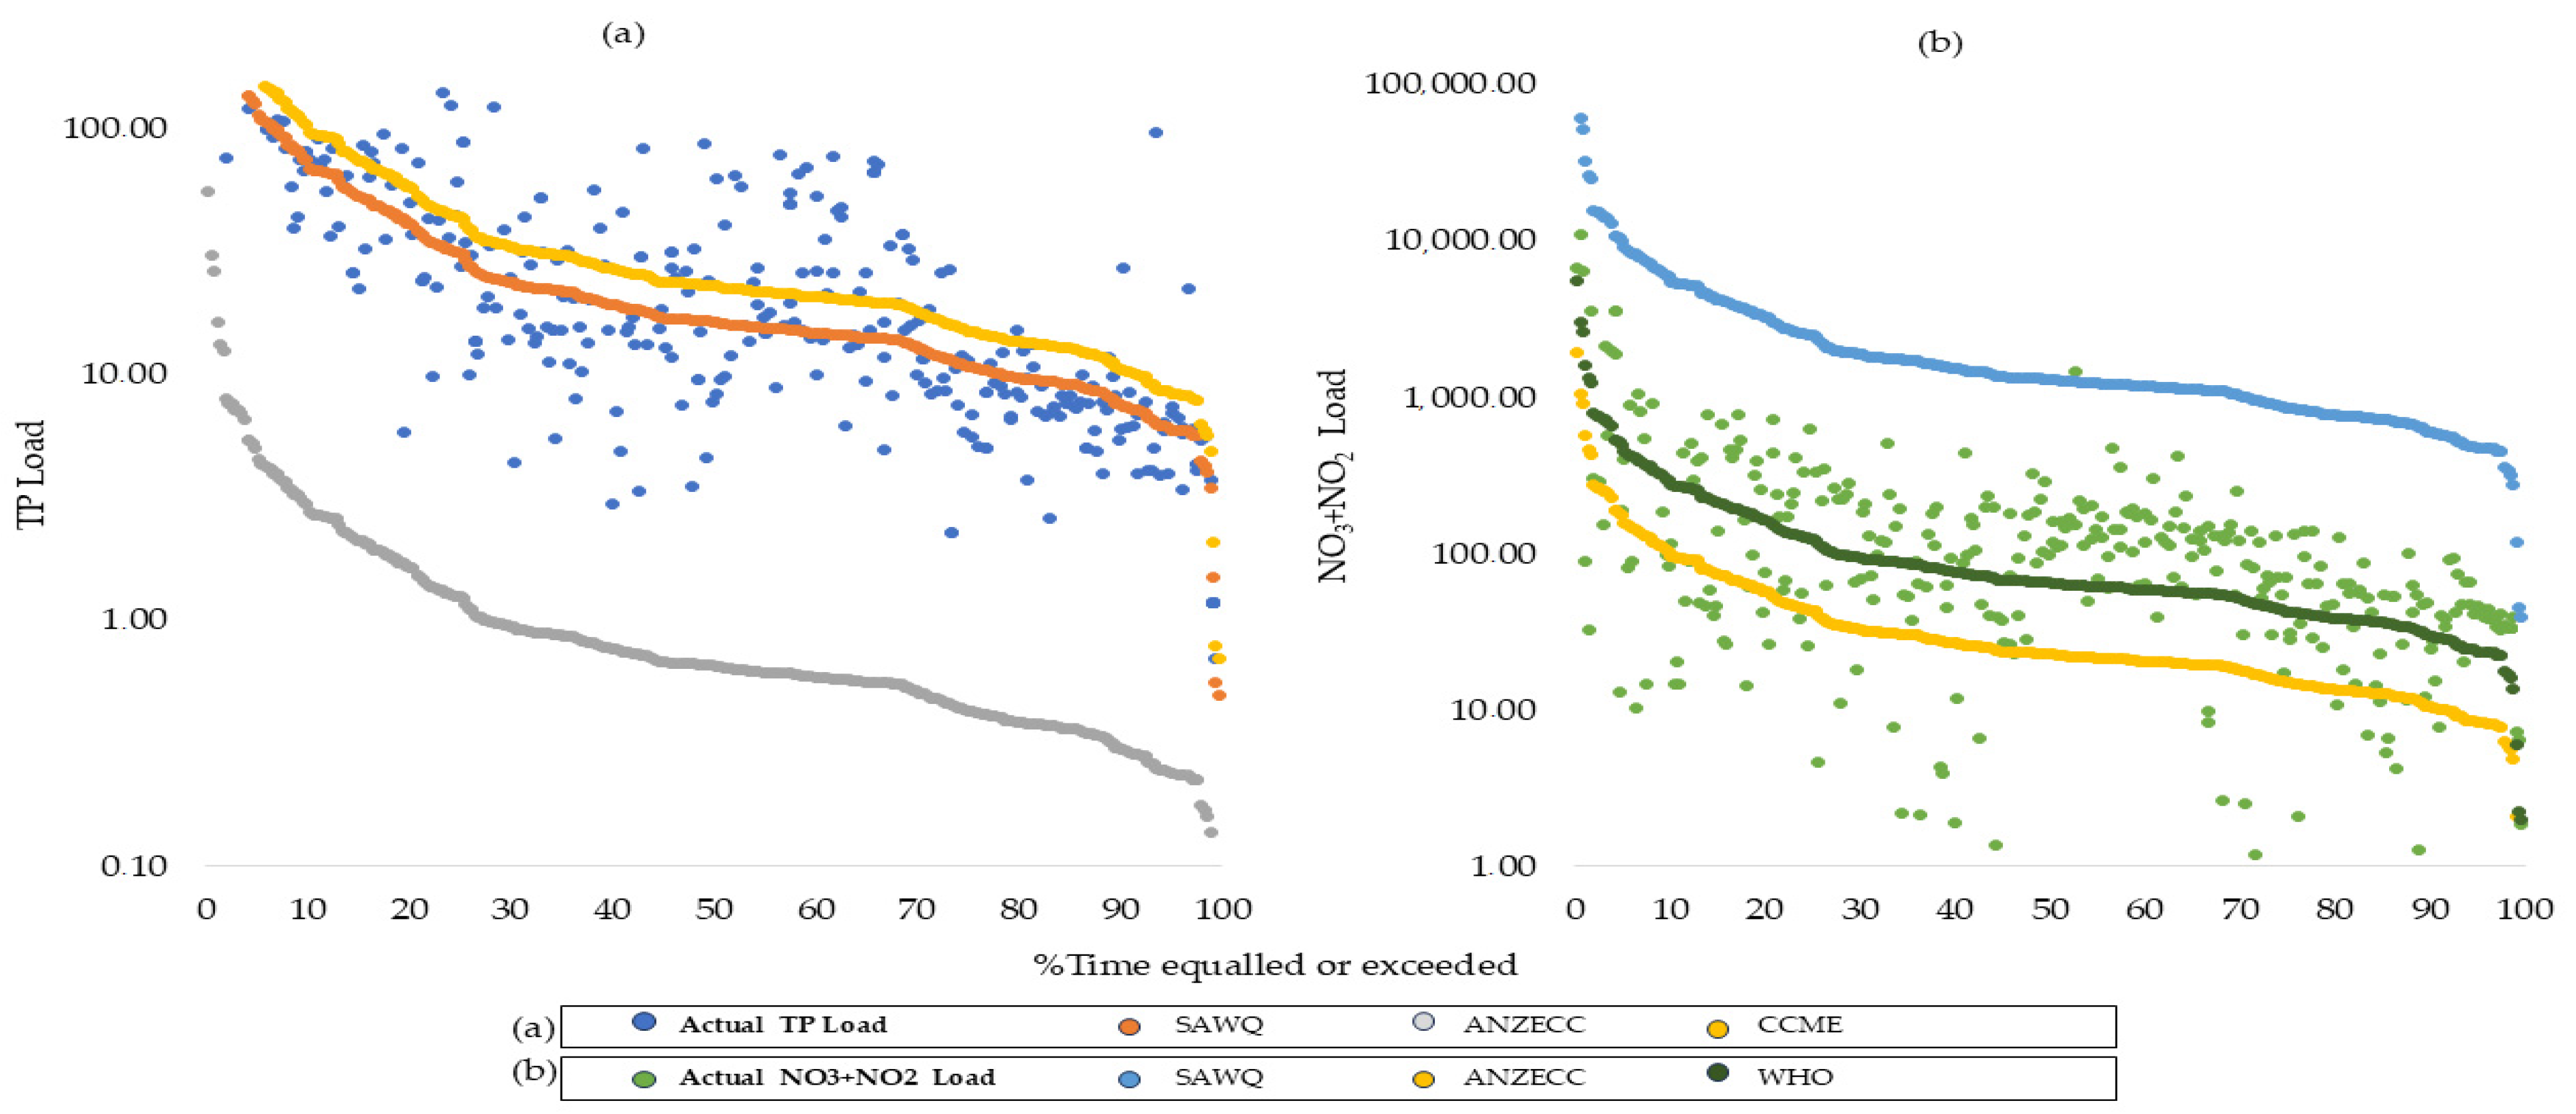
3.3. Nutrient Load Estimation Using Duration Curves

FDCs were analyzed for 2001–2021 at Sites A–E to assess flow variability and its implications for nutrient transport (Figure 3). The results highlight the dominance of low flows across most tributaries, indicating potential challenges for pollutant dilution. At Site A (Endendalespruit), 90% of flows were below 0.02 m3/s, with only 10% exceeding 0.32 m3/s. At Site B (Pienaars River upstream), 90% of flows were below 0.4 m3/s, with 10% exceeding 1.4 m3/s. Higher flow volumes highlight this site’s role as a significant pollutant transport pathway, corroborated by the CPI findings (Table 3). At Sites C (Hartbeesspruit) and D (Zeekoegat WWTW), there were predominantly low flows, with 90% of flows below 0.07 m3/s and 0.06 m3/s, respectively. These sites show limited capacity to mitigate nutrient loads through natural dilution. Whereas Site E (Dam outflow) depicted 90% of flows were below 0.4 m3/s, with higher flows exceeding 3.17 m3/s associated with dam releases and spills. High-flow events are likely during substantial rainfall in upstream catchments, resulting in downstream flooding and potential nutrient surges during wet seasons.
Figure 4 and Figure 5 illustrate the LDCs for TP and NO3 + NO2, comparing actual nutrient loads with permissible limits set by SAWQ and internationally accepted guidelines (e.g., WHO, ANZECC, and CCME). TP loads at Sites A and C exhibited a positive correlation with flow, suggesting the predominance of non-point source contributions during wet-flow conditions. Increased rainfall and runoff during these periods transport nutrients from agricultural and urban areas upstream. Conversely, Sites B and D demonstrated an inverse relationship, with TP loads increasing as flow decreased, indicating the influence of point sources, such as WWTWs, during dry or low-flow periods. At low flows, WWTW effluent constitutes a greater proportion of the total stream volume, thus exerting a stronger influence on TP loads. The assumption is that exceedances during low flow events suggest the influence of point sources, while those occurring during high flow conditions may indicate the influence of non-point source [47]. Exceedances of water quality standards were frequent at Site A mostly during high flows, suggesting non-point source pollution, and at low flows at Sites B and D, indicative of point source impacts. While NO3 + NO2 loads generally remain within allowable limits across most sites. Sporadic non-compliance was observed at Site B, reflecting intermittent point source contributions. The dam’s outflow (Figure 5) showed frequent exceedances for TP throughout the study period, indicating cumulative contributions from both point and non-point sources. These findings suggest that the dam is p-limited, necessitating targeted strategies to reduce TP inputs.

3.4. Land Cover and Land Use Change over Time

The spatial visualization of LULCC in the A23A quaternary catchment from 2001 to 2021 is illustrated in Figure 6. The analysis, conducted over two 10-year intervals, highlights significant spatio–temporal transformations. The results indicate an increase in soil exposure, a substantial decline in vegetation cover, and a significant expansion of the built environment. These changes suggest intensified land use activities with considerable implications for catchment hydrology and water quality.
Table 4 statistically illustrates that over the two decades from 2001 to 2021, the built area has experienced a steady area increase from 26.56% to 32.32%, indicating ongoing urban development. The soil area initially decreased from 10.25% in 2001 to 8.49% in 2011 but surged to 22.01% by 2021, suggesting significant changes in land use or agricultural practices. Meanwhile, the vegetation area remained stable at around 62% between 2001 and 2011 but declined drastically to 45.17% in 2021, possibly due to deforestation or land conversion. The water area has remained relatively stable, with minor fluctuations, balanced around 0.5%. These trends reflect notable shifts in land use and environmental conditions over the years.

4. Discussion

4.1. Implications for Nutrient Load Reduction

Roodeplaat Dam receives inflows from three primary tributaries: the Edendalespruit (Site A), Pienaars (Site B), and Hartbeesspruit Rivers (Site C), along with return flows from the Zeekoegat WWTW (Site D). The Edendalespruit River, passing through residential areas and small-scale farms, is particularly vulnerable to non-point source pollution, as indicated by low-flow conditions and frequent nutrient exceedances (Figure 3). Frequent low-flow conditions suggest limited dilution capacity, exacerbating non-point source pollution impacts. Reduced dilution flows will likely exacerbate organic pollution, leading to increased biological oxygen demand (BOD) and, consequently, lower dissolved oxygen (DO) concentrations in rivers [48]. The Pienaars River traverse informal settlements with inadequate sanitation infrastructure and receives effluent from the malfunctioning Baviaanspoort WWTW. Subsequently, recorded elevated CPI scores reflect significant contributions from both point and non-point source pollution. The Hartbeesspruit River, though supporting a diverse array of flora and fauna, is increasingly threatened by urbanization and pollution. However, it recorded the lowest CPI score among the three rivers, reflecting relatively better conditions compared to other inflows. The CPI results concur with the findings of Modley et al. [49], who previously demonstrated that Roodeplaat Dam is significantly impacted by polluted inflows characterized by elevated levels of metals, faecal coliform bacteria, and nutrients, contributing to the dam’s hyper-eutrophic state.
These rivers, which serve as vital corridors for indigenous fauna and provide recreational value, face significant threats from pollution, habitat degradation, and invasive species due to urbanization and industrialization. This is evident in many developing countries, where freshwater quality continues to decline due to insufficient natural processes to counteract the increasing nutrient loads from anthropogenic activities [50,51,52]. To address this challenge, flow manipulation has emerged as a promising strategy for mitigating eutrophication in regulated river systems [53]. For instance, Song et al. [54] proposed strategies such as implementing surface withdrawal scenarios to reduce hydraulic residence time, thereby mitigating algal growth and accumulation within the reservoir.
By addressing the key drivers of algal blooms, namely residence time and stratification, flow management can effectively reduce primary production. Greater emphasis should be placed on optimizing flow regimes to mimic natural flow patterns and minimizing residence time in downstream reaches, thereby reducing the potential for excessive algal growth. This approach is particularly crucial for highly regulated river systems where natural flow variability has been significantly altered, such as the Pienaars Rivers, as suggested by the elevated CPI.
The malfunctioning WWTWs, particularly Baviaanspoort and Zeekoegat, are significant contributors to elevated TP loads at Sites B and D, with Bavianspoort polluting the most as it operates at 153% of its design capacity [29]. As established, higher nutrient loads between 2012 and 2021 may reflect the worsening condition of WWTWs and increased agricultural runoff. Across South Africa, poorly maintained wastewater infrastructure is a recurring challenge with far-reaching implications for aquatic ecosystems. Municipal wastewater infrastructure serves as the critical barrier between untreated urban wastewater and receiving water bodies, such as the Roodeplaat Dam. A similar problem was evident in the Hartbeespoort Dam, which experienced a significant increase in nutrient loading from inflowing rivers between 2010/11 and 2016/17. The average annual nutrient influx during this period was estimated at 582 t·a−1 for TP and 4987 t·a−1 for TN, likely driven by inadequate wastewater treatment infrastructure, including leaks and overflows within the catchment [55]. When this infrastructure fails, it not only leads to nutrient over-enrichment but also contributes to other water quality issues, including microbial contamination, elevated chemical oxygen demand (COD), and compromised wastewater reuse strategies [56,57].
The volume of wastewater entering Roodeplaat Dam is a substantial portion of its total inflow, making it a key driver of eutrophication. This also presents a downstream risk as water released from the dam flows approximately 1700 km to the sea, often utilized by users unaware of its source or quality [25]. The results of this study emphasize the importance of hydrological dynamics in influencing nutrient transport and the need for sound catchment management to mitigate impacts on downstream ecosystems. Importantly, improving nutrient concentrations in these inflows is critical to maintaining aquatic ecosystem health, ensuring ecological sustainability, and meeting water quality standards for downstream users.
Phosphorus is considered a manageable nutrient due to its higher concentration in synthetic detergents and industrial waste. Approximately 35–50% of P in domestic wastewater originates from detergents, with about 32% eventually settling in reservoirs [58]. N, while also problematic, is more complex to remove due to the energy-intensive aeration requirements of conventional N removal processes [59]. Promising alternatives include algae-based treatments for domestic wastewater effluents, which can reduce TN by 43.1% and 35.1% in pond systems, presenting a sustainable solution for nutrient management in African contexts [60]. Countries such as Sweden have implemented upstream work (uppströmsarbete) strategies focusing on the reduction in harmful substances that enter wastewater infrastructure [61]. This proactive, source-reduction approach offers significant potential for mitigating pollution in South African dams such as Roodeplaat and Hartbeespoort, which are heavily affected by upstream activities.
Additionally, NBS offers an effective approach to controlling pollution and mitigating stormwater impacts. Strategies such as riparian buffer zones, constructed wetlands, and microalgae systems for wastewater treatment are low-cost and energy-efficient alternatives that complement traditional engineering measures [62,63]. For example, Winter et al. [64], identified biofiltration as a promising option for removing environmental pollutants from water, specifically reducing inorganic matter and nutrient concentrations and eliminating pathogens from informal settlement runoff in South Africa. This option, along with other cleaner technology that optimizes industrial processes to reduce pollution, can be integrated into wastewater treatment practices, enhancing both sustainability and economic competitiveness [65]. Significant research gaps remain despite the progress in identifying key nutrient sources. This study highlights the need for further investigations into nutrient reduction strategies tailored systems, including innovative technologies and policy interventions. Addressing these gaps will be critical for effectively mitigating the escalating nutrient load and ensuring the long-term health of the dam and its downstream ecosystems.

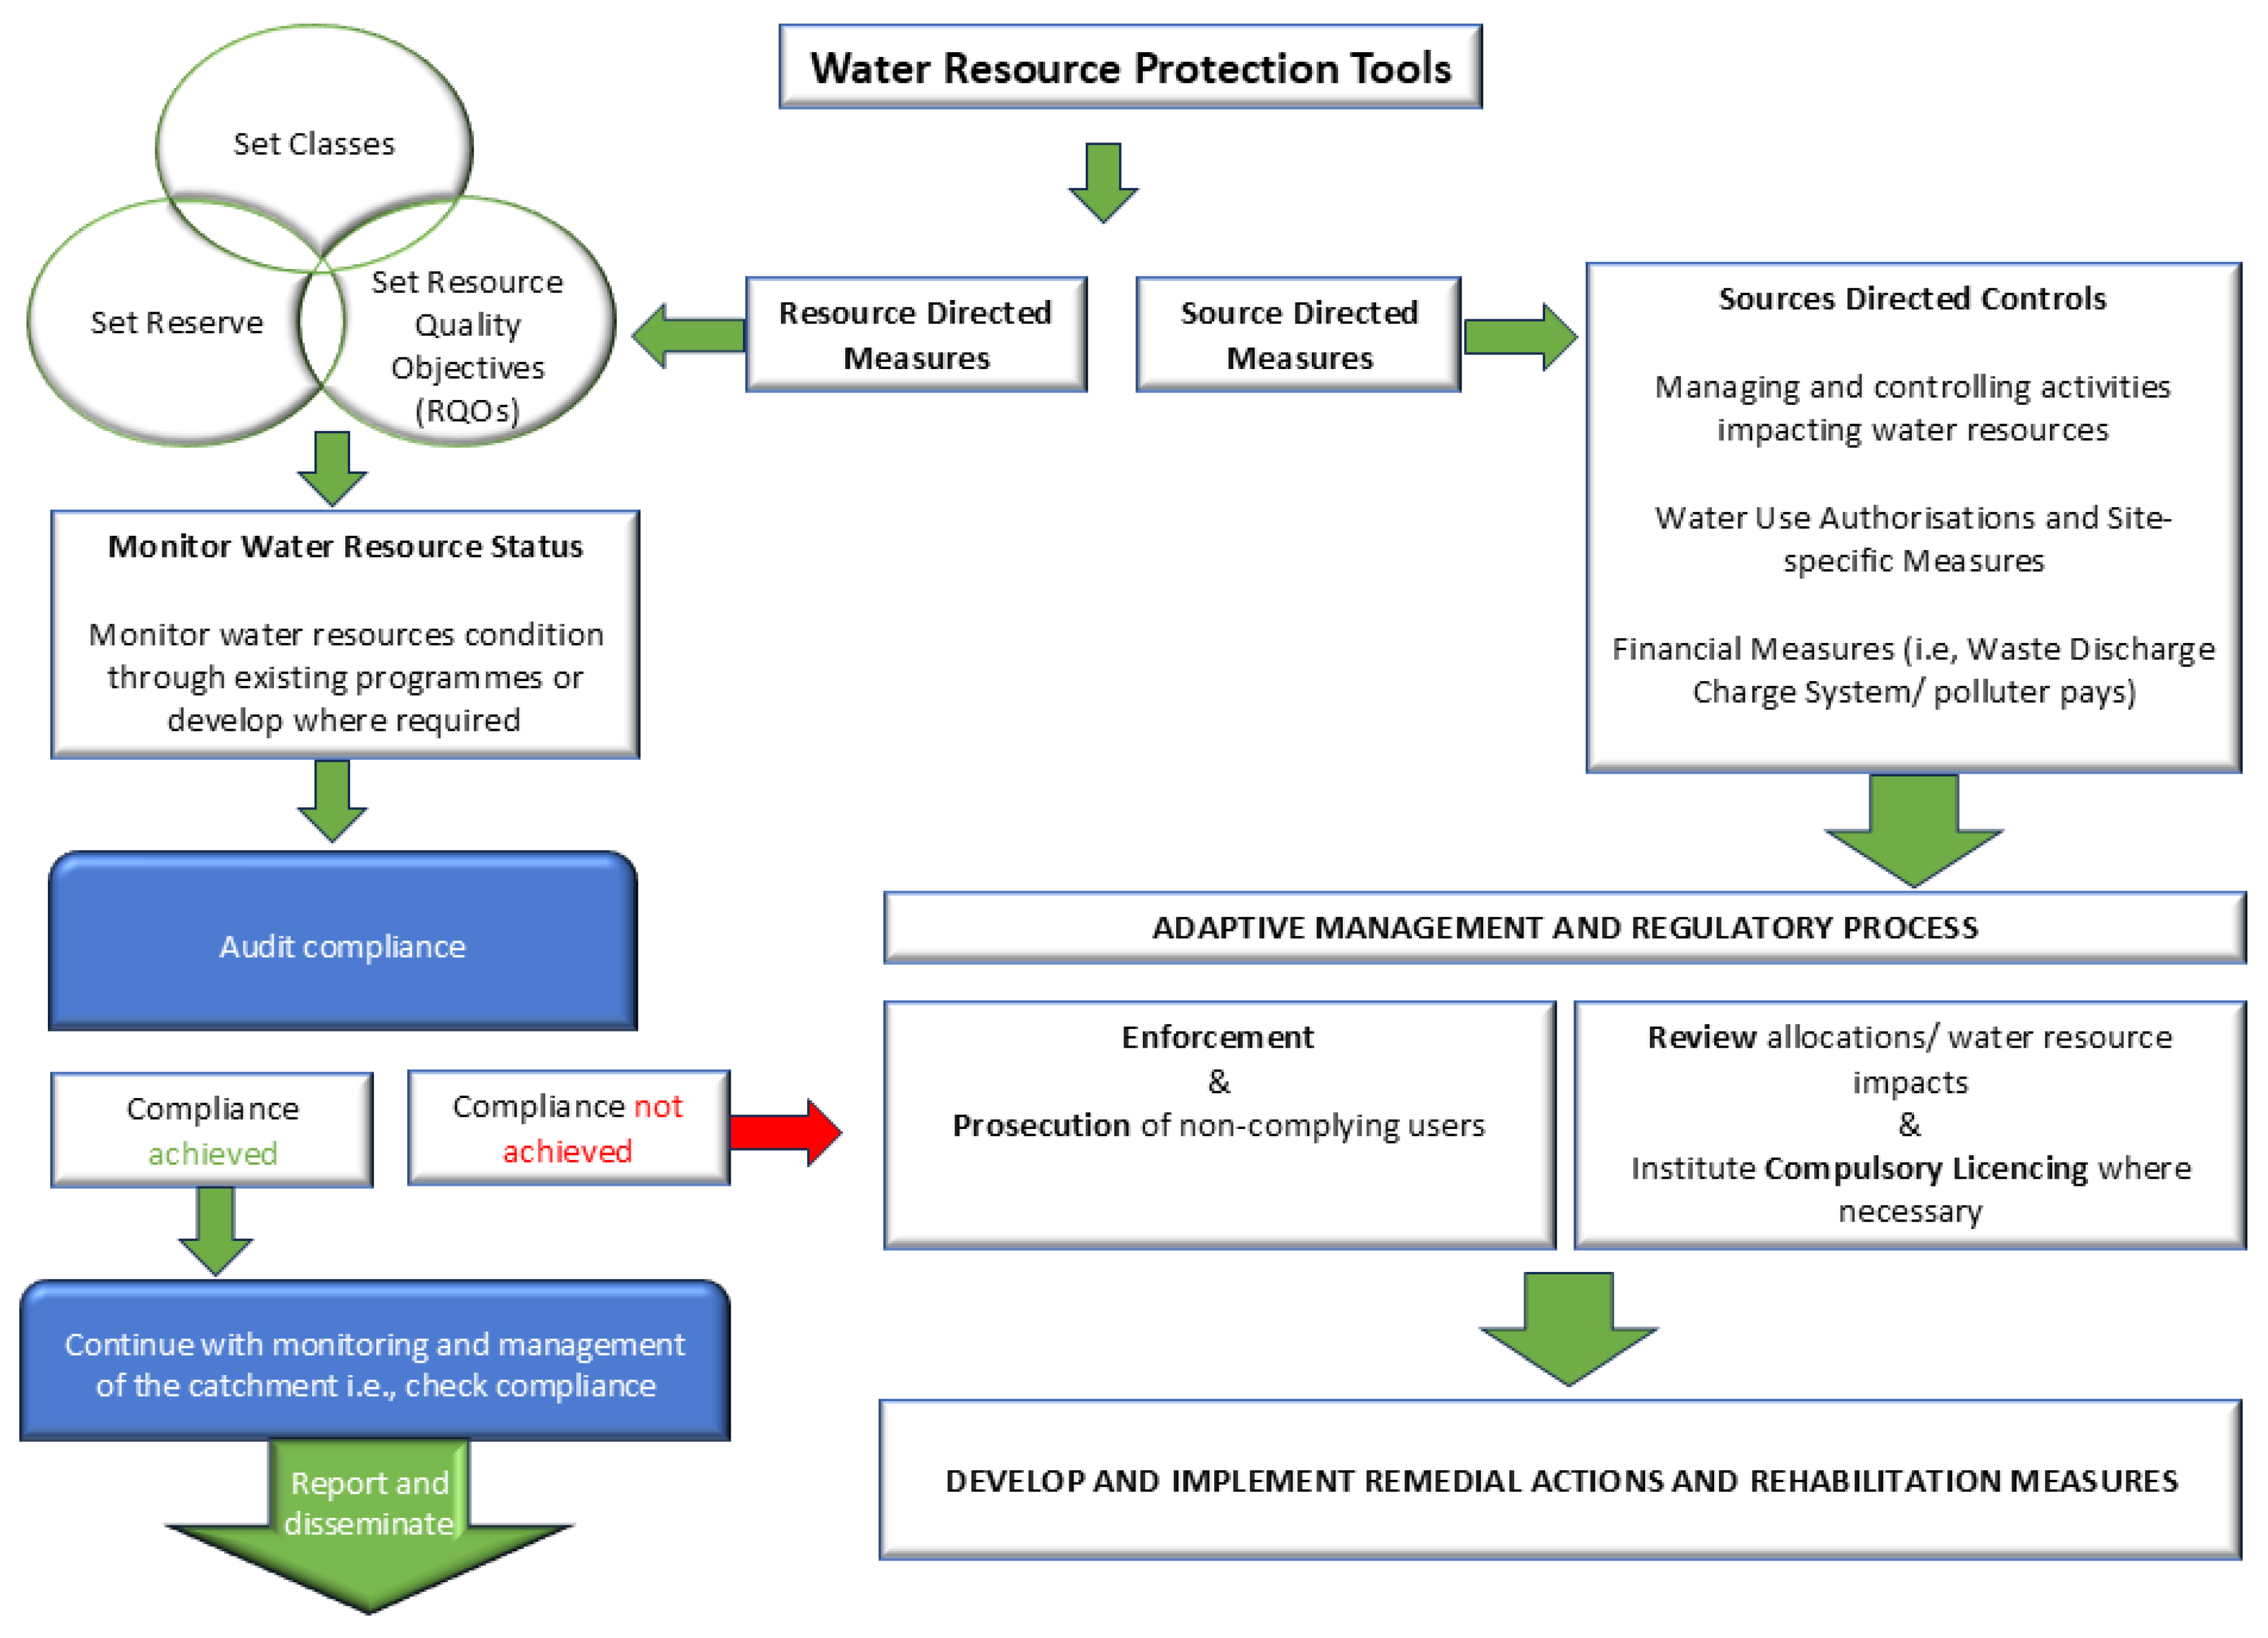
4.2. Implications for Environmental Policies

Mitigating eutrophication in developing countries such as South Africa remains a complex challenge due to the diverse and intertwined nature of pollution sources, including both point and non-point contributors [66]. Transparency and cooperation between government agencies, local communities, and industries are essential for identifying and addressing pollution sources. This is particularly relevant for non-point source pollution, which is more challenging to manage than point sources. Comprehensive monitoring systems provide the data required for evidence-based decision-making and enforcement actions. For example, the identification of P and N vulnerable zones can guide targeted interventions to protect surface and groundwater resources. Within these zones, stricter practices for fertilizer application, manure management, and crop rotation can be mandated to reduce diffuse nutrient loading [53]. Additionally, predictive models are indispensable for assessing these contributions and incorporating legacy nutrient sources, which are often overlooked in traditional accounting systems.
This study has established that rehabilitating dams located in urban areas requires a dual focus on managing point and non-point pollution sources. This involves enforcing stricter regulatory compliance for WWTWs, adopting TMDL frameworks, and implementing financial mechanisms such as the Waste Discharge Charge System. TMDL programs have been widely implemented globally for water quality management, encompassing pollutant reduction strategies and the adoption of best management practices [67]. In South Africa, pilot studies demonstrated the applicability of Rapid TMDL assessments to address a range of water quality issues, including salinity, suspended solids, DO levels, and the impacts of specific toxicants [68]. However, a decade after these initial pilot studies, there has been no progress in their regulatory adoption by the South African government.
To effectively address water quality issues, it is crucial to establish robust regulatory frameworks, foster effective stakeholder collaboration, and implement comprehensive monitoring systems. Strong regulatory oversight, paired with enforceable policies and clear legislation, is critical for ensuring compliance and implementing effective nutrient reduction measures. These measures must be supported by updated catchment management strategies and robust stakeholder engagement to ensure their success.
Figure 7 presents an integrated framework for water resource protection, illustrating the integrated strategies required for successful catchment management [69]. This framework combines resource-directed measures (RDMs) and source-directed controls (SDCs) to balance ecological, social, and economic objectives [70]. RDMs focus on sustainable water use, conservation, and development, ensuring the long-term health of water resources for current and future generations [71]. Complementing this, SDCs regulate water use through wastewater quality standards, hazardous substance control, and cleaner production practices [72]. The precautionary approach outlined in South African water policies emphasizes proactive measures to anticipate risks and mitigate pollutant inflows into water bodies. This includes regular monitoring of sewer networks, stormwater systems, and WWTW effluent quality. Enhanced enforcement mechanisms, supported by financial and technical resources, are critical to ensuring compliance with discharge standards [73].
Furthermore, land management interventions integrated with existing SDCs can address the detrimental effects of urbanization, soil erosion, and agricultural runoff. For instance, riparian buffers, reforestation, and erosion control measures can reduce sediment and nutrient transport into water bodies.

4.3. Policy Implementation Challenges and Recommendations

Despite the presence of robust environmental policy frameworks, several challenges hinder their effective implementation [74]. A key issue is the funding and capacity constraints faced by many municipalities. Limited financial and technical resources restrict their ability to enforce compliance and upgrade WWTW infrastructure. Addressing this challenge requires establishing dedicated funding mechanisms, such as pollution levies or public–private partnerships, to finance infrastructure improvements and enhance monitoring programs. For instance, in China, the government effectively implemented fiscal incentive policies to enhance environmental governance. One notable example is the Energy Saving and Emissions Fiscal Reduction Policy, which has demonstrated success in reducing industrial wastewater discharges and stimulating the adoption of green technologies [75]. Recently, the European Union revised the Urban Wastewater Treatment Directive (UWWTD), implementing stringent nutrient effluent standards that are expected to significantly improve the ecological status of numerous water bodies [76].
Another critical challenge is stakeholder engagement, which is essential for the success of water management strategies. Active participation from local communities, industries, and other stakeholders is often limited, undermining collaborative efforts to address water quality issues. In many countries, there have been challenges to manage eutrophication, which is associated with failure to implement a coherent set of measures that effectively engage different stakeholder groups utilizing an appropriate repertoire of policy instruments [77]. Hence, fostering active engagement and ensuring compliance are paramount. This necessitates the implementation of participatory planning processes coupled with robust capacity-building and comprehensive public awareness campaigns.
Monitoring and data gaps further undermine policy enforcement and decision-making. The lack of access to real-time data and the prevalence of outdated monitoring systems hinder effective water resource management. Investing in modern monitoring technologies, such as remote sensing and Internet of Things (IoT)-based sensors, can significantly enhance data collection and analysis capabilities, enabling more informed and timely interventions.
Finally, while integrated frameworks like RDMs and SDCs show promise, their application remains uneven across catchments. This highlights the need for scaling successful models to ensure consistent and widespread implementation. Developing scalable templates for catchment management plans, tailored to local socio-economic and ecological contexts, can help bridge this gap and promote uniform policy application. Furthermore, RDMs and SDCs with targeted catchment-based tools, such as TMDLs, can significantly enhance the effectiveness of water quality management strategies and improve ecological outcomes.

4.4. Climate Change Scenario: Considerations for Future Research

The relationship between flow patterns and nutrient dynamics in dams is influenced by a range of factors, including climatic variables such as temperature and rainfall. Higher temperatures can accelerate nutrient cycling, increasing external nutrient loading from catchments. Similarly, increased rainfall, particularly in agricultural or urban areas, can intensify runoff and transport nutrients into water bodies [78]. Changes in flow patterns, including more frequent and intense flooding or prolonged dry periods, further complicate nutrient dynamics by affecting nutrient distribution, retention, and cycling within dams. Understanding these interactions is critical for effective water resource management and the long-term protection of aquatic ecosystems.
The CMIP6 projections, presented at a 0.25° × 0.25° (25 km × 25 km) resolution, indicate that Gauteng Province is likely to experience increases in both temperature and rainfall in the future (Figure 8). Seasonal streamflow variations are anticipated to reflect changing rainfall patterns; however, the specific local impacts of climate change on hydrology and nutrient dynamics will differ by season and region [17]. These climatic changes are expected to exacerbate challenges in managing dams situated in urban areas, including the Roodeplaat Dam. Higher temperatures may intensify algal blooms and eutrophication risks, while increased rainfall could lead to heightened runoff, transporting greater nutrient loads from surrounding agricultural and urban areas.
Additionally, increased temperatures are likely to enhance evaporation rates, potentially reducing water levels and concentrating nutrient loads in the remaining water. This can further exacerbate eutrophication. Changes in the net climate water balance, driven by altered precipitation and evaporation patterns, may also impact the overall water quantity and quality [79]. Altered flow patterns driven by climate change may compromise the dam’s ability to maintain water quality, particularly during extreme hydrological events such as floods or extended droughts. These factors collectively necessitate the need for adaptive water management strategies to proactively mitigate the impacts on nutrient loading and water quality.
Thus, to address these challenges, future studies must incorporate climate change projections when assessing the relationship between flow patterns and nutrient loads in dams. By understanding the complex interactions between climatic drivers, land use changes, and nutrient dynamics, water managers and decision-makers can develop adaptive strategies that enhance resilience to climate variability. These strategies may include improving green infrastructure to mitigate runoff, adopting NBS to enhance nutrient retention, and designing more robust monitoring systems to track and respond to climate-induced changes in water quality.

4.5. Key Findings

This study provides critical insights into the dynamics of nutrient loading, land-use changes, and water quality challenges in the Roodeplaat Dam system. These patterns highlight the role of specific tributaries and pollution sources in nutrient dynamics. Analysis of nutrient loads revealed significant spatial and temporal variability over the 20-year study period. NO3 + NO2 and TP levels were notably elevated at Sites B and D, primarily due to malfunctioning WWTWs underscoring the significant contribution of point source pollution. Conversely, non-point sources, including agricultural runoff and urban stormwater, were major contributors at Sites A and C, particularly during wet-flow conditions. Hydrological analysis revealed that low-flow conditions dominate most tributaries, limiting natural pollutant dilution, while LDCs showed frequent exceedances of water quality standards for TP, especially during dry periods at Sites B and D. The study further identified Roodeplaat Dam as a P-limited system, with TP frequently exceeding permissible limits, whereas NO3 + NO2 remained largely within thresholds. This finding underscores the need for targeted phosphorus reduction strategies to address eutrophication risks.
Furthermore, the preceding study by Mnyango et al. [22], established a 100, 95, 14, 48, and 33% non-compliance rate for the chlorophyll-a (Chl-α), PO43−, NH4+, NO3 + NO2, and pH, respectively. These findings suggested that the dam water quality commonly fell below the required resource quality status. Their study also documented a clear seasonal temperature profile, ranging from 25 °C in summer to 16 °C in winter, and identified the dam as monomictic with stable thermal stratification during summer, further supporting our observations of thermal stratification influencing nutrient dynamics.
LULCC analysis highlighted substantial declines in vegetation cover, increased soil exposure, and significant urban expansion. The decline in vegetative cover compromises the landscape’s ability to absorb rainfall, mitigate floods, and filter pollutants. This reduction also leads to habitat fragmentation and decreased biodiversity resilience within the catchment. Concurrently, increased soil exposure is indicative of heightened erosion risks [80], contributing to sediment transport and P loading into the dam, and exacerbating eutrophication risks [81]. The expansion of the built environment, driven by urbanization, has significantly increased impervious surfaces. These impervious areas promote surface runoff, reduce natural infiltration, intensify non-point source pollution, disrupt natural drainage patterns and further impact the hydrological balance of the catchment [82], as well as reduce the ecosystem’s ability to mitigate environmental stressors.
LULCC patterns are known to exacerbate water quality deterioration, particularly in larger and more degraded catchments, where the compounded effects of urbanization, soil erosion, and vegetation loss reduce ecological functionality [83,84]. The findings of this study emphasize the need for further investigation into the ecological consequences of LULCC in the Roodeplaat Dam system. Such research is critical to design and implement sustainable land management practices that balance land use demands with ecological conservation. Measures such as reforestation, erosion control, and green infrastructure could mitigate the observed trends and promote a more resilient catchment landscape.
Climatic variables, including altered rainfall patterns and extreme weather events, may have contributed to the observed changes by accelerating natural landscape degradation and amplifying the effects of human activities. Concerningly, climate projections from CMIP6 data indicate that Gauteng Province will likely experience increased temperatures and rainfall in the future, potentially exacerbating nutrient loading and hydrological variability (Figure 8). Finally, the study’s regulatory and management analysis highlighted the critical need for stricter compliance with WWTW standards, alongside the adoption of NBS and integrated catchment management practices to address both point and non-point source pollution effectively. Incorporating climate change projections is vital for adapting these policies to future scenarios. Data from CMIP6 models can inform how changes in rainfall intensity, temperature, and extreme weather events may exacerbate nutrient loading and hydrological imbalances. Proactive adaptation measures, such as improving urban green infrastructure and enhancing floodplain management, can help mitigate these impacts.

4.6. Limitations and Future Research Directions

This study provides a robust foundation for understanding nutrient loading and water quality dynamics in the Roodeplaat Dam; however, several limitations must be acknowledged. While the analysis benefits from a 20-year historical dataset, gaps in monitoring and sampling frequency inconsistencies may have influenced temporal trend accuracy. The lack of real-time data further restricted the ability to capture short-term variations, such as nutrient spikes during extreme weather events. Additionally, while point source pollution was effectively quantified, diffuse sources, including agricultural runoff and urban stormwater, were more challenging to estimate accurately. The role of legacy nutrients stored in sediments, which are periodically released into the water column, was also not fully explored, representing a critical gap in nutrient accounting. Furthermore, uncertainties in local-scale CMIP6 climate projections may affect the reliability of predicted impacts, particularly regarding rainfall and temperature changes. To mitigate these limitations, a rigorous data quality assessment was conducted (i.e., data treatment) for all input parameters, including flow data, nutrient concentrations, and meteorological data. The identified data gaps were subsequently addressed using data management systems such as the HYDSTRA model to perform quality assurance functions (e.g., verification and patching).
Future research should address these limitations by adopting enhanced monitoring systems that leverage IoT-based sensors and remote sensing technologies to provide high-resolution, real-time data on flow and water quality. Regular monitoring of diffuse sources, such as runoff from agricultural and urban areas, is essential for developing accurate nutrient budgets. Future studies should also investigate the contribution of legacy nutrients stored in sediments to better understand their role in eutrophication dynamics. Integrating CMIP6 climate projections with predictive hydrological and nutrient models would enable scenario-based simulations, providing insights into long-term intervention impacts under varying land use and climatic conditions.
Scaling NBS, such as riparian buffers and hybrid constructed wetlands, presents another promising avenue for research. Field trials should evaluate their effectiveness in reducing nutrient loads and explore their scalability across catchments in South Africa. Additionally, investigating mechanisms for integrating scientific findings into policy frameworks and water management practices is essential. Stakeholder engagement, including community-based initiatives, should be prioritized to foster sustainable land and water management. Finally, comparative studies across multiple catchments would enhance the understanding of universal drivers of eutrophication and identify broadly applicable strategies.
By addressing these limitations and exploring the proposed research directions, future studies can enhance our understanding of nutrient dynamics, refine management practices, and strengthen the resilience of aquatic ecosystems in the face of climatic and anthropogenic pressures.

5. Conclusions

The findings revealed that TP and NO3 + NO2 loads varied significantly across the sites investigated, with TP loads consistently exceeding allowable limits. This pattern indicates the influence of both point and non-point source pollution, with malfunctioning WWTWs identified as the dominant contributors. This study’s findings necessitate a robust, multi-pronged strategy to effectively combat nutrient overload in the region’s water resources. Paramount among these efforts is addressing the key drivers: malfunctioning WWTWs and non-point source pollution originating from urban runoff and agricultural activities. Crucially, enhanced monitoring through expanded and real-time systems is required to inform targeted interventions. These interventions should include: (1) a prioritized program to upgrade and optimize underperforming WWTWs, including investment in advanced nutrient removal technologies and rigorous performance monitoring; (2) strategic implementation of NBS such as constructed wetlands and riparian buffers to provide natural filtration and nutrient retention; (3) a comprehensive urban runoff management strategy incorporating green infrastructure; (4) incentivizing the adoption of sustainable agricultural practices, including reduced tillage and precision fertilizer application, and promoting reforestation to minimize soil erosion and nutrient runoff; (5) strengthening and enforcing regulations on nutrient discharges, coupled with incentive programs to encourage compliance and proactive adoption of best management practices; (6) implementing community engagement and education programs to raise awareness, capacity building and promote responsible water use and land management; and (7) designing climate-resilient water infrastructure and developing adaptive management plans that explicitly consider projected climate change impacts, including altered rainfall patterns and increased frequency of extreme events. By aggressively and systematically pursuing these interconnected strategies, water management efforts can effectively mitigate nutrient overload, protect ecosystem health, and ensure the long-term sustainability of the region’s water resources.
The study also recommends updating P and N standards to align with the specific needs of water resources in the catchment and beyond. Applying precautionary principles is particularly relevant in contexts where there are intolerable risks to human or environmental health or where scientific knowledge remains insufficient. This approach is especially critical in developing countries, where limited data and resources often constrain effective water resource management.
In conclusion, this research highlights the interconnectedness of land use changes, nutrient dynamics, and water quality, emphasizing the importance of adaptive and integrated management strategies. By prioritizing targeted interventions and robust policy frameworks, developing countries such as South Africa can achieve long-term water security and protect their aquatic ecosystems for future generations.

Author Contributions

Conceptualization, S.S.M., M.T. and P.J.O.; methodology, S.S.M.; software, C.T., S.S.M. and N.G.X.; validation, M.T., Y.S. and P.J.O.; formal analysis, S.S.M., C.T. and N.G.X.; data curation, S.S.M.; writing—original draft preparation, S.S.M.; writing—review and editing, M.T. and Y.S.; supervision, M.T. and P.J.O.; funding acquisition, S.S.M. and P.J.O. All authors have read and agreed to the published version of the manuscript.

Funding

The Department of Water and Sanitation funded this research, and the University of the Free State sponsored the Article Processing Charge.

Data Availability Statement

Data are available from DWS upon request.

Acknowledgments

The authors gratefully acknowledge anonymous reviewers appointed by the journal whose comments, suggestions, and input substantially improved this paper.

Conflicts of Interest

The authors declare no conflicts of interest.

Abbreviations

The following abbreviations are used in this manuscript:
ANZECCAustralian and New Zealand Conservation Council and the Agricultural and Resource Management Council for Australia and New Zealand
CCMECanadian Council of Ministers for the Environment
CMIPCoupled Model Inter-comparison Project
CODChemical Oxygen Demand
CPIComprehensive Pollution Index
DWSDepartment of Water and Sanitation
EMSsEarth System Models
FDCFlow Duration Curve
IPCCIntergovernmental Panel on Climate Change
LDCLoad Duration Curve
LEDAPSLandsat Ecosystem Disturbance Adaptive Processing System
LULCCLand Use Land Cover Change
NNitrogen
NBSNature-based Solution
PPhosphorus
PCAPrincipal Component Analysis
PIPollution Index
RDMsResource Directed Measures
RMSEroot mean square error
RQOsResource Quality Objectives
SAWQSouth African Water Quality Standard
SDCsSource Directed Controls
SSPsShared Socio-economic Pathways
TMDLsTotal Maximum Daily Loads
TNTotal nitrogen
TPTotal phosphorus
TWQRTarget Water Quality Range
USGSUnited States Geological Survey
VEPACVariance Estimation and Precision
WHOWorld Health Organization
WMSWater Management System
WWTWWastewater Treatment Works

References

  1. Makanda, K.; Nzama, S.; Kanyerere, T. Assessing Feasibility of Water Resource Protection Practice at Catchment Level: A Case of the Blesbokspruit River Catchment, South Africa. Water 2023, 15, 2394. [Google Scholar] [CrossRef]
  2. Dubey, D.; Dutta, V. Nutrient Enrichment in Lake Ecosystem and Its Effects on Algae and Macrophytes. In Environmental Concerns and Sustainable Development; Shukla, V., Kumar, N., Eds.; Springer: Singapore, 2020. [Google Scholar]
  3. Noori, R.; Berndtsson, R.; Franklin Adamowski, J.; Rabiee Abyaneh, M. Temporal and depth variation of water quality due to thermal stratification in Karkheh Reservoir, Iran. J. Hydrol. Reg. Stud. 2018, 19, 279–286. [Google Scholar] [CrossRef]
  4. Wei, Z.; Yu, Y.; Yi, Y. Spatial distribution of nutrient loads and thresholds in large shallow lakes: The case of Chaohu Lake, China. J. Hydrol. 2022, 613, 128466. [Google Scholar] [CrossRef]
  5. Rathore, S.; Chandravanshi, P.; Chandravanshi, A.; Jaiswal, K. Eutrophication: Impacts of Excess Nutrient Inputs on Aquatic Ecosystem. OSR-JAVS 2016, 9, 89–96. [Google Scholar] [CrossRef]
  6. Pranta, A.D.; Rahaman, M.d.T.; Ahmed, M.d.S.; Rafi, M.d.S.A. Navigating Eutrophication in Aquatic Environments: Understanding Impacts and Unveiling Solutions for Effective Wastewater Management. Res. Ecol. 2023, 5, 11–18. [Google Scholar] [CrossRef]
  7. Njagi, D.M.; Routh, J.; Odhiambo, M.; Luo, C.; Basapuram, L.G.; Olago, D.; Klump, V.; Stager, C. A century of human-induced environmental changes and the combined roles of nutrients and land use in Lake Victoria catchment on eutrophication. Sci. Total Environ. 2022, 835, 155425. [Google Scholar] [CrossRef]
  8. Yang, X.; Jiang, Y.; Deng, X.; Zheng, Y.; Yue, Z. Temporal and Spatial Variations of Chlorophyll a Concentration and Eutrophication Assessment (1987–2018) of Donghu Lake in Wuhan Using Landsat Images. Water 2020, 12, 2192. [Google Scholar] [CrossRef]
  9. Sirunda, J.; Oberholster, P.; Wolfaardt, G.; Botes, M.; Truter, C. The Assessment of Phytoplankton Dynamics in Two Reservoirs in Southern Africa with Special Reference to Water Abstraction for Inter-Basin Transfers and Potable Water Production. Water 2021, 13, 3045. [Google Scholar] [CrossRef]
  10. Hwang, S.J. Eutrophication and the Ecological Health Risk. Int. J. Environ. Res. Public Health 2020, 17, 6332. [Google Scholar] [CrossRef]
  11. Naderian, D.; Noori, R.; Heggy, E.; Bateni, S.M.; Bhattarai, R.; Nohegar, A.; Sharma, S. A water quality database for global lakes. Resour. Conserv. Recycl. 2024, 202, 107401. [Google Scholar] [CrossRef]
  12. Fetahi, T. Eutrophication of Ethiopian water bodies: A serious threat to water quality, biodiversity and public health. Afr. J. Aquat. Sci. 2019, 44, 303–312. [Google Scholar] [CrossRef]
  13. Akinnawo, S.O. Eutrophication: Causes, consequences, physical, chemical and biological techniques for mitigation strategies. Environ. Chall. 2023, 12, 100733. [Google Scholar] [CrossRef]
  14. Kirk, L.; Compton, J.E.; Neale, A.; Sabo, R.D.; Christensen, J. Our national nutrient reduction needs: Applying a conservation prioritization framework to US agricultural lands. J. Environ. Manag. 2024, 351, 119758. [Google Scholar] [CrossRef] [PubMed]
  15. Thornton, J.A.; Harding, W.R.; Dent, M.; Hart, R.C.; Lin, H.; Rast, C.L.; Rast, W.; Ryding, S.-O.; Slawski, T.M. Eutrophication as a ‘wicked’ problem. Lakes Reserv. Sci. Policy Manag. Sustain. Use 2013, 18, 298–316. [Google Scholar] [CrossRef]
  16. Verlicchi, P.; Grillini, V. Surface Water and Groundwater Quality in South Africa and Mozambique—Analysis of the Most Critical Pollutants for Drinking Purposes and Challenges in Water Treatment Selection. Water 2022, 12, 305. [Google Scholar] [CrossRef]
  17. Patil, R.; Wei, Y.; Pullar, D.; Shulmeister, J. Effects of change in streamflow patterns on water quality. J. Environ. Manag. 2022, 302, 113991. [Google Scholar] [CrossRef]
  18. Nkosi, M.; Mathivha, F.I.; Odiyo, J.O. Impact of Land Management on Water Resources, a South African Context. Sustainability 2021, 13, 701. [Google Scholar] [CrossRef]
  19. Welde, K.; Gebremariam, B. Effect of land use land cover dynamics on hydrological response of watershed: Case study of Tekeze Dam watershed, northern Ethiopia. Int. Soil Water Conserv. Res. 2017, 5, 1–16. [Google Scholar] [CrossRef]
  20. Truneh, L.A.; Matula, S.; Báťková, K. An analysis of the impacts of land use change on the components of the water balance in the Central Rift Valley sub-basins in Ethiopia. Sustain. Water Resour. Manag. 2024, 10, 77. [Google Scholar] [CrossRef]
  21. Gabiri, G.; Diekkrüger, B.; Näschen, K.; Leemhuis, C.; van der Linden, R.; Majaliwa, J.-G.M.; Obando, J.A. Impact of Climate and Land Use/Land Cover Change on the Water Resources of a Tropical Inland Valley Catchment in Uganda, East Africa. Climate 2020, 8, 83. [Google Scholar] [CrossRef]
  22. Mnyango, S.S.; Thwala, M.; Oberholster, P.J.; Truter, C.J. Using Multiple Indices for the Water Resource Management of a Monomictic Man-Made Dam in Southern Africa. Water 2022, 14, 3366. [Google Scholar] [CrossRef]
  23. Walmsley, R.; Toerien, D.; Steÿn, D. Eutrophication of Four Transvaal Dams. Water SA 1978, 4, 61–75. [Google Scholar]
  24. Walmsley, R.; Toerien, D.; Steÿn, D. An Introduction to the Limnology of Roodeplaat Dam. J. Limnol. Soc. South. Afr. 1978, 4, 35–52. [Google Scholar] [CrossRef]
  25. Silberbauer, M.; Esterhuyse, C. Poster: Parallel drainages—The urban hydrology of the Moreletaspruit. In Proceedings of the 17th SANCIAHS National Hydrology Symposium, UWC SANCIAHS, Bellville, South Africa, 1–3 September 2014. [Google Scholar]
  26. Bosman, H.; Kempster, P. Precipitation Chemistry of Roodeplaat Dam. Water SA 1985, 11, 157–168. [Google Scholar]
  27. Jones, R.A.; Lee, G.F. Impact of phosphorus load reductions on eutrophication-related water quality of Roodeplaat Dam (Reservoir), Republic of South Africa. Water SA 1984, 10, 115–120. [Google Scholar]
  28. Ndlela, L.L.; Oberholster, P.J.; Van Wyk, J.H.; Cheng, P.H. Bacteria as biological control agents of freshwater cyanobacteria: Is it feasible beyond the laboratory? Appl. Microbiol. Biotechnol. 2018, 102, 9911–9923. [Google Scholar] [CrossRef]
  29. Lukhele, T.; Msagati, T.A.M. Eutrophication of Inland Surface Waters in South Africa: An Overview. Int. J. Environ. Res. 2024, 18, 27. [Google Scholar] [CrossRef]
  30. Hohls, B.C.; Quibell, G.; Du Plessis, B.J.; Belcher, T. Assessment of the Implementation of the Phosphate Standard at the Baviaanspoort and the Zeekoegat Water Care Works; Report No. N/A230/01/DEQ0797; Department of Water Affairs and Forestry: Pretoria, South Africa, 1998. Available online: https://www.dws.gov.za/iwqs/roodeplaat/index.htm (accessed on 23 August 2024).
  31. Sukenik, A.; Kaplan, A. Cyanobacterial Harmful Algal Blooms in Aquatic Ecosystems: A Comprehensive Outlook on Current and Emerging Mitigation and Control Approaches. Microorganisms 2021, 9, 1472. [Google Scholar] [CrossRef]
  32. Department of Water and Sanitation. Green Drop Watch Report 2023; Department of Water and Sanitation: Pretoria, South Africa, 2023. Available online: https://ws.dws.gov.za/iris/releases/GDWR.pdf (accessed on 15 January 2025).
  33. Republic of South Africa. Government Notice (GN) No. 42775: Determination of Resource Quality Objectives in the Mokolo, Matlabas, Crocodile (West), and Marico Catchments in the Limpopo North West Water Management Area (WMA 01): Resource Quality Objectives and Numerical Limits. Volume 652. Government Printing Works South Africa. 18 October 2019; pp. 103–260. Available online: http://www.gpwonline.co.za (accessed on 23 August 2024).
  34. Department of Water Affairs and Forestry. Water Quality Sampling Manual for the Aquatic Environment; Report Number: N/0000100/DEQ/0497; Department of Water Affairs and Forestry: Pretoria, South Africa, 1997. Available online: https://www.dws.gov.za/iwqs/reports/general/Kilian_1997_Water_Quality_Sampling_Manual_for_the_Aquatic_Environment.pdf (accessed on 15 September 2024).
  35. Water Research Commission. Quality of Domestic Water Supplies. Volume 2: Sampling Guide; WRC Report No. TT 117/99; Department of Water Affairs and Forestry, Department of Health, and Water Research Commission: Pretoria, South Africa, 2003. Available online: https://www.wrc.org.za/wp-content/uploads/mdocs/Quality%20of%20Domestic%20Water%20Supplies%20Sampling%20Guide%20Vol%202.pdf (accessed on 15 September 2024).
  36. Magagula, M.; Atangana, E.; Oberholster, P. Assessment of the Impact of Coal Mining on Water Resources in Middelburg, Mpumalanga Province, South Africa: Using Different Water Quality Indices. Hydrology 2024, 11, 113. [Google Scholar] [CrossRef]
  37. Sirunda, J.; Oberholster, P.; Wolfaardt, G. Assessing the Adverse Effects of Land Use Activities on the Water Quality of Selected Sub-Saharan Africa Reservoirs Using a Combination of Water Quality Indices. Water Air Soil Pollut. 2022, 233, 267. [Google Scholar] [CrossRef]
  38. Oberholster, P.F.; Goldin, J.; Xu, Y.; Kanyerere, T.; Oberholster, P.J.; Botha, A.M. Assessing the adverse effects of a mixture of AMD and sewage effluent on a sub-tropical dam situated in a nature conservation area using a modified pollution index. Int. J. Environ. Res. 2021, 15, 321–333. [Google Scholar] [CrossRef]
  39. Son, C.T.; Giang, N.T.H.; Thao, T.P.; Nui, N.H.; Lam, N.T.; Cong, V.H. Assessment of Cau River water quality assessment using a combination of water quality and pollution indices. J. Water Supply Res. Technol. Aqua 2020, 69, 160–172. [Google Scholar] [CrossRef]
  40. Department of Water Affairs and Forestry. South African Water Quality Guidelines. Volumes 1: Domestic Use, 2nd ed.; Department of Water Affairs and Forestry: Pretoria, South Africa, 1996. Available online: https://www.dws.gov.za/Groundwater/documents/Pol_saWQguideFRESHDomesticusevol1.pdf (accessed on 26 August 2024).
  41. Department of Water Affairs and Forestry. South African Water Quality Guidelines. Volume 7: Aquatic Systems; Department of Water Affairs and Forestry: Pretoria, South Africa, 1996. Available online: https://www.dws.gov.za/iwqs/wq_guide/edited/Pol_saWQguideFRESH_vol7_Aquaticecosystems.pdf (accessed on 14 September 2024).
  42. World Health Organization (WHO). Nitrate and Nitrite in Drinking-Water: Background Document for Development of WHO Guidelines for Drinking-Water Quality; World Health Organization: Geneva, Switzerland, 2016; Available online: https://cdn.who.int/media/docs/default-source/wash-documents/wash-chemicals/nitrate-nitrite-background-jan17.pdf?sfvrsn=1c1e1502_4 (accessed on 23 February 2025).
  43. ANZECC. Australian and New Zealand Environment and Conservation Council and Agriculture and Resource Management Council of Australia and New Zealand. National water quality management strategy: Paper No. 4. In Australian and New Zealand Guidelines for Fresh and Marine Water Quality. Vol. 1: The Guidelines; Australian Water Association: Canberra, Australia, 2000. Available online: https://www.waterquality.gov.au/sites/default/files/documents/anzecc-armcanz-2000-guidelines-vol1.pdf (accessed on 26 August 2024).
  44. Canadian Council of Ministers of the Environment (CCME). Phosphorus: Canadian Guidance Framework for the Management of Freshwater Systems. 2004. Available online: https://ccme.ca/en/resources/water-aquatic-life (accessed on 23 February 2025).
  45. Eyring, V.; Bony, S.; Meehl, G.A.; Senior, C.A.; Stevens, B.; Stouffer, R.J.; Taylor, K.E. Overview of the Coupled Model Intercomparison Project Phase 6 (CMIP6) experimental design and organization. Geosci. Model. Dev. 2016, 9, 1937–1958. [Google Scholar] [CrossRef]
  46. Hausfather, Z. CMIP6: The Next Generation of Climate Models Explained. Carbon Brief. 2019. Available online: https://www.carbonbrief.org/cmip6-the-next-generation-of-climate-models-explained/ (accessed on 10 October 2024).
  47. Dlamini, S.; Gyedu-Ababio, T.K.; Slaughter, A. The Loading Capacity of the Elands River: A Case Study of the Waterval Boven Wastewater Treatment Works, Mpumalanga Province, South Africa. J. Water Resour. Prot. 2019, 11, 1049–1063. [Google Scholar] [CrossRef]
  48. Whitehead, P.G.; Wilby, R.L.; Battarbee, R.W.; Kernan, M.; Wade, A.J. A review of the potential impacts of climate change on surface water quality. Hydrol. Sci. J. 2009, 54, 101–123. [Google Scholar] [CrossRef]
  49. Modley, L.A.S.; Rampedi, I.T.; Avenant-Oldewage, A.; Van Dyk, C. A comparative study on the biotic integrity of the rivers supplying a polluted, hyper-eutrophic freshwater system: A multi-indicator approach. Ecol. Indic. 2020, 111, 105940. [Google Scholar] [CrossRef]
  50. Kanownik, W.; Policht-Latawiec, A.; Fudała, W. Nutrient Pollutants in Surface Water—Assessing Trends in Drinking Water Resource Quality for a Regional City in Central Europe. Sustainability 2019, 11, 1988. [Google Scholar] [CrossRef]
  51. Steinebach, Y. Water Quality and the Effectiveness of European Union Policies. Water 2019, 11, 2244. [Google Scholar] [CrossRef]
  52. Dersseh, M.G.; Steenhuis, T.S.; Kibret, A.A.; Eneyew, B.M.; Kebedew, M.G.; Zimale, F.A.; Worqlul, A.W.; Moges, M.A.; Abebe, W.B.; Mhiret, D.A.; et al. Water Quality Characteristics of a Water Hyacinth Infested Tropical Highland Lake: Lake Tana, Ethiopia. Front. Water 2022, 4, 774710. [Google Scholar] [CrossRef]
  53. Department of Water and Sanitation. Eutrophication Management Strategy for South Africa—Edition 2. Project Report Number 4.2, Sources Directed Studies Report Number RDM/EMP&S/00/IHS/SDS/0520. Department of Water and Sanitation: Pretoria, South Africa, 2023. Available online: https://www.dws.gov.za/WEM/DocumentsSDS.aspx (accessed on 16 February 2023).
  54. Song, Y.; Chen, M.; Li, J.; Zhang, L.; Deng, Y.; Chen, J. Can selective withdrawal control algal blooms in reservoirs? The underlying hydrodynamic mechanism. J. Clean. Prod. 2023, 394, 136358. [Google Scholar] [CrossRef]
  55. Carroll, A.; Curtis, C. Increasing nutrient influx trends and remediation options at Hartbeespoort Dam, South Africa: A mass-balance approach. Water SA 2021, 47, 210–220. [Google Scholar] [CrossRef]
  56. Nemutamvuni, K.; McKay, T.J.M.; Tantoh, H.B. Active citizenry, community—Based organisations and the protection of urban wetlands: The case of colbyn, Tshwane, South Africa. Glob. Ecol. Conserv. 2020, 24, e01244. [Google Scholar] [CrossRef]
  57. Department of Water and Sanitation. Eutrophication Management Strategy into Practice. Project Report Number 5 (Version 3). Sources Directed Studies Report Number RDM/EMSSA /00/IHS/SDS/0722. Department of Water and Sanitation: Pretoria, South Africa, 2023. Available online: https://www.dws.gov.za/WEM/DocumentsSDS.aspx (accessed on 31 January 2024).
  58. Quayle, L.; Dickens, C.; Graham, M.; Simpson, D.; Goliger, A.; Dickens, J.; Freese, S.; Blignaut, J. Investigation of the Positive and Negative Consequences Associated with the Introduction of Zero-Phosphate Detergents into South Africa; WRC Report no. TT 446/10. Private Bag X03, Gezina, 0031; Water Research Commission: Pretoria, South Africa, 2010; Available online: https://www.wrc.org.za/wp-content/uploads/mdocs/TT%20446%20Water%20Quality%20Management.pdf (accessed on 1 March 2023).
  59. Jia, H.; Yuan, Q. Removal of nitrogen from wastewater using microalgae and microalgae–bacteria consortia. Cogent Environ. Sci. 2016, 2, 1275089. [Google Scholar] [CrossRef]
  60. Oberholster, P.J.; Cheng, P.H.; Genthe, B.; Steyn, M. The environmental feasibility of low-cost algae-based sewage treatment as a climate change adaption measure in rural areas of SADC countries. J. Appl. Phycol. 2019, 31, 355–363. [Google Scholar] [CrossRef]
  61. Fältström, E.; Gustafsson, S. Upstream pollution control by water utilities in Sweden: Incentives and challenges. Water Policy 2021, 23, 1400–1414. [Google Scholar] [CrossRef]
  62. Matthews, M.; Kravitz, J.; Silberbauer, M.; Christelis, C. The Integrated of Earth Observation into the National Eutrophication Monitoring Programme. WRC Report No. TT 770/18. Pretoria; 2019. Available online: www.wrc.org.za (accessed on 22 August 2024).
  63. Oberholster, P.J.; Steyn, M.; Botha, A.M. A Comparative Study of Improvement of Phycoremediation Using a Consortium of Microalgae in Municipal Wastewater Treatment Pond Systems as an Alternative Solution to Africa’s Sanitation Challenges. Processes 2021, 9, 1677. [Google Scholar] [CrossRef]
  64. Winter, K.; Mgese, S.; Nicklin, E.; Maraj, K. Treating and reusing polluted runoff from an informal settlement, South Africa. Water Pract. Technol. 2023, 18, 796–809. [Google Scholar] [CrossRef]
  65. Prigozhin, V.; Zheng, W.; Lee, F. Implementing Cleaner Production Technologies: General Aspects. E3S Web Conf. 2023, 392, 01006. [Google Scholar] [CrossRef]
  66. Bohman, B. Lessons from the regulatory approaches to combat eutrophication in the Baltic Sea region. Mar. Policy 2018, 98, 227–236. [Google Scholar] [CrossRef]
  67. Wang, H.; Guan, Y.; Hu, M.; Hou, Z.; Ping, Y.; Zhang, Z.; Zhang, Q.; Shang, F.; Lin, K.; Feng, C. Enhancing pollution management in watersheds: A critical review of total maximum daily load (TMDL) implementation. Environ. Res. 2025, 264, 120394. [Google Scholar] [CrossRef]
  68. Harding, W.R. A Feasibility Evaluation of the Total Maximum Daily (Pollutant) Load (TMDL) Approach for Managing Eutrophication in South African Dams; WRC Report no.2245/1/15. Private Bag X03, Gezina, 0031; Water Research Commission: Pretoria, South Africa, 2015; Available online: https://www.wrc.org.za/wp-content/uploads/mdocs/2245-1-15.pdf (accessed on 15 September 2024).
  69. Pienaar, H.; Xu, Y.; Braune, E.; Cao, J.; Dzikiti, S.; Jovanovic, N.Z. Implementation of groundwater protection measures, particularly resource-directed measures in South Africa: A review paper. Water Policy 2021, 23, 819–837. [Google Scholar] [CrossRef]
  70. Makanda, K.; Nzama, S.; Kanyerere, T. Assessing the Role of Water Resources Protection Practice for Sustainable Water Resources Management: A Review. Water 2022, 14, 3153. [Google Scholar] [CrossRef]
  71. Department of Water and Sanitation. National State of Water Report 2023; Integrated Water Resource Studies Report Number WII/IWRS/NSoW 2023; Department of Water and Sanitation: Pretoria, South Africa, 2024. Available online: https://www.dws.gov.za/Projects/National%20State%20of%20Water%20Report/Documents.aspx (accessed on 14 September 2024).
  72. Department of Water and Forestry. Water Quality Management Series, Sub-Series No. MS7, National Water Quality Management Framework Policy, Draft 2; Department of Water Affairs and Forestry: Pretoria, South Africa, 2002. Available online: https://www.gov.za/sites/default/files/gcis_document/201409/4437-2583-4-w-report-draft-2june-2002.pdf (accessed on 14 September 2024).
  73. Department of Water and Sanitation. Integrated Water Quality Management Policies and Strategies for South Africa: WQM Policy (Draft for Public Comments); Department of Water and Sanitation: Pretoria, South Africa, 2023. Available online: https://www.dws.gov.za/iwrp/iwqms/ (accessed on 19 November 2024).
  74. Kruger, A.; Pieters, R.; Horn, S.; van Zijl, C.; Aneck-Hahn, N. The role of effect-based methods to address water quality monitoring in South Africa: A developing country’s struggle. Environ. Sci. Pollut. Res. 2022, 29, 84049–84055. [Google Scholar] [CrossRef] [PubMed]
  75. Tong, J.; Yang, Y.; Zheng, C.; Zheng, M. Do Fiscal Incentives Contribute to Pollution Control? Empirical Evidence from China. Sustainability 2024, 16, 9632. [Google Scholar] [CrossRef]
  76. Kardos, M.K.; Patziger, M.; Jolánkai, Z.; Clement, A. The new urban wastewater treatment directive from the perspective of the receiving rivers’ quality. Environ. Sci. Eur. 2025, 37, 10. [Google Scholar] [CrossRef]
  77. Shkaruba, A.; Mnatsakanian, R.; Molodikova, I.; Kireyeu, V.; Sepp, K. Why is the eutrophication governance over the Lake of Baikal failing? Land use governance solutions need to account for barriers across sectors, scales, and actor groups. Land Use Policy 2024, 141, 107136. [Google Scholar] [CrossRef]
  78. Ayele, G.T.; Yu, B.; Hamilton, D.P. Land Use and Climate Change Effects on Streamflow and Nutrient Loads in a Temperate Catchment: A Simulation Study. Land 2023, 12, 1326. [Google Scholar] [CrossRef]
  79. Bolan, S.; Padhye, L.P.; Jasemizad, T.; Govarthanan, M.; Karmegam, N.; Wijesekara, H.; Amarasiri, D.; Hou, D.; Zhou, P.; Biswal, B.K.; et al. Impacts of climate change on the fate of contaminants through extreme weather events. Sci. Total Environ. 2024, 909, 168388. [Google Scholar] [CrossRef]
  80. Demir, S.; Dursun, İ. Assessment of pre- and post-fire erosion using the RUSLE equation in a watershed affected by the forest fire on Google Earth Engine: The study of Manavgat River Basin. Nat. Hazards 2024, 120, 2499–2527. [Google Scholar] [CrossRef]
  81. Shi, W.; Qin, B. Sediment and Nutrient Trapping by River Dams: A Critical Review Based on 15-Year Big Data. Curr. Pollut. Rep. 2023, 9, 165–173. [Google Scholar] [CrossRef]
  82. McGrane, S.J. Impacts of urbanisation on hydrological and water quality dynamics, and urban water management: A review. Hydrol. Sci. J. 2016, 61, 2295–2311. [Google Scholar] [CrossRef]
  83. Zhang, F.; Chen, Y.; Wang, W.; Jim, C.Y.; Zhang, Z.; Tan, M.L.; Liu, C.; Chan, N.W.; Wang, D.; Wang, Z.; et al. Impact of land-use/land-cover and landscape pattern on seasonal in-stream water quality in small watersheds. J. Clean. Prod. 2022, 357, 131907. [Google Scholar] [CrossRef]
  84. Locke, K.A. Impacts of land use/land cover on water quality: A contemporary review for researchers and policymakers. Water Qual. Res. J. 2024, 59, 89–106. [Google Scholar] [CrossRef]
Figure 1. Location of the Roodeplaat Dam (a) in South Africa (b) and mimetic diagram (c) of the inflowing rivers and monitoring points.
Hydrology 12 00057 g001
Figure 2. Principal Component Analysis (PCA) biplot indicates relationships between selected sampling sites in reference to phosphate, nitrogen, and flow rate. Individual data points are mean values representing two decades of sampling (i.e., 2001 to 2011 and 2012 to 2021). The PCA axes represent linear combinations of the original input variables that capture the maximum variance in the data.
Hydrology 12 00057 g002
Figure 3. An exceedance diagram showing the percentage of time flows exceeded at Sites A–E during 2001–2021.
Hydrology 12 00057 g003
Figure 4. Illustration of Load Duration Curves (LDCs) for total phosphorus (TP) (a) and nitrate–nitrite (NO3 + NO2) (b) at Sites A–D.
Hydrology 12 00057 g004
Figure 5. Illustration of LCD for TP (a), and NO3 + NO2 (b) at Site E.
Hydrology 12 00057 g005
Figure 6. Spatial patterns of land cover change (LULCC) in the A23A quaternary catchment.
Hydrology 12 00057 g006
Figure 7. Water Resource Protection Scenario for Catchment Management.
Hydrology 12 00057 g007
Figure 8. Coupled Model Inter-comparison Project 6 (CMIP6) projections of mean rainfall (mm/y) and surface air temperature (°C) over Gauteng Province, South Africa. Historical period: 1950–2014. Reference period: 1995–2014. Future period: 2020–2100.
Hydrology 12 00057 g008
Table 1. Summary of monitoring sites.
Site IDWMS IDGauging StationLocationCoordinates
Inflow
AA2H029Q01A2H029Edendalespruit River28.391944; −25.648889
BA2H027Q01A2H027Pienaars River (upstream)28.351147; −25.663172
C *A2H028Q01A2H055Moreleta River28.319444; −25.66317222
A2H054Hartbeesspruit River
D **A2H124Q01A2H124Zeekoegat WWTW effluent28.3721; −25.6177
Outflow
E ***AR2900Q01AR2900Dam Wall28.33873861; −25.62319861
A2H102Q01A2H102Pienaars River (releases and spills)
A2H100 Q01A2H100left canal
A2H101 Q01A2H101left canal to the right bank
* The loads in the Hartbeesspruit (site C) were estimated using the water quality record at A2H028Q01, and the combined flows were measured at A2H054 and A2H055. ** Site D was estimated using the water balance measured at the dam. *** Similarly, the dam’s outflow (site E) was estimated using water quality collected at A2H100Q01 and the combined flows measured at AR2900, A2100, A2H101 and A2H10.
Table 2. Target Water Quality Range (TWQR) for Aquatic Ecosystems and Domestic Use.
ParametersUnitSAWQWHOANZECCCCMEWater Use
TPmg/ℓI: ≤0.005 0.01>0.35 *Aquatic Ecosystem
A: 0.005–0.025-
T: 0.025–0.25
U: >0.25
NO3 + NO2mg/ℓI: ≤6>10.35-Domestic Use
A: 6–10
T: 10–20
U: >20
Key: I = ideal, A: acceptable, T = tolerable, U = unacceptable (non-compliance, and associated with hypertrophic conditions). * Trigger range for eutrophication.
Table 3. Comprehensive Pollution Index (CPI) of inflows and outflows of the Roodeplaat Dam for the period 2001–2021.
Site IDMonitoring SitesParametersPICPIPolluted
AEndendalespruit RiverTP1.5697710.847748Slightly polluted
NO3 + NO20.125726
BPienaars River
(upstream)
TP6.413.369788Heavily polluted
NO3 + NO20.33199
CHartbeesspruit RiverTP0.346270.196499Less polluted
NO3 + NO20.046728
DZeekoegat WWTW
effluent
TP4.952.621479Heavily polluted
NO3 + NO20.29
EPienaars River
(downstream)
TP1.3742720.729337Slightly polluted
NO3 + NO20.084403
Table 4. Areal coverage of LULCC at different periods in the A23A Quaternary Catchment.
LULCC Type201120012021
Shape Area%Shape Area%Shape Area%
Built181,182,792.2326.56191,564,769.7528.08 ⮉220,475,320.5732.32 ⮉
Soil69,902,204.1110.2557,930,723.958.49 ⮋150,154,974.4722.01 ⮉
Vegetation427,206,265.5762.62429,469,579.4562.95 ⮉308,134,324.8745.17 ⮋
Water3,897,785.670.573,223,974.420.47 ⮋3,424,427.670.50 ⮉
Key: ⮉ signifies the increased area percentage, whereas ⮋ signifies the decreased area percentage.
Disclaimer/Publisher’s Note: The statements, opinions and data contained in all publications are solely those of the individual author(s) and contributor(s) and not of MDPI and/or the editor(s). MDPI and/or the editor(s) disclaim responsibility for any injury to people or property resulting from any ideas, methods, instructions or products referred to in the content.

