Article

Evaluation of the Soil Conservation Service Curve Number (SCS-CN) Method for Flash Flood Runoff Estimation in Arid Regions: A Case Study of Central Eastern Desert, Egypt

1
Department of Geography, Faculty of Arts, Cairo University, Cairo 12613, Egypt
2
Division of Scientific Training and Continuous Studies, National Authority for Remote Sensing and Space Sciences (NARSS), Cairo 11769, Egypt
3
Division of Geological Applications and Mineral Resources, National Authority for Remote Sensing and Space Sciences (NARSS), Cairo 11769, Egypt
4
Department of Geography & GIS, Faculty of Arts, Ain Shams University, Cairo 11566, Egypt
5
Department of Agricultural, Forest, Food and Environmental Sciences, University of Basilicata, Viale dell’Ateneo Lucano 10, 85100 Potenza, Italy
*
Authors to whom correspondence should be addressed.
Hydrology 2025, 12(3), 54; https://doi.org/10.3390/hydrology12030054
Submission received: 22 January 2025 / Revised: 1 March 2025 / Accepted: 7 March 2025 / Published: 8 March 2025

Abstract

Flash floods are highly destructive natural disasters, particularly in arid and semi-arid regions like Egypt, where data scarcity poses significant challenges for analysis. This study focuses on the Wadi Al-Barud basin in Egypt’s Central Eastern Desert (CED), where a severe flash flood occurred on 26–27 October 2016. This flash flood event, characterized by moderate rainfall (16.4 mm/day) and a total volume of 8.85 × 10⁶ m3, caused minor infrastructure damage, with 78.4% of the rainfall occurring within 6 h. A significant portion of floodwaters was stored in dam reservoirs, reducing downstream impacts. Multi-source data, including Landsat 8 OLI imagery, ALOS-PALSAR radar data, Global Precipitation Measurements—Integrated Multi-satellite Retrievals for Final Run (GPM-FR) precipitation data, geologic maps, field measurements, and Triangulated Irregular Networks (TINs), were integrated to analyze the flash flood event. The Soil Conservation Service Curve Number (SCS-CN) method integrated with several hydrologic models, including the Hydrologic Modelling System (HEC-HMS), Soil and Water Assessment Tool (SWAT), and European Hydrological System Model (MIKE-SHE), was applied to evaluate flood forecasting, watershed management, and runoff estimation, with results cross-validated using TIN-derived DEMs, field measurements, and Landsat 8 imagery. The SCS-CN method proved effective, with percentage differences of 5.4% and 11.7% for reservoirs 1 and 3, respectively. High-resolution GPM-FR rainfall data and ALOS-derived soil texture mapping were particularly valuable for flash flood analysis in data-scarce regions. The study concluded that the existing protection plan is sufficient for 25- and 50-year return periods but inadequate for 100-year events, especially under climate change. Recommendations include constructing additional reservoirs (0.25 × 10⁶ m3 and 1 × 10⁶ m3) along Wadi Kahlah and Al-Barud Delta, reinforcing the Safaga–Qena highway, and building protective barriers to divert floodwaters. The methodology is applicable to similar flash flood events globally, and advancements in geomatics and datasets will enhance future flood prediction and management.

1. Introduction

Geomorphologic hazards, including volcanic eruptions, landslides, tsunamis, and flash floods, are defined as unexpected events that occur as a result of exceptional and sudden tectonic and geomorphic processes. They are associated with geologic, climatic, and hydrologic events, threaten humanity, and cause significant losses of life, property, and infrastructure [1,2,3]. Flash floods are one the most destructive geomorphologic hazards worldwide, particularly in arid and semi-arid regions [4]. Population increases, urban growth, development of human activities, and climate changes have made settlements more vulnerable to flash flood hazards. Therefore, the risk rate has increased worldwide.
Studying flash flood events and mitigating their harmful effects is not only based on flood risk, but also takes into consideration the interactions between hazards and human activities. There are several factors affecting the hydrology of the drainage basins, including morphology, geology, climate, soil, and vegetation cover. Since these factors differ from one region to another, flash floods should be studied in each region separately. Storm Daniel, which struck the Northeastern Aegean Sea on 3 September 2023, caused extreme rainfall over Thessaly, Greece, leading to devastating floods. With an average rainfall return period of 150 years, peak flows near the Peneus River mouth reached 1950 m3/s, resulting in significant environmental and economic damage. Data from the HIMIOFoTS monitoring network provided critical insights into the event’s hydrological characteristics, highlighting the need for enhanced flood modeling and infrastructure to improve disaster resilience [5].
In arid and semi-arid regions such as Egypt, Saudi Arabia, Oman, and UAR, flash floods usually take place after sudden and extraordinary storm events, which occur within a short period of time up to a few hours, and sometimes a day or more [6,7,8]. Flash floods are characterized by high runoff velocity, a short time of concentration, and sharp peak discharges [4]. Despite this, they cause significant losses in property, infrastructure, and lives, and they also play an important role in recharging groundwater aquifers, flowering desert plants, and filling reservoirs. Thus, flash floods have positive and negative sides at the same time.
Recently, several flash floods have occurred infrequently in many regions of Egypt, the worst of them drained or occurred on 2 November 1994 in Upper Egypt, west of Assiut Governorate, causing dozens of deaths. Additionally, hundreds of residents suffered from shortness of breath due to the fires resulting from the explosion of oil tanks [9]. On 18 January 2010 in the El-Arish area in North Sinai, flash floods led to the death of six citizens and the injury of many citizens [6,10]. In addition, the flash floods completely or partially destroyed around 2000 houses, and the water level reached two meters above the ground [11]. Ras Gharib City in the Northern Eastern Desert (NED) suffered from a flash flood catastrophe that happened on 27 October 2016, and according to a statement by the Ministry of Health, 22 citizens died and dozens of residents were injured, in addition to serious damage to many buildings and facilities, due to the water level rising to about 1.5 m above the ground. Moreover, the flash flood swept away cars, trucks, and trees, while also causing severe damage to roads, electricity poles, and water lines. The force of the floodwaters eroded road surfaces, disrupted infrastructure, and left the area without essential services. On 13 March 2020, devastating flash floods struck the AS-Saff area in Giza governorate, Egypt, causing widespread damage to property and infrastructure. Based on the fieldwork and analysis of Sentinel-2 satellite images, the flash floods resulted in significant property and infrastructure damage, and also submerged agricultural lands, houses, brick factories, wheat silos, and animal and poultry farms. Moreover, the flash flood eroded parts of roads, undercut the artificial flood control canal, and injured several residents. The event highlighted the vulnerability of the region to such natural disasters and the urgent need for improved flood mitigation measures.
The analysis of flash floods in Egypt is very difficult due to the unavailability of hydro-meteorological data for the basins, and the scarcity of data required for hydrologic models. Consequently, numerous studies on flash floods in Egypt have employed morphometric analysis to develop flash flood hazard maps [10,12,13,14,15,16,17], whereas other studies have relied on hydrologic models such as SCS-CN, HEC-HMS, and HEC-RAS, where too much data were provided through the integration of GIS and RS [10,11,18,19,20,21,22]. Periodically, this approach is continually upgraded, and has become more widely used because of increasing access to spatial databases and the availability of remote sensing (RS) and geographic information system (GIS) software [23].
The SCS-CN method is one of the most widely used approaches for estimating runoff and has been applied across various disciplines, including hydrology, environmental science, and water resources management [24]. Several effective factors, including rainfall data, land cover, soil type, and vegetation, are essential for successfully applying the SCS-CN method. However, it has limitations, including the lack of a slope factor, storm duration consideration, and proper guidance on antecedent moisture conditions [25].
Studies such as Shi and Wang, 2020 [25,26,27] found that the SCS-CN method overlooks critical parameters such as slope, rainstorm duration, and previous soil moisture condition (AMC). AMC is particularly important for estimating infiltration rates, as it significantly influences precipitation outcomes. Recognizing the importance of AMC, Jacobs et al., 2003 [28] utilized satellite imagery to analyze AMC across five basins in Oklahoma. Mishra and Singh, 2013 [29] further modified the CN values by categorizing them into AMC-I, AMC-II, and AMC-III corresponding to dry, normal, and wet conditions, respectively. Additionally, Woodward et al., 2003 and Mishra and Singh, 2004 [30,31] indicated that the initial abstraction ratio (Ia/S) of 0.2 is relatively high. Consequently, Woodward et al., 2003 [30] proposed reducing this value to 0.05S, based on their analysis of 307 watersheds across 23 U.S. states, while Satheeshkumar et al., 2017 [32] adopted a value of 0.3S for their study of the Pappiredipatti watershed in southeastern India.
Egypt, like many other arid and semi-arid regions, suffers from the scarcity of most of this data (rainfall data, land cover, soil type, and vegetation cover), but the great development in RS has provided many of these datasets with different spatio-temporal resolutions. Here, this method has recently been used in many studies in Egypt [33,34,35,36,37,38]. The accuracy of the results has not been well evaluated due to the absence of hydrologic data and accurate field measurements.
Gheith and Sultan (2002) [33] analyzed the data extracted from the 2 November 1994 flash flood event which occurred in the NED of Egypt using an effective SCS-CN hydrological model. They imported rain gauge data to create an irregular rainfall in relation to relief elevations, and extracted geomorphologic, geologic, and lithologic data from topographic maps, a 3-arc DEM, Landsat TM images, and geologic maps. The model was executed and key hydrological components were estimated, including initial losses (such as interception and infiltration before runoff begins), groundwater recharge, and surface runoff. The results were compared against field observations reported for some basins immediately after the storm. Foody et al. (2004) [36] applied the HEC-HMS model to study the Wadi Alam basin in the Central Eastern Desert (CED), and utilized the SCS-CN method to estimate the initial losses and runoff quantity. For their analysis, they assumed the intensity of the studied rain storm was 30 mm/h during the storm, and that it continued for a full 2 h. The model’s results were then validated against field observations of road damage caused by the flood event, demonstrating its effectiveness in simulating the hydrological response of the basin. According to the Masoud (2011) study [35], a runoff model, adopting the simple Soil Conservation Service method, was built for 13 ungauged basins in Southern Sinai, Egypt. This study used the maximum rainfall recorded in one day during the period 1960–1990, and land cover and soil type data were extracted from both Landsat 7 images and geologic maps. Due to the lack of measured flow data, the results of the hydrological models were validated using alternative approaches. These included DEM-derived relative stream power and wetness indices, as well as field observations and available reports, ensuring the reliability of the model outputs [35]. In contrast, several studies, which will be discussed later, have applied the SCS-CN method to study floods in Egypt’s dry valleys, particularly in the Eastern Desert and Sinai. However, due to the lack of field measurements and observational data in these regions, the accuracy of the results from these studies has not been evaluated. This limitation highlights a key difference in our approach, as we have employed alternative validation methods, such as DEM-derived indices and field checks, to assess the reliability of our findings. Moawad (2013) [11] and Moawad et al. (2016) [37] employed a black-box model, which included statistical and machine learning approaches, to study flash floods. Their model integrated the SCS-CN method with real-time satellite precipitation data to analyze the flash flood events in Wadi El-Arish on 18 January 2010 and Wadi Qena on 28 January 2013; also, El-Fakharany and Mansour (2021) [10] and Hagras (2023) [21] estimated the volume of runoff in several basins in ED and Sinai using SCS-CN, although the results were not evaluated.
Accordingly, the SCS-CN method has been used to study several different flash flood locations in Egypt, Saudi Arabia, Oman, and UAR [6,7,8]. These studies were discussed based on the available datasets and applied different methodologies to fill the gap in some data, especially the hydro-meteorological data, and some of these studies used field observations to verify the accuracy of the SCS-CN method results. In the current study, many accurate data and field measurements were available, which provided an effective way to carefully apply the SCS-CN method and accurately evaluate its results. Among these data were TIN DEMs produced for the dam’s areas from field surveys, and Landsat 8 OLI images acquired before and after the flash flood. Furthermore, ALOS-PALSAR (ALOS) radar images were used to extract the Wadi deposit’s soil texture. In addition to the Global Precipitation Measurements Final Run (GPM-FR) precipitation data, geological maps at 1:100,000 and 1:250,000 scales, and fieldwork investigations, this study utilized high-accuracy datasets that were not available in previous research. These datasets played a critical role in accurately measuring the size of the studied flood event and quantifying the volume of water accumulated in the reservoirs.
Therefore, the present study focuses on integrating RS, GIS techniques, and field measurements with the SCS-CN method to estimate the hydrologic responses induced by 27 October 2016 flash flood. Also, it aims to validate the accuracy of the runoff estimated by the SCS-CN method against the volume of flash flood water accumulated in the reservoirs, in addition to assessing the capacity of storage dams to mitigate future flash floods, in consideration of factors such as urban growth, climate change, and the potential for rainstorms stronger than the analyzed storm. These considerations are critical for ensuring the long-term effectiveness of flood management strategies. The methodology and results of this study are expected to provide a better understanding of flash floods’ behavior in arid and semi-arid regions. It is also likely to enhance the accuracy of risk assessment, making management plans more effective.

2. Description of the Study Area

Wadi Al-Barud basin is a dry valley (wadi) located in the CED of Egypt. It extends from latitudes 26°39′40″ to 26°53′10″ N and longitudes 33°22′20″ to 33°57′35″ E. The basin covers an area of 520.4 km2; and starts from the Red Sea Mountains in the west and ends at the Red Sea coast in the east. It is recognized as one of the significant basins in the Eastern Desert (ED), particularly because Safaga City and Port Safaga are located on its delta. Furthermore, about 25% of Safaga–Qena highway extends along its longitudinal section. Safaga Ring Road and the Red Sea Coastal highway extend through its delta (Figure 1A).
As a result, urban areas, Port Safaga, roads, and human activities associated with the basin have been exposed to many flash floods, resulting in extensive damage. For instance, flash floods on 20 October 1979 and 9–14 November 1996 caused significant damage to extensive sections of the Safaga–Qena highway. Additionally, the flash flood that occurred on 20 October 1990 caused severe damage to the Red Sea coastal highway and forced the closure of Port Safaga from 20 to 24 October. Furthermore, on 18 October 1997, a flash flood destroyed dozens of houses and caused great damage to the Safaga–Qena highway [39,40,41]. Therefore, in 2007, the Egyptian Governorate constructed three dams in Wadi Al-Barud basin: dams no. 1 and 2 are located at the outlet of Wadi Al-Barud Al-Abyad sub-basin, while dam no. 3 (Abu-Mayah dam) is located near the outlet of Wadi Abu-Mayah sub-basin before it connects with Wadi Umm Taghar sub-basin. It should be noted that these three dams protect Safaga City and Port Safaga from a certain disaster. Furthermore, in 2020, the Egyptian Governorate deepened sections of the dam reservoirs to enhance their storage capacity and improve flood management capabilities.
The study area is characterized by a hyper-arid climate, with hot and dry conditions prevailing during the summer months. In contrast, winters range from warm to cold, although overall precipitation remains minimal throughout the year [42]. According to data from the Quseir and Hurghada meteorological stations, the annual mean temperature in the study area is 24.7 °C. January records the lowest daytime temperature, averaging 18.1 °C in Quseir and 16.3 °C in Hurghada, while August is the warmest month, with daytime temperature reaching 27.4 °C in Quseir and 27.1 °C in Hurghada. Annual relative humidity ranges from 48 to 58% in Quseir, and from 38 to 53% in Hurghada. Furthermore, average annual precipitation is 6.4 mm and 5.5 mm, respectively [43]. These inconsiderable amounts are not responsible for the flash floods, but during the spotty connective thunderstorms, sudden and heavy precipitation occurs for a few hours, up to a day, and causes the flash floods [42,44].
The basin is composed mainly of Precambrian crystalline basement rocks that occupy 73.8% of the basin’s surface, which include metavolcanics: metagabbro, tonalities, granodiorite, Dokhan volcanics, monzogranite, and post granite dykes (Figure 1B). Sedimentary rocks outcrop in the lower reaches of the basin, which cover approximately 0.45% of the area, primarily consist of sandstone, limestone, gypsum, and clastic phosphate from the Upper Cretaceous and Miocene periods. Additionally, Quaternary sediments covering 23.8% of the basin are widely distributed and overlie the basement rocks. These sediments are composed of clastic materials and are prominently found in wadi bottoms, alluvial terraces, and the delta. The basin is dissected by 167 faults, which are distributed throughout the area and have significantly influenced the basin topography and directions of the wadis. These faults can be categorized based on their orientation, such as normal faults, strike-slip faults, or thrust faults, and their spatial distribution, which plays a key role in shaping the hydrological and geomorphological features of the basin.
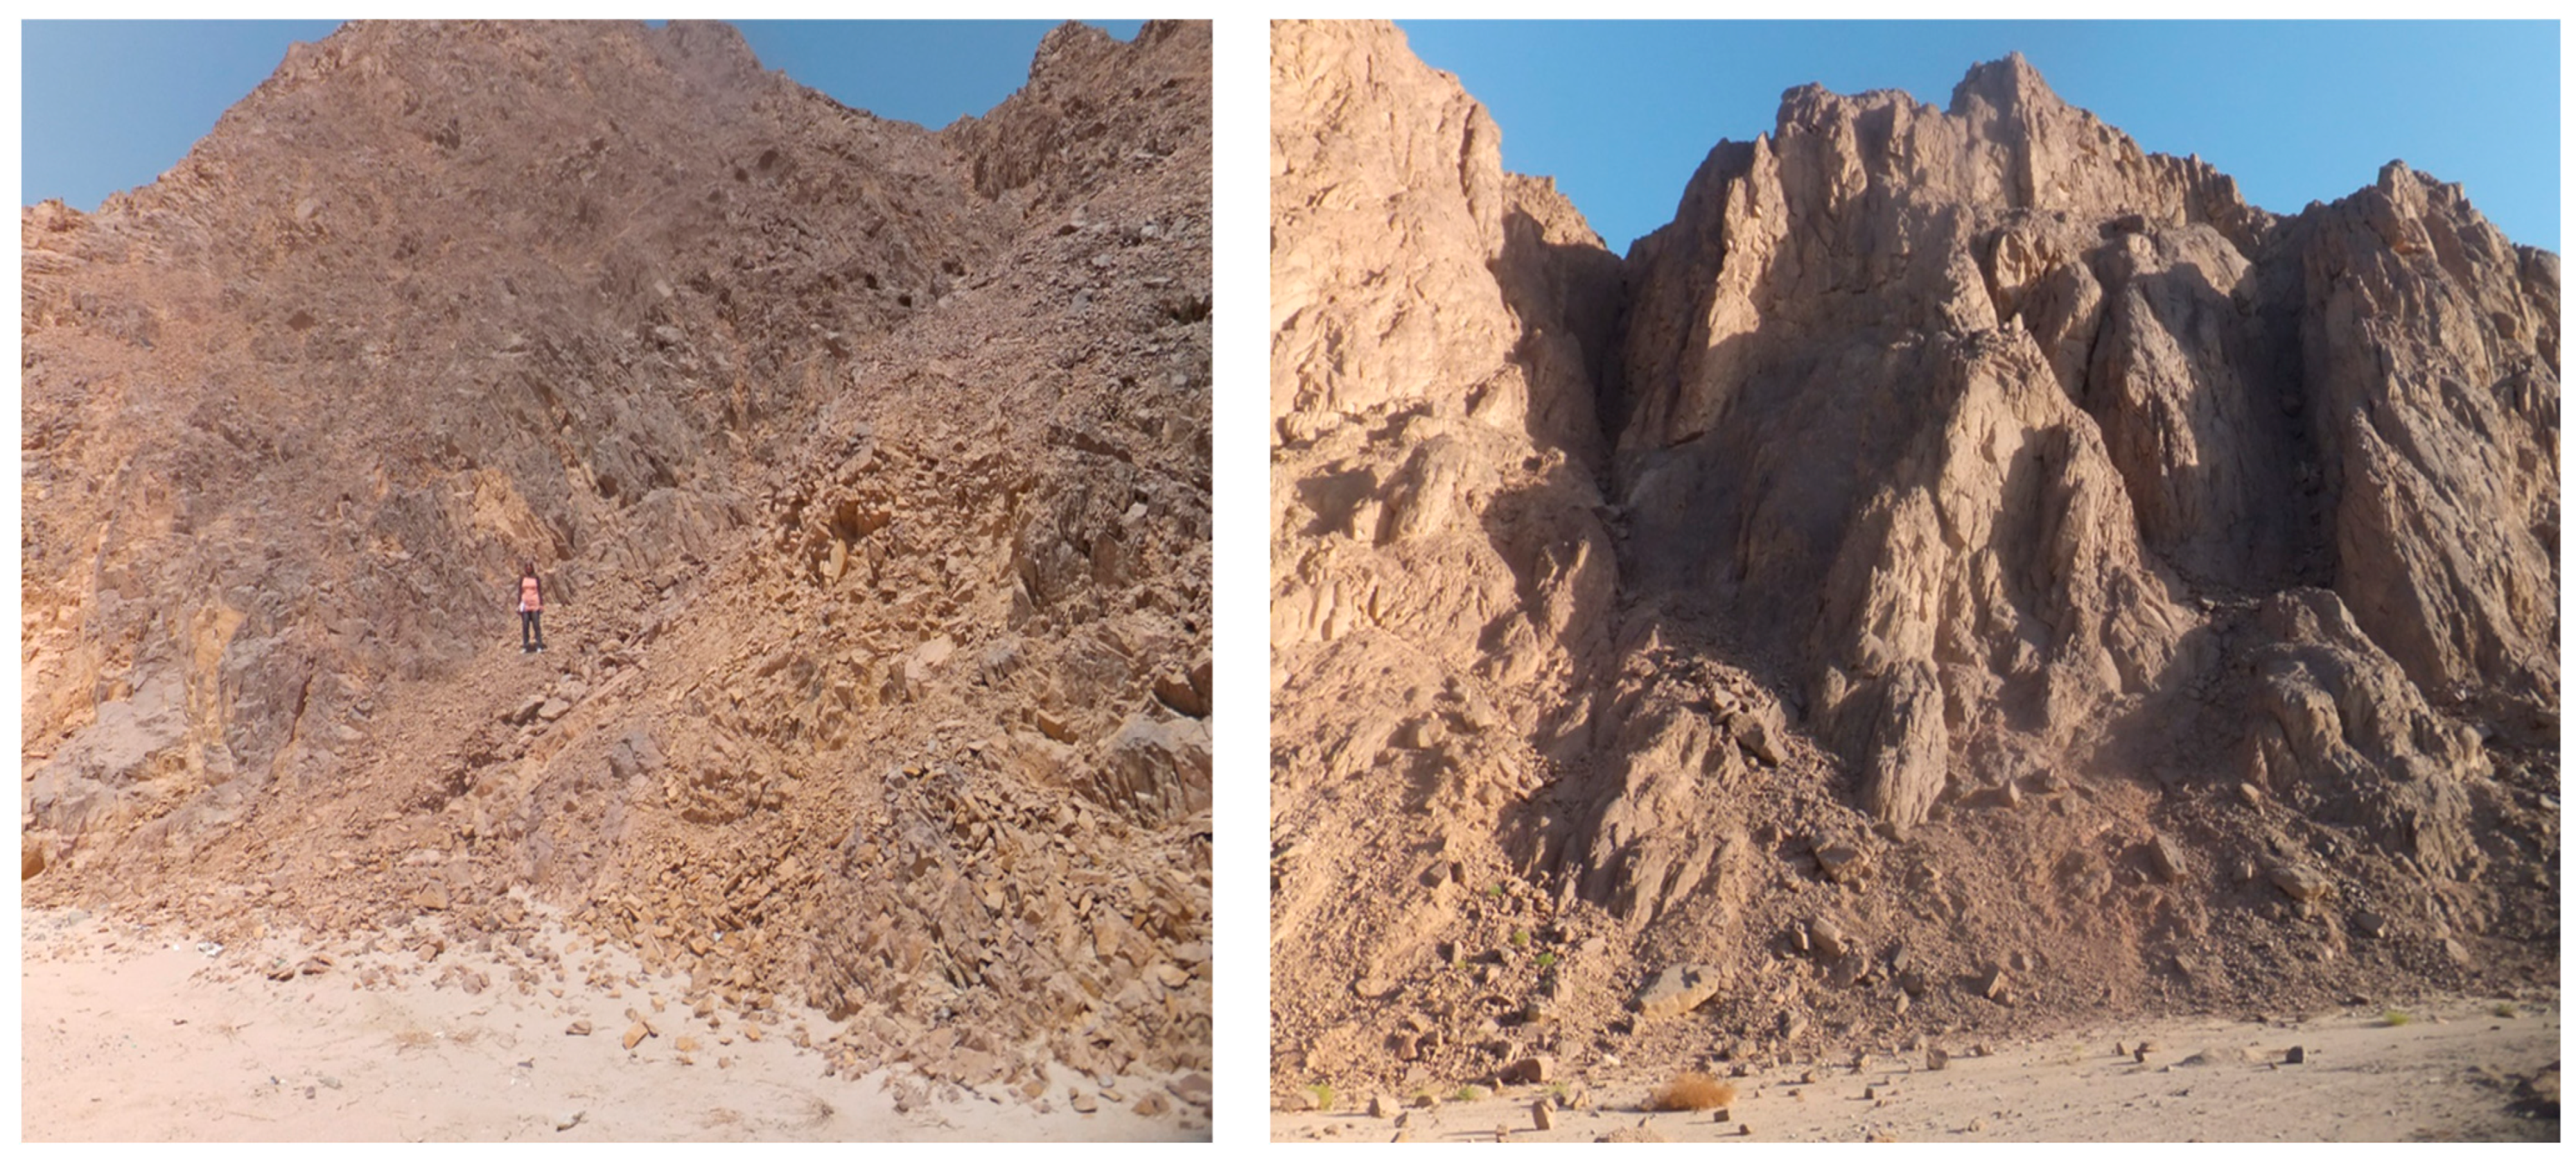
The basin consists of two physiographic units: the Red Sea Mountains and the plain (Figure 1A). The former, with an area of 95.7%, are part of the Red Sea Mountain range, comprising mainly basement rocks, and their heights range from 100 to 1446 m. The mountains are highly dissected by numerous V-shaped wadis that separate them into steep masses. Field observations showed a mixture of weathered rocks piled up on the slopes and talus, as shown in Figure 2.
The plain unit is represented by Al-Barud Delta, which is covered by Quaternary sediments. This area has elevations ranging from 0 to 150 m and features gentle slopes averaging 2°, making it almost flat. The delta is characterized by several braided streams and the main course of Wadi Al-Barud, which have eroded and shaped its surface. Furthermore, most of Safaga City, Port Safaga, and parts of the main regional highways were built above the delta and the future urban planning related with its surface.
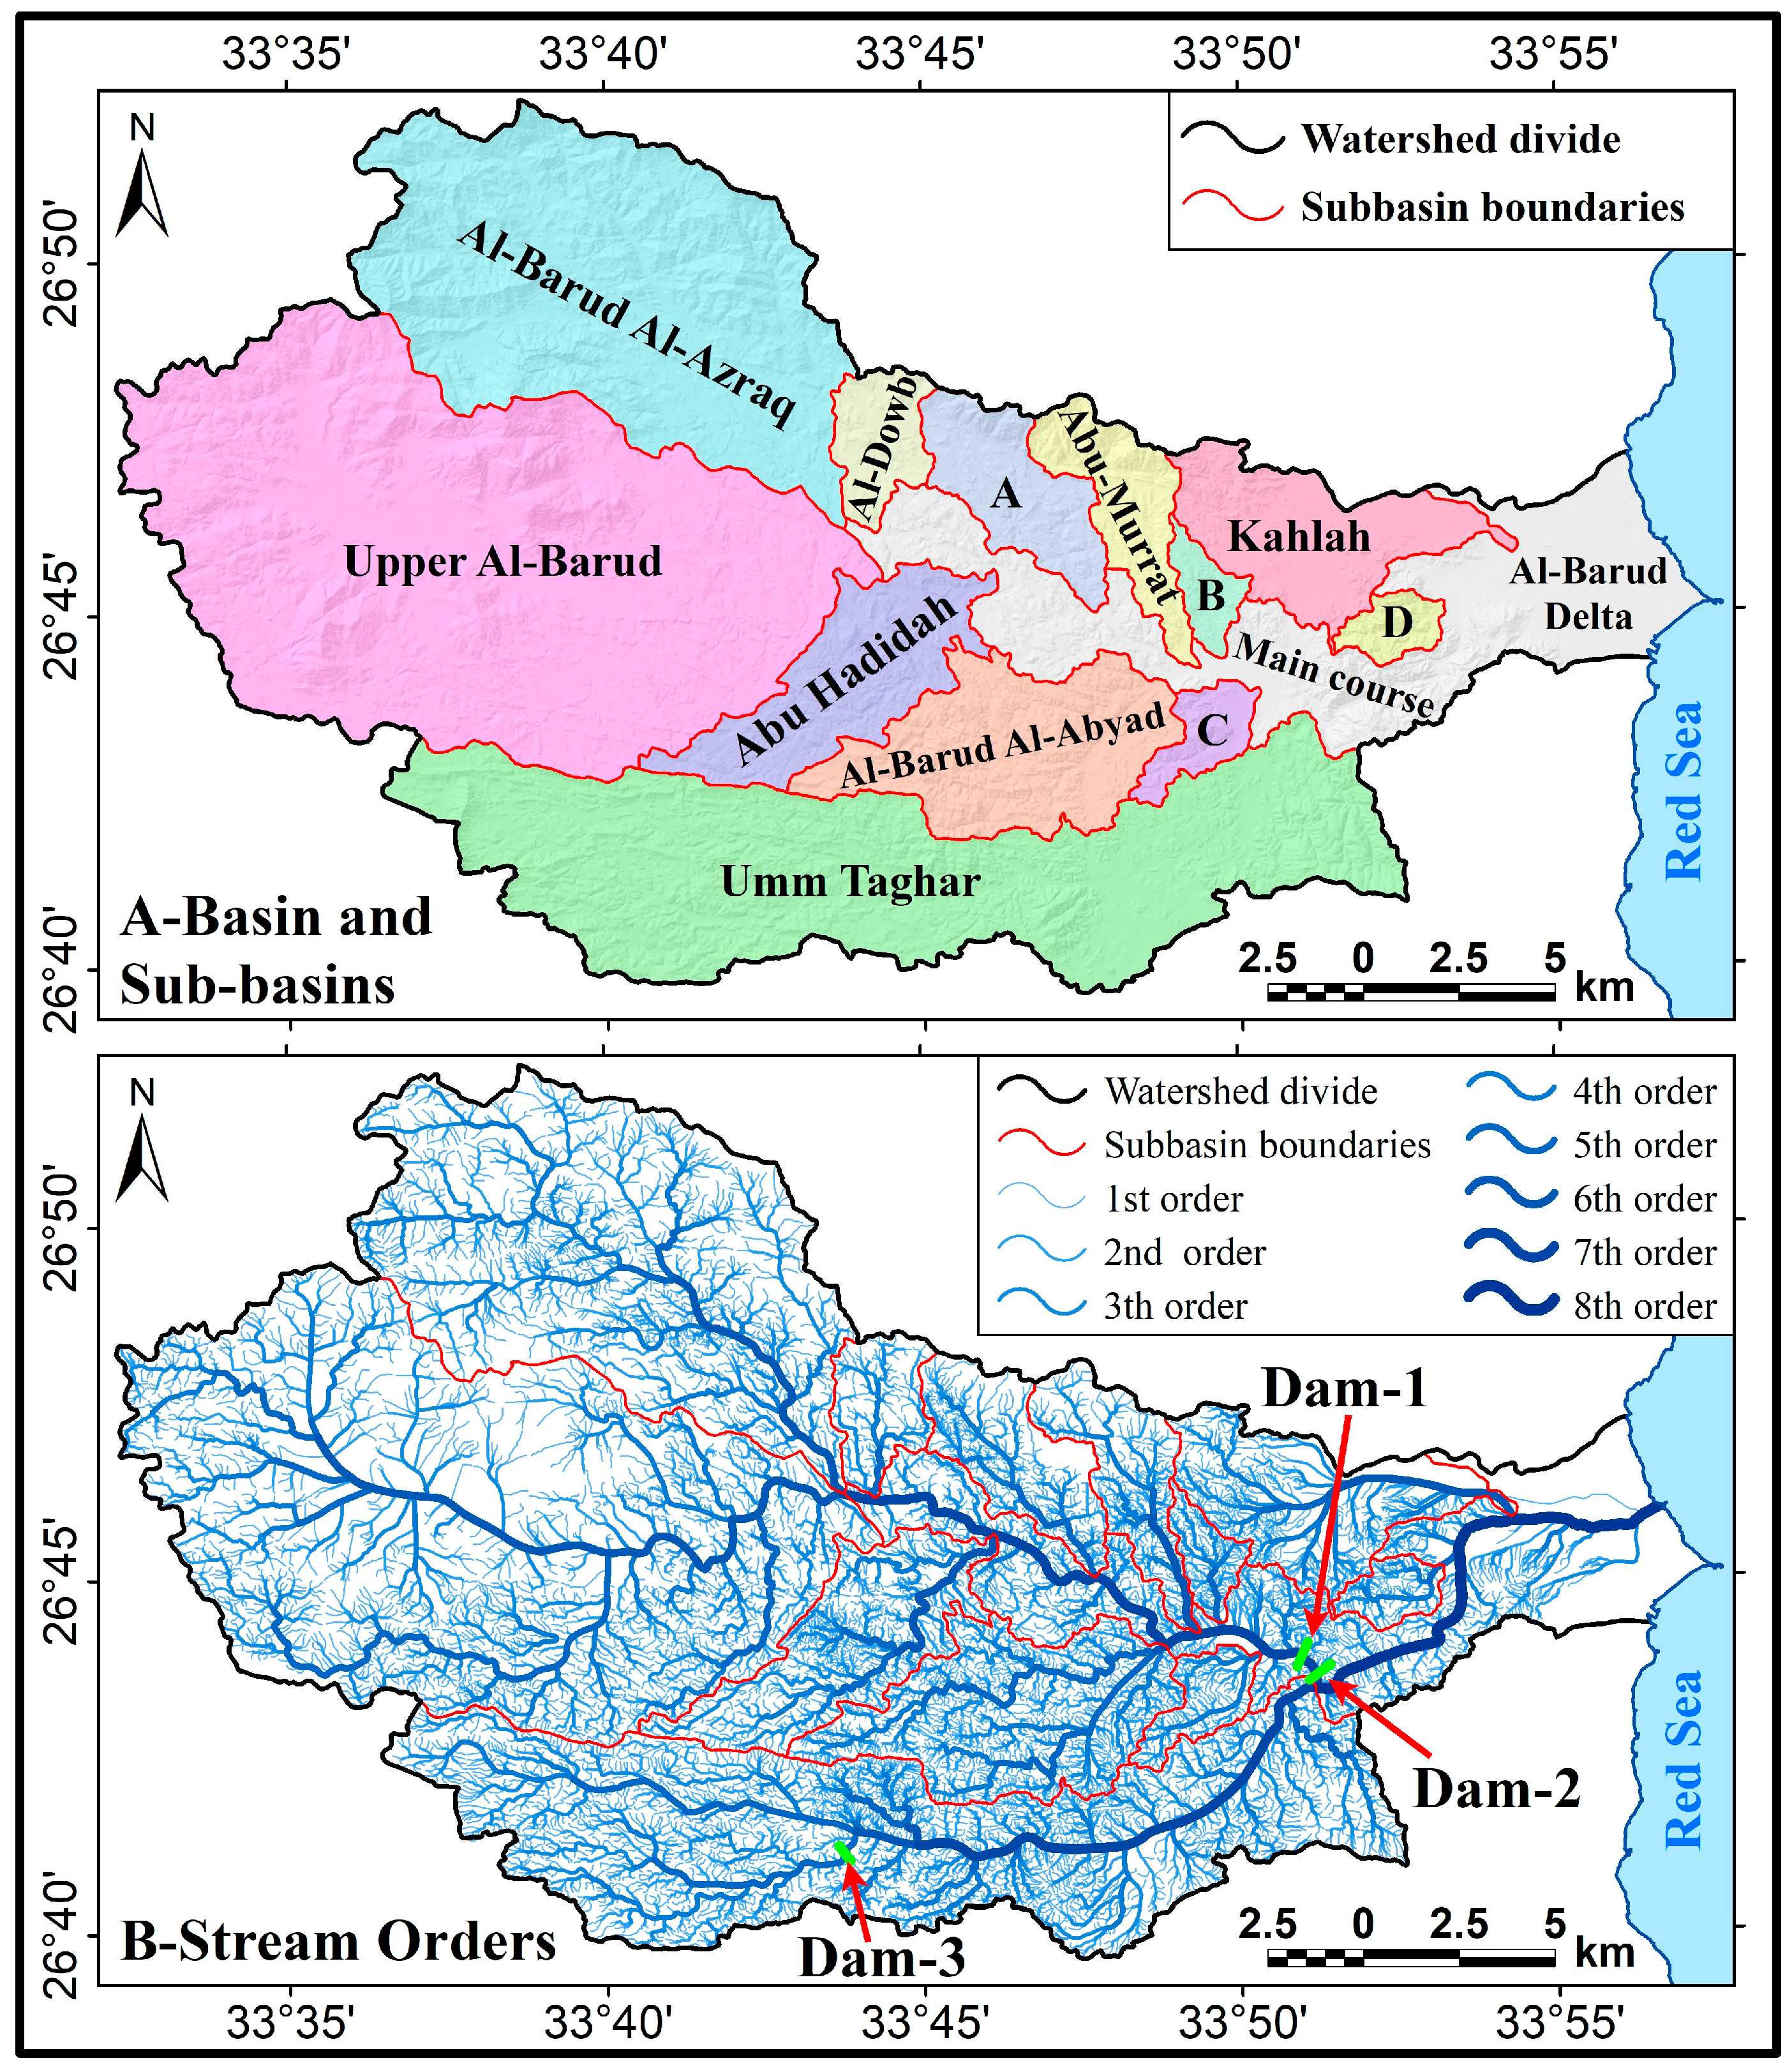
It is obvious from Figure 3A and Table 1 that Wadi Al-Barud basin consists of 12 sub-basins with an area ranging between 3.7 and 151.6 km2. The length (Lb) [45] and mean width (W) [46] of the basin are 42.3 and 12.3 km, respectively, and the values of the sub-basins range between 3.1 and 24 km and between 0.9 and 7.8 km, respectively. The ratios of elongation (Re) and circulation (Rc) [45] revealed that the basin and most of the sub-basins are close to fern-leaf-like shapes and far from circular. The relief ratio (Rhr) [45] and ruggedness number (Rn) [47] in the basin are 0.03 and 8.8, respectively, and in the sub-basins range between 0.026 and 0.104 and between 2.1 and 7.2, respectively. The average basin slope (Bs), calculated from Carto DEM 5 m by the Horn (1981) method [48], was 16.9°, and values in the sub-basins ranged between 11 and 28.3°.
Moreover, it is clear from Figure 3B and Table 1 that there are about 12,507 streams (ƩNu) in the basin and their orders are between first and eighth according to the Strahler classification method [49]. The main course of the basin reaches the eighth order, and the main courses of the sub-basins are between the fifth and seventh orders. The bifurcation ratio (Rb) [50] reaches 4.2 in the basin, and the values range between 3.4 and 4.55 in the sub-basins. The stream frequency (FS) in the study basin is 33.3 stream/km2, and the values in the sub-basins are between 15.4 and 55 stream/km2. The drainage density (Dd) reaches 6.1 km/km2 in the basin, and ranges between 5.5 and 11.6 km/km2 in the sub-basins [50]. The stream slope (SS) calculated from the Carto DEM 5 ranges between 0 and 64.1°, with an average of 41.7°. All these parameters indicate that the study basin and sub-basins are in the early stage of evolution, have great capacity to transport water and sediments, and have high potential for runoff, with a high peak of discharge, lower lag time, rapid concentration of runoff, and high capacity and competence [51,52].

3. Data

In this study, the following data were used in different projections; therefore, all data were rectified and projected to the UTM, zone 36N, and WGS 1984 ellipsoid using ArcGIS 10.8, as follows:

3.1. Precipitation Data

The scarcity and uneven distribution of meteorological stations across Egypt poses a significant challenge for flash floods studies. This limited infrastructure hinders the collection of accurate and comprehensive rainfall data, which is critical for understanding flash floods dynamics and improving predictive models in arid regions. Moreover, most stations are located in urban areas, away from mountainous regions; although ED of Egypt is occupied by a large number of basins, no sufficient meteorological stations can be observed in most of the basins [43].
Moreover, the desert rains are characterized by being spotty, infrequent, sudden, heavy, intense, and falling in different quantities from year to year and from one area to another. So, their quantities are difficult to measure in the field, which also makes it difficult to study the flash floods based on meteorological stations near the basins. To address these challenges, many previous studies have attempted to overcome the limitations of sparse meteorological data. Some have used rain gauge data to create an irregular precipitation surface [21,22,33,35,53,54], while others have assumed a simplified rainfall storm event, such as a constant rainfall amount over a 2 h duration with a uniform precipitation distribution [20,36]. Additionally, several studies have relied on rainfall data derived from remote sensing satellite images [34,55,56,57,58] as an alternative source of information.
Recently, many international scientific agencies have provided precipitation data, such as Tropical Rainfall Measuring Mission (TRMM), and Integrated Multi-Satellite Retrievals for Global Precipitation Measurement (GPM-IMERG). All these data are available in high spatial and temporal resolutions, finer than 0.25° and less than a day, respectively. The recent advances in precipitation retrieval algorithms, which integrate both positive and negative remote sensing data with ground-based measurements, have significantly improved the accuracy of rainfall estimation. As a result, Hou et al. [59] argue that they have transitioned from an era of inferring precipitation to an era of physical measuring it with greater precision. So, several recent studies in arid and semi-arid regions have evaluated the accuracy and reliability of GPM data, particularly the GPM Final Run (GPM-FR) product. For example, studies conducted in the United Arab Emirates [60,61], Morocco [62], Iran [63,64], and other regions [65] have compared GPM-FR data with other high-resolution satellite precipitation products and ground-based rain gauge measurements. These studies employed various statistical metrics, such as correlation coefficients, root mean square error (RMSE), and bias analysis, to assess the performance of GPM-FR. The results consistently demonstrated that GPM-FR data are the most accurate and suitable for studying flash floods in arid and semi-arid regions, making them a valuable resource for hydrological modeling and flood risk assessment.
The current study will analyze the estimated precipitated data of the study basin based on GPM-IMERG data, which were produced through a collaboration between NASA and JAXA, and a consortium of other international space agencies https://gpm.nasa.gov/missions/GPM (last accessed 14 May 2024). The IMERG algorithm calibrates, merges, and interpolates all precipitation estimates from active and passive remote sensing data with rain gauge data. The algorithm is run several times: the first run, “IMERG Early Run”, is a quick estimate available four hours after rainfall; the second run, “IMERG Late Run”, provides better estimates, being published after 12 h of rainfall; while the third run, “IMERG Final Run (GPM-FR)”, is preferable because it uses monthly rain gauge data and is published 2.5 months after precipitation (https://gpm.nasa.gov/data/directory (last accessed 14 May 2024)).

3.2. Optical and Radar Images

Landsat 8 OLI scenes (path: 174 and row: 42; https://earthexplorer.usgs.gov/, accessed on 20 May 2024) were acquired before and after the flash flood runoff (16 October and 1 November 2016), and these images were used for multiple purposes such as land use/land cover and areas where flood waters had accumulated, especially in front of dams. All the images were characterized by zero percent cloud cover, and both radiometric and atmospheric corrections (FLAASH) with spectral enhancements were performed. The processed data then were cropped to define the study basin. Additionally, an ALOS-PALSAR (L-band, HH-polarization, Ascending Orbit; https://www.asf.alaska.edu/) radar image, acquired on 26 January 2008, was utilized to extract soil textures of the wadi bottoms. In addition, two Corona Cast photo mosaics were acquired on 29 July 1969 with a spatial resolution of 1.8 m and were used to digitize the urban area of the basin. Also, a high-resolution world imagery layer in ArcGIS 10.8 software was used to digitize the wadi bottoms and the urban areas in 2023.

3.3. Topographic Maps

The current study digitized eight 1:25,000 scale topographic maps produced in 2004 [66]. The maps were used to interpolate a cartometric DEM with a spatial resolution of 5 m (Carto-5), prepare the morphometric data, and study the urban areas.

3.4. Digital Elevation Models (DEMs)

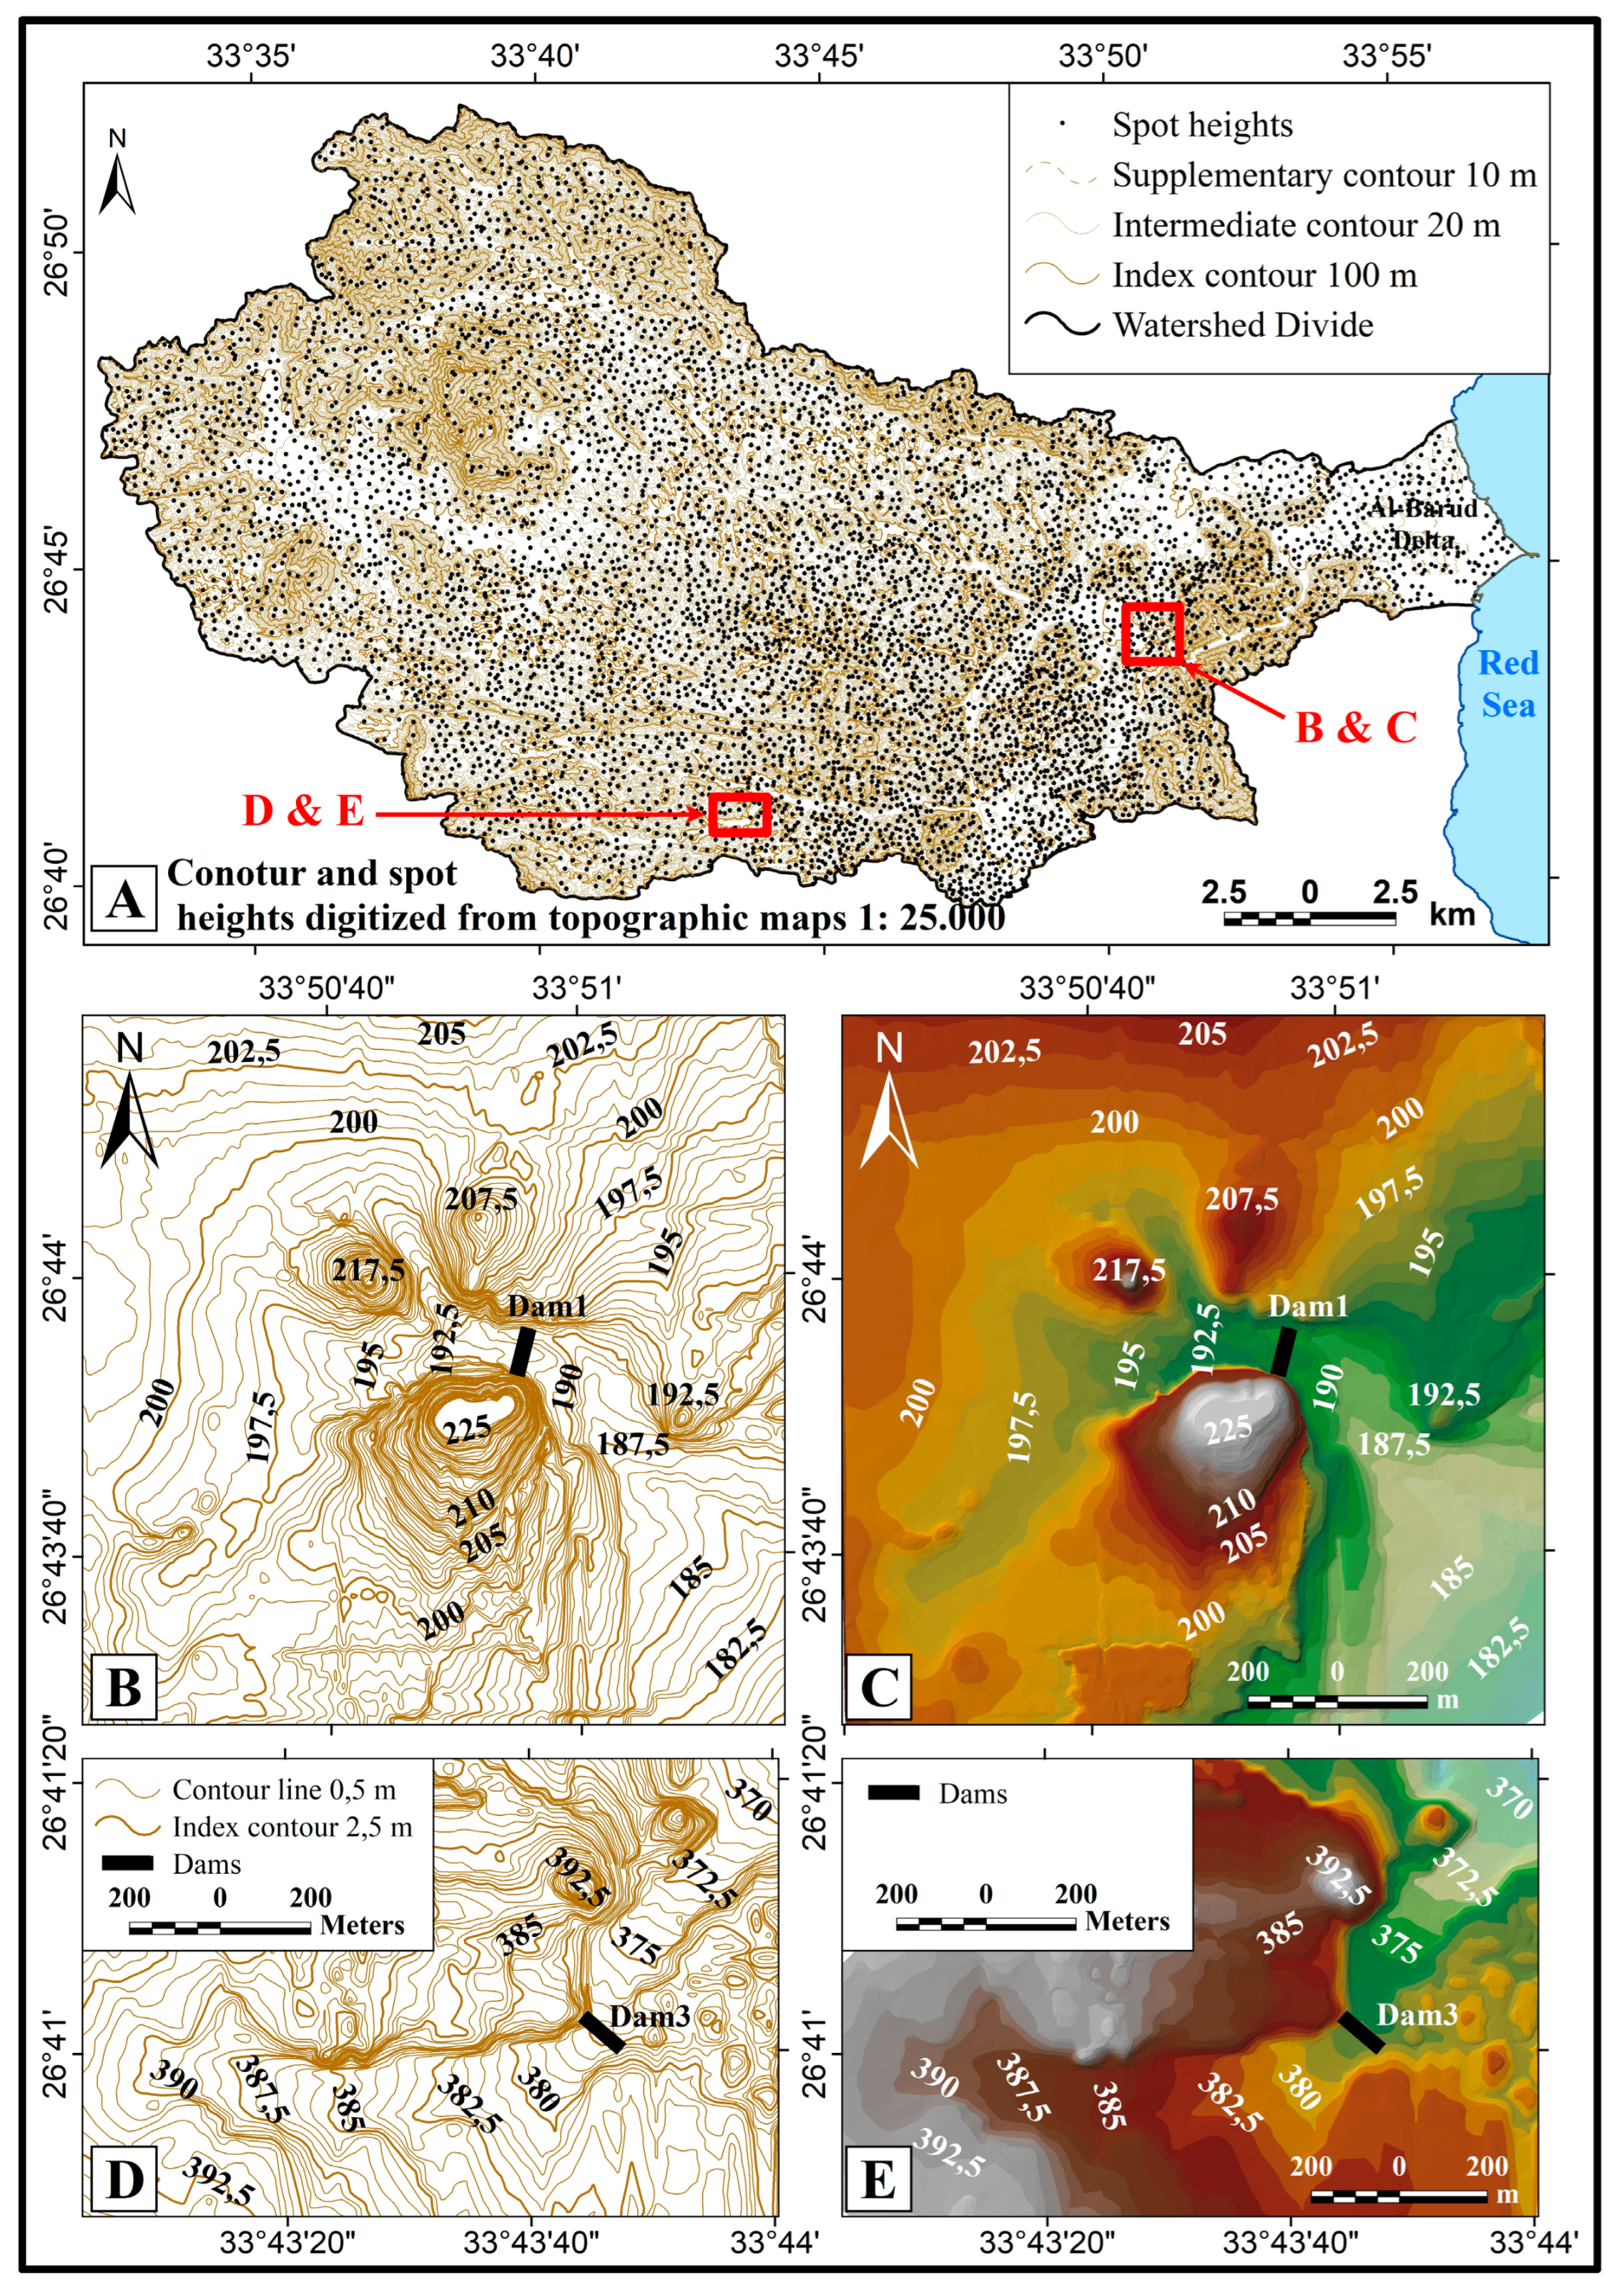
Three DEMs were produced for the study basin and dam areas. The Carto-5 DEM was created from spot heights and contour lines digitized from the topographic maps (Figure 4A) and the DEM produced using the Topo-to-Raster interpolation method, and then it was statistically and visually examined. Furthermore, two TIN DEMs (TINs) were created from contour maps with a contour interval if 0.5 m (Figure 4B,D). They were prepared from ground surveys in 2003 by the Water Resources Research Institute (WRRI) in Egypt for dam areas (Figure 4C,E). The DEM data were used to estimate the volume of water accumulated from flash floods in the dam’s reservoirs.

3.5. Geologic Maps

Two geologic maps produced by the Egyptian Geological Survey and Mining Authority (EGSMA) were studied to draw the geology map of the study basin and determine the Curve Number of the rocks.

4. Methods

4.1. SCS-CN Method

In the present study, the SCS-CN method was applied to estimate the initial abstracts (Ia), rainfall depth, and surface runoff for the study basin. The processing steps and procedures applied in the study are illustrated in Figure 4.
The SCS-CN method conserved monthly and annual runoff volumes satisfactorily. A sensitivity analysis of the method parameters was performed, including the effect of variation in storm duration [31]. It is worth mentioning that there are many hydrologic methods used to estimate runoff. The SCS-CN method is one of the most effective methods used to examine the losses and runoff in arid and semi-arid regions from a single rainfall event [29]. This method runs based on many variables including rainfall, land cover, soil type, and vegetation type. Moreover, the Curve Number (CN) values (between 0 and 100) should be obtained from pre-prepared standard tables based on the land cover class and soil type. There is an inverse relationship between permeability and CN values, as impermeable surfaces will have high values and higher runoff potential, and vice versa (USDA, 1986) [67]. Thus, if the value of CN is 98 or 95, it means that every 25 mm of rain will produce about 20 or 14 mm of runoff, respectively [68]. The runoff is calculated by the SCS-CN method by the following equation (USDA, 1986) [67]:
Q = ( P I a ) 2 P I a + S
where Q is the runoff depth (mm), P is the total rainfall, S is the maximum potential retention after runoff starts (mm), and Ia is all initial abstractions before runoff begins (mm). The initial abstraction ratio (λ = Ia/S) in the SCS-CN method was originally set at 0.20. However, analysis of rainfall-runoff data from hundreds of plots in USA suggests that a λ value of 0.05 provides a better fit to observed data and is more accurate for runoff calculations. This adjustment significantly impacts runoff depth, hydrograph peaks, CN definitions, and soil moisture accounting, particularly for lower rainfall depths or lower CN values. Using λ = 0.05 instead of 0.20 improves the reliability of runoff predictions in hydrological modeling [30].
Satheeshkumar et al., 2017 [32] applied a value of 0.3S in their study of the Pappiredipatti watershed of southeastern India. In the present study, however, we apply the standard value as specified in the SCS-CN method.
In general, previous studies concluded that the value of Ia is 0.2S, and accordingly, Equation (1) can be modified to Equation (2):
Q = ( P 0.2 S ) 2 P + 0.8 s
The S values are related to the land cover characteristics and soil type of the basin through CN and its value is related to CN values by the next equation:
S = 1000 C N 10
Since the value of S in Equation (3) is in inches, it can be converted to millimeters (mm) through the equation:
S = (25,400/CN) − 254
Finally, the runoff volume can be calculated by the next equation:
R V = Q ( m m 3 ) 1000 C
where RV is the runoff volume in cubic meters, Q is the runoff depth calculated from Equation (2) in mm, 1000 is a constant value for converting the units from mm to m3, and C is the cell size.

4.2. GPM-FR Data Processing

GPM-FR data ver. 6 was used to calculate the 26 and 27 October 2016 rainfall over the study basin. Data were downloaded from the NASA platform (https://giovanni.gsfc.nasa.gov/giovanni/, last accessed 6 November 2023) with a spatial resolution of 0.1°, and at both three hourly and daily temporal resolution. GPM-FR data were downloaded in NetCDF format and converted to Geo-Tiff raster format to be readable data in ArcGIS 10.8, and then the Geo-Tiff raster was converted to a point vector layer. This was subsequently used to generate a raster surface with 30 m spatial resolution using the IDW interpolation method, and the latter was clipped by the basin polygon layer.

4.3. Land Cover

Obviously, land cover directly affects the amount of Ia before runoff is generated, and Ia includes various types of losses such as evaporation, vegetation interception, infiltration, and surface detention (USDA, 1986) [67]. In the present study, Landsat 8 OLI images were acquired on October 16 2016 (LS-Oct.), nine days before the flash flood data were processed. ENVI 4.5 software was used to perform the pre-processing analysis to normalize the data and remove atmospheric effects and noise. Then, the minimum distance supervised classification method was performed based on geologic maps, the world imagery layer, and field investigations.

4.4. Vegetation

The vegetation cover percentage, density, and type usually affect the amount of evapotranspiration. The Normalized Difference Vegetation Index (NDVI) was calculated to quantify the vegetation density from a Landsat 8 OLI image acquired on October16 2016, and this index is based on the ratio between the visible red (RED band no. 4) and near-infrared wavelengths (NIR band no. 5) using the following equation:
NDVI = (NIR − RED)/(NIR + RED)
where NIR = reflectance in the near-infrared spectral band and RED = reflectance in the red spectral band. Plants reflect a small amount of red and a large amount of near-infrared rays [69].

4.5. Hydrological Soil Groups (HSGs)

Soil plays a critical role in influencing runoff, as its properties directly affect infiltration rates and the overall hydrological response of a basin. According to particle sizes, soil can be classified into three main types: sand, silt, and clay. These particle sizes significantly influence soil properties, such as porosity and infiltration rate, which in turn affect water movement and runoff processes [29]. The SCS-CN method classified soils into four HSGs—A, B, C, and D—according to the water transmission and infiltration rate.
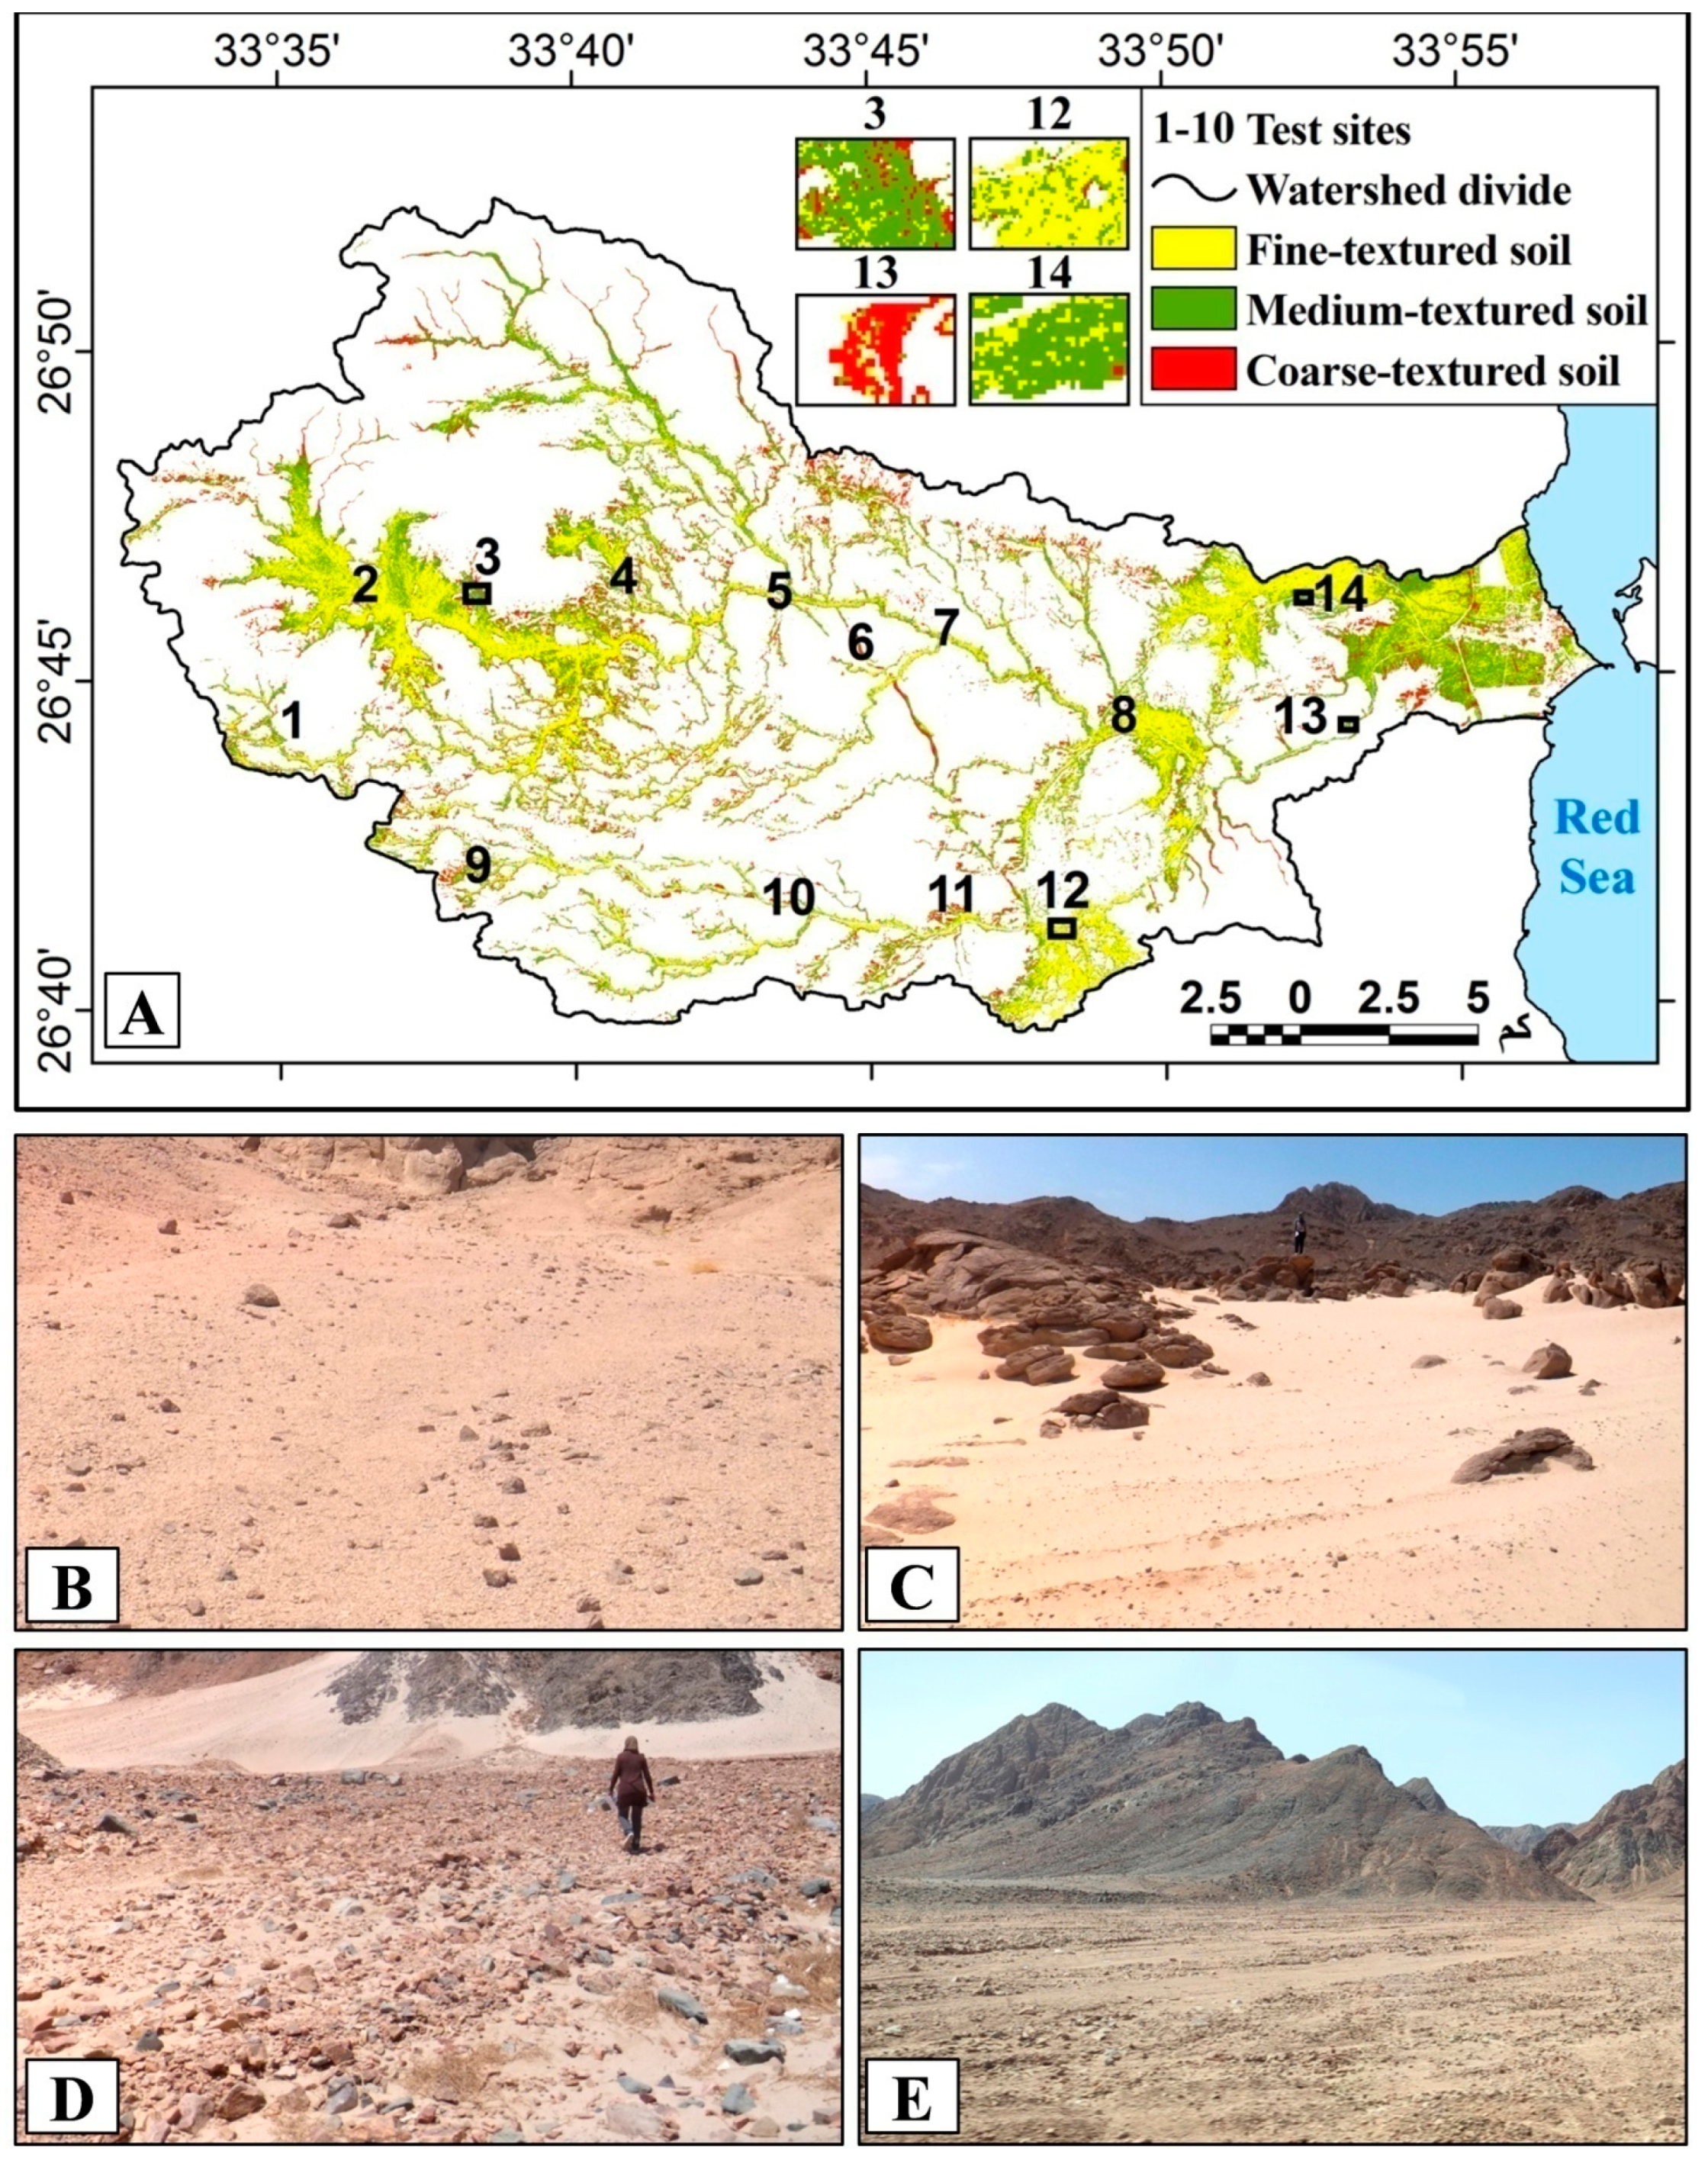
Unfortunately, soil maps are not available for most drainage basins in Egypt, including the study basin. Recently, based on radar image analysis, some studies in Egypt have mapped the soil texture in some basins in Sinai and the CED [20,70]. Therefore, an ALOS radar image with a spatial resolution of 12.5 m was used to map the soil texture in the study basin, where the coarse fragments appear bright due to their high diffuse reflectance, and the fine fragments appear dark because of their low specular reflection as the radar waves are far from the receiving antenna (Figure 5) [20]. The soil texture properties in the study basin were classified using the ALOS image as follows:
1—The wadi bottom and delta extracted from the LS-Oct image was modified and edited from the world imagery layer, due to its ability to determine the boundaries of the wadi bottom and delta with high accuracy.
2—The ALOS image was cropped using the modified wadi bottom and delta layer, and we tested the unsupervised Iso-Data and K-Means classification methods. The results were checked in the field at fourteen test sites (Figure 5), and it was found that the K-Means method was more accurate. So, the soil texture was classified into coarse, medium, and fine (Figure 5), and the cell size was resampled to a spatial resolution of 30 m to match the other layers used to estimate the runoff.

4.6. The Antecedent Moisture Condition (AMC)

AMC is an indicator of soil moisture storage prior to a storm event, and has a significant impact on the amount of infiltration. If the soil is wet, most of the rain will turn into direct runoff without any infiltration, and vice versa. AMC is determined by the total rainfall in the five days preceding the storm. In the SCS-CN method, AMC is divided into three types: AMC-III is for wet, AMC-II is for normal, and AMC-I is for dry. The SCS-CN method assumes that the AMC is normal, so its values should be adjusted due to the type of AMC.
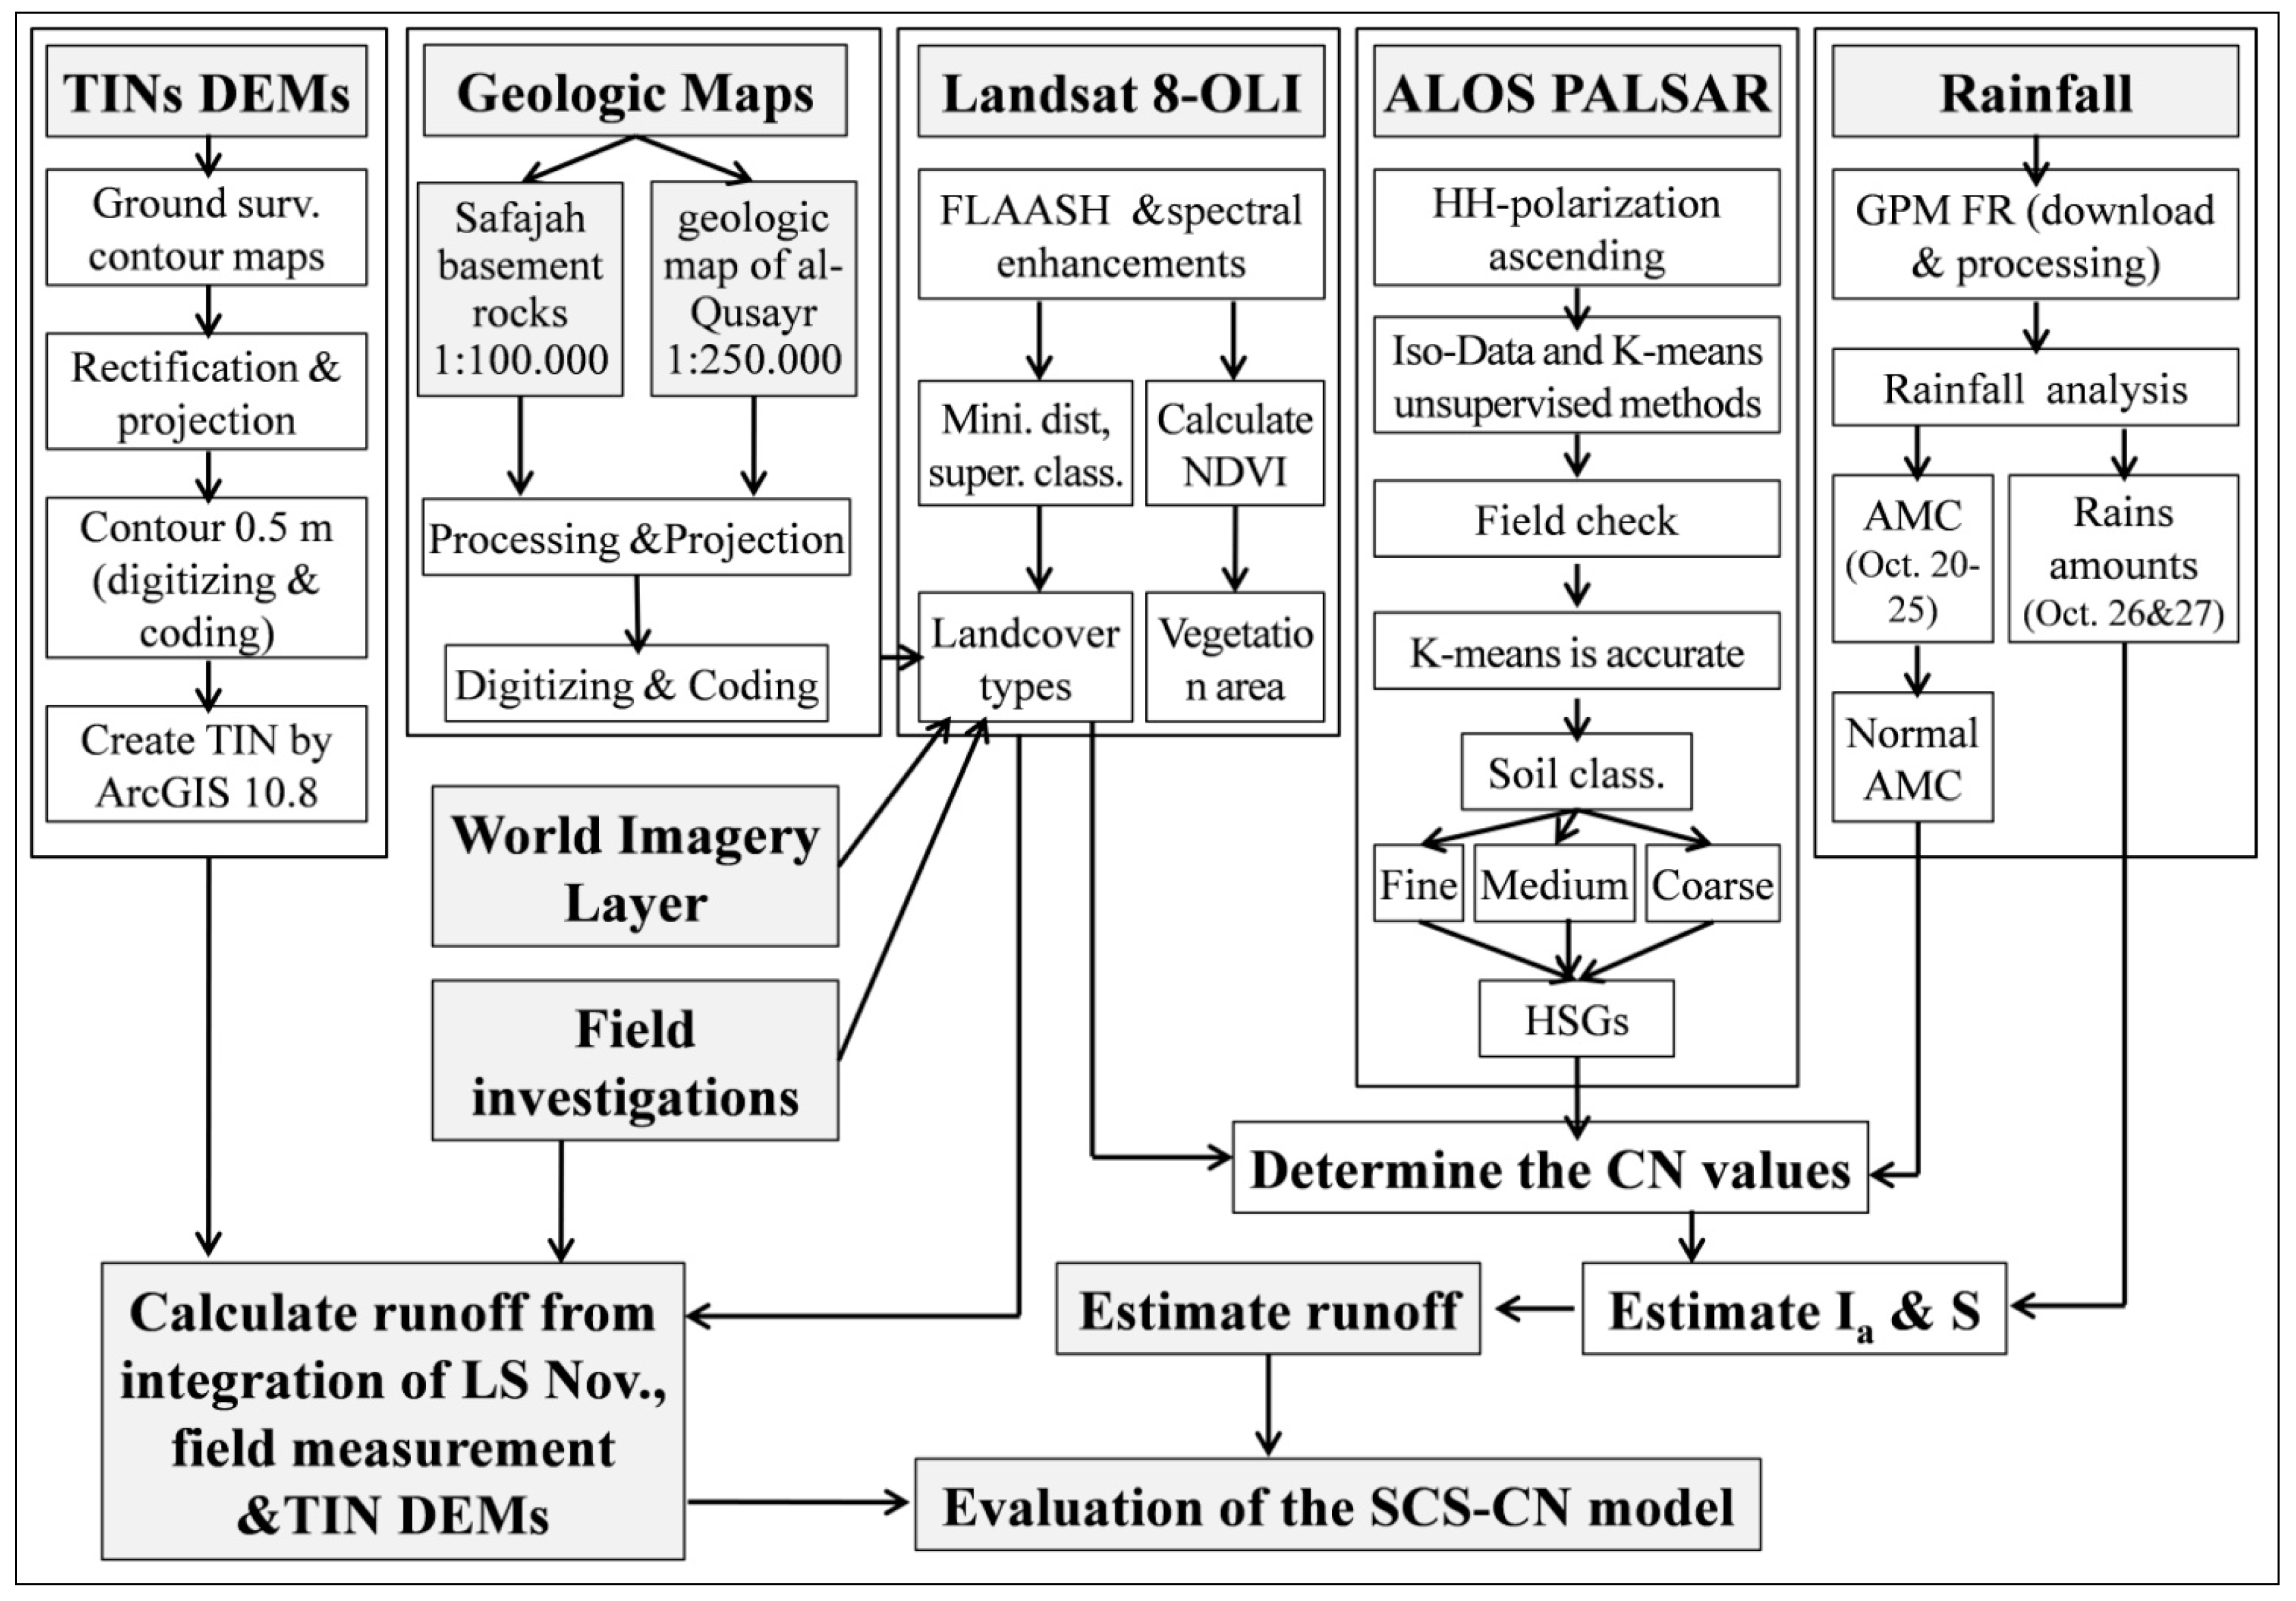
The data and methods used in this study are explained in Figure 6.

5. Results and Discussions

5.1. The Rainfall Analysis

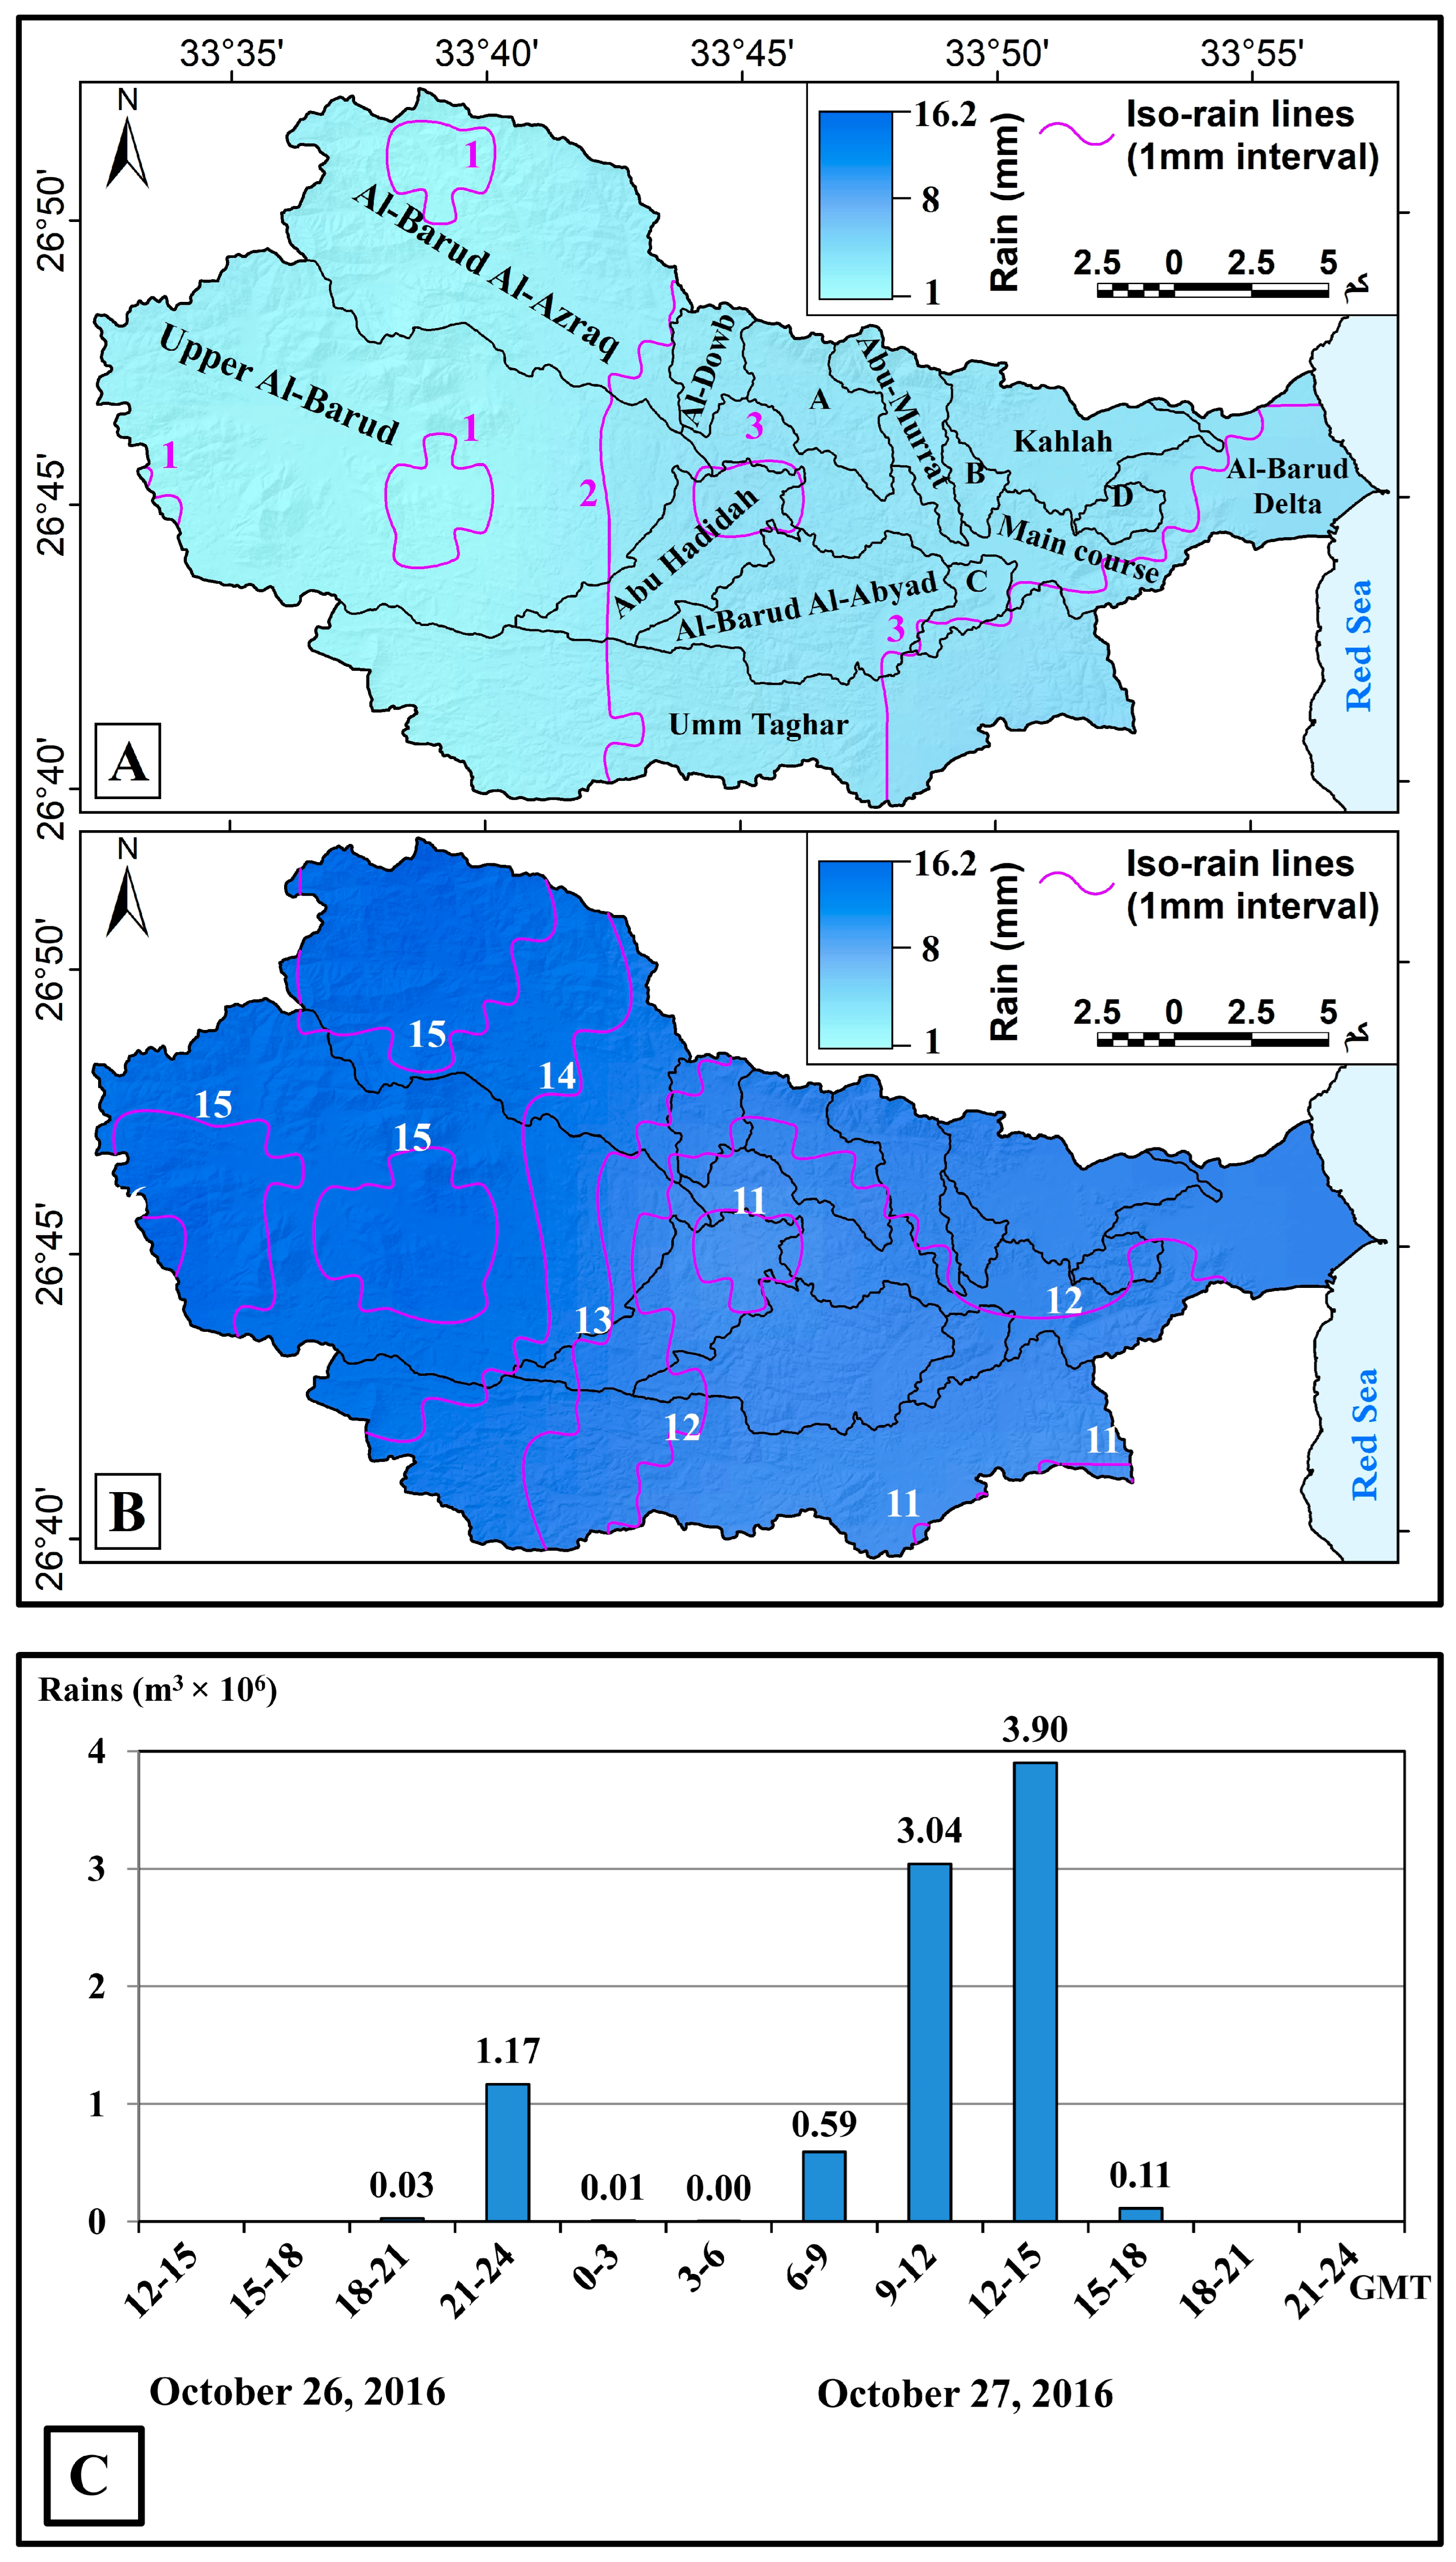
Examining Figure 7, Table 2 and Table 3 indicate the following: (1) rainfall over the study basin began at 18:00 GMT on 26 October and continued until nearly 18:00 GMT on 27 October. (2) The total rainfall amounts were approximately 1.19 × 10⁶ and 7.66 × 10⁶ m3 on 26 and 27 October, respectively, with a total of 8.85 × 10⁶ m3. (3) Rainfall amounts over the sub-basins ranged from 60.4 × 10³ m3 to 2.7 × 10⁶ m3 on the sub-basin B and Wadi Al-Barud El-Aely, respectively. (4) Rainfall varied significantly both temporally and spatially, with amounts fluctuating from one 3-hour interval to the next and differing across various areas of the basin. (5) The period from 9:00 GMT to 15:00 GMT on 27 October was the main rainfall period, accounting for 78.4% of the total rainfall. (6) The maximum amount of rain reached 16.4 and 4 mm/day on 26 and 27 October, respectively, and both values were recorded in the Wadi Umm Taghar sub-basin. (7) Moreover, about two-thirds of the total amount of rain fell on Wadi Al-Baroud El-Aely, Umm-Taghar, and Wadi Al-Barud Al-Azraq. Perhaps the above rainfall analysis confirms the characteristics of precipitation in arid and semi-arid regions, where flash floods occur when appropriate amounts of rain fall within a period of time of up to six hours.

5.2. Land Cover, NDVI, and HSG Properties

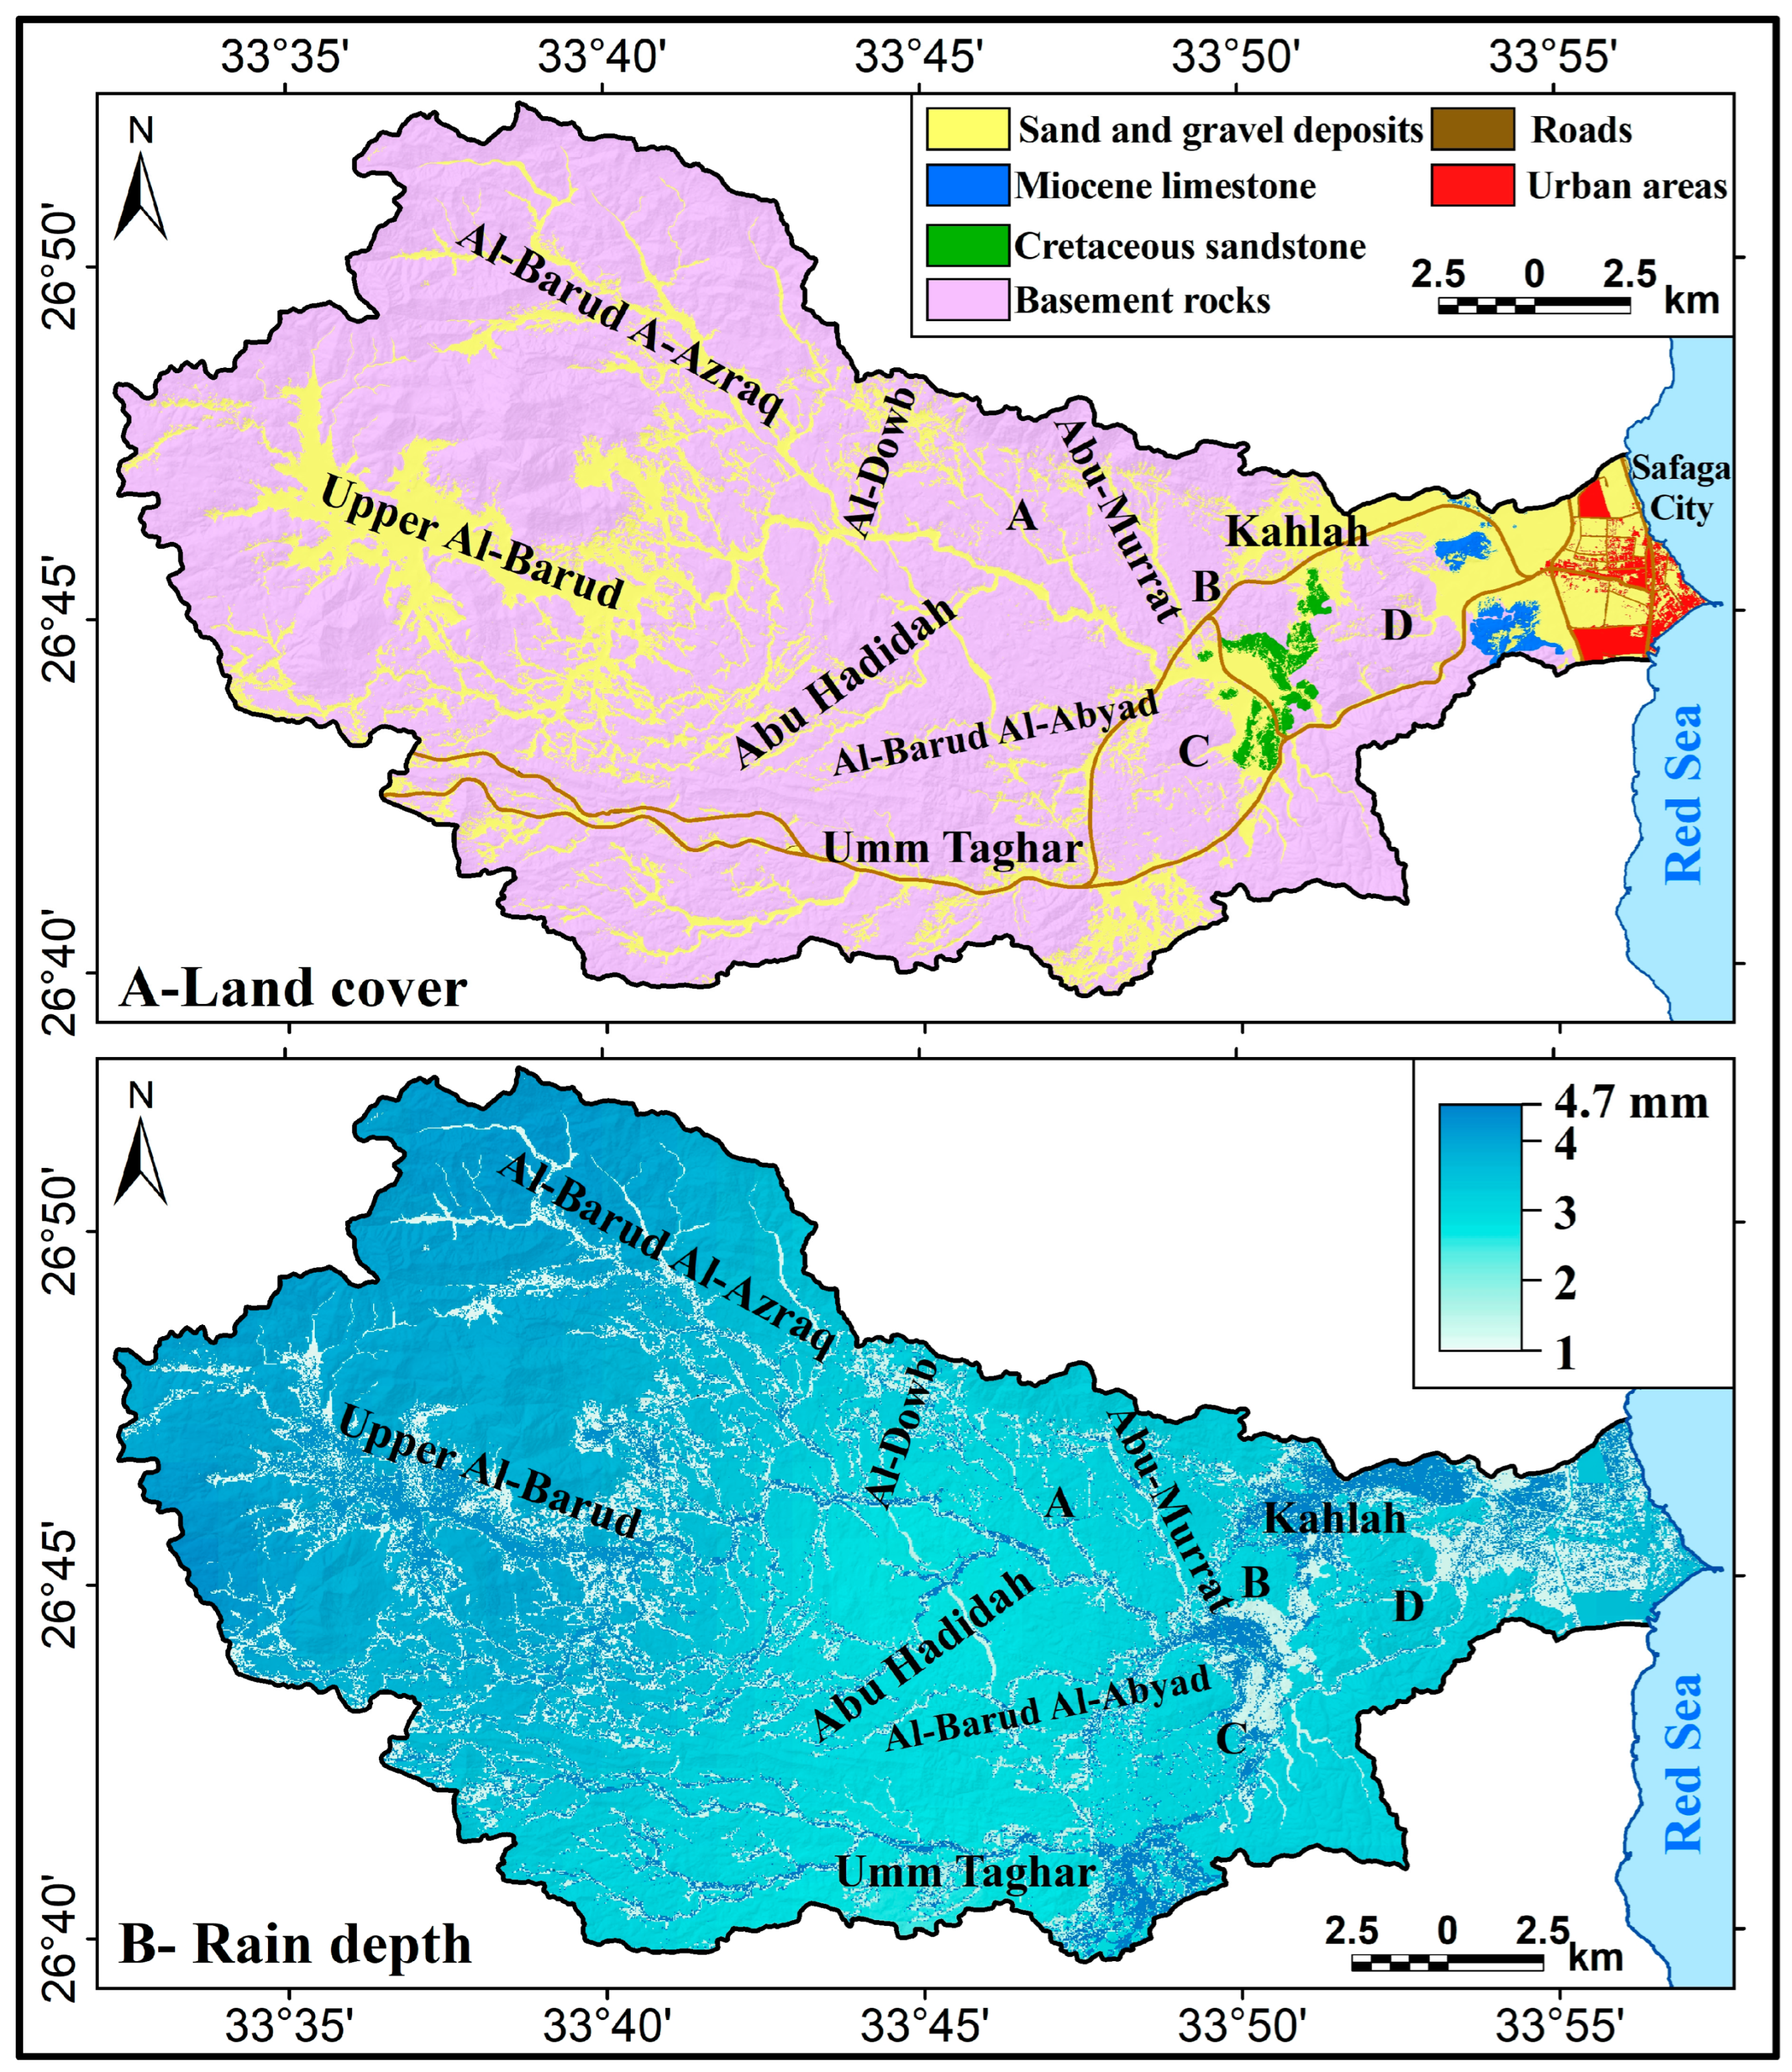
Obviously, there are six land cover categories in the study basin (Figure 8A and Table 4), Basement rocks are present in 73.8% of the basin area, while Cretaceous sandstones and Miocene limestone rocks outcrop in 0.8% of the basin area, near downstream sections. Sand and gravel deposits are primarily found on the wadi bottom, delta, and wadi terraces, covering 9.7 and 14.2% of the basin area, respectively; moreover, the urban areas and roads represent approximately 1.4% of the basin’s total area. These results indicate that the basin is mostly permeable with a high level of runoff potentiality.
The HSG classes which were extracted from the ALOS image revealed that the soils of the study basin are of group A and B, and can be summarized as below:
(1)
HSG (A): includes fine-textured sandy soil with a large thickness and good drainage. It has high infiltration rates even when completely wet, and therefore has low runoff potential. These soils have a high water transmission rate > 7.62 mm/h [67], and represent 9.7% of the total basin area.
(2)
HSG (B): consists mainly of medium and coarse gravel deposits of medium to large thickness and is characterized by moderate infiltration rates when the soil is wet. These soils have a moderate water transmission rate of 3.81 to 7.62 mm/h [67], and account for 14.2% of the total basin area.
Based on daily GPM-FR data, it was concluded that the basin did not receive any rain during the five days preceding the storm. Therefore, the soil was dry (AMC-I), so the CN values must be adjusted from the normal state (AMC-II) to the dry state (AMC-I). This was done based on the tables given in the study of Mishra and Singh [29].
The NDVI results showed that the vegetation cover of the basin has a very low density, which is in agreement with that recorded during field investigations, as the plants in the basin are scattered desert shrubs that appear on the thalweg and bottoms of the main valleys. Therefore, the basin falls within the desert land cover group with poor vegetation cover (less than 30%) and contains scattered desert shrubs. Accordingly, the CN values taken from this result were used, as the CN values change depending on vegetation cover density and type (USDA, 1986) [67].

5.3. Determine the CN Values

Based on land cover categories, NDVI results, and HSG classes, ArcGIS 10.8 was used to create a CN raster layer with a spatial resolution of 30 m, and each cell had a CN value related to its characteristics, as shown in Figure 7A and Table 4. It is noted that the basement rocks, Miocene limestone, urban areas, and roads took a value of CN 94, and their total area is 75.7% of the basin area. The Cretaceous sandstone rocks and medium to coarse gravel deposits, which cover 14.6% of the basin area, were assigned a Curve Number (CN) value of 59, reflecting their moderate runoff potential. On the other hand, fine sand deposits, represent 9.7% of the basin area, were assigned a lower CN value of 42, indicating a higher infiltration capacity and lower runoff potential [71]. These variations in CN values are critical for accurately modeling hydrological processes and understanding the spatial distribution of runoff within the basin [72].

5.4. SCS-CN Results

The results of the SCS-CN analysis, as illustrated in Figure 8B and Table 3, indicate the following: (1) The total Ia for the study basin is 7.22 × 10⁶ m3, representing 81.6% of the total rainfall during the storm. This percentage is consistent with findings estimated in other basins in Egypt [11,18,33], suggesting similar hydrological behavior in arid regions. (2) The Ia values across sub-basins varied significantly, ranging from 48.9 × 10³ to 2.19 × 10⁶ m3 (80.4 and 83.1% of total rainfall) with a standard deviation (SD) of 661.3 × 10³ m3. These variations are due to differences in rainfall distribution, sub-basin area, and CN values, which reflect variations in soil type, land cover, and infiltration capacity. (3) The runoff depth (Q) values across the basin ranged between 1 and 4.7 mm, with an average of 3.1 mm. There were slight differences between the sub-basins, as the values ranged between 2.8 and 3.5 mm, with SD of 0.2 mm. These minor differences indicate relatively uniform runoff generation across sub-basins, likely due to similar rainfall intensities and CN values. (4) The total amount of runoff for the entire basin was estimated at 1.63 × 10⁶ m3 (18.4% of the total rainfall). This relatively low runoff percentage is typical for arid regions, where high initial abstraction and infiltration rates dominate the hydrological response. (5) The runoff volumes in the sub-basins varied significantly, with an SD of 153.4 × 10³ m3, and these differences are primarily due to differences in sub-basin areas and amounts of rainfall, as well as differences in the infiltration rate due to land cover and Hydrologic Soil Groups (HSGs). For example, Wadi Upper Al-Barud recorded the highest runoff volume (508.1 × 10³ m3), contributing approximately one-third of the total basin runoff. In contrast, sub-basin D had the lowest runoff volume (10.7 × 10³ m3), likely due to its smaller area and lower rainfall [73]. (6) The analysis revealed a strong proportional relationship between the runoff volume and both the basin area (r = 0.996) and rainfall amount (r = 0.999). These high correlation coefficients underscore the dominant role of basin size and rainfall intensity in controlling runoff generation in arid environments.

5.5. Model Evaluation

5.5.1. Tracing the Flash Flood

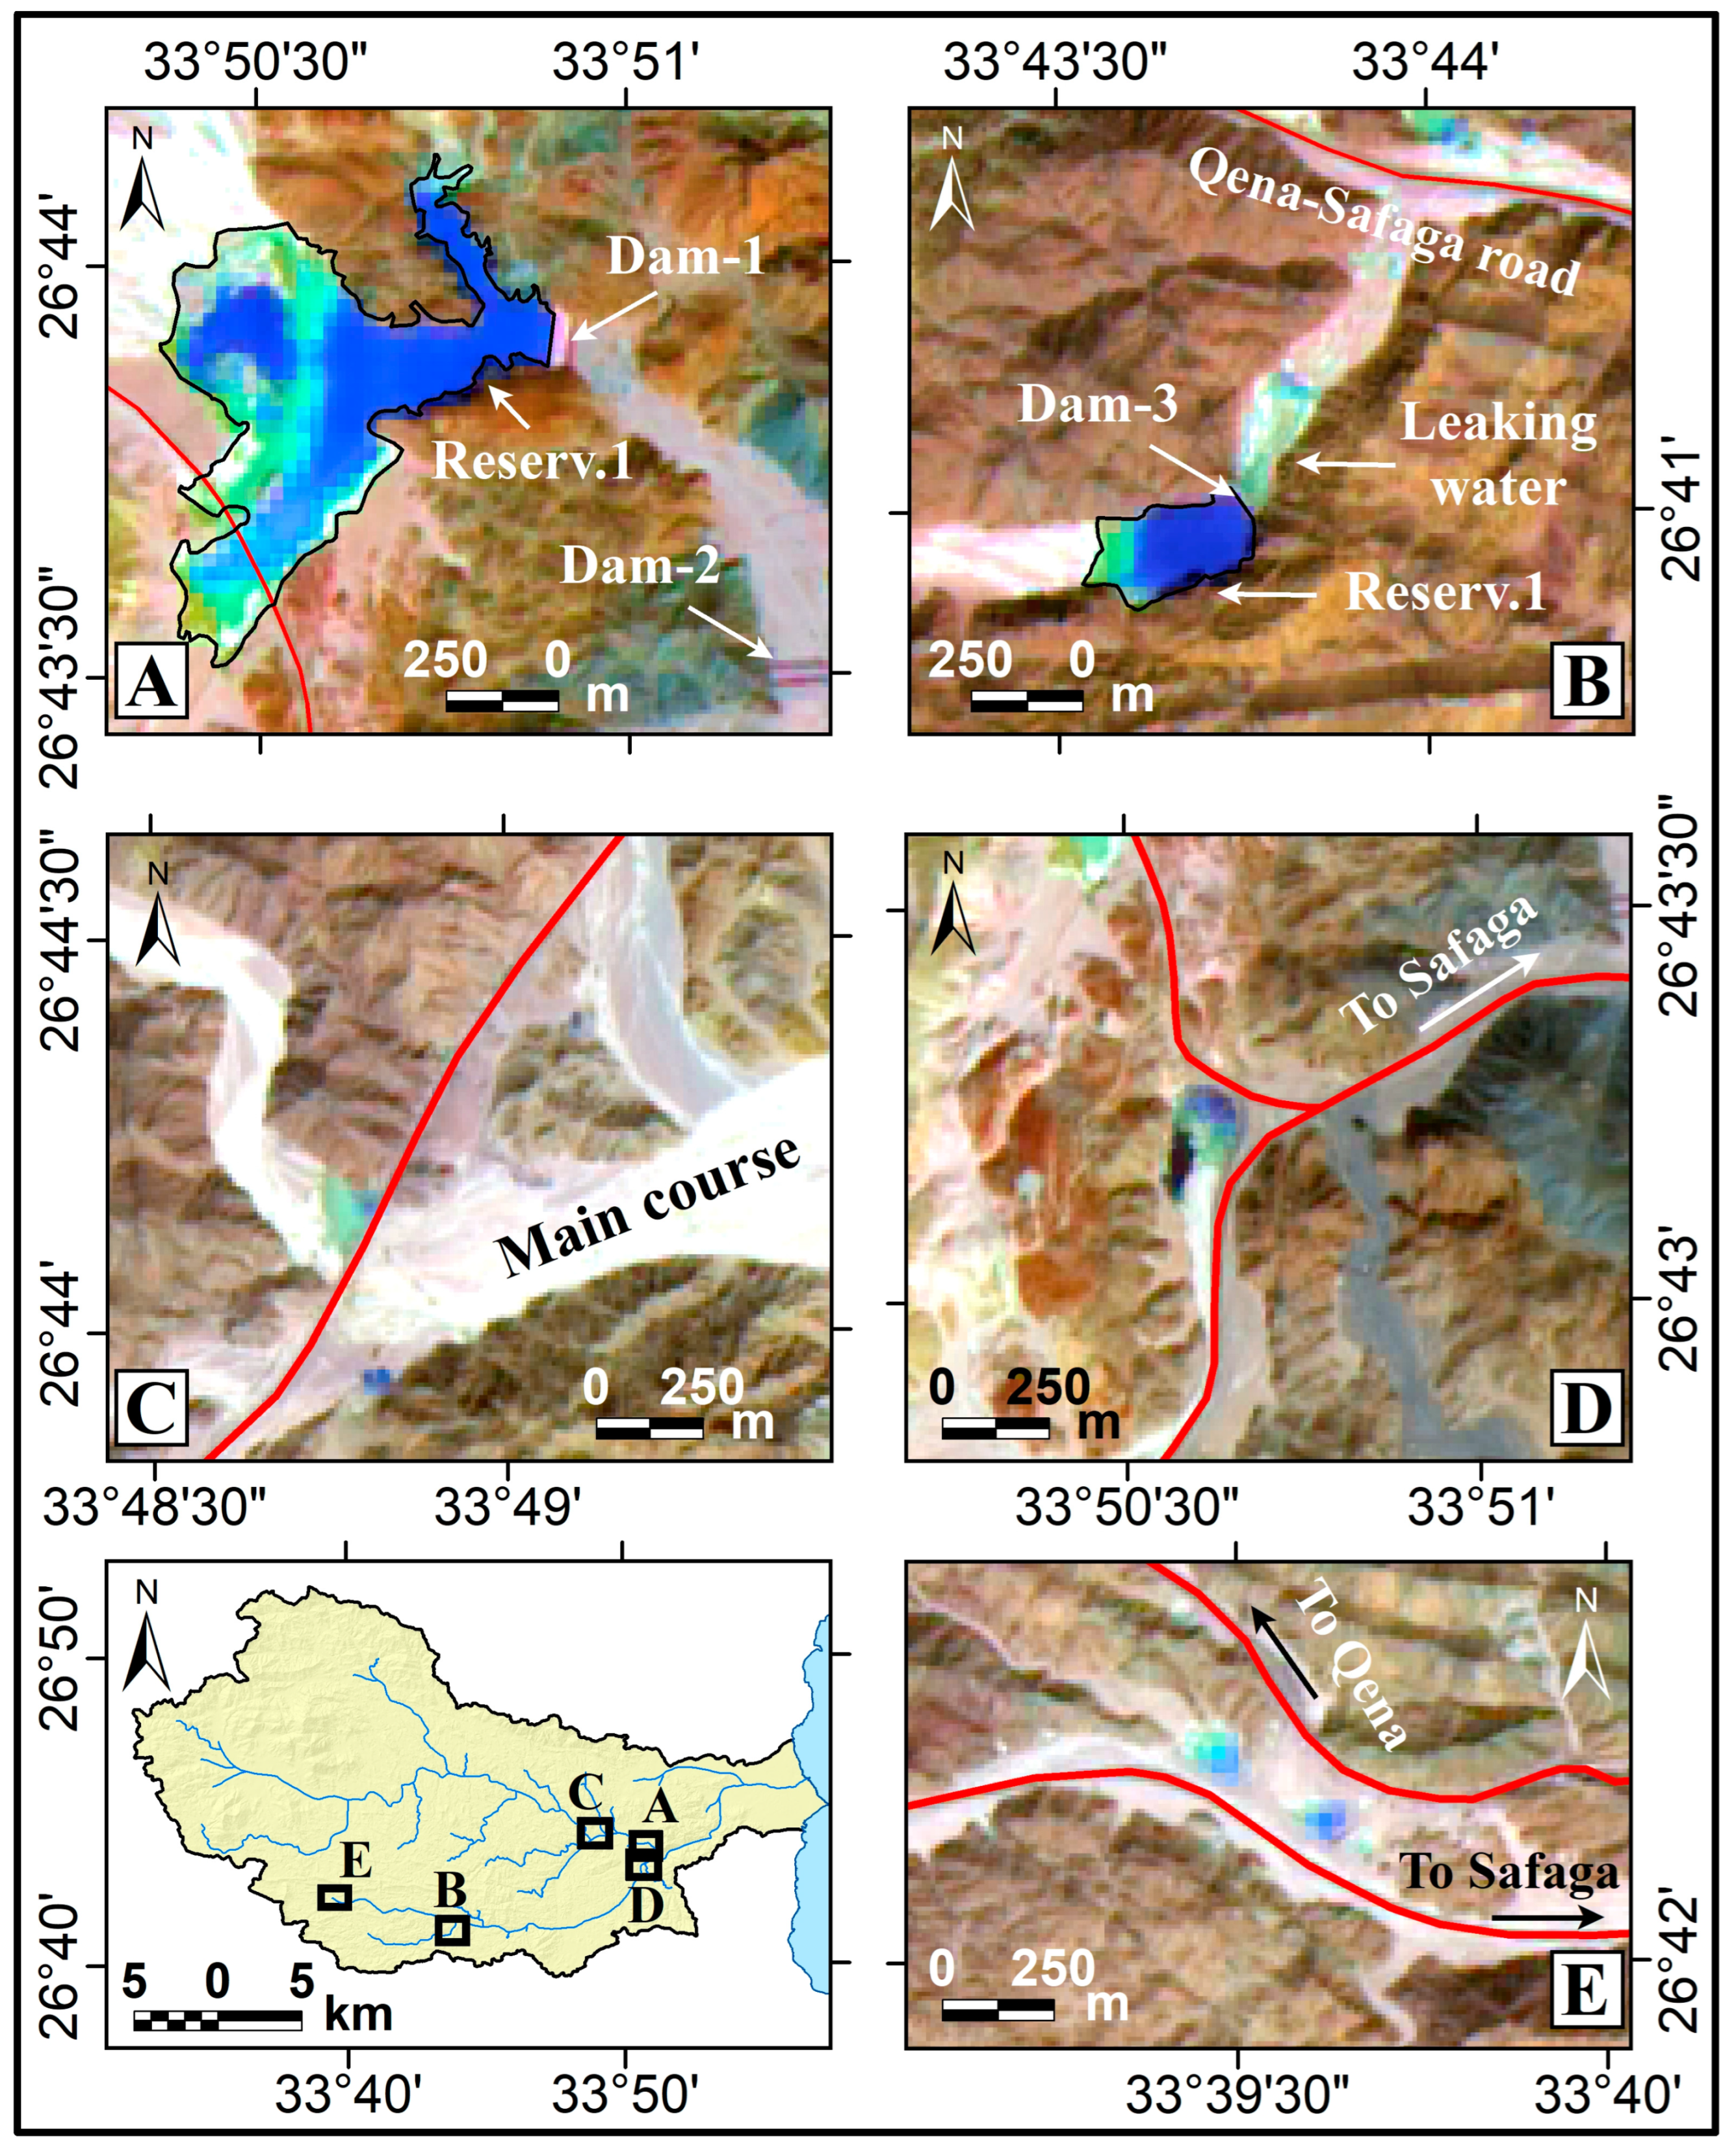
Based on the Landsat 8 OLI image acquired on 1 November 2016 at 8.13 GMT (LS-Nov), 4 days after the flash flood, and field investigations, it is evident that the flash floodwaters flowed extensively throughout the basin, and significant amounts of water and sediments accumulated in the reservoirs of Dams 1 and 3 (Figure 9A,B), highlighting the effectiveness of these structures in capturing floodwaters and reducing downstream impacts [74]. Additionally, floodwaters accumulated in several separated and dispersed small ponds (Figure 9C–E), representing low terrain between the outlets of the sub-basins and the Safaga–Qena highway, as the road is at a higher elevation than the level of the outlets. Furthermore, the flash flood of Wadi Kahlah sub-basin accumulated on a small pond on the western side of the Safaga Ring Road, as this road reaches a height of approximately 10 m. This observation underscores the influence of infrastructure on floodwater distribution and accumulation patterns [75]. Hence, the water and sediments accumulated in the two reservoirs are the most obvious, and their quantities can be measured with high accuracy through the integration of RS, TIN DEMs, and field work measurements. This multi-source approach not only enhances the precision of flood impact assessments, but also provides valuable insights for improving flood management strategies in arid regions [76].

5.5.2. Runoff from the Integration of RS, TIN DEMs, and Field Measurements

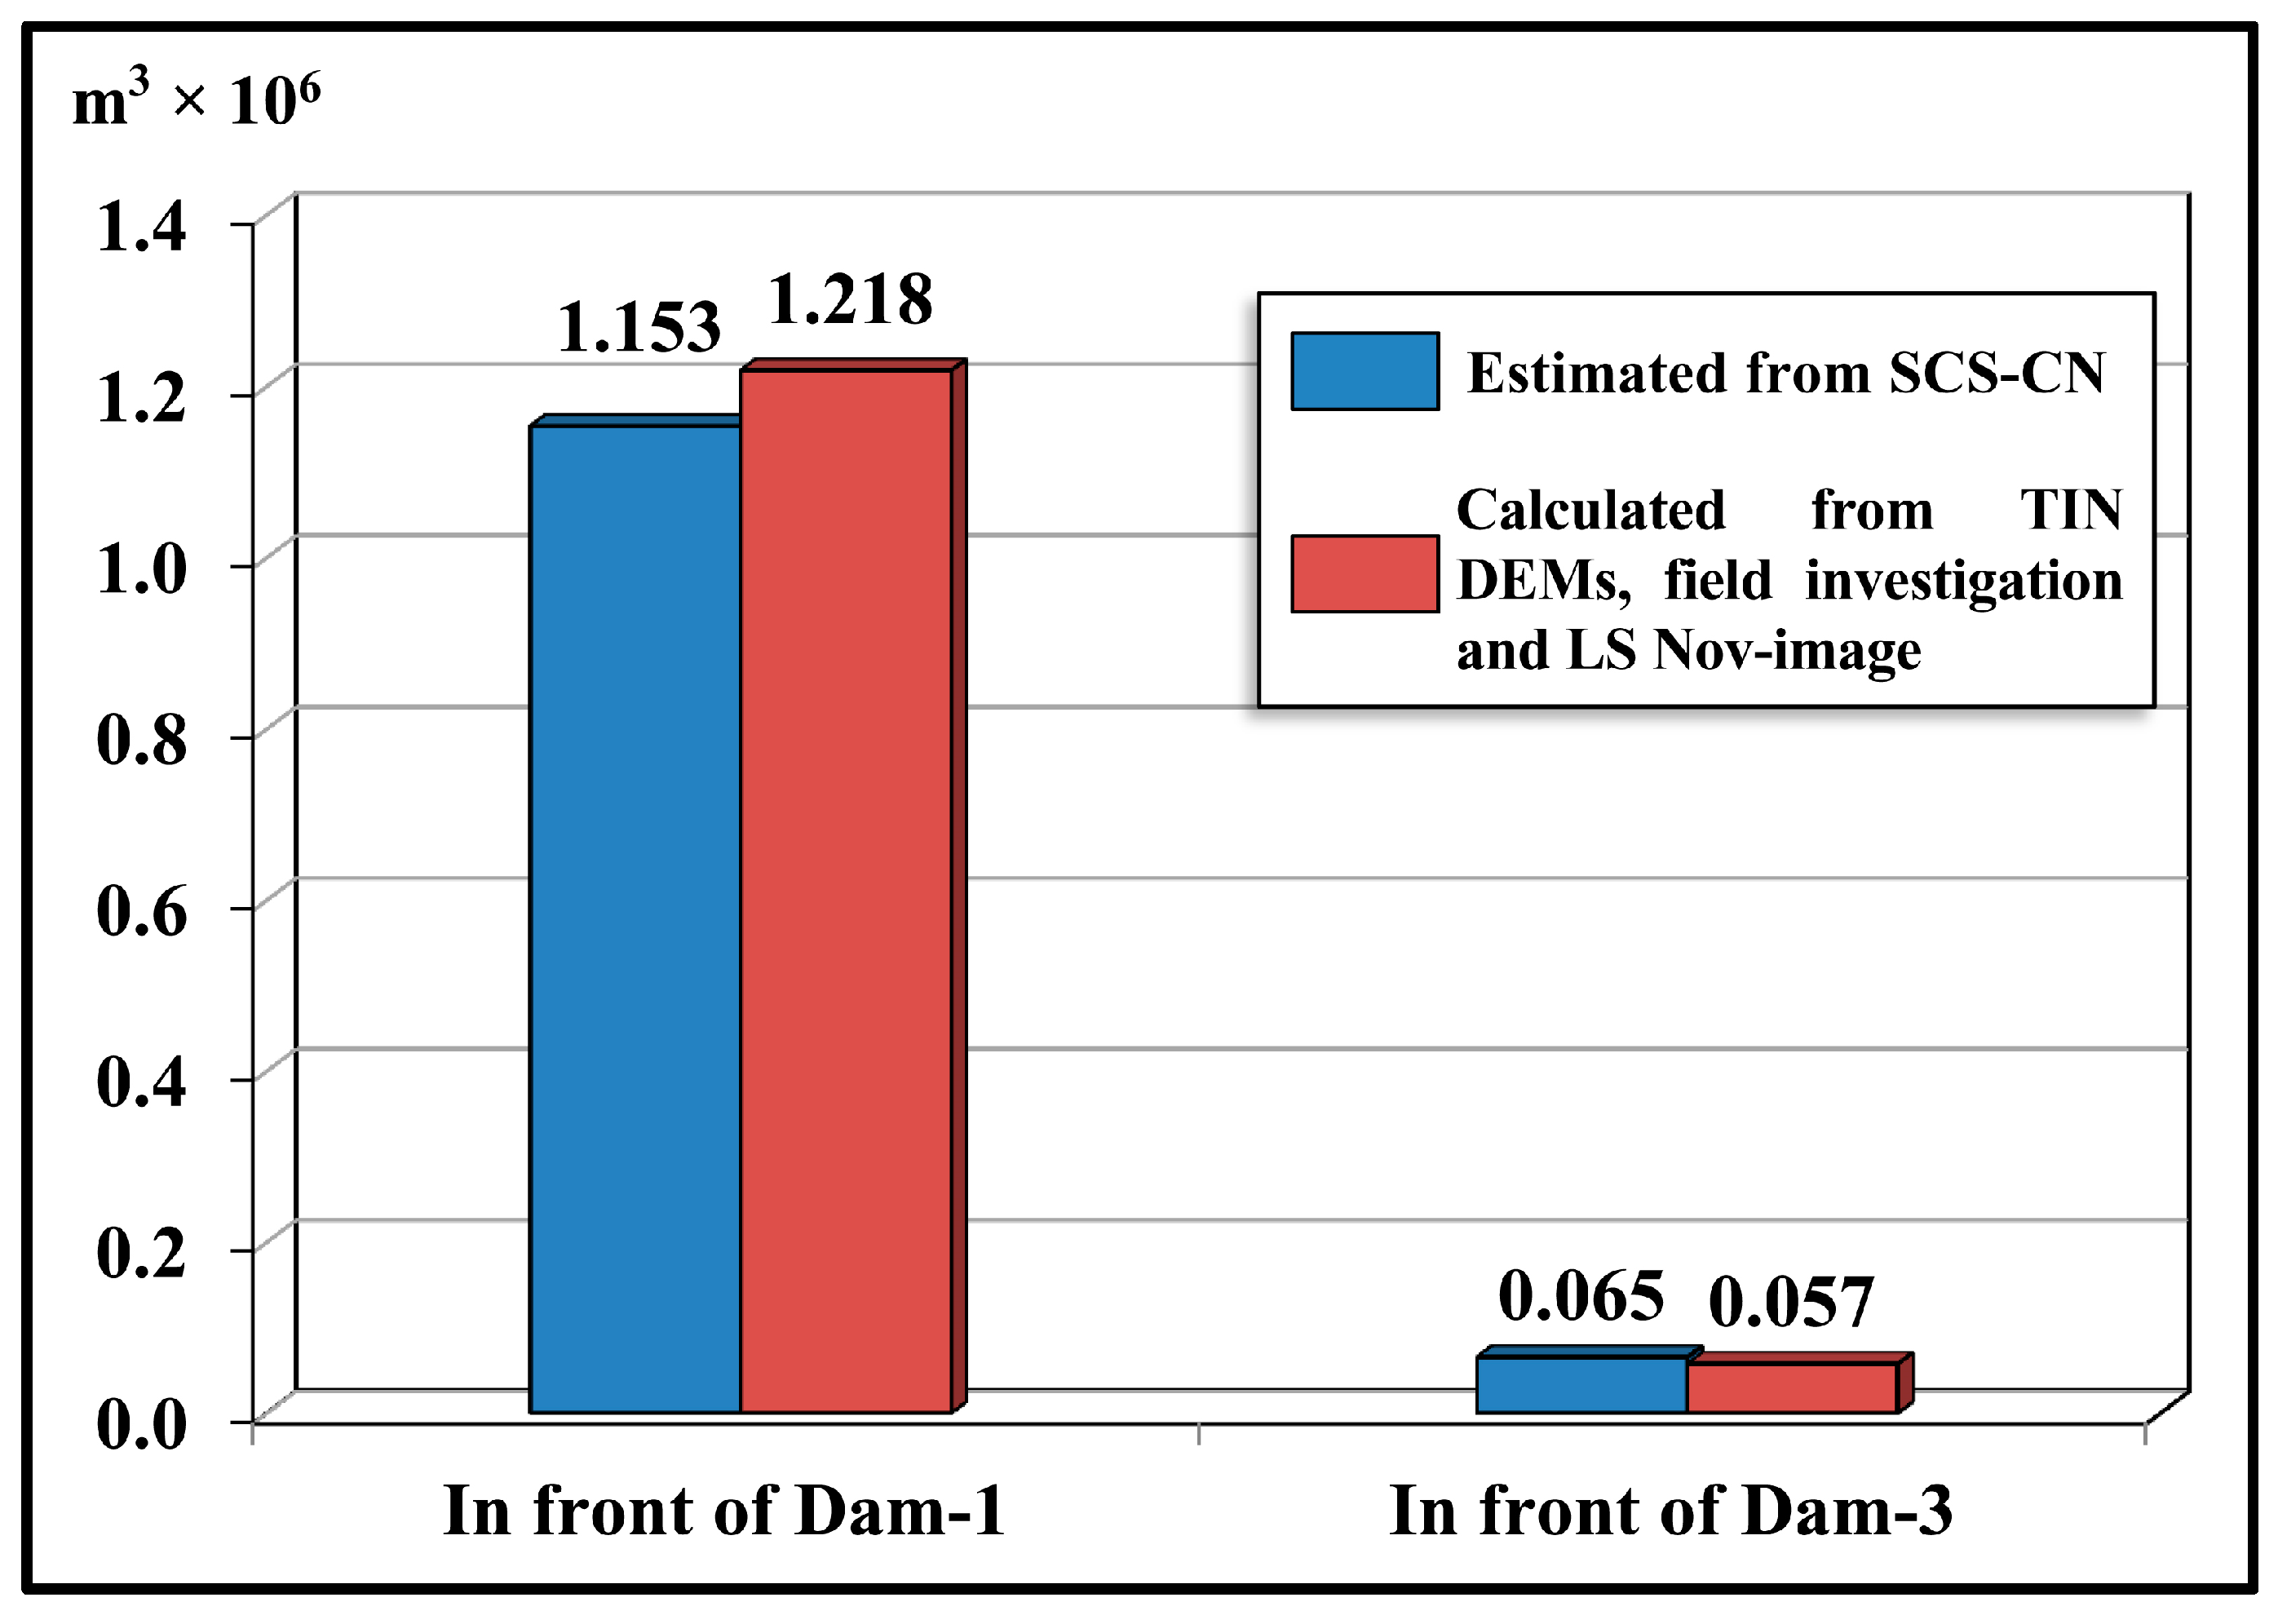
The flash flood water and sediments accumulated in the reservoirs were calculated based on the integration between the LS-Nov, TIN DEMs (Figure 4C,E), and field measurements. The levels of the water in the reservoirs were drawn from the LS-Nov image (Figure 9A,B), and their areas were about 389 × 103 m3 and 62.6 × 10³ m3 in Dams 1 and 3, respectively. Also, the height of the water was measured through the marks of water levels and sediments on both the dams and the sides of the reservoirs, and its height reached about 9 m in Dam 1 (201 m msl.) and about 3 m in Dam 3 (371 m msl.). Accordingly, the amount of the flash flood was about 1.22 × 10⁶ m3 and 57.3 × 10³ m3 in Reservoirs 1 and 3, respectively (Figure 10). These values were very close to those estimated by the Crises Unit, Safaga City Council.

5.5.3. Estimating the Volume of Runoff from SCS-CN

The water amount and sediments accumulated at the reservoirs of Dams 1 and 2 was estimated using the SCS-CN method, by determining the boundaries of the drainage basin of each dam and estimating the amount of runoff in the two basins. The drainage basin of Dam 1 included Wadi Upper Al-Barud, Wadi Al-Barud Al-Azraq, Wadi Al-Barud Al-Abyad, Wadi Al-Dowb, Wadi Abu Hadidah, Wadi Abu-Murrat, Wadis A, B, and C, and the Al-Barud main course up to Dam 1. This basin covers a total area of 358 km2, representing approximately 68.7% of the entire study basin. The drainage basin for Dam 3 primarily consists of Wadi Abu-Mayah sub-basin and a tributary of Umm Taghar sub-basin, with an area of 21.9 km2. Therefore, the runoff amounts in the dam’s basins estimated from SCS-CN were about 1.15 × 10⁶ m3 and 64.9 × 10³ m3, respectively (Figure 8). By applying the SCS-CN method to these delineated basins, the runoff volumes were estimated, providing a basis for quantifying the water and sediment accumulation in the reservoirs. This approach highlights the importance of accurate basin delineation and hydrological modeling for effective floodwater management in arid regions [77].
Based on the analysis, as illustrated in Figure 8, slight differences were observed between the water volumes calculated using the integration of RS, TIN DEMs, and field investigation, and the results obtained from the SCS-CN method. The percentage differences were 5.4 for Reservoir 1 and 11.7% for Reservoir 3. The greater difference in Reservoir 3 is due to the fact that the dam is of a mesh earth-filled type without a cemented cover, and therefore quantities of water leaked behind the dam. This is clear in the LS-Nov image (Figure 7B).
Therefore, these slight differences observed between the water volumes calculated using RS, TIN DEMs, and field investigations, and those estimated using the SCS-CN method (5.4% for Reservoir 1 and 11.7% for Reservoir 3), indicate a high level of accuracy in the SCS-CN results.
Some studies, such as [30,31], argue that the initial abstraction ratio (Ia/S) value of 0.2S is a relatively high value, with Woodward et al., 2003 [30] suggesting a reduction to 0.05S, while Satheeshkumar et al., 2017 [32] used the value of 0.3S. However, our current study finds that the standard value of 0.2S is suitable for the study basin and similar basins. This is primarily due to the basin’s geological and topographical characteristics, which predominantly consist of Precambrian crystalline basement rocks, some sedimentary rocks, and a terrain marked by steep slopes and abundant mountains and hills. These features make the study area well suited for applying the SCS-CN method with its standard values without modification.
Experimental results further support this conclusion, with initial abstraction ratios of 0.25, 0.2, 0.15, and 0.1 yielding total surface runoff volumes of 1.06, 1.15, 1.28, and 1.34 × 10⁶ m3 in front of Dam 1, and 0.061, 0.065, 0.076, and 0.081 × 10⁶ m3 in front of Dam 3, respectively. These results indicate that the value of 0.2 is appropriate for the study basin and other basins with similar geological, topographical, and climatic conditions. This value also aligns closely with findings from previous studies on flood events in Egypt [18,39].
This accuracy, combined with the reliability of GPM-FR precipitation data, demonstrates the suitability of these methods for studying rainfall and runoff in arid and semi-arid regions, where field measurements are often challenging to obtain. This finding represents a significant advancement in flash flood studies, particularly for Wadi Al-Barud, where the integration of multiple data sources (e.g., RS, TIN DEMs, and field measurements) has provided a level of detail and precision that was not available in previous studies [21]. The availability of these diverse datasets has enabled more robust and accurate hydrological analyses, offering valuable insights for flood risk assessment and water resource management in similar regions.

5.6. Evaluating the Current Protection Methods

The storage capacities of Reservoirs no. 1, 2, and 3 are 2.7, 0.4 and 1.1 × 10⁶ m3, respectively (WRRI, 2003) [78]. On December 2020, the Egyptian Government removed the sediments in front of the three dams and deepened the reservoirs by digging four basins; two of them are in front of Dam 1. Based on field measurements and the world imagery layer, this study has estimated the four basins’ storage. Thus, the storage capacities of the reservoirs have increased to about 0.7, 0.3, and 0.075 × 10⁶ m3, respectively.
To evaluate the efficiency of current protection methods in mitigating the risks of future floods stronger than the studied event, this study simulated hypothetical rainfall storms with return periods of 25, 50, and 100 years. This simulation was based on rainfall data recorded at the Hurghada Meteorological Station, located in the Red Sea coastal plain about 50 km north of the study basin, making it the closest meteorological station to the study area. The maximum rainfall depths for the 25-, 50-, and 100-year return periods were 17.6 mm, 28.7 mm, and 45.2 mm, respectively.
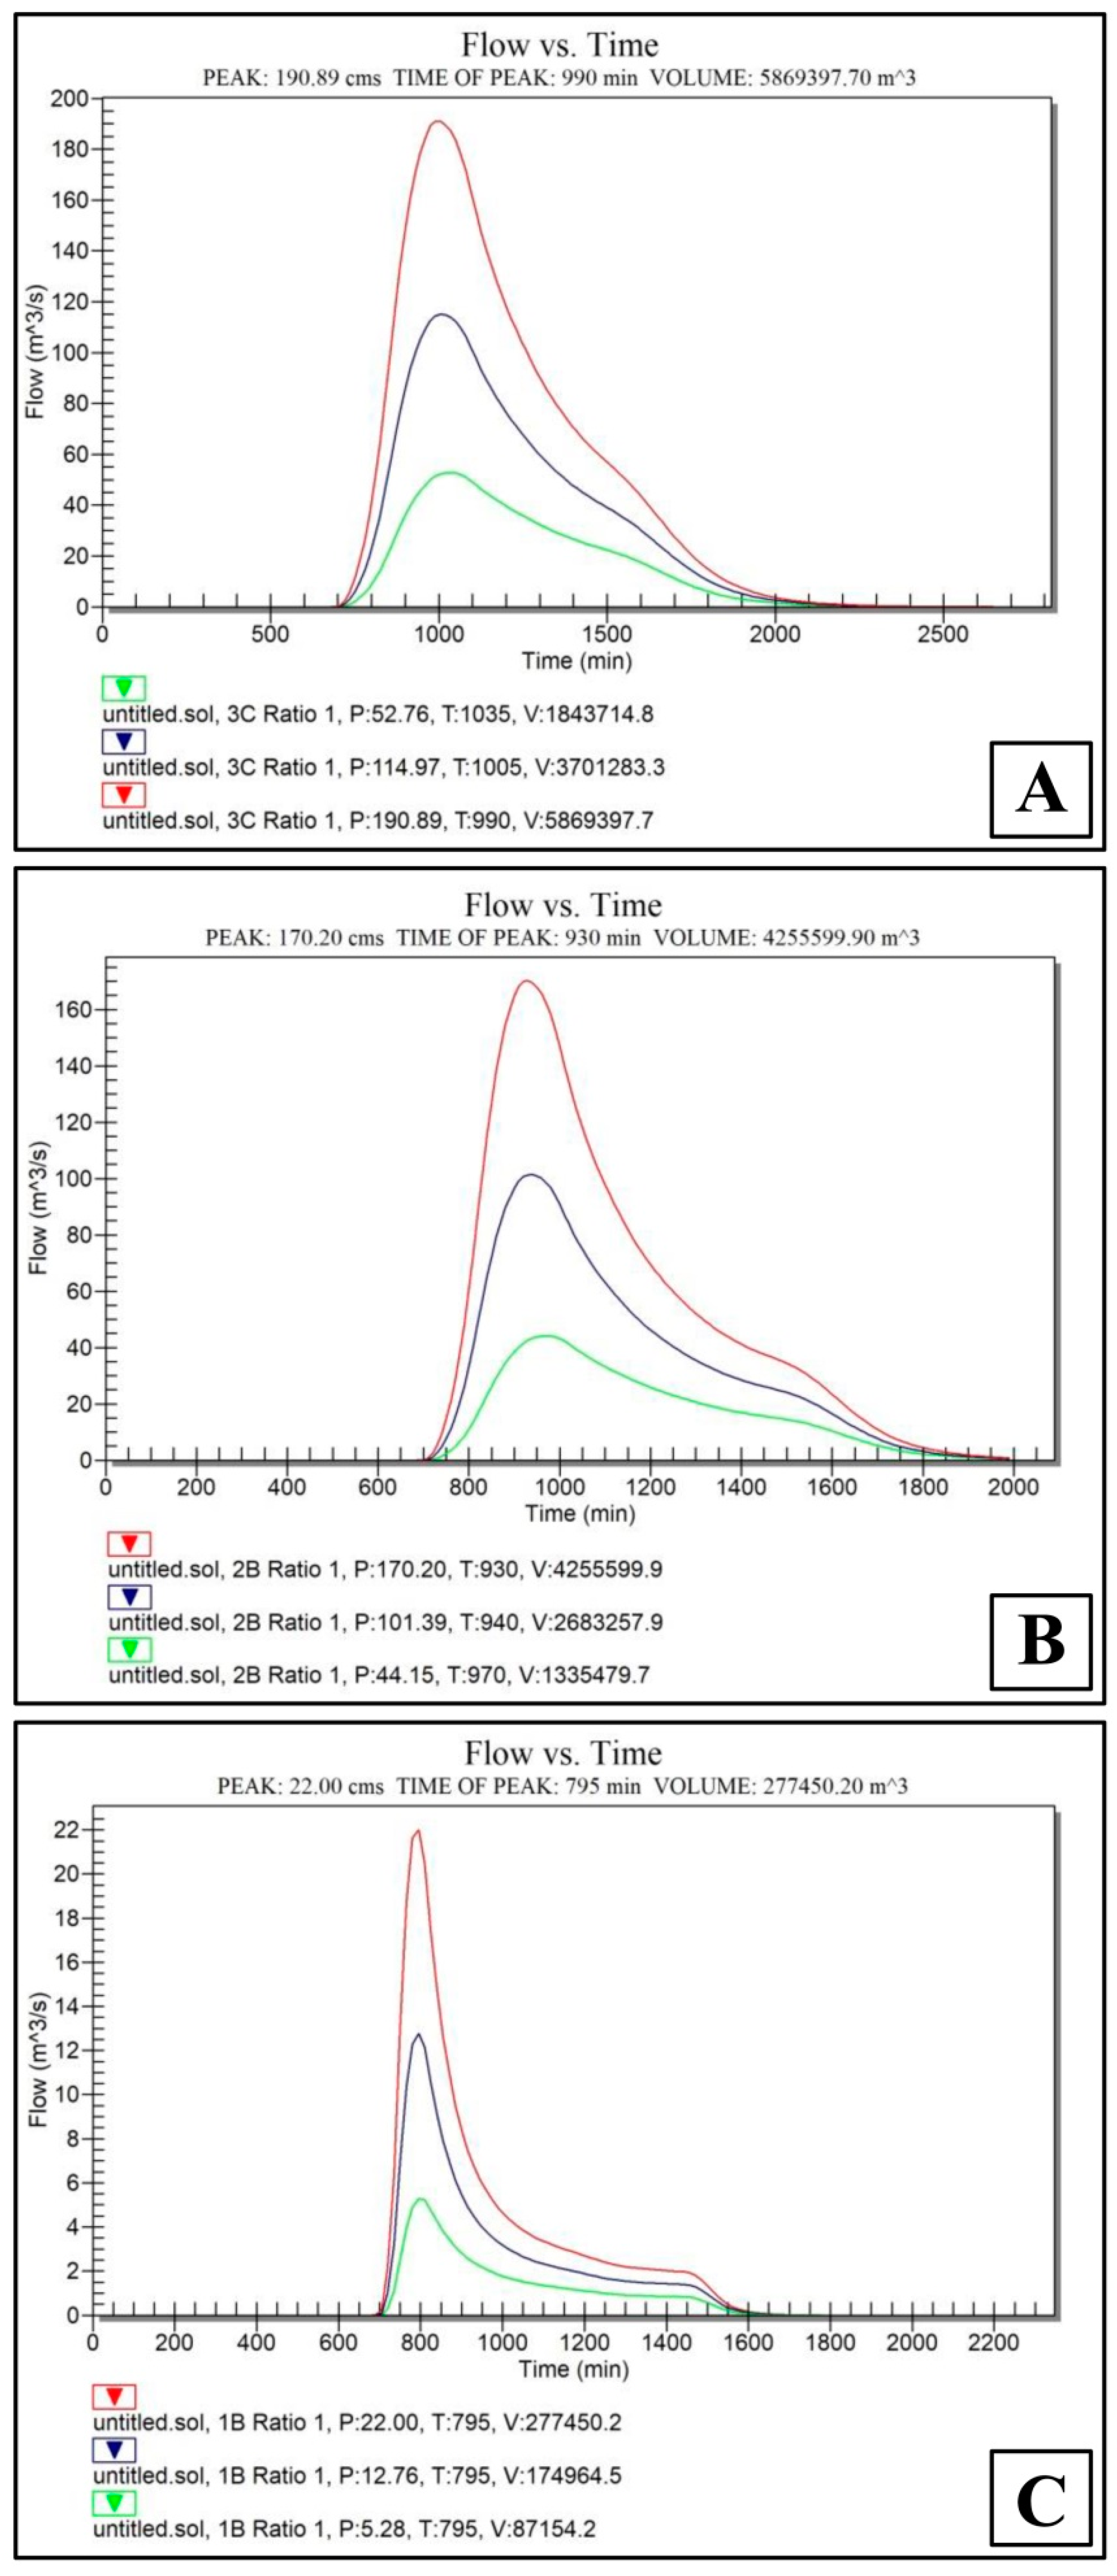
The Watershed Modeling System (WMS 11) software was used to estimate the runoff volumes at Dams 1 and 2, as well as at Dam 3, and for the entire Wadi Al-Barud basin (Figure 11). By subtracting the runoff volumes at the three dams from the total basin runoff, the remaining runoff volume in the rest of the basin was calculated, as shown in Table 5. The analysis reveals the following: (1) The runoff volumes for the 25-, 50-, and 100-year return periods are estimated at 1.8 × 10⁶ m3, 3.7 × 10⁶ m3, and 5.8 × 10⁶ m3, respectively. (2) Reservoirs 1 and 2 will be able to capture all the floodwaters reaching them for the 25- and 50-year return periods. However, there will be an excess of 0.2 × 10⁶ m3 for the 100-year return period. (3) Reservoir 3 will be able to capture all the floodwaters reaching it for all three return periods. In fact, its current storage capacity of 1.175 × 10⁶ m3 allows it to accommodate much larger volumes. (4) Consequently, the main course of Wadi Al-Barud and the Wadi Kahlah sub-basin will experience runoff volumes of 0.37 × 10⁶ m3, 0.85 × 10⁶ m3, and 1.22 × 10⁶ m3 for the 25-, 50-, and 100-year return periods, respectively. This poses a significant risk to the Safaga–Qena highway, the Safaga Ring Road, Safaga City, and Safaga Port.
Based on the data provided in Table 5, the runoff volume for the 26–27 October 2016 flash flood event was 1.64 × 10⁶ m3 at Wadi Al-Barud basin. Comparing this to the estimated runoff volumes for the 25-, 50-, and 100-year return periods (1.8 × 10⁶ m3, 3.7 × 10⁶ m3, and 5.8 × 10⁶ m3, respectively), it is clear that the 2016 event produced a runoff volume lower than that of the 25-year return period.
Therefore, the return period of the October 2016 rainfall event was less than 25 years. This suggests that the event was relatively moderate compared to the hypothetical storms simulated for longer return periods.
Therefore, the current plans procedures in the study basin are almost sufficient to mitigate the risk of the flash floods resulting during the 25- and 50-year return periods, and barely with a 100-year return period, especially in consideration of the climate changes and their effects on flash floods in arid and semi-arid regions [79,80,81,82].
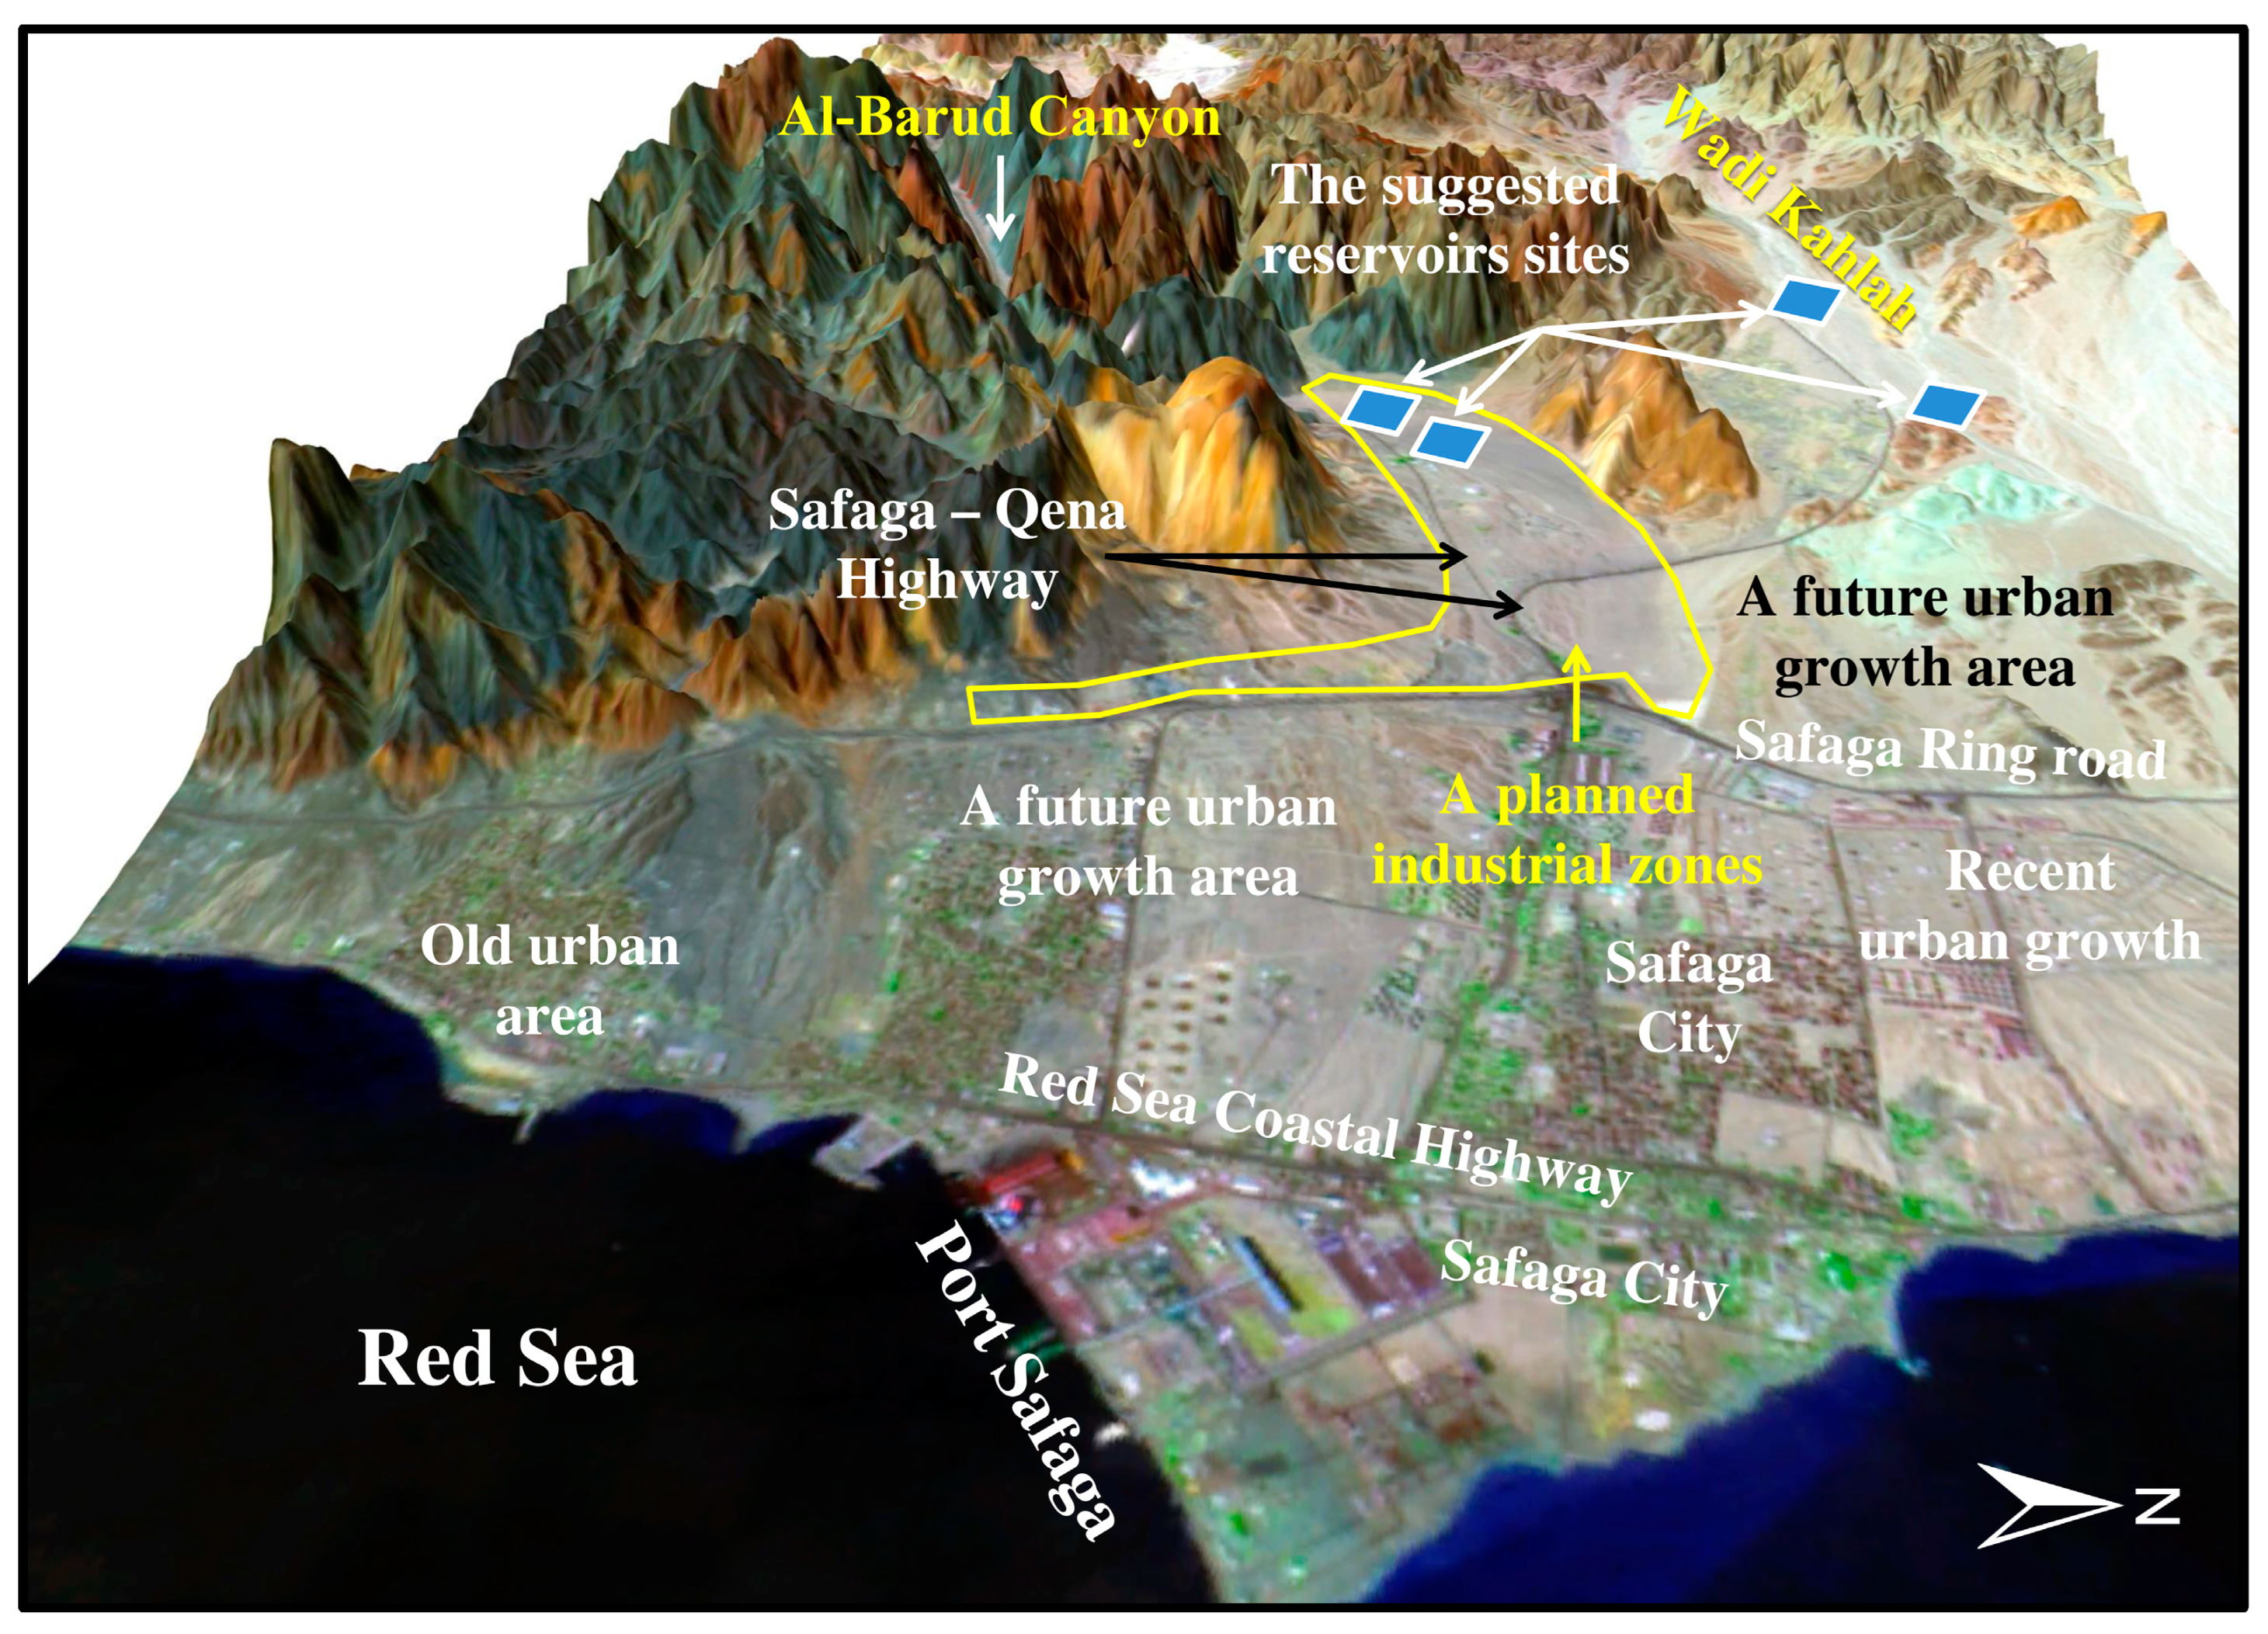
So, the current study recommends digging a reservoir with a storage capacity of 0.25 × 10⁶ m3 in the active channel of the Wadi Kahlah outlet (Figure 12). Since Wadi Umm Taghar and Wadi Al-Barud main trunks are narrow and deep (canyons), and the Safaga–Qena highway passes through their longitudinal sections, this study suggests digging one or two reservoirs with a capacity of 1 × 10⁶ m3 at the apex of the Al-Barud Delta, in order to impound the flash flood of these wadis, with the necessity of strengthening the sides of the road and constructing a barrier to divert the flash floods towards these reservoirs.
Based on the proposed protection plans, this study suggests that it is possible to implement urban plans for Safaga City (Figure 12). Also, the entire delta area has become more sustainable for human use in the future. Moreover, reservoir water can be utilized for human uses, especially since water is scarce in the study basin.

6. Conclusions

The current study investigates the accuracy of the SCS-CN method for analyzing flash floods in arid and semi-arid regions, with a specific application to Wadi Al-Barud basin, Central Eastern Desert, Egypt. This basin was chosen for two reasons: the first is the availability of various data sources, which were not available for previous studies. These sources include high-spatio-temporal resolution GPM-FR precipitation data, the ALOS-PALSAR radar image that is used to extract soil textures, Landsat 8 OLI images, geologic maps, and topographic maps. Fortunately, there is the possibility of measuring the amount of water accumulated in the dam’s reservoirs with high accuracy, including a high-accuracy TIN DEM created from ground surveys for the reservoir areas, field measurements, and a Landsat 8 OLI image acquired four days after the flash flood. The study concluded that the SCS-CN method is valuable for studying the flash floods of ungauged basins in arid and semi-arid regions, as its estimations are very close to those calculated from the integration of GIS, RS, and field measurements. Moreover, ALOS radar images enabled the extraction of an accurate soil texture map, which helps in estimating the amount of infiltration; this is a very important method for extracting such maps in areas where they do not exist. The GPM-FR precipitation data are valuable for studying flash floods in arid and semi-arid regions where rain gauge data are scarce. Therefore, the application of geomatics, integrating geospatial technologies such as satellite imagery, GIS, and remote sensing, enables high-accuracy analysis of flash floods, particularly as advancements in data resolution, computational methods, and machine learning continue to enhance modeling capabilities. These tools allow researchers to synthesize diverse datasets (e.g., topography, soil texture, precipitation patterns) and improve predictions, even in data-scarce arid and semi-arid regions. Moreover, this study concluded that the current protection plans in the study basin are almost sufficient to mitigate the risks of future flash floods generated from during the 25- and 50-year return periods, and barely with a 100-year return period, especially in consideration of climate changes. Therefore, the study proposes digging two or three reservoirs, the first with a storage capacity of 0.25 × 10⁶ m3 in the active channel of the Wadi Kahlah outlet and the rest with a capacity of 1 × 10⁶ m3 at the apex of the Al-Barud Delta. The sides of Safaga–Qena highway must also be strengthened and a barrier must be constructed to divert the flash floods towards the proposed reservoirs. If these proposed procedures are implemented, future urban planning of the Al-Barud Delta can be performed without any concern about the flash floods.

Author Contributions

Conceptualization, M.I.K., M.E.F., H.A.M., A.M.S., O.E.-S., M.D., A.S. and M.K.S.; methodology, M.I.K., M.E.F., H.A.M., A.M.S., O.E.-S., M.D., A.S. and M.K.S.; software, M.I.K., M.E.F., H.A.M., A.M.S., O.E.-S., M.D., A.S. and M.K.S.; validation, M.I.K., M.E.F., H.A.M., A.M.S., O.E.-S., M.D., A.S. and M.K.S.; formal analysis, M.I.K., M.E.F., A.M.S., O.E.-S., A.S. and M.K.S.; investigation, M.I.K. and M.K.S.; resources, M.I.K., M.E.F., H.A.M., A.M.S., O.E.-S., M.D., A.S. and M.K.S.; data curation, M.I.K., M.E.F., H.A.M., A.M.S., O.E.-S., M.D., A.S. and M.K.S.; writing—original draft preparation, M.I.K., M.E.F. and M.K.S.; writing—review and editing, M.I.K., M.E.F., H.A.M., A.M.S., O.E.-S., M.D., A.S. and M.K.S.; visualization, M.I.K., M.E.F., H.A.M., A.M.S., O.E.-S., M.D., A.S. and M.K.S.; supervision, M.I.K., M.E.F., A.S. and M.K.S.; project administration, M.I.K., M.E.F., A.S. and M.K.S.; funding acquisition, M.I.K., M.E.F., H.A.M., A.M.S., O.E.-S., M.D., A.S. and M.K.S. All authors have read and agreed to the published version of the manuscript.

Funding

This research received no external funding.

Data Availability Statement

Data are contained within the article.

Acknowledgments

The manuscript presented is a scientific collaboration between scientific institutions in two countries (Egypt and Italy). The authors would like to thank Cairo University, Ain Shams University, National Authority for Remote Sensing and Space Science (NARSS), and the University of Basilicata for supporting the field survey and data analysis.

Conflicts of Interest

The authors declare no conflicts of interest.

References

  1. Alcántara, I.; Goudie, A.S. Geomorphological Hazards and Disaster Prevention; Cambridge University Press: Cambridge, UK, 2010. [Google Scholar]
  2. Richardson, D. International Encyclopedia of Geography, 15 Volume Set: People, the Earth, Environment and Technology; John Wiley & Sons: Hoboken, NJ, USA, 2017; Volume 1. [Google Scholar]
  3. Huggett, R.; Shuttleworth, E. Fundamentals of Geomorphology; Routledge: London, UK, 2022. [Google Scholar]
  4. Sene, K. Flood Warning, Forecasting and Emergency Response; Springer Science & Business Media: Berlin/Heidelberg, Germany, 2008. [Google Scholar]
  5. Dimitriou, E.; Efstratiadis, A.; Zotou, I.; Papadopoulos, A.; Iliopoulou, T.; Sakki, G.-K.; Mazi, K.; Rozos, E.; Koukouvinos, A.; Koussis, A.D. Post-Analysis of Daniel Extreme Flood Event in Thessaly, Central Greece: Practical Lessons and the Value of State-of-the-Art Water-Monitoring Networks. Water 2024, 16, 980. [Google Scholar] [CrossRef]
  6. Khalifa, A.; Bashir, B.; Alsalman, A.; Naik, S.P.; Nappi, R. Remotely Sensed Data, Morpho-Metric Analysis, and Integrated Method Approach for Flood Risk Assessment: Case Study of Wadi Al-Arish Landscape, Sinai, Egypt. Water 2023, 15, 1797. [Google Scholar] [CrossRef]
  7. Bajabaa, S.; Masoud, M.; Al-Amri, N. Flash flood hazard mapping based on quantitative hydrology, geomorphology and GIS techniques (case study of Wadi Al Lith, Saudi Arabia). Arab. J. Geosci. 2014, 7, 2469–2481. [Google Scholar] [CrossRef]
  8. Abushandi, E.; Al Sarihi, M. Flash flood inundation assessment for an arid catchment, case study at Wadi Al Jizzi, Oman. Water Pract. Technol. 2022, 17, 1155–1168. [Google Scholar] [CrossRef]
  9. Ashour, M.M. Flash floods in Egypt. Bull. Egypt. Geogr. Soc. 2002, LXXV, 101–114. [Google Scholar]
  10. El-Fakharany, M.; Mansour, N. Morphometric analysis and flash floods hazards assessment for Wadi Al Aawag drainage Basins, southwest Sinai, Egypt. Environ. Earth Sci. 2021, 80, 168. [Google Scholar] [CrossRef]
  11. Moawad, M.B. Analysis of the flash flood occurred on 18 January 2010 in wadi El Arish, Egypt (a case study). Geomat. Nat. Hazards Risk 2013, 4, 254–274. [Google Scholar] [CrossRef]
  12. Abduladheem, A.; Elmewafey, M.; Beshr, A.; Elnaggar, A. Using GIS based morphometry estimation of flood hazard impacts on desert roads in South Sinai, Egypt. Int. J. Sci. Eng. Res. 2015, 6, 1593–1599. [Google Scholar]
  13. Elsadek, W.M.; Ibrahim, M.G.; Mahmod, W.E. Flash flood risk estimation of Wadi Qena Watershed, Egypt using GIS based morphometric analysis. Appl. Environ. Res. 2018, 40, 36–45. [Google Scholar] [CrossRef]
  14. Abd El Aal, A.; Kamel, M.; Al-Homidy, A. Using remote sensing and GIS techniques in monitoring and mitigation of geohazards in Najran Region, Saudi Arabia. Geotech. Geol. Eng. 2019, 37, 3673–3700. [Google Scholar] [CrossRef]
  15. Nasir, M.J.; Iqbal, J.; Ahmad, W. Flash flood risk modeling of swat river sub-watershed: A comparative analysis of morphometric ranking approach and El-Shamy approach. Arab. J. Geosci. 2020, 13, 1–19. [Google Scholar] [CrossRef]
  16. El-Fakharany, M.A.; Hegazy, M.N.; Mansour, N.M.; Abdo, A.M. Flash flood hazard assessment and prioritization of sub-watersheds in Heliopolis basin, East Cairo, Egypt. Arab. J. Geosci. 2021, 14, 1693. [Google Scholar] [CrossRef]
  17. Rashwan, M.; Mohamed, A.K.; Alshehri, F.; Almadani, S.; Khattab, M.; Mohamed, L. Flash Flood Hazard Assessment along the Red Sea Coast Using Remote Sensing and GIS Techniques. ISPRS Int. J. Geo-Inf. 2023, 12, 465. [Google Scholar] [CrossRef]
  18. Gabr, S.; El Bastawesy, M. Estimating the flash flood quantitative parameters affecting the oil-fields infrastructures in Ras Sudr, Sinai, Egypt, during the January 2010 event. Egypt. J. Remote Sens. Space Sci. 2015, 18, 137–149. [Google Scholar] [CrossRef]
  19. Ezz, H. Integrating GIS and HEC-RAS to model Assiut plateau runoff. Egypt. J. Remote Sens. Space Sci. 2018, 21, 219–227. [Google Scholar] [CrossRef]
  20. Mashaly, J.; Ghoneim, E. Flash flood hazard using optical, radar, and stereo-pair derived dem: Eastern desert, Egypt. Remote Sens. 2018, 10, 1204. [Google Scholar] [CrossRef]
  21. Hagras, A. Runoff modeling using SCS-CN and GIS approach in the Tayiba Valley Basin, Abu Zenima area, South-west Sinai, Egypt. Model. Earth Syst. Environ. 2023, 9, 3883–3895. [Google Scholar] [CrossRef]
  22. Hegazy, M.N.; El-Fakharany, M.A.A.; Abdo, A.M.; Mansour, N.M. Estimation of expected peak discharge and flood volume of the Heliopolis basin, East Cairo, Egypt, using RS and WMS program. Egypt. J. Remote Sens. Space Sci. 2023, 26, 676–690. [Google Scholar] [CrossRef]
  23. Zerger, A.; Smith, D.I. Impediments to using GIS for real-time disaster decision support. Comput. Environ. Urban Syst. 2003, 27, 123–141. [Google Scholar] [CrossRef]
  24. Al-Ghobari, H.; Dewidar, A.; Alataway, A. Estimation of surface water runoff for a semi-arid area using RS and GIS-based SCS-CN method. Water 2020, 12, 1924. [Google Scholar] [CrossRef]
  25. Shi, W.; Wang, N. An improved SCS-CN method incorporating slope, soil moisture, and storm duration factors for runoff prediction. Water 2020, 12, 1335. [Google Scholar] [CrossRef]
  26. Suresh Babu, P.; Mishra, S. Improved SCS-CN–inspired model. J. Hydrol. Eng. 2012, 17, 1164–1172. [Google Scholar] [CrossRef]
  27. Mishra, S.K.; Jain, M.K.; Suresh Babu, P.; Venugopal, K.; Kaliappan, S. Comparison of AMC-dependent CN-conversion formulae. Water Resour. Manag. 2008, 22, 1409–1420. [Google Scholar] [CrossRef]
  28. Jacobs, J.M.; Myers, D.A.; Whitfield, B.M. Improved rainfall/runoff estimates using remotely sensed soil moisture 1. JAWRA J. Am. Water Resour. Assoc. 2003, 39, 313–324. [Google Scholar] [CrossRef]
  29. Mishra, S.K.; Singh, V.P. Soil Conservation Service Curve Number (SCS-CN) Methodology; Springer Science & Business Media: Berlin/Heidelberg, Germany, 2013; Volume 42. [Google Scholar]
  30. Woodward, D.E.; Hawkins, R.H.; Jiang, R.; Hjelmfelt, J.; Allen, T.; Van Mullem, J.A.; Quan, Q.D. Runoff curve number method: Examination of the initial abstraction ratio. In Proceedings of the World Water & Environmental Resources Congress 2003, Philadelphia, PA, USA, 23–26 June 2003; pp. 1–10. [Google Scholar]
  31. Mishra, S.K.; Singh, V.P. Long-term hydrological simulation based on the Soil Conservation Service curve number. Hydrol. Process. 2004, 18, 1291–1313. [Google Scholar] [CrossRef]
  32. Satheeshkumar, S.; Venkateswaran, S.; Kannan, R. Rainfall–runoff estimation using SCS–CN and GIS approach in the Pappiredipatti watershed of the Vaniyar sub basin, South India. Model. Earth Syst. Environ. 2017, 3, 24. [Google Scholar] [CrossRef]
  33. Gheith, H.; Sultan, M. Construction of a hydrologic model for estimating Wadi runoff and groundwater recharge in the Eastern Desert, Egypt. J. Hydrol. 2002, 263, 36–55. [Google Scholar] [CrossRef]
  34. Milewski, A.; Sultan, M.; Yan, E.; Becker, R.; Abdeldayem, A.; Soliman, F.; Gelil, K.A. A remote sensing solution for estimating runoff and recharge in arid environments. J. Hydrol. 2009, 373, 1–14. [Google Scholar] [CrossRef]
  35. Masoud, A.A. Runoff modeling of the wadi systems for estimating flash flood and groundwater recharge potential in Southern Sinai, Egypt. Arab. J. Geosci. 2011, 4, 785–801. [Google Scholar] [CrossRef]
  36. Foody, G.M.; Ghoneim, E.M.; Arnell, N.W. Predicting locations sensitive to flash flooding in an arid environment. J. Hydrol. 2004, 292, 48–58. [Google Scholar] [CrossRef]
  37. Moawad, M.B.; Abdel Aziz, A.O.; Mamtimin, B. Flash floods in the Sahara: A case study for the 28 January 2013 flood in Qena, Egypt. Geomat. Nat. Hazards Risk 2016, 7, 215–236. [Google Scholar] [CrossRef]
  38. Abuzaid, A.S.; Abdellatif, A.D.; Fadl, M.E. Modeling soil quality in Dakahlia Governorate, Egypt using GIS techniques. Egypt. J. Remote Sens. Space Sci. 2021, 24, 255–264. [Google Scholar] [CrossRef]
  39. El-Etr, H.; Ashmawy, M. Flash flood vulnerability and mitigation of the Red Sea basins between Latitudes 24°41 and 25°26. In Proceedings of the International Conference on ‘‘30 years Coop. Geol. Surv.”, Egypt, Cairo; 1993; Volume 30, pp. 335–351. [Google Scholar]
  40. Badawy, M. Applications of Remote Sensing and Geographic Information Systems in Geomorphological Studies: Safaga-El Quseir Area, Red Sea Coast, Egypt as an Example. Ph.D. Dissertation, Mainz University, Mainz, Germany, 2008. [Google Scholar]
  41. Abdel-Fattah, M.; Kantoush, S.; Sumi, T. Integrated management of flash flood in wadi system of Egypt: Disaster prevention and water harvesting. Annu. Disas. Prev. Res. Inst. Kyoto Univ. 2015, 58, 485–496. [Google Scholar]
  42. Embabi, N.S. Landscapes and Landforms of Egypt; Springer: Berlin/Heidelberg, Germany, 2018. [Google Scholar]
  43. Egyptian, M.A. Normals for Meteorological Surface Station from 1981–2010; Meteorological Station: Cairo, Egypt, 2016. [Google Scholar]
  44. Baldi, M.; Amin, D.; Al Zayed, I.S.; Dalu, G. Climatology and dynamical evolution of extreme rainfall events in the Sinai Peninsula—Egypt. Sustainability 2020, 12, 6186. [Google Scholar] [CrossRef]
  45. Schumm, S.A. Evolution of drainage systems and slopes in badlands at Perth Amboy, New Jersey. Geol. Soc. Am. Bull. 1956, 67, 597–646. [Google Scholar] [CrossRef]
  46. Horton, R.E. Drainage-basin characteristics. Trans. Am. Geophys. Union 1932, 13, 350–361. [Google Scholar]
  47. Strahler, A.N. Quantitative geomorphology of drainage basin and channel networks. In Handbook of Applied Hydrology; McGraw-Hill: New York, NY, USA, 1964. [Google Scholar]
  48. Horn, B.K. Hill shading and the reflectance map. Proc. IEEE 1981, 69, 14–47. [Google Scholar] [CrossRef]
  49. Strahler, A.N. Quantitative analysis of watershed geomorphology. Eos Trans. Am. Geophys. Union 1957, 38, 913–920. [Google Scholar]
  50. Horton, R.E. Erosional development of streams and their drainage basins; hydrophysical approach to quantitative morphology. Geol. Soc. Am. Bull. 1945, 56, 275–370. [Google Scholar] [CrossRef]
  51. Chorley, R.J. The drainage basin as the fundamental geomorphic unit. In Introduction to Physical Hydrology; Routledge: London, UK, 2019; pp. 37–59. [Google Scholar]
  52. Shamy, E. Recent recharge and flash flooding opportunities in the Eastern Desert, Egypt; Possibilités de recharge de nappes et de crues subites dans le Désert Oriental, Egypte. Ann. Geol. Surv. Egypt 1992, 18, 323. [Google Scholar]
  53. Yousif, M.; Hussien, H.M. Flash floods mitigation and assessment of groundwater possibilities using remote sensing and GIS applications: Sharm El Sheikh, South Sinai, Egypt. Bull. Natl. Res. Cent. 2020, 44, 50. [Google Scholar] [CrossRef]
  54. Arnous, M.O.; El-Rayes, A.E.; El-Nady, H.; Helmy, A.M. Flash flooding hazard assessment, modeling, and management in the coastal zone of Ras Ghareb City, Gulf of Suez, Egypt. J. Coast. Conserv. 2022, 26, 77. [Google Scholar] [CrossRef]
  55. Abou El-Magd, I.; Hermas, E.; El Bastawesy, M. GIS-modelling of the spatial variability of flash flood hazard in Abu Dabbab catchment, Red Sea Region, Egypt. Egypt. J. Remote Sens. Space Sci. 2010, 13, 81–88. [Google Scholar] [CrossRef]
  56. Elnazer, A.A.; Salman, S.A.; Asmoay, A.S. Flash flood hazard affected Ras Gharib city, Red Sea, Egypt: A proposed flash flood channel. Nat. Hazards 2017, 89, 1389–1400. [Google Scholar] [CrossRef]
  57. Hermas, E.; Gaber, A.; El Bastawesy, M. Application of remote sensing and GIS for assessing and proposing mitigation measures in flood-affected urban areas, Egypt. Egypt. J. Remote Sens. Space Sci. 2021, 24, 119–130. [Google Scholar] [CrossRef]
  58. Gado, T.A.; Elkollaly, M.; Guo, Y.; El-Hagrsy, R.M.; Mohameden, M.B.; Shalaby, B.A.; Elboshy, B.; Omara, H.; ElSawwaf, M.A. Event-based rainfall analysis in Sinai, Egypt. Hydrol. Sci. J. 2024, 69, 622–638. [Google Scholar] [CrossRef]
  59. Hou, A.Y.; Skofronick-Jackson, G.; Kummerow, C.D.; Shepherd, J.M. Global precipitation measurement. In Precipitation: Advances in Measurement, Estimation and Prediction; Springer: Berlin/Heidelberg, Germany, 2008; pp. 131–169. [Google Scholar]
  60. Hamouda, M.A.; Hinge, G.; Yemane, H.S.; Al Mosteka, H.; Makki, M.; Mohamed, M.M. Reliability of GPM IMERG Satellite Precipitation Data for Modelling Flash Flood Events in Selected Watersheds in the UAE. Remote Sens. 2023, 15, 3991. [Google Scholar] [CrossRef]
  61. Mahmoud, M.T.; Hamouda, M.A.; Mohamed, M.M. Spatiotemporal evaluation of the GPM satellite precipitation products over the United Arab Emirates. Atmos. Res. 2019, 219, 200–212. [Google Scholar] [CrossRef]
  62. Rachdane, M.; Khalki, E.M.E.; Saidi, M.E.; Nehmadou, M.; Ahbari, A.; Tramblay, Y. Comparison of high-resolution satellite precipitation products in sub-saharan Morocco. Water 2022, 14, 3336. [Google Scholar] [CrossRef]
  63. Aslami, F.; Ghorbani, A.; Sobhani, B.; Esmali, A. Comprehensive comparison of daily IMERG and GSMaP satellite precipitation products in Ardabil Province, Iran. Int. J. Remote Sens. 2019, 40, 3139–3153. [Google Scholar] [CrossRef]
  64. Sharifi, E.; Steinacker, R.; Saghafian, B. Assessment of GPM-IMERG and other precipitation products against gauge data under different topographic and climatic conditions in Iran: Preliminary results. Remote Sens. 2016, 8, 135. [Google Scholar] [CrossRef]
  65. Mahmoud, M.T.; Mohammed, S.A.; Hamouda, M.A.; Mohamed, M.M. Impact of topography and rainfall intensity on the accuracy of imerg precipitation estimates in an arid region. Remote Sens. 2020, 13, 13. [Google Scholar] [CrossRef]
  66. MSA. Egyptian Topographic Maps 1:25,000; Directorate of Military Survey, War Office and Air Ministry: London, UK, 2004. [Google Scholar]
  67. Cronshey, R. Urban Hydrology for Small Watersheds; US Department of Agriculture, Soil Conservation Service, Engineering Division: Washington, DC, USA, 1986.
  68. Pandit, A.; Regan, J. What is the Impervious Area Curve Number? J. Water Manag. Model. 1998, 23, R200-23. [Google Scholar] [CrossRef]
  69. Entezari, M.; Esmaeily, A.; Niazmardi, S. Estimation of soil moisture and earth’s surface temperature using landsat-8 satellite data. Int. Arch. Photogramm. Remote Sens. Spat. Inf. Sci. 2019, 42, 327–330. [Google Scholar] [CrossRef]
  70. Gaber, A.; Koch, M.; El-Baz, F. Textural and compositional characterization of Wadi Feiran deposits, Sinai Peninsula, Egypt, using Radarsat-1, PALSAR, SRTM and ETM+ data. Remote Sens. 2009, 2, 52–75. [Google Scholar] [CrossRef]
  71. Pishvaei, M.H.; Noroozpour, S.; Sabzevari, T.; Kheirabadi, M.A.; Petroselli, A. Spatial and temporal distribution of infiltration, curve number and runoff coefficients using TOPMODEL and SCS-CN models. J. Agric. Environ. Int. Dev. (JAEID) 2024, 118, 203–230. [Google Scholar] [CrossRef]
  72. Meresa, H. Modelling of river flow in ungauged catchment using remote sensing data: Application of the empirical (SCS-CN), artificial neural network (ANN) and hydrological model (HEC-HMS). Model. Earth Syst. Environ. 2019, 5, 257–273. [Google Scholar] [CrossRef]
  73. Salem, I.A.; AR, A.E.-E.; El-Shibiny, N.H. Geochemical and mineralogical characteristics of stream sediments of Wadi El-Baroud area Central Eastern Desert Egypt. Int. J. Innov. Eng. Technol. (IJIET) 2017, 2, 21–40. [Google Scholar]
  74. Dao, P.D.; Liou, Y.-A. Object-based flood mapping and affected rice field estimation with Landsat 8 OLI and MODIS data. Remote Sens. 2015, 7, 5077–5097. [Google Scholar] [CrossRef]
  75. Ahmed, M.R.; Rahaman, K.R.; Kok, A.; Hassan, Q.K. Remote sensing-based quantification of the impact of flash flooding on the rice production: A case study over Northeastern Bangladesh. Sensors 2017, 17, 2347. [Google Scholar] [CrossRef]
  76. Islam, M.M.; Ahamed, T. Development of a near-infrared band derived water indices algorithm for rapid flash flood inundation mapping from sentinel-2 remote sensing datasets. Asia-Pac. J. Reg. Sci. 2023, 7, 615–640. [Google Scholar] [CrossRef]
  77. Mujeeb, M. Estimation of Surface Runoff Using SCS-CN Remote Sensing and GIS in Sanjab Watershed. Available online: https://ouci.dntb.gov.ua/en/works/73E5o10l/ (accessed on 14 May 2024).
  78. Water Resources Research Institute (WRRI). Safaga City Protection Project from Flash Flood Hazards: Red Sea Governorate (Phase I), in Arabic; WRRI: Raleigh, NC, USA, 2003. [Google Scholar]
  79. Burt, T.; Boardman, J.; Foster, I.; Howden, N. More rain, less soil: Long-term changes in rainfall intensity with climate change. Earth Surf. Process. Landf. 2016, 41, 563–566. [Google Scholar] [CrossRef]
  80. El-Rawy, M.; Fathi, H.; Zijl, W.; Alshehri, F.; Almadani, S.; Zaidi, F.K.; Aldawsri, M.; Gabr, M.E. Potential Effects of Climate Change on Agricultural Water Resources in Riyadh Region, Saudi Arabia. Sustainability 2023, 15, 9513. [Google Scholar] [CrossRef]
  81. Hussain Shah, S.M.; Yassin, M.A.; Abba, S.I.; Lawal, D.U.; Hussein Al-Qadami, E.H.; Teo, F.Y.; Mustaffa, Z.; Aljundi, I.H. Flood Risk and Vulnerability from a Changing Climate Perspective: An Overview Focusing on Flash Floods and Associated Hazards in Jeddah. Water 2023, 15, 3641. [Google Scholar] [CrossRef]
  82. Nabinejad, S.; Schüttrumpf, H. Flood risk management in arid and semi-arid areas: A comprehensive review of challenges, needs, and opportunities. Water 2023, 15, 3113. [Google Scholar] [CrossRef]
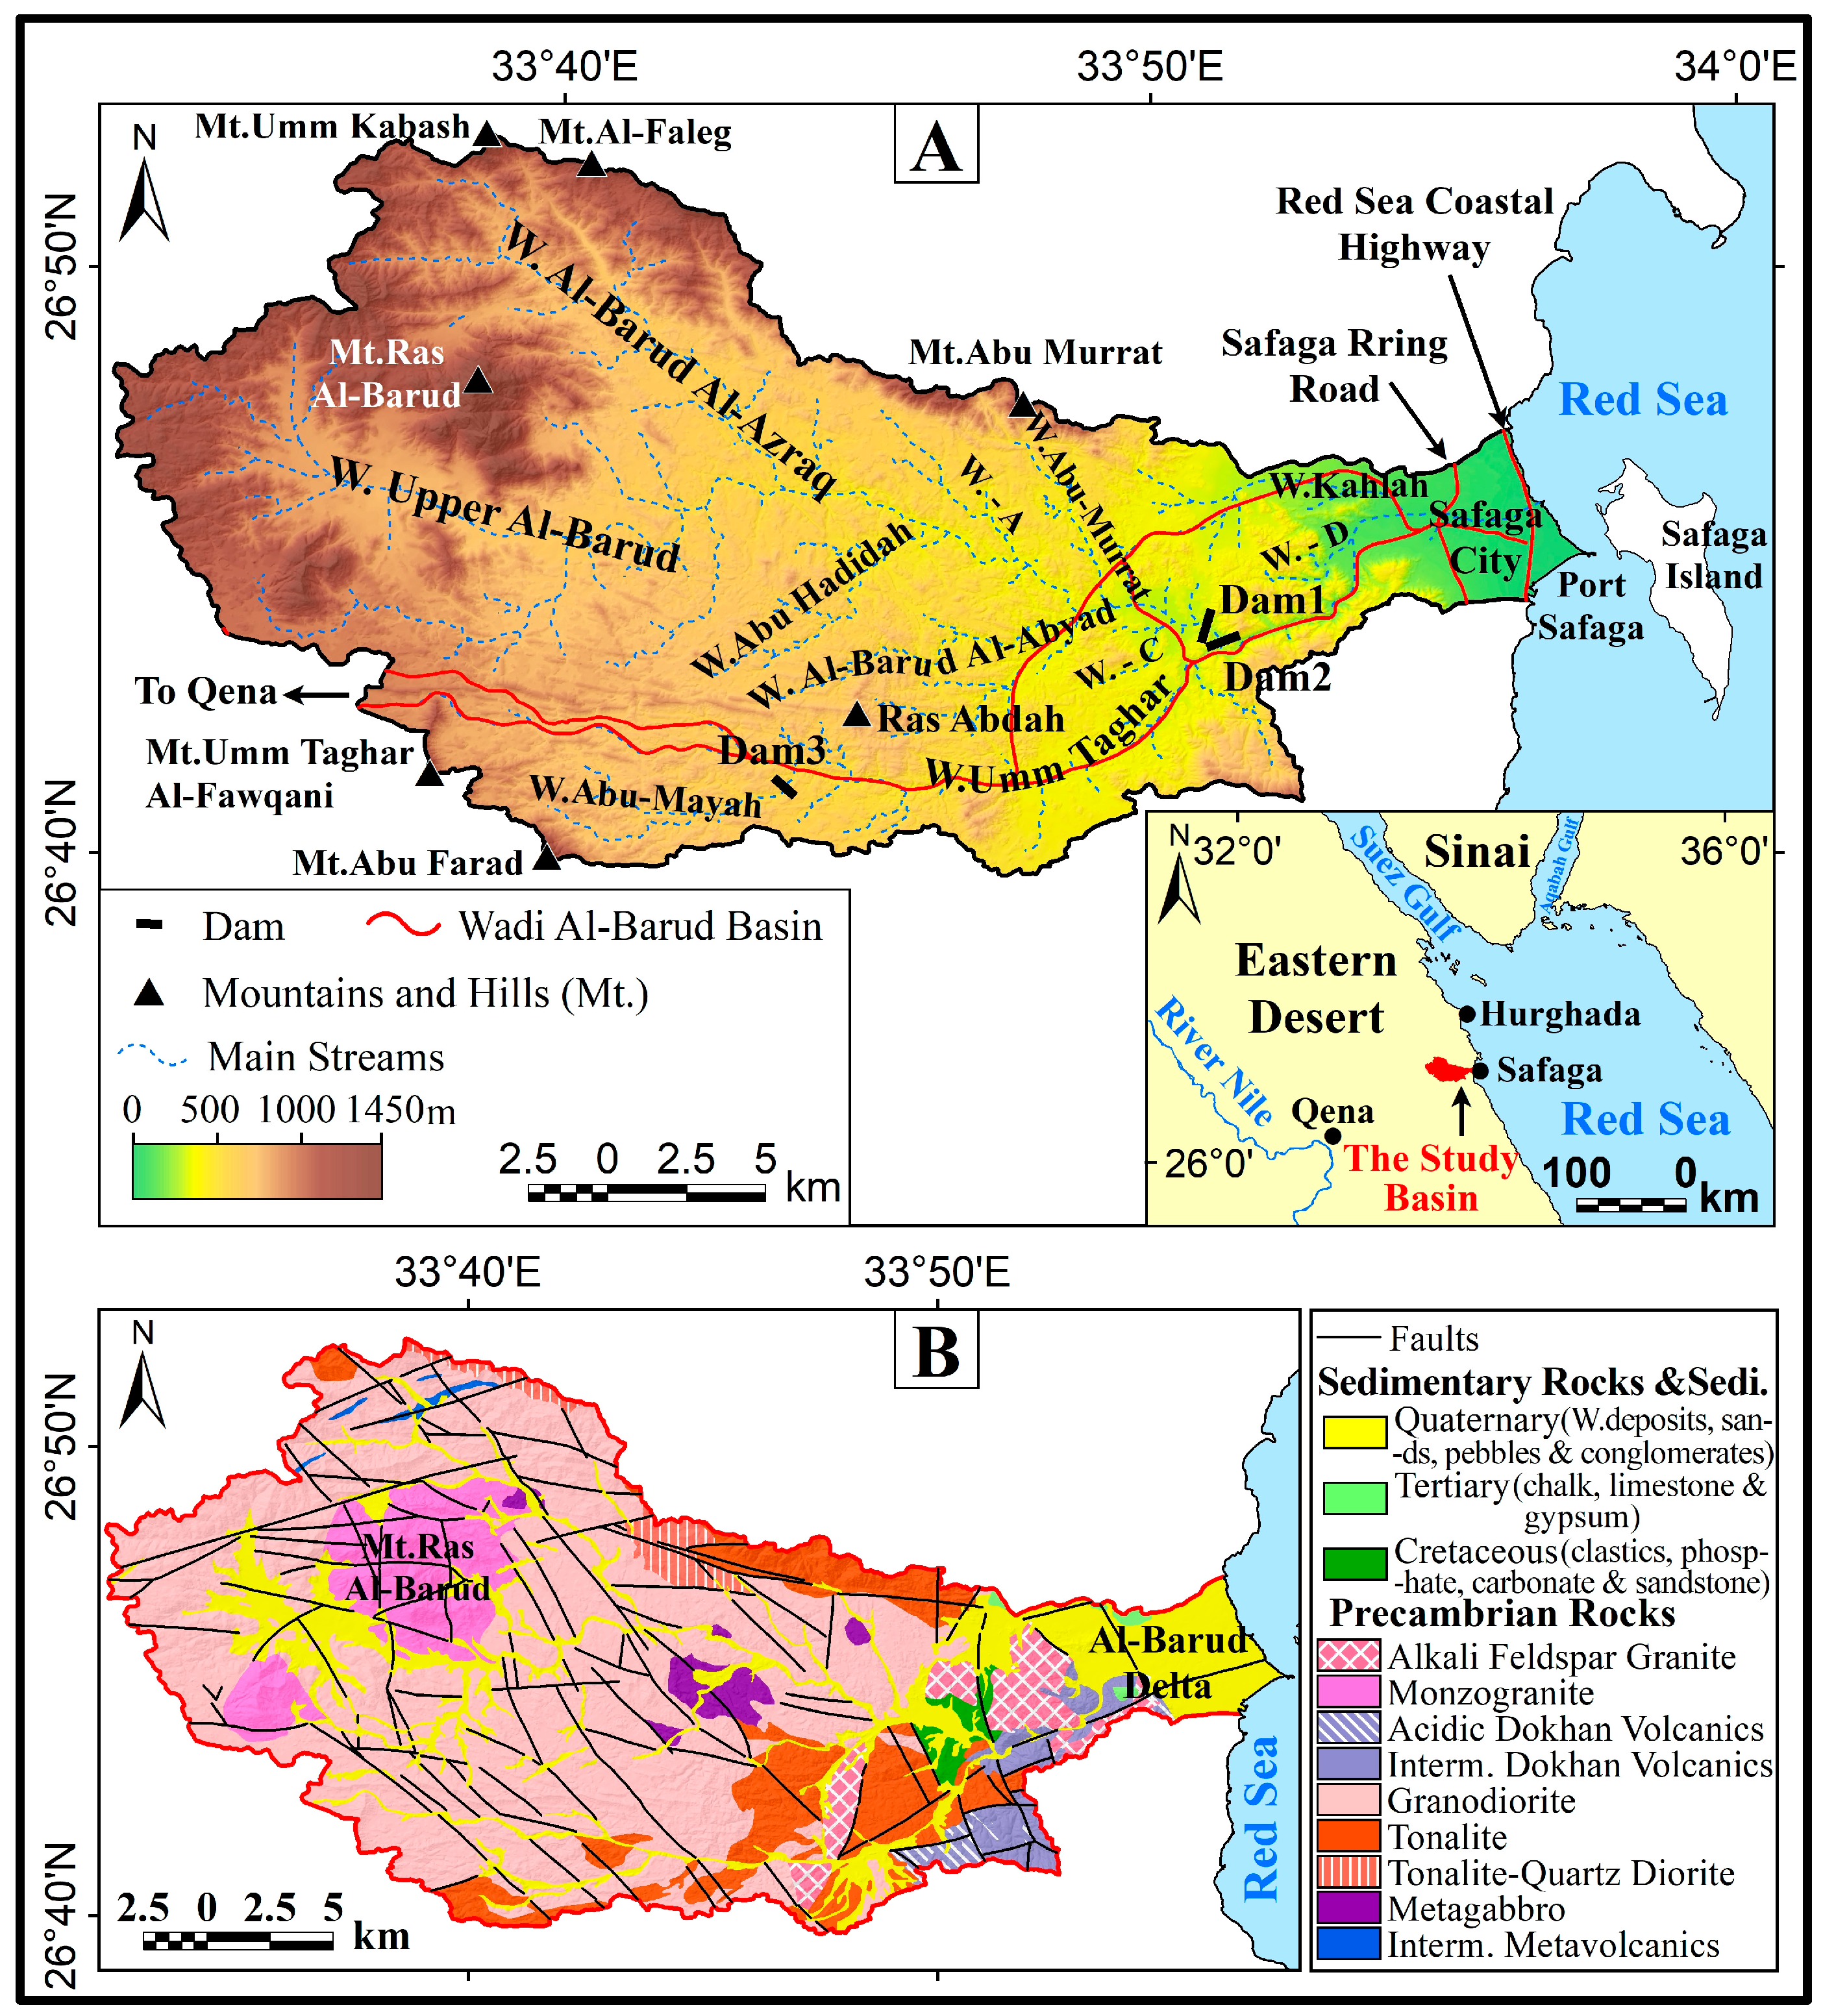
Figure 1. (A) Location map showing the main wadis and mountains and (B) geological map of the study basin.
Hydrology 12 00054 g001
Figure 2. Mixture of weathered rocks piled up on the slopes and talus.
Hydrology 12 00054 g002
Figure 3. (A) Wadi Al-Barud basin and sub-basins, A, B, C, D are defined by the Hydrological Soil Groups (HSGs), as sub-basin classes. (B) Stream orders (Strahler method).
Hydrology 12 00054 g003
Figure 4. (A) The digitized contours and spot heights from topographic maps 1:25.000. (B,D) The surveyed contours for the dam areas (C,E) and the created TIN DEMs.
Hydrology 12 00054 g004
Figure 5. (A) Soil classification map extracted from ALOS radar image; (B) a field photo for coarse- and medium-textured soil at test site no. 3; (C) a field photo for fine-textured soil at test site no. 12; (D) a field photo for coarse-textured soil at test site no. 13; and (E) a field photo for coarse- and medium-textured soil at test site no. 14.
Hydrology 12 00054 g005
Figure 6. A flowchart of the procedures for evaluating the SCS-CN model.
Hydrology 12 00054 g006
Figure 7. (A,B), Rainfall amounts over the study basin on 26–27 October 2016, respectively, with a temporal resolution of 3 h (C).
Hydrology 12 00054 g007
Figure 8. Land cover categories (A) and rain depth (B) in the study basin.
Hydrology 12 00054 g008
Figure 9. Flash flood lakes in front of Dam 1 and Dam 2 ((A) and (B), respectively), and in some separated and dispersed small ponds near Qena–Safaga Highway. Source: Landsat 8 OLI: 11Bands, Path 174, Row42, 1 November 2016. https://earthexplorer.usgs.gov/, accessed on 20 May 2024.
Hydrology 12 00054 g009
Figure 10. Volume of runoff from estimated from SCS-CN against that calculated from TIN DEMs, field investigations, and LS-Nov image.
Hydrology 12 00054 g010
Figure 11. The estimated hydrograph of (A) Wadi Al-Barud basin, (B) Reservoir 1 and 2 contributing areas, (C) Reservoir 3 contributing area.
Hydrology 12 00054 g011
Figure 12. Three-dimensional model of the Wadi Al-Barud Delta and the suggested sites for digging reservoirs.
Hydrology 12 00054 g012
Table 1. Morphometric parameters of Wadi Al-Barud and its sub-basins.
Sub-BasinsArea (km2)Lb (km)W (km)ReRcRhrRnBs
(◦)
ƩNuRbFS
(S/km2)
Dd
(km/km2)
Upper Al-Barud151.619.37.80.410.470.051616.323294.515.45.5
Umm Taghar101.524.54.10.260.220.0327.2173.663.830.28.3
Al-Barud Al-Azraq85.9165.40.370.460.0596.321.214624.3172.7
Al-Barud Al-Abyad30.610.330.340.340.035419.112974.242.49.8
Abu Hadidah22.810.62.10.290.270.0262.714.78133.935.78.5
Kahlah21.49.42.30.310.320.0715.2116093.528.47.6
Abu-Murrat12.37.81.60.280.330.0775.121.94053.4337.9
Al-Dowb8.14.41.90.410.520.1042.712.71593.419.64.9
A147.21.90.330.430.0935.317.24674.433.37.6
B3.840.90.310.420.0452.112.82093.85511.6
C5.24.51.20.320.390.0582.715.82053.839.79.9
D3.73.11.20.390.550.0913.228.31833.650.110.2
Main course59.621.42.80.230.090.023.313.213032.921.96.1
Barud basin520.442.312.30.340.320.038.816.912,5704.221.56.1
Lb, Basin length; W, mean width; Re, ratios of elongation; Rc, circulation; Rhr, relief ratio; Rn, ruggedness number; Bs, average basin slope; ƩNu, number of streams in the basin and their orders; Rb, bifurcation ratio; FS, stream frequency; and Dd, drainage density; A, B, C, D are defined by the Hydrological Soil Groups (HSGs), as sub-basin classes.
Table 2. Rainfall amounts over the study basin on 26–27 October 2016 (103 m3), with a temporal resolution of 3 h.
Time26 October27 OctoberTime26 October27 OctoberTime26 October27 October
0–306.79–1203042.118–2126.60
3–600.712–1503901.221–241168.70
6–90594.115–180113.8Total1195.37658.6
Table 3. Amounts of rainfall, maximum rainfall/day losses, and runoff volume in the study basin and sub-basins.
Sub-BasinRainfall Amounts (103 m3)Max. Rainfall/Day (mm)Losses (103 m3)Runoff (103 m3)
26 October27 OctoberSum26 October27 October
Upper Al-Barud234.22469.42703.5316.42195.4508.1
Umm Taghar264.11380.91645414.61345.5299.4
Al-Barud Al-Azraq138.614061544.72.615.91242.4302.2
Al-Barud Al-Abyad94392.9486.9312.3401.385.6
Abu Hadidah65.3296.2361.53.113.4297.564
Kahlah65.8289.9355.6312.4287.568.2
A40.4187.8228.22.912.618840.1
Abu-Murrat35.5166.7202.22.912.5166.335.9
Al-Dowb21113.1134.12.713.1111.422.7
C1767.484.43.111.968.915.4
B11.748.760.4312.148.911.5
D11.750.962.62.91251.910.7
Main course196788.7984.73.312.6818.1166.6
Al-Barud basin1195.27658.68853.83.716.17223.41630.2
SD88.3736.2814.50.31.4661.3153.4
A, B, C, D are the Hydrological Soil Group (HSG) classes; SD, standard deviations.
Table 4. CN for land cover and HSG.
Land Cover/HSGCNArea%
Roads942.50.48
Urban area9450.96
Coarse-textured soil5915.53
Medium-textured soil4258.411.2
Fine-textured soil4250.39.7
Miocene limestone942.10.44
Cretaceous sandstone592.60.42
Basement rocks9438473.8
Table 5. Surface runoff amount of 27 October 2016 flash flood and the assumption of doubling the amount of rain.
AreaRunoff Volume (×106 m3)Current Storage
Capacity (×106 m3)
26 and 27 October 201625 years50 years100 years
Wadi Al-Barud Basin1.641.83.75.85.275
Reservoirs 1 and 21.161.342.684.34.1
Reservoirs 30.070.090.170.281.175
Wadi Al-Barud main course and Wadi Kahlah0.280.370.851.220
Disclaimer/Publisher’s Note: The statements, opinions and data contained in all publications are solely those of the individual author(s) and contributor(s) and not of MDPI and/or the editor(s). MDPI and/or the editor(s) disclaim responsibility for any injury to people or property resulting from any ideas, methods, instructions or products referred to in the content.