
Stable Isotope Investigations of Icicle Formation and Evolution


Abstract
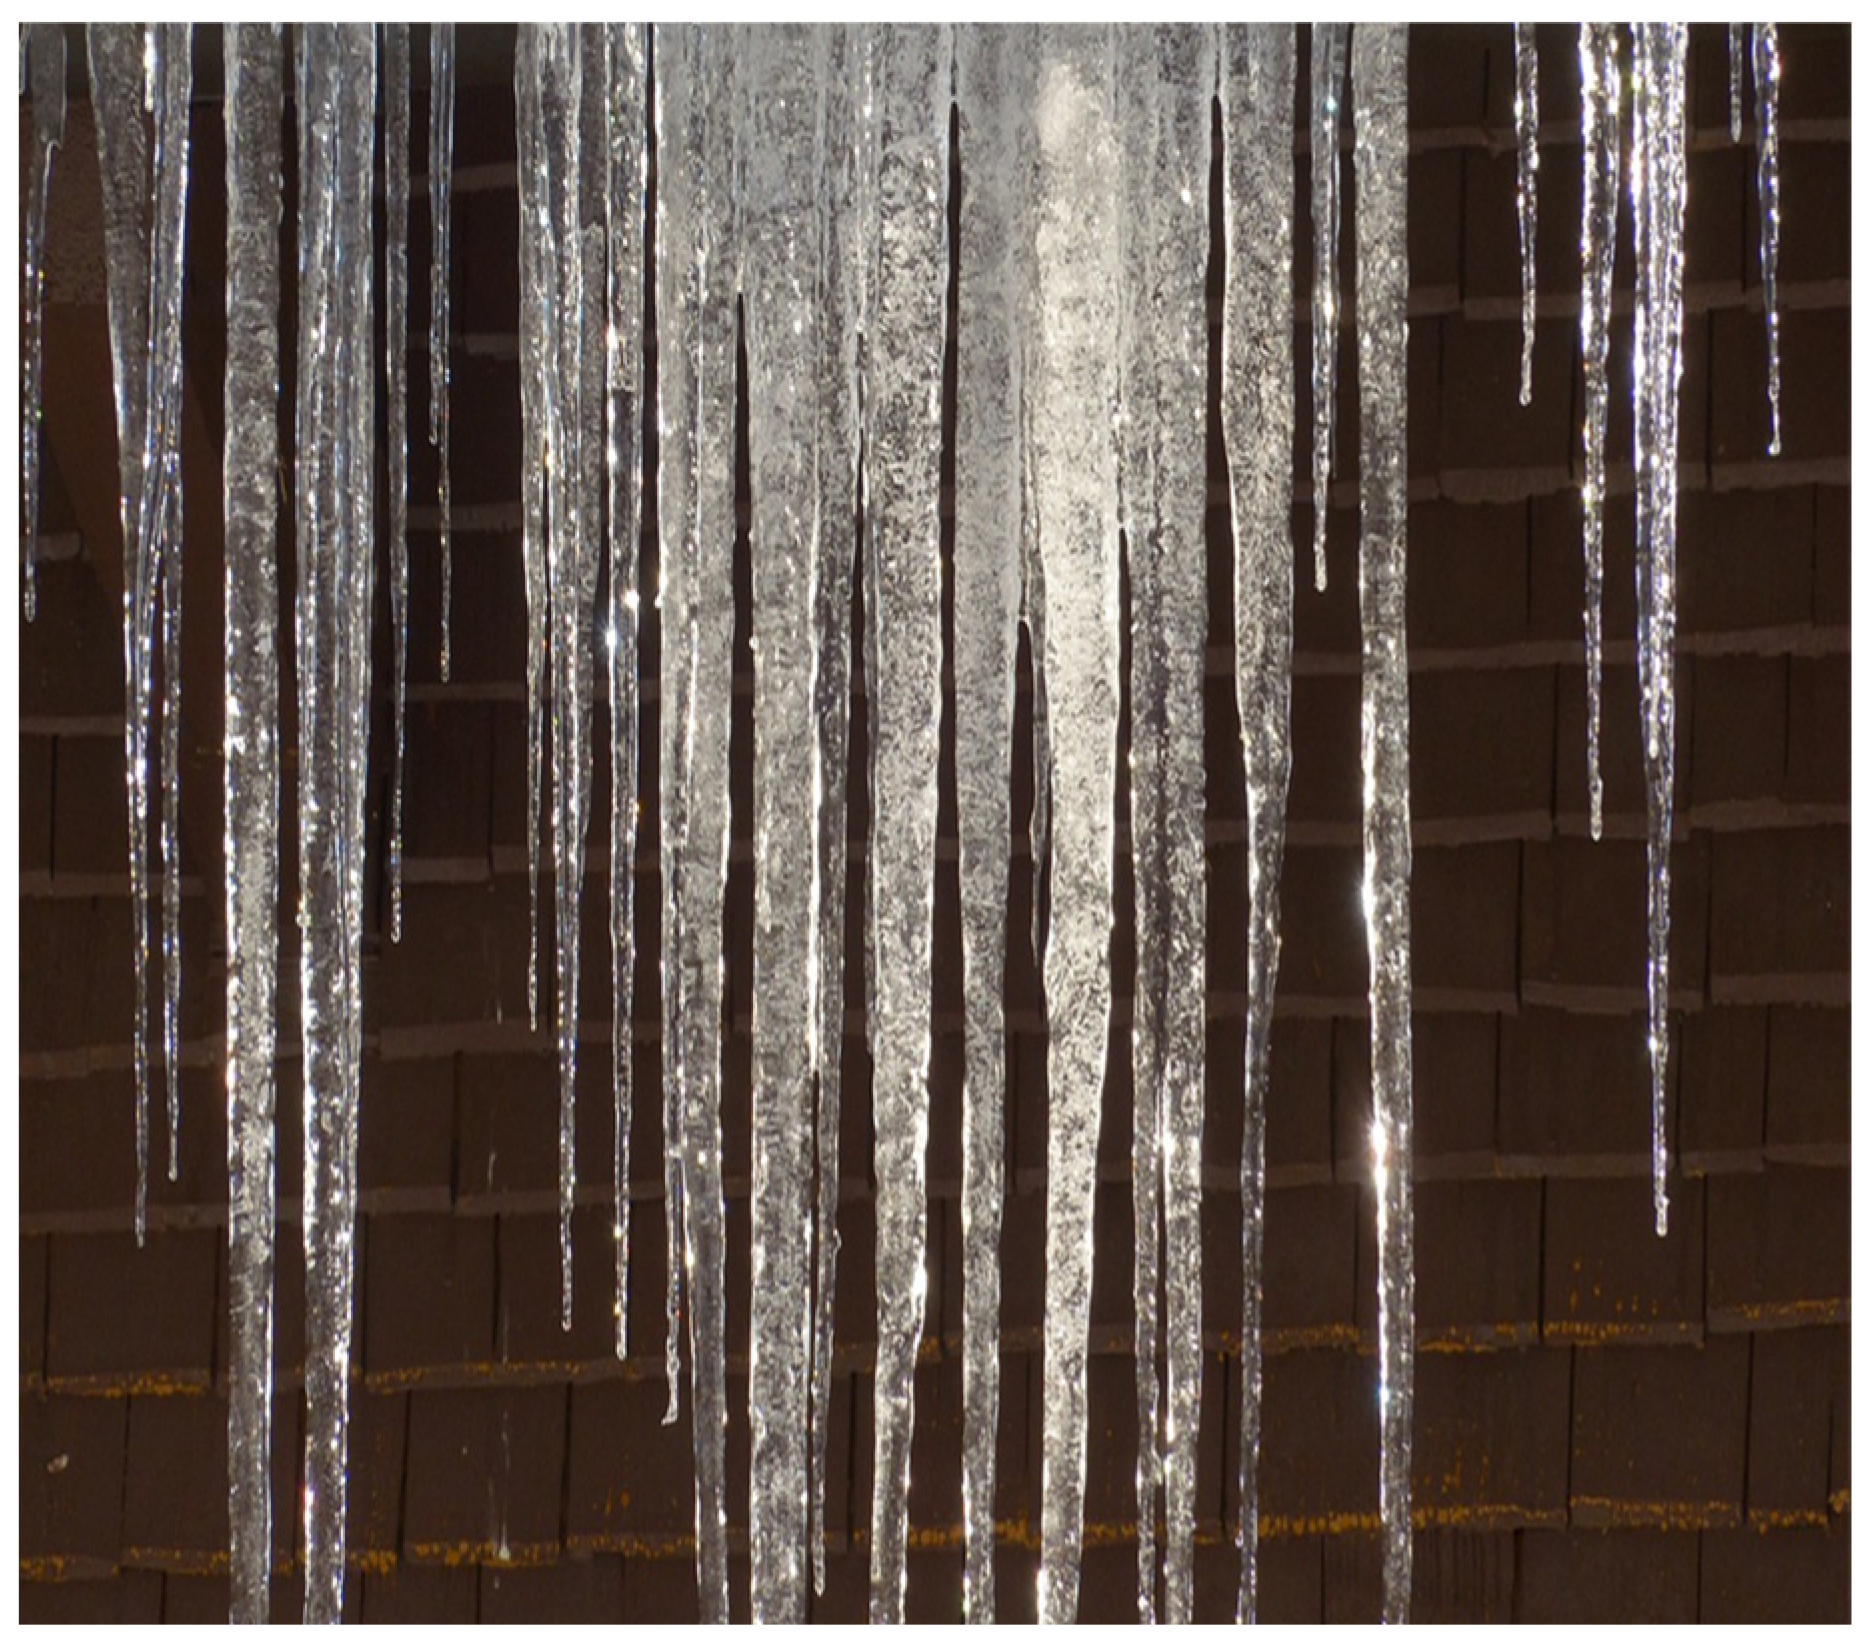
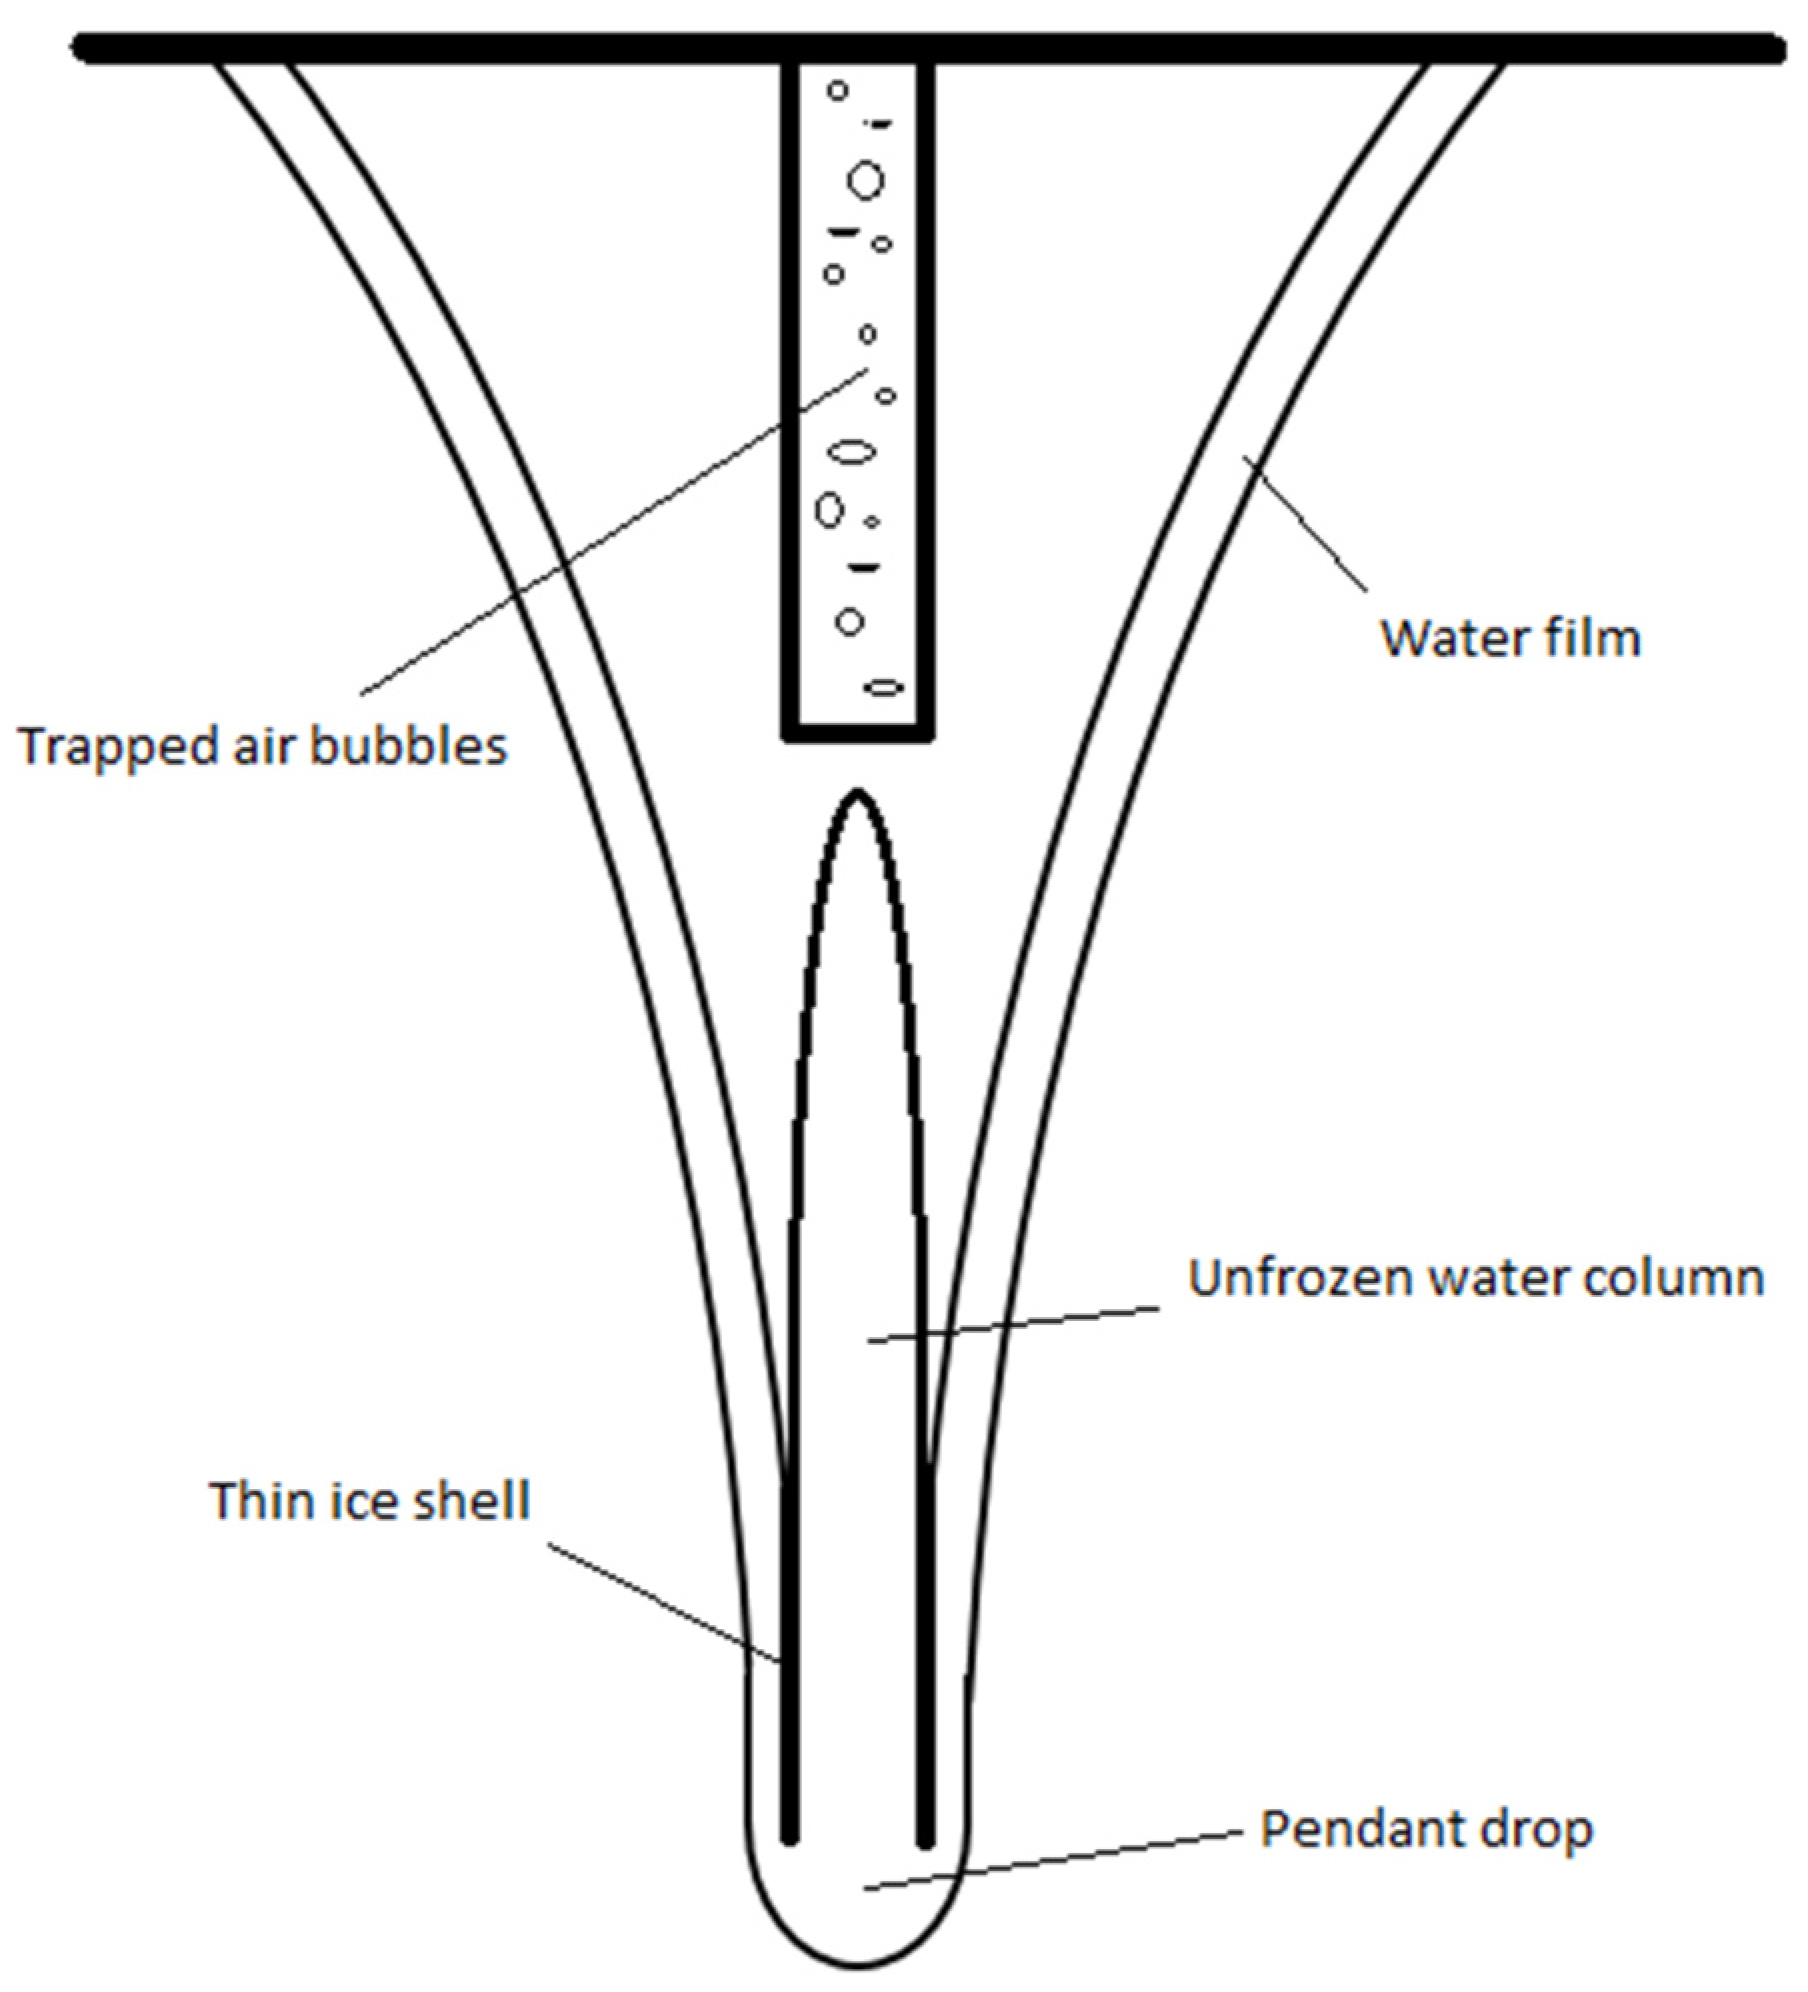
1. Introduction
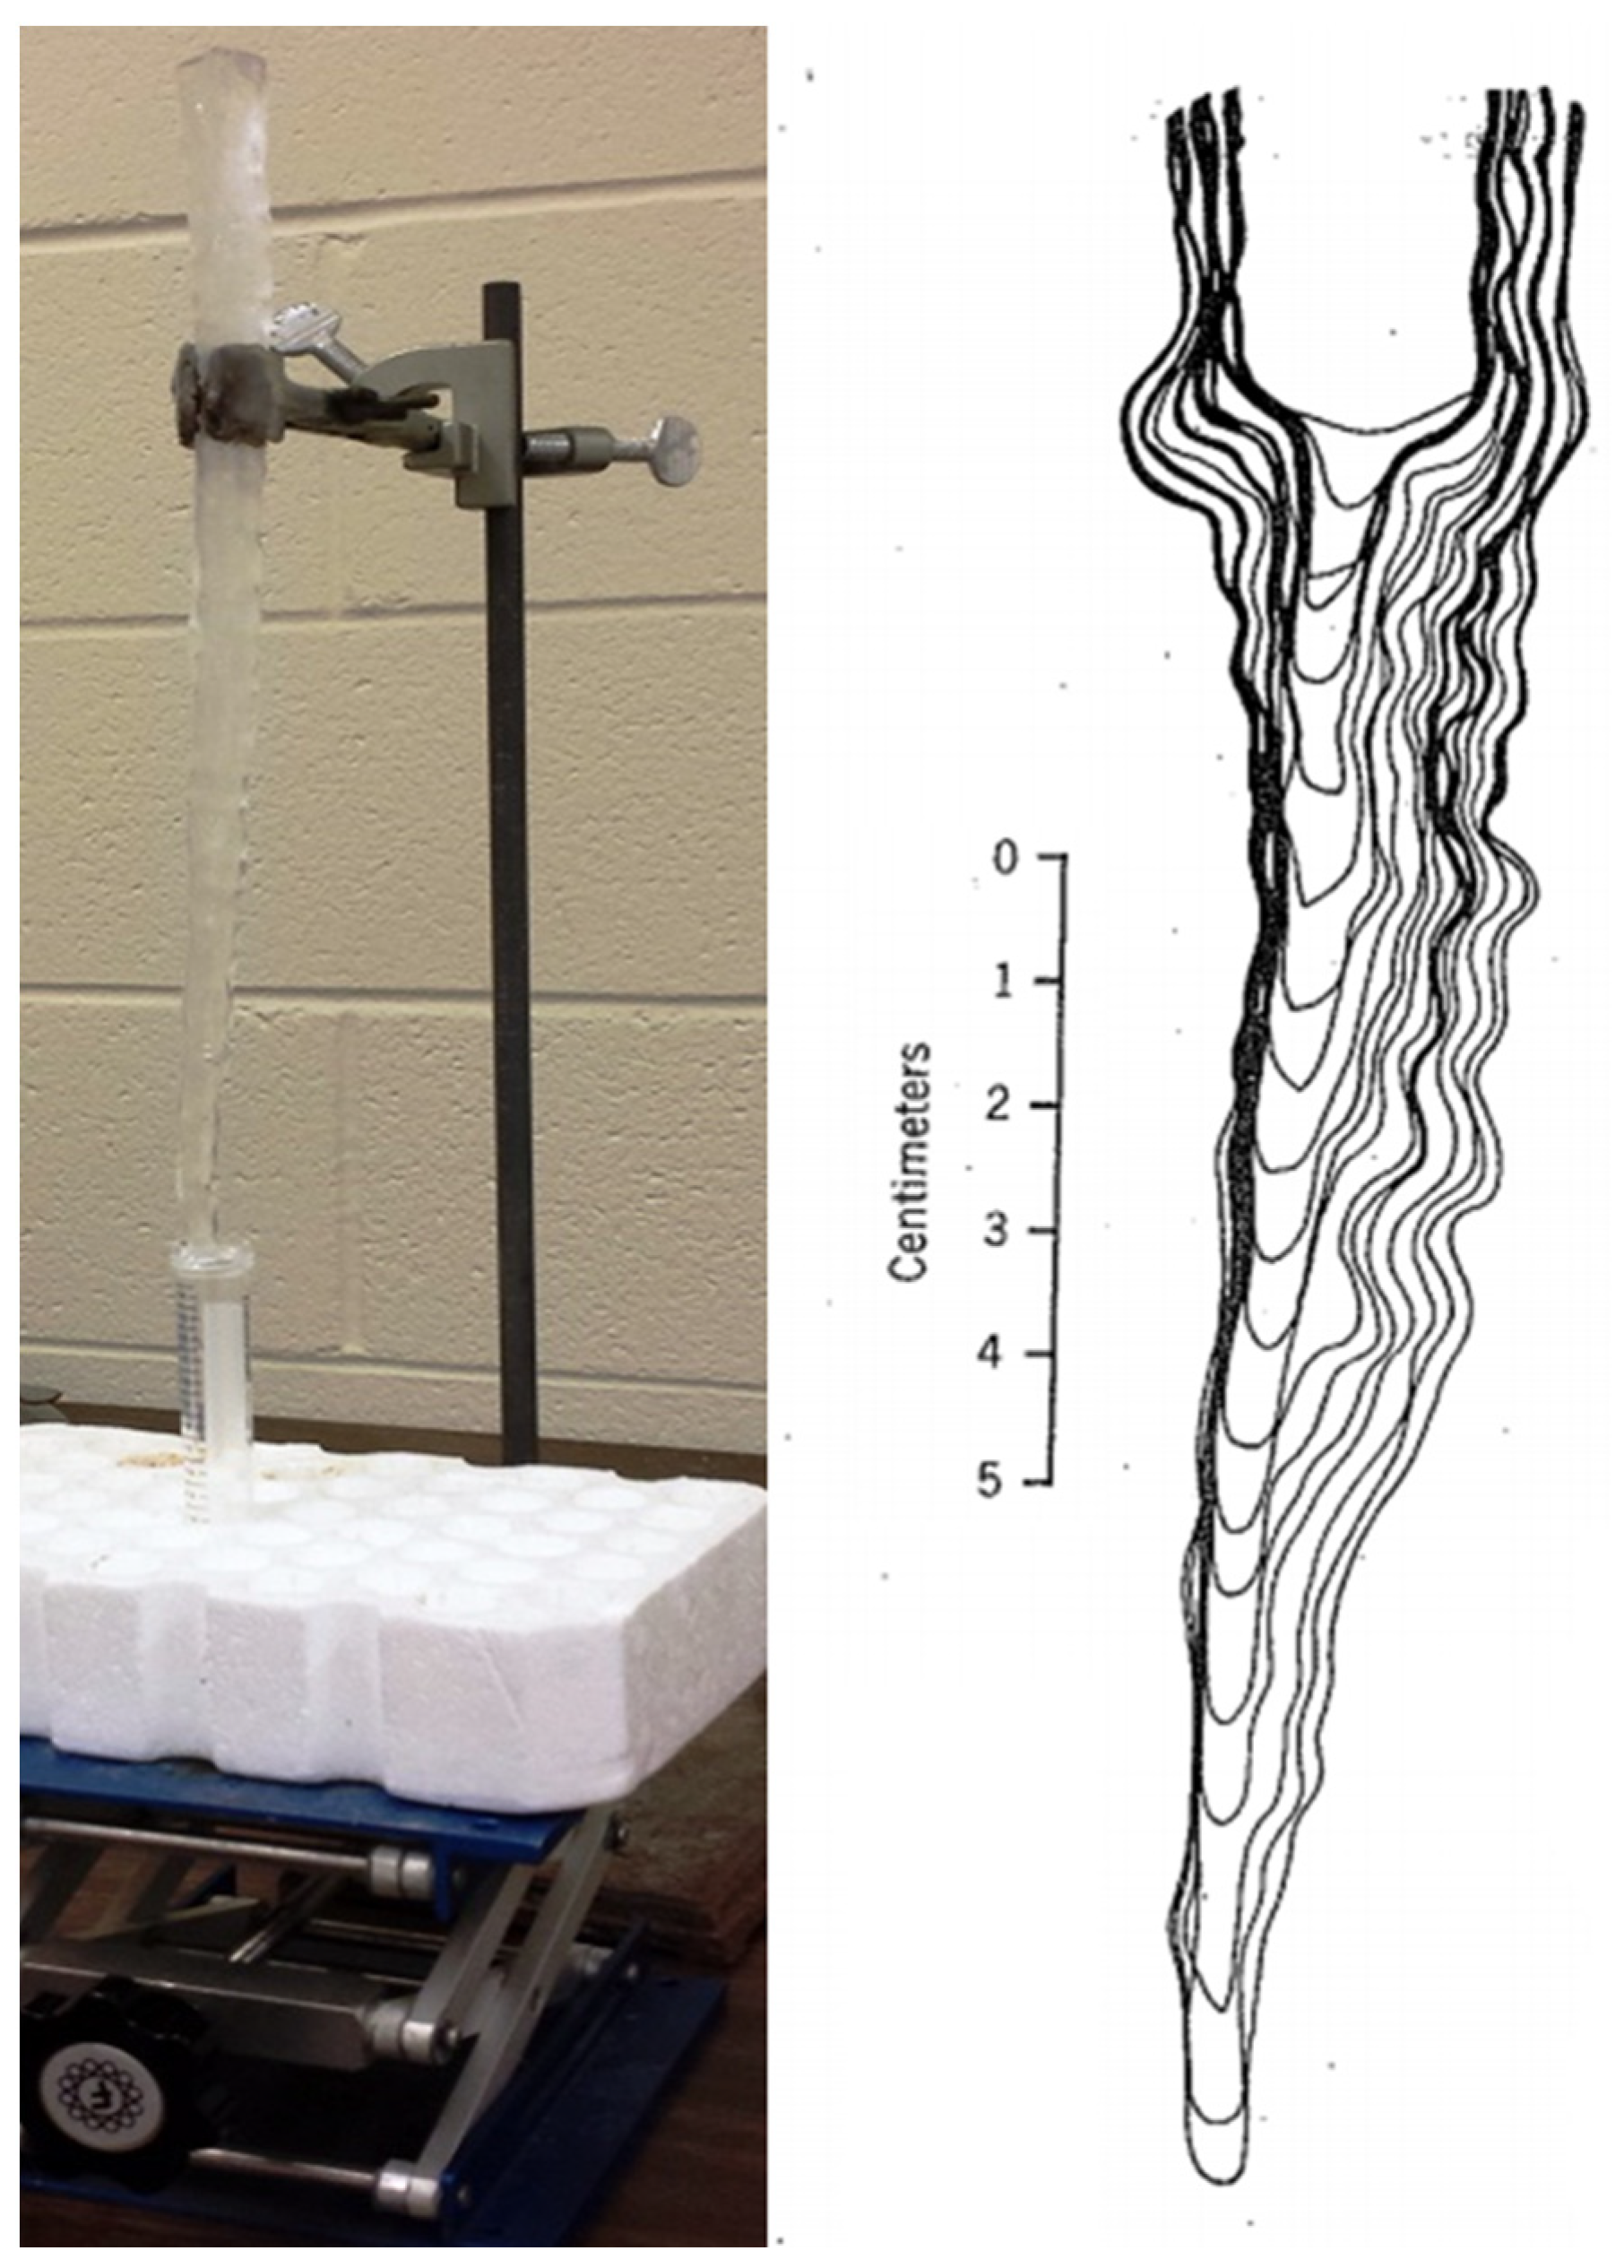
2. Materials and Methods
3. Results
3.1. δ2H–δ18O Relationship
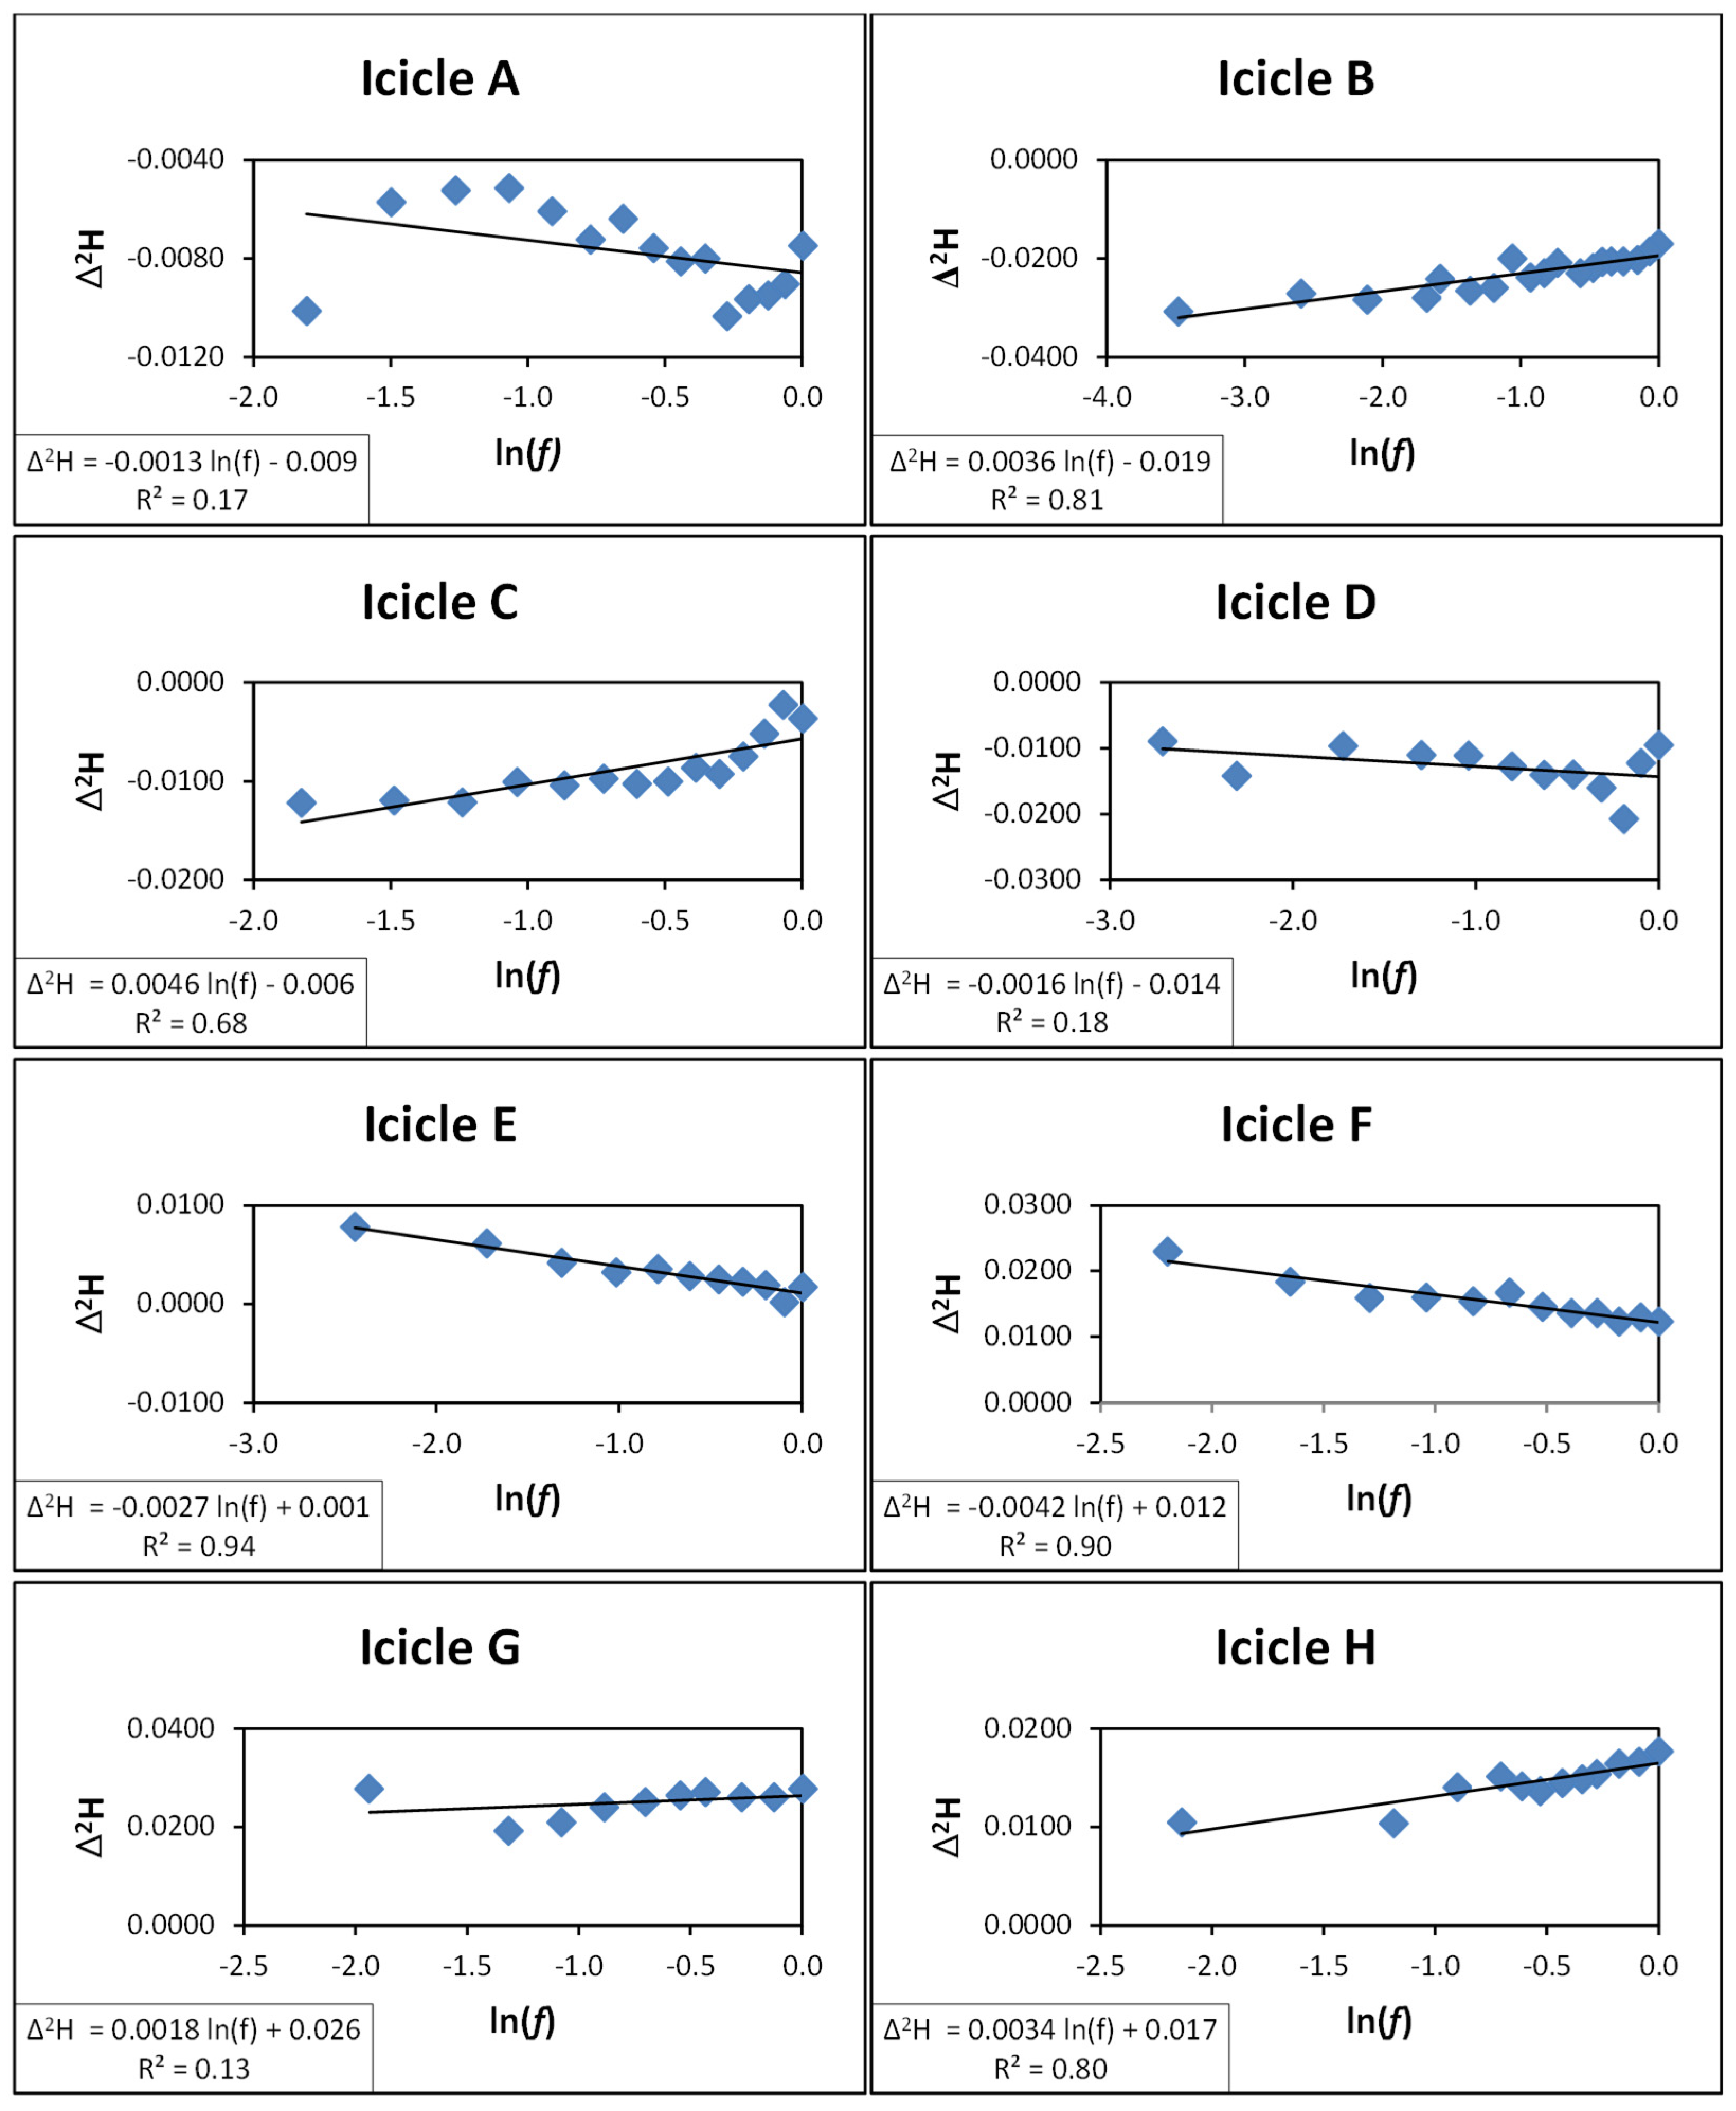
3.2. Isotope Fractionation During Melting and Refreezing
3.3. Model 1
3.4. Model 2
4. Conclusions
Supplementary Materials
Author Contributions
Funding
Data Availability Statement
Acknowledgments
Conflicts of Interest
References
- Short, M.B.; Baygents, J.C.; Goldstein, R.E. A free-boundary theory for the shape of the ideal dripping icicle. Phys. Fluids 2002, 18, 083101. [Google Scholar] [CrossRef]
- Makkonen, L. A model of icicle growth. J. Glaciol. 1988, 34, 64–70. [Google Scholar] [CrossRef]
- Maeno, N.; Makkonen, L.; Nishimura, K.; Kosugi, K.; Takahashi, T. Growth rates of icicles. J. Glaciol. 1994, 40, 226–319. [Google Scholar] [CrossRef]
- Neufeld, J.A.; Goldstein, R.E.; Worster, M. On the mechanisms of icicle evolution. J. Fluid Mech. 2010, 647, 287–308. [Google Scholar] [CrossRef]
- Geer, I.W. The not-so-ordinary icicle. Weatherwise 1981, 34, 257–259. [Google Scholar] [CrossRef]
- Reesman, A.L. Icicles: A guide to the quality and movement of groundwater. Am. Geol. Soc. Abstr. 1973, 5, 777. [Google Scholar]
- Jouzel, J.; Souchez, R.A. Melting-refreezing at the glacier sole and the isotopic composition of the ice. J. Glaciol. 1982, 28, 98. [Google Scholar] [CrossRef]
- Walker, J. Icicles ensheathe a number of puzzles: Just how does the water freeze. Sci. Am. 1988, 258, 114. [Google Scholar] [CrossRef]
- Hatakeyama, H.; Nemoto, S. A note on the formation of horizontal stripes on icicles. Geophys. Mag. 1958, 28, 479–484. [Google Scholar]
- Maeno, N.; Takahashi, T. Studies on icicles: I. General aspects of the structure and growth of an icicle. Low Temp. Sci. 1984, 43, 125–138. [Google Scholar]
- Moser, H.; Stichler, W. Environmental isotopes in ice and snow. In Handbook of Environmental Isotope Geochemistry; Fritz, P., Fontes, J.C., Eds.; Elsevier: Amsterdam, The Netherlands, 1980; Volume 1, pp. 141–178. [Google Scholar]
- Van Belle, G. Statistical Rules of Thumb; John Wiley and Sons: New York, NY, USA, 2002. [Google Scholar]
- Berman, E.S.; Levin, N.E.; Landais, A. Measurement of δ18O, δ17O, and 17O-excess in Water by Off-Axis Integrated Cavity Output Spectroscopy and Isotope Ratio Mass Spectrometry. Anal. Chem. 2013, 85, 10392–10398. [Google Scholar] [CrossRef] [PubMed]
- Barnett, V.; Lewis, T. Outliers in Statistical Data; John Wiley and Sons: New York, NY, USA, 1994. [Google Scholar]
- Craig, H. Isotopic variations in meteoric waters. Science 1961, 133, 1702–1703. [Google Scholar] [CrossRef] [PubMed]
- Hurst, S.; Krishnamurthy, R.V. Stable Isotopes in Precipitation. In Encyclopedia of Water: Science, Technology, and Society; Patricia, A.M., Ed.; John Wiley & Sons: Hoboken, NJ, USA, 2019. [Google Scholar]
- Dansgaard, W. Stable isotopes in precipitation. Tellus A 1964, 16, 436–468. [Google Scholar] [CrossRef]
- Machavaram, M.; Krishnamurthy, R.V. Survey of Factors controlling the stable isotope ratios in precipitation in the Great Lakes region. Israel J. Earth Sci. 1994, 43, 195–202. [Google Scholar]
- Búason, T. Equation of isotope fractionation between ice and water in a melting snow column with continuous rain and percolation. J. Glacio. 1972, 11, 387–405. [Google Scholar] [CrossRef]
- Suzuoki, T.; Kimura, T. D/H and 18O/16O fractionation in ice-water system. J. Mass Spec. Soc. Japan 1973, 21, 229–233. [Google Scholar] [CrossRef]
- Michel, F.A. Isotope geochemistry of frost-blister ice, North Fork Pass, Yukon, Canada. Can. J. Earth Sci. 1986, 23, 543–549. [Google Scholar] [CrossRef]
- Arnason, B. Equilibrium constant for the fractionation of deuterium between ice and water. J. Phys. Chem. 1969, 73, 3491–3494. [Google Scholar] [CrossRef]
- Souchez, R.; Tison, J.L.; Jouzel, J. Freezing rate determination by the isotopic composition of ice. Geophys. Res. Lett. 1987, 14, 599–602. [Google Scholar] [CrossRef]
- O’Neil, J.R. Hydrogen and oxygen isotope fractionation between ice and water. J. Phys. Chem. 1968, 72, 3683–3684. [Google Scholar] [CrossRef]
- Posey, J.C.; Smith, H.A. The equilibrium distribution of light and heavy waters in a freezing mixture. J. Am. Chem. Soc. 1957, 79, 555–557. [Google Scholar] [CrossRef]


| Icicle | Slope | α |
|---|---|---|
| A | −0.0013 | 0.9987 |
| B | 0.0036 | 1.0036 |
| C | 0.0046 | 1.0046 |
| D | −0.0016 | 0.9984 |
| E | 0.0027 | 0.9973 |
| F | 0.0042 | 0.9958 |
| G | 0.0018 | 1.0018 |
| H | 0.0034 | 1.0034 |
| Average | 0.0005 | 1.0005 |
Disclaimer/Publisher’s Note: The statements, opinions and data contained in all publications are solely those of the individual author(s) and contributor(s) and not of MDPI and/or the editor(s). MDPI and/or the editor(s) disclaim responsibility for any injury to people or property resulting from any ideas, methods, instructions or products referred to in the content. |
© 2025 by the authors. Licensee MDPI, Basel, Switzerland. This article is an open access article distributed under the terms and conditions of the Creative Commons Attribution (CC BY) license (https://creativecommons.org/licenses/by/4.0/).
Share and Cite
Brubaker, T.; Krishnamurthy, R.V. Stable Isotope Investigations of Icicle Formation and Evolution. Hydrology 2025, 12, 30. https://doi.org/10.3390/hydrology12020030
Brubaker T, Krishnamurthy RV. Stable Isotope Investigations of Icicle Formation and Evolution. Hydrology. 2025; 12(2):30. https://doi.org/10.3390/hydrology12020030
Chicago/Turabian StyleBrubaker, Thomas, and R. V. Krishnamurthy. 2025. "Stable Isotope Investigations of Icicle Formation and Evolution" Hydrology 12, no. 2: 30. https://doi.org/10.3390/hydrology12020030
APA StyleBrubaker, T., & Krishnamurthy, R. V. (2025). Stable Isotope Investigations of Icicle Formation and Evolution. Hydrology, 12(2), 30. https://doi.org/10.3390/hydrology12020030