Article

Groundwater Recharge Estimation Based on Environmental Isotopes, Chloride Mass Balance and SWAT Model in Arid Lands, Southwestern Saudi Arabia

1
Water Research Center, King Abdulaziz University, P.O. Box 80200, Jeddah 21598, Saudi Arabia
2
Hydrology Department, Desert Research Centre, Cairo 11753, Egypt
3
Earth Science Department, Faculty of Science, Damanhour University, Damanhour 22516, Egypt
4
Department of Water Resources, Faculty of Environmental Sciences, King Abdulaziz University, P.O. Box 80200, Jeddah 21598, Saudi Arabia
5
Institute of Geological Sciences, Freie Universitaet Berlin, 14195 Berlin, Germany
6
Depaetement of Applied Geoscience, German University of Technology in Oman (GUtech), P.O. Box 1816, Muscat PC 130, Oman
7
Department of Environment, Faculty of Environmental Sciences, King Abdulaziz University, P.O. Box 80200, Jeddah 21598, Saudi Arabia
*
Author to whom correspondence should be addressed.
Hydrology 2025, 12(11), 306; https://doi.org/10.3390/hydrology12110306
Submission received: 21 October 2025 / Revised: 13 November 2025 / Accepted: 14 November 2025 / Published: 16 November 2025

Abstract

Estimated groundwater recharge is considered the essential factor for groundwater management and sustainability, especially in arid lands such as the Kingdom of Saudi Arabia (KSA). Consequently, assessing groundwater recharge is a key process for forecasting groundwater accessibility to sustain safe withdrawal. So, this study focused on environmental isotopes, the chloride mass balance (CMB) method, and a SWAT model by integrating GIS with hydrological and hydrochemical techniques to detect the origin of coastal aquifer groundwater and to compute the recharging rate in the study area. This study is based on the results of chemical analysis of 78 groundwater samples and environmentally stable isotopes, including deuterium (2H) and oxygen-18O, in 29 representative samples. The results revealed that the origin of groundwater recharge comes through precipitation, where the ranges of δ18O and δ2H isotopes in the analyzed groundwater were from −1.10‰ to +1.03‰ and from −0.63‰ to 11.63‰, respectively. The CMB finding for estimating the average recharge is 3.57% of rainfall, which agrees with a previous study conducted in the wadi Qanunah basin (north of the study area), where the estimated average value of recharge was 4.25% of rainfall. Meanwhile, the estimated annual recharge using a SWAT model ranged between 1 mm and 16.5 mm/year at an average value of approximately 8.75 mm/year. The results obtained by the two techniques are different due to some reasons such as the presence of additional chloride sources, as well as evaporation. Outputs of this study will be valuable for the local community, officials, and decision-makers who are concerned with groundwater resources.

1. Introduction

The availability of water resources is a challenge worldwide, particularly in semi-arid and arid countries such as the KSA, due to the increasing populations and living conditions, in addition to climate change [1]. In the KSA, groundwater is regarded as the primary natural source of water resources. However, this source is subjected to extreme overpumping, which leads to lowering of the water table. One of the main factors which is very necessary for groundwater management and the safe production of pumped water is the calculated recharge rate to the aquifer. Groundwater recharge is a hydrological process that occurs when water infiltrates the ground and reaches the saturation zone. This process is initiated by surface precipitation, followed by water infiltration into the root zone. Groundwater recharge is one of the least understood components of the hydrologic cycle, as it is highly variable spatially and temporally and difficult to measure directly. Groundwater recharge estimation is crucial for water resource management, especially in arid and semi-arid regions such as the KSA.
Various approaches are applied to assess groundwater recharge, for instance, experimental methods, water budget techniques, application of the Darcy law in the root zone, isotopic tracers, and traceability techniques [2,3,4,5]. Fritz and Fontes [6] reported that the recharge rate percentage in arid and semi-arid regions ranges between 1% and 30% of the rainfall amount. Some researchers have studied groundwater recharge using tracer techniques, for instance, environmental isotopes and CMB [7,8,9,10,11,12]. The results were analyzed and suggested that the groundwater recharge in southwest KSA is about 1.4 mm per year, and this amount enhances the water level, especially in wet periods. Other researchers concluded that the recharge amount in semi-arid regions ranges from 2% to 4% of the average rainfall. According to [13,14,15,16], the estimation methods can be classified into two categories: direct such as lysimeters and tracer injection tests and indirect such as hybrid/inferential. One common and straightforward method is the chloride mass balance (CMB). This is because the chloride ion is generally considered non-reactive over a wide range of time and space: it does not evaporate or become consumed by biological activity in significant quantities, so it concentrates when evaporation or runoff occurs. The basic principle is that the amount of chloride entering the aquifer with rainfall is distributed through surface and groundwater pathways. By comparing the chloride concentration in the rainwater with its concentration in the aquifer, the amount of water that has infiltrated (recharged) can be estimated.
On the other hand, the SWAT model is an integrated basin-level hydrological model that simulates surface and sectoral processes: precipitation, surface runoff, infiltration, and evapotranspiration. SWAT can estimate deep infiltration or leaching to the aquifer at the level of each hydrological management unit (HRU). Combining CMB and SWAT provides strength: CMB offers a simple and realistic field constraint on the recharge rate, and SWAT provides a spatial and temporal understanding of how-and-where mechanisms and the impact of land use and climate. Numerous methods exist for assessing groundwater origins and the average age, or mean residence time, within the aquifer system. Environmental isotopic tracers utilized by evaluating groundwater recharge and age can be categorized into radioactive isotopes, event markers, and radiogenic tracers [7]. Commonly, groundwater origin and age are almost determined by environmental isotopes, such as deuterium (2H), oxygen-18 (18O), tritium (3H), carbon-13 (13C), and carbon-14 (14C) in groundwater samples [7].
In the KSA, many researchers have conducted hydrology and hydrogeology studies concerning the evaluation of water quality and the conservation of water resources in wadis [15,17,18,19,20,21,22,23,24,25,26,27,28,29,30,31,32]. Most of these studies reported that the drainage basins initiated along the Red Sea coast from the upper stream portions at the basement complex of the Arabian Shield and drain their water toward the west (Red Sea). The basement complex is overlayed by sedimentary deposits such as Quaternary and wadi filling. Sources of groundwater contamination are of natural origin, although there is noteworthy wastewater seepage discharge, which is responsible for the groundwater deterioration. On the other hand, there is a large gap in groundwater recharge investigation in the KSA. The geological complexity, lack of information, low rainfall, and the several mechanisms that interact to move water through the system pose a challenge for estimating the groundwater recharge. The novelty of this research, compared with the previous research, is that two methods are employed: chloride mass balance (CMB) and a SWAT model are combined to simulate and estimate groundwater recharge rates in a study basin. Rainfall and groundwater chloride concentration measurements serve as a direct field constraint to quantify the amount of water infiltrating the aquifer, while the SWAT model provides spatial and temporal interpretation of deep infiltration mechanisms and the effects of land use and climate on recharge. The integration of CMB and SWAT offers practical and reliable value to decision-makers in water resource planning and management and suggests improvements to monitoring networks to reduce uncertainty in future estimates.
The problem in this study is that there is remarkable decline in water levels with pumping in many places, increasing salinity and desertification in some areas due to continuous pumping without any information about the annual rate of recharge. The live activities in the study area which depend mainly on groundwater (domestics and agriculture) can be maintained through proper management of groundwater storage, without major issues. However, the assessing of recharge rates in arid regions includes a large range of ambiguity due to the limited amount of annual precipitation in addition to a higher amount of annual evaporation. Therefore, understanding groundwater recharge is essential to ensuring sustainable water management. Combining the outcomes of the CMB method with the outputs of the SWAT model and environmental isotopes can enhance the accuracy of estimates, contribute to a comprehensive understanding of the water balance in arid regions, and assist decision-makers in developing effective water resource management policies. Therefore, this research deals with the assessment of recharging a shallow groundwater aquifer via environmental isotopes such as deuterium (2H) and oxygen-18 (18O), chloride mass balance (CMB), and soil and water assessment tool (SWAT) model, as well as geographic information system (GIS) and hydrochemical studies. These techniques depend on measurable parameters such as annual rainfall and chloride anion concentrations in that rainfall and in the groundwater of the aquifers in the study drainage basins.
The aims of this study are to provide an accurate estimation of groundwater recharge rates using two approaches (CMB and SWAT model), as well as environmental isotopes (18O and 2H), to confirm the origin of groundwater and how it is affected by evaporation. The scientific results obtained may support and contribute to making sound decisions in water resources management, optimal use and sustainable development of water and soil, and accurate prediction of aquifer behavior, particularly with pumping under climate change conditions, as well as improving the quantity and quality of groundwater for enhancing water security in the KSA.

2. Study Area

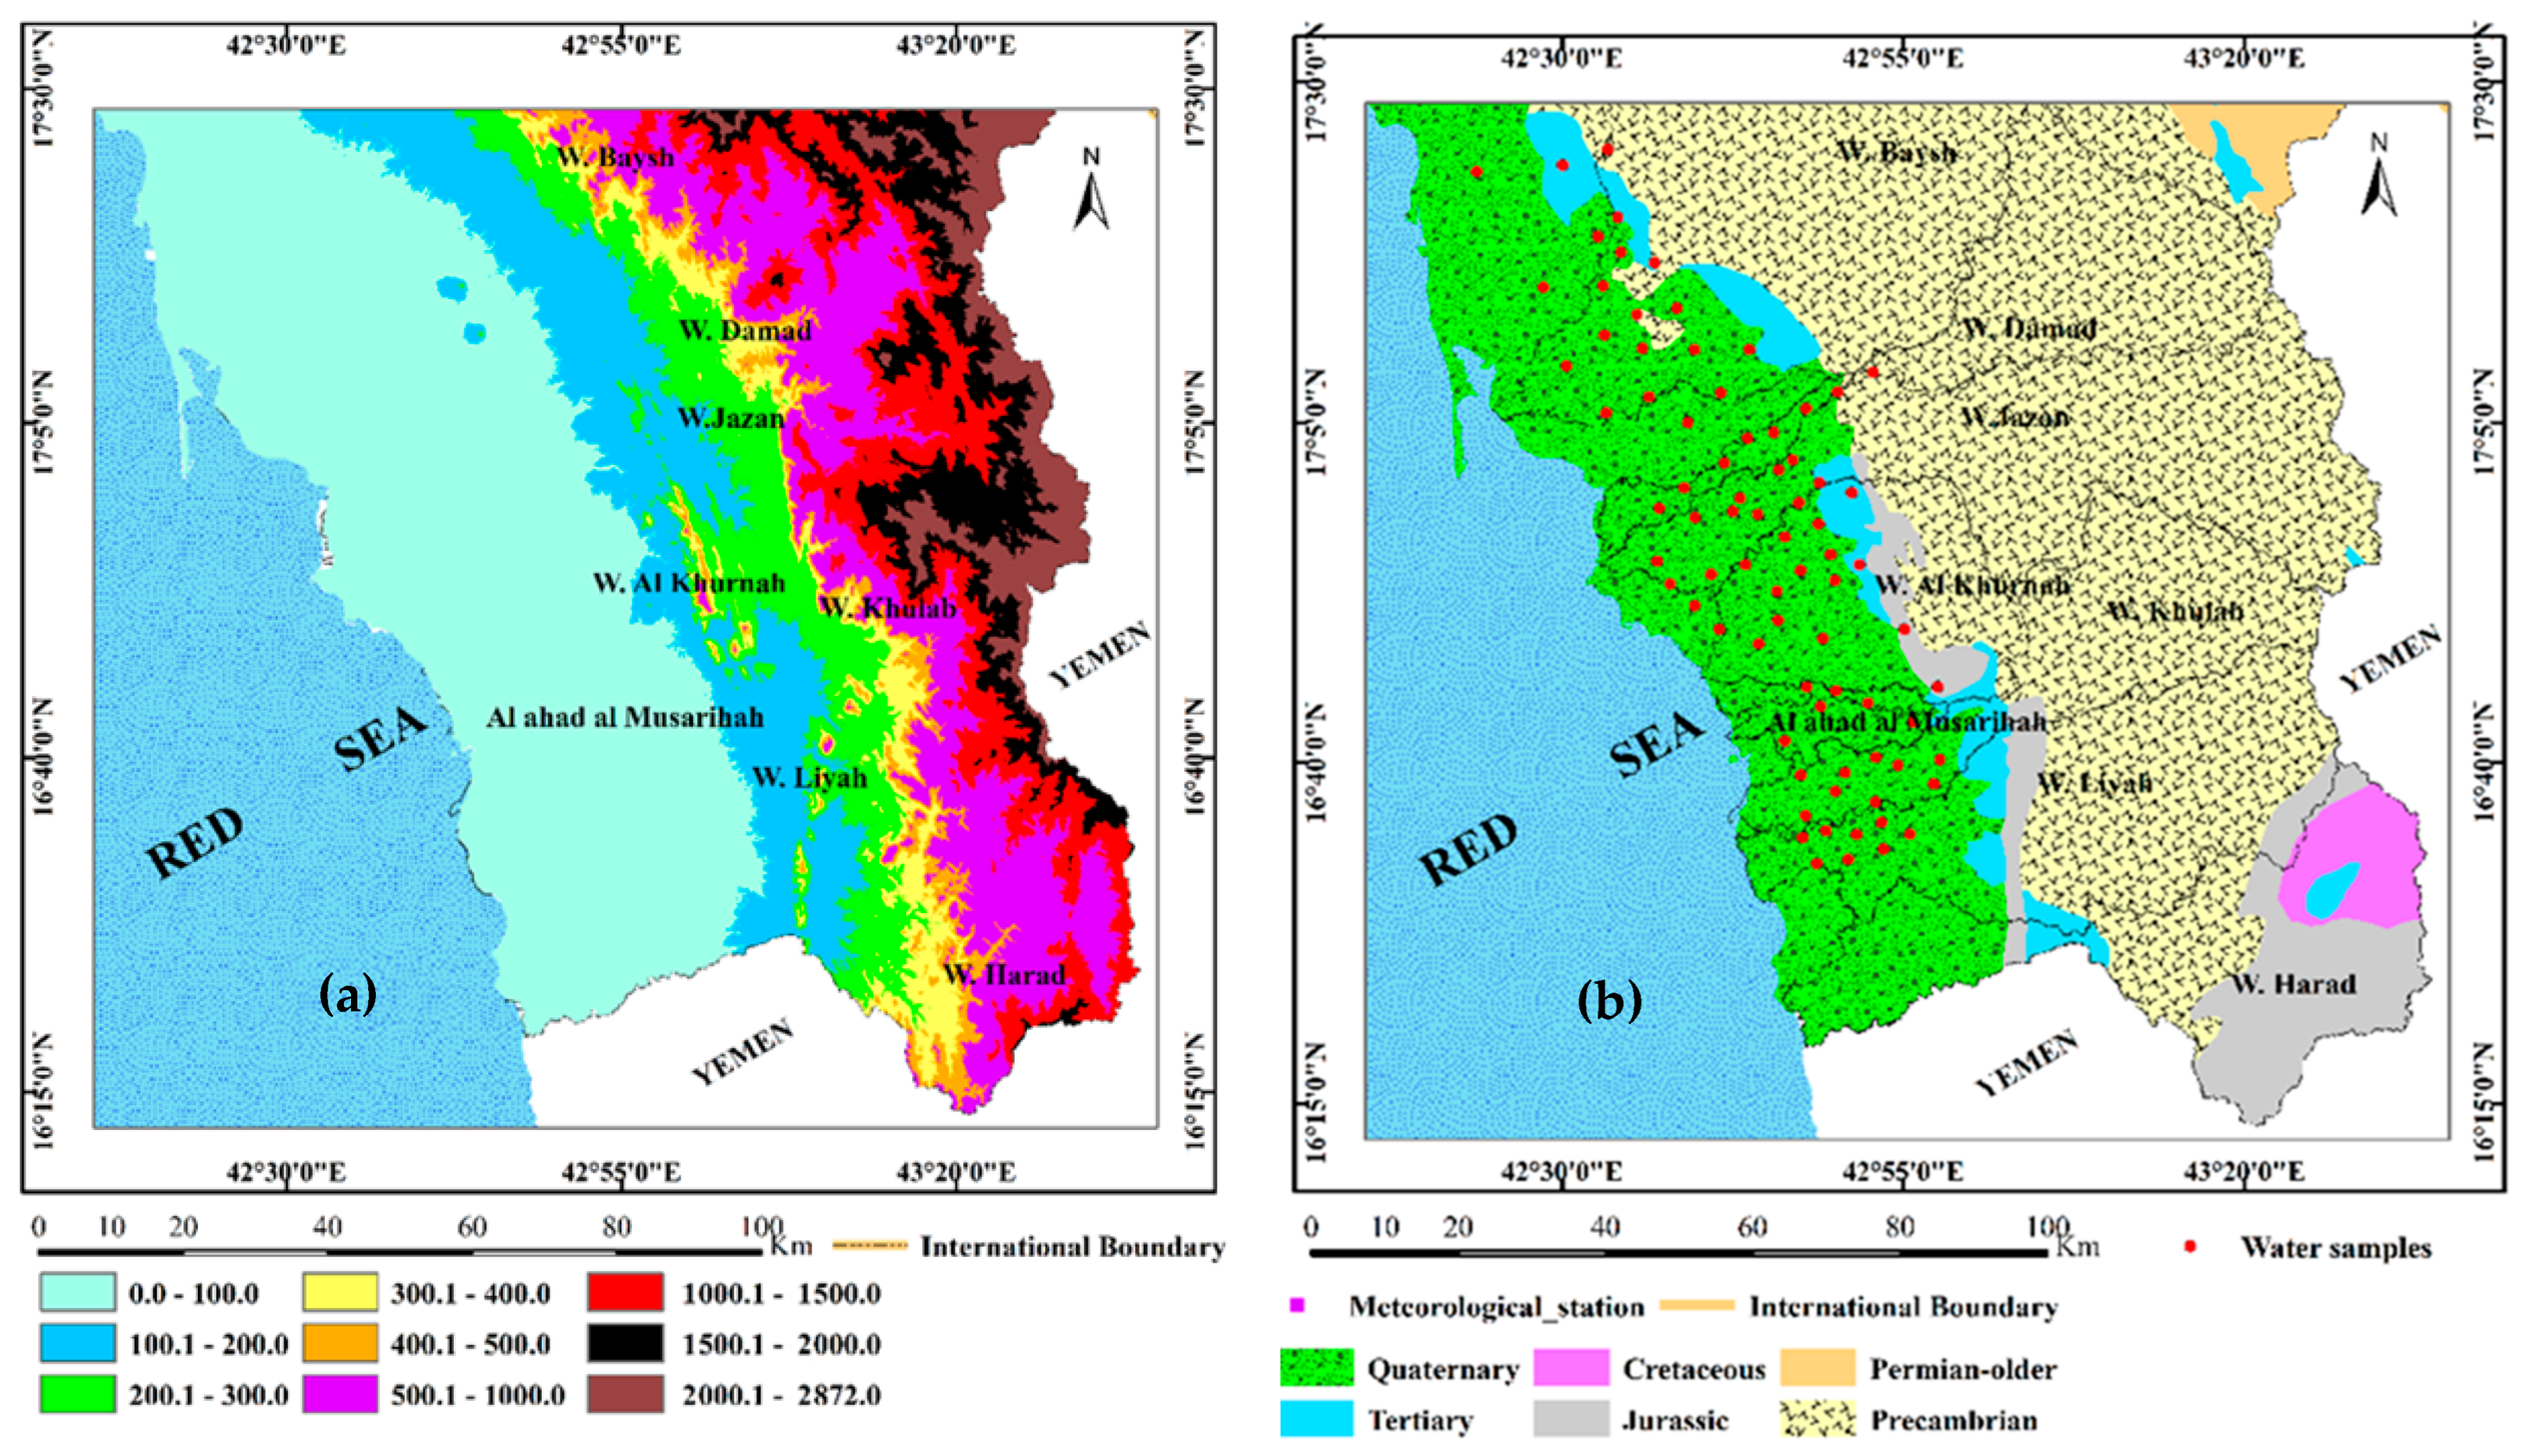
The study focused on a major part of the Jazan Province, in southwestern KSA. It occupies an administration area of about 8200 km2 and a hydrological area of about 15,000 km2. In the research area, the main source of water is the groundwater of a Quaternary aquifer, which has occurred in a Quaternary shallow alluvial aquifer and depends on direct recharge from rainfall events. This area of study includes nine drainage basins from the Wadi Baysh basin in the north to the Wadi Harad basin in the south, as shown in Figure 1. This area contains arid to semi-arid climates, which will positively affect the recharge of groundwater for alluvial aquifers and the enhancement of groundwater quality [33,34]. According to [35], Jazan Province includes three different geomorphologic features, as follows (Figure 2a): (1) the coastal plain, which varies in width from 20 km to 100 km and has an elevation between 0 m and 100 m, (2) the sloped zones (foothills) that extend from the coastal plain to the mountains, with widths extending from 62 km to 155 km and an elevation of 420 m, and (3) the Asir mountain range, which stretches east of the hills from north to south, running parallel to the coast and reaching elevations exceeding 3000 m. Most of the stream networks within the study basins originate in the mountainous region of the Asir region, traversing the hilly terrain before flowing into the Red Sea.
Geologically, the area under study mainly comprises various complex rock units ranging from the Precambrian to Quaternary periods (Figure 2b). According to [36], the Precambrian and Cambrian series have undergone alterations and metamorphosis, with some regions experiencing the intrusion of rocks of various ages and compositions. Tertiary rock units are found throughout the region, constituting a substantial succession of clastic sedimentary rocks that developed within fault-bounded troughs and were often overlain by basaltic flows from the Tertiary–Quaternary period. Particularly throughout the coastal plain, Quaternary deposits are extensively dispersed as extensive sheets (up to 12 m only). These deposits are considered the main water-bearing formation in the study area.
The study area is located in the Arabian Sheild, which is characterized by a highly complex structural geology. It shows great variations in lineament frequency values, reflecting the impact of the lithologic types. The lineament frequency ranges from 0 km−2 to 0.1 km−2, with an average value of 0.03 km−2. Lineament density is an important structural parameter, which has a direct influence on the permeability of the rocks, and it ranges from 0 km−1 to 0.53 km−1, with an average value of 0.2 km−1. The variation in the frequency and density values of the study basins is due to the variation in lithology. This structural geology plays an important role in groundwater recharge of shallow aquifers in the study area.
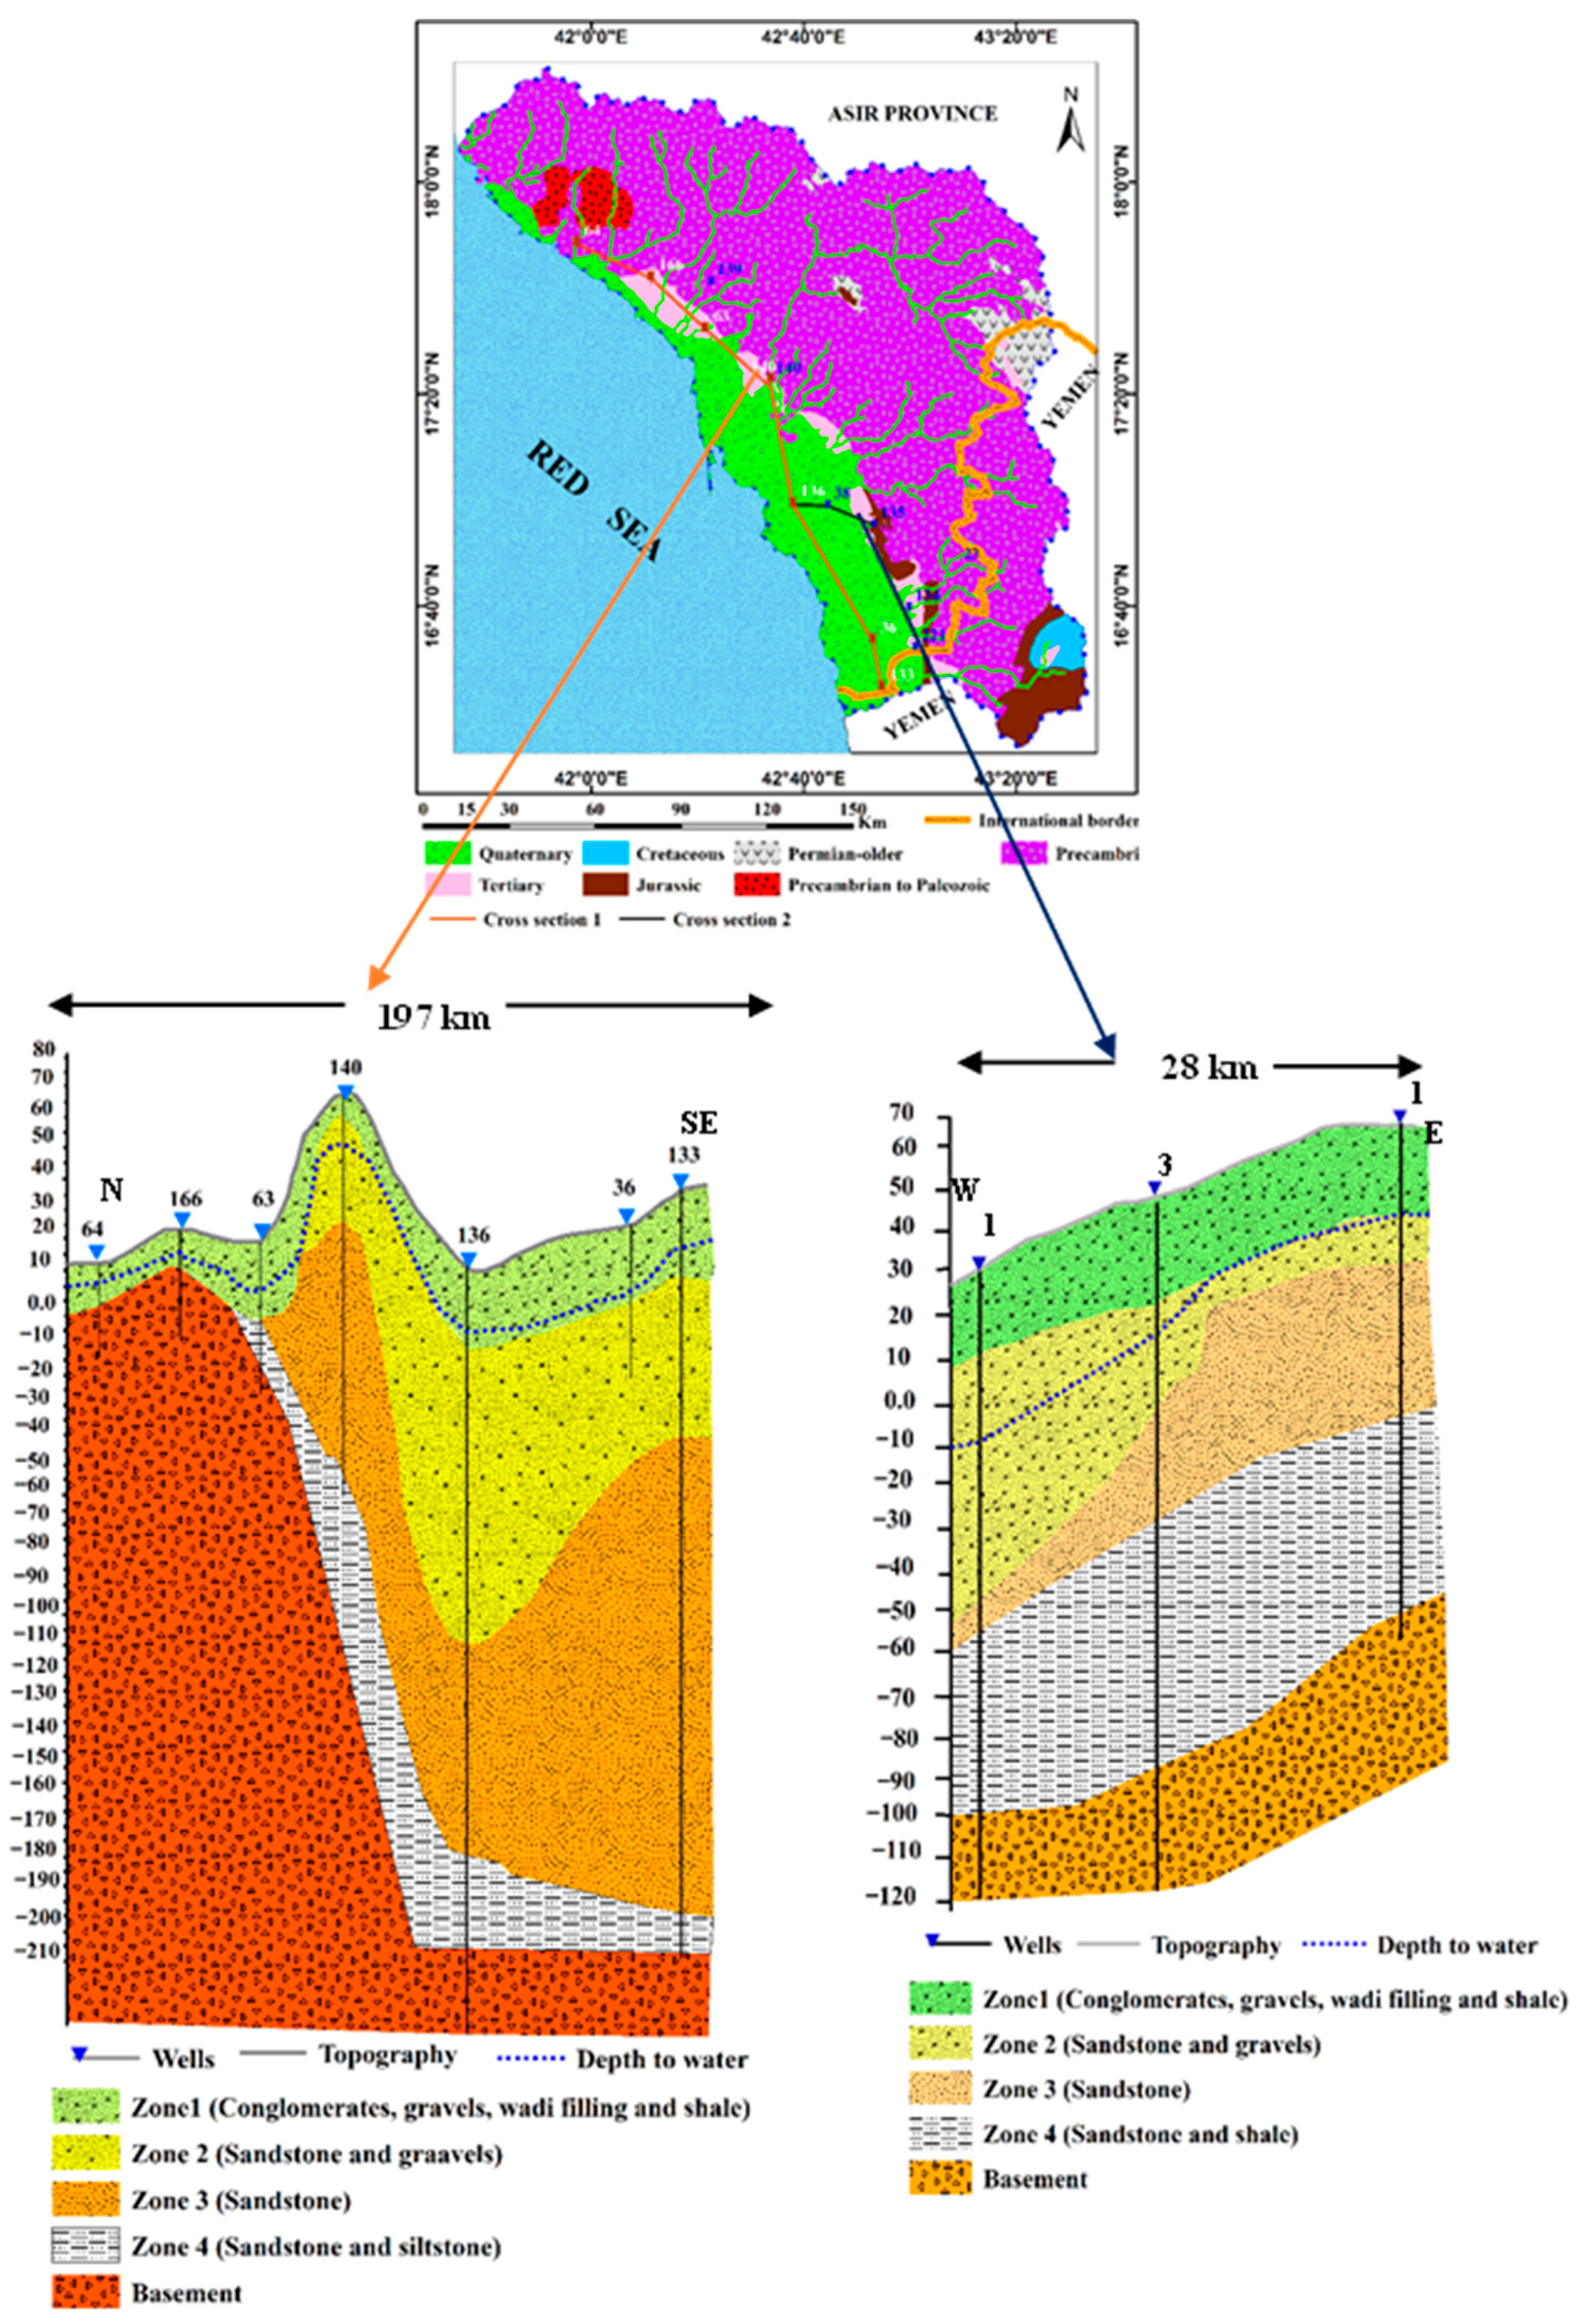
Hydrogeologically, the study area is located in the Red Sea coastal region, which is characterized by a Quaternary aquifer. This aquifer is considered the main source of natural renewal groundwater for agricultural, domestic, and industrial uses. The hydrogeology was assessed by Masoud et al. [1], who concluded that the coastal aquifer in Jazan Province consists of a significant thickness of Quaternary deposits (20 m–120 m) that comprises conglomerates, gravels, sands, and sandstone, with some intercalations of silt and clay. Sources of groundwater recharge of the coastal aquifer depend mainly on precipitation, while the discharge is due to pumping wells for different uses. Figure 3 shows the hydrogeological cross-sections of the study Quaternary aquifer as described by Masoud et al. [1].

3. Data Sources and Methods

  • Making an inventory of the existing groundwater wells tapping to the coastal aquifer using portable Magellan GPS 315 (San Dimas, CA, USA), as shown in Figure 1. Measuring the depth to water and collecting representative groundwater samples for chemical and isotope analyses.
  • Measuring the physical properties of the collected water samples in situ, such as pH, EC (μS/cm at 25 °C), and TDS (mg/L).
  • Collecting all the former research and data about rainfall, geology, and hydrogeology, as well as the modern techniques, which can be applied for estimating groundwater recharge rate.
  • Chemical analyses of 78 water samples, which included the major cations (Ca2+, Mg2+, Na+, and K+) and anions (SO42−, Cl, CO3−2, and HCO3), in addition to the some minor and trace elements, through standard methods (APHA reference). The Ca2+ and Mg2+ levels were quantified using titration, while (Na+) and (K+) were analyzed using flame photometry (Jenway, Models PFP7, Cole-Parmer Ltd., Staffordshire, UK). The Cl level was determined by titration with code chloride 9253 and a solution of silver nitrate (AgNO3), while the SO42− levels were measured using turbidity with a spectrophotometer. The CO3 and HCO3 levels were estimated using titration against 0.01 N H2SO4 using phenolphthalein and methyl orange indicators. The I and Br, levels were measured using ion chromatography (ICS-1100 systems, Ramsey, MN, USA). The ion balance error between total cations and anions was calculated, which was less than 5%, supporting the reliability of the results and the accuracy of the lab used for analysis of groundwater samples. In addition, environmentally stable isotopes including deuterium (2H) and oxygen-18 (18O) were determined for 29 representative groundwater samples using a PICARRO L2130-i high precision isotopic analyzer by the Hydrogeology Group, Institute of Geological Sciences—Frei University Berlin— Germany.
  • The CMB method was employed to estimate groundwater recharge, based on the availability of data and the hydrogeological setting [37,38]. The essential formula which applied for estimating the groundwater recharge is
R = (   P e f f × C l w a p ) ( C l g w )
The rate of recharge per year, symbolized by R, is assessed by the mean annual actual precipitation (Peff), which can be estimated by deducting surface runoff from precipitation. Clwap represents weighted mean chloride concentrations of precipitation, comprising dry deposition, while the mean chloride concentration of groundwater is denoted as Clgw. On the other hand, ref. [39] used the CMB method in another way. This approach allows for a quantitative correlation between the Cl content frequency distribution in local groundwater basins and both the recharge rate and source of chloride salinity. If a normal distribution of chloride is seen in a vast amount of groundwater samples, it is likely that dissolution of evaporates and mixing are the main mechanisms for the build-up of chloride.
  • Analyzing the frequency of maximum daily rainfall occurrences and applying common probability distribution functions to fit the actual data.
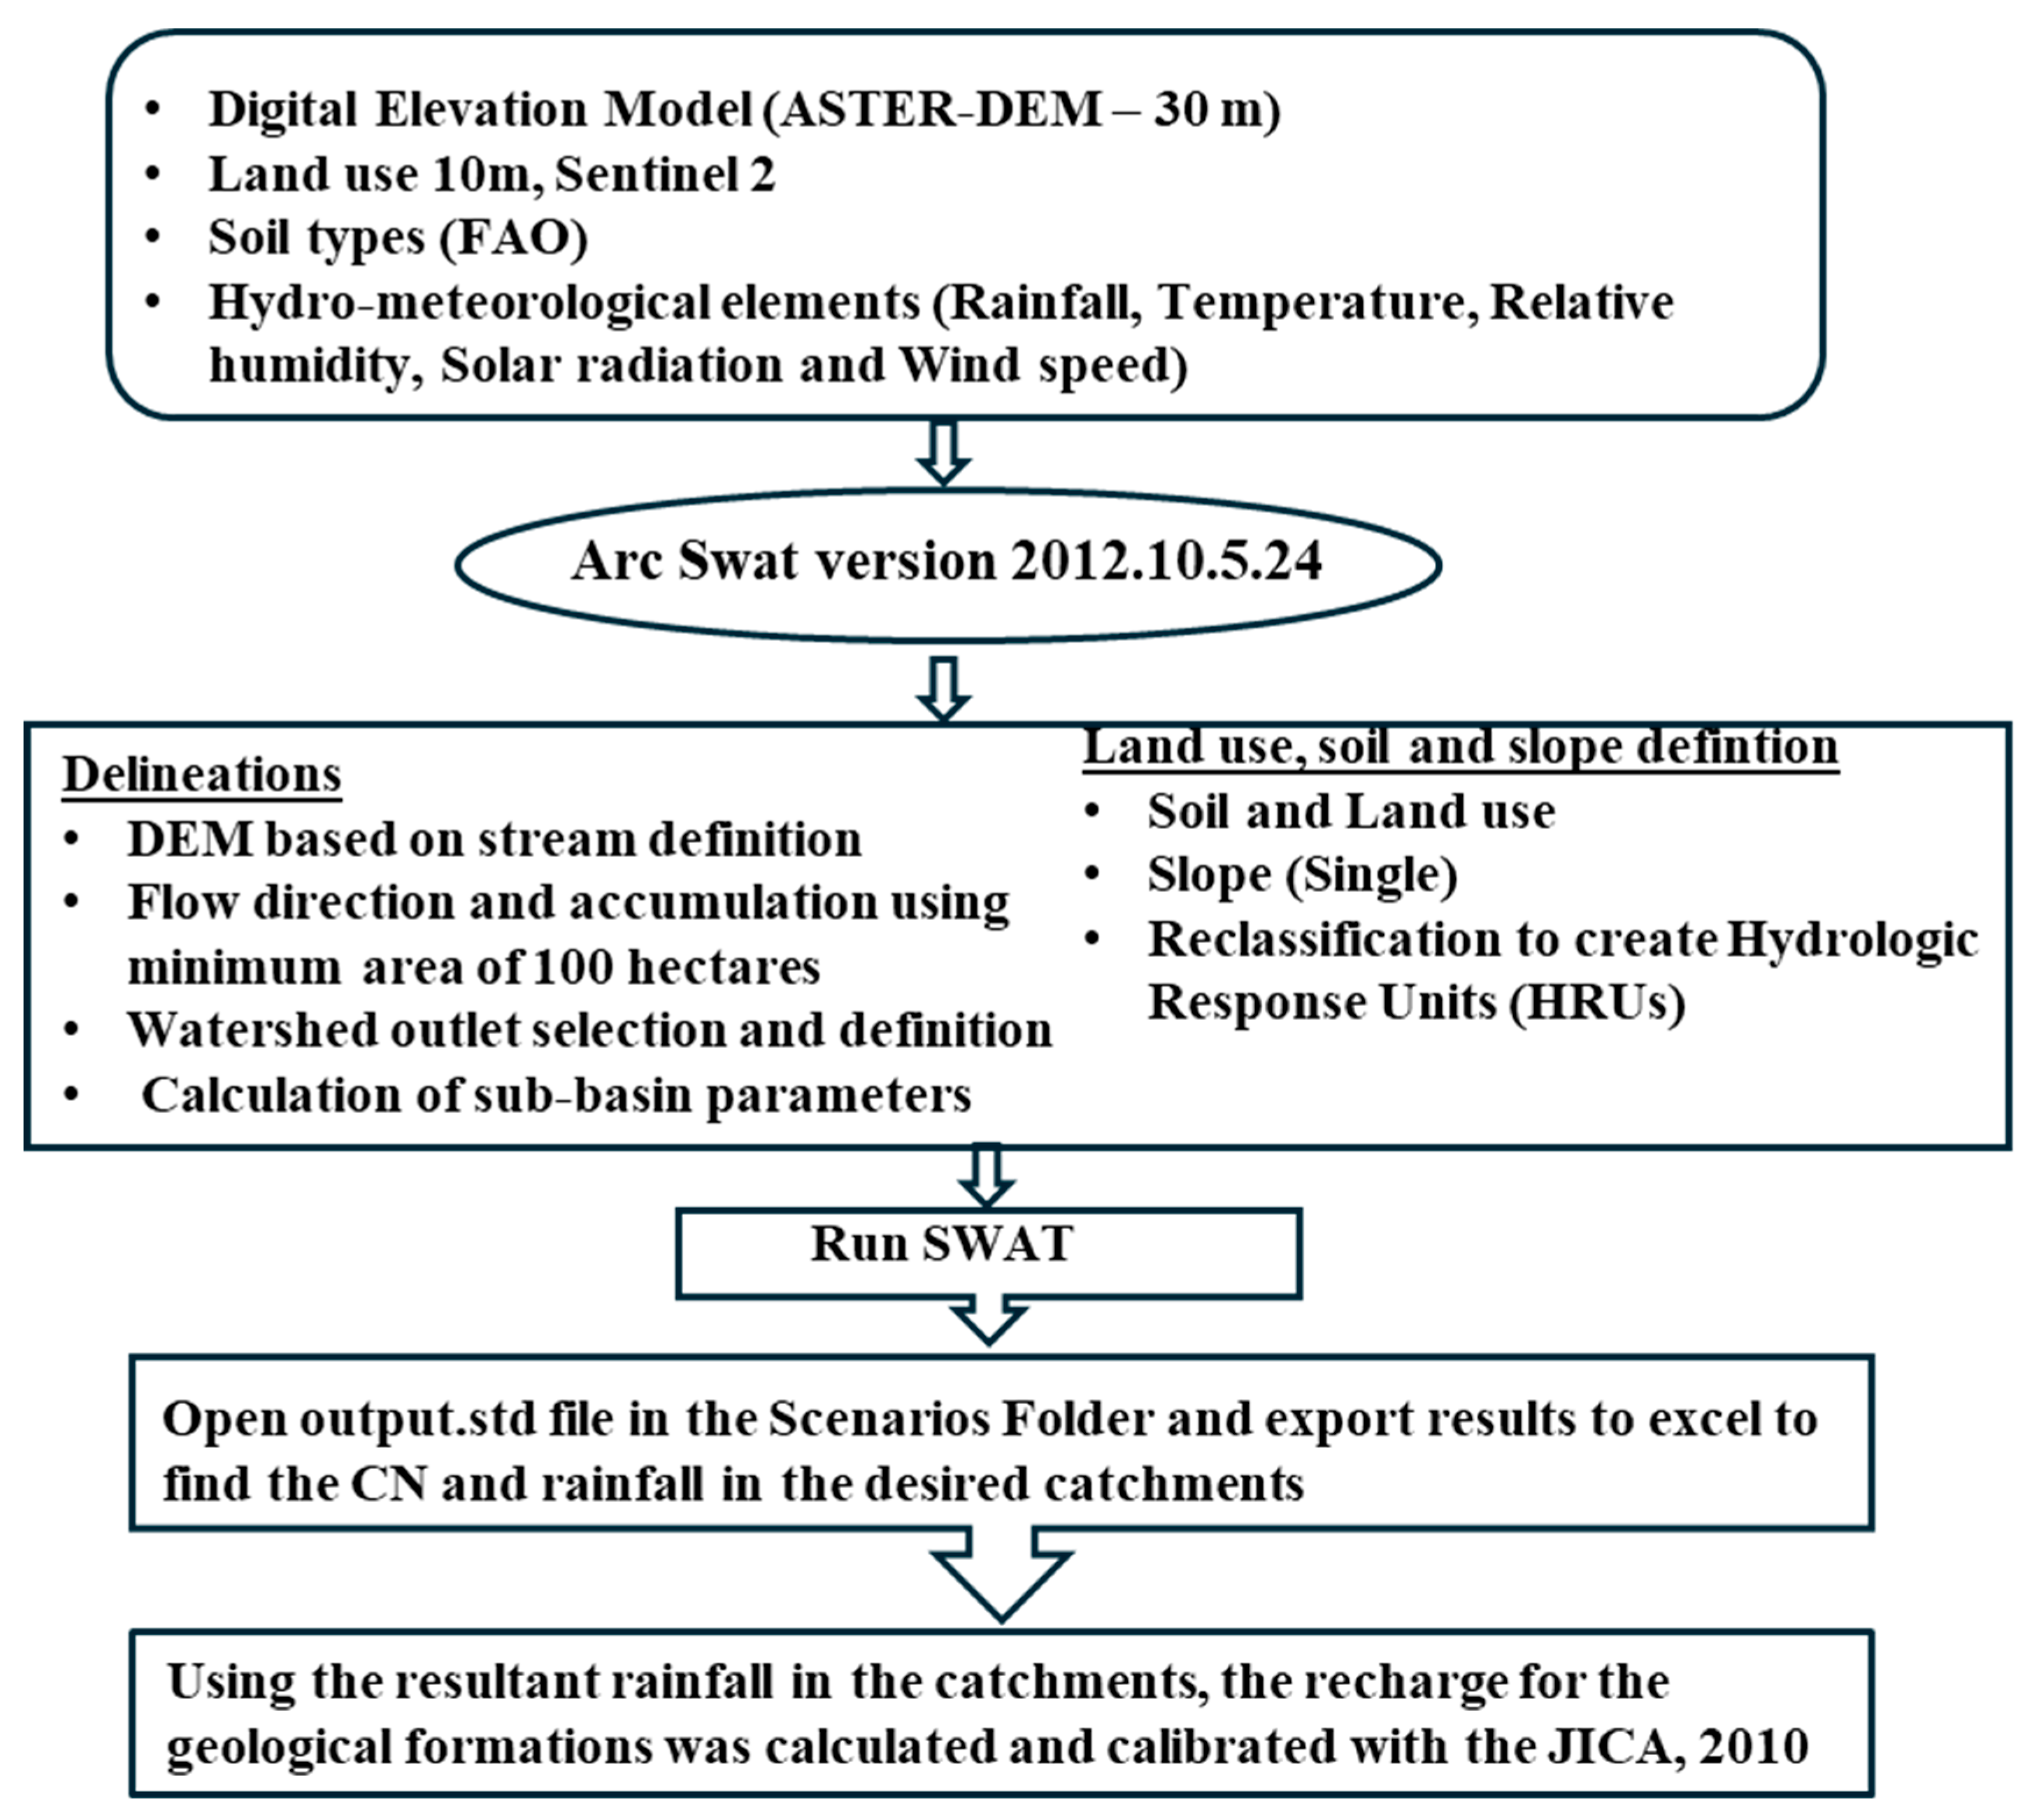
  • Using a soil and water assessment tool (SWAT) model for recharge estimation, which depends upon many parameters, for instance hydro-meteorological data, land uses and covers, digital elevation models (DEMs), soils, groundwater levels, watershed delineations, calibration and validations of the results, and spatial and temporal simulation of groundwater recharge. The parameters for input and output related to the groundwater recharge evaluation utilizing the SWAT model are illustrated in Figure 4.
  • Use of GIS, hydrogeological data, and chemical analysis for data digitization for the study area.
  • Providing the necessary recommendations that might help decision-makers with sustainable water resource management in the study area.

4. Results and Discussion

4.1. Water Resources

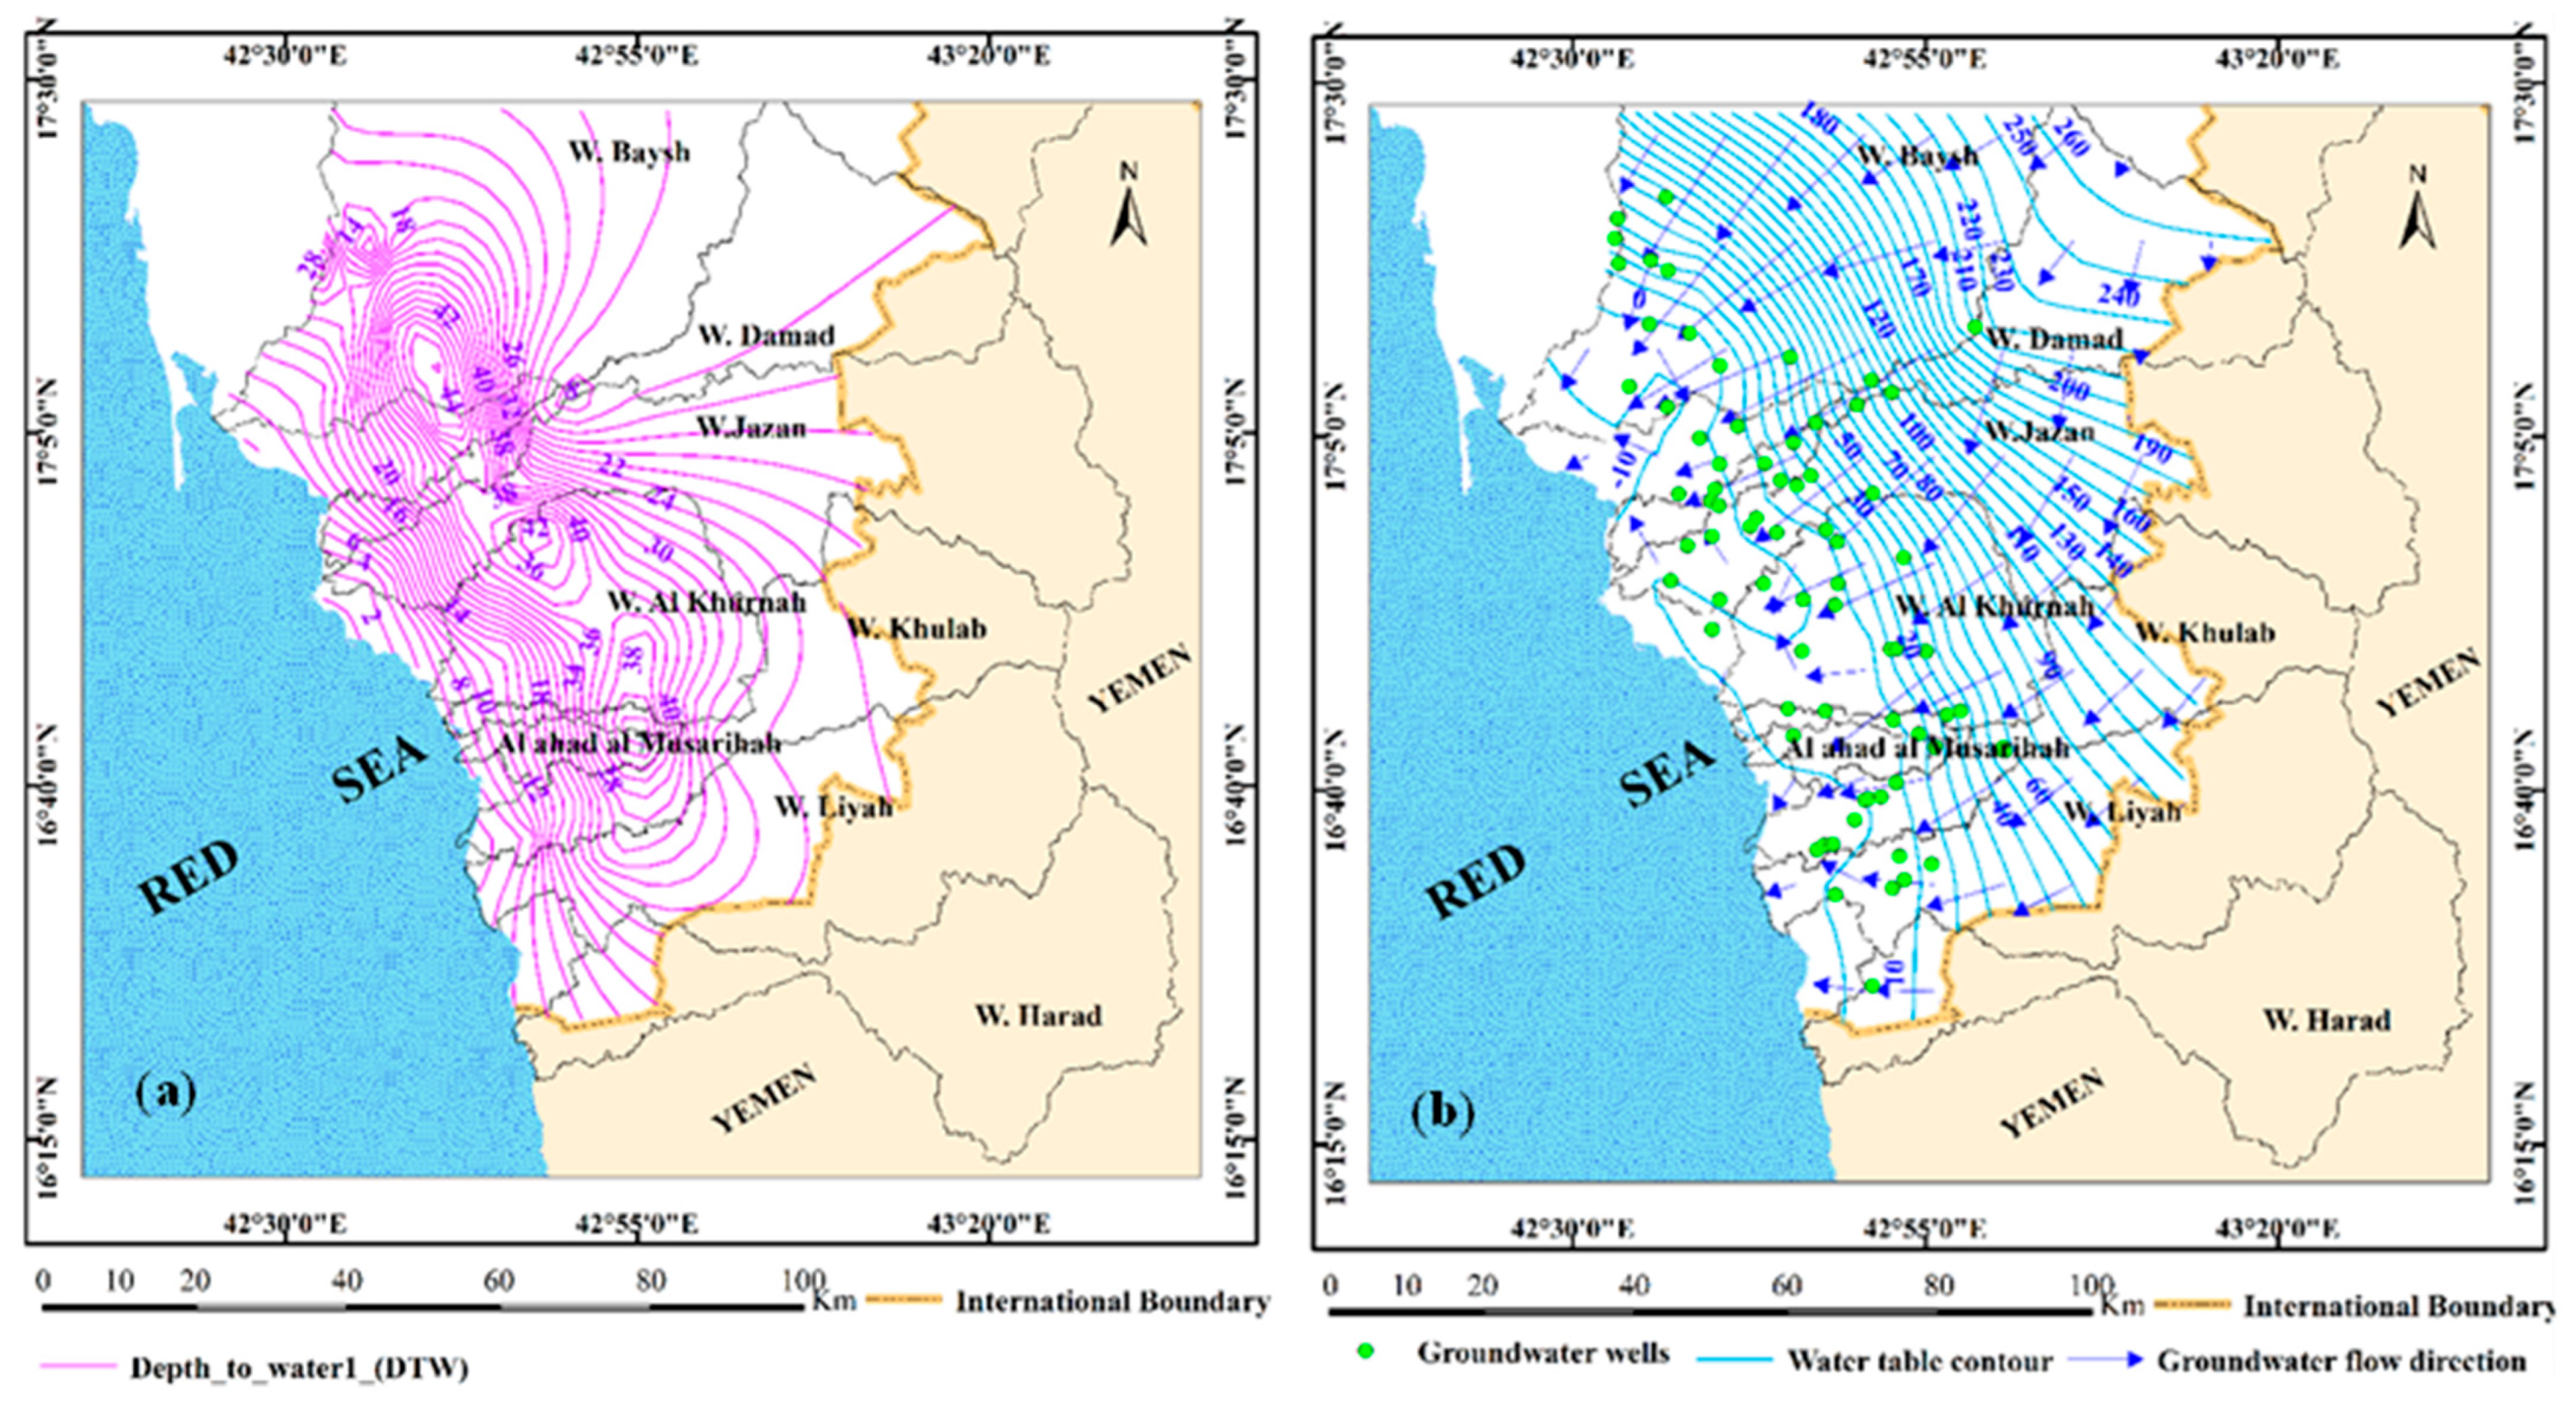
The groundwater of the Quaternary aquifer exists under unconfined to semi-confined conditions. It is used for different uses, including drinking water, domestic requirements, and irrigation. Sources of groundwater recharge and movement into the coastal aquifer have been inferred from groundwater level measurements for 78 drilled wells through visits and field monitoring in 2022. Depth to water and water table maps were constructed for the studied aquifer, as shown in Figure 5a and Figure 5b, respectively. As a result of the shallow groundwater levels and the porous, permeable upper layers, a significant portion of the rainwater runoff infiltrates the aquifer system, leading to a decrease in groundwater depth towards the east and northwest of the province (Figure 5a). Following the topographic gradient toward the coast of the Red Sea, groundwater flows mainly from east to west (Figure 5b). Furthermore, groundwater flows towards wells that have a high pumping rate, especially in the western portions of the province, because of increased agricultural activity, particularly in these areas.
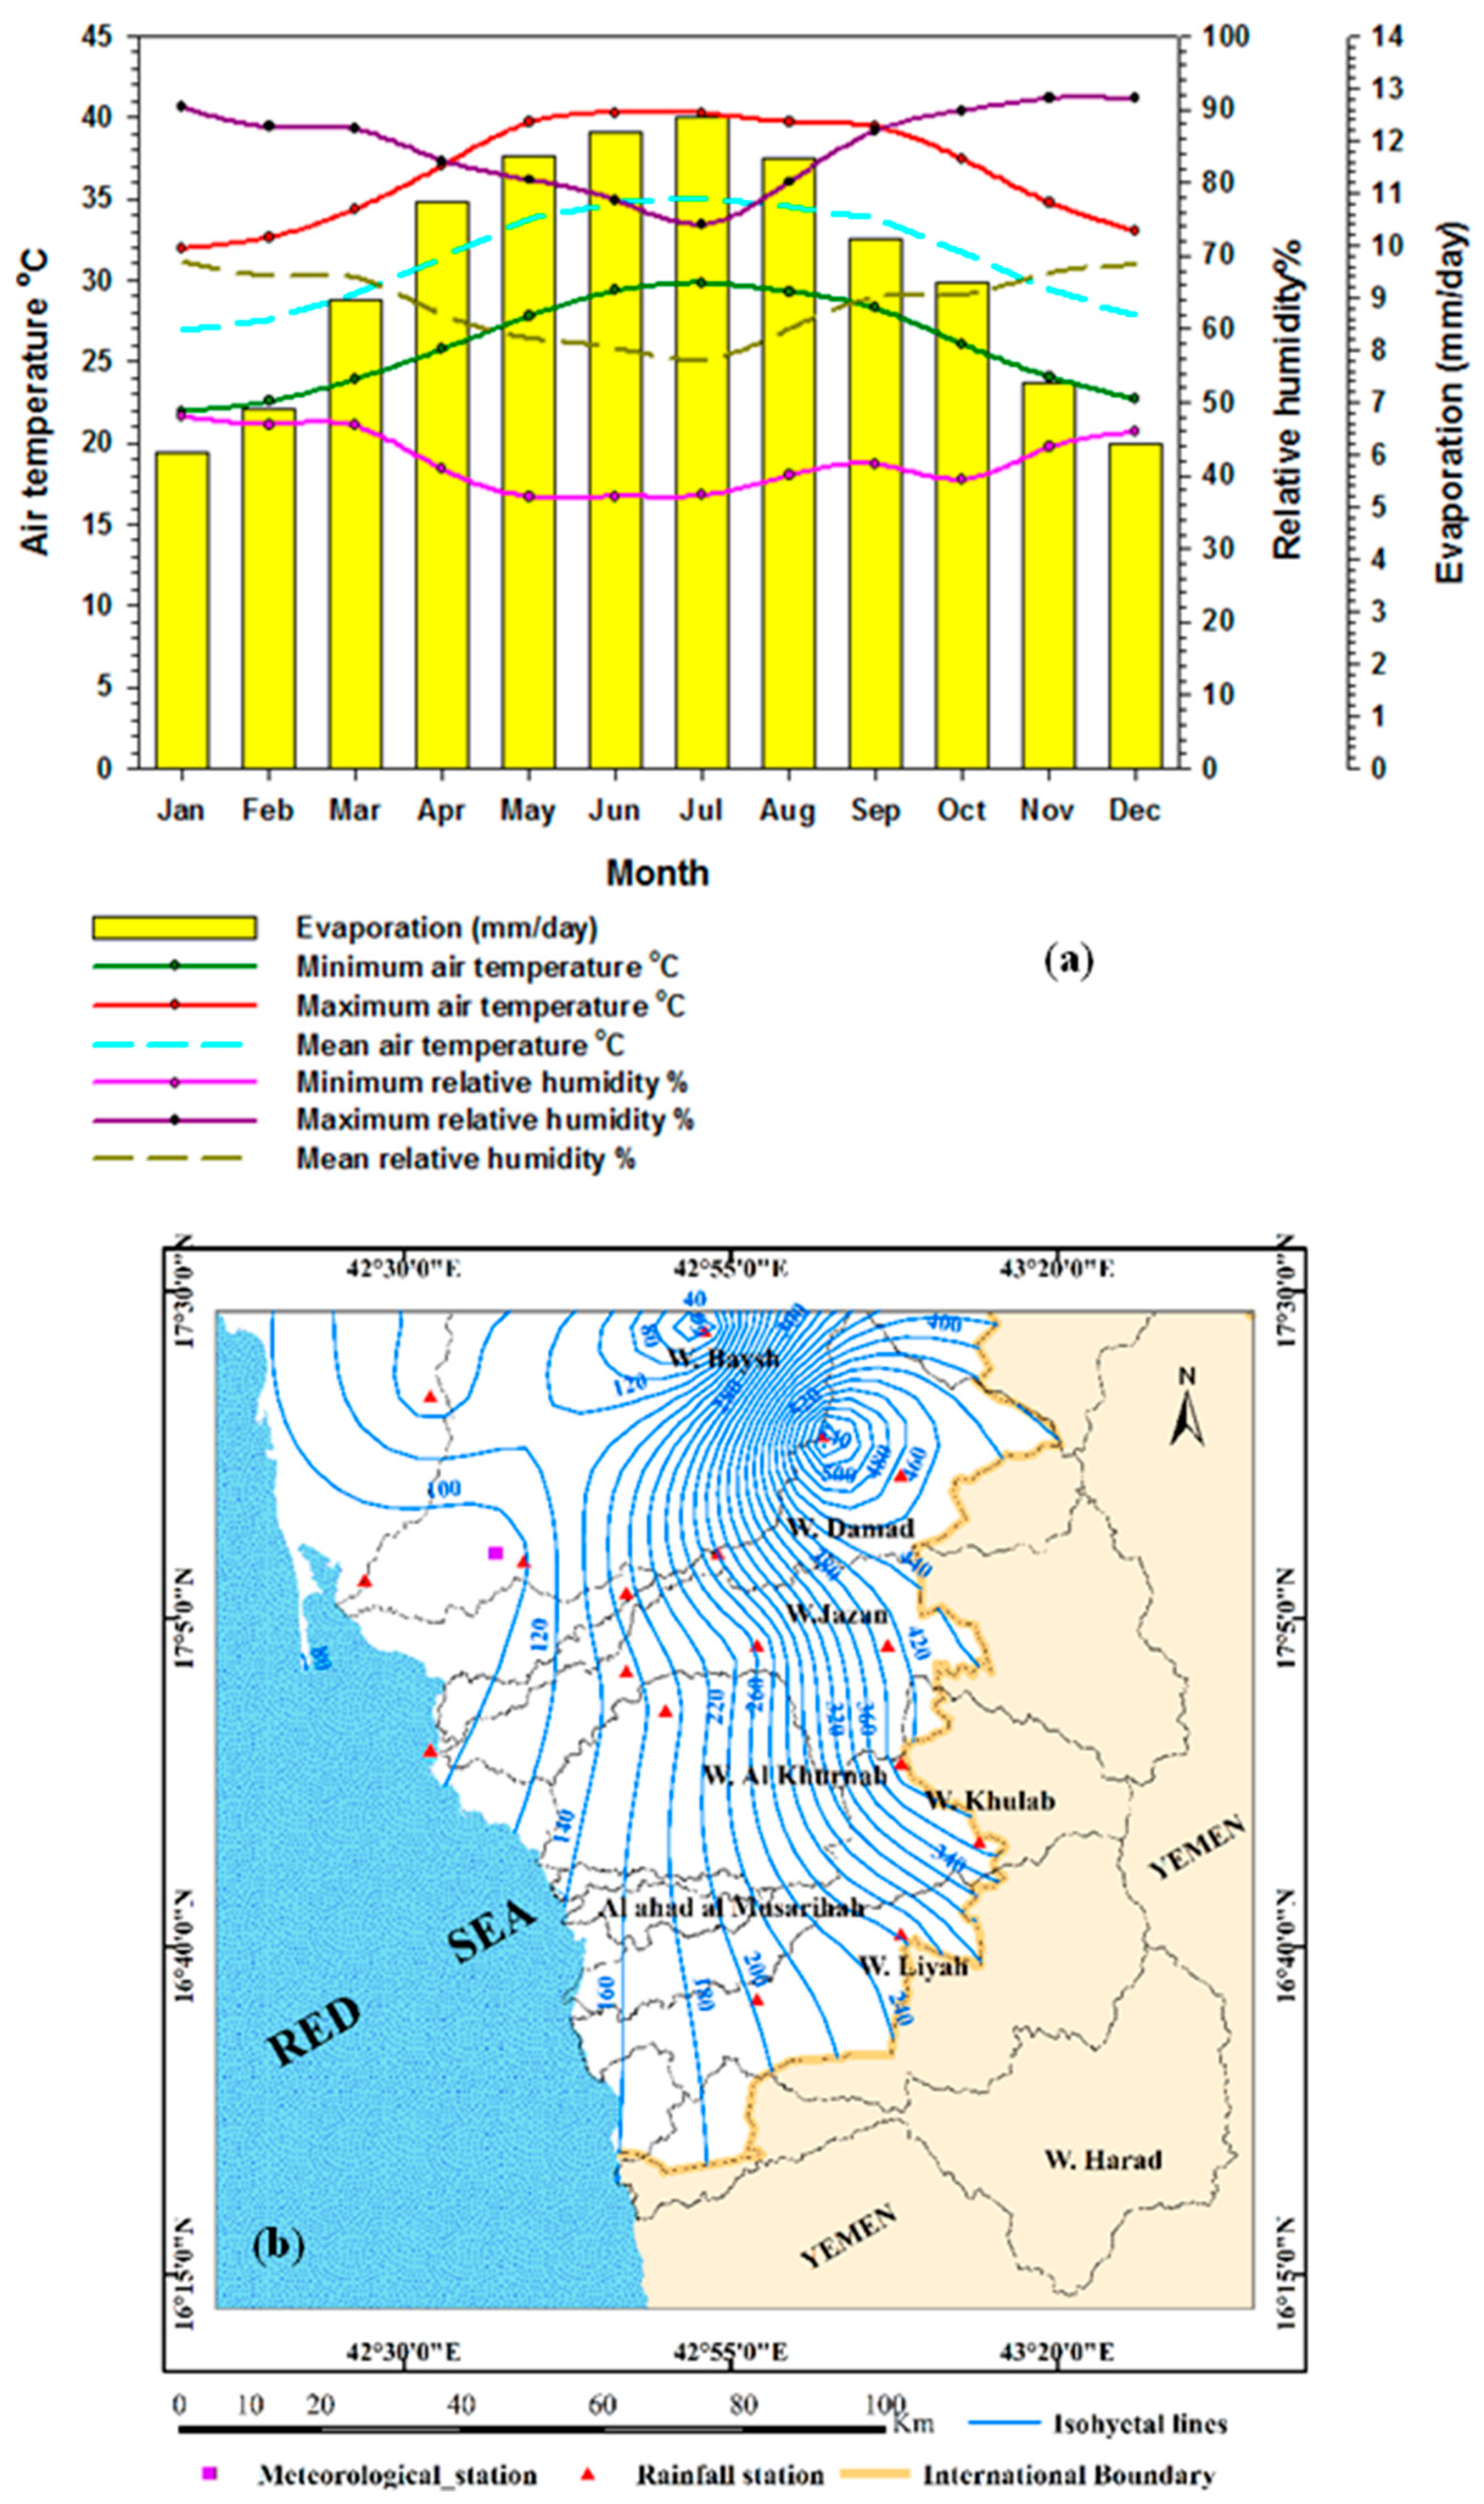
As classified by [41], Jazan Province is characterized by a climate that varies from a tropical to a sub-tropical dry zone. Consequently, heavy rainfall frequently results in flash floods, which have been documented in Jeddah, Riyadh, and various other locations in the KSA over recent decades. It is anticipated that climate change could affect the intensity, duration, and characteristics of rainfall in the future [42]. The southwestern region of the KSA experiences the highest levels of rainfall compared to other regions, attributed to its elevated mountainous terrain within a subtropical climate. Geographical features primarily influence the intensity of rainfall in Jazan Province. In this study, data collected from 10 rainfall stations was recorded over a span of 53 years (1966–2018), with annual average rainfall varying from 40 mm to 520 mm (Figure 6). This increase is observed from the west (downstream of low relief) to the east direction (upstream of high relief).
Consequently, the area retains water for several days following these storms; however, the highly permeable bed materials result in the loss of most of the water. It is proposed that the infiltration occurring in the main channels of the subbasins is the primary mechanism for recharging the Quaternary aquifer in Jazan Province. Various factors affect the accessibility of groundwater recharge in relation to rainfall, including the duration and intensity of storms, the landscape that promotes runoff concentration, geology, soil type, and vegetation cover [8,32]. In arid and semi-arid regions, like the study area, estimating groundwater recharge is neither a straightforward nor an easy undertaking. The recharge flux is mostly lower and may display increased variability in more arid climates [43].

4.1.1. Groundwater Quality of the Coastal Aquifer

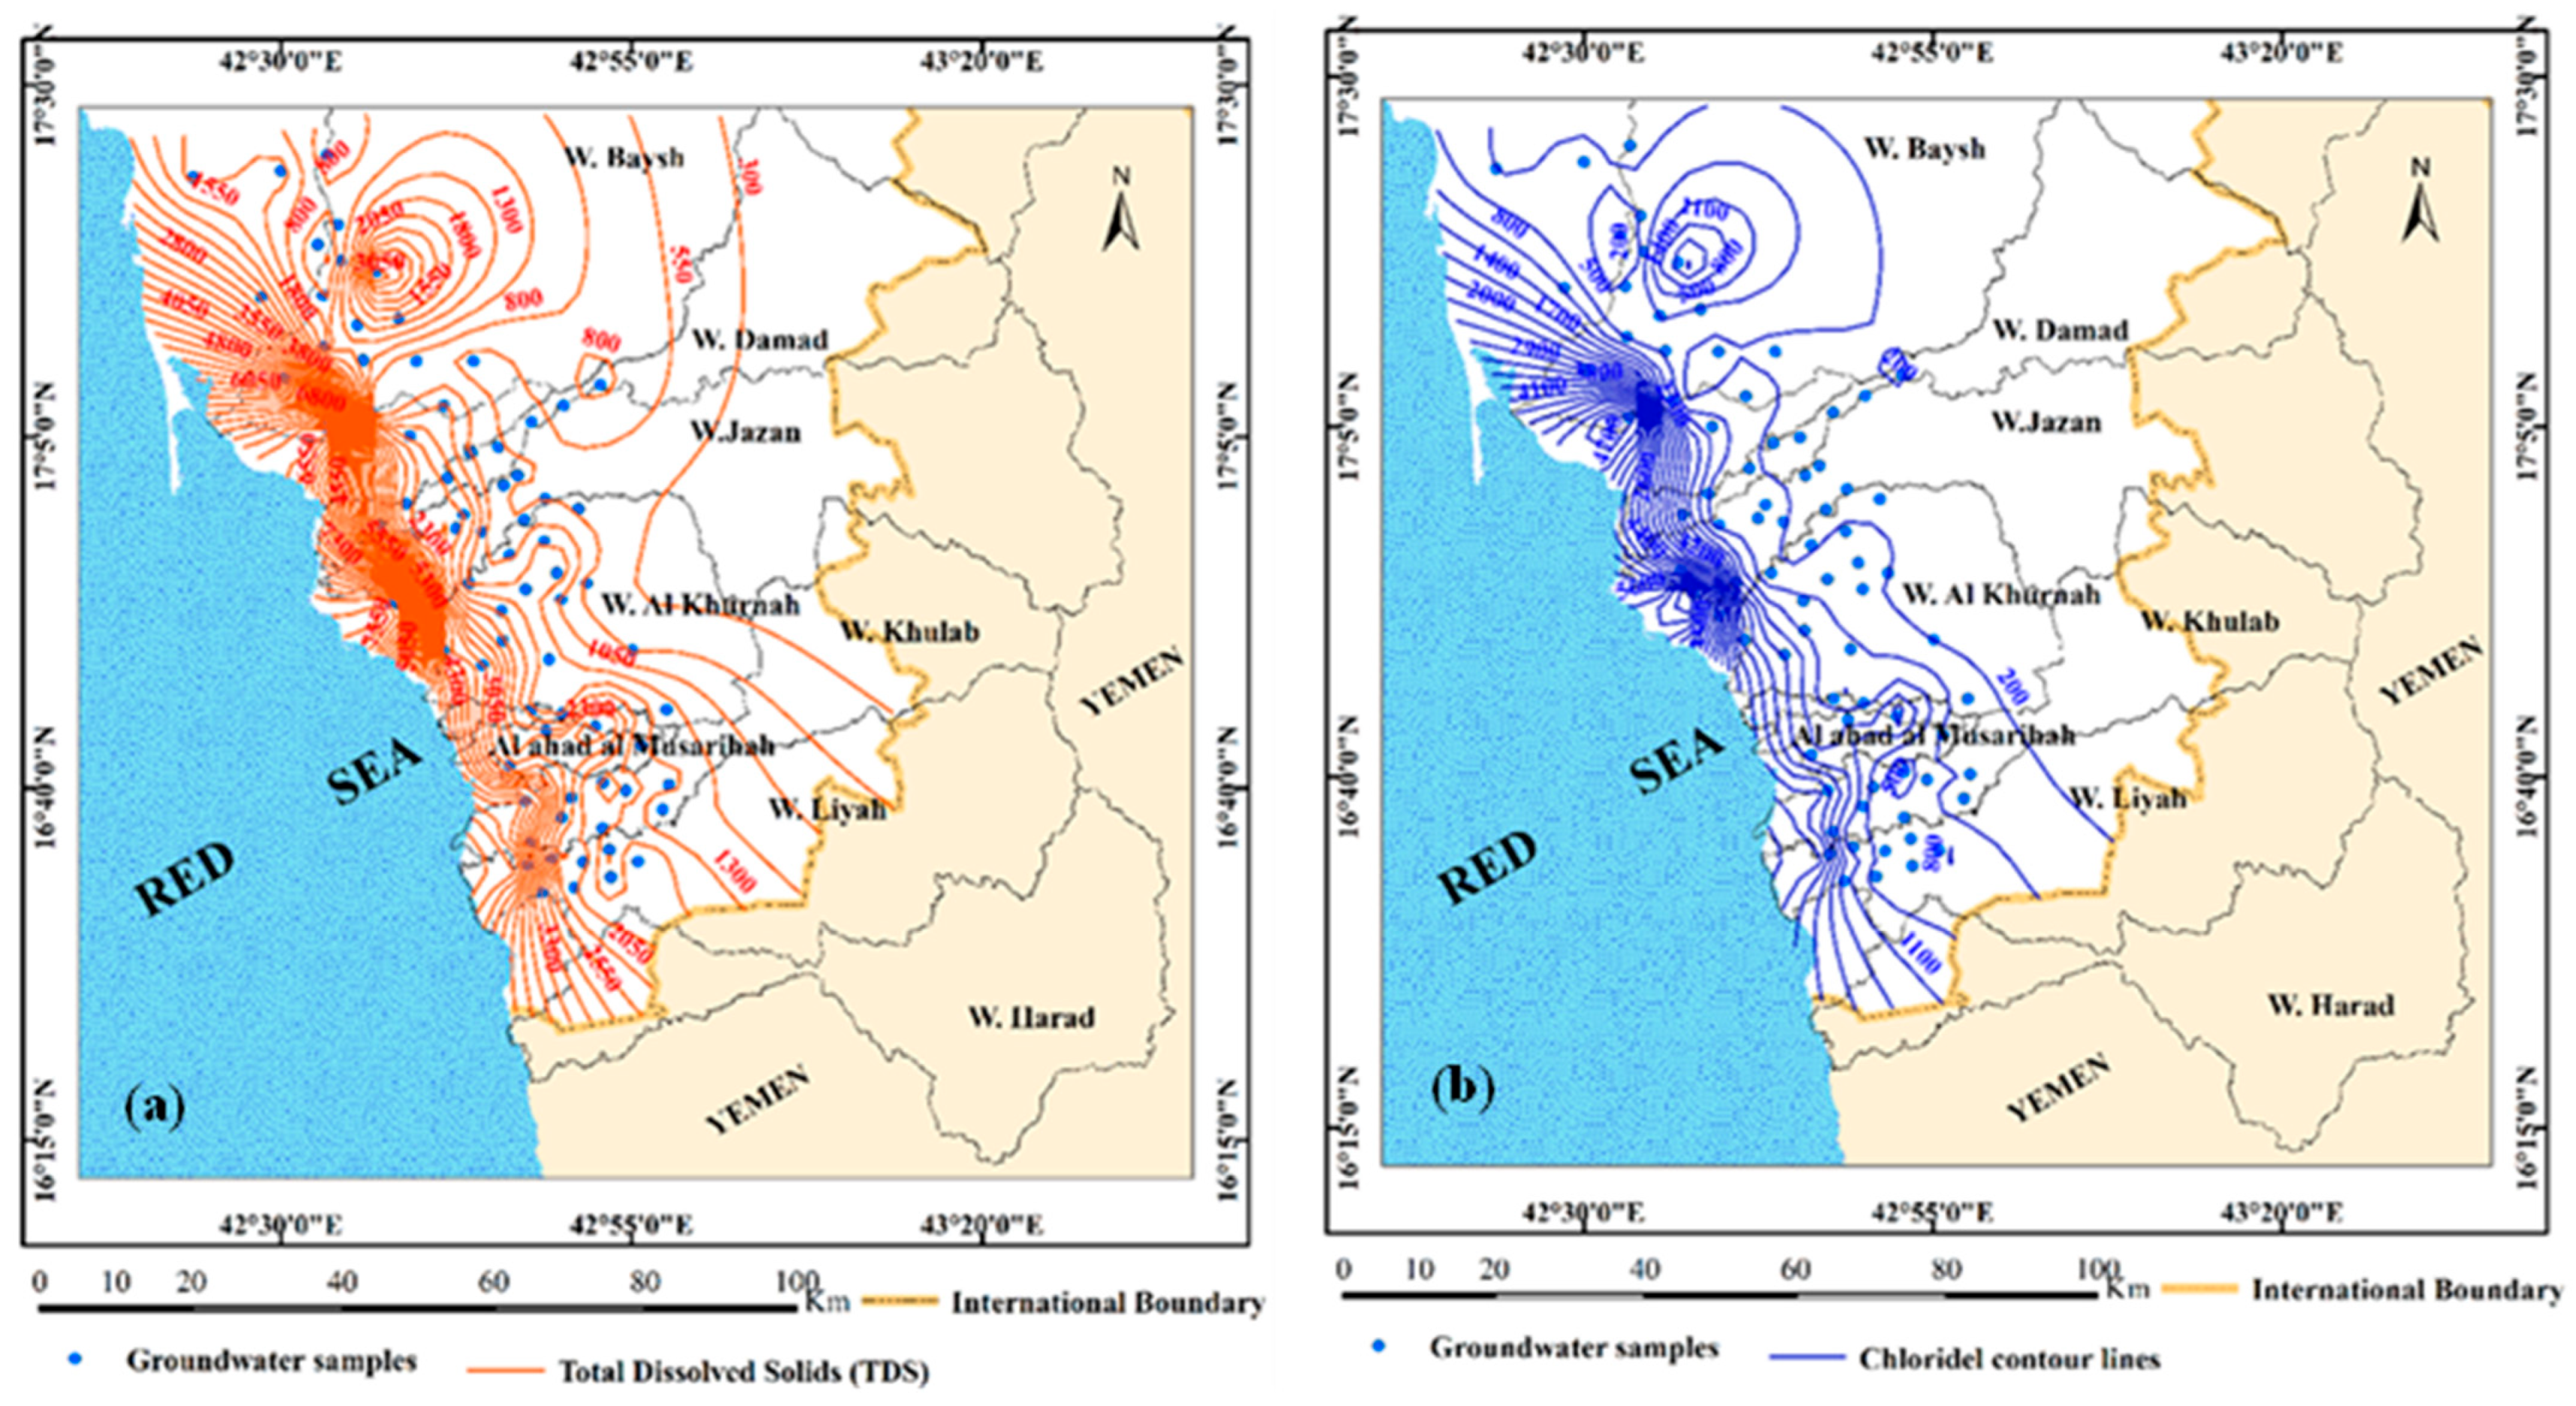
The statistical (minimum and maximum values) of the measured physicochemical parameters of the 78 groundwater samples collected from the coastal aquifer in the Jazan Province are presented in Table 1. The groundwater within the study area exhibits a pH range of 6.2 to 7.6, indicating that it is slightly acidic to neutral. Meanwhile, variability in groundwater salinity was observed, with electrical conductivity (EC) measurements between 1082 and 23,840 μS/cm and the total dissolved solids (TDSs) ranging from 604 to 14,673 mg/L (Table 1). These values suggest that the groundwater varied from fresh to brackish [44]. The predominant cations and anions are ranked as Na+ > Ca2+ > Mg2+ > K+ and Cl > SO4−2 > HCO3 > NO3, respectively. Total dissolved solids (TDSs) are commonly used to assess the quality of groundwater. Accordingly, the distribution map of TDSs in the study area was constructed, as shown in Figure 7a. This map indicates that the TDSs increase from east to west. This is essentially caused by evaporation, interaction of groundwater with rock, reverse ion exchange processes, intrusion of seawater (near the Red Sea coast), overpumping, and low rainfall. One of the essential elements utilized by the CMB method to evaluate groundwater recharge is the chloride level in groundwater. According to the chloride concentrations (mg/L), a distribution contour map was constructed in the study area (Figure 7b). The minimum concentration of Cl (about 27 mg/L) was found in the mountainous highlands located in the eastern part of the area, where the majority of recharge was recorded. This phenomenon is attributed to precipitation (which has low chloride content) occurring predominantly in the elevated upstream areas, followed by runoff that descends towards the coast. On the other hand, the chloride level increases along the groundwater flow path, exceeding 7000 mg/L, particularly near the Red Sea coast (Figure 7b). A study by [32] indicated that lower chloride levels are associated with higher recharge rates, whereas higher chloride levels correspond to low recharge rates.
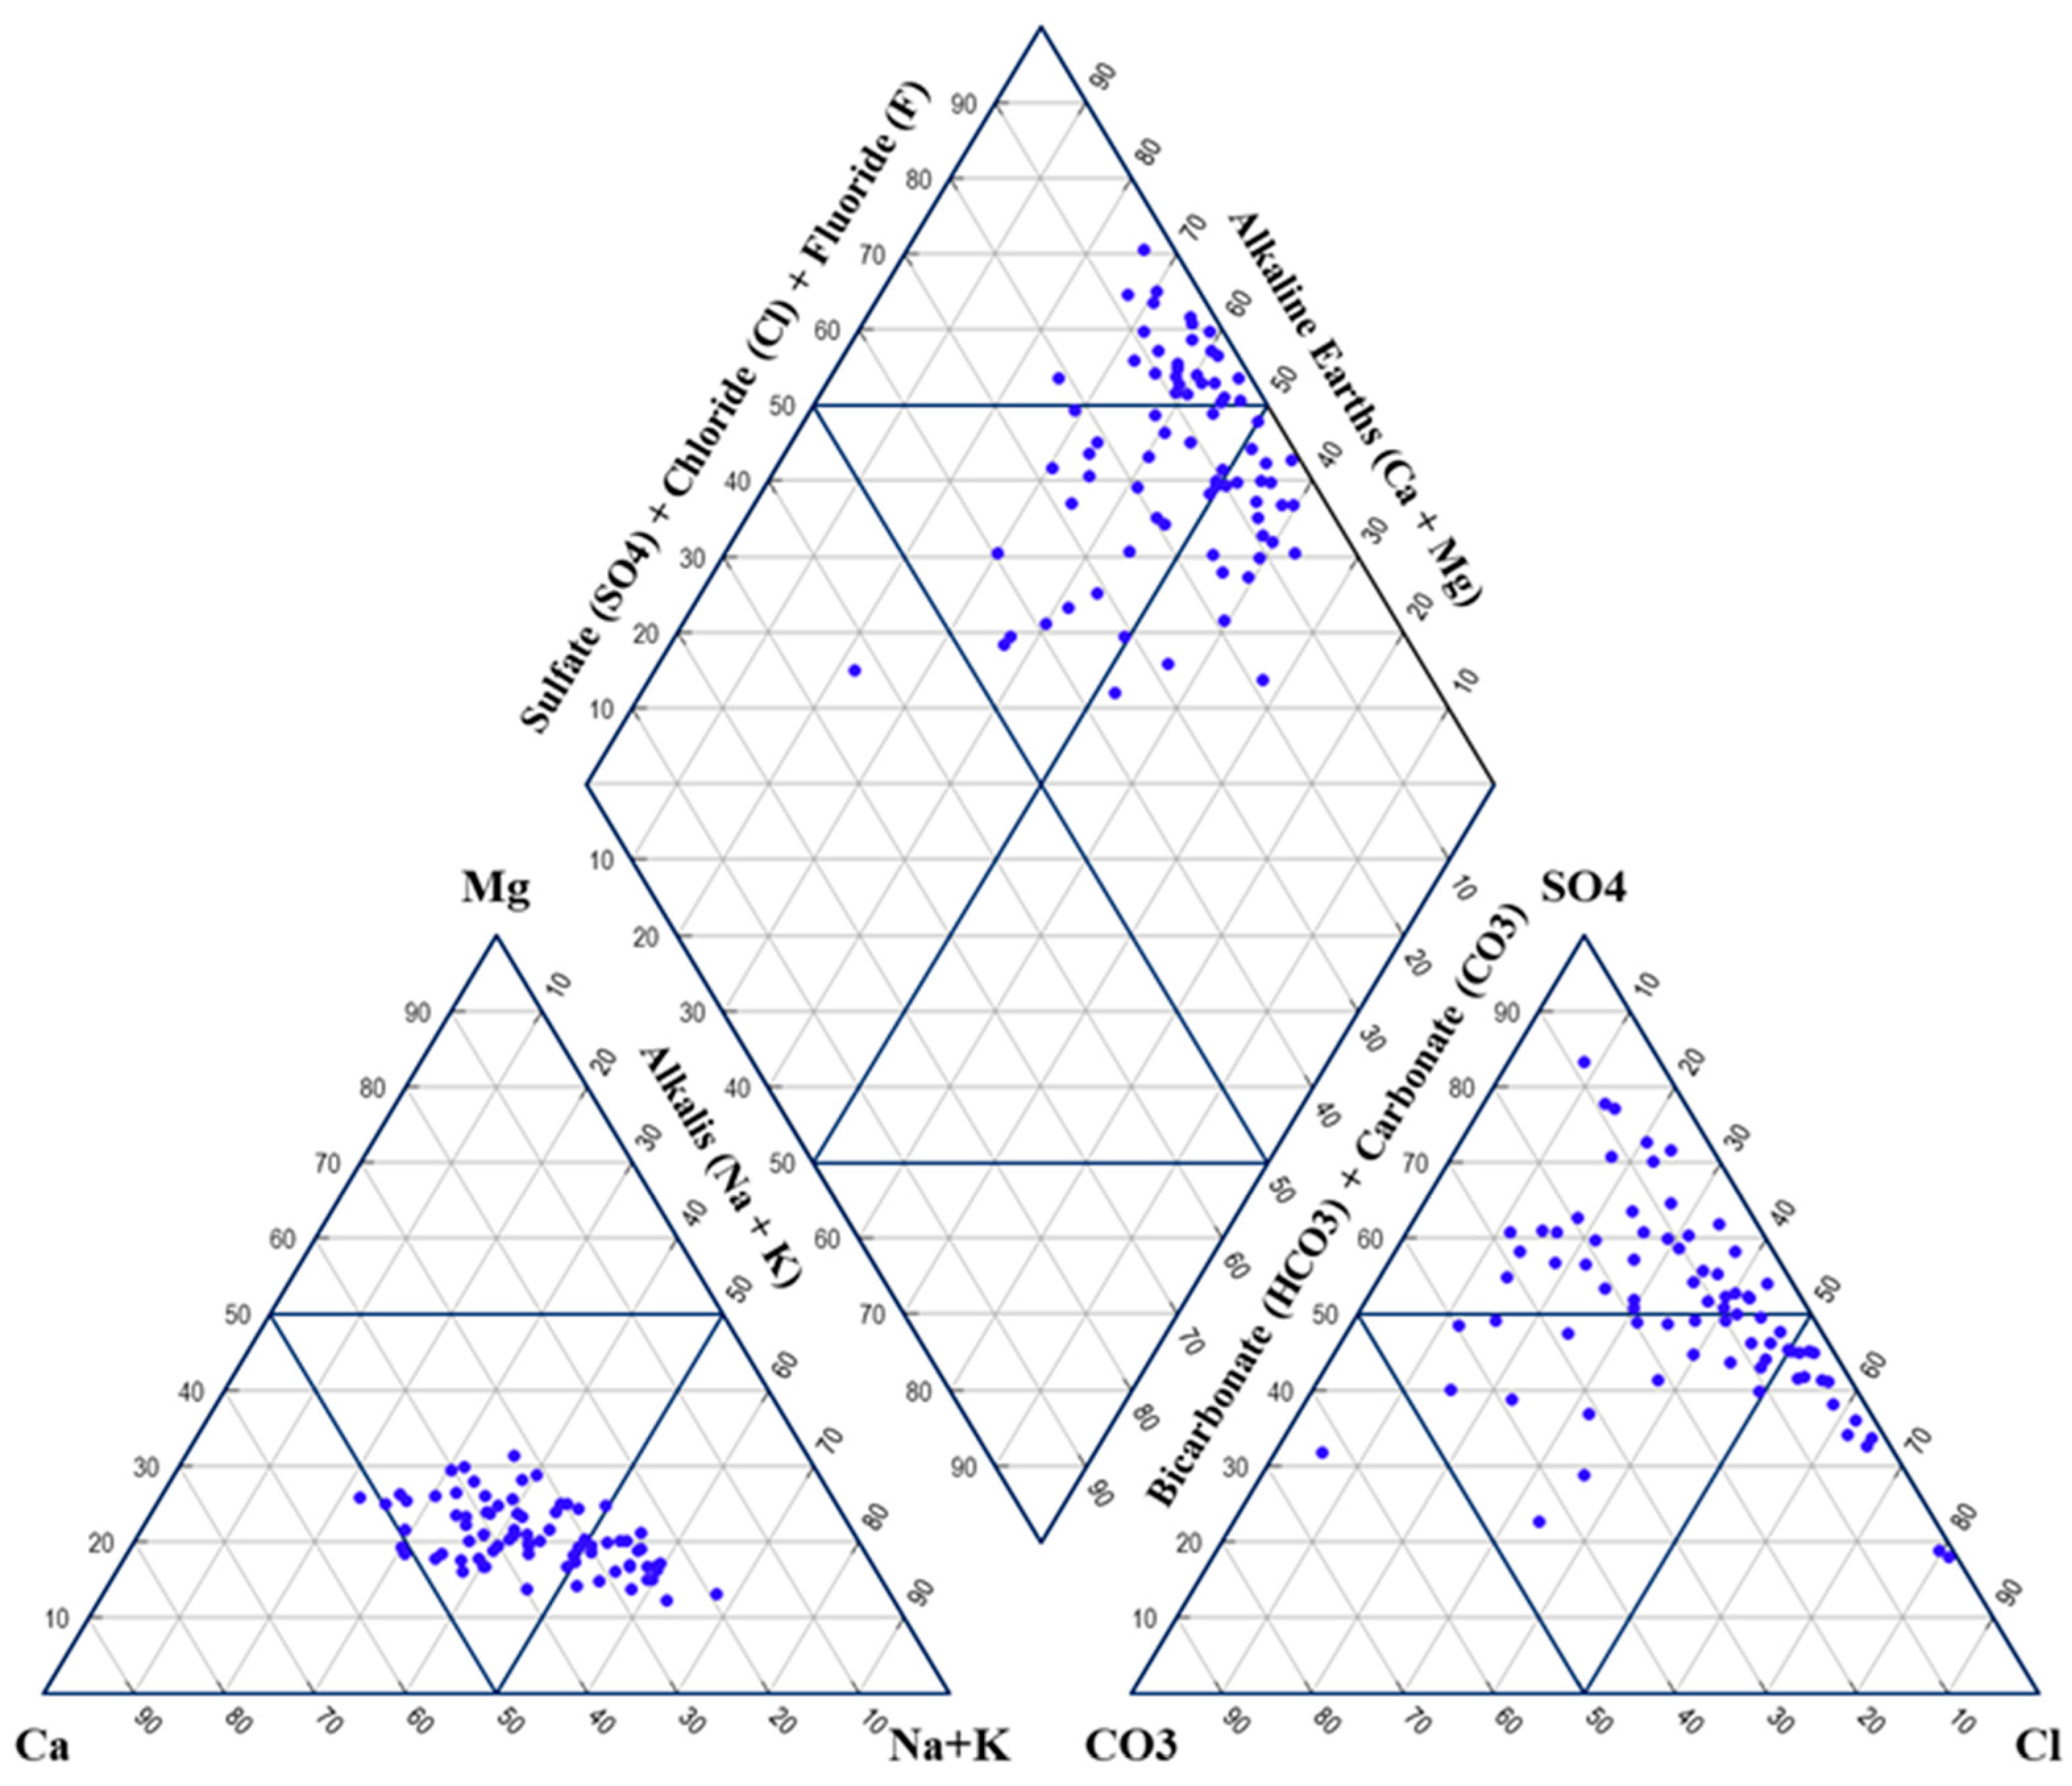
Graphic methodologies, such as the Piper [45] diagram, were employed to achieve a more profound understanding of the chemical classification of groundwater and the various geochemical influences that affect groundwater quality within the area under study (Figure 8). The results revealed three distinct classifications of groundwater facies that align with the geological and hydrogeological characteristics for the coastal aquifer (Figure 8). The facies described are as follows: (i) Na-Cl facies, indicating the concluding stage of water evolution and the intrusion of seawater resulting from reduced groundwater levels due to overextraction, (ii) mixed Mg-Cl-SO4 facies, linked to the interactions among the mineral constituents of rocks and groundwater, and (iii) Ca-Mg-HCO3 facies, which illustrate the effects of recharge from precipitation.
  • Sea water intrusion
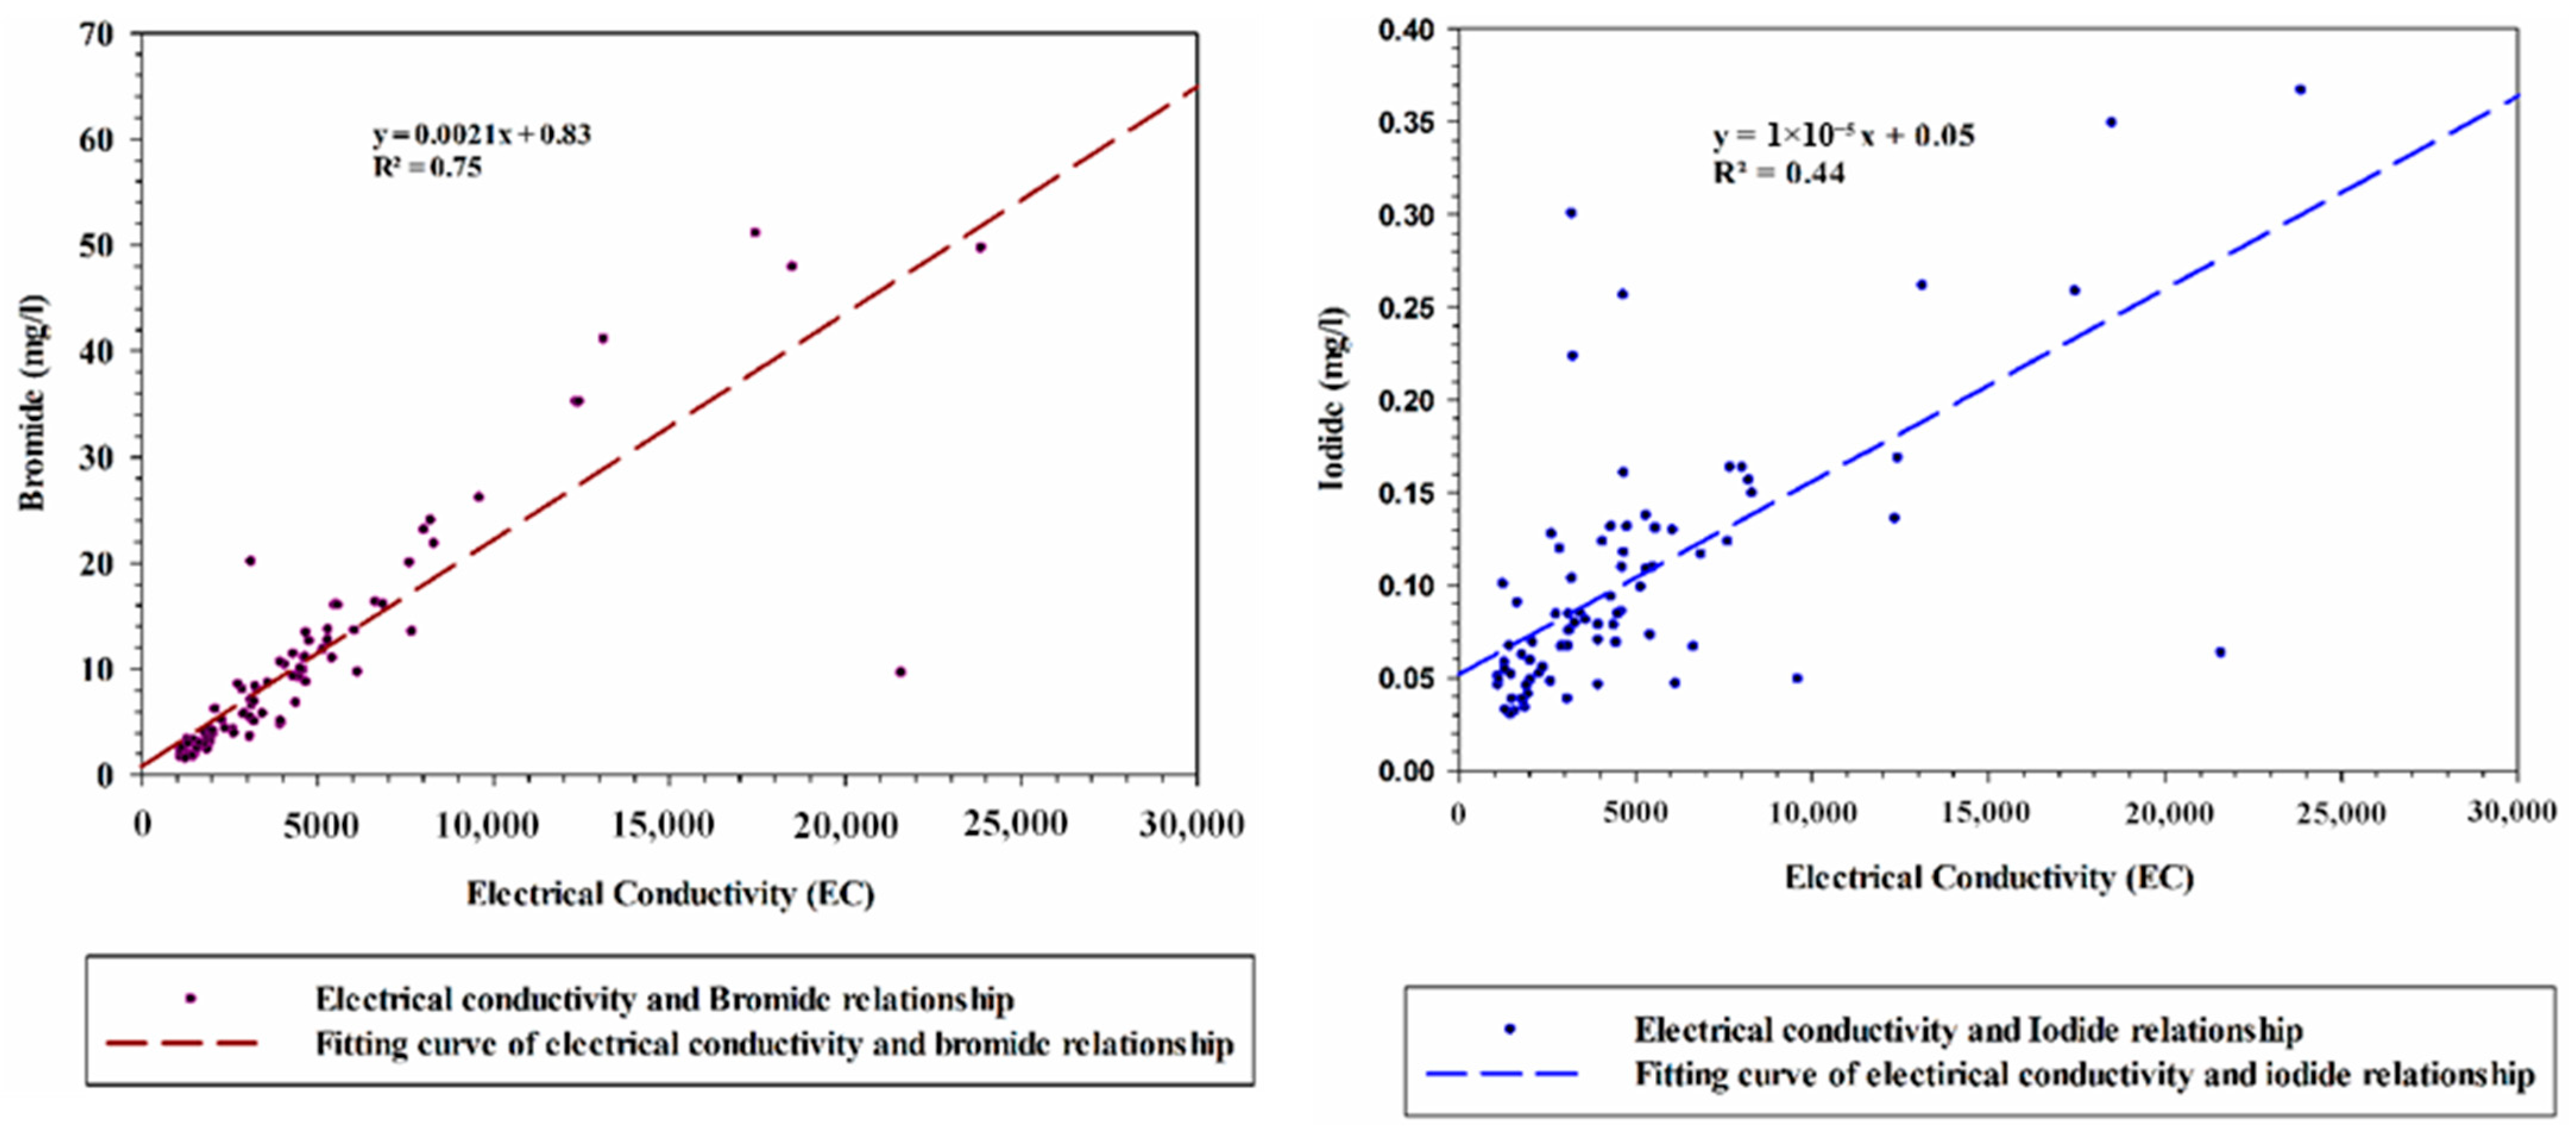
However, shallow coastal aquifers in western Saudi Arabia are adversely affected by seawater intrusion, excessive pumping from wells, and irrigation return flow in the intensively used agricultural region, resulting in water quality that is inadequate for various uses. Iodine (I) and bromine (Br) serve as effective indicators for identifying seawater intrusion due to the significant changes in their concentrations and ratios in groundwater when seawater mixes with freshwater. In particular, the molar Cl/Br ratio, which is approximately 655 in seawater, can reveal the degree of intrusion, since degree of mixing modifies this ratio. If seawater were to be mixed with low-mineralized groundwater, the Cl/Br ratio of 288 would stay approximately the same [45]. Furthermore, elevated concentrations of Br and I in groundwater samples can lead to the formation of more harmful brominated and iodinated disinfection byproducts (DBPs), thereby making them important markers for assessing the effects of seawater intrusion on water quality. The results in Table 1 indicate fluctuations in groundwater salinity, with I values varying between 0.0308 and 0.367517 mg/L and Br levels varying from 1.63 to 51.20 mg/L. The relatively high bromide contents in groundwater samples have typically occurred due to weathering of the surrounding Precambrian rocks. Based on the measurements of electrical conductivity (EC), bromine, and iodine in the sampled groundwater, Br and I generally display positive correlations with the EC, as illustrated in Figure 9. The correlation coefficients (R2) exhibited a relatively high range, from 0.75 to 0.44, indicating water–rock interactions and seawater intrusions. In the sampled groundwater, Cl/Br ratios range between 15 and 643. In this case, it is presumed that the additional saline solution is the cause of this wide variation in Cl/Br ratios.
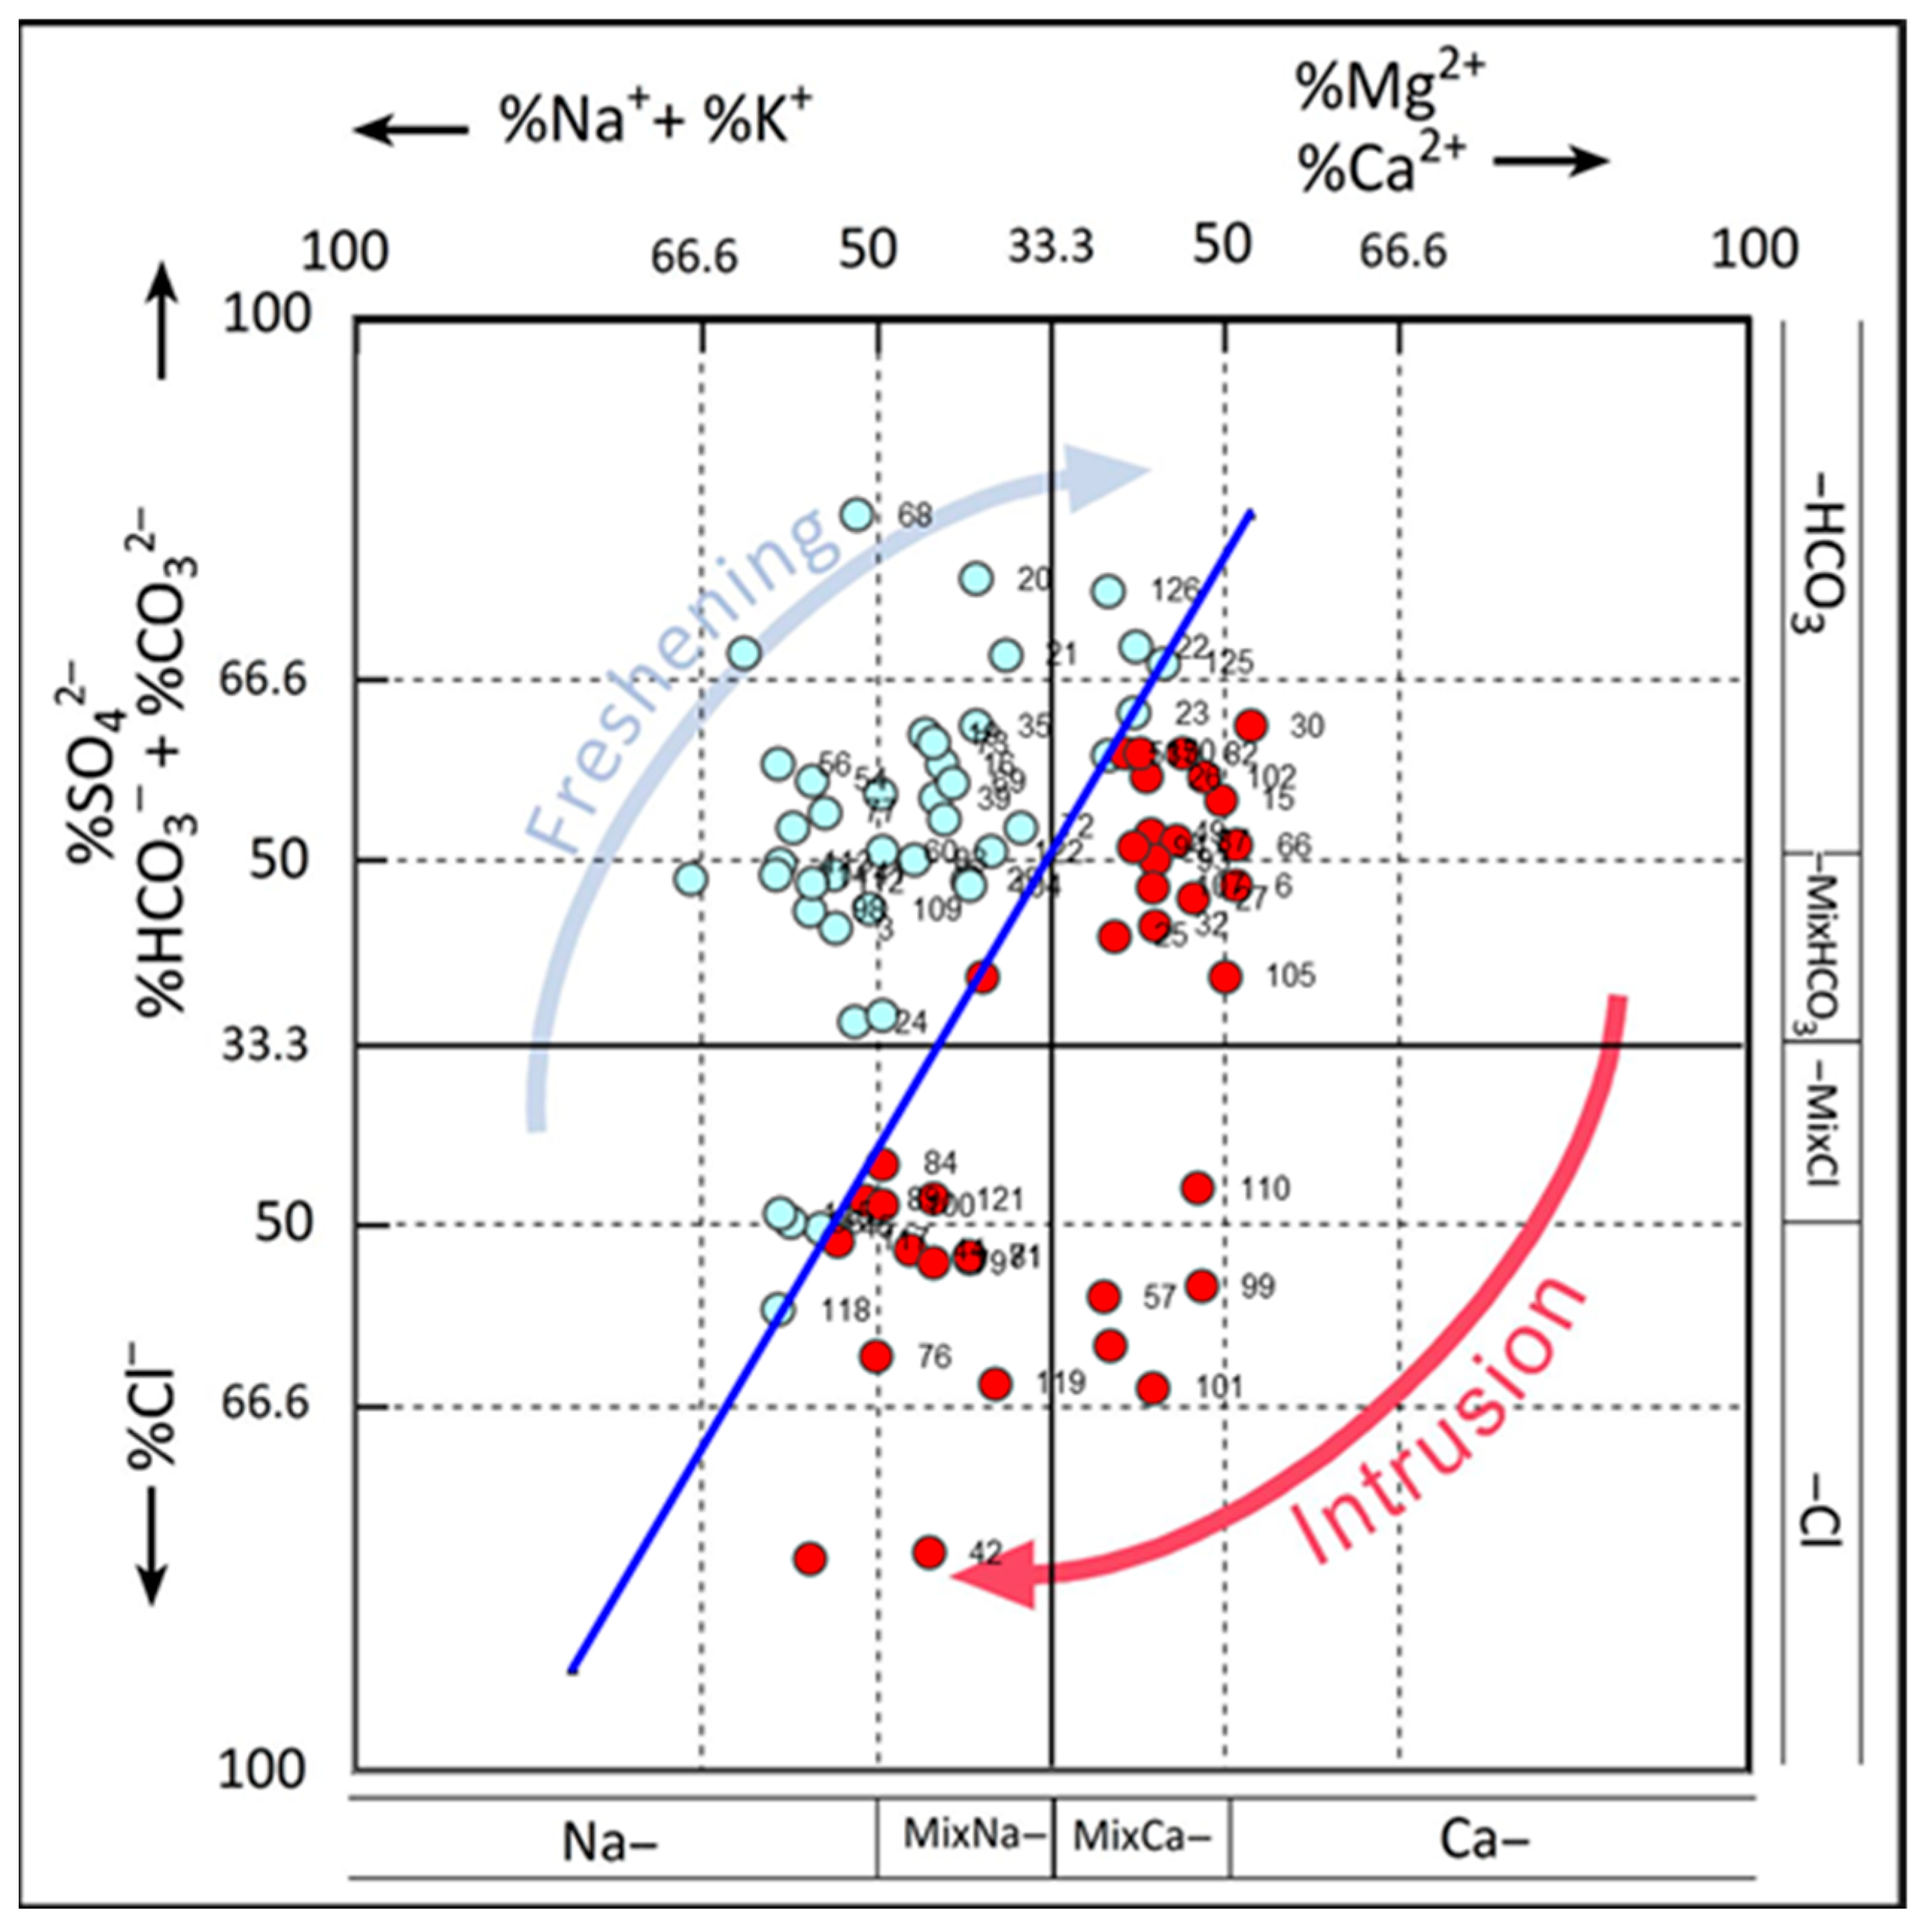
A hydrochemical facies evolution diagram (HFE-D) was also utilized for the groundwater samples to differentiate between the two main phases (intrusion or freshening). The HFE-D distinguishes these phases through the conservative mixing line (depicted as a blue line in Figure 10). As shown in (HFE-D), 42 samples were classified as belonging to the freshening phase, while 36 samples were categorized under the salinization phase (mixing with sea water), indicating a progression of seawater intrusion in the study area.

4.1.2. Mechanism of Groundwater Recharge

In this research, environmental isotopes (oxygen δ18O and hydrogen δ2H) were incorporated and utilized to investigate the factors influencing recharge, mixing, and development of groundwater chemistry of the coastal aquifer, as well as the source of salinity at the site of the groundwater wells. Based on the findings from the environmental isotope analysis conducted on 29 representative samples (Table 2 and Figure 11), the range of δ18O isotopes varied from −1.10‰ to +1.03‰, yielding an average value of −0.245‰. On the other hand, the range of hydrogen δ2H isotopes was from −0.63‰ to 11.63‰, with an average of 5.87‰. As shown in Figure 11, most of the samples were situated near the global precipitation line (depicted as a black line in Figure 11), indicating that they predominantly originated from meteoric sources [35,47]. This distinctly indicates the presence of young groundwater that formed during the Holocene. Importantly, upstream of the basins, relatively high or significantly enriched isotope signatures exhibiting positive deuterium and oxygen-18 values were observed. These signatures are indicative of groundwater that has developed in a warm climate and near recent rainfall, thus validating that the recharge was due to recent meteoric precipitation. By graphing the oxygen δ18O and hydrogen δ2H data from Wadi Malal, as examined by [48], and Al-Madinah Al-Munawarah Province, investigated by [35], it is fortunate to note a significant correlation between their findings and those of this study, with both datasets aligning closely along the same local meteoric line (Figure 11). Additionally, when plotting the mean isotopic data of rainfall in Riyadh, as documented by [49], it is observed to be very near the global precipitation line (Figure 11). Meanwhile, the slope of the local meteoric water line for the area under consideration is measured at 5.2, which is lower than that of the global precipitation line and is like Riyadh’s line, with a slope of 5.2, as found by [50]. In conclusion, the δ18O and δ2H values of the sampled groundwater indicate that the recharge of the coastal aquifer originates from meteoric sources.

4.1.3. Estimation of Groundwater Recharge

As the global population continues to increase, a growing number of individuals will depend on groundwater resources, especially in arid and semi-arid regions like the study area [52]. The long-term sustainability of groundwater supplies for expanding populations and irrigation activities can only be guaranteed through the development and implementation of effective management strategies. Thus, it is essential to quantify the natural rates of groundwater recharge for the efficient management of groundwater resources. Although recharge is one of the most critical elements in groundwater research, it remains one of the least realized, primarily due to the significant variability of recharge rates across different locations and times, as well as the challenges associated with directly measuring these rates. Recently, groundwater recharge was assessed through various methods, including water balance, water level fluctuation, CMB, and the SWAT model. These methods analyze factors such as precipitation, evapotranspiration, runoff, soil moisture, and aquifer response to ascertain the volume of water that infiltrates the ground and replenishes groundwater reserves. Accordingly, the study area in Jazan Province, KSA has hundreds of groundwater wells which extract millions of cubic meters per year, and there is a critical drawdown in the water level. Thus, it is very important to assess the rate of recharge to groundwater of the coastal aquifer in the study area using the methods described below.
  • Chloride mass balance (CMB) method
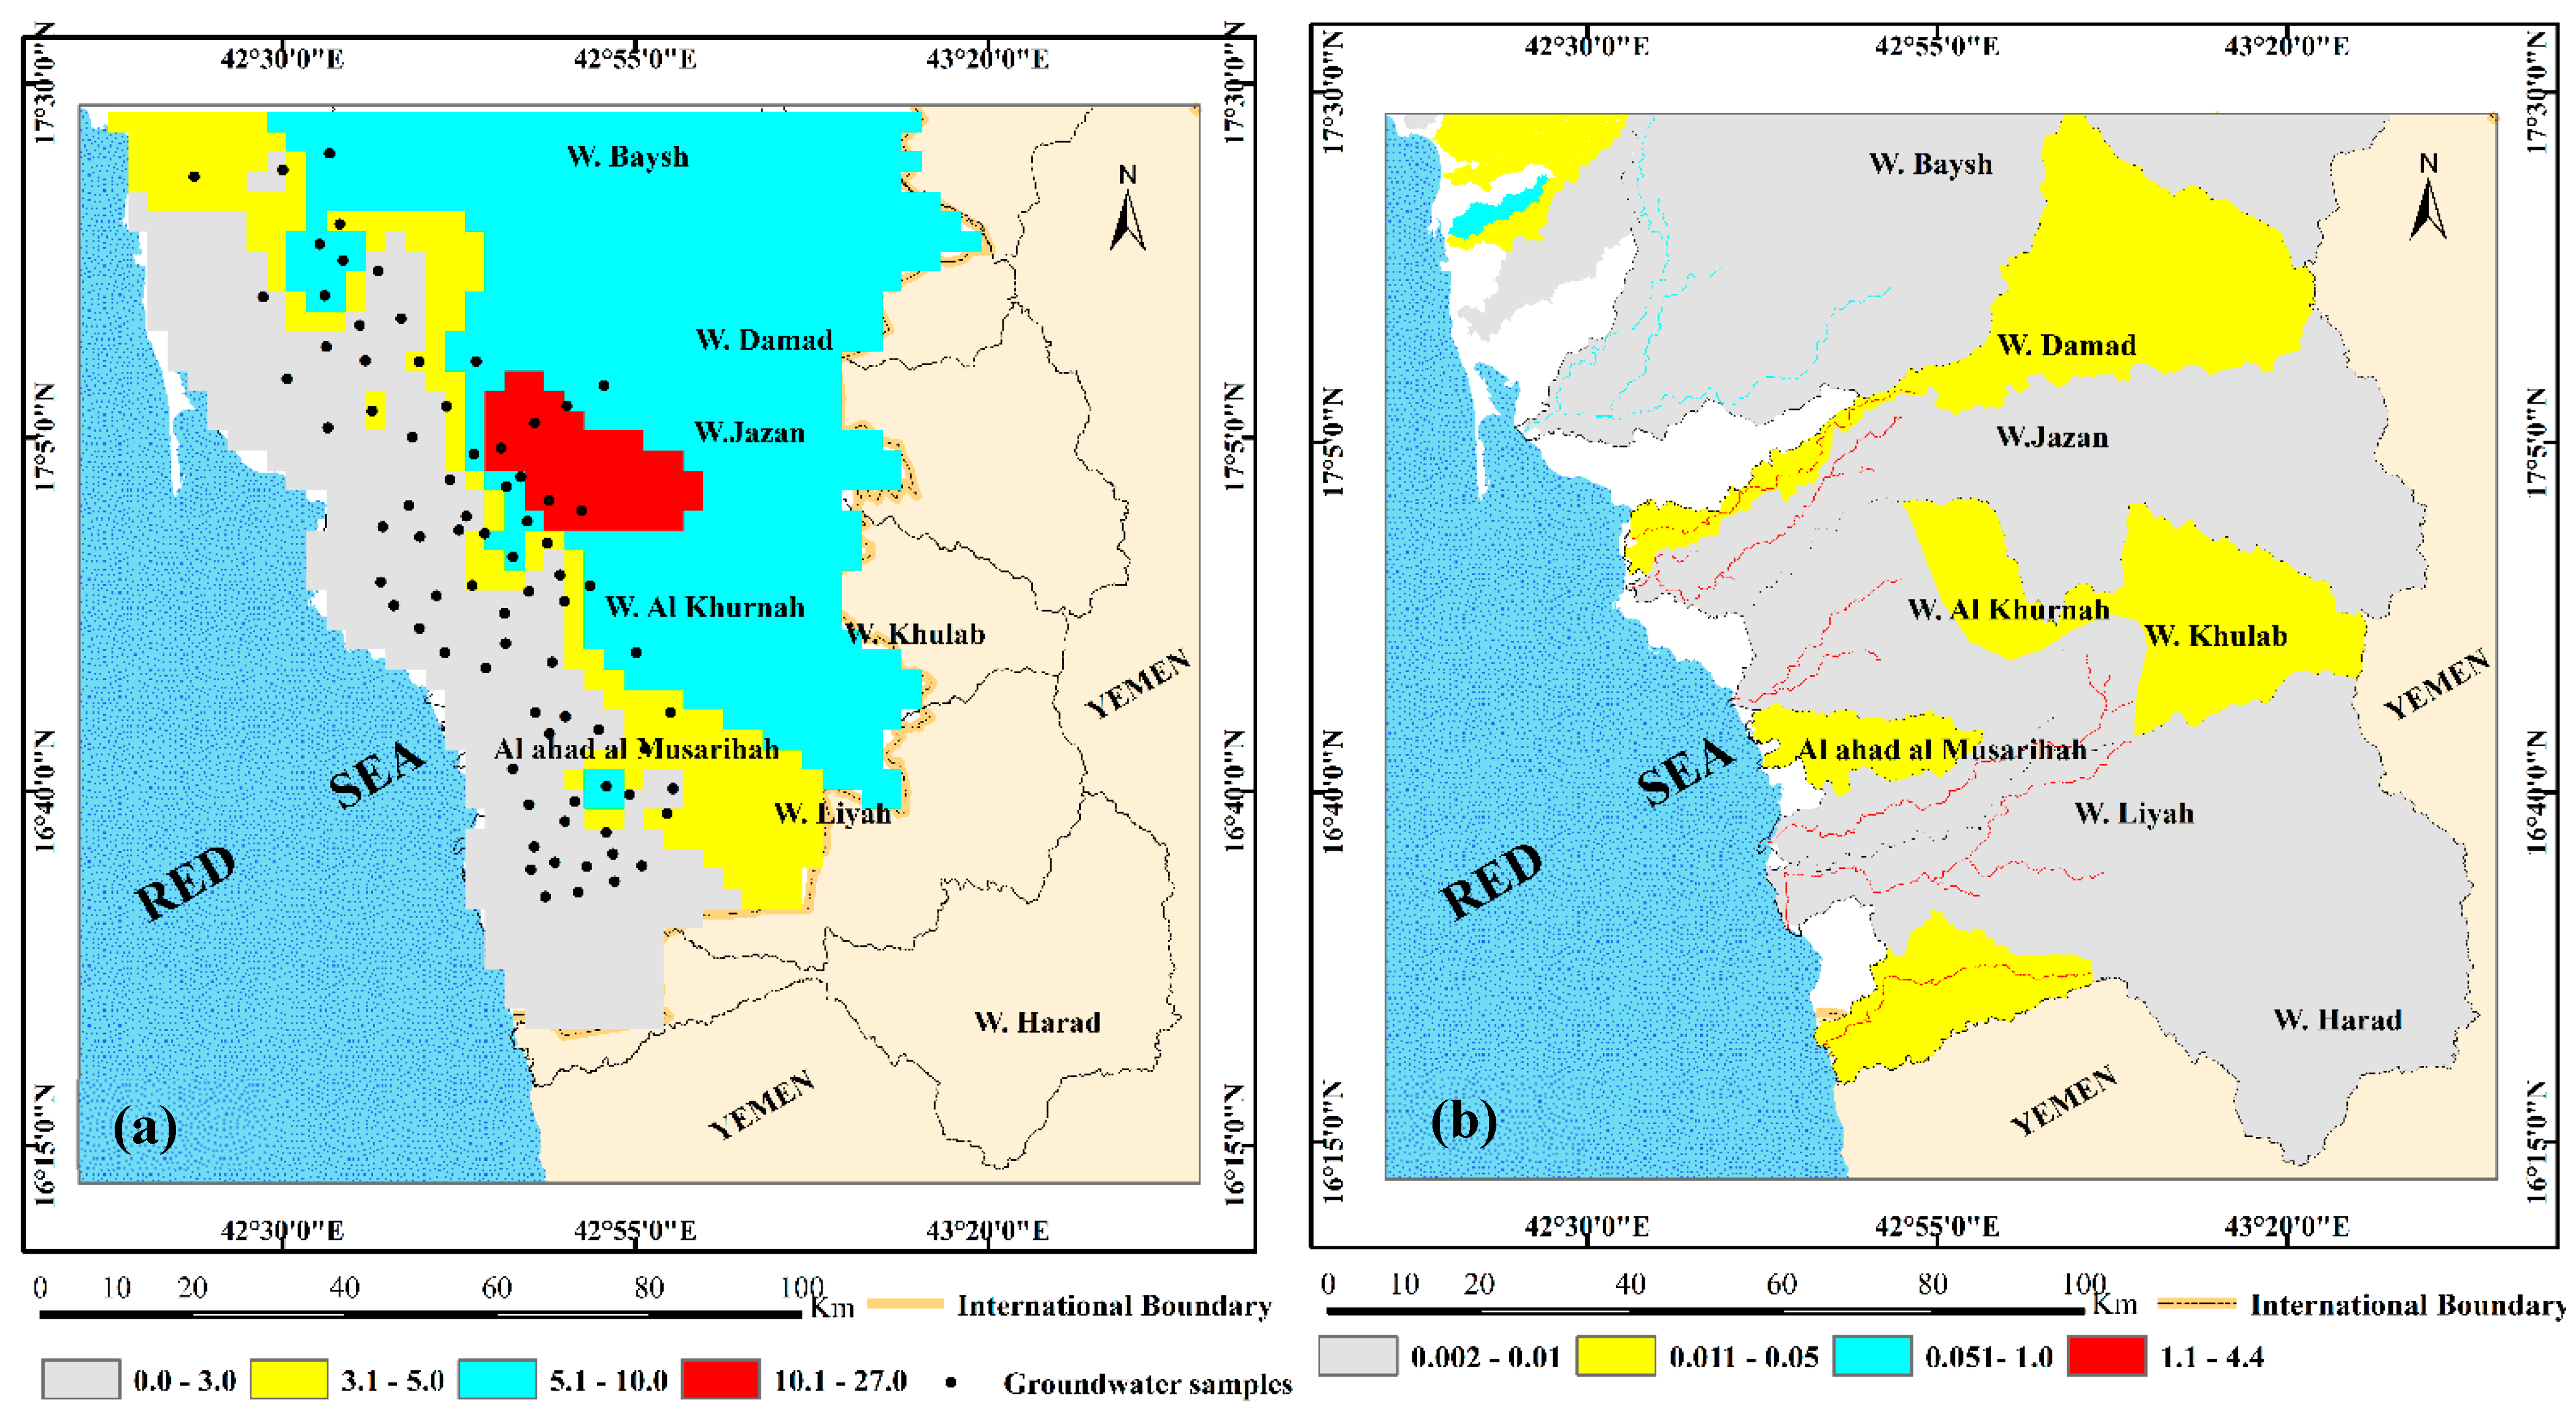
This technique employs a geochemical method to assess recharge. It is based on the principle that the concentration of chloride in groundwater varies as recharge takes place due to rainfall. By analyzing the chloride levels in both rainfall and groundwater, one can estimate the extent of dilution that has happened, which reflects the volume of recharge. This approach requires a comprehension of the yearly rainfall rates and the chloride levels contained within that rainfall, as well as the Cl level detected in the groundwater of the considered coastal aquifer. As a result, these data facilitate the assessment of groundwater recharge within study area. Based on Equation (1) in the methodology section, quantifying the recharge to the coastal aquifer during this study utilized a weighted mean of rainfall (as shown in Figure 6b) that was found to be 79.7 mm to 249.9 mm, a weighted chloride concentration in rainfall, which was measured to be 6.15 mg/L (as listed in Table 1), and slanted Cl values in 78 groundwater samples ranging from 27.60 to 7200.00 mg/L. Accordingly, the estimated annual recharge rates at all groundwater sites are ranging between 1.12 mm and 34 mm, with a mean value round 5.64 mm (Figure 12a). On the other hand, the anticipated recharge as a percentage of rainfall varied from 0.59% and 20.59%, with an average value of 3.57% of rainfall. The estimated recharge values are low, especially in the western portion of the study area, because rainfall events usually happen over brief intervals, resulting in flash floods. As this flood mainly deposits clay, the infiltration rate is extremely low or almost nonexistent. The finding of this method (CMB) for estimating the average recharge to groundwater of coastal aquifers (3.57% of rainfall) agrees with a previous study conducted by [33] of wadi Qanunah basin (north of the study are), where the estimated average value of recharge was 4.25% of rainfall. Consequently, the CMB utilized in this research demonstrates strong accuracy and effectively forecasts the recharge for the coastal aquifer in the investigated area.
  • Soil and water assessment tool (SWAT) model
This approach poses a challenge in estimating groundwater recharge by examining the connections among satellite image analysis, SWAT, and GIS methodologies (Figure 4). The SWAT model divided the watershed of the study area into similar units known as hydrologic response units (HRUs), which are defined by parameters including soil class and landscape. The catchments of the study area cover an area of approximately 11,010 km2, which is divided into 6655 km2 of mountainous terrain (basement rocks) and 3755 km2 of the wadi plain (Quaternary deposits). According to the historical rainfall data for the hydrological period from 1966 to 2018, the highest average annual precipitation recorded in the mountainous region (upstream section) is 500 mm, whereas in the downstream section, it is approximately 100 mm (Figure 6b). In this study, the SWAT model was used to calculate a daily water balance for each hydrological response unit (HRU), factoring in precipitation, evapotranspiration, surface runoff, and the transfer of soil water. Groundwater recharge is evaluated when the soil moisture exceeds its storage capacity, leading to percolation and infiltration into the aquifer system. Accordingly, the average yearly precipitation in the upstream region can be categorized into two parts: evapotranspiration losses, which represent about 89% (445 mm), and effective rainfall, which makes up 11% (55 mm/year). Approximately 30% (16.5 mm) of the effective rainfall in the upstream region contributes to recharge of the groundwater aquifer through the basement fracture, whereas the remaining 70% (34.5 mm/year) is released as surface runoff into the primary valleys of the drainage basins leading towards the downstream area. In the downstream area (Quaternary), the average annual precipitation can also be categorized into two segments: evapotranspiration losses, which are about 90% (90 mm), and effective rainfall, which is 10% (10 mm/year). The operative rainfall in the downstream area, which signifies rainfall excess or surface runoff, is further divided into approximately 90% (9 mm/year) associated with evapotranspiration losses and 10% (1 mm/year) allocated for recharge within the main channels of the drainage basins. In conclusion, the estimated annual recharge to the coastal aquifer in the study area using the SWAT model ranged between 1 mm/year and 16.5 mm/year, with a mean value of 8.75 mm/year (Figure 12b). The estimated recharge values are high in the main channels of the basins due to the high infiltration rates. The results obtained from the SWAT recharge model in the study are consistent with the JICA internal report [40] and the research conducted by [27], which determined that the annual groundwater recharge throughout all regions of the Jazan province constitutes roughly 30% and 15% of the effective rainfall that occurred in the upstream and downstream regions, respectively.
The aim of this research was to rate the recharge for groundwater of the coastal aquifer through the application of two methods: CMB and the SWAT model. The results obtained by the two techniques are different due to reasons such as the presence of additional chloride sources (seawater, soil salinization, irrigation inputs, or industrial runoff), as well evaporation, as demonstrated by the isotopic analysis, as shown in Figure 11. Meanwhile, CMB provides an average value for the basin, while SWAT provides a spatial distribution; comparisons are inconsistent if the same spatial unit is not compared. Groundwater recharge estimation contributes to the development of scientific policies and strategic plans for managing water resources and improving quantity and quality, which has a positive impact on enhancing water security and supporting agriculture, industry, and daily individual use.

5. Conclusions

Estimation of groundwater recharge is considered the essential factor for groundwater management and sustainability, especially in arid and semi-arid regions. This research focused on the use of three corresponding approaches, including environmental isotopes (18O and 2H), CMB, and the SWAT model, by integrating GIS with hydrological and hydrochemical techniques based on the influence of environmental factors (rainfall, soil, vegetation cover). The coastal Quaternary aquifer of unconfined conditions is considered the main source of naturally renewing groundwater for agriculture, domestic, and industrial uses in the study area. Variability in groundwater quality was observed, with electrical conductivity (EC) between 1082 and 23,840 μS/cm and total dissolved solids (TDSs) from 604 to 14,673 mg/L. Three chemical facies are described for the groundwater, including Na-Cl, mixed Mg-Cl-SO4, and Ca-Mg-HCO3 facies. The range of δ18O isotopes varied from −1.10‰ to +1.03‰, yielding an average value of −0.245‰, and the range of hydrogen δ2H isotopes was from −0.63‰ to 11.63‰, with an average of 5.87‰. The results of environmental isotopes indicating that the study groundwater predominantly originated from meteoric sources with effect of evaporation. The estimated annual recharge rate using CMB ranged between 1.12 and 34 mm by a mean value around 5.64 mm, and the percentage of rainfall varied from 0.59% and 20.59%, with an average value of 3.57% of rainfall. On the other hand, the estimated annual recharge to the coastal aquifer using the SWAT model ranged between 1 mm/year and 16.5 mm/year, with a mean value of 8.75 mm/year. The results obtained by the two applied methods are different due to reasons including the presence of additional chloride sources, as well as evaporation, which is clear from the isotopic analysis. While SWAT provides a spatial distribution, comparisons are inconsistent if the same spatial unit is not compared.
Finally, further scope of works and recommendations that might contribute to sustainability of groundwater resources include operation of multiple rainfall stations, periodic measurement of groundwater levels, applying modern irrigation systems, reducing overpumping from wells, and continuous measuring of groundwater quality.
This study faced some limitations, such as a lack of rainfall sample analysis, unknown secondary chloride sources, and some missing some hydrological and geological information. Therefore, some recommendations for future studies should be considered, as follows:
  • Increasing the Hydrological and Chemical Monitoring Network.
  • Investigating secondary chloride sources.
  • Enhancing geological and hydrogeological data input.
  • Studying the impact of land use change.
  • Establishing an integrated database.

Author Contributions

Conceptualization, M.M. and M.E.O.; methodology, M.M., M.E.O., J.B. and B.N.; software, M.M., N.A.-A., R.H., A.A. and M.S.; validation, J.B., B.N. and N.A.-A.; formal analysis, M.M., M.E.O., A.A. and R.H.; investigation M.E.O., J.B., B.N., N.A.-A. and A.A.; resources, M.M., J.B., M.S. and B.N.; data curation, M.M., M.E.O., A.A. and R.H.; writing—original draft preparation, M.E.O., M.M., N.A.-A. and A.A.; writing—review and editing, M.M., M.E.O., M.S. and B.N.; project administration, M.M. All authors have read and agreed to the published version of the manuscript.

Funding

This project was funded by the Deanship of Scientific Research (DSR), King Abdulaziz University, Jeddah, Saudi Arabia, under grant no. IPP: 22-123-2025. The authors therefore acknowledge with thanks DSR for the technical and financial support.

Institutional Review Board Statement

Not applicable.

Informed Consent Statement

Not applicable.

Data Availability Statement

All data are provided as tables and figures in this article.

Conflicts of Interest

The authors declare that they have no known competing financial interests or personal relationships that could have appeared to influence the work reported in this paper.

References

  1. Amin, M.; Ashraf, M. The challenges and potential strategies of Saudi Arabia’s water Resources: A review in analytical way. Environ. Nanotechnol. Monit. Manag. 2023, 20, 100855. [Google Scholar] [CrossRef]
  2. Eagleson, P.S. The annual water balance. J. Hydraul. Div. 1979, 105, 921–941. [Google Scholar] [CrossRef]
  3. Lerner, D.N.; Issar, A.S.; Simmers, I. Groundwater Recharge: A Guide to Understanding and Estimating Natural Recharge; IAH International Contributions to Hydrogeology; Taylor and Francis: New York, NY, USA; Balkema: Rotterdam, The Netherlands, 1990. [Google Scholar]
  4. Flint, A.L.; Flint, L.E.; Kwicklis, E.M.; Fabryka-Martin, J.T.; Bodvarsson, G.S. Estimating recharge at Yucca Mountain, Nevada, USA: Comparison of methods. Hydrogeol. J. 2002, 10, 180–204. [Google Scholar] [CrossRef]
  5. Edmunds, W.; Fellman, E.; Goni, I.; Prudhomme, C. Spatial and temporal distribution of groundwater recharge in northern Nigeria. Hydrogeol. J. 2002, 10, 205–215. [Google Scholar] [CrossRef]
  6. Carter, R.; Morgulis, E.; Dottridge, J.; Agbo, J. Groundwater modelling with limited data: A case study in a semi-arid dunefield of northeast Nigeria. Q. J. Eng. Geol. Hydrogeol. 1994, 27, S85–S94. [Google Scholar] [CrossRef]
  7. Fritz, P.; Fontes, J.C. The Terrestrial Environment A. In Handbook of Environmental Isotope Geochemistry; Elsevier: Amsterdam, The Netherlands, 1980; Volume 1. [Google Scholar]
  8. Wood, W.W.; Imes, J.L. How wet is wet? Precipitation constrains on late Quaternary climate in southern Arabian Peninsula. J. Hydrol. 1995, 164, 263–268. [Google Scholar] [CrossRef]
  9. Wood, W.W.; Sanford, W.L. Chemical and isotopic methods for quantifying groundwater recharge in a regional, semi-arid environment. Ground Water 1995, 33, 458–468. [Google Scholar] [CrossRef]
  10. Wood, W.W. Use and Misuse of the Chloride-Mass Balance Method in Estimating Ground Water Recharge. Ground Water 1999, 37, 2–3. [Google Scholar] [CrossRef]
  11. Shi, J.; Wang, Q.; Chen, G.; Wang, G.; Zhang, Z. Isotopic geochemistry of the groundwater system in arid and semiarid areas and its significance: A case study in Shiyang River basin, Gansu province, northwest China. Environ. Geol. 2001, 40, 557–565. [Google Scholar] [CrossRef]
  12. Kattan, Z. Use of hydrochemistry and environmental isotopes for evaluation of groundwater in the Paleogene limestone aquifer of the Ras Al-Ain area (Syrian Jezireh). Environ. Geol. 2001, 41, 128–144. [Google Scholar] [CrossRef]
  13. International Atomic Energy Agency. Atomic Energy Review; No. 1; IAEA: Vienna, Austria, 1980; Volume 18. [Google Scholar]
  14. International Atomic Energy Agency. Nuclear Power Reactors in the World September; 1983 ed.; Reference Data Series No. 2; IAEA: Vienna, Austria, 1983. [Google Scholar]
  15. Clark, I.; Fritz, P.F. Environmental Isotopes in Hydrology; Lewis Publishers: Boca Raton, FL, USA, 1998. [Google Scholar] [CrossRef]
  16. Uugulu, S.; Wanke, H. Estimation of groundwater recharge in savannah aquifers along a precipitation gradient using chloride mass balance method and environmental isotopes, Namibia. Phys. Chem. Earth Parts A/B/C 2020, 116, 102844. [Google Scholar] [CrossRef]
  17. Abdulrazzak, M.; Şorman, Ü.; El-Hames, A. Water balance approach under extreme arid conditions—A case study of Tabalah Basin, Saudi Arabia. Hydrol. Process 1989, 3, 107–122. [Google Scholar] [CrossRef]
  18. Bazuhair, A.S.; Wood, W. Chloride mass-balance method for estimating ground water recharge in arid areas: Examples from western Saudi Arabia. J. Hydrol. 1996, 186, 153–159. [Google Scholar] [CrossRef]
  19. Bazuhair, A.S.; Nassief, M.O.; Al-Yamani, M.S.; Sharaf, M.A.; Bayumi, T.H.; Ali, S. Groundwater Recharge Estimation in Some Wadi Aquifers of the Western Saudi Arabia: King Abdulaziz City for Science and Technology; Project No. AT-17–63; CRC Press: Riyadh, Saudi Arabia, 2002. [Google Scholar]
  20. Alshehri, F.; Mohamed, A. Investigation of groundwater potential using gravity data in Wadi Fatimah and its surroundings, Western Saudi Arabia. Front. Earth Sci. 2023, 11, 1225992. [Google Scholar] [CrossRef]
  21. Alshehri, F.; Abdelrahman, K. Groundwater Potentiality of Wadi Fatimah, Western Saudi Arabia: Geophysical and Remote Sensing Integrated Approach. Water 2023, 15, 1828. [Google Scholar] [CrossRef]
  22. Alshehri, F.; Sultan, M.; Karki, S.; Alwagdani, E.; Alsefry, S.; Alharbi, H.; Sahour, H.; Sturchio, N. Mapping the distribution of shallow groundwater occurrences using Remote Sensing-based statistical modeling over southwest Saudi Arabia. Remote Sens. 2020, 12, 1361. [Google Scholar] [CrossRef]
  23. Mallick, J.; Singh, C.K.; AlMesfer, M.K.; Singh, V.P.; Alsubih, M. Groundwater Quality Studies in the Kingdom of Saudi Arabia: Prevalent Research and Management Dimensions. Water 2021, 13, 1266. [Google Scholar] [CrossRef]
  24. Masoud, M.H.Z.; Rajmohan, N.; Basahi, J.M.; Niyazi, B.A.M. Application of water quality indices and health risk models in the arid coastal aquifer, Southern Saudi Arabia. Environ. Sci. Pollut. Res. 2022, 29, 70493–70507. [Google Scholar] [CrossRef]
  25. Aly, A.A.; Al-Omran, A.M.; Alharby, M.M. The water quality index and hydrochemical characterization of groundwater resources in Hafar Albatin, Saudi Arabia. Arab. J. Geosci. 2015, 8, 4177–4190. [Google Scholar] [CrossRef]
  26. Al-Harbi, O.A.; Hussain, G.; Lafouza, O. Irrigation water quality evaluation of Al-Mendasah groundwater and drainage water, Al-Madenah Al-Monawarah region, Saudi Arabia. Int. J. Soil Sci. 2010, 5, 282–300. [Google Scholar] [CrossRef]
  27. Shereif, H.M. Delineation of potential sites for groundwater recharge using a GIS-based decision support system. Environ. Earth Sci. 2014, 72, 3429–3442. [Google Scholar] [CrossRef]
  28. Masoud, M.; El Osta, M.; Al-Amri, N.; Niyazi, B.; Alqarawy, A.; Rashed, M. Groundwater Characteristics’ Assessment for Productivity Planning in Al-Madinah Al-Munawarah Province, KSA. Hydrology 2024, 11, 99. [Google Scholar] [CrossRef]
  29. El Maghraby, M.; Bamousa, A.O. Evaluation of groundwater quality for drinking and irrigation purposes using physicochemical parameters at Salilah area, Madinah Munawarah District, Saudi Arabia. J. Taibah Univ. Sci. 2021, 15, 695–709. [Google Scholar] [CrossRef]
  30. Hussain, S.; Niyazi, B.; Elfeki, A.M.; Masoud, M.; Wang, X.; Awais, M. SWAT-Driven Exploration of Runoff Dynamics in Hyper-Arid Region, Saudi Arabia: Implications for Hydrological Understanding. Water 2024, 16, 2043. [Google Scholar] [CrossRef]
  31. Abdalla, F.; Al-Turki, A.; Al Amri, A. Evaluation of groundwater resources in the Southern Tihama plain, Saudi Arabia. Arab. J. Geosci. 2015, 8, 3299–3310. [Google Scholar] [CrossRef]
  32. Khan, M.Y.A.; ElKashouty, M.; Subyani, A.M.; Tian, F.; Gusti, W. GIS and RS intelligence in delineating the groundwater potential zones in Arid Regions: A case study of southern Aseer, southwestern Saudi Arabia. Appl. Water Sci. 2022, 12, 3. [Google Scholar] [CrossRef]
  33. El Osta, M.; Masoud, M.; Al-Amri, N.; Alqarawy, A.; Halawani, R.; Rashed, M. Estimation of groundwater recharge by chloride mass balance (CMB) method in some selected wadis, Western Saudi Arabia in (1966–2018). Environ. Earth Sci. 2025, 84, 321. [Google Scholar] [CrossRef]
  34. Hassan, I.; Salamah, S.; Bob, M. Shallow water table rise and fluctuation between 1977 and 2010 in Madinah City, Saudi Arabia. Discov. Environ. 2024, 2, 88. [Google Scholar] [CrossRef]
  35. Masoud, M.; El Osta, M.; Al-Amri, N.; Niyazi, B.; Alqarawy, A.; Halawani, R.; Rashed, M. Groundwater Recharge Evaluation Using Stable Isotopes and the NETPATH Model in Al-Madinah Al-Munawarah Province, Saudi Arabia. Water 2025, 17, 211. [Google Scholar] [CrossRef]
  36. Masoud, M.; El Osta, M.; Alqarawy, A.; Izzeldin, H. Application of Environmental Isotopes and Hydrochemistry to Identify the Groundwater Recharge in Wadi Qanunah Basin, Saudi Arabia. Sustainability 2023, 15, 2648. [Google Scholar] [CrossRef]
  37. Al-Turki, S. Water Resources in Saudi Arabia with Particular Reference to Tihama Asir Province. Ph.D. Thesis, Department of Geography, University of Durham, Durham, UK, 1995; 612p. Available online: http://core.kmi.open.ac.uk/download/pdf/9640285.pdf (accessed on 23 December 2013).
  38. Basahel, A.; Bahafzalla, A.; Mansour, H.; Omara, S. Primary structures and depositional environments of the Haddat Ash Sham sedimentary sequence, northwest of Jeddah, Saudi Arabia. Arab Gulf J. Sci. Res. 1983, 1, 143–155. [Google Scholar]
  39. Kinzelbach, W.; Aeschbach, W.; Alberich, C.; Goni, I.B.; Beyerle, U.; Brunner, P.; Chiang, W.H.; Rueedi, J.; Zoellmann, K. A Survey of Methods for Groundwater Recharge in Arid and Semiarid Regions; Early Warning and Assessment Report Series; UNEP/DEWA/RS.02–2; United Nations Environment Program: Nairobi, Kenya, 2002. [Google Scholar]
  40. Japan International Cooperation Agency, JICA. Chapter 4: Water Resources Potential. In The Study on Master Plan on Renewable Water Resources Development in the Southwest Region in the Kingdom of Saudi Arabia; Yachiyo Engineering Co., Ltd.: Tokyo, Japan, 2010; pp. S-4-1–S-7-3. [Google Scholar]
  41. Scanlon, R.; Healy, R.W.; Cook, P.G. Choosing appropriate techniques for quantifying groundwater recharge. Hydrogeol. J. 2002, 10, 18–39. [Google Scholar] [CrossRef]
  42. Erikson, E.H. The Distribution of Salinity in the Groundwater of Delhi Origin and Recharge Rates of Groundwater; IAEA: Vienna, Austria, 1975; pp. 171–177. [Google Scholar]
  43. Glenn, T. An Introduction to Climate, 3rd ed.; McGraw-Hill: New York, NY, USA, 1954. [Google Scholar]
  44. Mahmoodi, N.; Wagner, D.P.; Kiesel, J.; Fohrer, N. Modeling the impact of climate change on stream flow and major hydrological components of an Iranian Wadi system. J. Water Clim. Change 2021, 12, 1598–1613. [Google Scholar] [CrossRef]
  45. Allison, G.B.; Gee, G.W.; Tyler, S.W. Vadoze-zone Techniques for estimating groundwater recharge in arid and semi-arid regions. Soil Sci. Soc. Am. J. 1994, 58, 6–14. [Google Scholar] [CrossRef]
  46. Chebotarev, I.I. Metamorphism of natural waters in the crust of weathering. Geochim. Cosmochim. Acta 1955, 8, 22–32, IN1–IN2, 33–48. [Google Scholar] [CrossRef]
  47. Piper, A.M. A graphic procedure in the geochemical interpretation of water-analyses. EOS Trans. Am. Geophys. Union 1944, 25, 914–928. [Google Scholar]
  48. Yu, I.; Massoudieh, A.; Green, C.T.; Lee, K.-L.; Kaown, D. Complexity of groundwater age mixing near a seawater intrusion zone based on multiple tracers and Bayesian inference. Sci. Total Environ. 2021, 753, 141994. [Google Scholar] [CrossRef]
  49. Craig, H. Isotopic variations in meteoric waters. Science 1961, 133, 1702–1703. [Google Scholar] [CrossRef]
  50. Al-Harbi, O.A.; Ghulam Hussain, G.H.; Khan, M.M.; Moallim, M.A.; Al-Sagaby, I.A. Evaluation of Groundwater Quality and its Recharge by Isotopes and Solute Chemistry in Wadi Malal, Al-Madinah Al-Munawarah, Saudi Arabia. Pak. J. Biol. Sci. 2006, 9, 260–269. [Google Scholar] [CrossRef]
  51. Michelsen, N.; Reshid, M.; Siebert, C.; Schulz, S.; Knöller, K.; Weise, S.M.; Rausch, R.; Al-Saud, M.; Schüth, C. Isotopic and chemical composition of precipitation in Riyadh, Saudi Arabia. Chem. Geol. 2015, 413, 51–62. [Google Scholar] [CrossRef]
  52. Simmons, C.T.; Hong, H.; Wye, D.; Cook, P.G.; Love, A.J. Signal propagation and periodic response in aquifers: The effect of fractures and signal measurement methods. In Water 99 Joint Congress; Institution of Engineers: Barton, ACT, Australia, 1999; pp. 727–732. [Google Scholar]
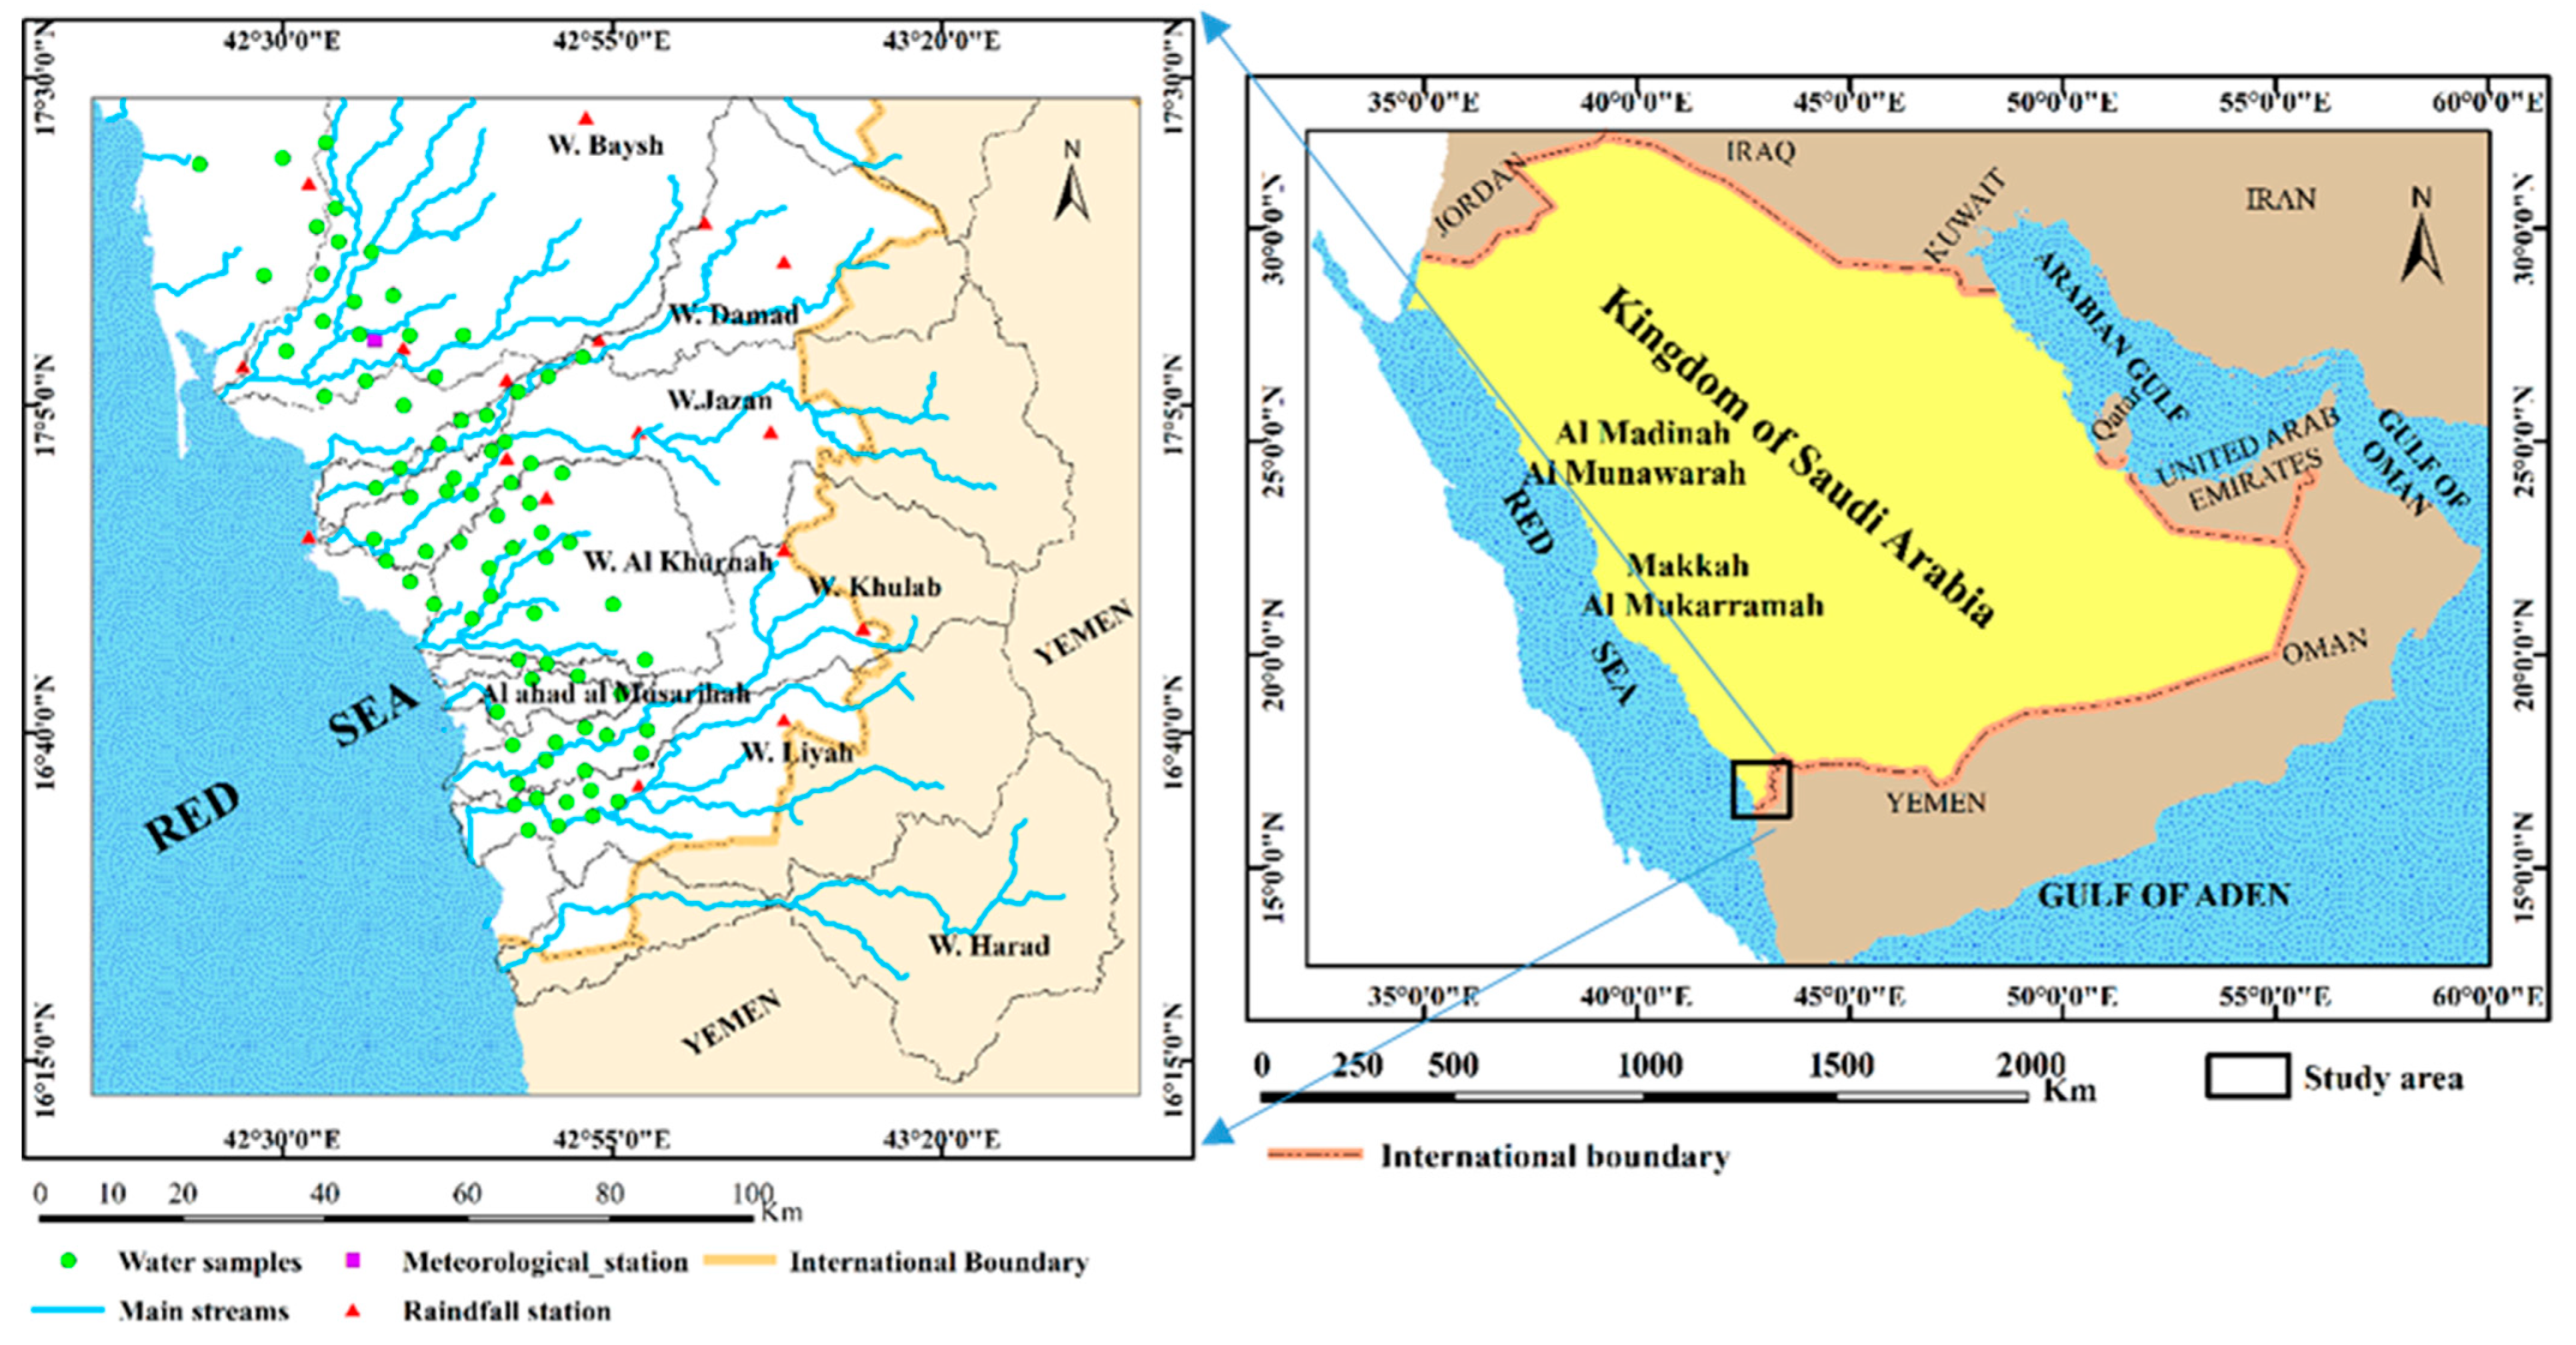
Figure 1. Key map and location of groundwater samples in the study area, Jazan Province, KSA.
Hydrology 12 00306 g001
Figure 2. Digital elevation model (a) and geological map (b) of the study area, Jazan Province, KSA.
Hydrology 12 00306 g002
Figure 3. Hydrogeological cross-sections of the study area (Unconfined aquifer), [1].
Hydrology 12 00306 g003
Figure 4. Chart for groundwater recharge estimation using a SWAT model in the study area, Jazan Province, KSA. Modified after JICA [40].
Hydrology 12 00306 g004
Figure 5. Depth to water (a) and water table (b) contour maps for the coastal aquifer in the study area, Jazan Province, KSA.
Hydrology 12 00306 g005
Figure 6. Seasonal variation in meteorological parameters (a) and isohyetal map (b) of the study area, Jazan Province (1966–2018), KSA.
Hydrology 12 00306 g006
Figure 7. Total dissolved solids in mg/L (a) and chloride concentration in mg/L (b) contour maps for groundwater of the coastal aquifer in the study area, Jazan Province, KSA.
Hydrology 12 00306 g007
Figure 8. Groundwater classification and geochemical processes affecting groundwater of the coastal aquifer in the study area, Jazan Province, KSA [46].
Hydrology 12 00306 g008
Figure 9. Electrical conductivity (EC) in μS/cm versus bromine and iodine in mg/L for groundwater of the coastal aquifer in the study area, Jazan Province, KSA.
Hydrology 12 00306 g009
Figure 10. HFE diagram for groundwater facies of the coastal aquifer in the study area, Jazan Province, KSA.
Hydrology 12 00306 g010
Figure 11. Global meteoric water line and stable isotope signatures for deuterium versus oxygen-18 for groundwater samples of the coastal aquifer in the study area, Jazan Province, KSA (the isotopic data of Wadi Malal and Al-Madinah Al Munawarah, as well as rain in Riyadh, were also plotted [35,50,51]).
Hydrology 12 00306 g011
Figure 12. Estimated annual recharge rate (mm) for groundwater of the coastal aquifer using the CMB method (a) and a SWAT model (b) in the study area, Jazan Province, KSA.
Hydrology 12 00306 g012
Table 1. Measured physicochemical parameters of groundwater samples from the coastal aquifer.
Physicochemical Parameters(Number of Groundwater Samples = 78)Rainwater Sample
UnitMinimumMaximum
pH-6.27.66.94
ECµS/cm108223,840130.00
TDSmg/L60414,67376.00
Na+mg/L7028001.87
Ca2+mg/L63.71650.017.30
Mg2+mg/L25.3650.00.54
K+mg/L1.004703.18
HCO3mg/L111555.10.00
Clmg/L27.67200.06.15
SO42−mg/l120378022.70
NO3mg/L7.28123.765.96
Img/L0.03080.367517--
Brmg/L1.6351.20--
THmg CaCO3/L267.0186796.7545.50
Table 2. Results of deuterium and oxygen-18 for selected groundwater samples from the coastal aquifer in the study area, Jazan Province, KSA.
Sample No.mw 18Omw dDStdev 18OStdev dD
1−1.001.360.130.30
2−0.992.720.130.46
30.439.820.100.88
5−0.228.030.120.31
6−0.765.130.100.27
8−1.022.890.080.38
11−0.137.520.090.37
14−0.784.580.100.27
170.5611.630.060.16
200.027.230.040.34
22−1.101.240.030.30
240.589.570.080.52
251.0311.180.040.34
27−0.971.930.040.22
28−0.732.870.110.28
29−0.99−0.630.050.17
300.5410.970.060.43
310.269.320.070.37
33−0.285.870.030.11
42−0.155.710.050.39
44−0.226.550.070.29
48−0.425.250.060.31
52−0.364.580.080.20
56−0.146.810.100.55
61−0.702.400.080.68
660.128.030.060.62
71−0.066.090.080.50
72−0.303.900.080.20
760.248.440.060.58
Rainwater1.1711.250.290.77
Seawater2.3011.602.690.79
Disclaimer/Publisher’s Note: The statements, opinions and data contained in all publications are solely those of the individual author(s) and contributor(s) and not of MDPI and/or the editor(s). MDPI and/or the editor(s) disclaim responsibility for any injury to people or property resulting from any ideas, methods, instructions or products referred to in the content.