Article

Robust and Fast Sensing of Urban Flood Depth with Social Media Images Using Pre-Trained Large Models and Simple Edge Training

1
School of Water Conservancy and Transportation, Zhengzhou University, No. 100 Science Rd, Zhengzhou 450001, China
2
School of Artificial Intelligence and Automation, Huazhong University of Science and Technology, No. 1037 Luoyu Rd, Wuhan 430074, China
3
China Belt and Road Joint Lab on Measurement and Control Technology, No. 1037 Luoyu Rd, Wuhan 430074, China
4
School of Architecture, Building and Civil Engineering, Loughborough University, Epinal Way, Loughborough LE11 3TU, UK
*
Authors to whom correspondence should be addressed.
These authors contributed equally to this work.
Hydrology 2025, 12(11), 307; https://doi.org/10.3390/hydrology12110307
Submission received: 21 September 2025 / Revised: 6 November 2025 / Accepted: 12 November 2025 / Published: 17 November 2025
(This article belongs to the Special Issue Advances in Urban Hydrology and Stormwater Management)

Abstract

Accurately estimating urban floodwater depth is a critical step in enhancing urban resilience and strengthening disaster prevention and mitigation capabilities. Traditional methods relying on hydrological monitoring stations and numerical simulations suffer from limitations such as sparse spatial coverage, insufficient validation data, limited accuracy, and delayed fast performance. In contrast, social media data—characterized by its vast volume and fast availability, can effectively compensate for these shortcomings. When processed using artificial intelligence (AI) algorithms, such data can significantly improve credibility, disaster perception speed, and water depth estimation accuracy. To address these challenges, this paper proposes a robust and widely applicable method for rapid urban flood depth perception. The approach integrates AI technology and social media data to construct an AI framework capable of perceiving urban physical parameters through multimodal big data fusion without costly model training. By leveraging the near real-time and widespread nature of social media, an automated web crawler collects flood images and their textual descriptions (including reference objects), eliminating the need for additional hardware investments. The framework uses predefined prompts and pre-trained models to automatically perform relevance verification, duplicate filtering, object detection, and feature extraction, requiring no manual data annotation or model training. With only a minimal amount of water depth annotated data and compressed cross-modal feature vectors as training input, a lightweight Multilayer Perceptron (MLP) achieves high-precision depth estimation based on reference objects. This method avoids the need for large-scale model fine-tuning, allowing rapid training even on devices without GPUs. Experiments demonstrate that the proposed method reduces the Mean Square Error (MSE) by over 80%, processes each image in less than 0.5 s (more than 20 times faster than existing large-model approaches), and exhibits strong robustness to changes in perspective and image quality. The solution is fully compatible with existing infrastructure such as surveillance cameras, offering an efficient and reliable approach for fast flood monitoring in urban hydrology and water engineering applications.

1. Introduction

Urban flooding triggered by extreme rainfall events is an important topic in urban resilience, which poses significant hazards, including life-threatening conditions, infrastructure damage, transportation paralysis, and substantial socioeconomic losses. Urban floodwater depth estimation serves as a foundational element for enhancing disaster response capabilities and strengthening, providing critical data to support disaster assessment and informed decision-making. Empirical analyses of catastrophic flood incidents reveal that the absence of robust, large-scale floodwater depth monitoring technologies remains a critical factor exacerbating disaster impacts [1,2,3]. Effective monitoring of urban floodwater depth is indispensable for flood risk mitigation: when integrated with monitoring point location data and GIS technology, the perceived flood depth information can be applied to subsequent applications such as predicting future flood depths, issuing flood depth risk level warnings, planning emergency rescue and evacuation routes under dynamic flood depth conditions, guiding drainage and emergency response planning, and informing infrastructure planning [4,5]. This study focuses on rapid and accurate flood depth perception technology, as it serves as the prerequisite for the aforementioned applications [6]. Such technologies empower both disaster management authorities and residents to implement proactive measures, thereby reducing casualties and safeguarding critical assets.
Current urban water depth sensing methods can be broadly categorized into four types [2,3]. The first category directly employs physical sensors, which transmit water depth data through dedicated monitoring devices [7]. Contact sensors, such as pressure sensors, are submerged in water and measure depth by converting pressure signals into depth data based on the principle that pressure varies with water depth [8]. Non-contact sensors, including sonar and ultrasonic devices, measure the distance between the sensor and the water surface by sending and receiving signals, then calculating the corresponding water depth. While effective, these sensor-based methods face challenges. Wireless sensors are often limited by battery life, and measurement accuracy can be affected by water waves and other disturbances. Moreover, prolonged exposure to humid environments increases the risk of sensor failure, leading to high maintenance costs. Another method involves using graduated water level gauges, where water depth is estimated by recognizing scale marks on the gauge from flood site images [9,10]. However, the small size of these gauges demands high image quality for accurate readings.
The second category is the multi-indicator empirical model method, which leverages limited data such as topography, rainfall patterns, and drainage capacity to develop empirical models for predicting water depth [11,12]. For example, Renata et al. [13,14] applied the Data-Based Mechanistic (DBM) approach and the State-Dependent Parameter (SDP) modeling method to construct models that predict water levels using data related to rainfall and water depth. Galasso and Senarath [15] introduced a hybrid statistical–physical regression method that utilizes data from catchments with similar characteristics but richer flood records to establish statistical relationships among relevant variables. This method helps estimate flood depths in data-scarce regions prone to flooding. Baida et al. [16] proposed a customized model that directly extracts key features from input topography data and rainfall time series for flood depth prediction. However, this method is hindered by significant delays, and both modeling errors and input data inaccuracies can substantially affect prediction accuracy.
The third category relies on topographical information and employs hydrodynamic models to simulate urban flooding dynamics within the study area [17]. Liu et al. [18] applied a hydrodynamic approach combined with an XGBoost model optimized by a genetic algorithm for flood depth prediction. Nhu et al. [19] used satellite imagery alone to determine flood inundation extents and proposed a hydrodynamic model to estimate water levels. Similarly, Hung et al. [20] developed an improved hydrodynamic model to estimate flood depth using satellite images. While effective, this method requires extensive flood data and detailed topographical information as inputs. It is also highly sensitive to initial and boundary conditions, limiting its applicability in regions with insufficient data management capabilities.
For the fourth category, with advancements in artificial intelligence (AI) and image recognition technologies [21], leveraging on-site flood images combined with AI techniques has emerged as a promising direction for urban flood depth estimation. To address data scarcity, methods using deep neural networks for data augmentation have been proposed. Since pre-trained large models do not require extensive labeled data, Temitope et al. [22] introduced an approach that employs a pre-trained large multimodal model (GPT-4 Vision) to automatically estimate flood depth from on-site flood photos. However, this method is inefficient, taking more than 10 s to process a single image that is not even full HD resolution. Researchers have also explored Generative Adversarial Networks (GANs) [23] to generate various types of synthetic data [24], but the reliability of the generated data is limited due to the scarcity of original data. Attempts have also been make to use remote sensing images for flood depth estimation [25,26], but this method tends to produce relatively large errors. Sirsant et al. [27] combined flood images with geographical tags and an Adaboost optimizer for flood depth estimation. However, the availability of such geographically tagged images is limited, posing additional challenges.
Rapid and accurate estimation of urban flood depth without monitoring and hydrodynamic prediction data remains a challenge. With the growing use of social media and surveillance cameras, researchers have increasingly explored leveraging these fast, large-scale data sources. Approaches combining these data with methods such as ordinary gradient optimization [28] and neural networks [29,30,31,32,33,34] have been reported to automatically extract relevant urban features and estimate flood depth. Urban features such as streetlights, flower beds, vehicles, and buildings typically have standard heights, making them reliable reference objects for estimating flood depth from images. For example, Liu et al. [35] developed the BEW-YOLOv8 model for near fast flood depth monitoring of submerged vehicles by integrating bidirectional feature pyramid networks, effective squeeze-and-excitation, and intelligent intersection-over-union into the YOLOv8 model. Park et al. [36] employed Mask-RCNN [37] to extract vehicle targets from images and used the VGG [38] network for flood feature extraction and depth estimation. Other methods for extracting reference targets include R-CNN [39], YOLO [40], and similar techniques.
Although theses applications of AI-based methods to extract reference objects and estimate flood depth from social media images have mitigated data scarcity challenges with improved efficiency and accuracy, they still present several limitations. First, although these methods use web crawlers to automatically gather relevant data, they require significant human intervention to design algorithms to extract text and image information related to specific flood events, remove redundancy, extract flooding features, etc. Second, these AI methods demand extensive labeling works, such as annotation for reference object detection and relevance checks from texts and images, which are time-consuming. Third, the neural networks employed for water depth estimation typically require computationally and memory-intensive training processes with images on their own datasets, resulting in poor transferability. Consequently, their accuracy tends to degrade when sampling or training data is insufficient.
To overcome the aforementioned limitations, this paper proposes a novel method for urban flood depth estimation that combines lightweight edge training with cutting-edge multimodal large models, such as the large language model DeepSeek-R1 [41], along with multimodal models OpenCLIP [42] and YOLO-World [43]. The proposed method achieves improved accuracy, efficiency, and adaptability for fast flood monitoring in urban environments.The proposed method introduces three key innovations:
(1)
This paper proposes a universal and reliable urban floodwater depth-sensing technique. Based on the designed framework that consists of pre-trained large models, our method achieves fully automated and intelligent event-specific flood data mining and relevance filtering, image-based flood/arbitrary target reference relevance filtering and detection, and automatic water-depth feature extraction from reference image regions. Therefore, this method inherits the high-level intelligence and generality of large models, eliminating time-consuming data collection, manual data labeling, and computationally expensive training for texts/images relevance filtering, object detection, and universal image compressive representation.
(2)
To accommodate the rapid switching needs of different water level reference objects, this paper designs the final stage of water depth perception as a lightweight neural network that can be rapidly trained without relying on a GPU. This neural network takes a 512-dimensional vector—generated from the compressed representation of image regions obtained in previous stages—as input, and outputs the water depth. This approach eliminates image-based neural network training, drastically reducing computational/storage demands and only requiring a fast reference-level water depth labeling. When suitable reference objects change due to factors such as differences between cities, it only requires collecting corresponding flood submergence images of the reference objects for water depth labeling, followed by lightweight edge retraining to complete water depth perception. This two-stage design significantly reduces deployment costs.
(3)
Our method improves the efficiency of current large model-based water depth perception from around 10 s to less than 0.5 s by using simple image classification, detection, and feature extraction instead of the time-consuming semantic understanding.
The rest of this paper is organized as follows: Section 2 provides a detailed introduction to the proposed methodology. Section 3 presents the results to validate the proposed approach, followed by brief conclusions in Section 4.

2. Methodology

2.1. The Proposed Methodology Framework

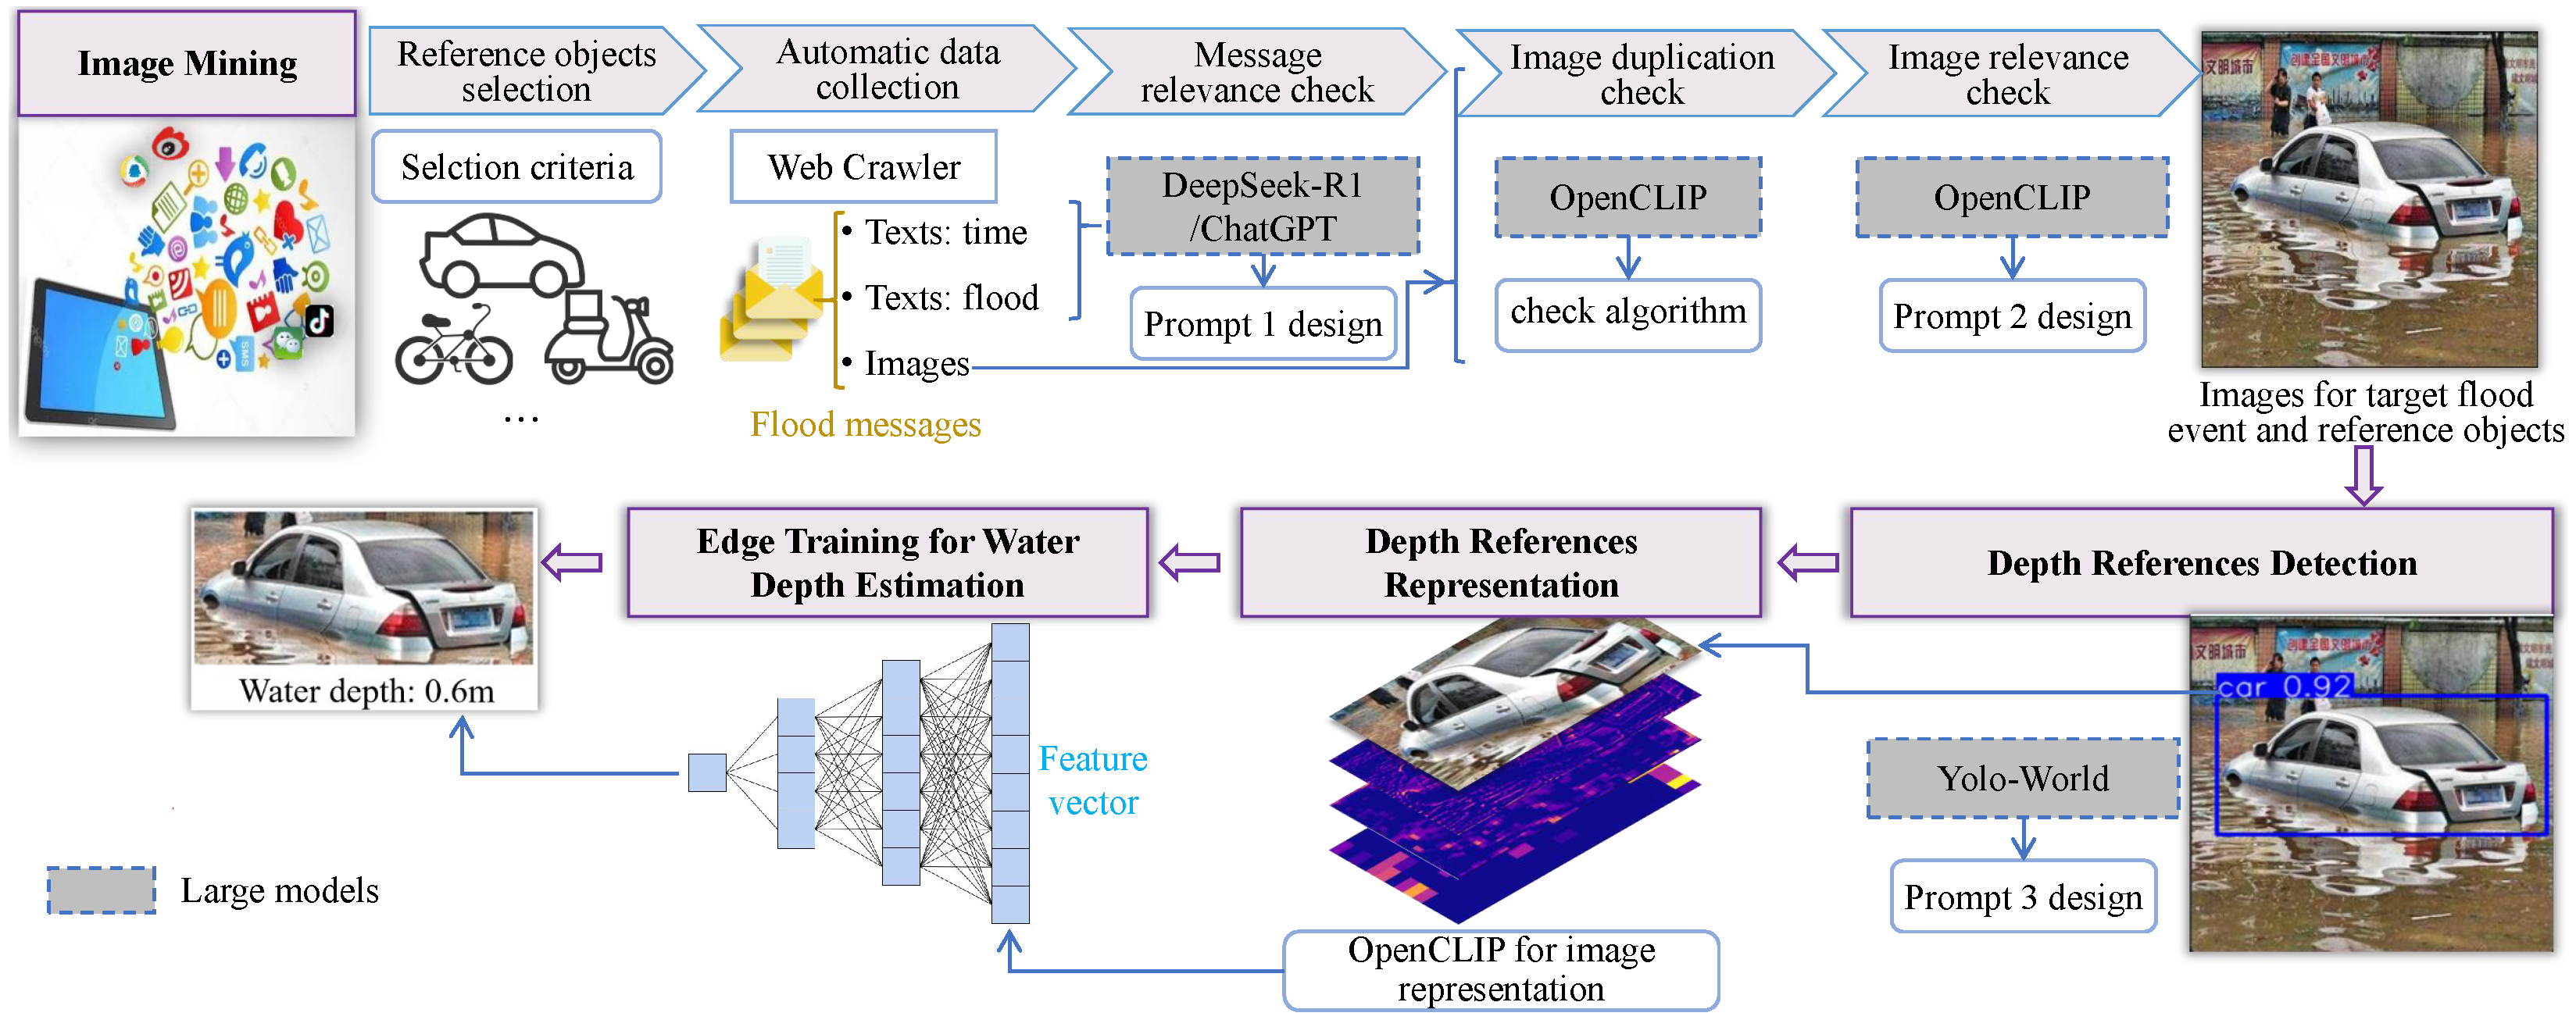
The proposed methodology framework is illustrated in Figure 1 and comprises the following steps.
(1) Image mining. First, we establish the criteria for reference selection suitable for urban flood depth measurement. Then, a web crawler is used for automatic data collection to gather reference and flood-related messages. These messages should include texts for time information, texts for flood description, and images from multiple sources such as web pages, social media feeds, and Douyin. These messages are forwarded to the subsequent message relevance check, image duplication check, and image relevance check stages. These stages are powered by pre-trained large models, the designed prompt templates, and the check algorithm, thus ultimately outputting images for target flood event and reference objects.
(2) Depth references detection. This step aims to extract the smallest rectangular regions containing exclusively a single reference object in images. The first rationale is to achieve water depth estimation at the reference-object level rather than full-image coverage, thereby enhancing spatial resolution. The second rationale stems from the observation that proximal regions to the reference object contain sufficient hydrological information signatures, whereas distal areas exhibit decaying spatial correlations that would compromise the accuracy of depth estimation at the reference location.
(3) Depth references representation. This step employs a pre-trained multimodal large model to directly generate compressed representations of images, mapping high-storage-demand image data into a unique cross-modal feature vector that bridges images and text. This significantly reduces the data throughput required for the subsequent network, thereby enhancing training efficiency.
(4) Edge training for water depth estimation. This is the only step in this method that requires model training. A simple lightweight neural network, such as a multi-layer fully connected network or convolutional neural network, can be employed to learn the mapping from the reference region feature vectors obtained in Step 3 to water depth, aided by reference object image-level depth annotations. Once trained, the model can be directly applied to high-speed depth measurement.
This automated framework streamlines the entire process of flood depth analysis, from multi-source data collection to content filtering and depth estimation. Leveraging large language and multimodal models pre-trained on large-scale datasets such as COCO [44] and ImageNet [45], the framework exhibits strong generalizability and intelligence. These models adapt effectively to common reference objects without additional training, providing reliable feature representations. Notably, only a light-weight prediction neural network requires training at the edge or end devices, significantly reducing manual intervention, improving model adaptability, and effectively addressing the data scarcity challenge faced by traditional methods.

2.2. Flood Image Mining

Effective reference objects should meet three key criteria: (1) They should be common in flood scenes to ensure easy identification and widespread availability. Pedestrians, vehicles, and road signs are frequently observed in urban flood scenes, making them practical choices that enhance the model’s adaptability to diverse environments. (2) Reference objects should have stable and well-defined heights to serve as reliable benchmarks. For instance, adult heights typically range between 1.5 to 1.9 m, while vehicles of the same type follow standardized dimensions. Municipal fixtures like road/traffic signs also maintain fixed heights. (3) The visual characteristics of reference objects should vary noticeably at different water depths to support accurate waterline detection. Vehicles and pedestrians, for example, exhibit clear morphological changes as water levels rise, providing strong visual references for flood depth estimation. In contrast, utility poles, which appear similar over a wide range of heights, are less suitable for this purpose. By following these reference object selection criteria, the subsequent automated data collection can gather massive data that is both widely distributed and rich in water depth information.
The web crawler collects information from a variety of online sources, including web pages (e.g., news websites, government announcements, and social media feeds), social media posts (e.g., personal experiences and on-site photos shared by WeChat users), Facebook (e.g., user posts, group discussions, and public page content), and Douyin (e.g., relevant posts on the short-video platform). Each collected entry, referred to as a “message”, consists of three key components: a text timestamp (indicating when the message was published, which helps define the temporal dimension of the flood event), a text flood description (providing details about the flood situation, location, or other contextual information), and images (showing the specific scene for flood depth analysis). There are numerous engineering methods for implementing the data acquisition via web crawlers. The Python script https://gitee.com/team-resource-billtang_0/water-depth-sensing-with-big-models-and-edge-nn.git (accessed on 6 October 2025) used in this paper supports configuring multiple keywords for a specific flood event, data retrieval latency for different platforms, etc., through a configuration file (config.py). Combined with the user’s own webpage URL library file, it can automatically acquire data. To obtain richer data, the keywords should encompass as many descriptive methods for the specific flood event as possible. This paper does not mandate a specific data storage format. The storage format used in the subsequent experimental section is as follows: disaster description text files (.txt) are placed in a dedicated folder, and images are placed in another separate folder. The text timestamp, the corresponding disaster description text file name, and the corresponding image filenames are stored in a CSV file (denoted as T a b m ) according to the message sequence number. This allows subsequent programs to quickly filter messages using this table. Depending on the quality of the crawled data, applicable preprocessing steps include discarding messages with missing image information, image size normalization, etc.
The collected messages often include information that is not associated with the target flood event. So, the large language model DeepSeek-R1 is employed to assess the text content and determine whether it pertains to a specific flood event. If the model concludes that the text is unrelated to the target flood event, the message is discarded. This filtering process effectively isolates high-quality data relevant to the focus event. To achieve precise and efficient large model filtering, this paper designs the DeepSeek-R1 prompt template. This template specifies core considerations for the large model and constrains its output to concise binary responses (Yes/No), thereby enhancing decision-making efficiency. For instance, in the case of the Zhengzhou 7·20 Flood Event, the prompt template used for this filtering process is shown in Table 1. Users can employ other large models such as ChatGPT, QWen, etc., and write scripts to automatically load the flood description texts of each message from the CSV file to the large model interface, combined with the prompt template designed in this paper to automatically complete the relevance screening for specific flood events. The relevance of each filtered message can be recorded in a column of T a b m using a binary method (e.g., 1 and 0 representing irrelevant and relevant, respectively).
To remove redundancy images in the remaining messages, OpenCLIP is employed. After reading the images of the relevant messages from T a b m , as is shown in Figure 2, this process begins by image representation to obtain one encoding from every images. For OpenCLIP, the popular encoding is a feature vector with 512 values. The key pseudocode to implement this encoding is given here https://gitee.com/team-resource-billtang_0/water-depth-sensing-with-big-models-and-edge-nn.git (accessed on 6 October 2025). A database, initialized as empty, is utilized to store the encodings along with their corresponding image IDs. This image ID can be a unique file name obtained during the data crawling phase, or all images can be uniformly renamed in the preprocessing phase. The database can be implemented using arrays in the corresponding programming language, CSV files, etc. These encodings are then compared against those of existing in the database using similarity metrics such as cosine similarity or Euclidean distance. If any of the calculated similarity metrics is below a predefined threshold, the image is identified as a duplicate and discarded, otherwise the encoding is added to the database. To discard an image, the program can set the image ID corresponding to that image to an invalid value, such as −1. We use a threshold value rather than directly evaluate whether the compare vectors are same, so our method can handle duplicate images with slightly different field-of-view, color style, and lighting conditions. For N images, this check algorithm only has a low complexity of O ( N ) .
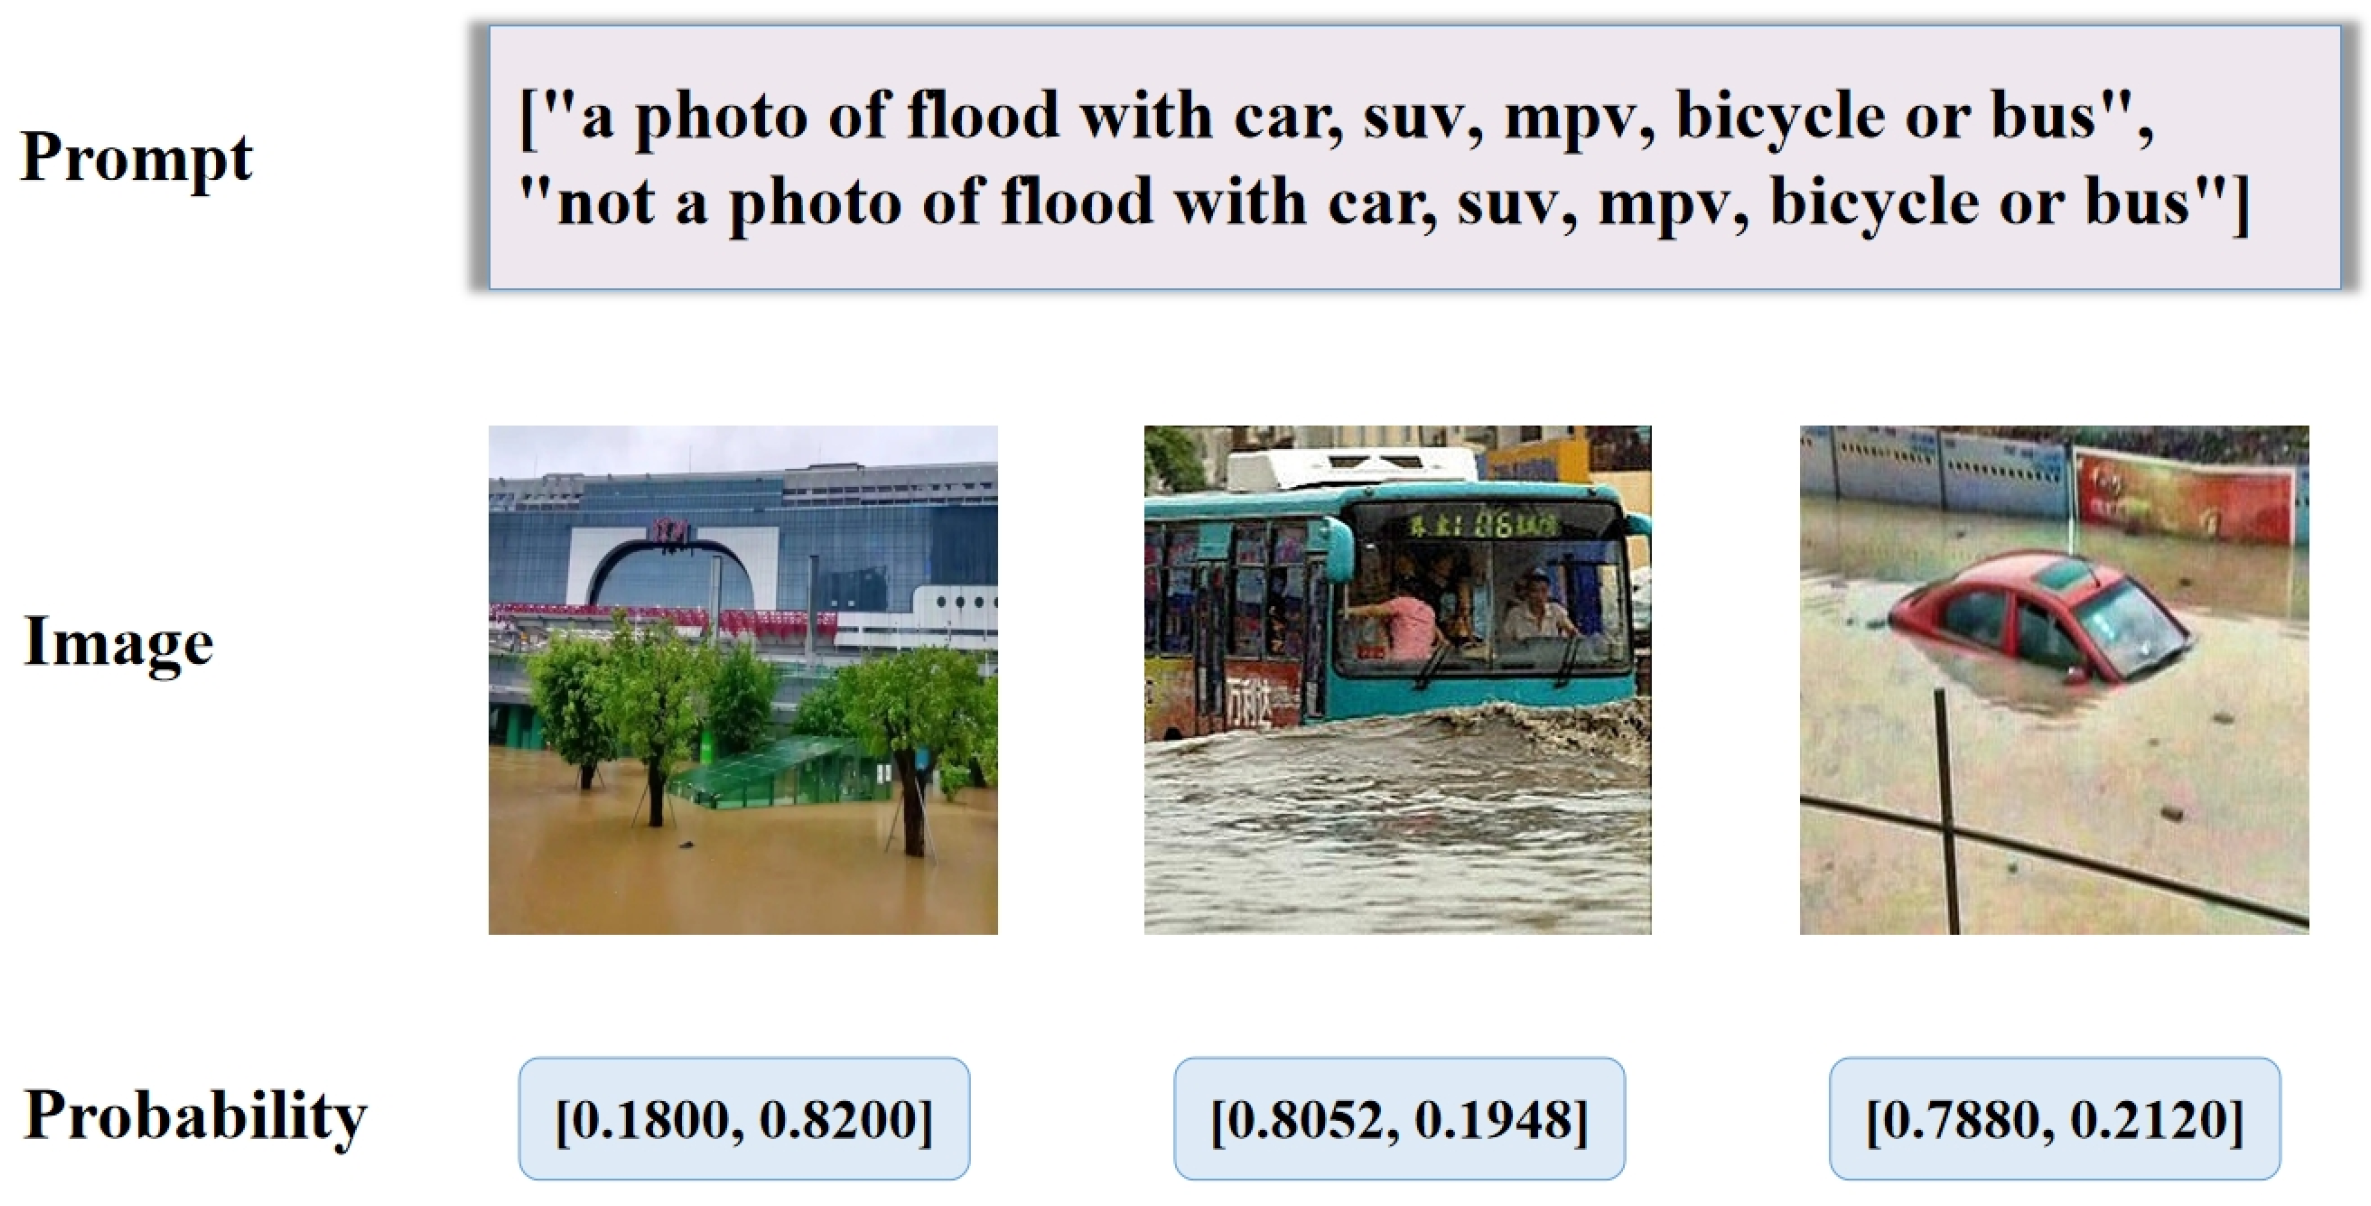
After image deduplication, OpenCLIP is further utilized to filter the remaining images containing the target reference objects through semantic evaluation. As is shown in Table 2, by supplying specific prompt words, OpenCLIP calculates corresponding probabilities that indicate the likelihood of an image matching the provided prompt. If the probability that the image contains the target reference object exceeds that of it not containing the object, the image is retained; otherwise, it is discarded by setting the image ID corresponding to that image to an invalid value. This step effectively removes irrelevant images, ensuring the collected image dataset retains only high-quality images featuring the target reference objects with available image IDs.

2.3. Depth References Detection and Representation

The depth references detection step uses YOLO-World to detect and locate these reference objects within the images. YOLO-World takes an image and textual prompts specifying arbitrary detection targets as input. Its outputs consist of minimum bounding boxes enclosing the targets and corresponding confidence scores. For flood reference object detection in this application, we designed the prompt templates shown in Table 3. These templates are engineered to precisely characterize unobstructed reference objects within flood-inundated areas, thereby enabling the identification of regions containing both reference markers and water depth-related features. To ensure accuracy, a confidence threshold is applied, filtering out low-quality detections. The output bounding boxes on input images define the target reference regions.
After extracting the regions containing reference objects from the images, OpenCLIP is employed again to obtain robust and universal feature representations. This process loads a pretrained OpenCLIP model, preprocesses images into formats compatible with OpenCLIP’s input requirements, and extracts image feature embeddings. Readers can found key codes on link https://github.com/mlfoundations/open_clip (accessed on 6 October 2025). OpenCLIP produces feature vectors that maintain a one-to-one correspondence with images. Visually similar images exhibit similar feature representations, while ensuring consistent alignment between image features and semantic characteristics. After this process, each reference object region image is converted into a 512-dimensional feature vector. Due to their strong generalization ability and versatility, these high-quality features represent flood depth information well.

2.4. The Simple Edge Training Neural Network for Water Depth Estimation

With the feature vectors of reference object regions extracted by OpenCLIP, this step constructs a lightweight neural network to achieve end-to-end flood depth estimation; we denote the neural network as Edge Neural Network (EdgeNN) because it only needs to be quickly updated at the network edge according to different needs. EdgeNN is architecture-agnostic and compatible with various neural network types, including fully connected networks and convolutional neural networks. The only mandatory requirements are that (1) the input layer dimension must precisely match the dimensionality of OpenCLIP’s output feature vectors, and (2) the output layer must be configured to predict a single water depth value. The previous preprocessing pipeline significantly simplifies the training data complexity, enabling even elementary architectures like Multilayer Perceptron (MLP) to achieve competitive prediction accuracy. When designing the network, we recommend prioritizing architectural simplicity while meeting accuracy thresholds, as this approach optimally balances performance with computational efficiency. Therefore, this paper recommends starting with a simple Multilayer Perceptron for testing, and then attempting more complex networks. For enhanced training stability and generalization capability, standard regularization techniques such as Dropout, Batch Normalization, and Layer Normalization can be incorporated during implementation.
To train the EdgeNN, preparing a dataset with submerged reference object and water depth annotation is necessary. Typically, within a country or region, similar reference objects exhibit comparable submersion patterns across different cities and flood events; we can collect images of submerged reference object regions with water depth annotations to construct the training dataset. This process requires only simple image-level water depth labeling, eliminating the need for reference position or category annotations. After representing the image regions as feature vectors using OpenCLIP, they can be paired with water depth labels as input–output pairs to complete the dataset preparation. As data accumulates through practical applications, this water depth prediction network can demonstrate progressively improved forecasting capabilities. However, national or regional characteristics may lead to differences in common vehicles, such as Japan’s K-car, India’s Tata, the UK’s double-decker buses, and America’s pickup trucks. To enable EdgeNN to achieve plug-and-play universality, it should ideally include typical flood reference objects from various countries and cities worldwide. But collecting such a comprehensive dataset is challenging and labor-intensive. The original design intent of this paper is to allow users from different cities to quickly adapt based on the common flood reference objects in their own city or region, so users only need to collect submerged images of flood reference objects from their local area. This is also the reason for designing EdgeNN as a lightweight model. Optionally, after obtaining sufficient multi-type reference object data, HatNN can also be trained as a more complex neural network model to achieve plug-and-play universality.
The water depth labeling of reference objects in the dataset directly affects the water depth perception accuracy of EdgeNN. Users can improve data reliability by combining objective techniques with expert subjective labeling based on actual conditions. The former can use IoT devices to collect actual water depth and image data on-site during flood events, such as drones equipped with water depth detection radar, water level gauges installed in culverts and other areas prone to flooding, etc. If conditions permit, objective labeling methods should be used more frequently. To reduce subjective errors in the latter, some methods can be adopted. First, establish clear criteria for judging submerged parts. For example, for pedestrians, judgments can be assisted based on their posture and joint confidence. Typically, body joints located below the water surface have significantly lower recognition confidence than those above the water. Utilizing this characteristic, estimation can be made based on the boundaries of exposed body parts. For example, for SUVs, refer to the criterion representation method shown in the figure below. Provide a standard side view of the object, draw lines at different key points to indicate water depth, and add multiple equivalent descriptive texts for each water depth. This allows labeling experts to automatically adapt to different perspectives, partial occlusions, etc. Second, independent labeling combined with cross-validation can be used. Due to variations in SUV sizes, Figure 3 is only for reference; experts can make comprehensive judgments, with 2 to 3 experts independently labeling each data point, and samples with poor labeling consistency are discussed and decided in meetings.
Users should be aware of the usage boundaries imposed by the sample distribution limitations of the training dataset. First, the issue of geographical distribution limitations. Inadequate refinement in reference object categorization can lead to significant size variations within the same category; for example, cars belonging to the same class but having different sizes. When the training data region is the same as the application region, this issue does not affect model performance because the model has been calibrated during the water depth labeling process. EdgeNN does not determine water depth through reference object category but through the water depth labels. When the training and application regions differ, or when the model is applied to new reference objects without retraining (e.g., applying a model trained on regular cars to a region including K-cars, or applying a model trained on vehicles to pedestrians), EdgeNN loses reliability and is likely to make errors, as the model has not learned the characteristics of K-cars or pedestrians. Second, the issue of water depth distribution limitations. The sample water depth distribution in the training dataset should cover all possible water depths as much as possible, and the data volume for each water depth should not be too small. If all sample water depths range from 0 to 1 m, the model will likely fail when used to perceive flood scenarios with water depths exceeding 1 m.

3. Experimental Results and Discussion

3.1. Experimental Settings

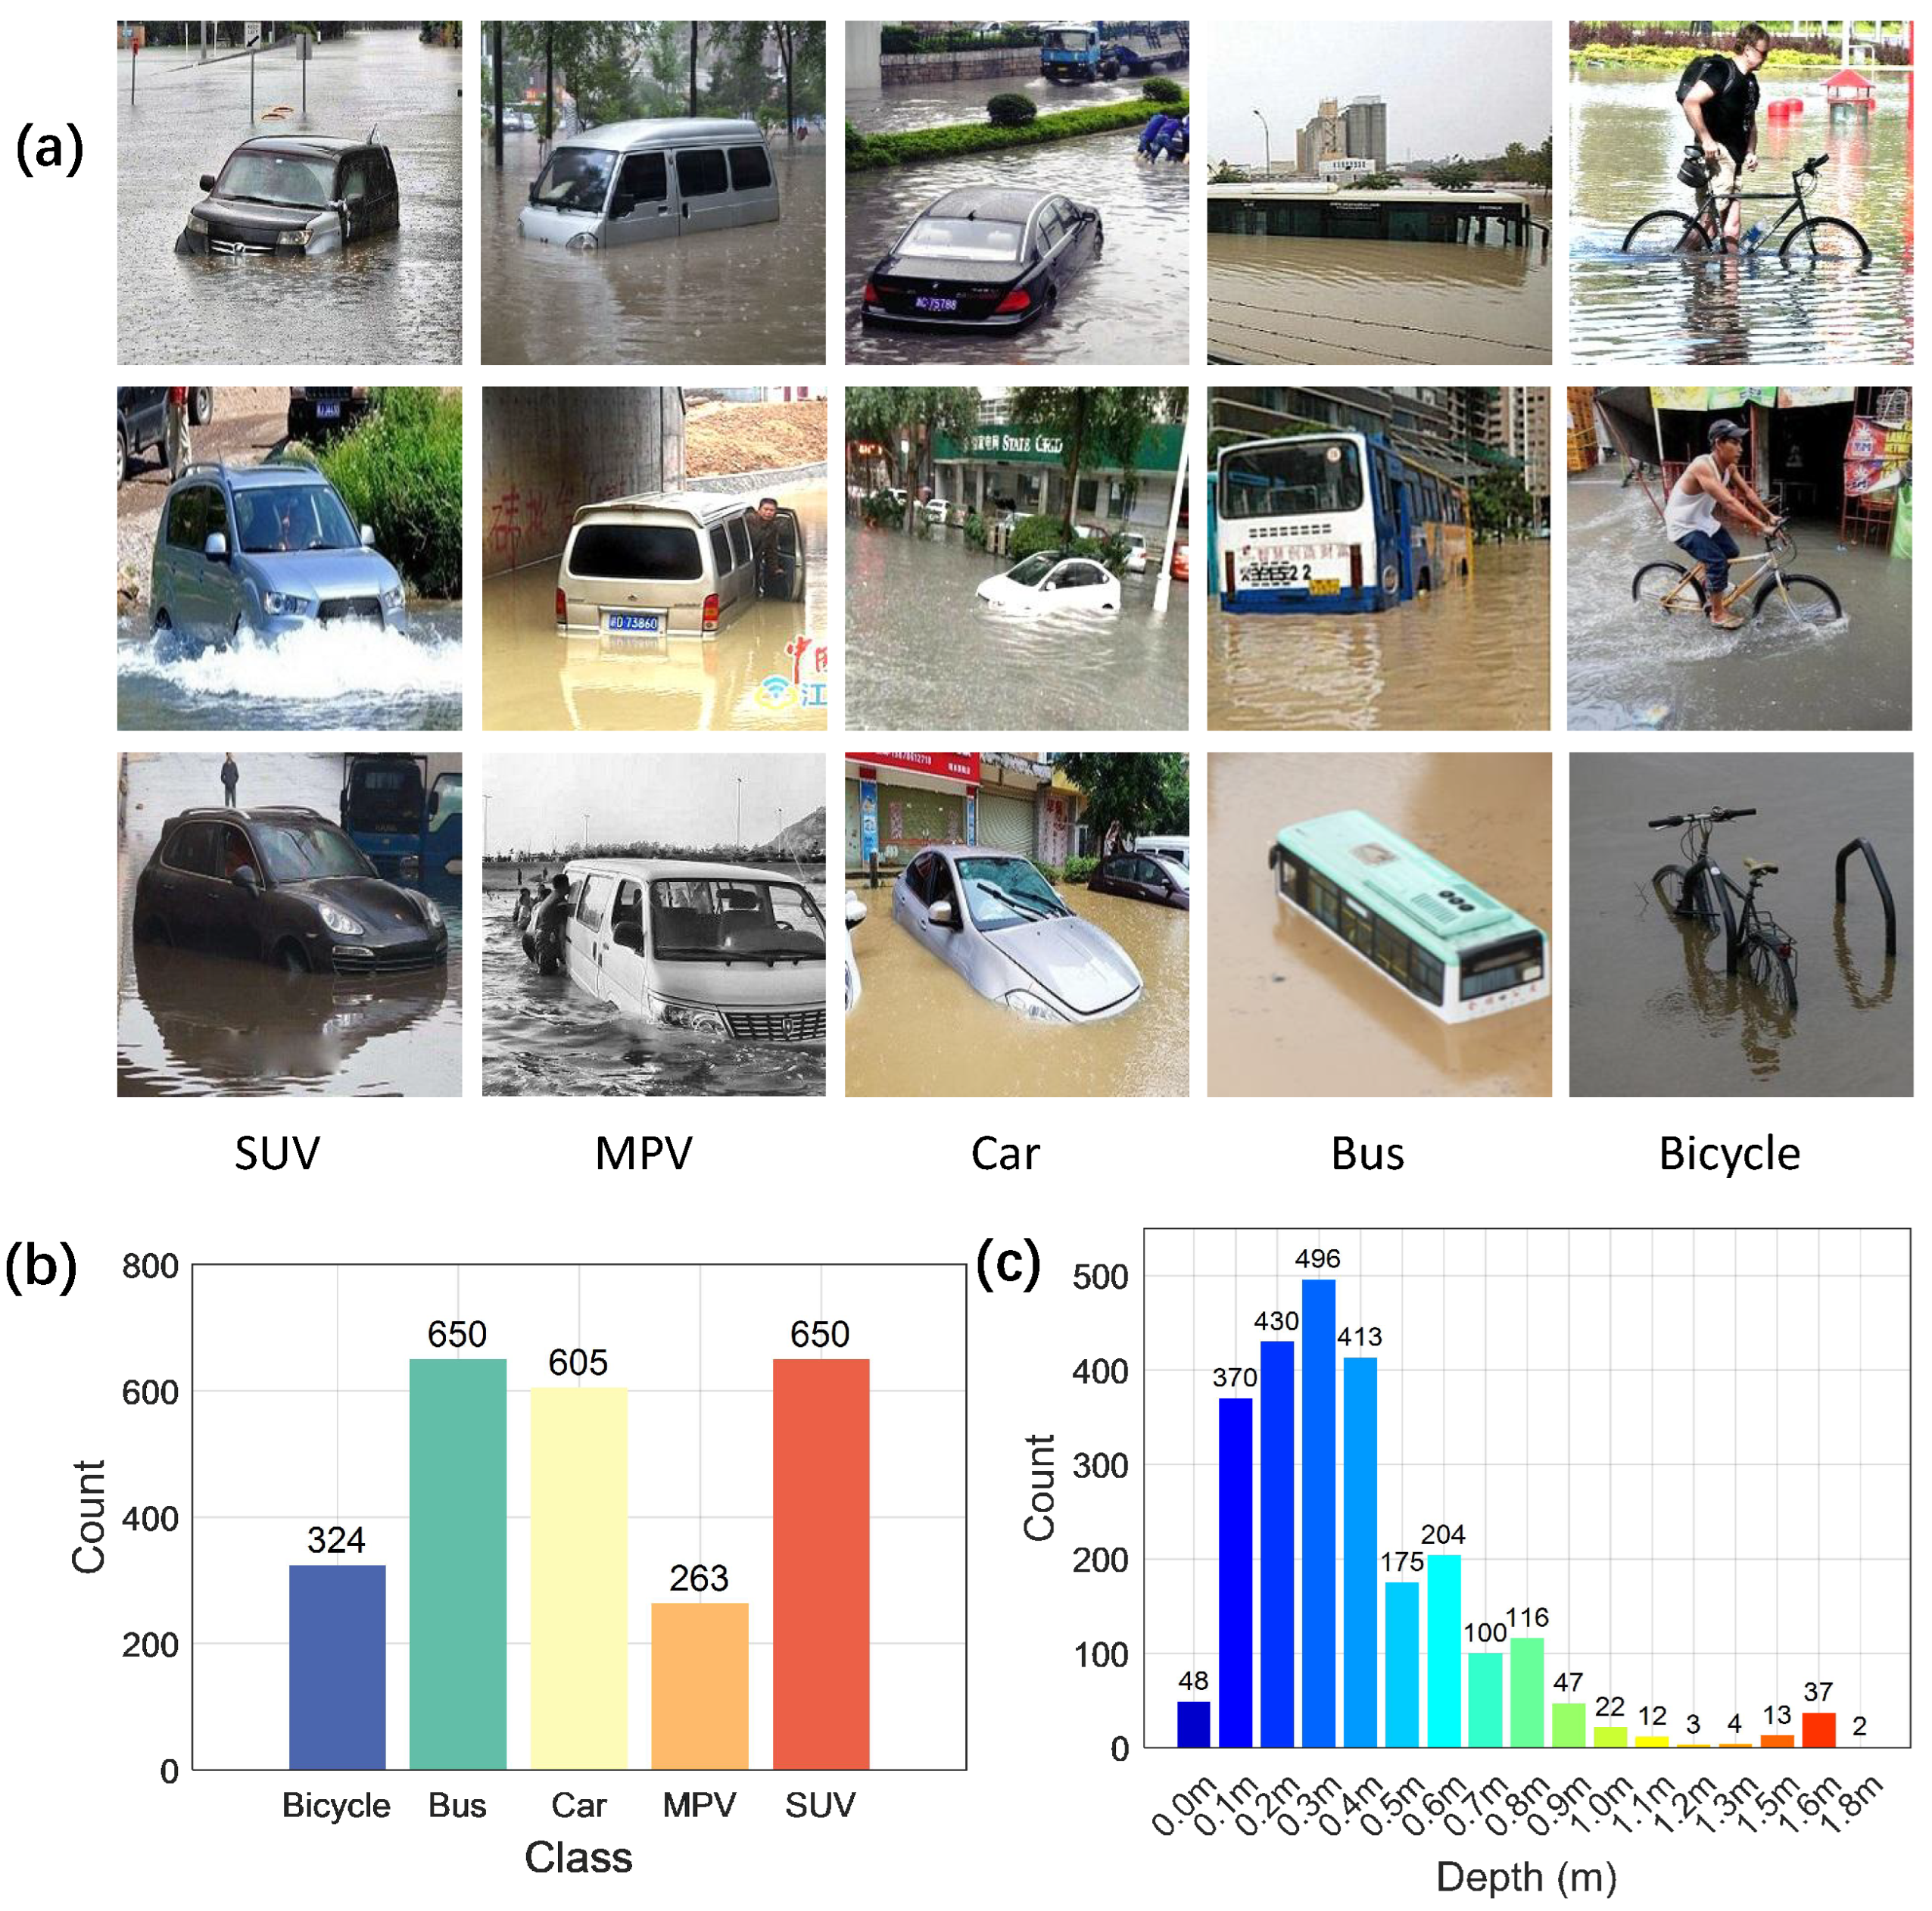
To evaluate the proposed methodology framework, five common land vehicles, including car, SUV, MPV, bicycle, and bus, are chosen as reference objects for urban flood water depth sensing. The selection covers a range of small to large urban flood targets, ensuring diversity. As shown in Figure 1, the data required for this paper consists of two parts: the text and images related to a specific flood event used for the image mining process, and the image data containing reference object bounding boxes, categories, and water depths used for the subsequent water depth perception process. The first part was obtained by configuring the web crawler tool to use common news websites, Weibo, and Douyin as sources, setting the “flood_keywords” in the crawler to “Zhengzhou 7·20”, “Zhengzhou July Flood”, “Zhengzhou July Flood Disaster”, “Zhengzhou Waterlogging”, “Zhengzhou Inundation”, “Zhengzhou Torrential Rain”, and “Zhengzhou Heavy Rainfall”. After discarding messages without images, 920 valid messages were obtained, containing 920 corresponding text descriptions and 2341 images. The second part, comprising reference object-related image data for EdgeNN training, was collected via keyword-based image searches using a search engine, without restricting the specific flood events. Keywords such as “flood”, “flooded bicycle”, “flooded sedan”, and “flooded bus” are used to search for images containing the target reference objects in flood scenes. An initial dataset of 400 reference object images is obtained through preliminary filtering, with water depth values manually annotated. To evaluate the detection performance of Yolo-World, we also labeled the bounding boxes on this initial dataset. To enhance both the quality and scale of the dataset, augmentation techniques such as rotation, brightness adjustment, Gaussian noise injection, and random geometric deformation are applied. Additionally, to assess the accuracy of the proposed method, images from the “Zhengzhou 7·20” extreme flood event are also manually annotated with bounding boxes for reference object detection and water depth values. These images come from the filtered images obtained by the web crawler, as well as images collected by our research group through a volunteer service platform (Wechat Official Account zzuflood) during the Zhengzhou 7·20 event. Therefore, the current image dataset at least meets the requirement stated in Section 2.4 regarding the inclusion of common vehicle types in the study area. All images are labeled and organized in JSON format, with sample images presented in Figure 4a. This process expands the dataset to 2492 high-quality flood images containing the target reference objects, forming the core dataset for Edge Training in this study. The number of samples for each class and water depth distribution for the dataset are given in Figure 4b and Figure 4c, respectively. From the water depth distribution, it can be seen that the EdgeNN trained in this paper is only applicable for sensing water depth in scenarios ranging from 0 to 1.8 m. Due to the relatively scarce data for high water depths, when partitioning the validation set, it is ensured that the validation set contains at least one sample for each water depth level, thereby fully incorporating the model’s prediction results for cases with few samples into the accuracy statistics.
The edge training neural network in this experiment possesses a Multilayer Perceptron (a four-layer fully connected architecture) designed with progressive feature compression. The input layer receives the 512-dimensional feature vector representing the reference object region, followed by a fully connected layer with 256 neurons activated by function ReLU and BatchNorm for improved learning stability. The third layer, featuring 128 neurons with GELU activation and LayerNorm, performs higher-order nonlinear mapping and further stabilizes the feature distribution. The final output layer directly predicts the flood depth using a linear layer without activation. To enhance robustness and efficiency, Dropout operation is added to the second and third layer. The model is trained with the Huber loss function to mitigate the influence of outliers, alongside the AdamW optimizer and a cosine annealing learning rate schedule to achieve fast convergence and improved generalization.
This study utilizes PaddlePaddle version 2.0.2 as the deep learning platform, with the following hardware specifications: a GPU of Tesla V100 with 32 GB of memory, a CPU of Intel Xeon Gold 6271C CPU @ 2.60 GHz with 32 GB of RAM. The learning rate for training the water depth prediction network is set at 0.005. The whole dataset is divided into training, testing, and validation sets with a ratio of 0.7:0.15:0.15, respectively.

3.2. Results for Flood Image Mining

To validate the message relevance check method, Figure 5 illustrates the prompt design for utilizing DeepSeek-R1 to classify text messages as related or unrelated to a specific flood event. In the examples, Zhengzhou City does not belong to Hebei Province; DeepSeek-R1 successfully identifies the relevant text message by leveraging the prompt, demonstrating its strong semantic understanding and classification capabilities.
To validate the message image duplication check method, Figure 6 illustrates key examples from the image duplication check process, where similarity measurements between OpenCLIP features determine whether images are duplicates. These examples show the two most commonly used vector similarity metrics, i.e., Euclidean distance and cosine similarity. In all duplicate cases shown from Figure 6b–d, the Euclidean distance remains below 0.3 while cosine similarity exceeds 0.9, showing significant divergence from the metrics in Figure 6e. Thus, a Euclidean distance threshold of ≤0.3 or cosine similarity threshold of ≥0.9 can be established for duplication determination. These visual examples confirm that OpenCLIP features generate similar encodings for visually alike images, making them particularly suitable for this duplication check task.
Similarly, to validate the image relevance check method, Figure 7 demonstrates the application of OpenCLIP in determining whether a flood image contains the target reference object. In the examples, the first image does not have any target reference objects; OpenCLIP identifies it as “not a photo of flood with car, suv, mpv, bicycle or bus” with a higher probability value of 0.82. OpenCLIP also reliably identifies the presence of the target reference objects in the next two photos, showcasing its ability to leverage cross-modal semantic alignment to capture the correlations between vehicle-type reference objects and flood scenes.

3.3. Results for Depth Reference Detection

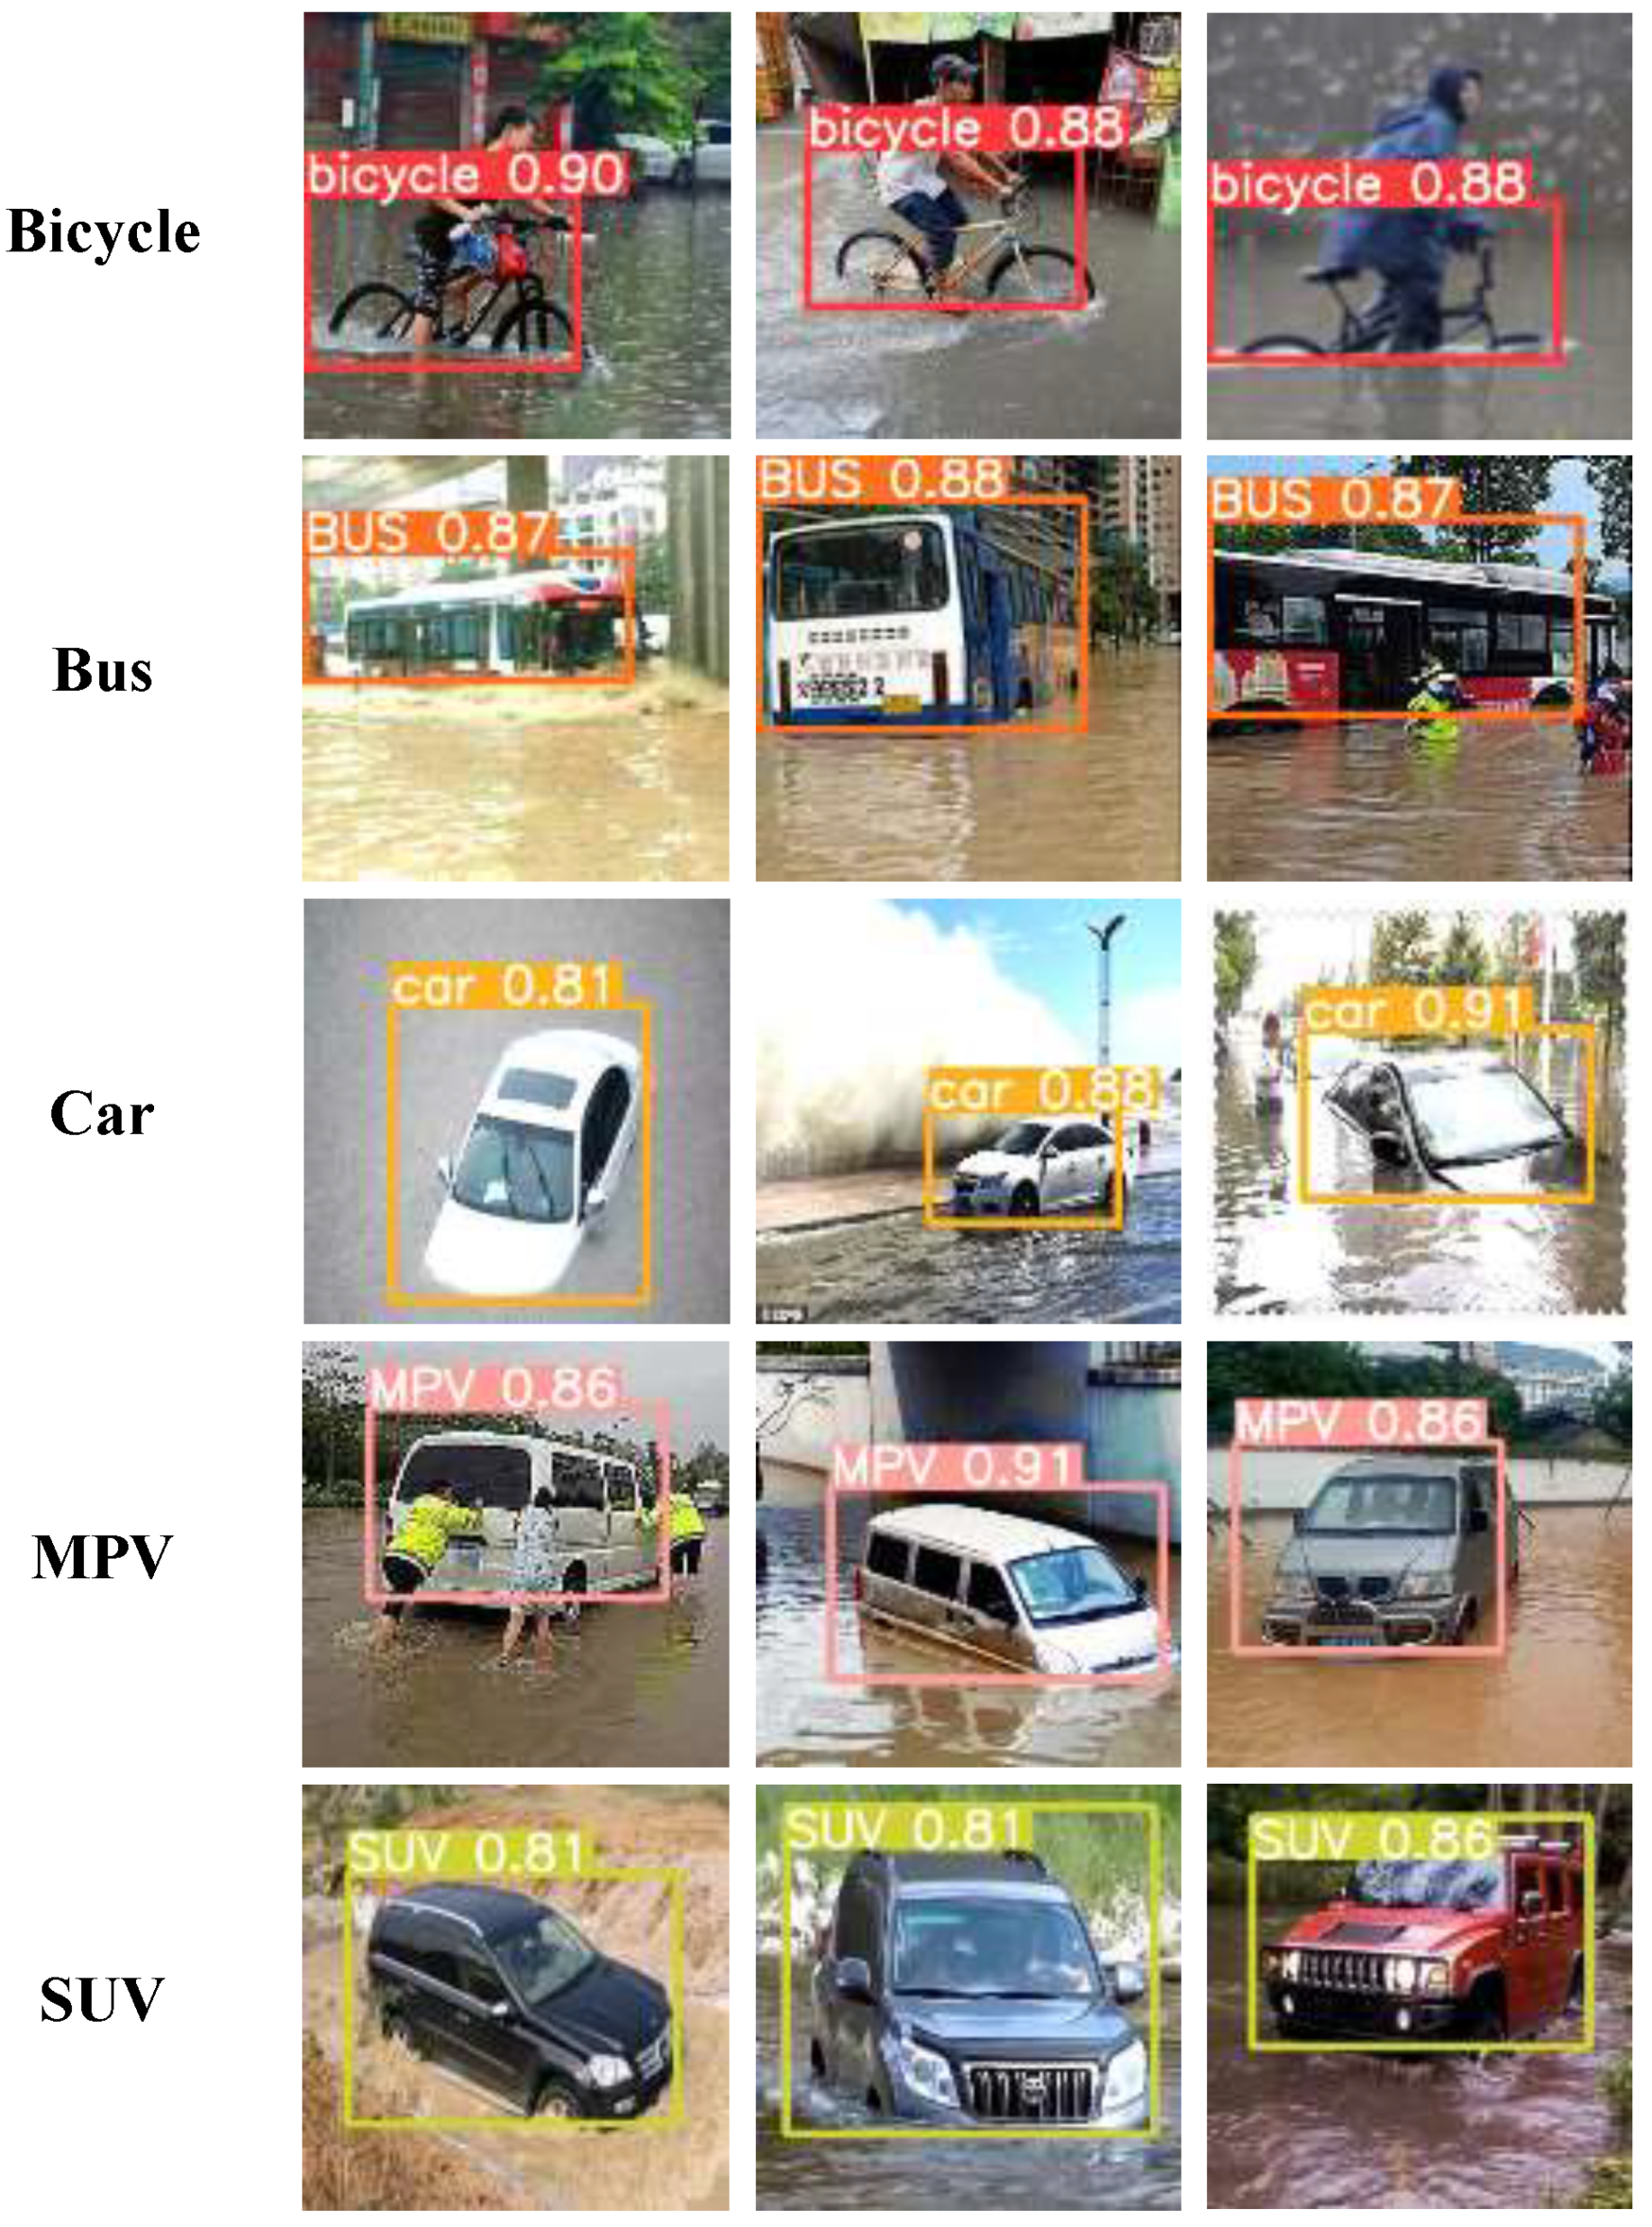
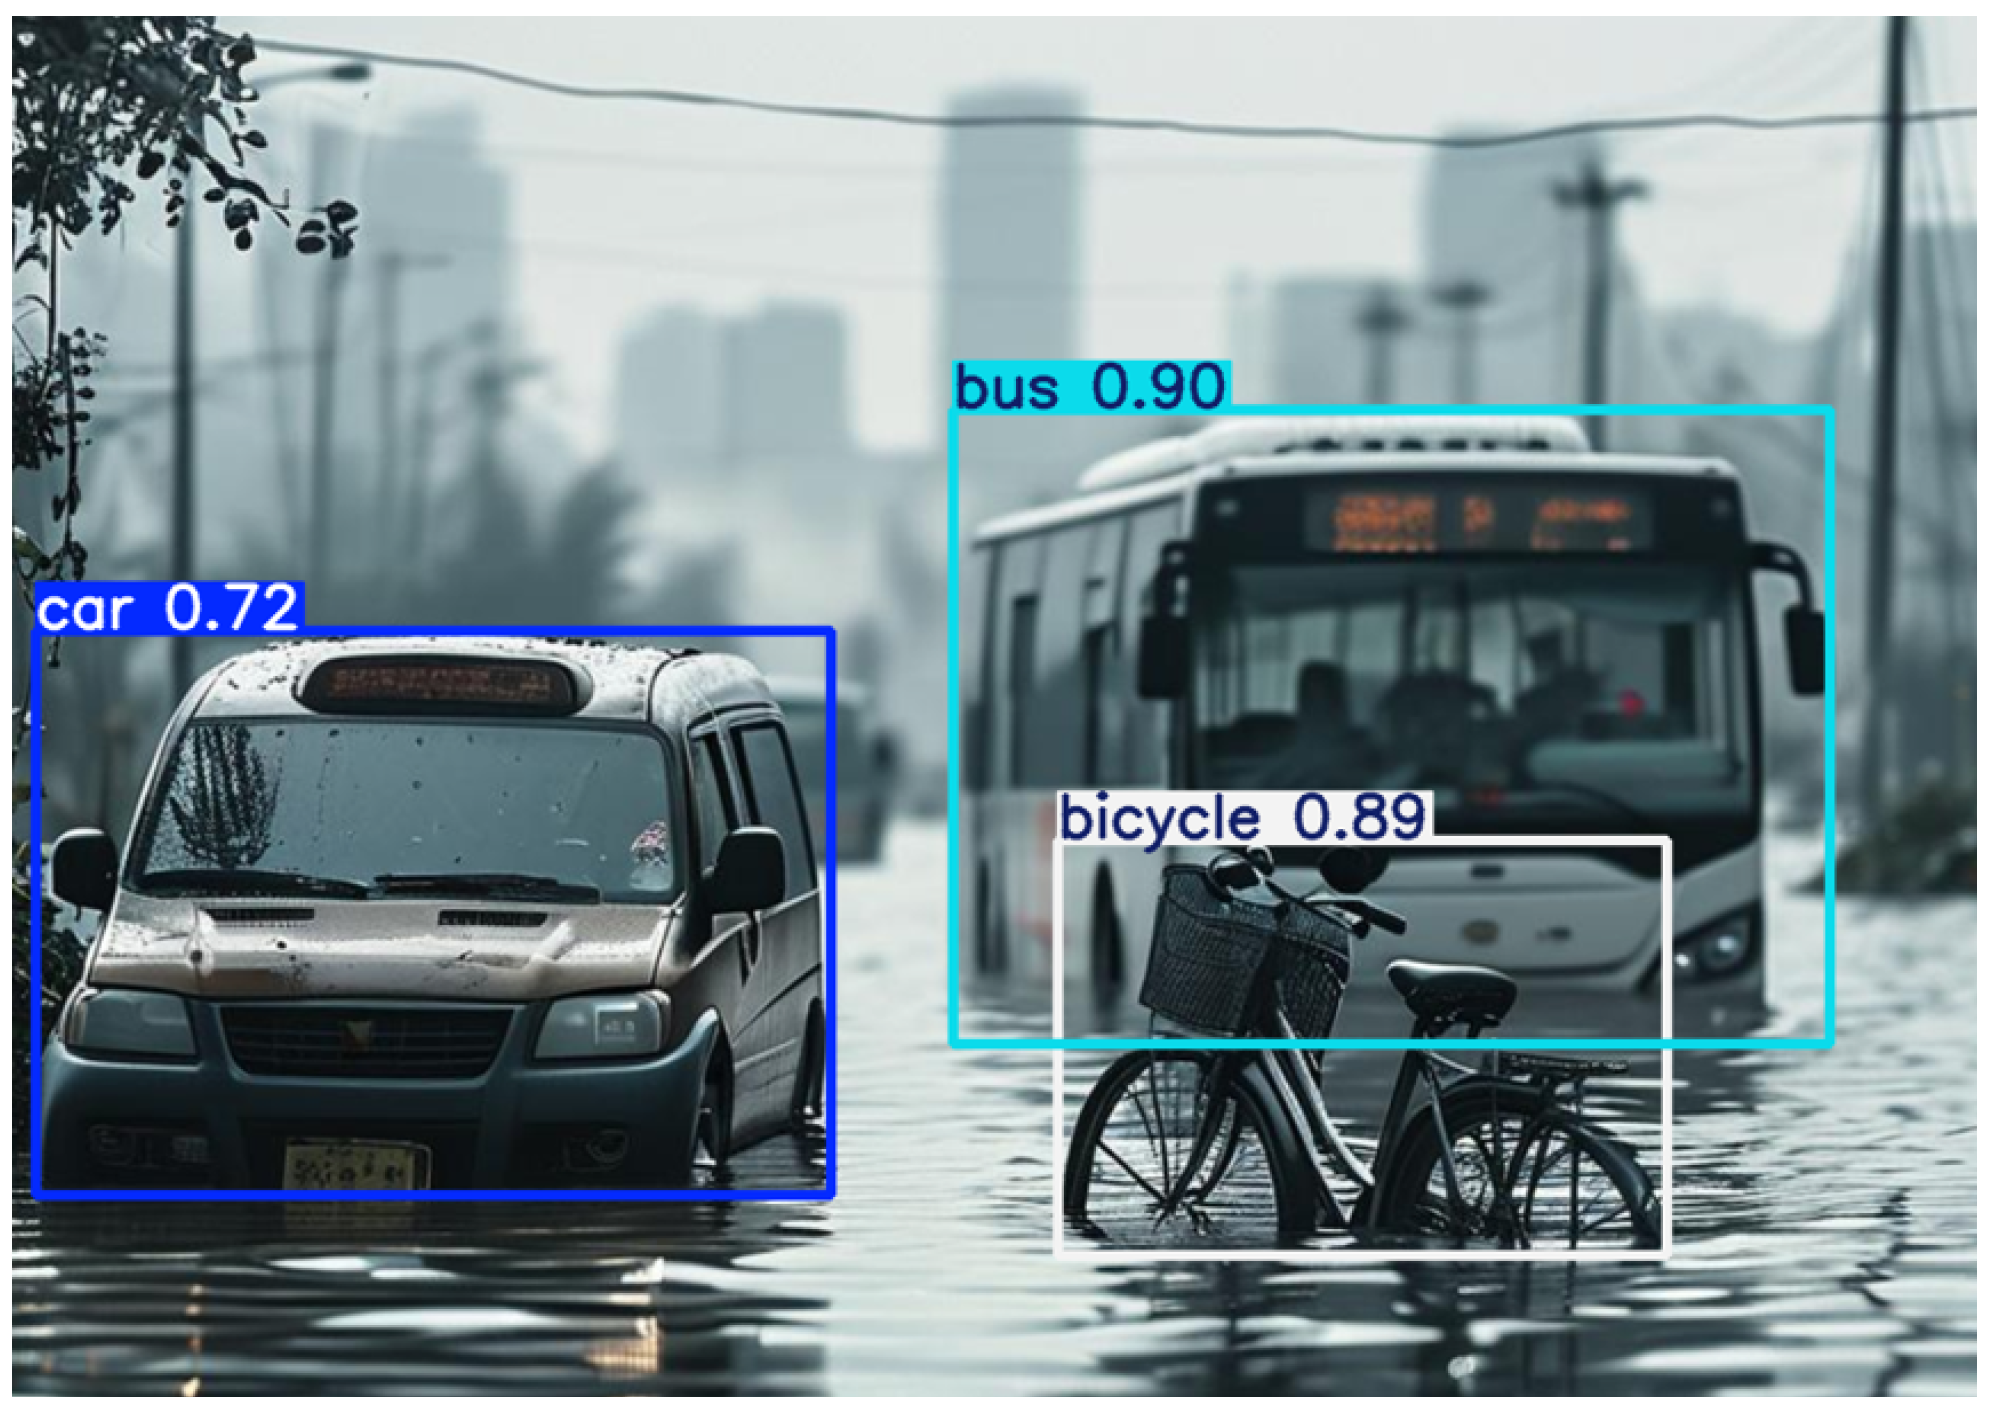
This study adopts YOLO-World for detecting reference objects. The example detection results are presented in Figure 8 and Figure 9. In Figure 9, the bicycle and bus were correctly detected with confidence scores of 0.89 and 0.90, respectively, while the MPV was misclassified as a car with a lower confidence score of only 0.72. In Figure 8, all vehicles were correctly detected with confidence scores above 0.8. Although the MPV in Figure 9 was incorrectly categorized, it still belongs to the target reference objects. Since the subsequent water depth prediction network does not rely on category information, this error does not affect depth recognition. Our tests show that when confidence scores fall below 0.6, non-target objects begin to be detected. Therefore, a threshold of 0.6 can be applied to filter out results that could negatively impact water depth estimation. The higher this threshold is set, the more data is filtered out, reducing the quantity of perceived data, which is detrimental to subsequent tasks such as water depth mapping. When this threshold is lowered, incorrect target regions and target regions with occlusions, etc., increase, ultimately producing erroneous water depth perception values.
Statistical comparison of the proposed method with other leading flood image detection approaches including the Vehicle-RCNN method [36] and the Media-RCNN method [32] are presented in Table 4 and Table 5. The results indicate that the pre-trained YOLO-World model achieves an average false detection rate of 1.44% and miss detection rate of 1.20% on the validation dataset, which is much lower than the other two methods. Additionally, our method achieves significantly higher accuracy on the reference object localization on all metrics in Table 5, highlighting its accuracy and reliability in detecting vehicle reference objects in urban flood scenes.

3.4. Results of Water Depth Estimation

3.4.1. Robustness to View Angle

In real-world scenarios, variations in lighting conditions, image clarity, and perspective may interfere with flood depth estimation, often impairing model accuracy and generalizability. Conventional models typically require expanded datasets for retraining to adapt to these changes. In contrast, the water depth perception method proposed in this study leverages the robust cross-modal image feature representation of OpenCLIP, which effectively enhances model robustness against these variations. As shown in Table 6, the model maintains high accuracy with estimated water depth errors remaining within 0.01 m for bicycles observed under diverse perspectives and clarity conditions. This demonstrates the model’s robustness and adaptability in complex real-world flood scenarios.

3.4.2. Accuracy

The statistical results of flood depth estimation using the proposed model are presented in Table 7. Although the mean squared error (MSE) varies slightly among different vehicle types, the overall MSE range is relatively small, with the maximum MSE being approximately 0.006 and the minimum MSE around 0.001. Compared to the state-of-the-art methods, our approach achieves an MSE reduction of over 80%, with the maximum reduction reaching 94.4% when using bicycles as the reference. This demonstrates that the neural network model can accurately predict flood depth and is reliable for practical applications. Additionally, the model exhibits strong generalization ability in estimating flood depth in reference to different types of vehicles.
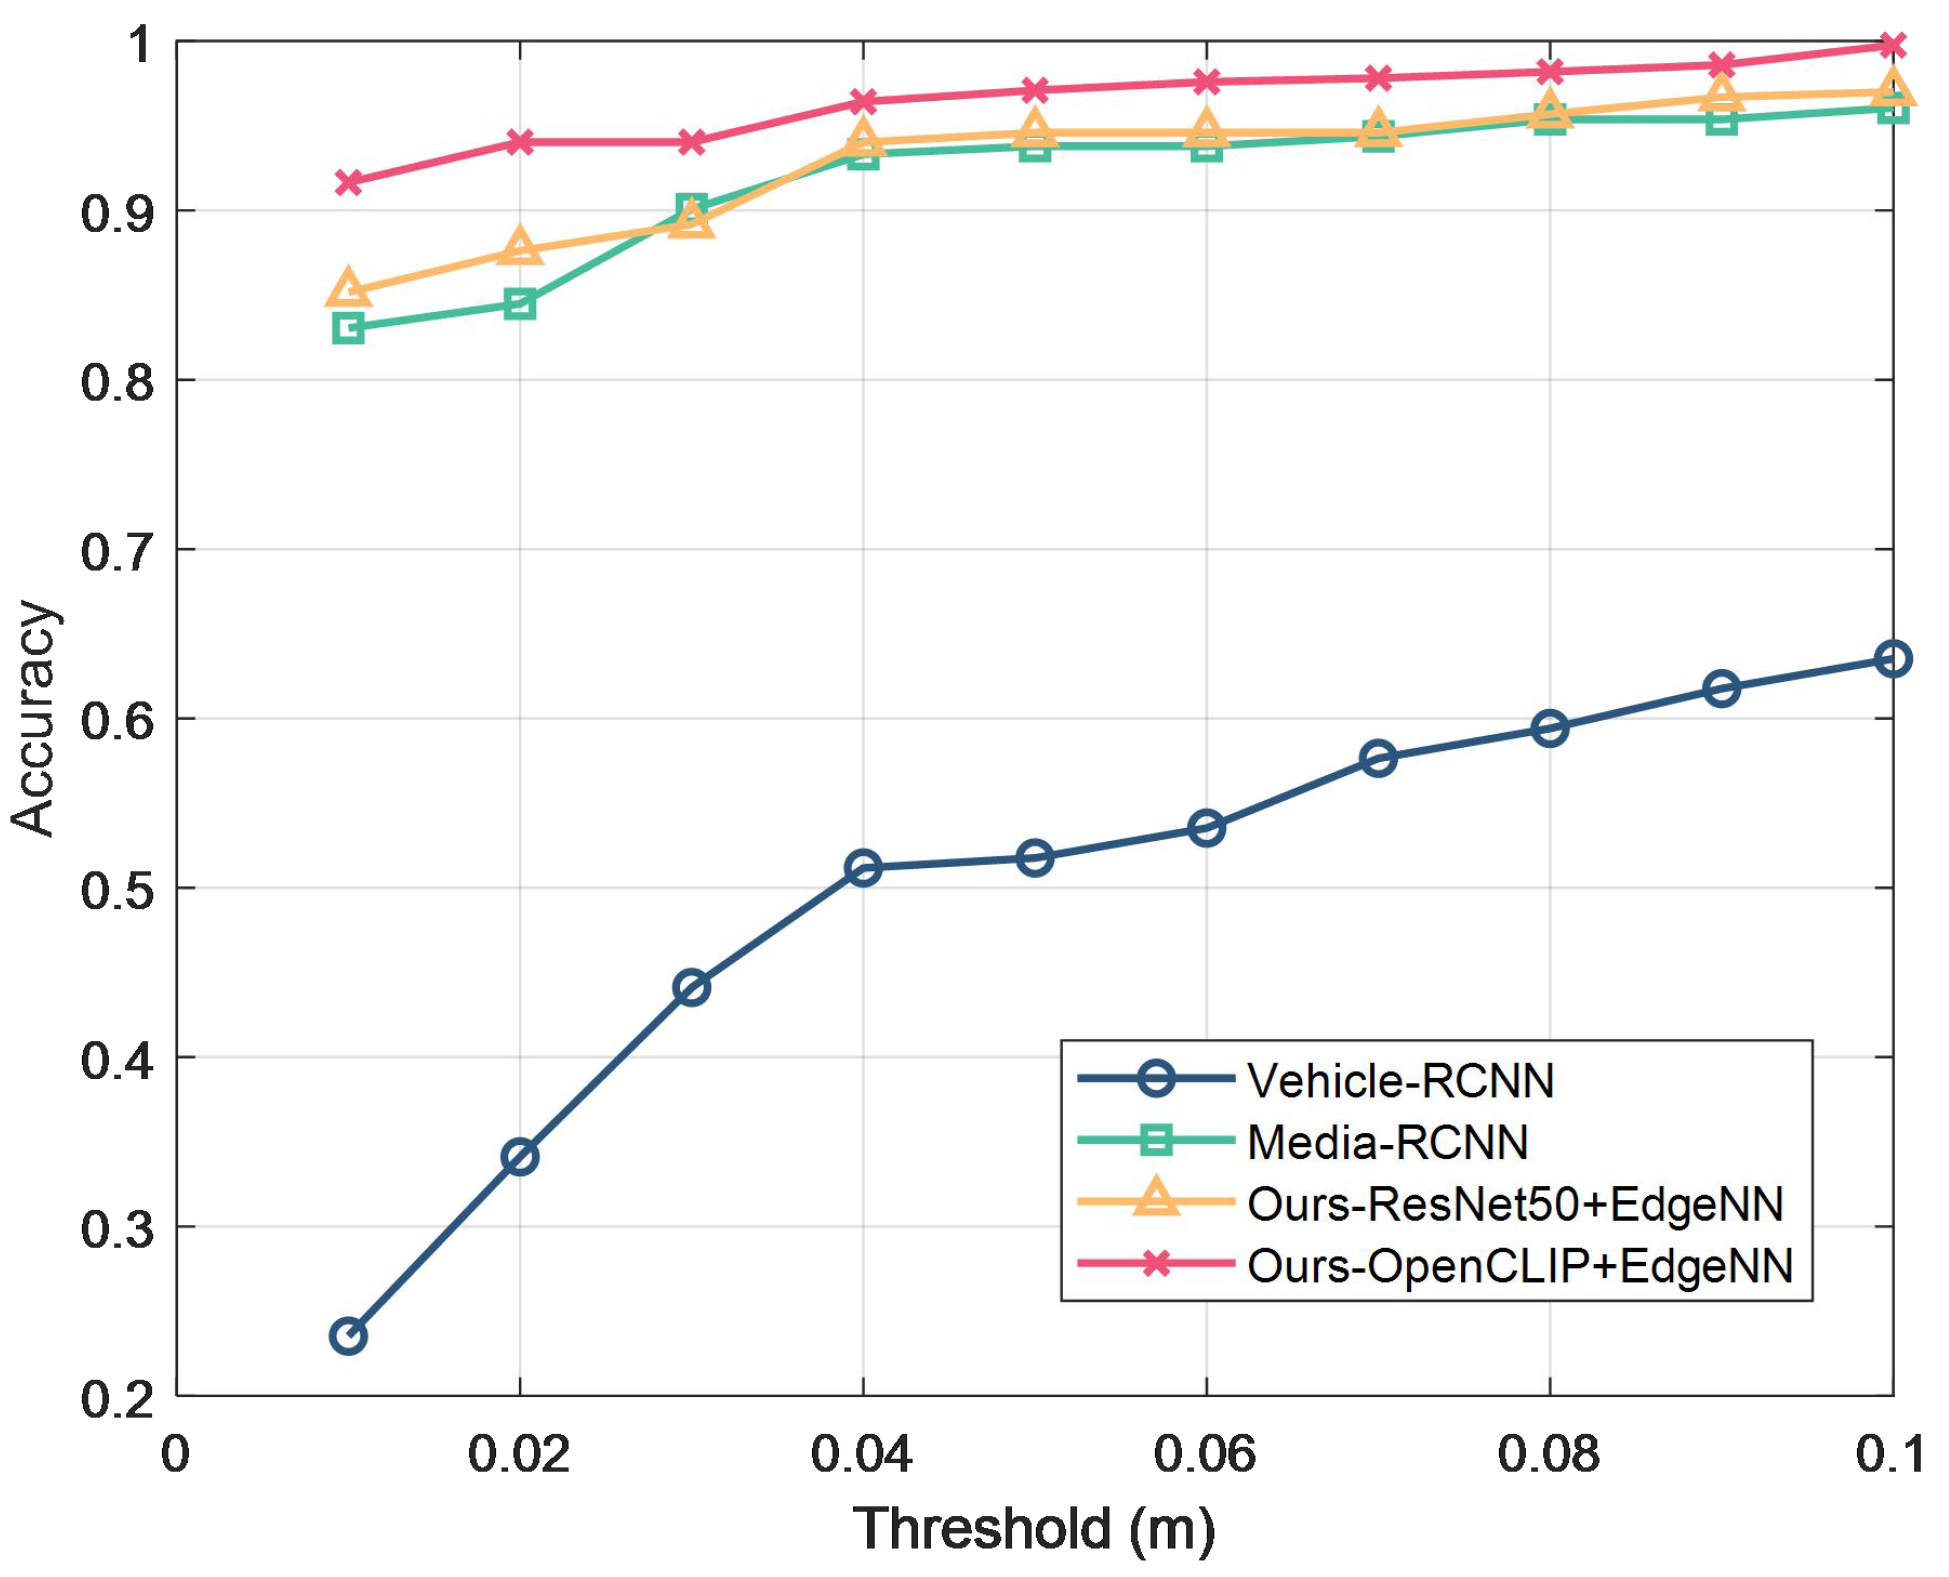
Figure 10 presents the accuracy of different methods under varying permissible thresholds for water depth estimation error. As shown in the figure, our method consistently achieves higher precision across the error tolerance range from 0.01 to 0.1 m. The advantage of our approach becomes particularly pronounced when maintaining strict error requirements below 0.03 m. Even under the most demanding condition of ≤0.01 m error tolerance, our method still maintains an accuracy exceeding 0.9. When the error tolerance is relaxed to 0.1 m, our approach achieves near-perfect accuracy (close to 100%) on this dataset. When the OpenCLIP image compression representation method used in this paper is replaced with the traditional pre-trained model ResNet50, under the same training settings, the water depth sensing accuracy is still slightly better than the state-of-the-art Media-RCNN. This ablation study validates the contribution of using big models for universal and compressive image representation. The model maintains a low overall error level under different conditions, highlighting its advantages in handling diverse and complex urban flood scenes.

3.4.3. Discussion of Efficiency

In practical application deployment, the flood perception delay in this paper includes the time from when a user observes the flood to when related information is published on social media ( t 1 ), the complete data crawling time for the web crawler ( t 2 ), the data preprocessing time for the crawled data ( t 3 ), the message relevance filtering time ( t 4 ), the image deduplication filtering time ( t 5 ), the image reference object relevance filtering time ( t 6 ), the reference object region detection time ( t 7 ), and the edge neural network water depth prediction time ( t 8 ). t 1 is uncontrollable for users relying on social media data. Its real-time performance is significantly better than remote sensing or official data dispatch, lower than dedicated monitoring equipment like traffic cameras or IoT water depth sensors, comparable to the efficiency of dedicated personnel, and generally within a few minutes. t 2 is the most time-consuming part of the entire process, primarily depending on the response time between the user’s client and the crawled platform servers and the required data volume. In the relatively good network environment of this experiment, acquiring about 2000 images took approximately 8 min. On the hardware used in this paper, the time to discard messages with missing images ( t 3 ) is about 0.02 s. t 4 , with the DeepSeek-R1 model, after optimizing the inference process, achieves a judgment time of about 0.2 s per message text. For t 5 , t 6 , and t 7 , the average run times of OpenCLIP and YOLO-World are approximately 0.09 s and 0.2 s to process a 640 × 480 resolution image. To further evaluate the performance of the proposed method across different image resolutions, the run times of OpenCLIP and YOLO-World are tested at two typical resolutions, i.e., 224 × 224 and 1920 × 1080 for low and high resolution images, respectively. At 224 × 224 resolution, OpenCLIP and YOLO-World achieve average processing times of approximately 0.05 s and 0.08 s, respectively. At 1920 × 1080 resolution, their average run times increase to around 0.13 s and 0.3 s. Due to the lightweight design of the water depth prediction network, t 8 is negligible.
Consequently, after obtaining the data, the typical single-image evaluation time with a resolution of 640 × 480 (denoted as t s ) for the proposed method is around t s = t 5 + t 6 + t 7 + t 8 + t r + t r + t 8 = 0.09 + 0.09 + 0.2 + 0.05 = 0.43 s, where t r is the OpenCLIP image region representation time (approximately 0.05 s for parallel processing of multiple regions). This is approximately 20 times faster than the GPT-4 method [28], which requires around 10 s for the same task, making the proposed method more suitable for fast detection. Assuming t 1 is 3 min, the time for this method to first obtain a round of water depth data for a specific flood event (denoted as t 1 s t ) is approximately t 1 s t = t 1 + t 2 + t 3 + N m × t 4 + N i × t 5 + N d × t 6 + N r e f × t 7 + N r e g × t r + N r e g × t 8 , where N x represents the quantity involved in the calculation. In the Zhengzhou 7·20 flood event of this paper, this time is approximately 19.5 min. When data needs to be updated, after adding the data deduplication code to the web crawler, it can be reduced to about 5 min. Not considering the user upload delay t 1 , this method can update flood water depth from network data in about 2 min. Combined with smart city supercomputing platforms, this time is expected to be compressed to the second level.
When users need to reselect reference objects for EdgeNN training, most of the time is consumed in image-level data labeling work, and the designed lightweight network requires only minutes of training time even on devices without GPUs. These results highlight the efficiency and scalability of the proposed method, demonstrating its applicability across various resolutions while maintaining high processing speed.

3.4.4. Potential Source of Error and Limitations

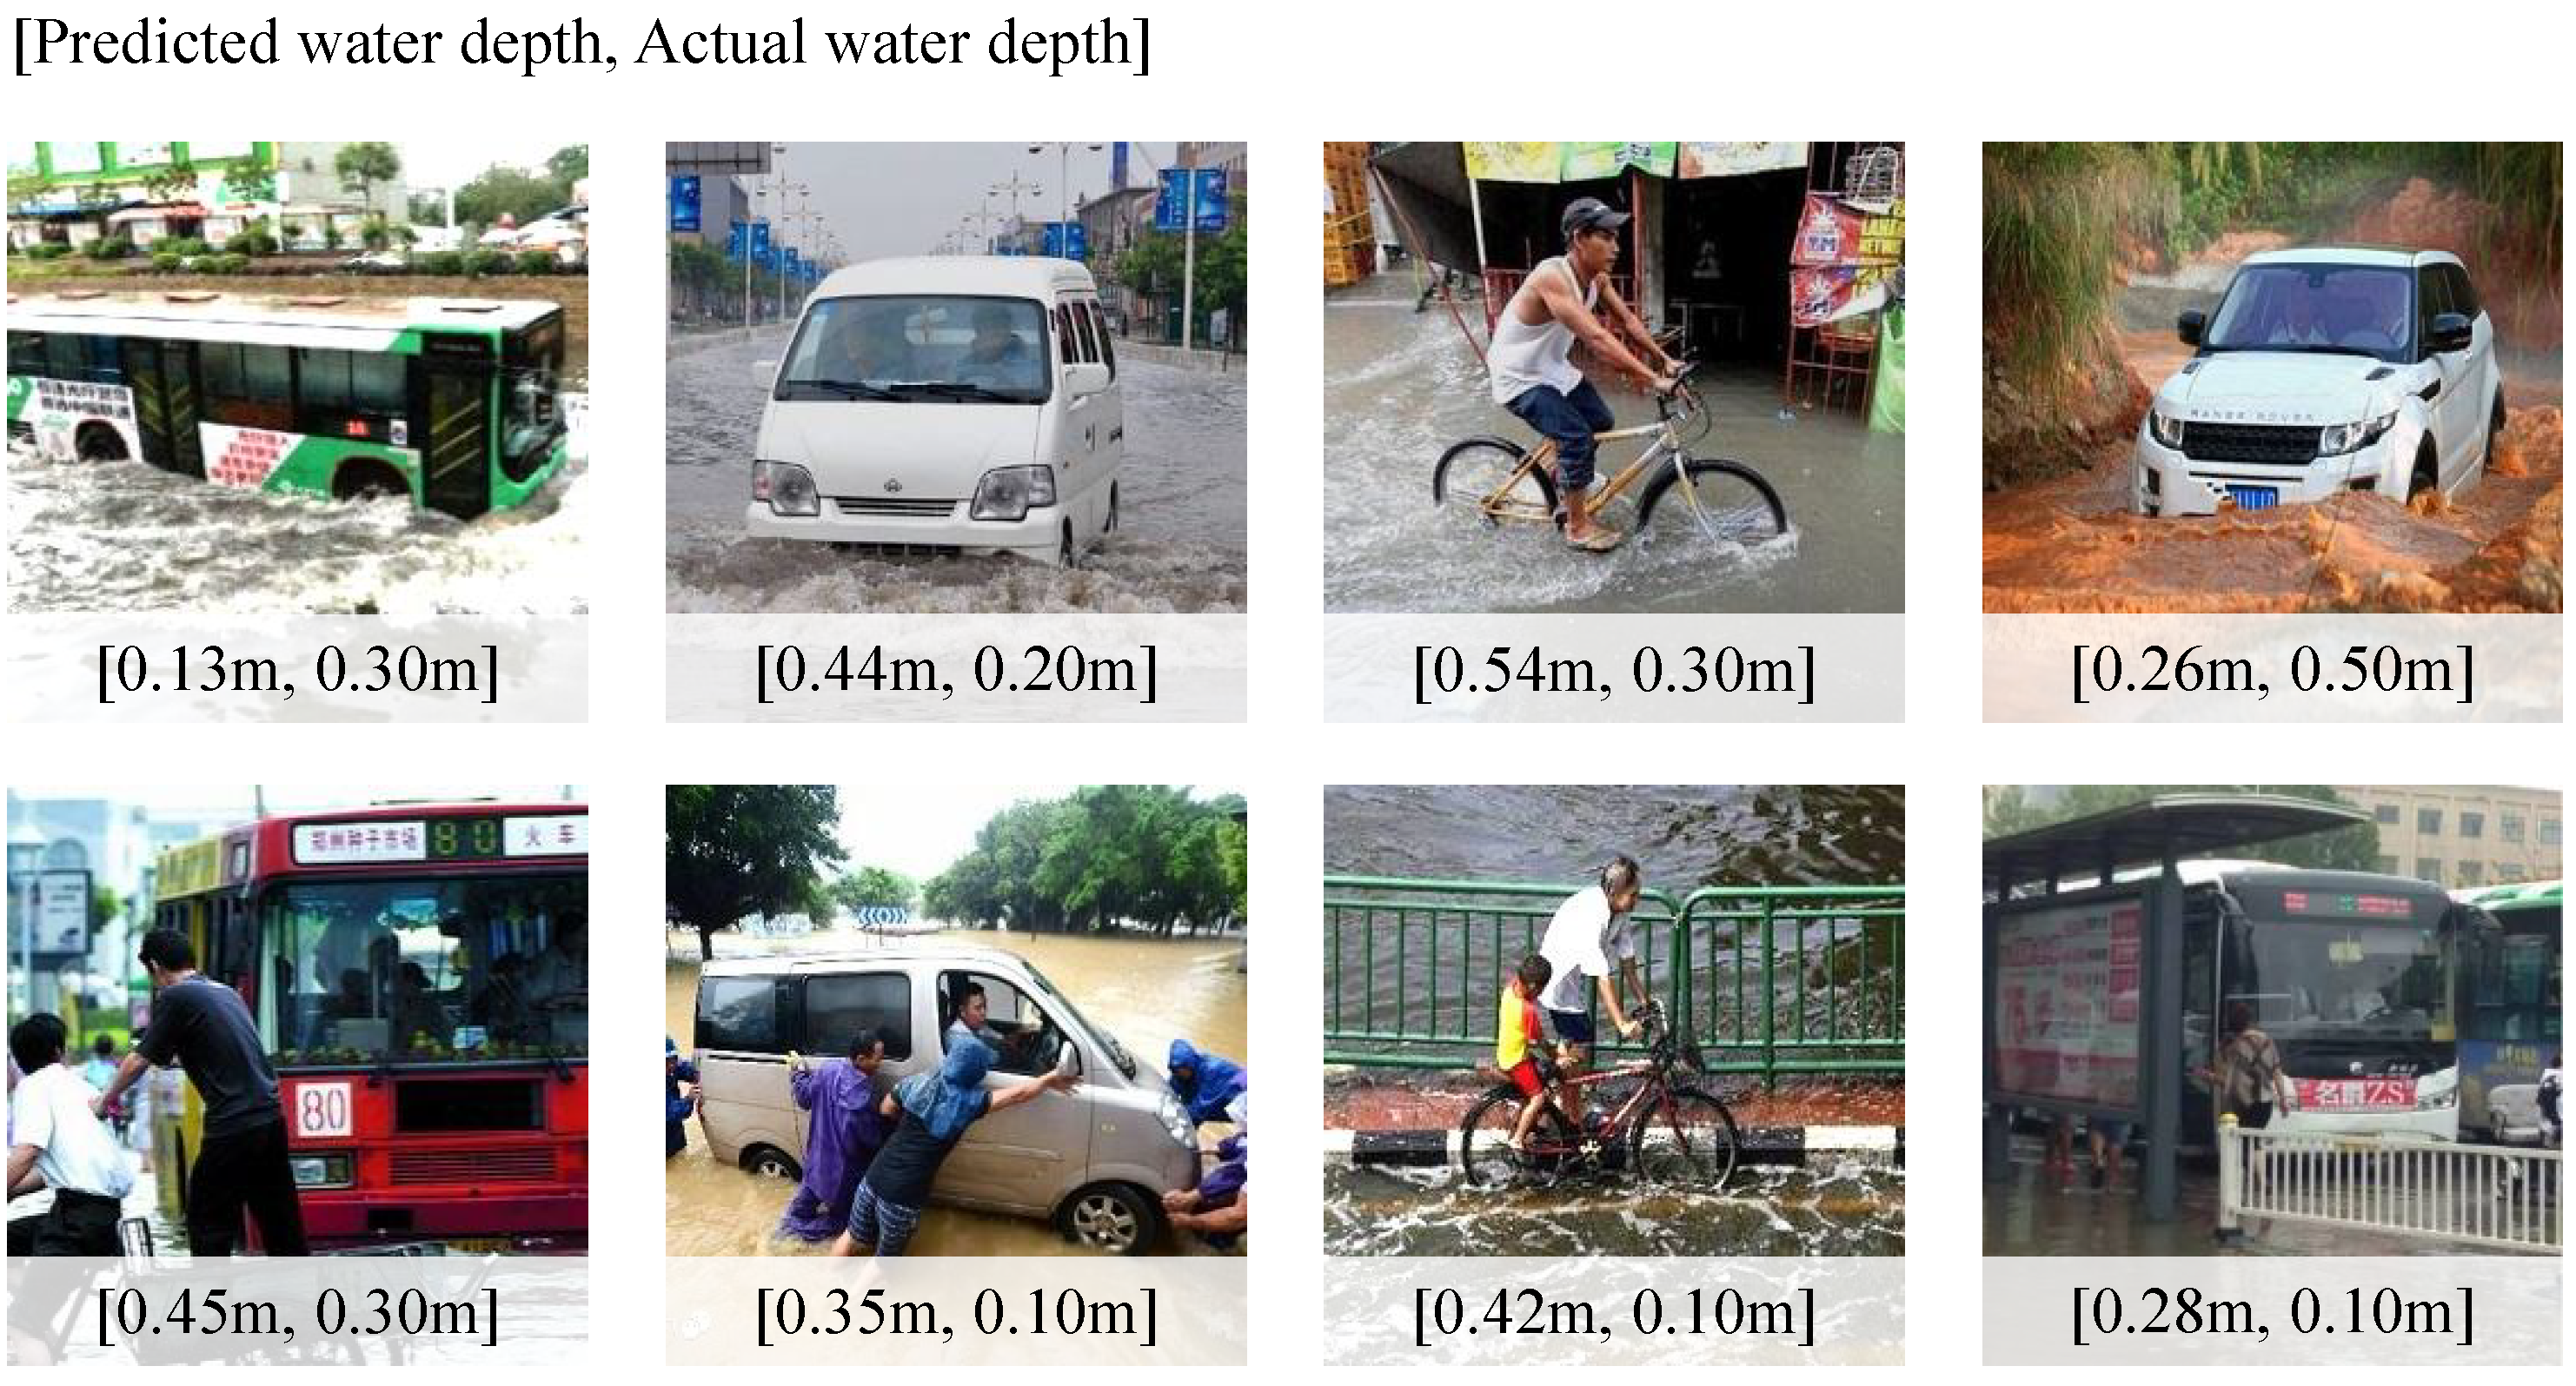
In the entire workflow of the proposed method, the large models, having been pre-trained on ultra-large-scale datasets, have reached a high level of intelligence and reliability. The primary potential sources of error are as follows: First, the lack of filtering for fake data collected by the web crawler. For instance, while the current pre-trained large models can effectively judge the relevance of text to specific flood events based on flood-related content, their ability to identify fake flood information texts has not been tested. Similarly, the identification of mismatched or forged images in fake messages that use images from other flood events has not been evaluated. Existing methods in computer science, such as techniques for filtering fake data using statistical information and identifying AI-generated images, can be leveraged for performance improvement. Second, the subjective error introduced by the reliance on expert experiential labeling in the EdgeNN dataset. In this method, the purpose of distinguishing reference object categories like car, SUV, and MPV is not to use different vehicle types to estimate water depth. Thus, the reference object category itself is not a major source of error. The categorization primarily facilitates easier and more accurate identification of images containing reference objects by the YOLO-World model during the image mining stage, ensuring alignment with the reference object distribution in the training dataset and avoiding application errors when the data lacks the reference objects present in the training set. Using different reference object categories also aids in establishing the labeling criteria described in Section 2.4. However, this standard itself is a potential source of error. For example, regarding variation in the size within classes, when expert experience is substantial, comprehensive judgment during labeling can overcome this error. But when expert experience is insufficient and reliance is placed solely on the labeling criteria shown in Figure 3, errors may arise. The multi-expert cross-validation in Section 2.4 can mitigate this error. Third, the incompleteness of the EdgeNN dataset. For instance, it may lack data under severe wave conditions, occlusions, or extremely poor lighting. Figure 11 shows examples where EdgeNN produces detection errors under wave and occlusion conditions, with the maximum perception error reaching 0.32 m. Therefore, the dataset collection process should strive to include various adverse scenarios. Alternatively, by collecting a sufficiently large number of samples and combining geographic tag information to generate water depth maps, statistical methods can be incorporated to remove outlier perception values. Finally, another potential error source arises when the actual water depth during application exceeds the range covered by the water depth distribution in the EdgeNN training dataset. This situation might occur due to labeling errors when the target reference object is floating, or if the selected reference object’s form is too easily influenced by flood depth, among other reasons.

4. Conclusions and Future Works

This study presents a lightweight framework that integrates pre-trained large models with edge training to estimate urban flood depth in data-scarce scenarios. By designing prompt templates for urban flood utilizing multimodal large models to automatically filter social media images and extract reference object features, this method eliminates the traditional time-consuming data collection, manual data labeling, and computationally expensive training for texts/images relevance filtering, object detection, and universal image compressive representation. By designing a lightweight flood depth sensing neural network as the final step, the method is easy to deploy. Ultimately, the proposed method significantly improves the accuracy and efficiency of urban flood depth estimation. Test results show that the proposed method reduces mean squared error by over 80% compared to existing approaches, with a maximum error of just 0.006. The method completes single-image processing in under 0.5 s, achieving fast performance. Additionally, the model demonstrates strong robustness to changes in viewpoint, lighting, and image quality. Since this method does not require large model training or hardware infrastructure construction, combining the ubiquity and abundance of social media images, this method achieves ubiquitous, green, and fast sensing of urban flood depth. The design concept of large model preprocessing combined with a separable, lightweight edge perception network, as presented in this paper, can be referenced not only for flood depth perception applications but also for other urban management areas such as road health monitoring and pollution monitoring.
The method presented in this paper still has limitations. Future work will focus on improving the data reliability and refining multimodal feature fusion strategies to enhance generalization in more complex environments. For example, by filtering out fake data collected by web crawlers and exploring more diverse objective labeling methods. Furthermore, an important data point in urban flood management is geographic tagging. After the relevance detection step in this paper, geographic tagging can be obtained by designing prompt templates similar to those in Table 1 and utilizing large language models to acquire the corresponding GPS coordinates for each image scene. With geographic coordinates available, generating spatiotemporal dynamic water depth maps under challenges like uneven spatiotemporal sampling and data conflicts represents a crucial next step to support smart city initiatives and enhance resilience against extreme rainstorm and flood disasters.
Author Contributions

Conceptualization, C.T.; Writing—original draft preparation, L.L. and C.T.; Writing—review and editing, C.T., Y.X. and Q.L.; Visualization, L.L. and Z.Z.; Formal analysis, L.L. and Z.Z.; Methodology, Z.Z.; Supervision, C.T. and Q.L.; Funding acquisition, C.T. All authors have read and agreed to the published version of the manuscript.

Funding

This work is partially fund by National Natural Science Foundation of China (no. 62103154, no. 62573206); Young Elite Scientists Sponsorship Program by CAST (2023QNRC001); Fundamental Research Funds for the Central Universities (no. 2021XXJS097); Zhengzhou University-Huazhong University of Science and Technology co-project (no. FW323240141).

Institutional Review Board Statement

Not applicable.

Informed Consent Statement

Not applicable.

Data Availability Statement

Core data and codes of this paper are uploaded to https://gitee.com/team-resource-billtang_0/water-depth-sensing-with-big-models-and-edge-nn.git (accessed on 6 October 2025).

Acknowledgments

The authors would like to thank the reviewers for their insightful comments.

Conflicts of Interest

The authors declare that they have no known competing financial interests or personal relationships that could have appeared to influence the work reported in this paper.

References

  1. Mignot, E.; Dewals, B. Hydraulic modelling of inland urban flooding: Recent advances. J. Hydrol. 2022, 609, 127763. [Google Scholar] [CrossRef]
  2. Aziz, F.; Wang, X.; Mahmood, M.Q.; Awais, M.; Trenouth, B. Coastal urban flood risk management: Challenges and opportunities- A systematic review. J. Hydrol. 2024, 645, 132271. [Google Scholar] [CrossRef]
  3. Agonafir, C.; Lakhankar, T.; Khanbilvardi, R.; Krakauer, N.; Radell, D.; Devineni, N. A review of recent advances in urban flood research. Water Secur. 2023, 19, 100141. [Google Scholar] [CrossRef]
  4. Borowska-Stefańska, M.; Bartnik, A.; Dulebenets, M.A.; Kowalski, M.; Sahebgharani, A.; Tomalski, P.; Wiśniewski, S. Changes in the equilibrium of the urban transport system of a large city following an urban flood. Reliab. Eng. Syst. Saf. 2025, 253, 110473. [Google Scholar] [CrossRef]
  5. Pei, S.; Fu, G.; Hoang, L.; Butler, D. Robustness of neuro-evolution in urban drainage system control under communication failures: Comparing centralized and decentralized control schemes. Water Res. 2025, 282, 123733. [Google Scholar] [CrossRef]
  6. Zhang, D.M.; Bai, H.; Zheng, C.Z.; Huang, H.W.; Ayyub, B.M.; Cao, W.J. Extreme rainfall induced risk mapping for metro transit systems: Shanghai metro network as a case. Reliab. Eng. Syst. Saf. 2025, 262, 111234. [Google Scholar] [CrossRef]
  7. Zheng, Y.; Jin, X.; Wei, J.; Zhou, Y.; Zhang, Y. A novel framework for optimization and evaluation of sensors network in urban drainage system. Water Res. 2025, 270, 122833. [Google Scholar] [CrossRef]
  8. Aravamudhan, S.; Bhansali, S. Reinforced piezoresistive pressure sensor for ocean depth measurements. Sens. Actuators A Phys. 2007, 142, 111–117. [Google Scholar] [CrossRef]
  9. Nair, B.B.; Rao, S. Flood water depth estimation—A survey. In Proceedings of the 2016 IEEE International Conference on Computational Intelligence and Computing Research (ICCIC), Chennai, India, 15–17 December 2016; IEEE: Piscataway Township, NJ, USA, 2016; pp. 1–4. [Google Scholar]
  10. Shangkun, L.; Wangguandong, Z.; Xige, W.; Huangrui, X.; Jingye, C.; Cheng, Y.; Wentian, Z.; Xiuguo, Z. A novel depth measurement method for urban flooding based on surveillance video images and a floating ruler. Nat. Hazards 2023, 119, 1967–1989. [Google Scholar] [CrossRef]
  11. Wang, Y.; Zhang, Q.; Zhang, J.; Lin, K. Impact of 2D and 3D factors on urban flooding: Spatial characteristics and interpretable analysis of drivers. Water Res. 2025, 280, 123537. [Google Scholar] [CrossRef]
  12. de Vitry, M.M.; Leitão, J.P. The potential of proxy water level measurements for calibrating urban pluvial flood models. Water Res. 2020, 175, 115669. [Google Scholar] [CrossRef]
  13. Romanowicz, R.J.; Young, P.C.; Beven, K.J. Data assimilation and adaptive forecasting of water levels in the river Severn catchment, United Kingdom. Water Resour. Res. 2006, 42, W06407.1–W06407.12. [Google Scholar] [CrossRef]
  14. Romanowicz, R.J.; Young, P.C.; Beven, K.J.; Pappenberger, F. A data based mechanistic approach to nonlinear flood routing and adaptive flood level forecasting. Adv. Water Resour. 2008, 31, 1048–1056. [Google Scholar] [CrossRef]
  15. Galasso, C.; Senarath, S.U.S. A Statistical Model for Flood Depth Estimation in Southeast Europe. In Proceedings of the International Conference on Vulnerability & Risk Analysis & Management, Liverpool, UK, 13–16 July 2014; pp. 1415–1424. [Google Scholar]
  16. Baida, M.E.; Boushaba, F.; Chourak, M.; Hosni, M. Real-Time Urban Flood Depth Mapping: Convolutional Neural Networks for Pluvial and Fluvial Flood Emulation. Water Resour. Manag. 2024, 38, 4763–4782. [Google Scholar] [CrossRef]
  17. Donnelly, J.; Abolfathi, S.; Pearson, J.; Chatrabgoun, O.; Daneshkhah, A. Gaussian process emulation of spatio-temporal outputs of a 2D inland flood model. Water Res. 2022, 225, 119100. [Google Scholar] [CrossRef]
  18. Liu, Y.; Wang, H.; Guan, X.; Meng, Y.; Xu, H. Urban Flood Depth Prediction and Visualization Based on the XGBoost-SHAP Model. Water Resour. Manag. 2025, 39, 1353–1375. [Google Scholar] [CrossRef]
  19. Nguyen, N.Y.; Ichikawa, Y.; Ishidaira, H. Estimation of inundation depth using flood extent information and hydrodynamic simulations. Hydrol. Res. Lett. 2016, 10, 39–44. [Google Scholar] [CrossRef]
  20. Nguyen, A.H.; Nguyen, P.T.; Nguyen, T.T. Enhanced flood water depth estimation from Sentinel-1A images. Int. J. Remote Sens. 2023, 44, 6399–6421. [Google Scholar] [CrossRef]
  21. Soleimani, R.; Soleimani-Babakamali, M.H.; Meng, S.; Avci, O.; Taciroglu, E. Computer vision tools for early post-disaster assessment: Enhancing generalizability. Eng. Appl. Artif. Intell. 2024, 136, 108855. [Google Scholar] [CrossRef]
  22. Temitope, A.; Huan, N.; Naser, L.M.; Zhenlong, L. Automated floodwater depth estimation using large multimodal model for rapid flood mapping. Comput. Urban Sci. 2024, 4, 12. [Google Scholar] [CrossRef]
  23. Goodfellow, I.J.; Pouget-Abadie, J.; Mirza, M.; Xu, B.; Warde-Farley, D.; Ozair, S.; Courville, A.C.; Bengio, Y. Generative Adversarial Nets. Adv. Neural Inf. Process. Syst. 2014, 27, 2672–2680. [Google Scholar]
  24. Koochali, A.; Bakhshipour, A.E.; Bakhshizadeh, M.; Habermehl, R.; Dilly, T.C.; Dittmer, U.; Ahmed, S.; Haghighi, A.; Dengel, A. Water depth prediction in combined sewer networks, application of generative adversarial networks. Discov. Appl. Sci. 2024, 6, 123. [Google Scholar] [CrossRef]
  25. Deo, P.; Siddiqui, M.A.; Siddiqui, L.; Naqvi, H.R.; Faruque, U.; Dwivedi, D. An integrated approach for urban flood risk prediction using AHP-TOPSIS model: A case study of Jaipur region. Nat. Hazards 2025, 121, 4385–4445. [Google Scholar] [CrossRef]
  26. Liv, H.; Mubarak, A.; Nayana, M.; Xing, W. Spatially estimating flooding depths from damage reports. Nat. Hazards 2023, 117, 1633–1645. [Google Scholar] [CrossRef]
  27. Sirsant, S.; Hinge, G.; Singh, H.; Hamouda, M.A. A hybrid convolutional neural network model coupled with AdaBoost regressor for flood mapping using geotagged flood photographs. Nat. Hazards 2025, 121, 5799–5819. [Google Scholar] [CrossRef]
  28. Li, J.; Cai, R.; Tan, Y.; Zhou, H.; Sadick, A.M.; Shou, W.; Wang, X. Automatic detection of actual water depth of urban floods from social media images. Measurement 2023, 216, 112891. [Google Scholar] [CrossRef]
  29. Panakkal, P.; Padgett, J.E. More eyes on the road: Sensing flooded roads by fusing real-time observations from public data sources. Reliab. Eng. Syst. Saf. 2024, 251, 110368. [Google Scholar] [CrossRef]
  30. He, J.; Zhang, L.; Xiao, T.; Wang, H.; Luo, H. Deep learning enables super-resolution hydrodynamic flooding process modeling under spatiotemporally varying rainstorms. Water Res. 2023, 239, 120057. [Google Scholar] [CrossRef]
  31. Fu, G.; Jin, Y.; Sun, S.; Yuan, Z.; Butler, D. The role of deep learning in urban water management: A critical review. Water Res. 2022, 223, 118973. [Google Scholar] [CrossRef] [PubMed]
  32. Chaudhary, P.; D’Aronco, S.; Moy de Vitry, M.; Leitão, J.P.; Wegner, J.D. Flood-water level estimation from social media images. ISPRS Ann. Photogramm. Remote Sens. Spat. Inf. Sci. 2019, 4, 5–12. [Google Scholar] [CrossRef]
  33. Chaudhary, P.; Leitão, J.P.; Schindler, K.; Wegner, J.D. Flood Water Depth Prediction with Convolutional Temporal Attention Networks. Water 2024, 16, 1286. [Google Scholar] [CrossRef]
  34. Vitry, M.M.d.; Kramer, S.; Wegner, J.D.; Leitão, J.P. Scalable flood level trend monitoring with surveillance cameras using a deep convolutional neural network. Hydrol. Earth Syst. Sci. 2019, 23, 4621–4634. [Google Scholar] [CrossRef]
  35. Liu, B.; Li, Y.; Feng, X.; Lian, P. BEW-YOLOv8: A deep learning model for multi-scene and multi-scale flood depth estimation. J. Hydrol. 2024, 645, 132139. [Google Scholar] [CrossRef]
  36. Park, S.; Baek, F.; Sohn, J.; Kim, H. Computer Vision–Based Estimation of Flood Depth in Flooded-Vehicle Images. J. Comput. Civ. Eng. 2021, 35, 04020072. [Google Scholar] [CrossRef]
  37. He, K.; Gkioxari, G.; Dollár, P.; Girshick, R. Mask R-CNN. In Proceedings of the IEEE International Conference on Computer Vision (ICCV), Venice, Italy, 22–29 October 2017; pp. 2961–2969. [Google Scholar]
  38. Simonyan, K.; Zisserman, A. Very Deep Convolutional Networks for Large-Scale Image Recognition. arXiv 2014, arXiv:1409.1556. [Google Scholar]
  39. Girshick, R.; Donahue, J.; Darrell, T.; Malik, J. Rich feature hierarchies for accurate object detection and semantic segmentation. In Proceedings of the IEEE Conference on Computer Vision and Pattern Recognition, Columbus, OH, USA, 23–28 June 2014; pp. 580–587. [Google Scholar]
  40. Redmon, J.; Divvala, S.; Girshick, R.; Farhadi, A. You only look once: Unified, real-time object detection. In Proceedings of the IEEE Conference on Computer Vision and Pattern Recognition, Las Vegas, NV, USA, 27–30 June 2016; pp. 779–788. [Google Scholar]
  41. DeepSeek-AI; Guo, D.; Yang, D.; Zhang, H.; Song, J.; Zhang, R.; Xu, R.; Zhu, Q.; Ma, S.; Wang, P.; et al. DeepSeek-R1: Incentivizing Reasoning Capability in LLMs via Reinforcement Learning. arXiv 2025, arXiv:2501.12948. [Google Scholar] [CrossRef]
  42. Radford, A.; Kim, J.W.; Hallacy, C.; Ramesh, A.; Goh, G.; Agarwal, S.; Sastry, G.; Askell, A.; Mishkin, P.; Clark, J. Learning Transferable Visual Models From Natural Language Supervision. In Proceedings of the 38th International Conference on Machine Learning, Virtual, 18–24 July 2021; pp. 8748–8763. [Google Scholar]
  43. Cheng, T.; Song, L.; Ge, Y.; Liu, W.; Wang, X.; Shan, Y. YOLO-World: Real-Time Open-Vocabulary Object Detection. In Proceedings of the IEEE/CVF Conference on Computer Vision and Pattern Recognition, Seattle, WA, USA, 16–22 June 2024; pp. 16901–16911. [Google Scholar]
  44. Lin, T.Y.; Maire, M.; Belongie, S.; Hays, J.; Perona, P.; Ramanan, D.; Dollár, P.; Zitnick, C.L. Microsoft coco: Common objects in context. In Proceedings of the Computer Vision–ECCV 2014: 13th European Conference, Zurich, Switzerland, 6–12 September 2014; Proceedings, Part V 13. Springer: Berlin/Heidelberg, Germany, 2014; pp. 740–755. [Google Scholar]
  45. Deng, J.; Dong, W.; Socher, R.; Li, L.J.; Li, K.; Fei-Fei, L. Imagenet: A large-scale hierarchical image database. In Proceedings of the 2009 IEEE Conference on Computer Vision and Pattern Recognition, Miami, FL, USA, 20–25 June 2009; IEEE: Piscataway Township, NJ, USA, 2009; pp. 248–255. [Google Scholar]
Figure 1. Overall diagram of the proposed ubiquitous, green, and fast urban flood water depth sensing method.
Hydrology 12 00307 g001
Figure 2. Check algorithm for removing duplicate images using OpenCLIP.
Hydrology 12 00307 g002
Figure 3. Example depth-labeling guidelines for SUV.
Hydrology 12 00307 g003
Figure 4. The edge training dataset with (a) example images, (b) reference object numbers for each class, and (c) the annotated water depth distribution. Photos come from a volunteering data collection project on Wechat Official Account zzuflood.
Hydrology 12 00307 g004
Figure 5. Message relevance check examples with DeepSeek-R1.
Hydrology 12 00307 g005
Figure 6. Similarity metrics between the OpenCLIP features of images under various conditions. (a) The baseline images, (b) slightly different field of view, (c) slightly different color style, (d) different brightness, (e) examples of not-duplicate images. Photos come from a volunteering data collection project on the Wechat Official Account zzuflood.
Hydrology 12 00307 g006
Figure 7. Image relevance check examples with OpenCLIP. Photos come from a volunteering data collection project on the Wechat Official Account zzuflood.
Hydrology 12 00307 g007
Figure 8. Detection performance for each class with YOLO-World. Photos come from a volunteering data collection project on the Wechat Official Account zzuflood.
Hydrology 12 00307 g008
Figure 9. Multi-instance detection examples with YOLO-World. Photos come from a volunteering data collection project on the Wechat Official Account zzuflood.
Hydrology 12 00307 g009
Figure 10. Estimation accuracy of flood depth under different error tolerances for different methods.
Hydrology 12 00307 g010
Figure 11. Examples of limitations of the method under flood wave (the first row) and occlusion (the second row) conditions.
Hydrology 12 00307 g011
Table 1. Prompt 1 template of DeepSeek-R1 for message relevance check.
FieldContent
TaskDetermine whether the following text belongs to a specific flood event.
InputsTexts that have flood location or time information
OutputsYes or No
PromptMainly considering the flood time and location, if the text belongs to {Flood Event Name}, return “Yes”; otherwise, return “No”.
Example inputs“2021.7.20”, “Zhengzhou experienced an extreme downpour, with multiple subway stations flooded. Citizens actively carried out self-rescue operations.”
DeepSeek-R1 outputYes
Example inputs“Recently, a city in Hubei Province experienced urban flooding, with severe water accumulation on some streets.”
DeepSeek-R1 outputNo
Table 2. Prompt 2 template of OpenCLIP for image relevance check.
FieldContent
TaskUse OpenCLIP to determine whether the image belongs to a flood scene containing the target reference object.
InputsAn image and a name list of reference objects
OutputsTwo probability values that indicate true or false
Prompt[“a photo of flood with {any reference objects in the list}”, “not a photo of flood with {any reference objects in the list}”]
Example output[0.9, 0.1] (Indicating that the image highly matches the description “a photo of flood with {any reference objects in the list}”)
Table 3. Prompt 3 template of Yolo-World for depth references detection.
FieldContent
TaskFind out minimum rectangle regions on images for reference objects
InputsAn image and prompt texts for reference objects
OutputsMinimum bounding rectangles of reference objects and their confidence score
Example prompt for carA standard sedan, suitable for common private car scenarios in urban floods.
Example prompt for busA bus or other large vehicle, suitable as a tall and conspicuous reference object.
Example prompt for bicycleA bicycle, suitable as a small but common reference object in flood scenarios.
Example prompt for SUVA sport utility vehicle, with a larger volume, suitable as a conspicuous and stable reference object.
Table 4. Ablation study for depth references detection step under false and miss detection rates.
MethodMetricBicycleBusCarMPVSUVAverage
Vehicle-RCNNFalse detection rate3.99%3.83%3.92%3.55%3.54%3.72%
Miss detection rate3.12%3.96%4.30%3.95%3.89%3.85%
Media-RCNNFalse detection rate4.35%4.58%3.05%3.44%3.57%3.71%
Miss detection rate3.31%3.88%3.92%3.62%3.78%3.75%
Our methodFalse detection rate2.20%1.78%0.51%1.40%1.30%1.44%
Miss detection rate1.10%1.78%1.02%1.47%0.65%1.20%
Table 5. Ablation study for depth references detection step under localization accuracy for bounding-boxes.
MetricOur MethodVehicle-RCNNMedia-RCNN
Precision82.53%71.45%77.08%
Recall87.28%76.48%80.04%
mAP_0.5 184.33%72.39%75.18%
mAP_0.5:0.95 250.73%44.93%45.88%
1 Mean average precision at intersection over union threshold 0.5. 2 Mean average precision averaged over multiple intersections over union thresholds from 0.5 to 0.95.
Table 6. Example images and their measured flood depth values. Photos come from a volunteering data collection project on the Wechat Official Account zzuflood.
CasesNo.1No.2No.3No.4
Example imagesHydrology 12 00307 i001Hydrology 12 00307 i002Hydrology 12 00307 i003Hydrology 12 00307 i004
Ground truth0.10 m0.10 m0.10 m0.10 m
Estimated depth0.11 m0.11 m0.10 m0.09 m
Table 7. Mean squared error between estimated and ground truth flood depth for different methods.
VehicleOur MethodVehicle-RCNNMedia-RCNN
Bicycle0.001 (−94.4%)0.2460.018
Bus0.006 (−86.0%)2.4270.043
Car0.005 (−85.3%)1.8480.034
MPV0.003 (−88.5%)0.2620.026
SUV0.002 (−85.7%)0.2850.014
Disclaimer/Publisher’s Note: The statements, opinions and data contained in all publications are solely those of the individual author(s) and contributor(s) and not of MDPI and/or the editor(s). MDPI and/or the editor(s) disclaim responsibility for any injury to people or property resulting from any ideas, methods, instructions or products referred to in the content.