Article

Remote Sensing-Based Monitoring of Agricultural Drought and Irrigation Adaptation Strategies in the Antalya Basin, Türkiye

1
Department of Civil and Environmental Engineering, University of Virginia, Charlottesville, VA 22904, USA
2
Department of Civil Engineering, Faculty of Engineering and Natural Sciences, Suleyman Demirel University, Isparta 32260, Türkiye
3
Department of Environmental Engineering, Faculty of Engineering and Natural Sciences, Suleyman Demirel University, Isparta 32260, Türkiye
*
Author to whom correspondence should be addressed.
Hydrology 2025, 12(11), 288; https://doi.org/10.3390/hydrology12110288
Submission received: 26 September 2025 / Revised: 28 October 2025 / Accepted: 30 October 2025 / Published: 31 October 2025
(This article belongs to the Section Soil and Hydrology)

Abstract

Drought is a critical hazard to agricultural productivity in semi-arid regions such as the Antalya Agricultural Basin of Türkiye. This study assessed agricultural drought from 2001 to 2023 using multiple remote sensing-based indices processed in Google Earth Engine (GEE). Vegetation indicators (Normalized Difference Vegetation Index, Normalized Difference Water Index, Normalized Difference Drought Index, Vegetation Condition Index, Temperature Condition Index, and Vegetation Health Index) were derived from MODIS datasets, while the Precipitation Condition Index was calculated from CHIRPS precipitation data. Composite indicators included the Scaled Drought Composite Index, integrating vegetation, temperature, and precipitation factors, and the Soil Moisture Condition Index derived from reanalysis soil moisture data. Results revealed recurrent moderate drought with strong seasonal and interannual variability, with 2008 identified as the driest year and 2009 and 2012 as wet years. Summer was the most drought-prone season, with precipitation averaging 5.5 mm, PCI 1.1, SDCI 15.6, and SMCI 38.4, while winter exhibited recharge conditions (precipitation 197 mm, PCI 40.9, SDCI 57.3, SMCI 89.6). Interannual extremes were detected in 2008 (severe drought) and wetter conditions in 2009 and 2012. Vegetation stress was also notable in 2016 and 2018. The integration of multi-source datasets ensured consistency and robustness across indices. Overall, the findings improve understanding of agricultural drought dynamics and provide practical insights for irrigation modernization, efficient water allocation, and drought-resilient planning in line with Türkiye’s National Water Efficiency Strategy (2023–2033).

1. Introduction

Climate change is reshaping environmental, economic, and social systems worldwide, creating profound challenges for water-dependent sectors [1,2,3]. Rising temperatures, altered precipitation regimes, and declining freshwater availability intensify evapotranspiration, prolong dry spells, and exacerbate drought. Drought occurs in different forms—meteorological (precipitation deficit), hydrological (surface and groundwater decline), and agricultural (soil moisture stress affecting vegetation growth)—often interacting across temporal and spatial scales. For agriculture, these processes reduce soil moisture, impair crop physiology, and may lead to severe yield losses [4,5]. Such risks threaten food security, rural livelihoods, and economic stability [6]. In Türkiye, where agriculture remains a major pillar of the economy, drought-induced disruptions have particularly far-reaching implications.
Agricultural production in Türkiye is structurally dependent on irrigation. As of 2019, 72% of irrigated lands still relied on open-channel systems, while only 28% operated through closed pressurized networks [7]. Although new projects favor closed-pipe designs, conveyance losses in open channels remain a critical challenge [8]. Efficient methods such as sprinkler and drip irrigation can improve water efficiency by 35% and 65%, respectively [9], yet field-level inefficiencies persist. For instance, in the Şanlıurfa–Harran irrigation project, water applications exceeded crop requirements by up to sevenfold, causing groundwater rise and soil degradation [10]. In this context, deficit irrigation (DI), traditional deficit irrigation (TDI), partial root-zone drying (PRD), and supplementary irrigation (SI) have gained prominence for reducing water use while sustaining yields [11,12]. These approaches are increasingly critical as climate change amplifies drought frequency and intensity [13,14,15]. The Antalya Agricultural Basin, one of Türkiye’s most productive regions, is highly vulnerable to drought risks [16]. The basin cultivates high-value crops such as citrus, banana, strawberry, and tomato, which are highly sensitive to water stress during flowering and fruit-setting stages [17]. Recurrent droughts thus jeopardize both national food security and export revenues [18]. Addressing this vulnerability requires robust monitoring systems and adaptive water management [19].
Remote sensing offers unique advantages for drought monitoring, providing wide spatial coverage, temporal consistency, and cost-effectiveness compared to ground-based data [20,21,22,23]. While meteorological station data provide local accuracy, they often fail to capture basin-scale heterogeneity [24]. Satellite-derived indices, by contrast, integrate vegetation vigor, canopy water status, land surface temperature, and precipitation to capture multidimensional drought stress [25,26,27]. NDVI reflects vegetation health, NDWI measures canopy and soil moisture [28], and their combination—NDDI—detects areas simultaneously affected by vegetation and moisture stress [29]. Composite indices further improve monitoring. The Vegetation Condition Index (VCI) and Temperature Condition Index (TCI), respectively, capture vegetation greenness and heat stress, while their integration forms the Vegetation Health Index (VHI) [30]. To explicitly consider rainfall, the Precipitation Condition Index (PCI) has been widely applied [31]. More recently, the Scaled Drought Composite Index (SDCI) has unified VCI, TCI, and PCI, offering a comprehensive measure across diverse climates and timescales [20,32]. Similarly, the Soil Moisture Condition Index (SMCI) incorporates soil moisture anomalies into drought evaluation, enhancing the representation of agricultural water stress, particularly in semi-arid regions where subsurface dynamics are critical [33].
Türkiye’s agriculture consumes over three-quarters of total water withdrawals, far above global and European averages, exacerbating conflicts among agricultural, industrial, and domestic uses [34]. National frameworks emphasize efficient irrigation technologies, improved monitoring, and sustainable practices [35,36]. Yet basin-level assessments remain necessary to identify hotspots and guide adaptation [37,38]. Preliminary analyses highlight the Antalya Agricultural Basin’s vulnerability, particularly in high-value crop zones [39,40]. Rising vegetation sensitivity to drought may affect yields, exports, and rural livelihoods [4]. Integrating precision irrigation, soil moisture monitoring, and crop-specific drought forecasting emerges as an urgent priority [33,41].
Numerous studies have investigated drought dynamics in Türkiye using satellite-based indices, most have focused on either meteorological or vegetation conditions at coarse spatial or temporal scales. Few studies have integrated multi-source remote sensing datasets to jointly assess vegetation, thermal, precipitation, and soil moisture responses to drought at the basin level. Moreover, basin-specific applications that link drought monitoring with national water management strategies remain limited. To address these limitations, this study builds on previous efforts by integrating physical and policy dimensions—linking remote sensing-based drought detection with national water efficiency planning. This approach provides a bridge between scientific drought monitoring and actionable management strategies at the basin scale.
This study therefore aims to evaluate the temporal and spatial dynamics of agricultural drought in the Antalya Basin during 2001–2023 using multiple satellite-based indices (NDVI, NDWI, NDDI, VCI, TCI, VHI, PCI, SDCI, and SMCI) processed through Google Earth Engine (GEE). By combining MODIS, CHIRPS, and ERA5-Land datasets, annual and seasonal drought variability was assessed. The results reveal recurrent drought, particularly during summers with high water demand and minimal precipitation. Beyond documentation, the study emphasizes adaptation priorities, including irrigation modernization, adoption of deficit irrigation practices, and integration of real-time climate data into basin-level water management in line with Türkiye’s National Water Efficiency Strategy (2023–2033). This alignment underscores the applied relevance of the study, as the identification of seasonal drought hotspots and water-stress periods directly supports the Strategy’s goals of improving irrigation efficiency, optimizing basin-level allocation, and enhancing early warning and monitoring capacities.

2. Study Area

The Antalya Agricultural Basin, hereafter referred to as the Area of Interest (AOI), was selected to analyze agricultural drought dynamics for the period from January 2001 to December 2023. In 2009, Türkiye’s Ministry of Agriculture and Forestry designated thirty agricultural basins across the country, among which the AOI represents a key semi-arid Mediterranean region characterized by intensive agricultural activity and high irrigation demand (Figure 1). The upper map shows the position of the AOI within Türkiye’s national agricultural basin framework, while the lower map illustrates the detailed land cover distribution within the basin based on the dataset [42]. The maps were prepared using datasets obtained from the Republic of Türkiye Ministry of Agriculture and Forestry (General Directorate of Water Management) and the Copernicus Land Monitoring Service [42].
The AOI is one of Türkiye’s most productive regions, recognized for its intensive greenhouse-based and open-field cultivation. The basin contributes approximately 10.7% of Türkiye’s fresh vegetable production (about 2.5 million tonnes annually), with nearly 72% of this output realized in greenhouses. High-value crops such as citrus fruits, bananas, strawberries, and tomatoes dominate local agriculture, supplying both domestic markets and exports. Indeed, Antalya accounts for nearly 43% of Türkiye’s protected cultivation area and provides about 20% of national fruit and vegetable exports [43], underlining its strategic role in national food security and agroeconomic development. According to CORINE land cover data, the basin is characterized by a land use structure dominated by coniferous forests (31.1%) and transitional woodland–shrub (22.8%), while agricultural areas, particularly fruit plantations (7.8%), agriculture with natural vegetation (8.4%), and permanently irrigated lands (5.2%), collectively represent nearly one-quarter of the AOI [42]. Artificial and urbanized areas remain marginal (<2%), highlighting the prevalence of natural ecosystems alongside intensive agricultural activities. This heavy concentration of water-intensive and climate-sensitive crops, combined with the basin’s reliance on both surface and groundwater resources, makes it highly vulnerable to agricultural drought and climate variability. Therefore, the AOI provides a representative and critical case study for evaluating drought dynamics and for testing adaptation-oriented water efficiency measures, underscoring the urgency of developing sustainable irrigation and water management strategies at the basin scale.

3. Material and Methods

3.1. Data

This study employed multi-source remote sensing datasets, including precipitation, land surface temperature, vegetation indices, and soil moisture products. The datasets used in the analysis are summarized in Table 1.
The CHIRPS dataset (0.05°, ~5 km) merges satellite infrared observations with ground station data to provide bias-corrected and spatially continuous precipitation estimates from 1981 to the present. CHIRPS was preferred over point-based meteorological data because it ensures seamless spatial coverage and a consistent, gap-free time series essential for basin-scale drought analysis. Its gridded format aligns with MODIS and ERA5-Land resolutions, allowing integrated assessment of vegetation, temperature, and hydrological variables. Previous studies have confirmed its strong agreement with ground observations in Türkiye and Mediterranean regions, supporting its reliability for long-term agricultural drought monitoring [49,50,51].
The MODIS Surface Reflectance product (MOD09A1, 500 m, 8-day) was used to derive NDVI, NDWI, and NDDI, while the MODIS Land Surface Temperature product (MOD11A2, 1 km, 8-day) provided daytime LST, aggregated to monthly means for computing the Temperature Condition Index (TCI). Both datasets cover the period 2001–2023 and were processed in Google Earth Engine (GEE).
The SMAP downscaled dataset (NSIDC-0779, 1 km, daily) combines L-band passive radiometer observations from the 9 km SMAP product with MODIS LST and NDVI to achieve 1 km resolution (EASE-Grid 2.0, EPSG:6933). Daily data were aggregated to monthly means for 2015–2024. The dataset is available from https://nsidc.org/data/nsidc-0779/versions/1 (accessed on 8 August 2025).
Soil moisture dynamics were derived from ERA5-Land, a global reanalysis dataset produced by ECMWF. ERA5-Land combines observations with a physically based land surface model, ensuring spatial and temporal consistency. The dataset has ~9 km (0.1°) resolution and is available at hourly and monthly timescales. For this study, monthly soil moisture data for the period 2001–2023 were used to compute the SMCI. Data are available from ECMWF https://www.ecmwf.int/en/era5-land (accessed on 8 August 2025).
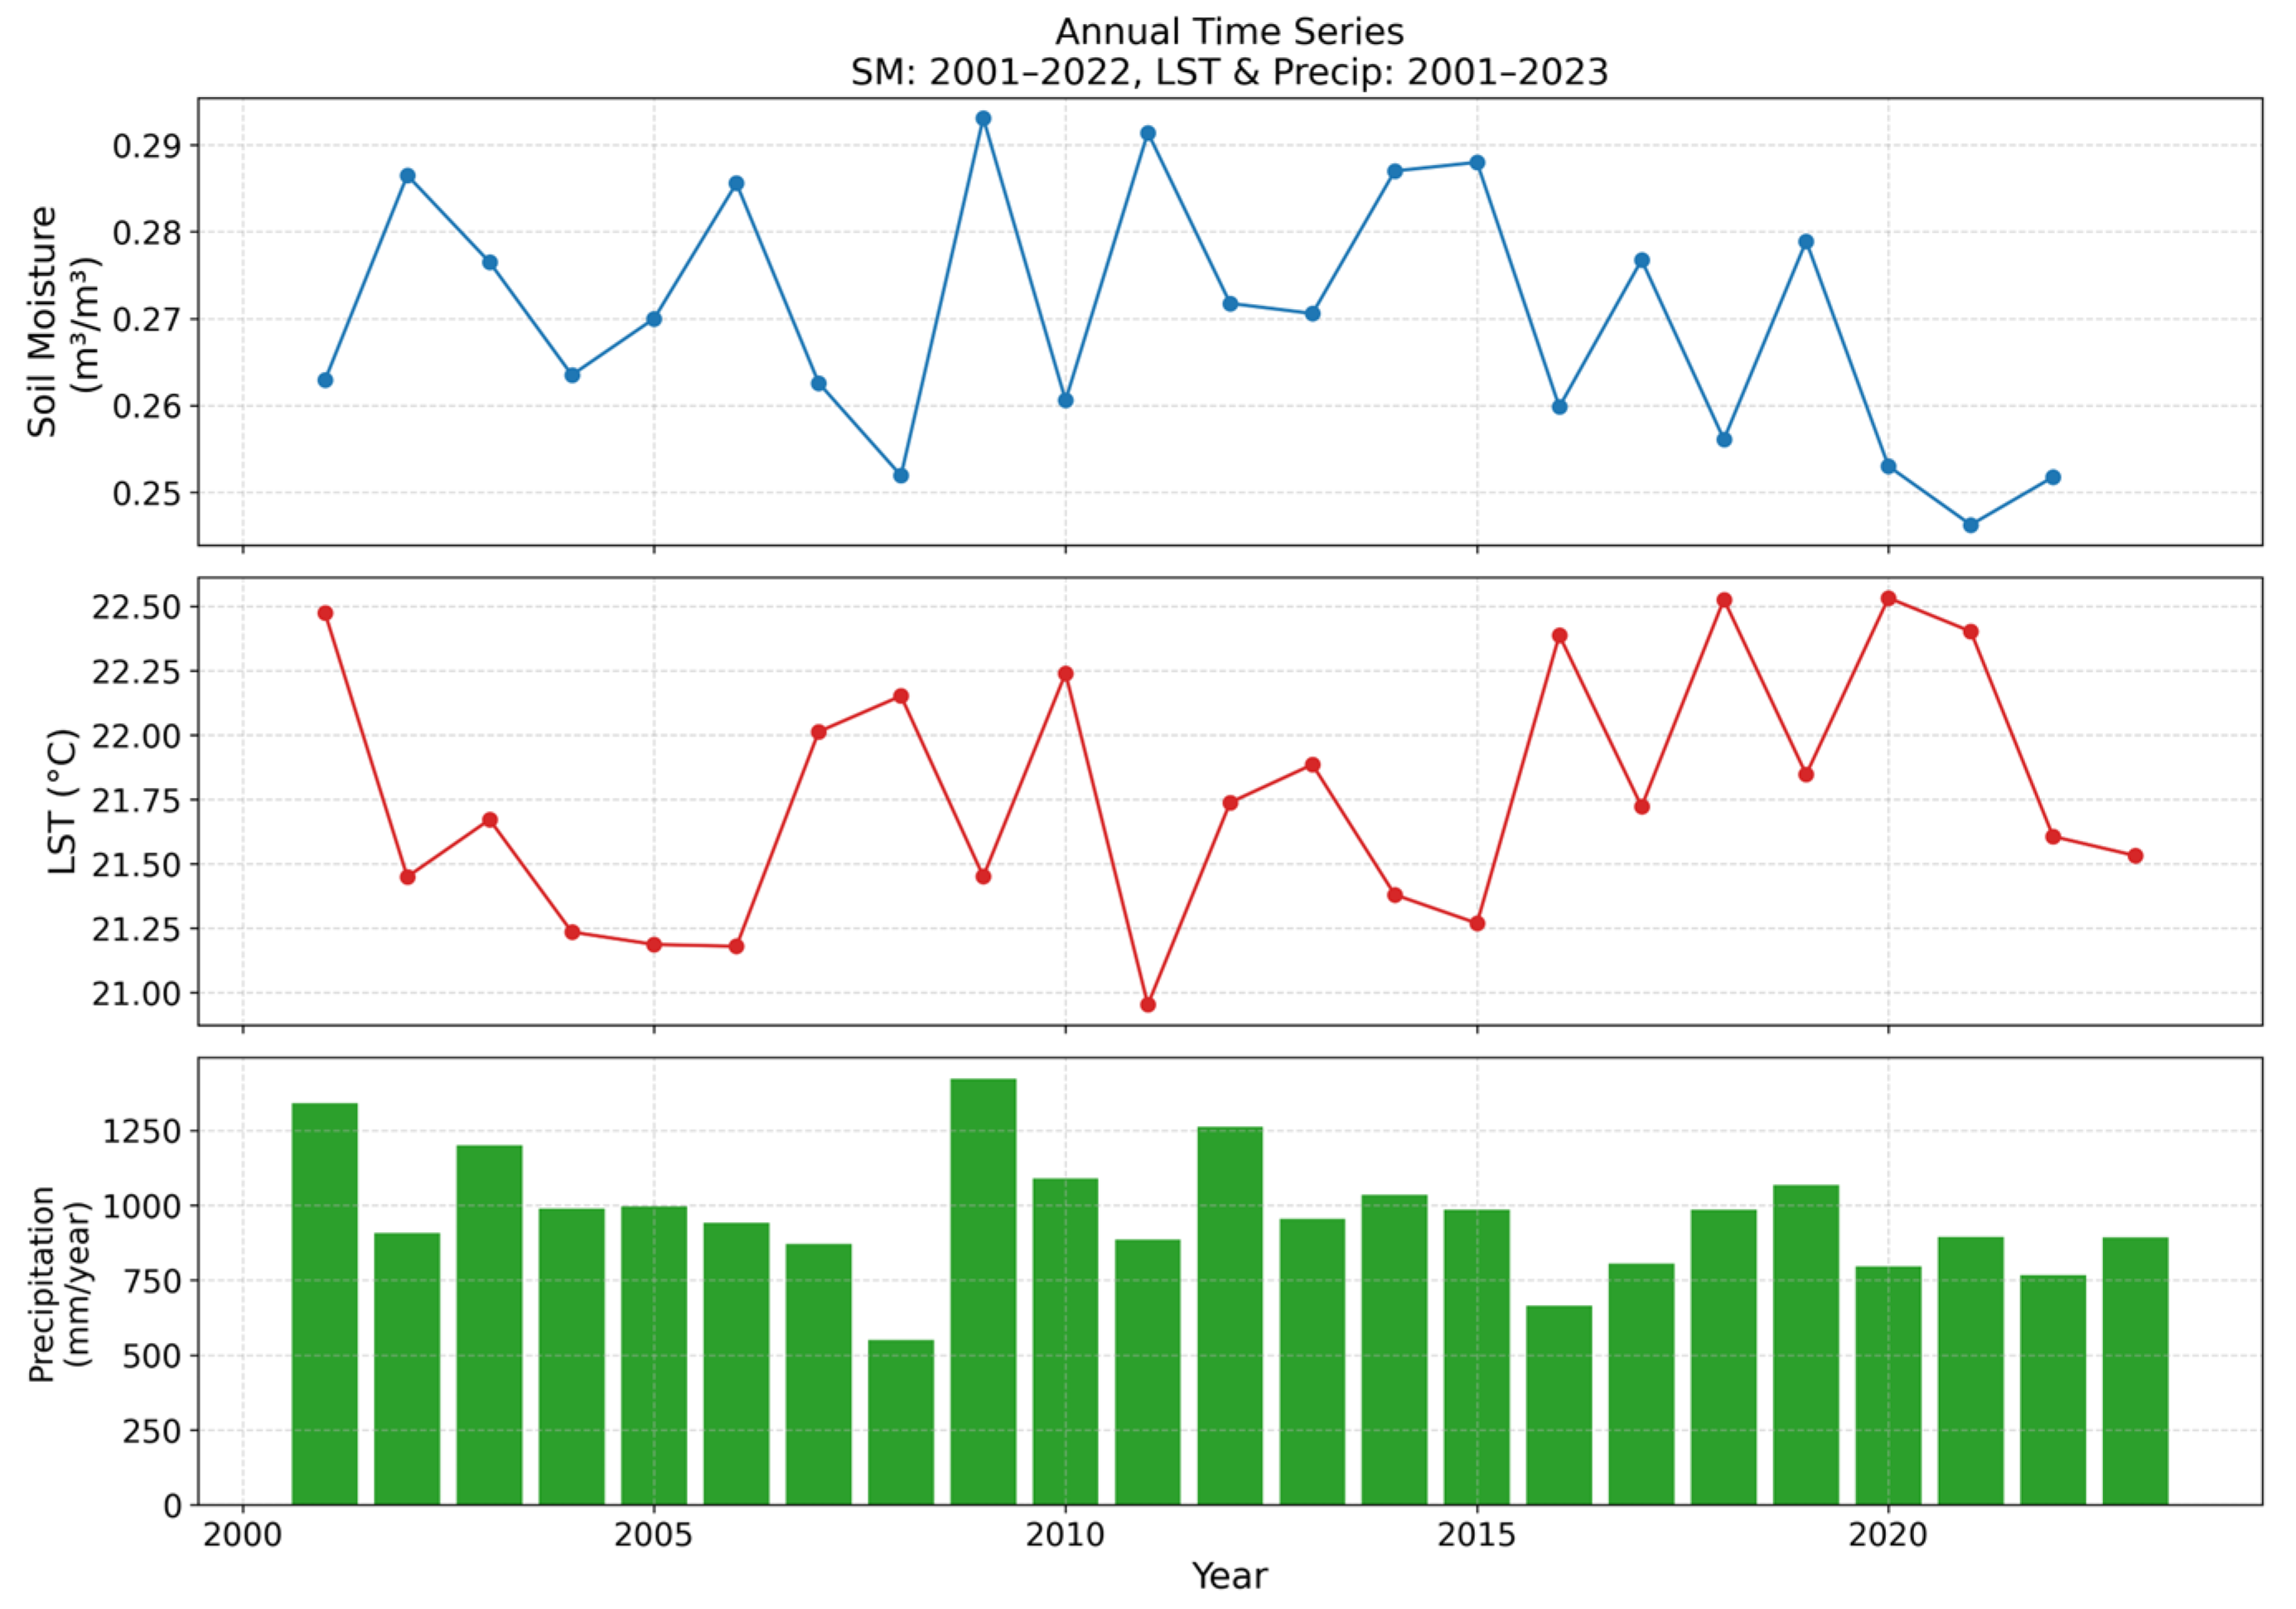
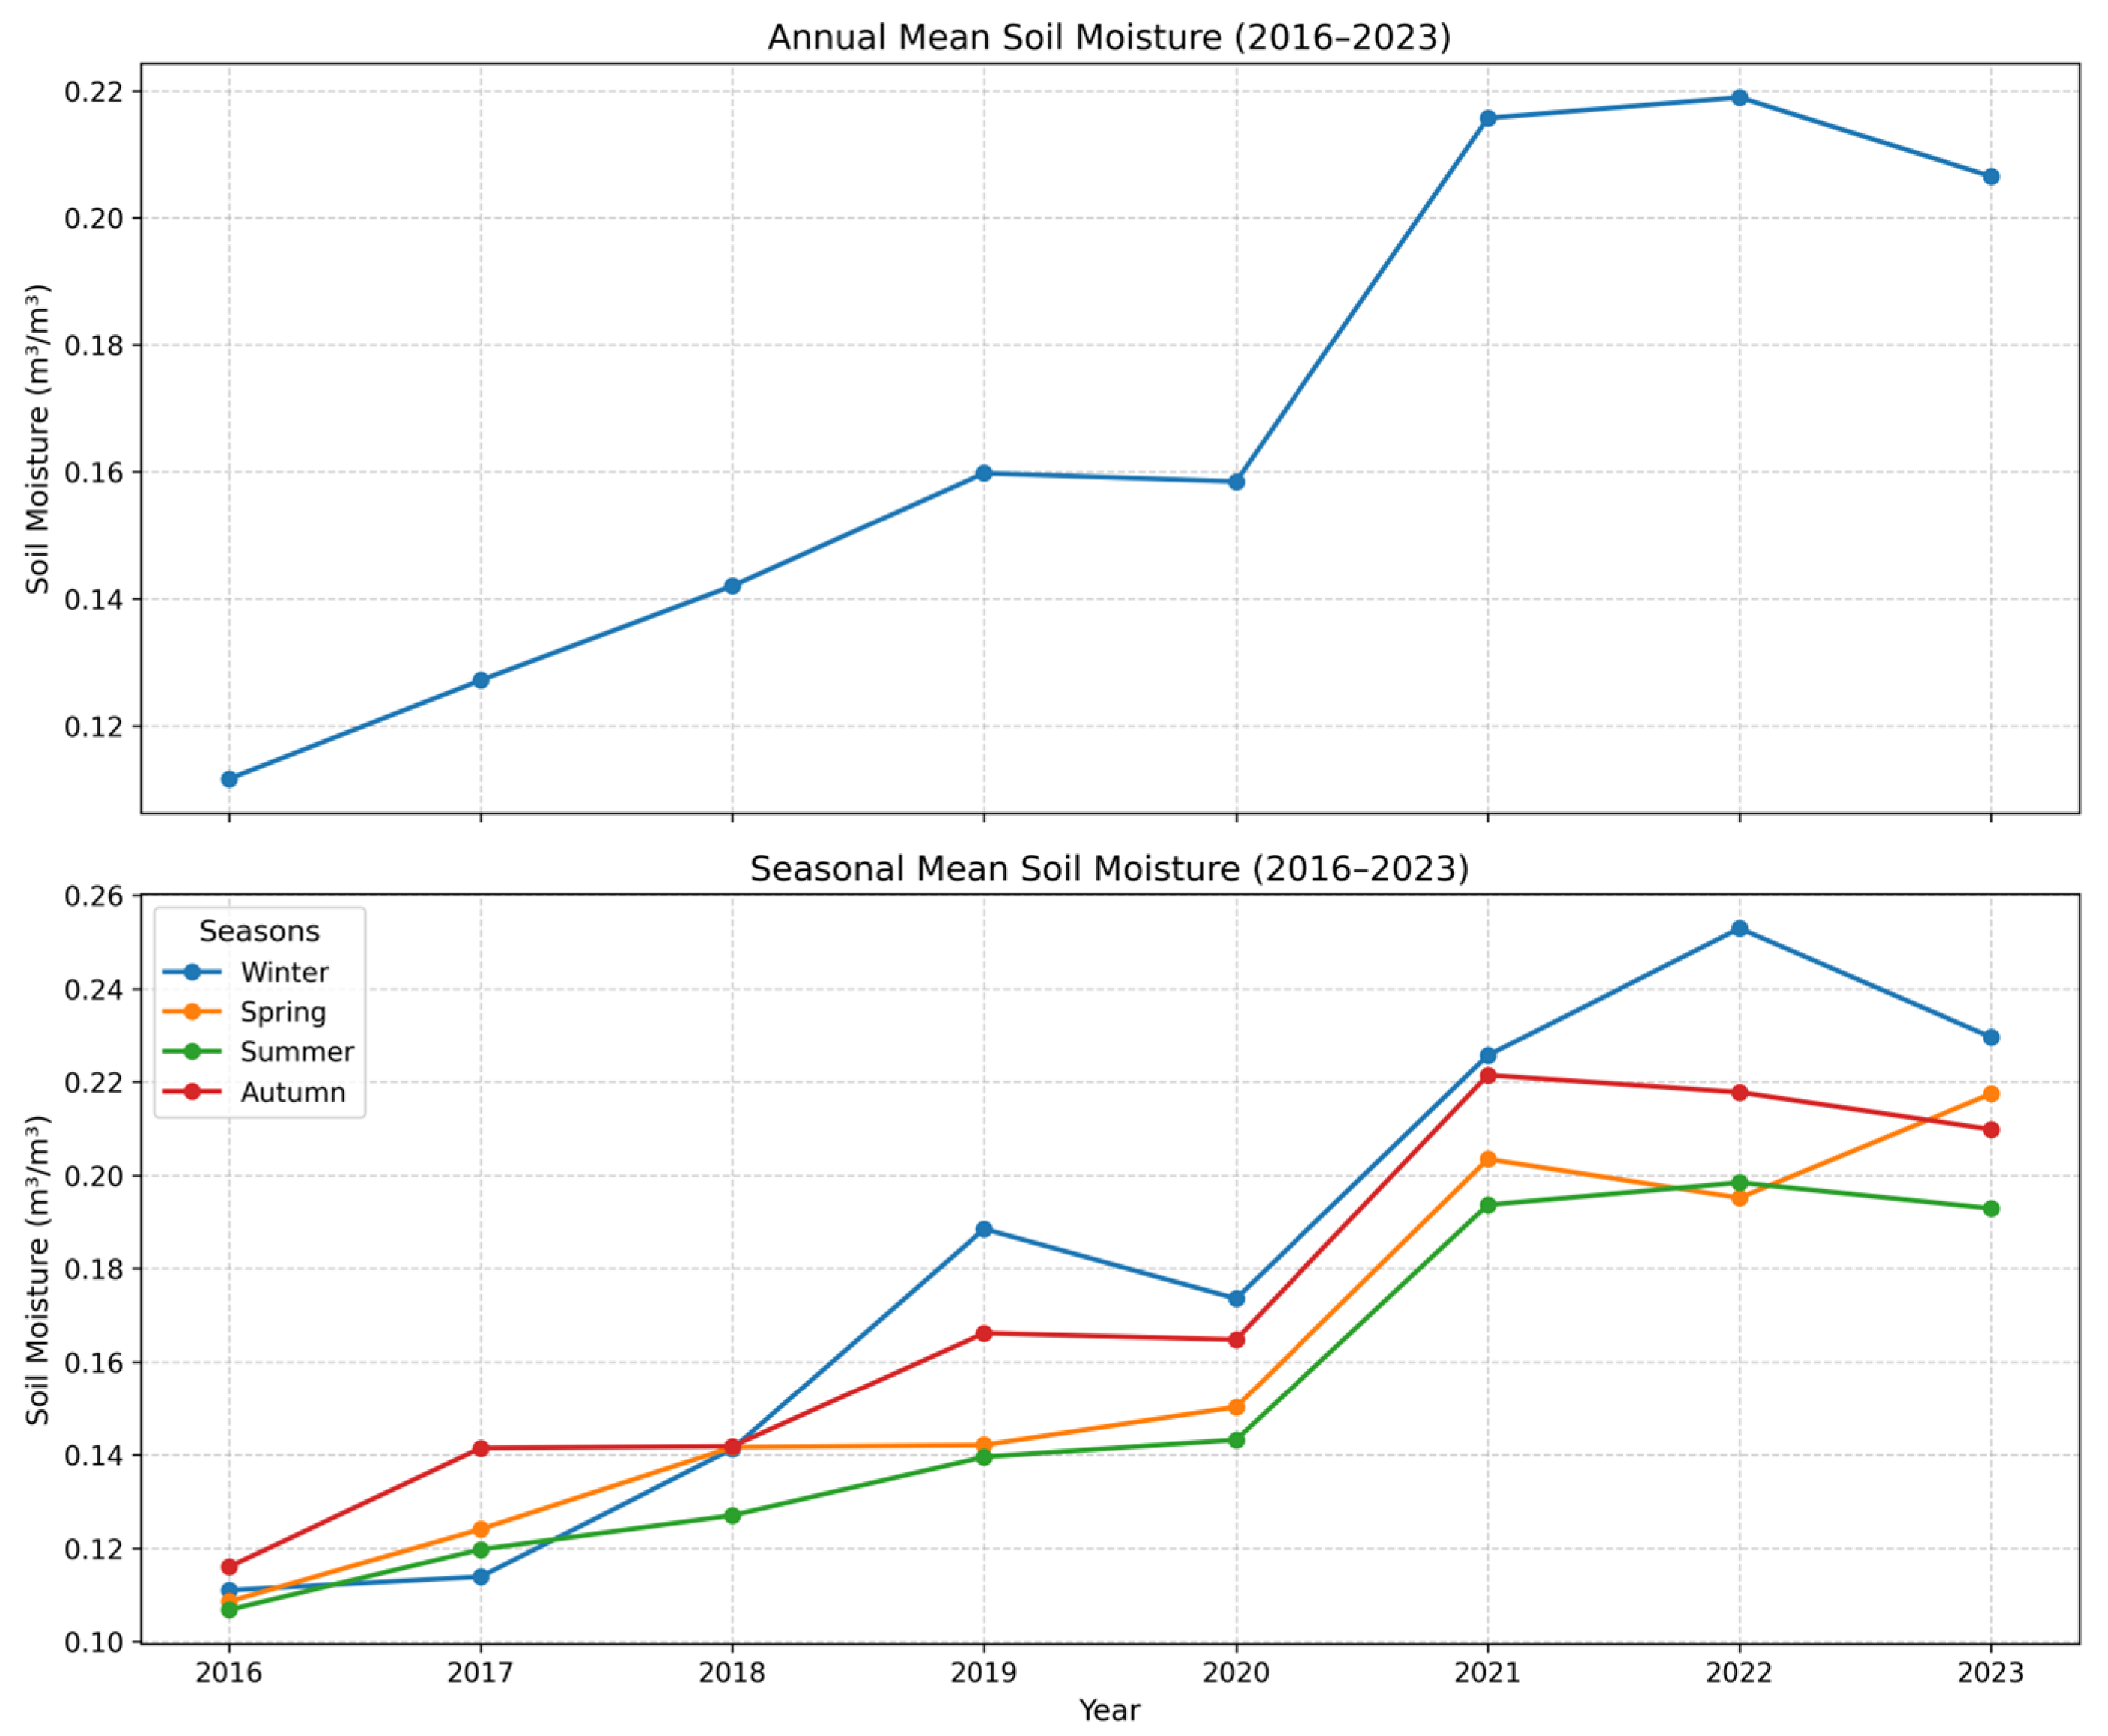
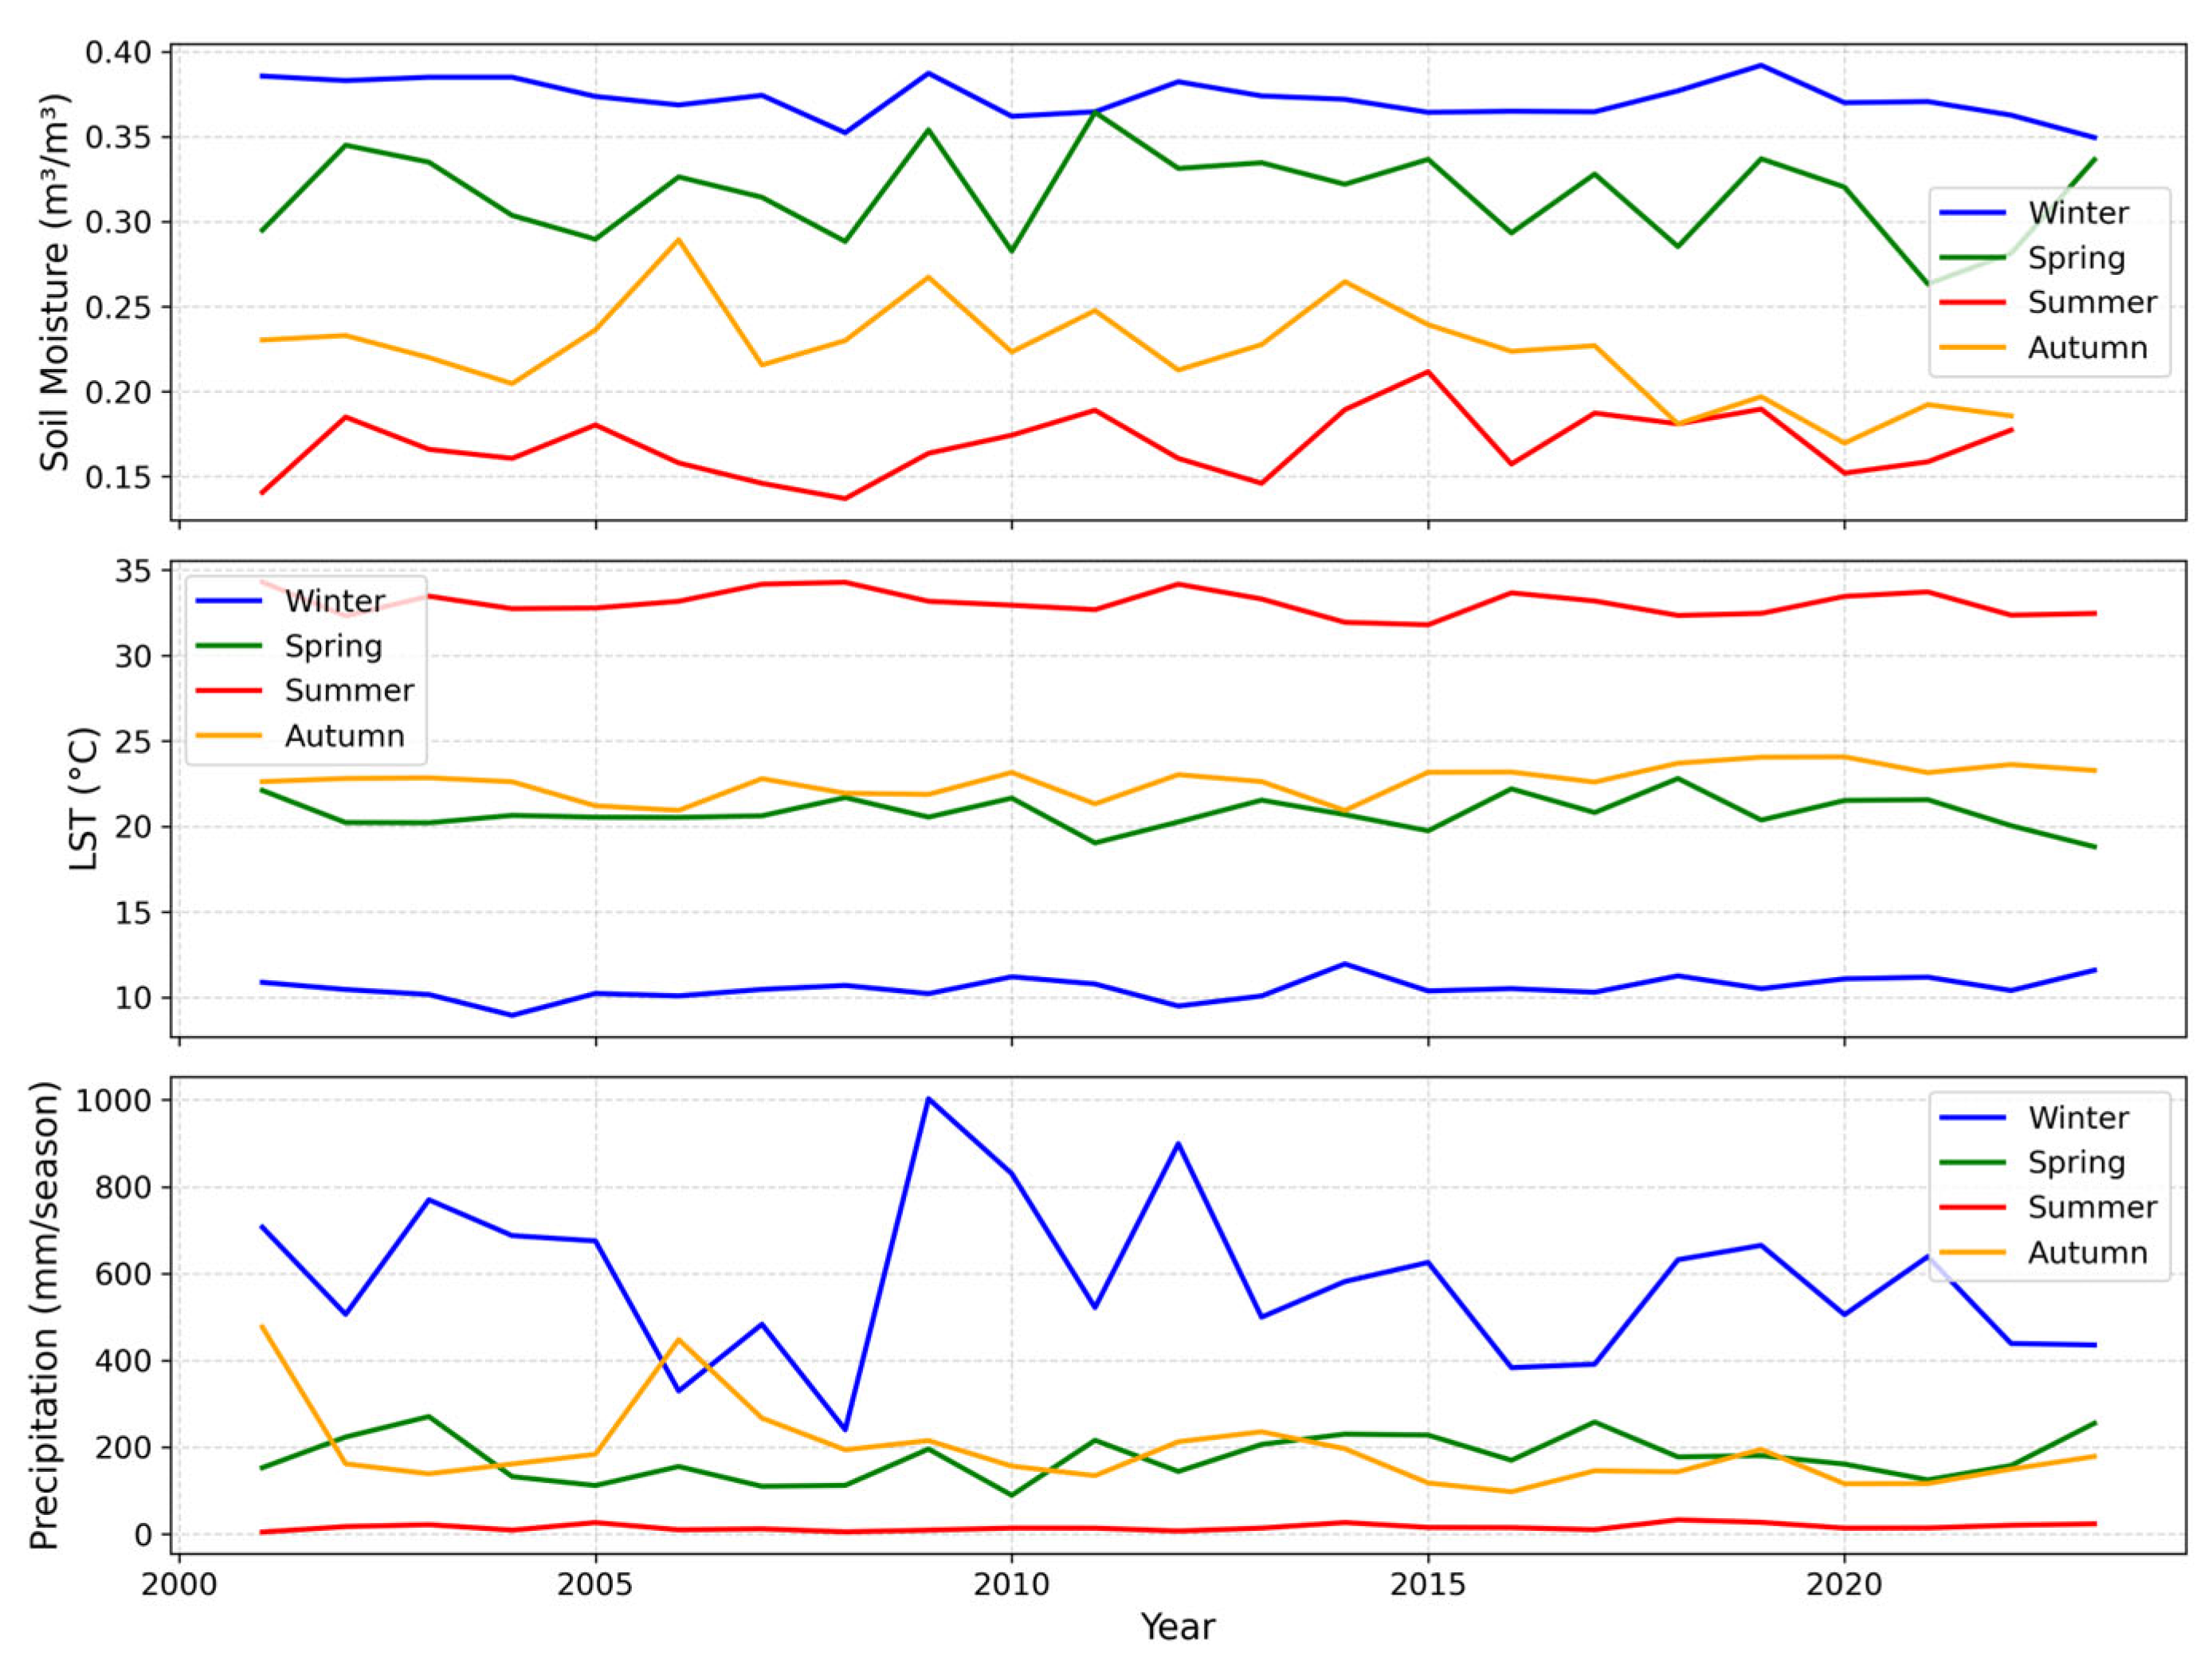
The datasets used in this study are presented as annual time series clipped to the AOI (Figure 2). In addition, annual and seasonal soil moisture (SM) from SMAP 1 km data (2016–2023) provides an independent reference for surface moisture variability (Figure 3). Seasonal time-series datasets are also included to capture intra-annual variability across the AOI (Figure 4). Annual SM (ERA5-Land), LST (MODIS), and P (CHIRPS) for 2001–2023 provide complementary perspectives on hydroclimatic variability. Precipitation exhibited strong interannual variability, with basin-wide totals falling below 600 mm in 2008 and exceeding 1300 mm in 2001 and 2009. Soil moisture generally ranged between 0.26 and 0.29 m3/m3, except for an anomalous increase in 2023. LST varied between ~21.0 °C and 22.5 °C, with slightly higher values observed after 2015. Seasonal aggregation confirms the expected Mediterranean cycles: soil moisture peaks in winter and spring (>0.30–0.35 m3/m3) due to precipitation recharge, while summer values remain below 0.20 m3/m3, indicating persistent water stress. Precipitation shows winter maxima (>400 mm) and summer minima (≈0 mm), while LST reveals stable winter means near 10 °C and summer peaks above 30 °C. Collectively, these datasets provide the hydroclimatic background for interpreting drought indices, demonstrating precipitation as the dominant driver and temperature as a seasonal intensifier. Seasonal averages were computed based on the standard climatological classification: Winter (December–February), Spring (March–May), Summer (June–August), and Autumn (September–November).
SMAP soil moisture products provide high-resolution observations, discrepancies were noted when compared to ERA5-Land, particularly in annual averages due to differences in retrieval depth and temporal gaps. Because SMAP observations have been available only since 2015, the comparison shown in Figure 3 covers the 2016–2023 period corresponding to the overlapping years between SMAP and other datasets. Therefore, SMAP data were used only for comparative reference to examine surface moisture variability, not for validating ERA5-Land. ERA5-Land, by contrast, showed more stable dynamics and higher correlation with observed hydroclimatic variability in the study area. For this reason, ERA5-Land soil moisture was preferred in the analysis, in line with recent studies highlighting its reliability and consistency for agricultural drought assessments [52,53,54,55,56,57].
In addition to remote sensing datasets, this study incorporated the National Water Efficiency Strategy and Action Plan (2023–2033), published by the Ministry of Agriculture and Forestry of Türkiye. This strategic framework defines national targets for water productivity, irrigation modernization, crop pattern optimization, and alternative water resource integration [58]. The document was used as a policy dataset to interpret remote sensing-based drought risk zones in AOI, linking spatial findings with practical adaptation measures and national water efficiency objectives.

3.2. Drought Assessment Methodology

Agricultural drought stress in the AOI was monitored using satellite-based indices representing vegetation (NDVI, NDWI, NDDI, VCI, VHI), temperature (LST, TCI), precipitation (P, PCI), and soil moisture (SM, SMCI). MOD09A1 (500 m, 8-day) was used to compute NDVI and NDWI, combined as NDDI. MOD11A2 (1 km, 8-day) provided LST, which was normalized to produce TCI, while NDVI was normalized to derive VCI. Daily CHIRPS P (~5 km) was aggregated to monthly totals and scaled to compute PCI. Soil moisture dynamics were assessed using ERA5-Land (~9 km, hourly aggregated to monthly) and validated with SMAP 1 km downscaled data (2016–2023), from which SMCI was derived to complement other indices. These indices were further integrated into the SDCI (VCI = 0.25, TCI = 0.25, PCI = 0.50) [20,32] to provide a composite measure of agricultural drought. All indices were computed on a monthly and seasonal basis to align with the distinct hydroclimatic regime of the AOI, which is characterized by wet winters, transitional springs, and prolonged dry summers typical of Mediterranean climates. This temporal resolution enables accurate detection of vegetation and soil moisture responses to short-term rainfall variability and seasonal water deficits, providing an effective repre-sentation of agricultural drought dynamics in the region.
All datasets were clipped to the AOI and processed in GEE (2001–2023). Outputs included seasonal and annual time series, spatial drought maps, and categorical drought severity classes, enabling consistent assessment of agricultural drought dynamics across the basin. Satellite-derived indicators were then applied to quantify vegetation, thermal, precipitation, and soil moisture variability, providing consistent spatial and temporal information across large areas with high repeatability. In this study, a comprehensive set of vegetation-, temperature-, precipitation-, and soil moisture-based indices were applied, namely NDVI, NDWI, NDDI, VCI, TCI, VHI, PCI, SDCI, and SMCI. These indices were calculated on a monthly basis between 2001 and 2023 using MODIS (surface reflectance and LST), CHIRPS (precipitation), and ERA5-Land (soil moisture) datasets processed via Google Earth Engine (GEE). In addition, SMAP 1 km downscaled soil moisture data (2016–2023) were used to complement the analysis and provide independent validation of surface moisture dynamics. This integrated approach is particularly suited to Mediterranean climates, where strong rainfall seasonality, high summer evapotranspiration, and recurrent dry spells require multi-source indicators to accurately represent agricultural drought dynamics. A multi-index framework was therefore adopted to capture the complex nature of agricultural drought, which cannot be fully represented by a single indicator. NDVI, VCI, and VHI reflect crop condition and photosynthetic activity, TCI represents canopy temperature stress, and PCI and SMCI quantify meteorological and hydrological deficits. Integrating these indicators reduces the limitations of single-variable monitoring and provides a more robust assessment of drought impacts on agriculture, particularly under Mediterranean conditions characterized by high rainfall variability and intense evapotranspiration. The input variables used in the index formulations include NIR, Red and Green spectral bands, LST, P, and SM. The coefficients α, β, and γ represent weighting factors assigned to precipitation, vegetation, and temperature components in the composite drought indices. The mathematical formulations of these indices are presented in Table 2. Drought classification thresholds based on NDDI values are summarized in Table 3.
The drought severity thresholds for each index were adapted from [59], which proposed a comprehensive classification framework integrating vegetation, temperature, precipitation, and soil moisture indicators. These thresholds have been widely applied and validated in semi-arid and Mediterranean regions, demonstrating their suitability for capturing vegetation and moisture stress dynamics under the climatic conditions of the Antalya Basin—characterized by high evapotranspiration and pronounced rainfall seasonality. Minor consistency checks were performed using precipitation and soil moisture anomalies to confirm their local applicability.
NDVI was employed to monitor vegetation vigor, reflecting photosynthetic activity and greenness levels (Equation (1), Table 2). It is derived from the contrast between near-infrared (NIR, MODIS Band 2: 841–876 nm), which is strongly reflected by healthy vegetation, and red light (Red, MODIS Band 1: 620–670 nm), which is absorbed by chlorophyll. High NDVI values indicate dense, healthy vegetation, while low values denote sparse cover or vegetation stress. Due to its robustness and cross-sensor applicability, NDVI remains the most widely used indicator in agricultural drought studies [60,61,62].
NDWI was employed to assess vegetation water status, derived from the contrast between near-infrared (NIR) and green reflectance values (Equation (2), Table 2). The green band corresponds to MODIS band 4 (545–565 nm), which is particularly sensitive to leaf water content. Elevated NDWI values indicate sufficient canopy water and favorable conditions, whereas lower values reflect vegetation under water stress. This index is widely recognized for its effectiveness in remote sensing of vegetation liquid water content [63].
NDDI was applied to capture agricultural drought by combining NDVI and NDWI (Equation (3), Table 2). High NDDI values indicate vegetation under both greenness and water stress, whereas low or negative values reflect healthy vegetation with adequate water availability. Because NDDI simultaneously reflects vegetation vigor and moisture deficit, it effectively distinguishes between healthy and water-stressed crops during the growing season, making it a sensitive indicator of agricultural drought in semi-arid and Mediterranean regions [64,65]. By integrating these complementary indices, NDDI improves drought detection compared to using NDVI or NDWI alone, particularly during critical crop growth stages [29].
VCI was used to quantify vegetation stress by normalizing the current NDVI value (NDVIi) against its long-term minimum (NDVImin) and maximum (NDVImax) during the 2001–2023 (Equation (4), Table 2). This normalization reduces the influence of background and seasonal effects, allowing standardized comparison across land covers. VCI ranges from 0 to 100, where low values indicate severe stress and high values denote favorable vegetation conditions. VCI is widely applied in agricultural drought monitoring and early warning systems due to its sensitivity to rainfall variability [20,30].
TCI quantifies vegetation heat stress by normalizing the land surface temperature (LSTj) relative to its long-term maximum (LSTmax) and minimum (LSTmin) (Equation (5), Table 2). This highlights the role of anomalously high temperatures in driving vegetation moisture stress, as heat reduces transpiration and accelerates drought effects. Here, MODIS MOD11A2 (1 km, 8-day) daytime LST was aggregated to monthly means for TCI computation. Low TCI values indicate severe heat stress, while high values denote cooler, less stressful conditions. TCI is widely used in agricultural drought monitoring due to its ability to capture early signs of heat-induced stress [30,66].
VHI integrates both VCI and TCI into a composite drought indicator (Equation (6), Table 2). Equal weights (a = 0.5, 1−a = 0.5) were assigned to VCI and TCI, following [30], ensuring balanced representation of greenness and temperature anomalies. This integration reduces misclassification risks common to NDVI-based indices, which may underestimate drought under cloud cover, excessive soil moisture, or irrigation. VHI values near 0 indicate extreme drought, while values above 50 denote healthy vegetation with minimal stress. VHI has been widely applied in regional and global drought monitoring [20,30,66].
PCI was computed from CHIRPS daily precipitation aggregated to monthly totals. PCI normalizes each month’s precipitation (CHIRPSi) relative to its long-term minimum (CHIRPSmin) and maximum (CHIRPSmax) values, producing an index scaled between 0 and 100 (Equation (7), Table 2). Low PCI values denote precipitation deficits and drought risk, while high values reflect wetter-than-normal conditions. By emphasizing rainfall anomalies, PCI effectively captures short- to seasonal-scale water stress and is widely applied in agricultural drought monitoring [31,67,68].
SDCI was employed to provide an integrated measure of agricultural drought by combining VCI, TCI, and PCI) into a single composite indicator (Equation (8), Table 2 Following [20], weights of 0.25, 0.25, and 0.50 were applied, emphasizing precipitation anomalies while retaining sensitivity to vegetation and thermal stress. This integration captures the multi-dimensional nature of agricultural drought more effectively than single-variable indices. SDCI values were classified into severity levels from extreme drought to non-drought (Table 4), supporting consistent spatial and temporal assessment across the AOI, where agriculture is exposed to rainfall variability, high evapotranspiration, and vegetation stress [20,68].
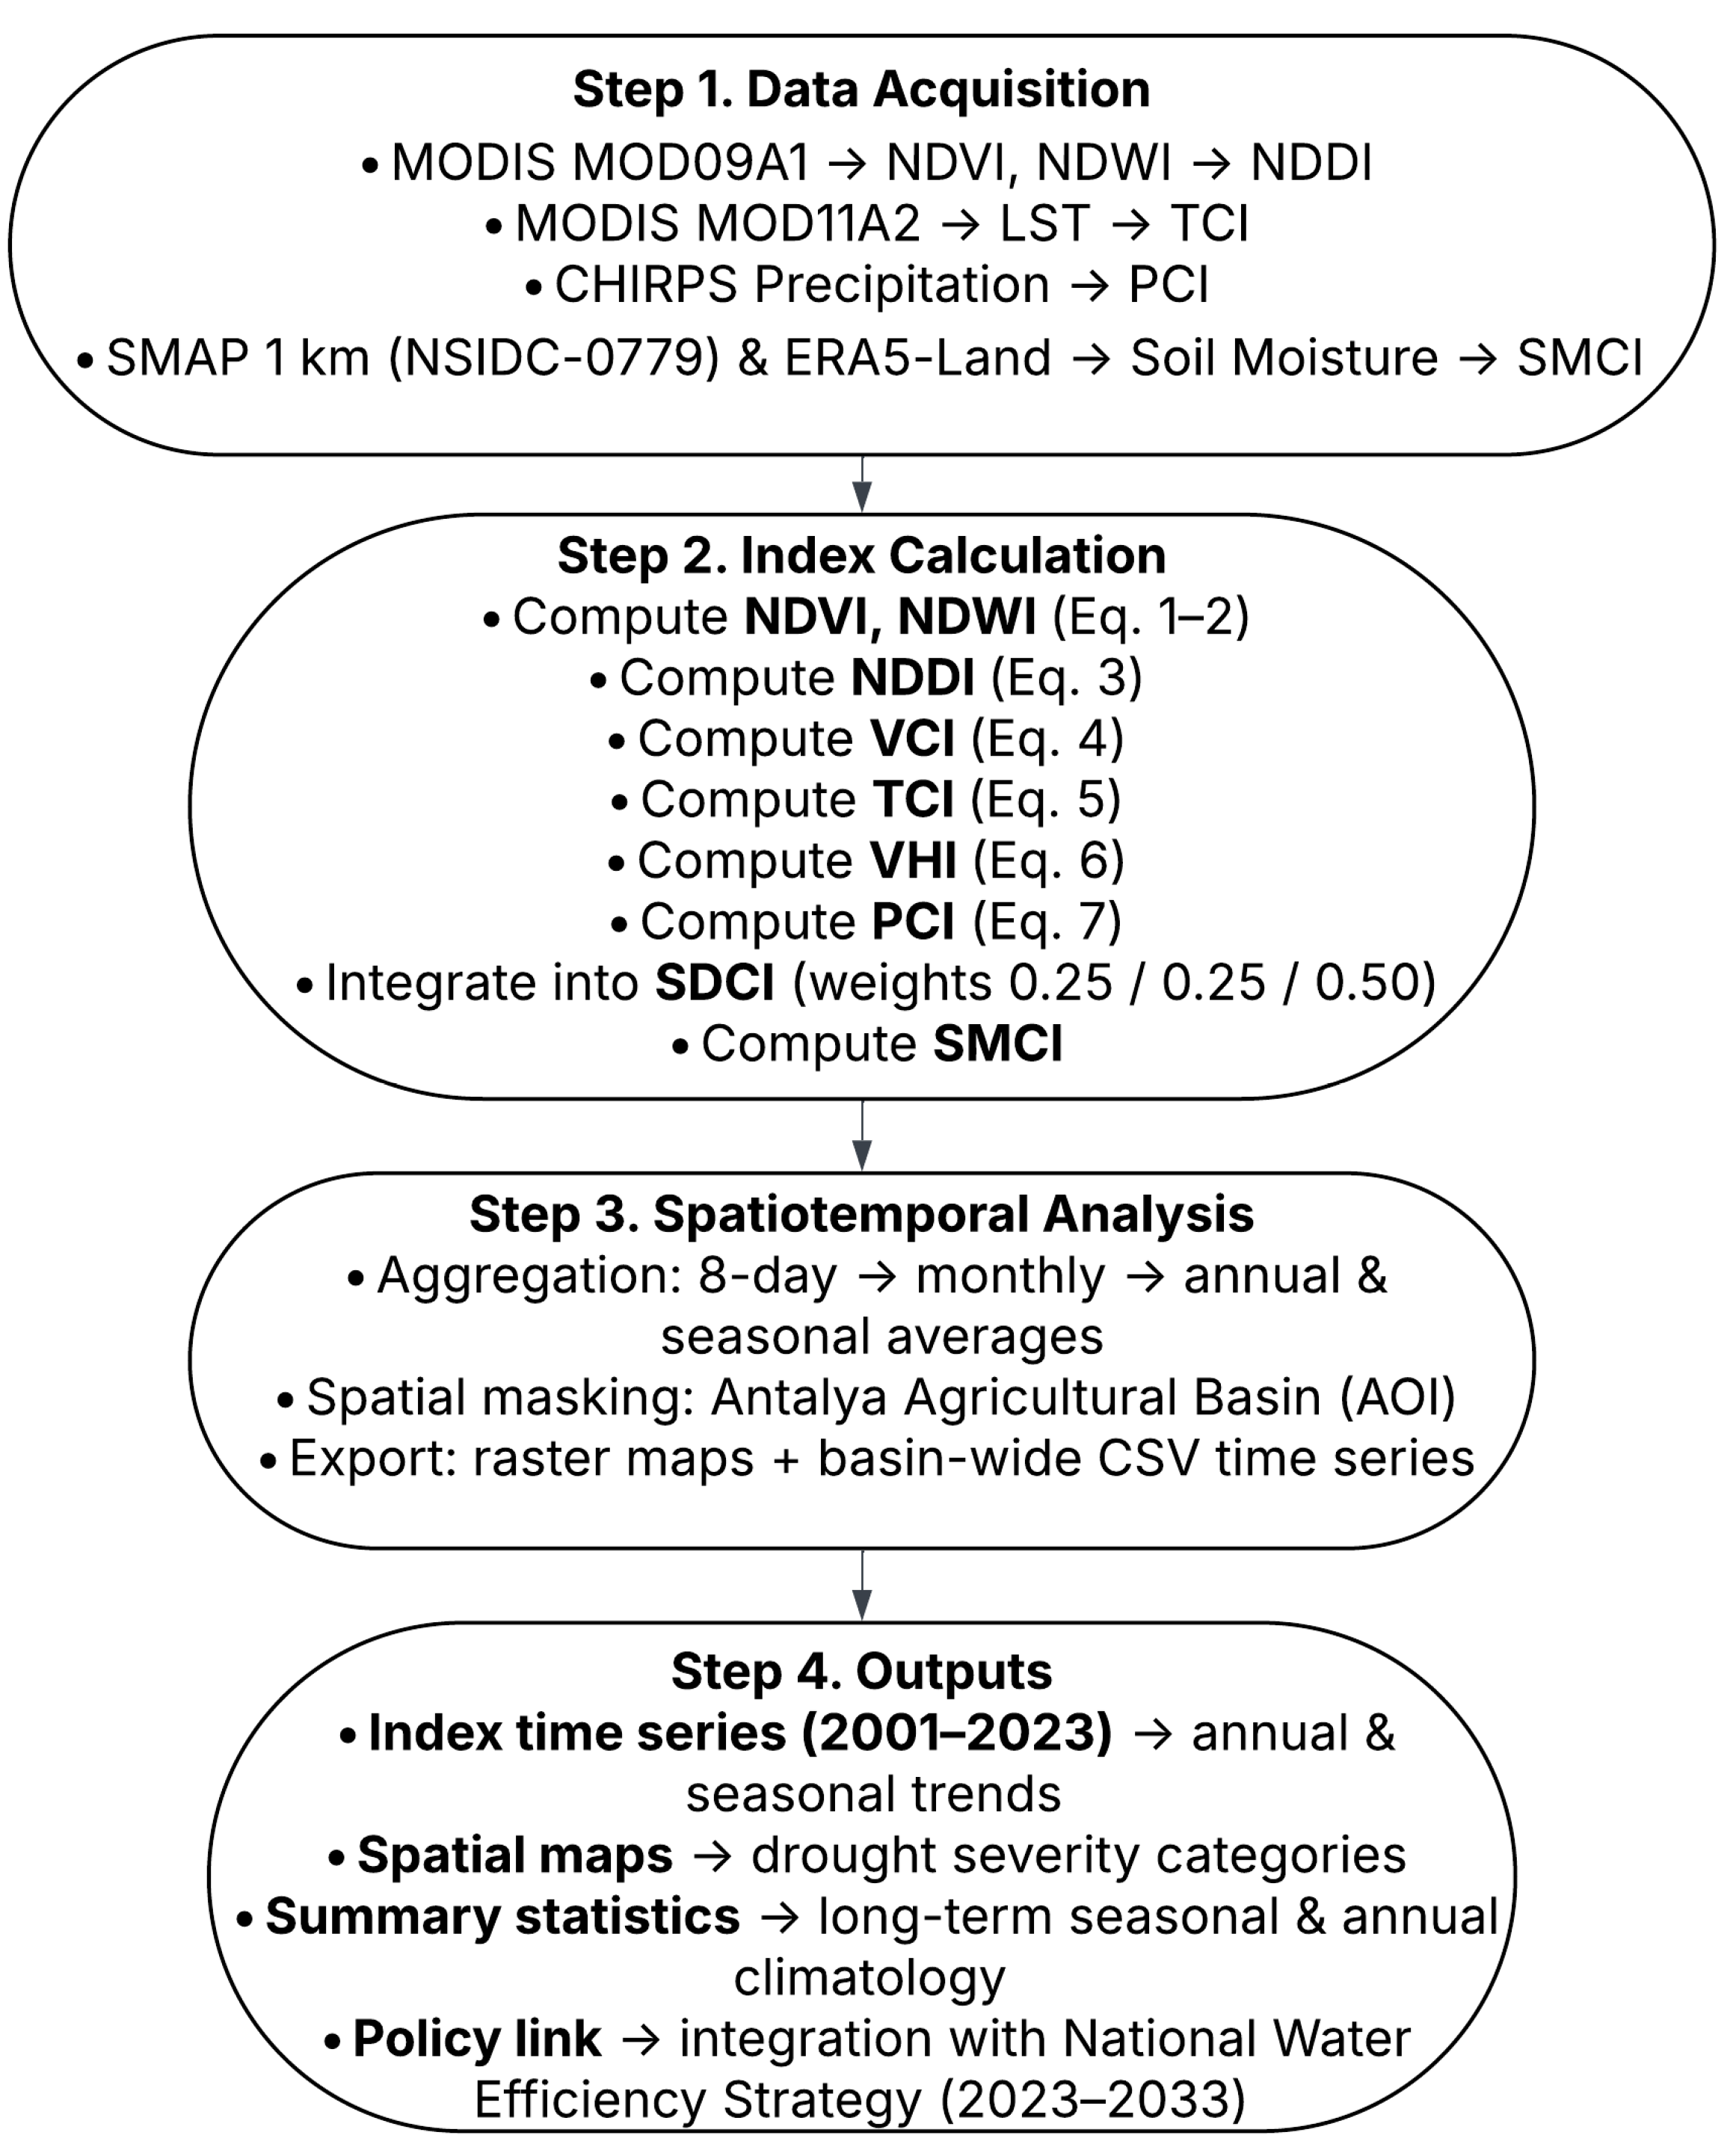
SMCI was used to assess drought directly from soil water availability, complementing precipitation- and vegetation-based indices. It was computed by normalizing soil moisture (SMt) against long-term minimum (SMmin) and maximum (SMmax) values, scaled between 0 and 100 (Equation (9), Table 2). Low SMCI values indicate critically dry soils, while high values reflect favorable water conditions. Like SDCI, SMCI values were categorized into drought severity classes (Table 4). By capturing root-zone water stress, SMCI strengthens drought monitoring in the AOI, especially under Mediterranean conditions where summer soil moisture deficits and irrigation intensity critically shape agricultural risk. The overall methodological framework, including data acquisition, index computation, spatiotemporal analysis, and outputs, is summarized in Figure 5.

4. Results

4.1. Agricultural Drought Monitoring with Remote Sensing Indices

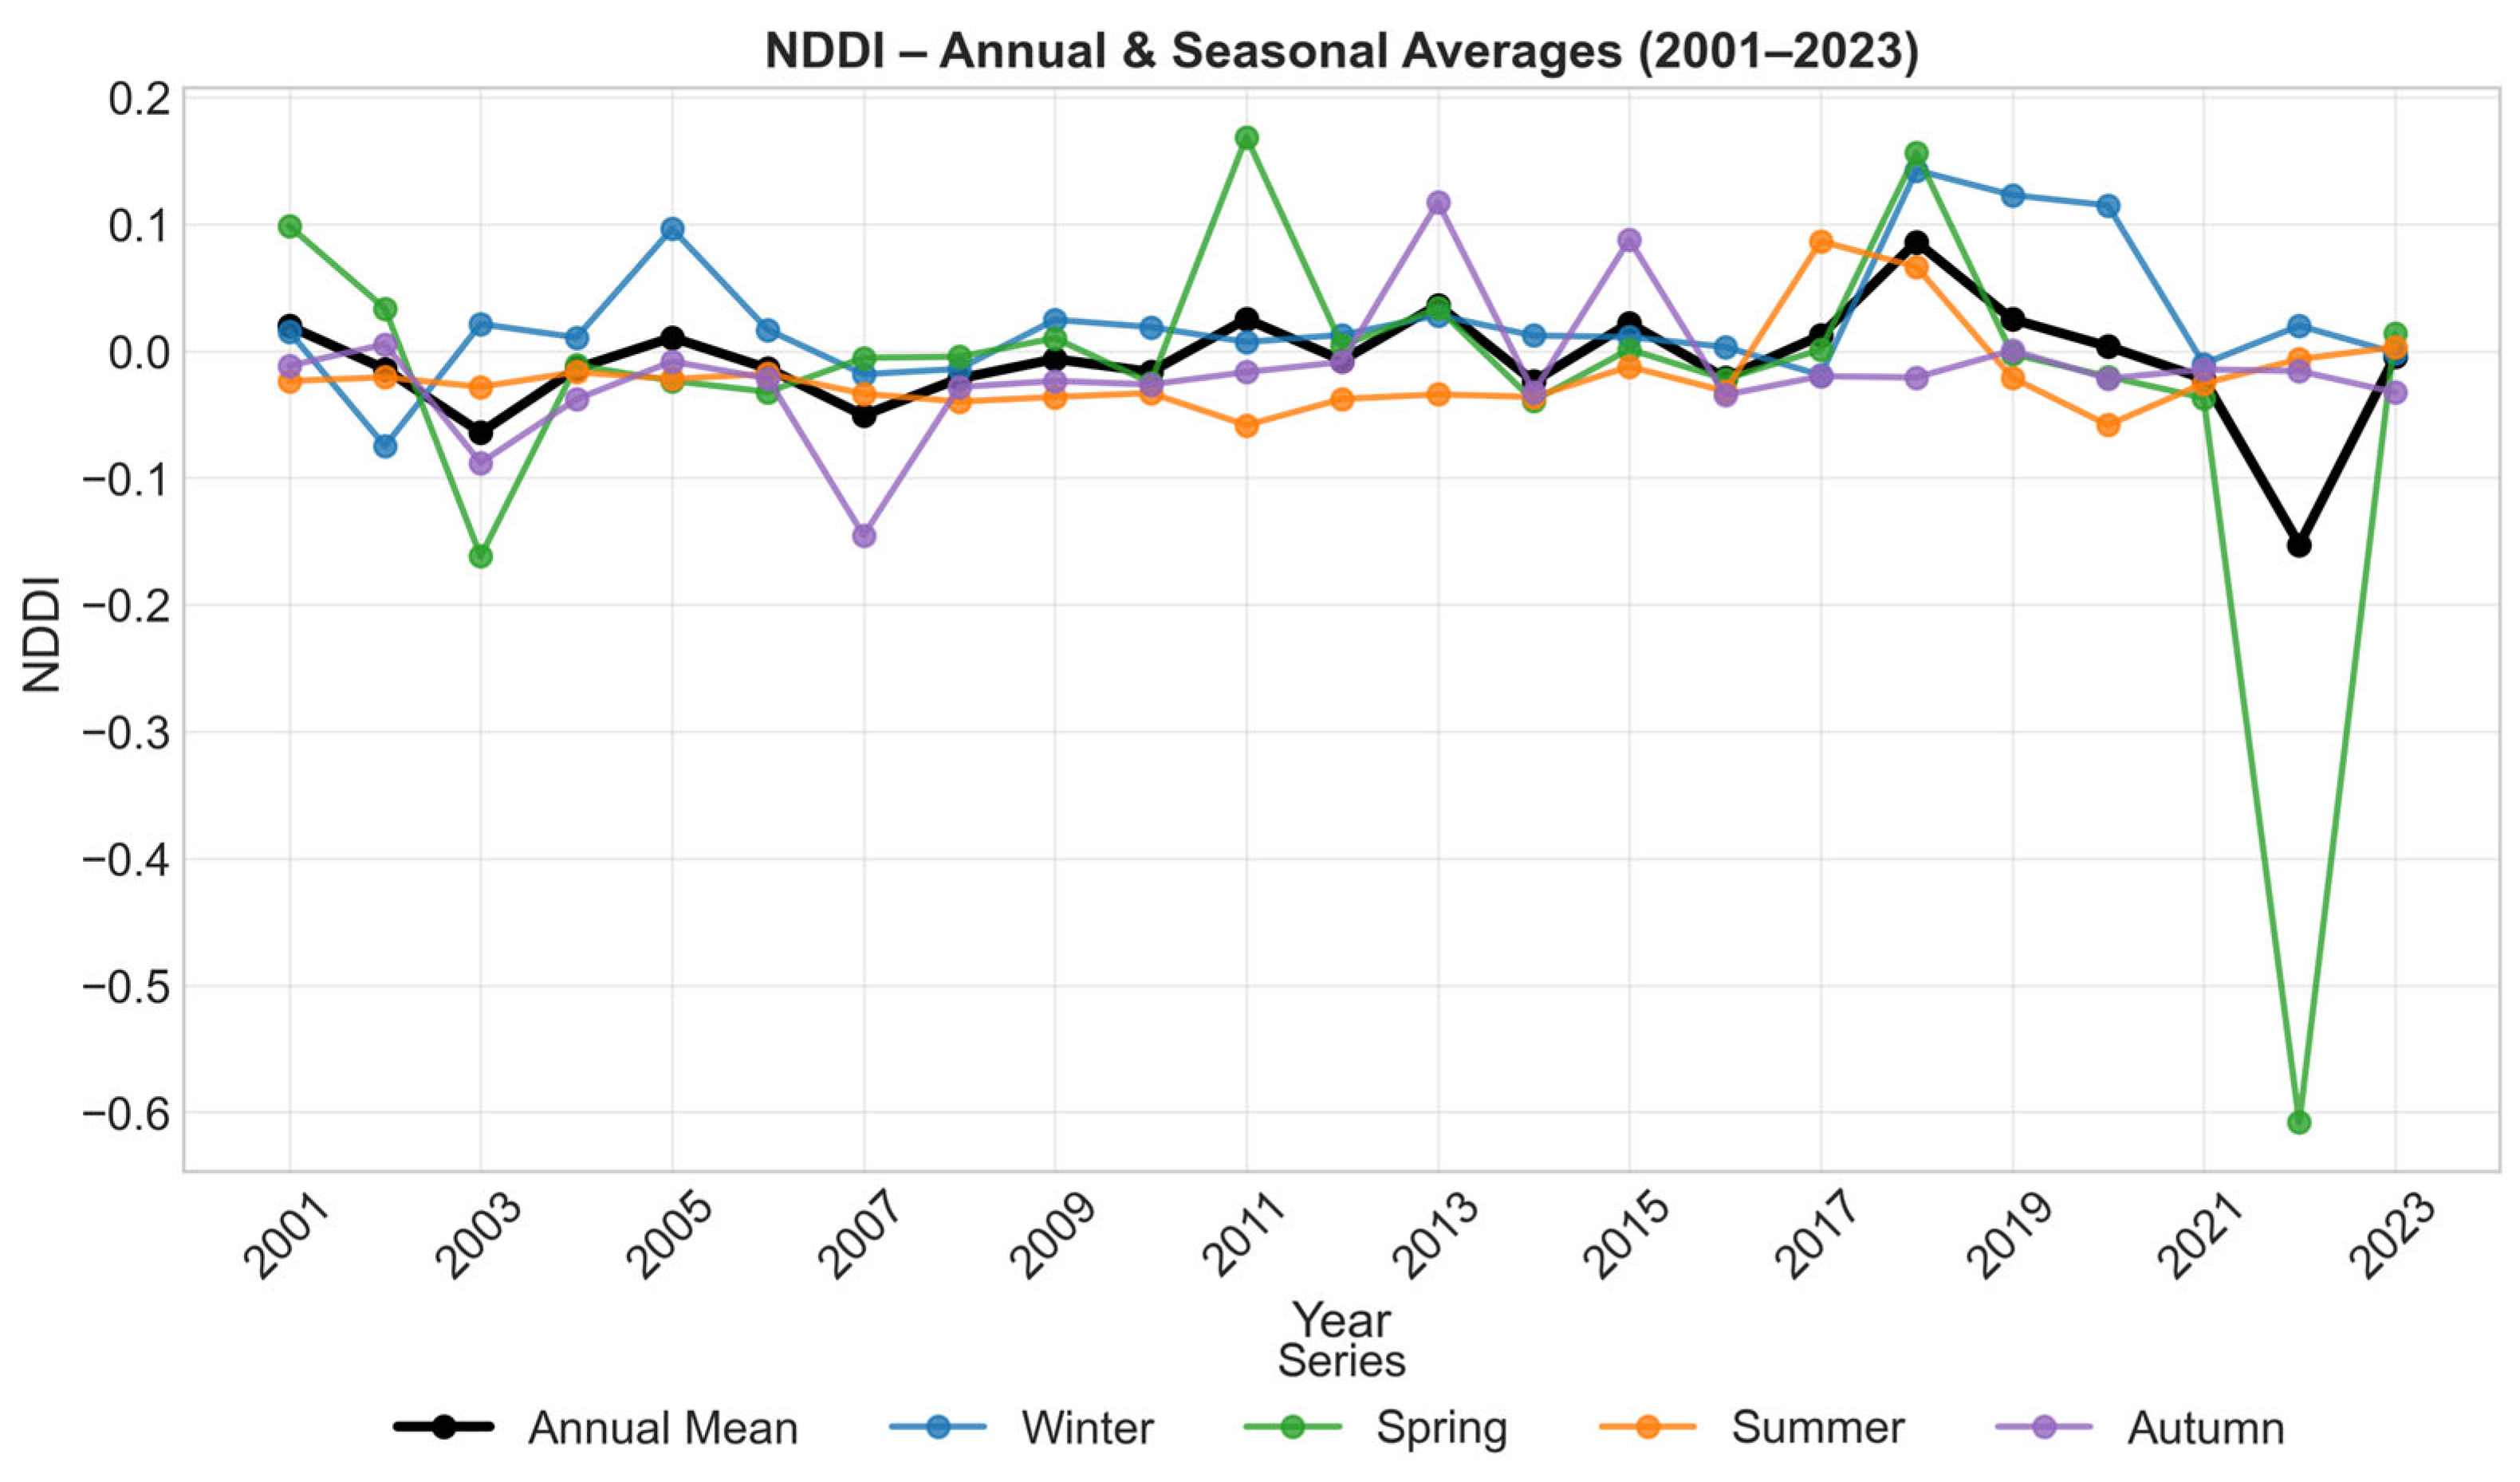
In this study, agricultural drought in the AOI was monitored using a set of remote sensing-based indices, namely NDDI, PCI, VCI, TCI, VHI, SDCI, and SMCI. These indices were computed seasonally and annually for the period 2001–2023 using datasets from MODIS (NDVI, NDWI, LST), CHIRPS (precipitation), and ERA5-Land/SMAP (soil moisture), all processed within the Google Earth Engine (GEE) platform. Seasonal and annual mean values of these indices were calculated, providing an overview of overall drought and wetness conditions across the study period. Agricultural drought conditions in the AOI were assessed using the NDDI, derived from NDVI and NDWI, calculated annually and seasonally for 2001–2023 (Figure 6). Annual values generally fluctuated around zero, indicating predominantly non-drought to mild drought conditions, with the lowest value in 2022 (–0.152) reflecting favorable moisture availability and the highest in 2018 (0.083) corresponding to localized agricultural stress. Positive anomalies in years such as 2009 and 2016 pointed to enhanced vegetation water stress, while negative values in 2002 and 2010 denoted improved hydro-ecological conditions. Seasonal dynamics revealed recharge conditions in winter and autumn, when NDDI values remained close to zero, whereas spring and especially summer showed more frequent positive values, indicating heightened stress during critical growth stages under limited rainfall. The extreme wet anomaly of summer 2022 (–0.58) contrasted with the peak stress observed in spring 2018 (0.12).
The PCI results confirm that precipitation variability is the dominant driver of agricultural drought in the AOI (Figure 7). Annual values ranged from 9.8 in 2008, a year of severe drought, to 24.6 in 2009, an exceptionally wet year. Consistent with this, the drought–wet year classification highlights 2008 and 2016 as basin-wide dry years, while 2009 and 2012 stand out as wet years. Seasonal analysis shows that winter PCI largely controls interannual variability, with drought in 2008 and 2016 and wet conditions in 2009 and 2012. Summer values remained persistently low (0–5), underscoring the Mediterranean climate’s inherent summer dryness, while spring and autumn revealed intermediate variability, such as a wet spring in 2003 and wet autumn in 2018, versus dry conditions in 2021 and 2016, respectively.
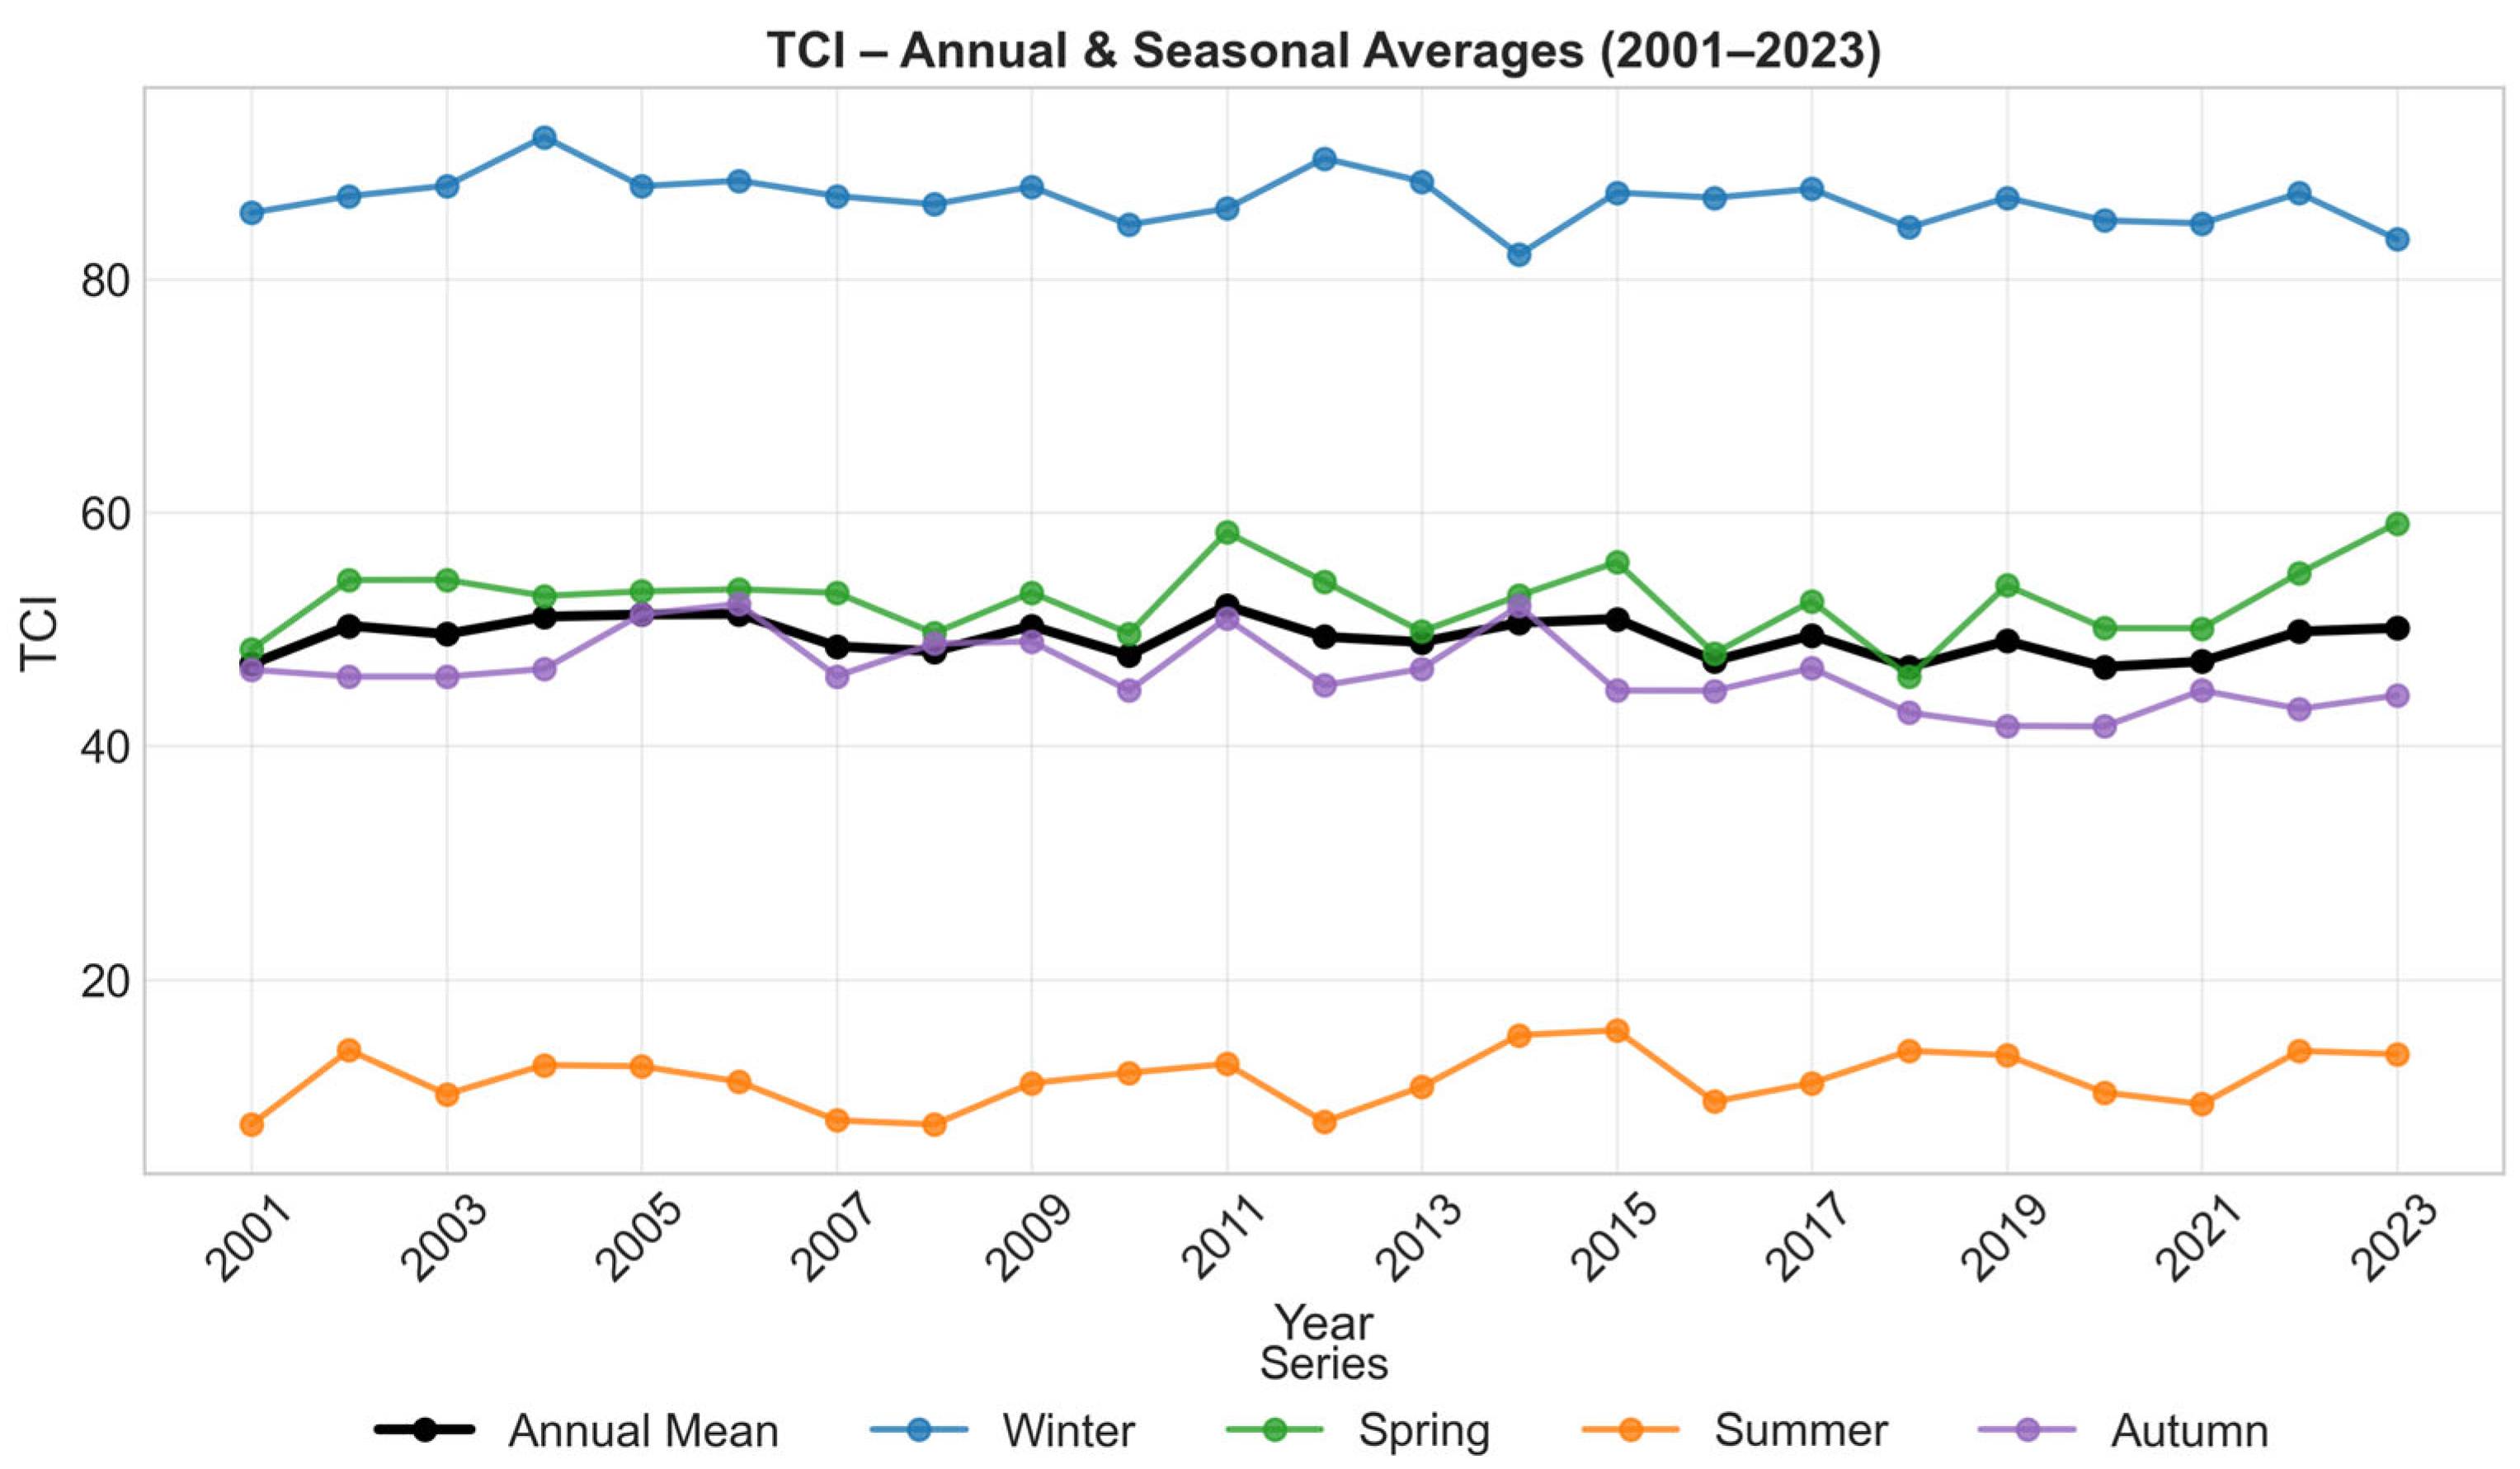
The Temperature Condition Index (TCI), derived from MODIS LST, was calculated annually and seasonally for 2001–2023 in the AOI (Figure 8). Annual values ranged from 46.7 (2018, 2020) to 52.0 (2011), indicating marked variability in thermal stress. The early 2000s generally showed higher values (>50), reflecting favorable conditions, while 2018 and 2020 were characterized by pronounced heat stress. Seasonally, winter TCI consistently exceeded 80, confirming minimal stress during recharge, whereas summer values (10–20) revealed extreme thermal pressure. Spring fluctuated between 50 and 60 but declined after 2015, while autumn remained stable (40–50).
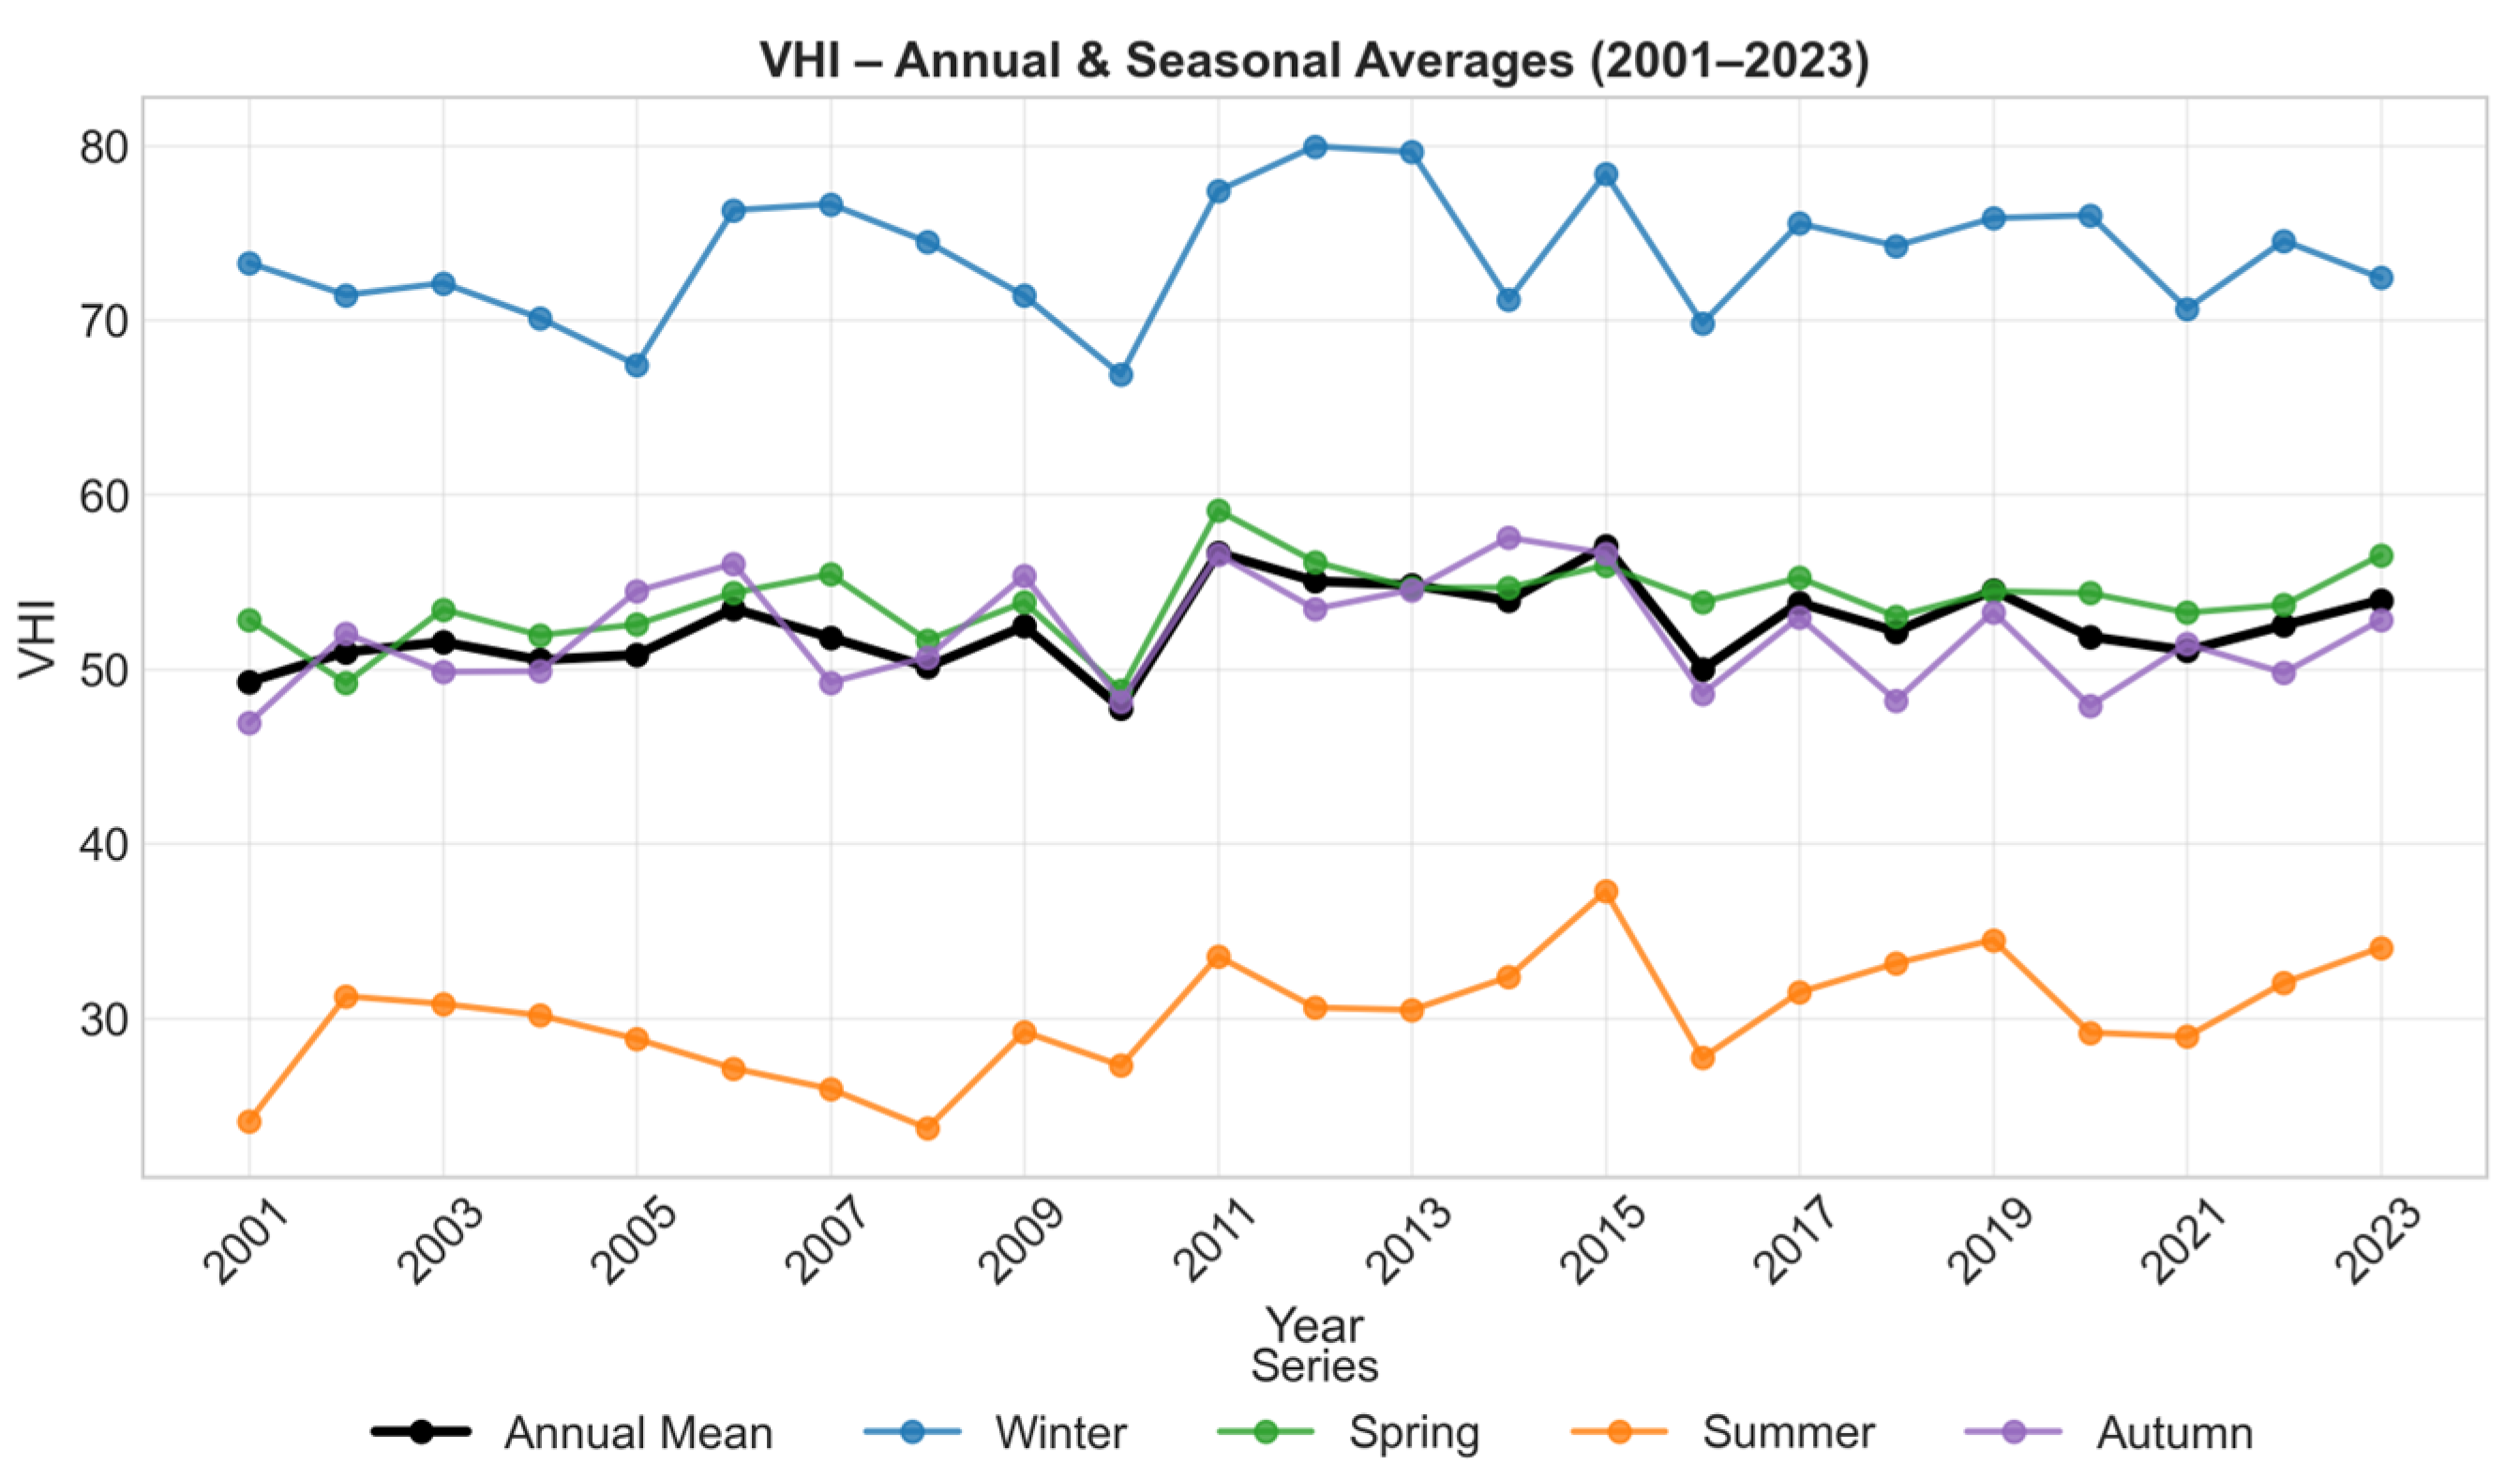
The VHI, integrating VCI and TCI, was calculated annually and seasonally for 2001–2023 in the AOI (Figure 9). Annual values varied between 47.8 in 2010, indicating severe vegetation stress under low precipitation and high temperatures, and 56.8 in 2015, reflecting favorable conditions. Seasonally, winter consistently showed the highest VHI (>60), confirming minimal stress during recharge, while summer values (25–40) revealed strong combined heat and water stress during peak crop demand.
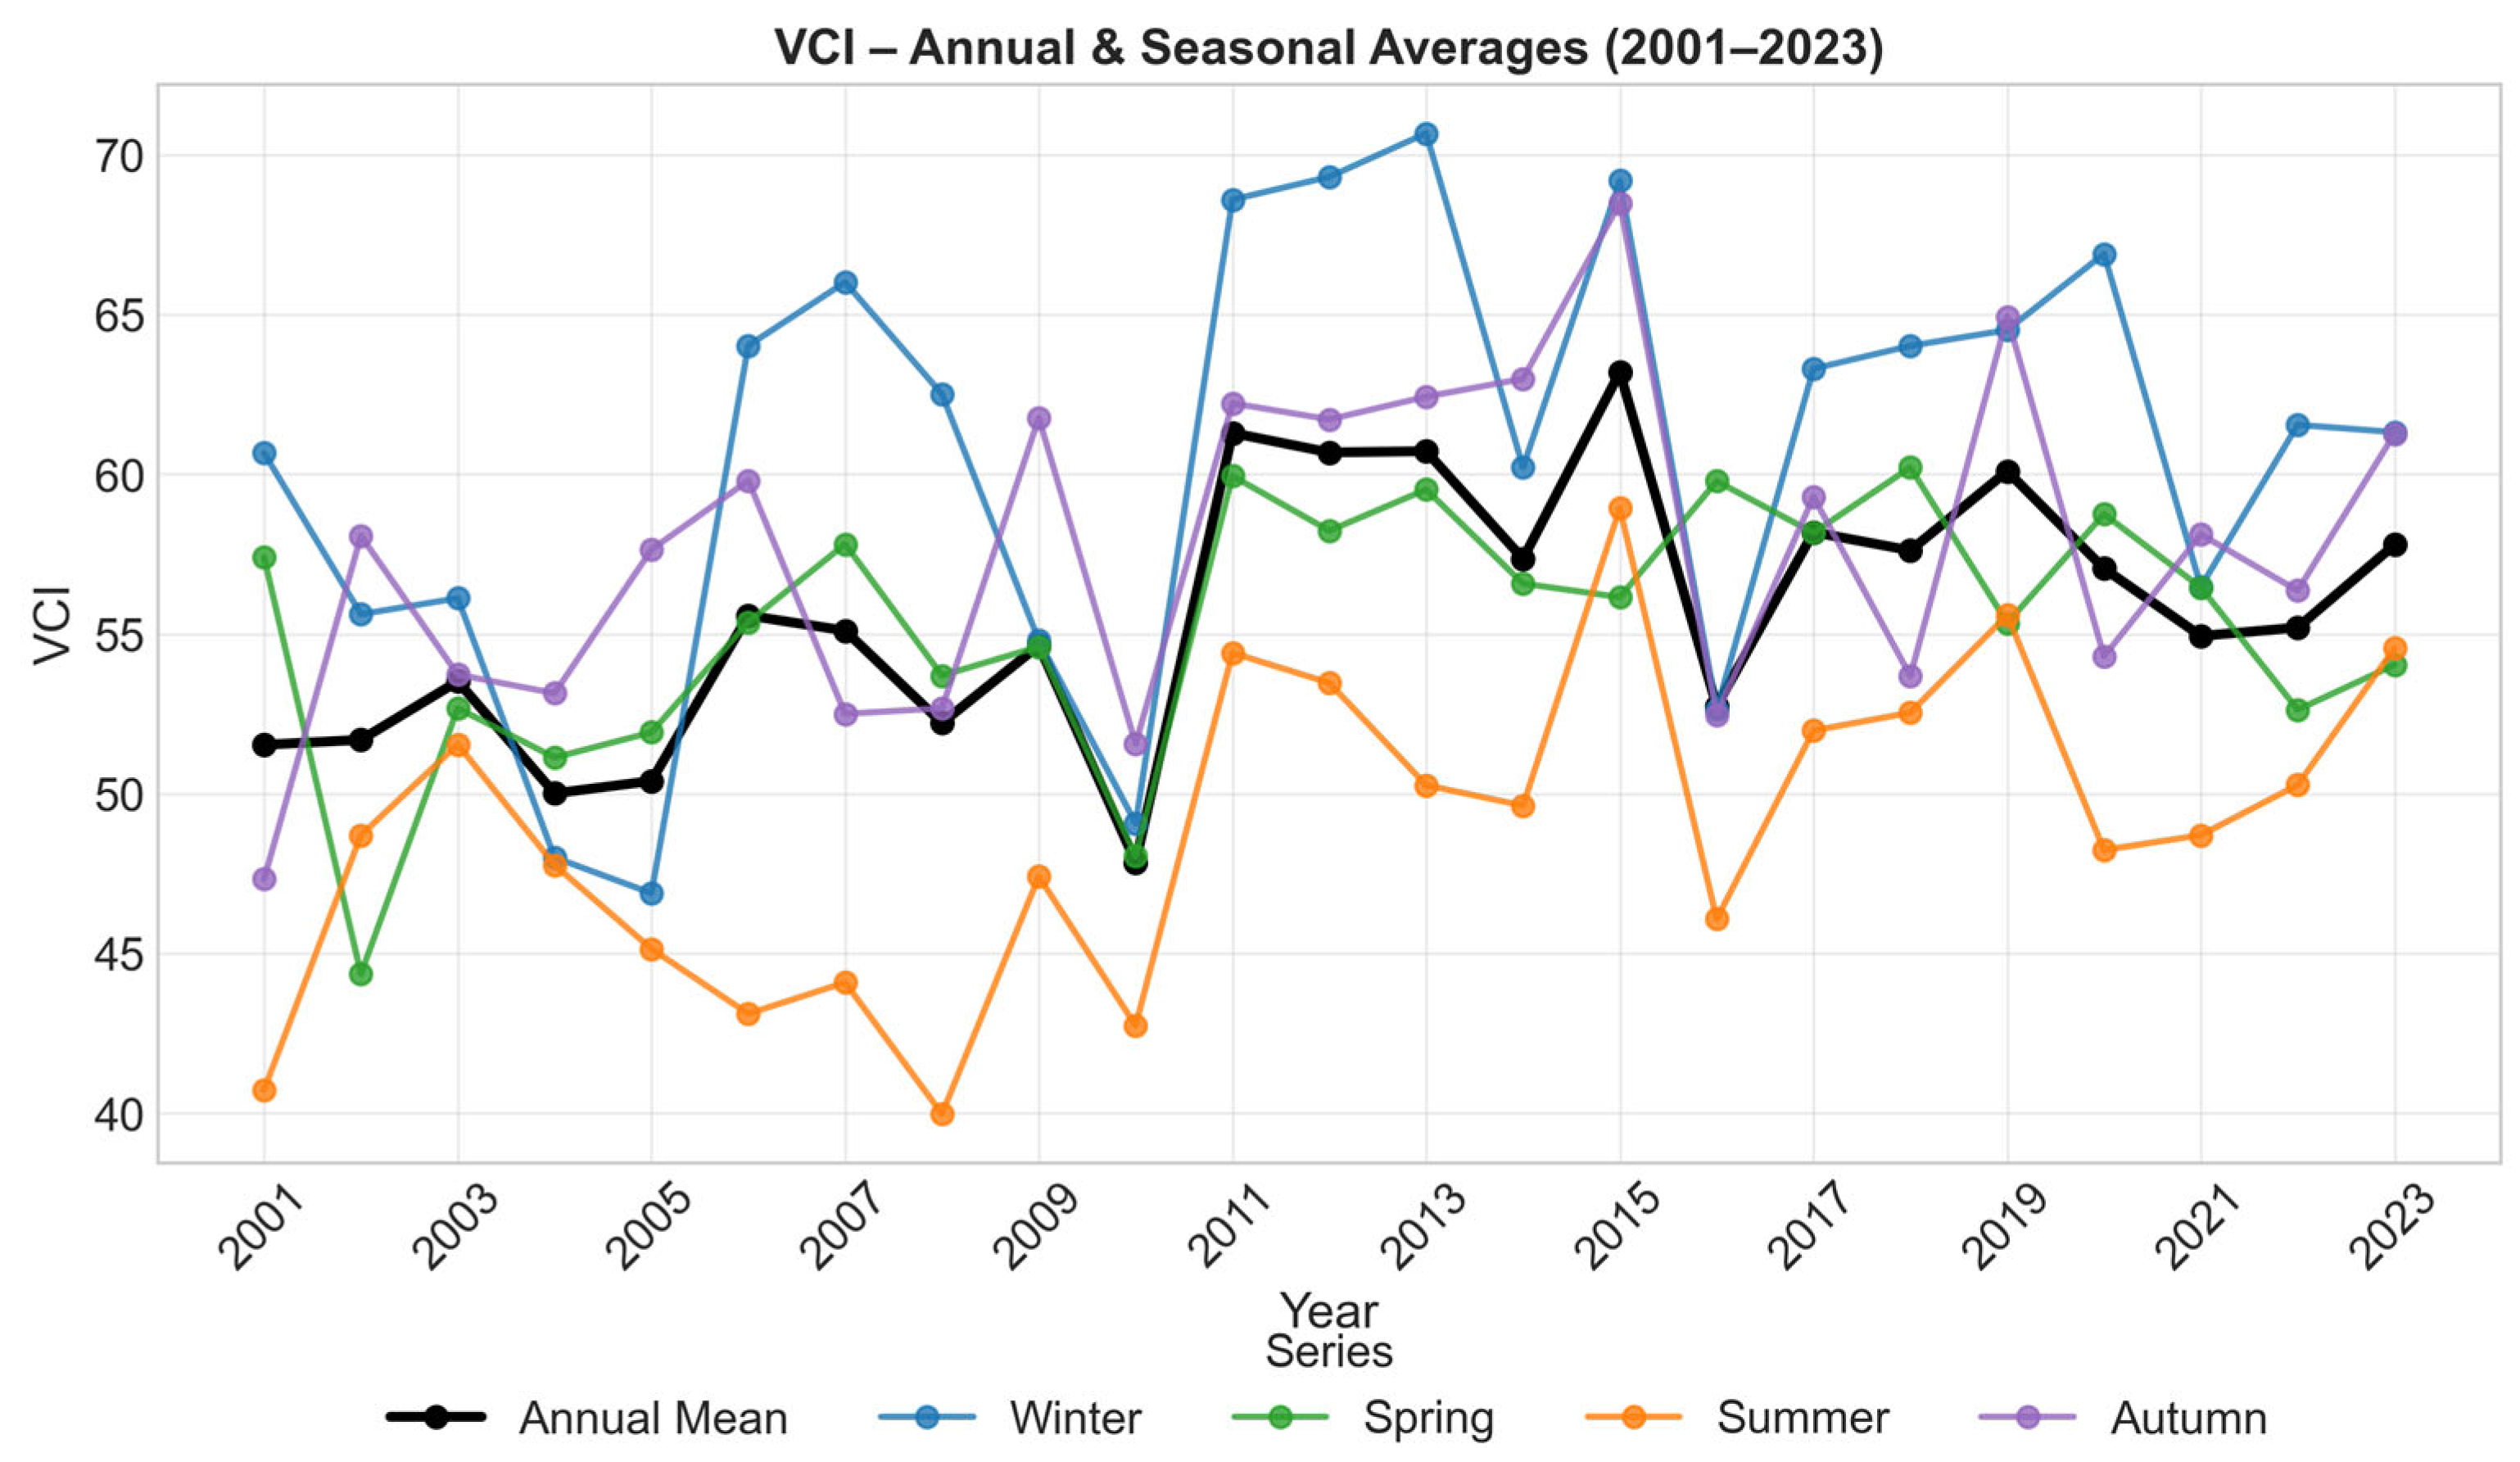
The VCI, derived from MODIS NDVI, was calculated annually and seasonally for 2001–2023 in the AOI (Figure 10). Annual values ranged from a minimum of 48.1 in 2010, reflecting severe vegetation stress under precipitation deficits, to a maximum of 63.2 in 2015, indicating favorable growing conditions. Seasonally, winter and spring generally recorded the highest VCI values (55–65), consistent with recharge and early crop development, while summer values were lowest (40–50), highlighting pronounced water stress during the dry season under minimal rainfall and peak evapotranspiration demand. Autumn values remained intermediate (50–60), marking the transition between summer stress and winter recovery.
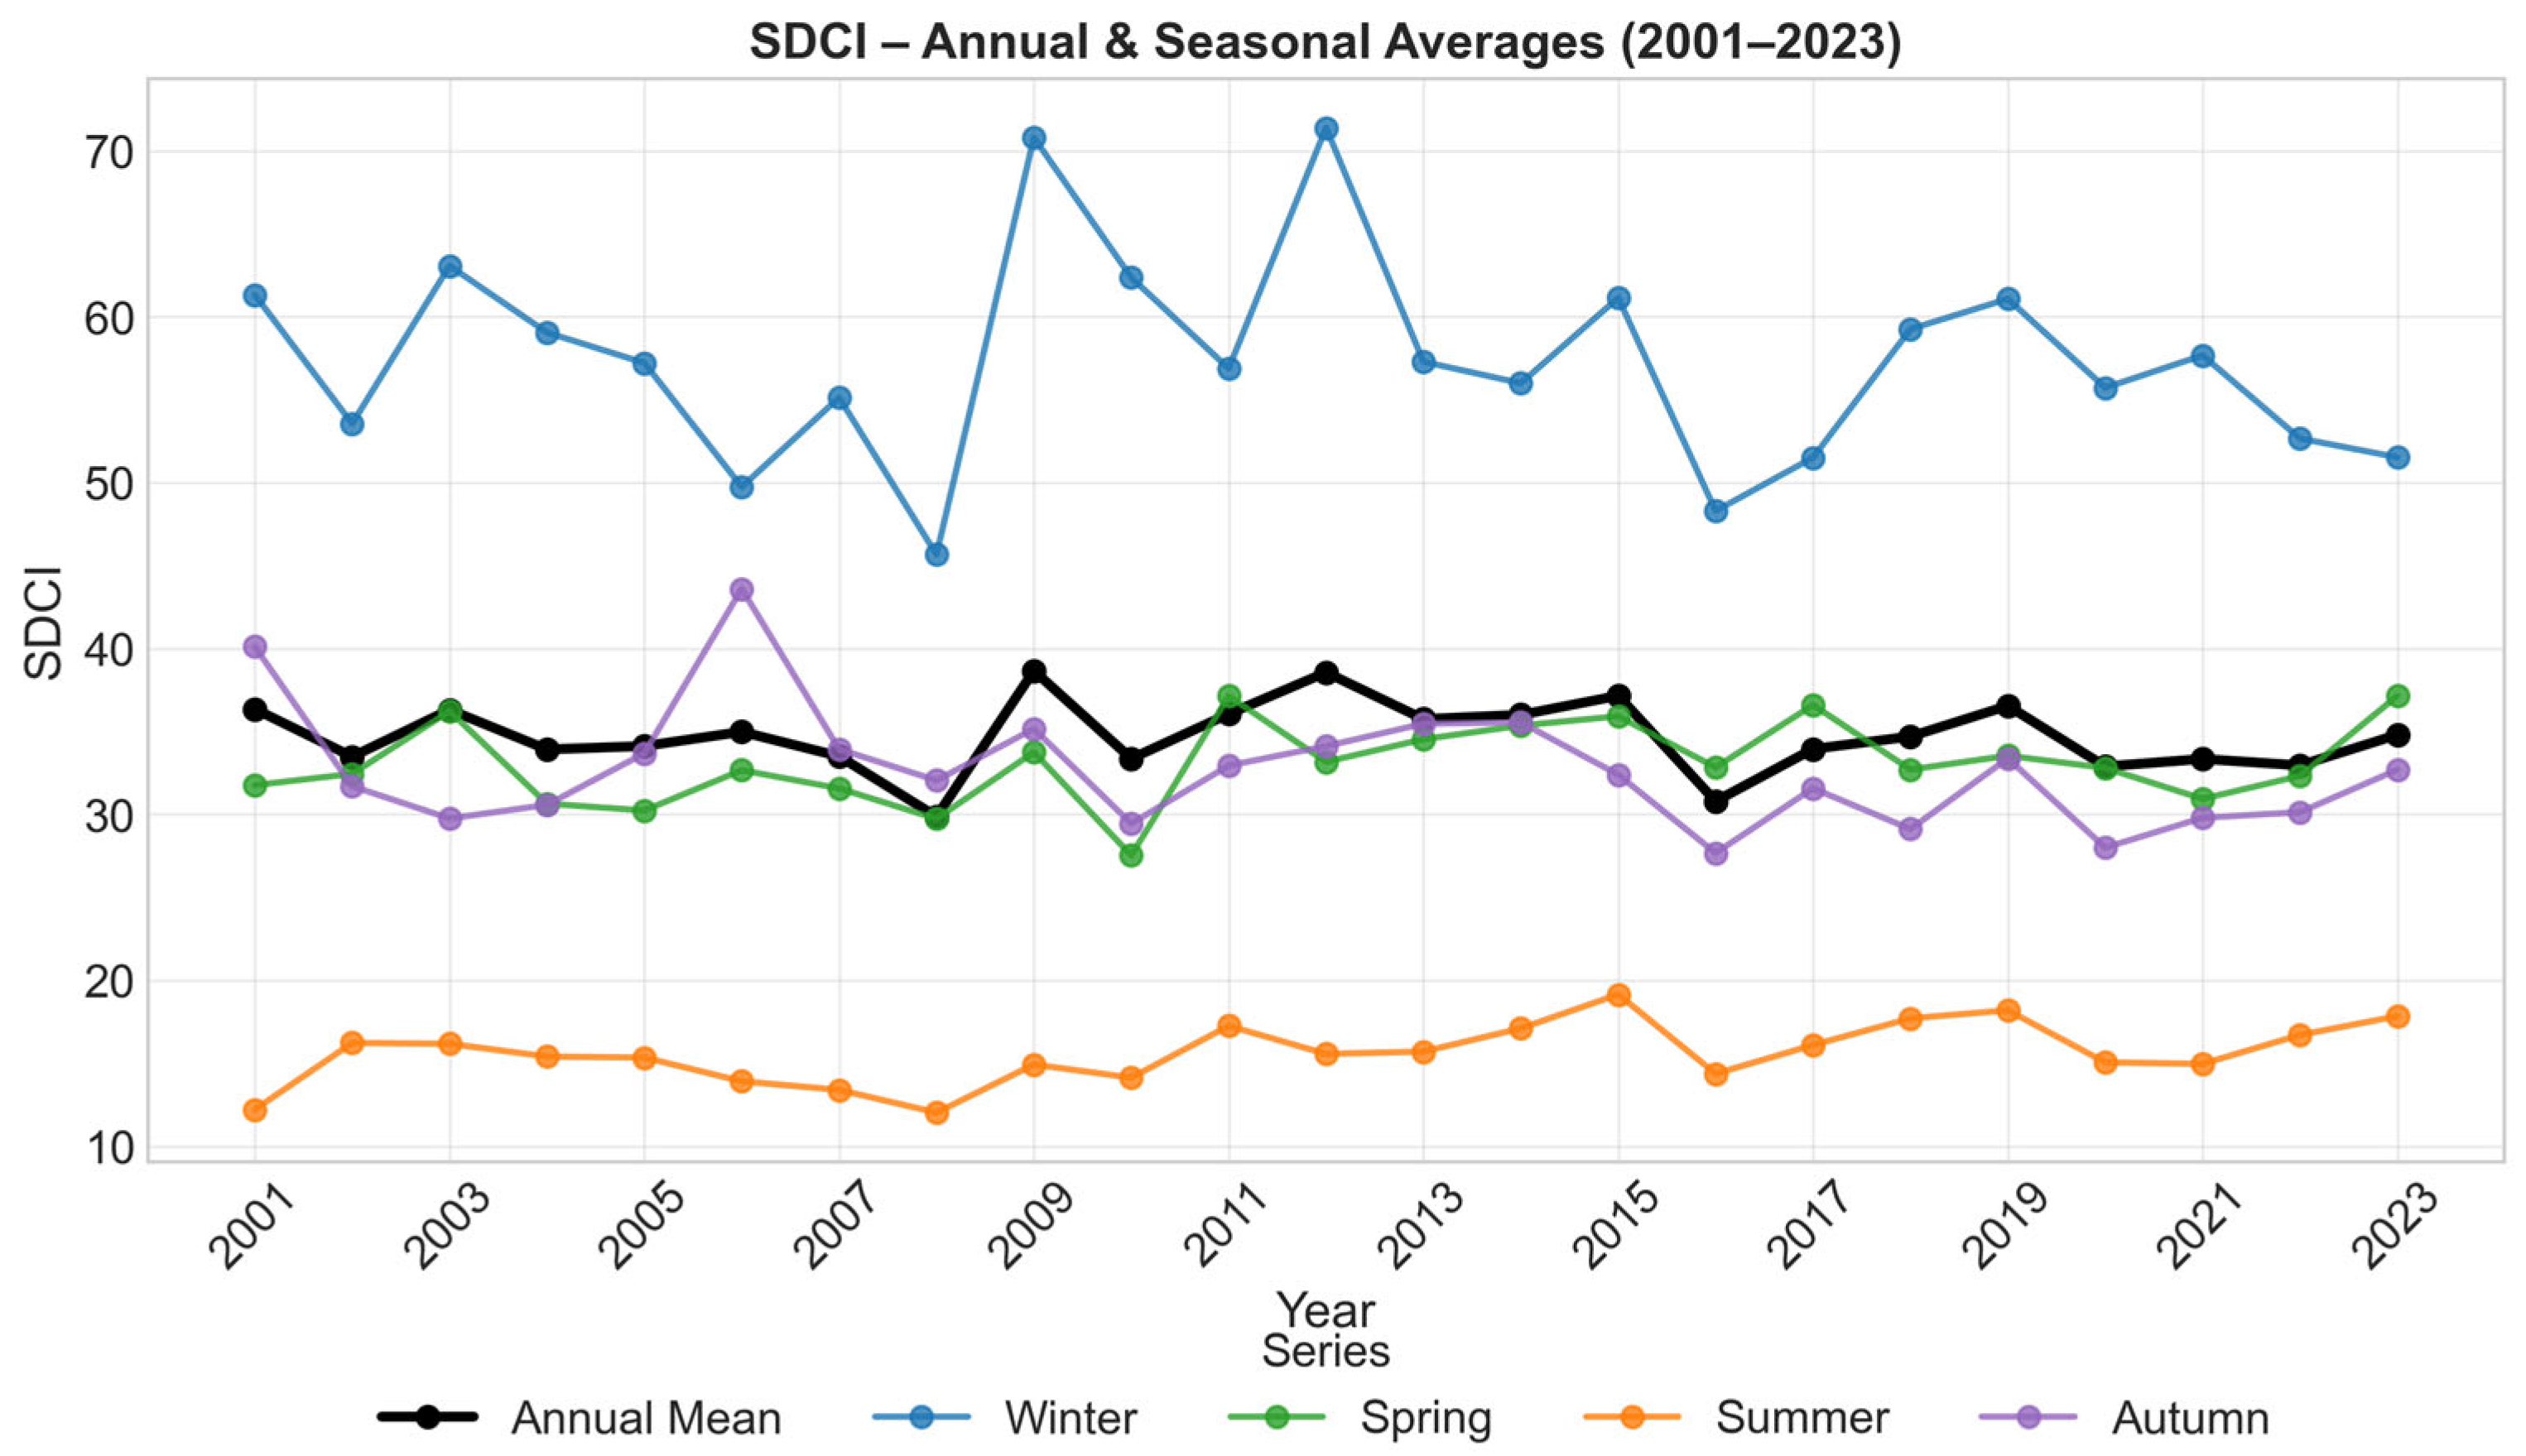
The Scaled Drought Condition Index (SDCI), integrating vegetation (VCI), temperature (TCI), and precipitation (PCI) stress, was calculated annually and seasonally for the AOI during 2001–2023 (Figure 11). Annual SDCI values ranged from a minimum of 30.0 in 2008, reflecting extreme drought under depressed PCI and negative vegetation signals (e.g., NDDI), to a maximum of 38.9 in 2009 and 2012, indicating wetter conditions with improved precipitation input and reduced stress. Throughout the following years, SDCI values generally remained within 32–37, indicating a predominance of moderate drought conditions across the basin. Seasonally, winter consistently showed the highest SDCI values (≈55–65), reflecting recharge supported by rainfall, while summer displayed the lowest (≈15–25), driven by minimal precipitation, high evapotranspiration, and peak crop water demand. Spring and autumn remained intermediate (≈30–40), marking transitional stress periods.
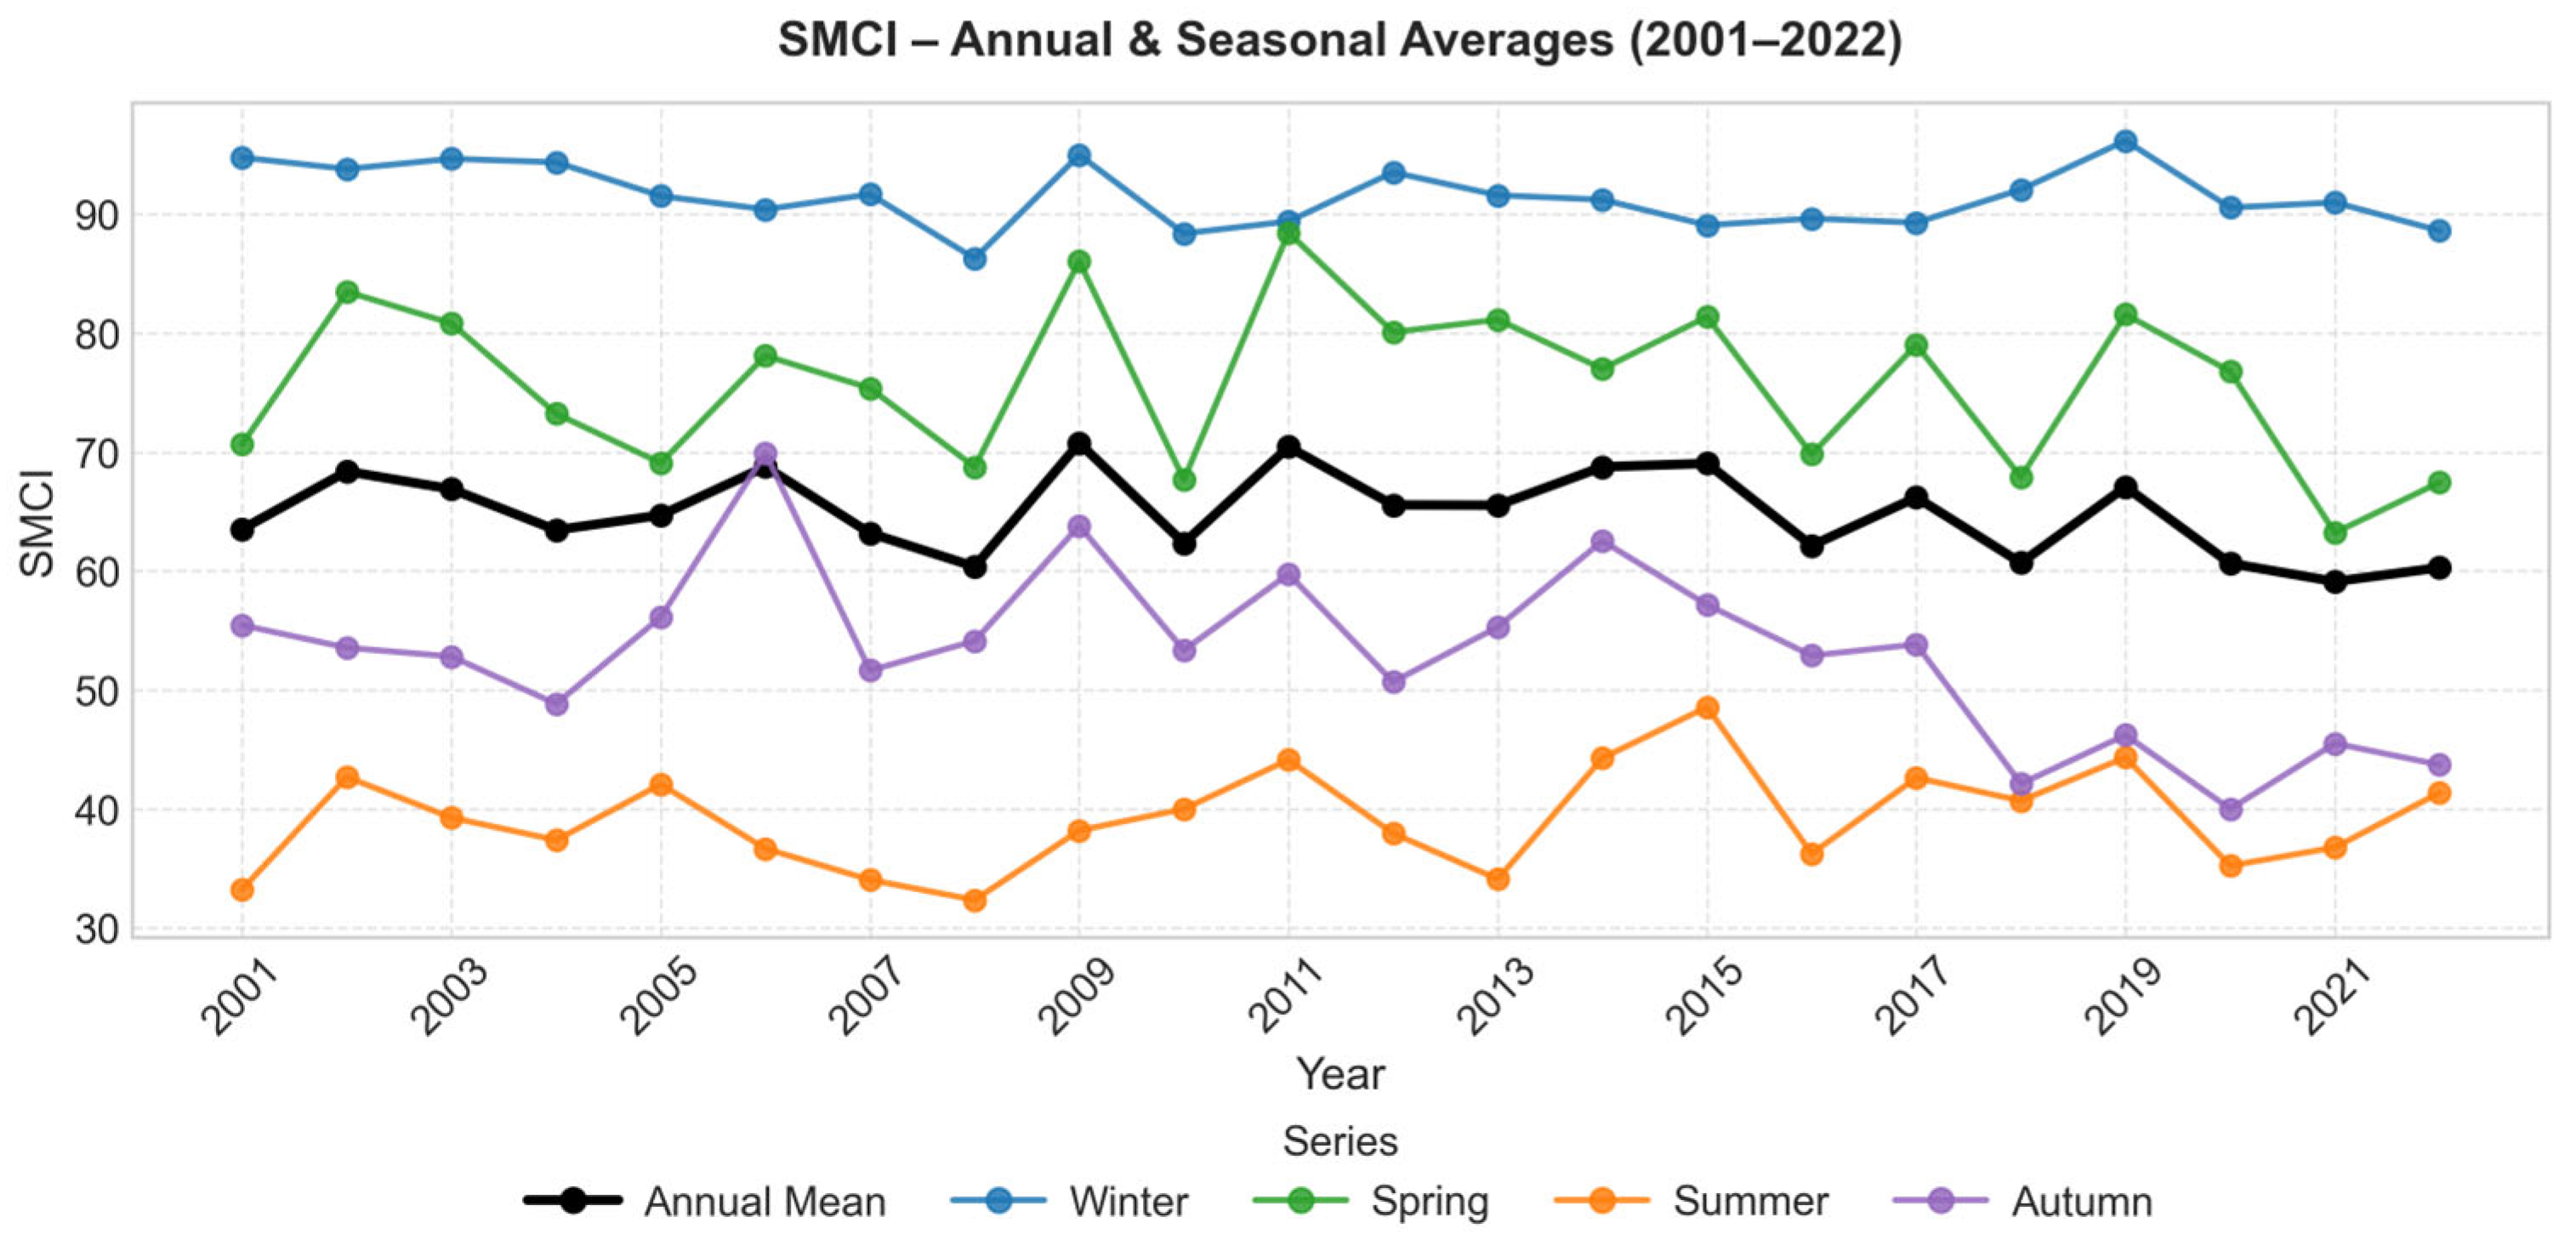
The Soil Moisture Condition Index (SMCI), derived from ERA5-Land reanalysis, was calculated annually and seasonally for the AOI during 2001–2022 (Figure 12). Annual SMCI values ranged from 59.5 in 2019 to 71.0 in 2010, remaining mostly within near normal to non-drought conditions. Seasonally, winter showed the highest values (85–95) due to strong precipitation recharge, while spring also remained favorable (70–80), supporting early crop growth. In contrast, summer values dropped sharply (35–45), reflecting sustained deficits under minimal rainfall and high evapotranspiration. Autumn values (50–60) marked partial recovery as rains resumed.
Seasonal and annual long-term averages of the drought indices were also calculated to summarize overall drought patterns in the AOI (Table 5).
The long-term means presented in Table 5 highlight the strong seasonality of drought conditions in the AOI. Winter and spring indices consistently reflect recharge and favorable conditions, while summer values reveal pronounced drought stress, with PCI, SDCI, and SMCI reaching their lowest levels. Overall, precipitation emerges as the dominant driver of agricultural drought, amplified by heat stress during summer, while vegetation indices provide an integrated response across seasons.
In Table 6, the values were determined according to the classification thresholds presented in Table 3 and Table 4. The results reveal that 2008 was the most severe drought year in the Antalya Agricultural Basin, with six out of seven indices (PCI, SDCI, SMCI, VHI, TCI, and VCI) simultaneously indicating drought during the summer season, confirming the season’s exceptionally low precipitation and high evapotranspiration. However, only two indices classified 2008 as an annual drought year, highlighting that annual aggregation smooths short-term extremes and may underestimate agricultural drought intensity.
When examined seasonally, winter droughts were most pronounced in 2008 and 2016, spring droughts in 2010 and 2011, and autumn droughts in 2016 and 2020, while 2018 and 2021 also showed localized dryness in NDDI and SMCI results, respectively. In contrast, 2009, 2011, 2015, and 2019 were identified as recovery or wet years across most indices, especially in vegetation- and soil-moisture-based indicators. These variations confirm that the Antalya Basin experiences recurrent but seasonally concentrated droughts—particularly in summer—linked to limited rainfall (≈5 mm) and intense evapotranspiration. Building on these temporal findings, the spatial distribution of drought further reveals where and how these seasonal anomalies are concentrated within the basin.
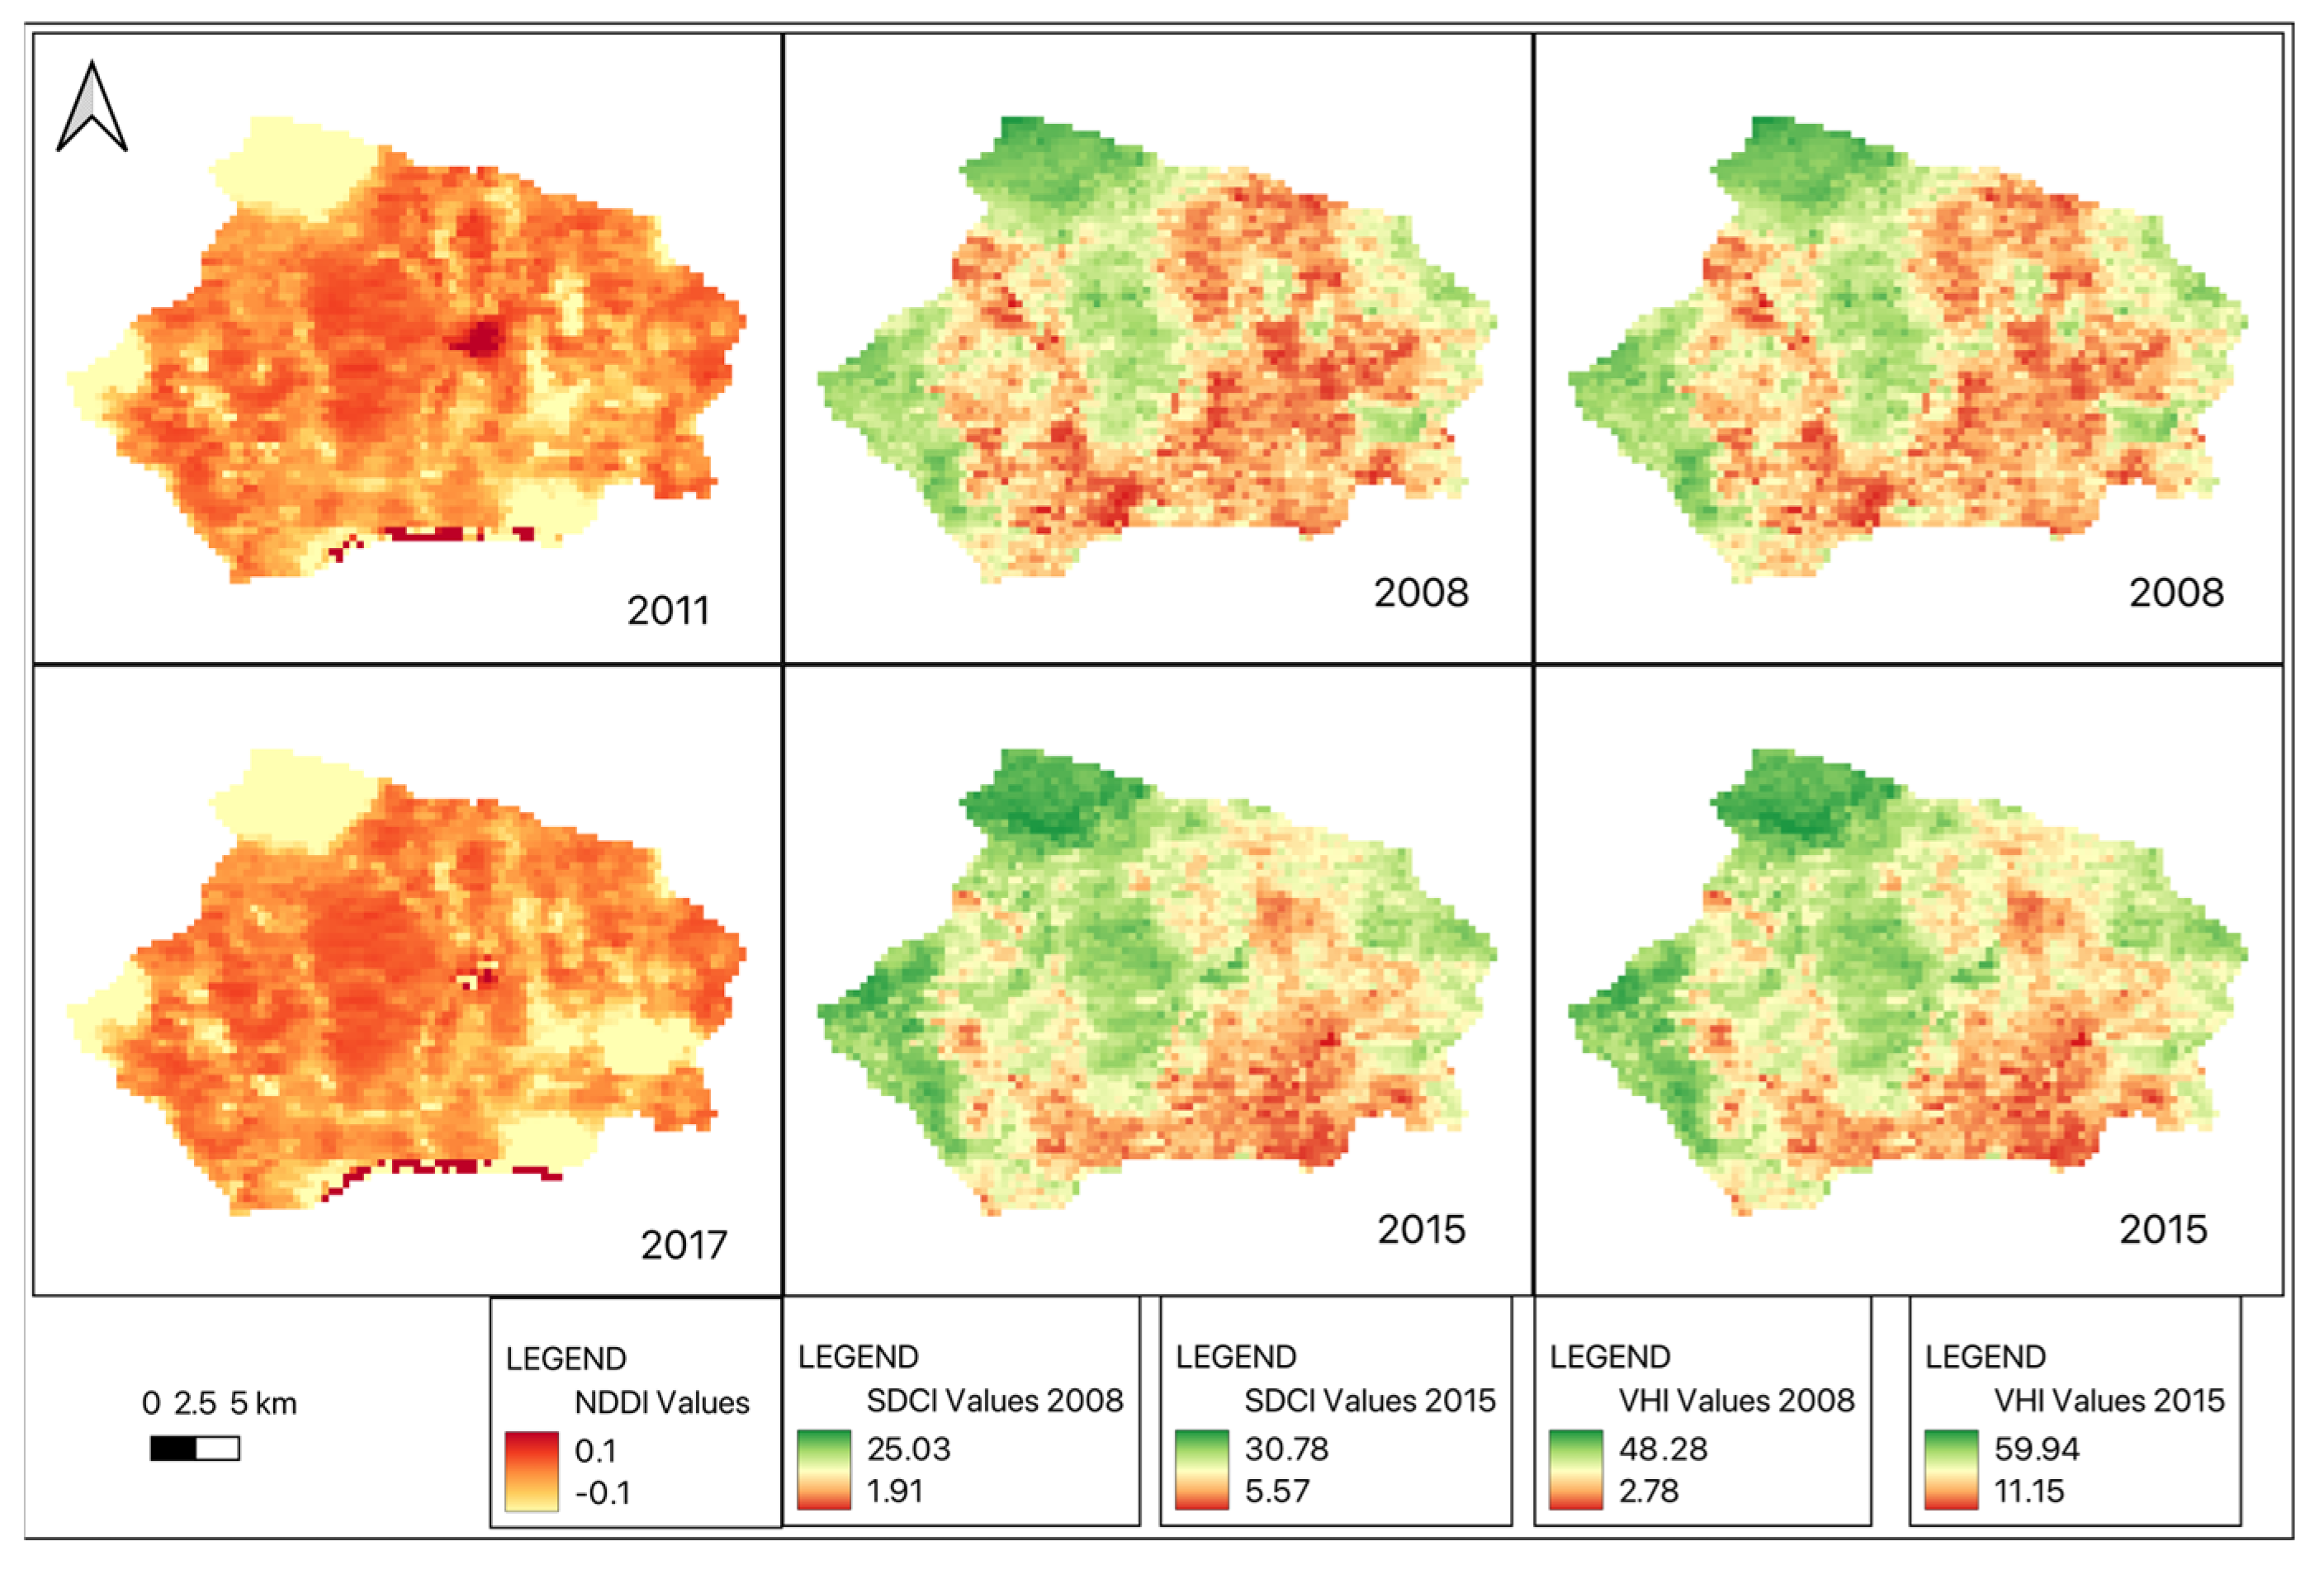
Spatial maps of summer NDDI further highlight the basin’s pronounced spatio-temporal variability in drought conditions (Figure 13). The driest and wettest summers—identified as 2011 (minimum) and 2017 (maximum)—illustrate distinct spatial contrasts across the AOI. In 2011, extensive areas of the southern and central plains exhibited moderate to severe drought, particularly within irrigated croplands and fruit plantations, reflecting acute vegetation and surface moisture stress. In contrast, 2017 presented widespread non-drought conditions, with most irrigated and forested regions maintaining healthy vegetation signals. Similarly, VHI and SDCI spatial patterns for the critical drought years (2008 and 2015) reveal the persistence of agricultural drought hotspots across lowland agricultural zones, while upland and forested areas showed relative resilience. The worst-case scenario, represented by the summer of 2008, depicts the most extensive and severe drought extent across the AOI, confirming the convergence of minimal rainfall, elevated land surface temperatures, and intensive irrigation demand during that period.
In summary, the findings emphasize that seasonal-scale analysis provides a more accurate representation of agricultural drought patterns than annual means, as it captures the temporal and spatial variability of hydroclimatic stress that directly influences crop growth and irrigation demand in Mediterranean basins.

4.2. Correlation Analysis of Drought Indices

To evaluate the consistency and interrelationship of the applied drought indices, pairwise Pearson correlation coefficients were computed for annual and seasonal scales across the 2001–2023 period (Table 7). The results reveal strong coherence among most indices, particularly those integrating precipitation, vegetation, and thermal components, confirming the robustness of the multi-index framework.
At the annual scale, very high correlations were observed between PCI–SDCI (r = 0.94), SDCI–TCI (r = 0.92), SDCI–VHI (r = 0.92), and TCI–VHI (r = 0.97), indicating a strong coupling between precipitation anomalies, vegetation greenness, and temperature stress. Similarly, the correlation between SMCI and TCI (r = 0.92) suggests that soil moisture variations closely follow surface temperature dynamics, emphasizing the importance of evapotranspiration-driven moisture loss under Mediterranean conditions.
Across seasonal scales, the strength of correlations varied according to the dominant climatic drivers.
During winter: correlations were generally weaker (r = 0.24–0.52) due to high rainfall and limited vegetation activity.
In spring: vegetation- and temperature-based indices (VCI, TCI, VHI) showed moderate relationships (r ≈ 0.6–0.9), reflecting active crop growth and climatic transitions.
Summer: exhibited the strongest correlations between composite indices (SDCI–VHI: r = 0.99; SDCI–TCI: r = 0.90; SDCI–SMCI: r = 0.89), confirming that drought stress is simultaneously expressed through temperature, soil moisture, and vegetation responses during peak evapotranspiration periods.
In autumn: high correlations between SMCI–VHI (r = 0.88) and TCI–VHI (r = 0.98) again indicate synchronous recovery of thermal and soil moisture conditions following the end of the dry season.
In contrast, NDDI exhibited relatively weak correlations with most other indices (annual r ≤ 0.09), highlighting its distinct sensitivity to short-term surface moisture fluctuations rather than long-term precipitation or temperature anomalies. This observation supports its role as a complementary rather than standalone indicator within the multi-index framework.
Overall, the correlation structure confirms that precipitation-based (PCI), composite (SDCI, VHI), and soil-moisture-based (SMCI) indices provide the most coherent depiction of agricultural drought dynamics in the Antalya Agricultural Basin, while vegetation-only metrics (NDVI, VCI) and short-term indices (NDDI) capture finer variations during specific growth stages.

4.3. Adaptation Measures and Irrigation Efficiency Strategies

The results obtained from remote sensing-based drought indices confirm the increasing vulnerability of agricultural production systems in the AOI. Quantitatively, the seasonal averages (Table 6) highlight that summer is the most critical period, with PCI dropping to 1.1, precipitation averaging only 5.5 mm, SDCI reaching its minimum of 15.6, and SMCI declining to 38.4, all pointing to severe water stress. In contrast, winter conditions are more favorable, with precipitation (~197 mm), PCI (40.9), SDCI (57.3), and SMCI (89.6) reflecting recharge and resilience. These contrasts underscore that the basin’s cropping calendar overlaps with the driest and hottest months, amplifying agricultural drought risk.
In light of these findings, adaptation measures that enhance irrigation efficiency are essential for mitigating recurrent drought impacts and ensuring sustainable water management. In semi-arid basins like Antalya, conventional irrigation methods with low efficiency are no longer sufficient. Since agriculture accounts for the majority of freshwater withdrawals in Türkiye, improving irrigation efficiency has become both an agricultural necessity and a strategic priority for national water policy. Accordingly, a set of integrated strategies—summarized in Table 6—was identified to target water savings at both farm and system levels. These measures, derived from institutional frameworks [68] and supported by scientific literature [20,36], include deficit irrigation techniques such as Traditional Deficit Irrigation (TDI) and Partial Root Zone Drying (PRD), modernization of irrigation infrastructure, parcel-level metering, SCADA-based automation, and the integration of localized meteorological and soil moisture data (e.g., SMCI) into irrigation scheduling. The detailed description and expected benefits of these measures are provided in Table 8, which outlines their purpose and potential contribution to reducing water losses while sustaining crop productivity. Together, these interventions form a multi-layered framework that, when adapted to basin-specific conditions, can substantially reduce irrigation water use and strengthen agricultural resilience.

5. Discussion

This study evaluated agricultural drought dynamics in the Antalya Agricultural Basin (AOI) for the period 2001–2023 using a multi-index framework that integrates vegetation, temperature, precipitation, composite, and soil moisture-based indicators. By employing MODIS, CHIRPS, ERA5-Land, and SMAP datasets within the Google Earth Engine platform, the analysis provided a spatially and temporally consistent assessment of drought severity.
The long-term averages of the indices (Table 5) reveal pronounced seasonal contrasts. Winter consistently reflects recharge conditions, with precipitation (~197 mm), PCI (40.9), SDCI (57.3), and SMCI (89.6) all indicating low drought stress. In contrast, summer emerges as the most critical season, with PCI dropping to 1.1, precipitation averaging only 5.5 mm, SDCI declining to 15.6, and SMCI reaching 38.4, highlighting persistent soil water deficits under peak crop demand and elevated LST. Spring and autumn act as transitional stages, showing partial recovery but still moderate stress.
At the interannual scale, drought and wetness years identified across multiple indices (Table 6) demonstrate the robustness of the multi-index approach. The most severe conditions were observed in summer 2008, when six of seven indices (PCI, SDCI, SMCI, VHI, TCI) simultaneously indicated drought, corresponding to minimal rainfall and intense evapotranspiration. Conversely, 2009 and 2015 emerged as the wettest years, identified by at least three indices, with vegetation and soil moisture indicators confirming recovery conditions. These results confirm that rainfall deficits (low PCI) are the dominant drought driver, while elevated temperatures (low TCI) amplify stress, particularly during summer. Vegetation indices responded consistently to these hydroclimatic anomalies, while SMCI provided direct evidence of soil water depletion, strengthening the overall reliability of the framework.
The observed summer drought conditions in the AOI, indicated by SDCI values between 15 and 25 and SMCI below 40, reveal moderate to severe agricultural water stress consistent with Mediterranean dry-season patterns. This period coincides with peak irrigation demand for high-value, water-intensive crops such as greenhouse vegetables (tomatoes, peppers, cucumbers), citrus orchards, vineyards, and irrigated maize, which dominate the basin’s agricultural economy. The concurrence of minimal precipitation (~5 mm), high land surface temperatures (>30 °C), and elevated evapotranspiration significantly increases pressure on already limited freshwater resources.
Comparable field-scale studies across Mediterranean regions confirm that such water deficits can be mitigated through improved irrigation efficiency. For instance, ref. [69] demonstrated that integrating remote sensing with meteorological datasets enhanced irrigation scheduling by 25–35%, while [70] reported similar savings in almond orchards under deficit irrigation and foliar kaolin application. Reference [71] quantified irrigation reductions of 25% (SSDI), 33% (RDI), and 49% (PRD) in orange orchards, and [72] observed 30–40% lower water use in greenhouse tomatoes with PRD. These quantitative benchmarks closely align with the drought intensity measured in this study, suggesting that targeted irrigation modernization and adaptive scheduling could offset up to one-third of the basin’s seasonal water deficit.
Overall, the findings underline that agricultural drought risk in the AOI is governed by the convergence of minimal summer rainfall, high evapotranspiration, and intensive irrigation demand for high-value crops such as citrus, banana, and greenhouse vegetables. Integrating remote-sensing-based drought monitoring with precision irrigation technologies—such as deficit irrigation, PRD, and real-time soil moisture automation—offers an effective adaptation pathway consistent with Türkiye’s National Water Efficiency Strategy (2023–2033).
Despite these advances, some limitations remain. The indices used primarily reflect surface conditions and may not fully capture subsurface dynamics such as groundwater depletion, which is critical in Antalya’s intensive greenhouse systems. Moreover, socio-economic factors—including cropping patterns, irrigation practices, and water governance—were not explicitly integrated but strongly influenced drought vulnerability. Future research should therefore combine multi-source soil moisture products (e.g., SMAP, ESA CCI), evapotranspiration datasets, and groundwater monitoring with socio-economic drivers to provide a more comprehensive and actionable understanding of agricultural drought risk.

6. Conclusions

The Antalya Agricultural Basin (AOI) is among Türkiye’s most productive agricultural regions, yet it faces intensifying drought risks driven by rising temperatures, declining precipitation, and growing irrigation demands. Using a multi-index remote sensing framework that integrates vegetation, thermal, precipitation, and soil moisture indicators, this study provided a comprehensive assessment of agricultural drought dynamics from 2001 to 2023. The results revealed that summer consistently represents the most drought-prone season, characterized by minimal precipitation (~5 mm), elevated land surface temperatures (>30 °C), and soil moisture deficits (SMCI < 40), whereas winter conditions indicate recharge and resilience. Extreme drought in 2008 and recovery in 2009 and 2015 underscore the value of multi-source integration in capturing both interannual variability and seasonal extremes.
The findings demonstrate that agricultural drought risk in the AOI is governed by the overlap of limited summer rainfall, high evapotranspiration, and the intensive water requirements of high-value crops such as citrus, greenhouse vegetables, and vineyards. This seasonal imbalance heightens pressure on freshwater resources and emphasizes the need for efficient irrigation scheduling and adaptive water management. In alignment with Türkiye’s National Water Efficiency Strategy (2023–2033), several measures are recommended to mitigate drought vulnerability, including the adoption of deficit irrigation techniques (TDI, PRD), modernization of irrigation infrastructure, SCADA-based automation, and the integration of localized meteorological and soil moisture data into irrigation planning.
Looking ahead, advancing digital traceability systems that monitor crop water use from production to market would enhance transparency, support water-saving behavior, and improve accountability across the agri-food value chain. Combining remote sensing with socio-economic, groundwater, and evapotranspiration data will further strengthen drought early warning systems and promote sustainable, climate-resilient agriculture. Overall, this research contributes to bridging scientific drought monitoring with practical water management policies, offering an adaptable framework for Mediterranean and semi-arid regions facing similar challenges.

Author Contributions

Conceptualization, V.L. and A.K.; methodology, A.K.; software, A.K.; validation, E.G.K. and B.F.; formal analysis, A.K.; investigation, A.K.; resources, E.G.K.; data curation, A.K.; writing—original draft preparation, A.K.; writing—review and editing, V.L. and B.F.; visualization, A.K.; supervision, V.L. and B.F.; project administration, A.K.; funding acquisition, V.L. All authors have read and agreed to the published version of the manuscript.

Funding

This research received no external funding. The article processing charge (APC) was fully waived by Hydrology (MDPI) through an APC voucher provided to Venkataraman Lakshmi.

Data Availability Statement

The datasets analyzed in this study are publicly available from the following sources: MODIS (NASA/LP DAAC, https://lpdaac.usgs.gov/ (accessed on 8 August 2025)), CHIRPS (Climate Hazards Group, https://www.chc.ucsb.edu/data/chirps (accessed on 27 July 2025)), ERA5-Land (ECMWF, https://www.ecmwf.int/en/era5-land (accessed on 8 August 2025)), and SMAP NSIDC-0779 (NSIDC, https://nsidc.org/data/nsidc-0779 (accessed on 8 August 2025)). Processed data and scripts used in Google Earth Engine (GEE) are available from the corresponding author upon reasonable request.

Acknowledgments

The authors gratefully acknowledge the NASA LP DAAC, Climate Hazards Group (CHIRPS), ECMWF (ERA5-Land), and NSIDC (SMAP) for providing open-access datasets used in this study. We also thank the General Directorate of Water Management (GDWM) of the Ministry of Agriculture and Forestry of Türkiye for institutional guidance on water efficiency policies.

Conflicts of Interest

The authors declare no conflicts of interest. The funders had no role in the design of the study; in the collection, analyses, or interpretation of data; in the writing of the manuscript; or in the decision to publish the results.

Abbreviations

The following abbreviations are used in this manuscript:
ABAAbscisic Acid
AOIArea of Interest
CHIRPSClimate Hazards Group InfraRed Precipitation with Stations
ERA5-LandFifth Generation ECMWF Atmospheric Reanalysis for Land
GEEGoogle Earth Engine
LSTLand Surface Temperature
MODISModerate Resolution Imaging Spectroradiometer
NDVINormalized Difference Vegetation Index
NDWINormalized Difference Water Index
NDDINormalized Difference Drought Index
PCIPrecipitation Condition Index
PRDPartial Root-Zone Drying
SDCIScaled Drought Composite Index
SCADASupervisory Control and Data Acquisition Systems
SMSoil Moisture
SMAPSoil Moisture Active Passive
SMCISoil Moisture Condition Index
TCITemperature Condition Index
TDITraditional Deficit Irrigation
VCIVegetation Condition Index
VHIVegetation Health Index

References

  1. Milly, P.; Dunne, K.; Vecchia, A. Global pattern of trends in streamflow and water availability in a changing climate. Nature 2005, 438, 347–350. [Google Scholar] [CrossRef]
  2. Mishra, A.K.; Özger, M.; Singh, V.P. Association between uncertainties in meteorological variables and water-resources planning for the state of Texas. J. Hydrol. Eng. 2010, 16, 984–999. [Google Scholar] [CrossRef]
  3. IPCC. Climate Change 2023: Synthesis Report. In Contribution of Working Groups I, II and III to the Sixth Assessment Report of the Intergovernmental Panel on Climate Change; Core Writing Team, Lee, H., Romero, J., Eds.; IPCC: Geneva, Switzerland, 2023. [Google Scholar] [CrossRef]
  4. Lesk, C.; Rowhani, P.; Ramankutty, N. Influence of extreme weather disasters on global crop production. Nature 2016, 529, 84–87. [Google Scholar] [CrossRef]
  5. Challinor, A.J.; Watson, J.; Lobell, D.B.; Howden, S.M.; Smith, D.R.; Chhetri, N. A meta-analysis of crop yield under climate change and adaptation. Nat. Clim. Change 2014, 4, 287–291. [Google Scholar] [CrossRef]
  6. Konapala, G.; Mishra, A.K.; Wada, Y.; Mann, M.E. Climate change will affect global water availability through compounding changes in seasonal precipitation and evaporation. Nat. Commun. 2020, 11, 3044. [Google Scholar] [CrossRef] [PubMed]
  7. Arslan, F.; Sawassi, A.; Derardja, B.; Değirmenci, H.; Lamaddalena, N. The effects of land consolidation projects on pressurized irrigation system design and the cost: A case study from Türkiye. Ecohydrol. Hydrobiol. 2024, 24, 608–616. [Google Scholar] [CrossRef]
  8. Han, X.; Wang, X.; Zhu, Y.; Huang, J.; Yang, L.; Chang, Z.; Fu, F. An experimental study on concrete and geomembrane lining effects on canal seepage in arid agricultural areas. Water 2020, 12, 2343. [Google Scholar] [CrossRef]
  9. Liu, Y.; Bai, M.; Zhang, K.; Zhang, B.; Li, Y.; Wang, Y.; Liu, J.; Liu, H.; He, Y. Study on the impact of pipe installation height on the hydraulic performance of combined canal–pipe water conveyance systems. Agriculture 2025, 15, 1347. [Google Scholar] [CrossRef]
  10. Bilgili, A.V. Spatial assessment of soil salinity in the Harran Plain using multiple kriging techniques. Environ. Monit. Assess. 2013, 185, 777–795. [Google Scholar] [CrossRef]
  11. Chukalla, A.D.; Krol, M.S.; Hoekstra, A.Y. Green and blue water footprint reduction in irrigated agriculture: Effect of irrigation techniques, irrigation strategies and mulching. Hydrol. Earth Syst. Sci. 2015, 19, 4877–4891. [Google Scholar] [CrossRef]
  12. Ibba, K.; Kassout, J.; Boselli, V.; Er-Raki, S.; Oulbi, S.; Mansouri, L.E.; Bouizgaren, A.; Sikaoui, L.; Hadria, R. Assessing the impact of deficit irrigation strategies on agronomic and productive parameters of Menara olive cultivar: Implications for operational water management. Front. Environ. Sci. 2023, 11, 1100552. [Google Scholar] [CrossRef]
  13. Fang, B.; Kansara, P.; Dandridge, C.; Lakshmi, V. Drought monitoring using high spatial resolution soil moisture data over Australia in 2015–2019. J. Hydrol. 2021, 594, 125960. [Google Scholar] [CrossRef]
  14. Tang, T.; Ge, J.; Shi, H.; Wang, L.; Cao, J.; Lee, X. Drought frequency, intensity, and exposure have increased due to historical land use and land cover changes. Commun. Earth Environ. 2025, 6, 398. [Google Scholar] [CrossRef]
  15. Spennmann, P.; Naumann, G.; Peretti, M.; Cammalleri, C.; Salvia, M.; Bocco, A.B.; Long, M.; Maas, M.; Kim, H.; Le, M.-H.; et al. Evaluation of a combined drought indicator against crop yield estimations and simulations over the Argentine Humid Pampas. Theor. Appl. Climatol. 2024, 156, 1473–1489. [Google Scholar] [CrossRef]
  16. Mahnamfar, F.; Nigussie, T.A. Assessment of drought characteristics and trend analysis in Antalya Basin, Turkey. J. Civ. Eng. Urban. 2023, 13, 18–24. [Google Scholar] [CrossRef]
  17. Zhao, C.; Liu, B.; Piao, S.; Wang, X.; Lobell, D.B.; Huang, Y.; Huang, M.; Yao, Y.; Bassu, S.; Ciais, P.; et al. Temperature increase reduces global yields of major crops in four independent estimates. Proc. Natl. Acad. Sci. USA 2017, 114, 9326–9331. [Google Scholar] [CrossRef]
  18. Candemir, S.; Ağızan, K.; Doğan, H.G.; Bayramoğlu, Z. Evaluating energy efficiency and carbon emissions in banana cultivation: The case of Antalya Province in Türkiye. Appl. Fruit Sci. 2025, 67, 99. [Google Scholar] [CrossRef]
  19. Serkendiz, H.; Tatlı, H.; Özcan, H.; Çetin, M.; Sungur, A. Multidimensional assessment of agricultural drought vulnerability based on socioeconomic and biophysical indicators. Int. J. Disaster Risk Reduct. 2023, 81, 104121. [Google Scholar] [CrossRef]
  20. Rhee, J.; Im, J.; Carbone, G.J. Monitoring agricultural drought for arid and humid regions using multi-sensor remote sensing data. Remote Sens. Environ. 2010, 114, 2875–2887. [Google Scholar] [CrossRef]
  21. Rebello, V.; Getirana, A.; Filho, O.; Lakshmi, V. Spatiotemporal vegetation response to extreme droughts in Eastern Brazil. Remote Sens. Appl. Soc. Environ. 2020, 18, 100294. [Google Scholar] [CrossRef]
  22. Lakshmi, V.; Le, M.-H.; Goffin, B.; Besnier, J.; Pham, H.; Do, H.; Fang, B.; Mohammed, I.; Bolten, J. Regional analysis of the 2015–16 drought monitoring over the Lower Mekong River Basin using NASA satellite observations. J. Hydrol. Reg. Stud. 2023, 46, 101362. [Google Scholar] [CrossRef]
  23. Lakshmi, V.; Kir, E.G.; Fang, B. Precipitation data accuracy and extreme rainfall detection for flood risk analysis in the Akçay Sub-Basin. Remote Sens. 2025, 17, 3199. [Google Scholar] [CrossRef]
  24. AghaKouchak, A.; Farahmand, A.; Melton, F.S.; Teixeira, J.; Anderson, M.C.; Wardlow, B.D.; Hain, C.R. Remote sensing of drought: Progress, challenges and opportunities. Rev. Geophys. 2015, 53, 452–480. [Google Scholar] [CrossRef]
  25. Pandey, V.; Srivastava, P.K.; Singh, A.K.; Suman, S.; Maurya, S. Techniques and tools for monitoring agriculture drought: A review. Arab. J. Geosci. 2024, 9, 497–519. [Google Scholar] [CrossRef]
  26. Besnier, J.; Getirana, A.; Beaudoing, H.; Lakshmi, V. Characterizing the 2019–2021 drought in the La Plata Basin with GLDAS and SMAP. J. Hydrol. Reg. Stud. 2024, 52, 101679. [Google Scholar] [CrossRef]
  27. Sur, K.; Lunagaria, M.M. Association between drought and agricultural productivity using remote sensing data: A case study of Gujarat State of India. J. Water Clim. Change 2020, 11, 189–202. [Google Scholar] [CrossRef]
  28. Chere, Z.; Debalke, D.B. Modeling agricultural drought based on the earth observation-derived standardized precipitation evapotranspiration index and vegetation health index in the northeastern highlands of Ethiopia. Nat. Hazards 2023, 120, 3127–3151. [Google Scholar] [CrossRef]
  29. Gu, Y.; Hunt, E.; Wardlow, B.; Basara, J.; Brown, J.; Verdin, J. Evaluation of MODIS NDVI and NDWI for vegetation drought monitoring using Oklahoma Mesonet soil moisture data. Geophys. Res. Lett. 2008, 35, L22401. [Google Scholar] [CrossRef]
  30. Kogan, F.N. Application of vegetation index and brightness temperature for drought detection. Adv. Space Res. 1995, 15, 91–100. [Google Scholar] [CrossRef]
  31. Farooq, M.; Wahid, A.; Kobayashi, N.; Fujita, D.; Basra, S.M.A. Plant drought stress: Effects, mechanisms and management. Agron. Sustain. Dev. 2009, 29, 185–212. [Google Scholar] [CrossRef]
  32. Park, S.; Seo, E.; Kang, D.; Im, J.; Lee, M.-I. Prediction of drought on pentad scale using remote sensing data and MJO index through random forest over East Asia. Remote Sens. 2018, 10, 1811. [Google Scholar] [CrossRef]
  33. Shahzad, M.U.; Tahir, S.; Rashid, J.; Khashan, O.A.; Ahmad, R.; Mansoor, S.; Ghani, A. Machine learning-based cotton yield forecasting under climate change for precision agriculture. Appl. Technol. 2025, 15, 101117. [Google Scholar] [CrossRef]
  34. Rosa, L.; Chiarelli, D.D.; Tu, C.; Rulli, M.C.; D’Odorico, P. Global unsustainable virtual water flows in agricultural trade. Environ. Res. Lett. 2019, 14, 114001. [Google Scholar] [CrossRef]
  35. OECD. Water Resources Allocation: Sharing Risks and Opportunities; OECD Publishing: Paris, France, 2015. [Google Scholar] [CrossRef]
  36. World Bank. Transforming Agriculture in Türkiye: Towards Climate-Smart Practices; World Bank Group: Washington, DC, USA, 2021; Available online: https://documents.worldbank.org/en/publication/documents-reports/documentdetail/099455306072212423/idu0ffbe9b5600d8604f9d0a430240d1a6b54bc1 (accessed on 9 July 2025).
  37. Hatfield, J.L.; Dold, C. Water-use efficiency: Advances and challenges in a changing climate. Front. Plant Sci. 2019, 10, 103. [Google Scholar] [CrossRef] [PubMed]
  38. Bozorg-Haddad, O.; Dehghan, P.; Zolghadr-Asli, B.; Singh, V.P.; Chu, X.; Loáiciga, H.A. System dynamics modeling of lake water management under climate change. Sci. Rep. 2022, 12, 5828. [Google Scholar] [CrossRef] [PubMed]
  39. Klisch, A.; Atzberger, C. Operational drought monitoring in Kenya using MODIS NDVI time series. Remote Sens. 2016, 8, 267. [Google Scholar] [CrossRef]
  40. Patil, P.P.; Jagtap, M.P.; Khatri, N.; Madan, H.; Vadduri, A.A.; Patodia, T. Exploration and advancement of NDDI leveraging NDVI and NDWI in Indian semi-arid regions: A remote sensing-based study. Case Stud. Chem. Environ. Eng. 2024, 9, 100573. [Google Scholar] [CrossRef]
  41. Zhang, Y.; Wang, G.; Li, L.; Huang, M. A monitoring method for agricultural soil moisture using wireless sensors and the Biswas model. Agriculture 2025, 15, 344. [Google Scholar] [CrossRef]
  42. European Environment Agency (EEA). CORINE Land Cover (CLC) 2018, Version 2020_20u1; Copernicus Land Monitoring Service: Copenhagen, Denmark, 2020. Available online: https://land.copernicus.eu/pan-european/corine-land-cover/clc2018 (accessed on 9 July 2025).
  43. Brumfield, R.G.; Ozkan, B. Gender analysis of labor and resources in greenhouse vegetable production in the Antalya Province of Turkey. HortScience 2016, 51, 1547–1554. [Google Scholar] [CrossRef]
  44. Funk, C.; Peterson, P.; Landsfeld, M.; Pedreros, D.; Verdin, J.; Shukla, S.; Husak, G.; Rowland, J.; Harrison, L.; Hoell, A.; et al. The Climate Hazards Infrared Precipitation with Stations (CHIRPS)—A New Environmental Record for Monitoring Extremes. Sci. Data 2015, 2, 150066. [Google Scholar] [CrossRef]
  45. Wan, Z.; Hook, S.; Hulley, G. MODIS/Terra Land Surface Temperature/Emissivity 8-Day L3 Global 1 km SIN Grid V061 [Data set]. NASA Land Processes Distributed Active Archive Center. NASA LP DAAC. 2021. Available online: https://www.earthdata.nasa.gov/data/catalog/lpcloud-mod11a2-061 (accessed on 8 August 2025).
  46. Vermote, E. MODIS/Terra Surface Reflectance 8-Day L3 Global 500 m SIN Grid V061 [Data set]. NASA Land Processes Distributed Active Archive Center. NASA LP DAAC. 2021. Available online: https://www.earthdata.nasa.gov/data/catalog/lpcloud-mod09a1-061 (accessed on 8 August 2025).
  47. Lakshmi, V.; Fang, B. SMAP-Derived 1-km Downscaled Surface Soil Moisture Product (NSIDC-0779, Version 1); NASA National Snow and Ice Data Center Distributed Active Archive Center: Boulder, CO, USA, 2023. [Google Scholar] [CrossRef]
  48. Muñoz-Sabater, J.; Dutra, E.; Agustí-Panareda, A.; Albergel, C.; Arduini, G.; Balsamo, G.; Vitart, F. ERA5-Land: A state-of-the-art global reanalysis dataset for land applications. Earth Syst. Sci. Data 2021, 13, 4349–4383. [Google Scholar] [CrossRef]
  49. Orieschnig, C.; Cavus, Y. Spatial characterization of drought through CHIRPS and a station-based dataset in the Eastern Mediterranean. Proc. IAHS 2024, 385, 79–84. [Google Scholar] [CrossRef]
  50. Ergene, E.M.; Bektaş Balçık, F.; Balık Şanlı, F. Trends analysis of agricultural drought in Central Anatolian Basin, Turkey. Int. Arch. Photogramm. Remote Sens. Spatial Inf. Sci. 2024, XLVIII-4/W9, 141–148. [Google Scholar] [CrossRef]
  51. Tran, A.P.; Tran, B.C.; Campbell, S.B.; Nguyen, N.A.; Tran, D.H.; Nguyen, T.T.; Nguyen, A.D.; Duong, H.S. Spatio-temporal characterization of drought variability in data-scarce regions using global precipitation data: A case study in Cauto River Basin, Cuba. Sci. Rep. 2024, 14, 11659. [Google Scholar] [CrossRef]
  52. Feng, S.; Wang, W.; Zhang, Y.; Wei, Z.; Dong, J.; Weihermüller, L.; Vereecken, H. Fusing ERA5-Land and SMAP L4 for an improved global soil moisture product. Earth Syst. Sci. Data 2025, preprint under review. [Google Scholar] [CrossRef]
  53. Ma, H.; Zeng, J.; Chen, N.; Zhang, X.; Cosh, M.H.; Wang, W. Satellite surface soil moisture from SMAP, SMOS, AMSR2 and ESA CCI: A comprehensive assessment using global ground-based observations. Remote Sens. Environ. 2019, 231, 111215. [Google Scholar] [CrossRef]
  54. Mazzariello, A.; Albano, R.; Lacava, T.; Manfreda, S.; Sole, A. Intercomparison of recent microwave satellite soil moisture products on European ecoregions. J. Hydrol. 2023, 626, 130311. [Google Scholar] [CrossRef]
  55. Shi, P.; Leung, L.R.; Lu, H.; Wang, B.; Yang, K.; Chen, H. Uncovering the interannual predictability of the 2003 European summer heatwave linked to the Tibetan Plateau. npj Clim. Atmos. Sci. 2024, 7, 242. [Google Scholar] [CrossRef]
  56. Hong, X.; Jia, S.; Zhu, W.; Song, Z. Evaluation of global seamless soil moisture products over China: A perspective of soil moisture sensitivity to precipitation. J. Hydrol. 2024, 641, 131789. [Google Scholar] [CrossRef]
  57. Yang, K.; Wang, C.; Bao, H. Contribution of soil moisture variability to summer precipitation in the Northern Hemisphere. J. Geophys. Res. Atmos. 2016, 121, 12108–12124. [Google Scholar] [CrossRef]
  58. Republic of Türkiye, Ministry of Agriculture and Forestry, General Directorate of Water Management (GDWM). Water Efficiency Strategy Document and Action Plan (2023–2033); Republic of Türkiye, Ministry of Agriculture and Forestry, General Directorate of Water Management: Ankara, Türkiye, 2023. Available online: https://suverimliligi.gov.tr/wp-content/uploads/2023/10/su-vermliligi-eylem-plani-en.pdf (accessed on 9 July 2025).
  59. Du, L.; Tian, Q.; Yu, T.; Meng, Q.; Janscso, T.; Udvardy, P.; Huang, Y. A comprehensive drought monitoring method integrating MODIS and TRMM data. Int. J. Appl. Earth Obs. Geoinf. 2013, 23, 245–253. [Google Scholar] [CrossRef]
  60. Huang, S.; Tang, L.; Hupy, J.P.; Wang, Y.; Shao, G. A commentary review on the use of normalized difference vegetation index (NDVI) in the era of popular remote sensing. J. For. Res. 2021, 32, 1–6. [Google Scholar] [CrossRef]
  61. Kim, K.; Scanlon, T.; Bakar, S.; Lakshmi, V. Decoupling of ecological and hydrological drought conditions in the Limpopo River Basin inferred from groundwater storage and NDVI anomalies. Hydrology 2023, 10, 170. [Google Scholar] [CrossRef]
  62. Miura, Y.; Shamsudduha, M.; Suppasri, A.; Sano, D. A global multi-sensor dataset of surface water indices from Landsat-8 and Sentinel-2 satellite measurements. Sci. Data 2025, 12, 1253. [Google Scholar] [CrossRef]
  63. Jiang, C.; Ma, C.; Duan, S.; Min, X.; Zhang, Y.; Li, D.; Zhang, X. Monitoring of agricultural drought based on multi-source remote sensing data in Heilongjiang Province, China. J. Integr. Agric. 2025, in press. [Google Scholar] [CrossRef]
  64. Das, A.C.; Shahriar, S.A.; Chowdhury, M.A.; Hossain, M.L.; Mahmud, S.; Tusar, M.K.; Ahmed, R.; Salam, M.A. Assessment of remote sensing-based indices for drought monitoring in the north-western region of Bangladesh. Heliyon 2023, 9, e13016. [Google Scholar] [CrossRef]
  65. Pavur, G.; Lakshmi, V. Observing recent floods and drought in the Lake Victoria Basin using Earth observations and hydrological anomalies. J. Hydrol. Reg. Stud. 2023, 46, 101347. [Google Scholar] [CrossRef]
  66. Cai, S.; Zuo, D.; Wang, H.; Xu, Z.; Wang, G.; Yang, H. Assessment of agricultural drought based on multi-source remote sensing data in a major grain producing area of Northwest China. Agric. Water Manag. 2023, 278, 108142. [Google Scholar] [CrossRef]
  67. Gago, J.; Douthe, C.; Coopman, R.E.; Gallego, P.P.; Ribas-Carbo, M.; Flexas, J.; Escalona, J.; Medrano, H. UAVs challenge to assess water stress for sustainable agriculture. Agric. Water Manag. 2015, 153, 9–19. [Google Scholar] [CrossRef]
  68. Satapathy, T.; Ramadas, M.; Dietrich, J. A novel agricultural drought monitoring framework using remote sensing products. In Proceedings of the EGU General Assembly 2021, Online Conference, 19–30 April 2021. EGU21-10228. [Google Scholar] [CrossRef]
  69. Gaznayee, H.A.A.; Zaki, S.H.; Al-Quraishi, A.M.F.; Aliehsan, P.H.; Hakzi, K.K.; Razvanchy, H.A.S.; Riksen, M.; Mahdi, K. Integrating Remote Sensing Techniques and Meteorological Data to Assess the Ideal Irrigation System Performance Scenarios for Improving Crop Productivity. Water 2023, 15, 1605. [Google Scholar] [CrossRef]
  70. Barreales, D.; Capitão, S.; Bento, A.A.; Casquero, P.A.; Ribeiro, A.C. Adapting Almond Production to Climate Change through Deficit Irrigation and Foliar Kaolin Application in a Mediterranean Climate. Atmosphere 2023, 14, 1593. [Google Scholar] [CrossRef]
  71. Stagno, F.; Consoli, S.; Licciardello, F.; Virga, G.; Barbagallo, S.; Motisi, A. Water Use Efficiency in a Deficit-Irrigated Orange Orchard. Horticulturae 2024, 10, 498. [Google Scholar] [CrossRef]
  72. Urlić, B.; Runjić, M.; Mandušić, M.; Žanić, K.; Vuletin Selak, G.; Matešković, A.; Dumičić, G. Partial Root-Zone Drying and Deficit Irrigation Effect on Growth, Yield, Water Use and Quality of Greenhouse Grown Grafted Tomato. Agronomy 2020, 10, 1297. [Google Scholar] [CrossRef]
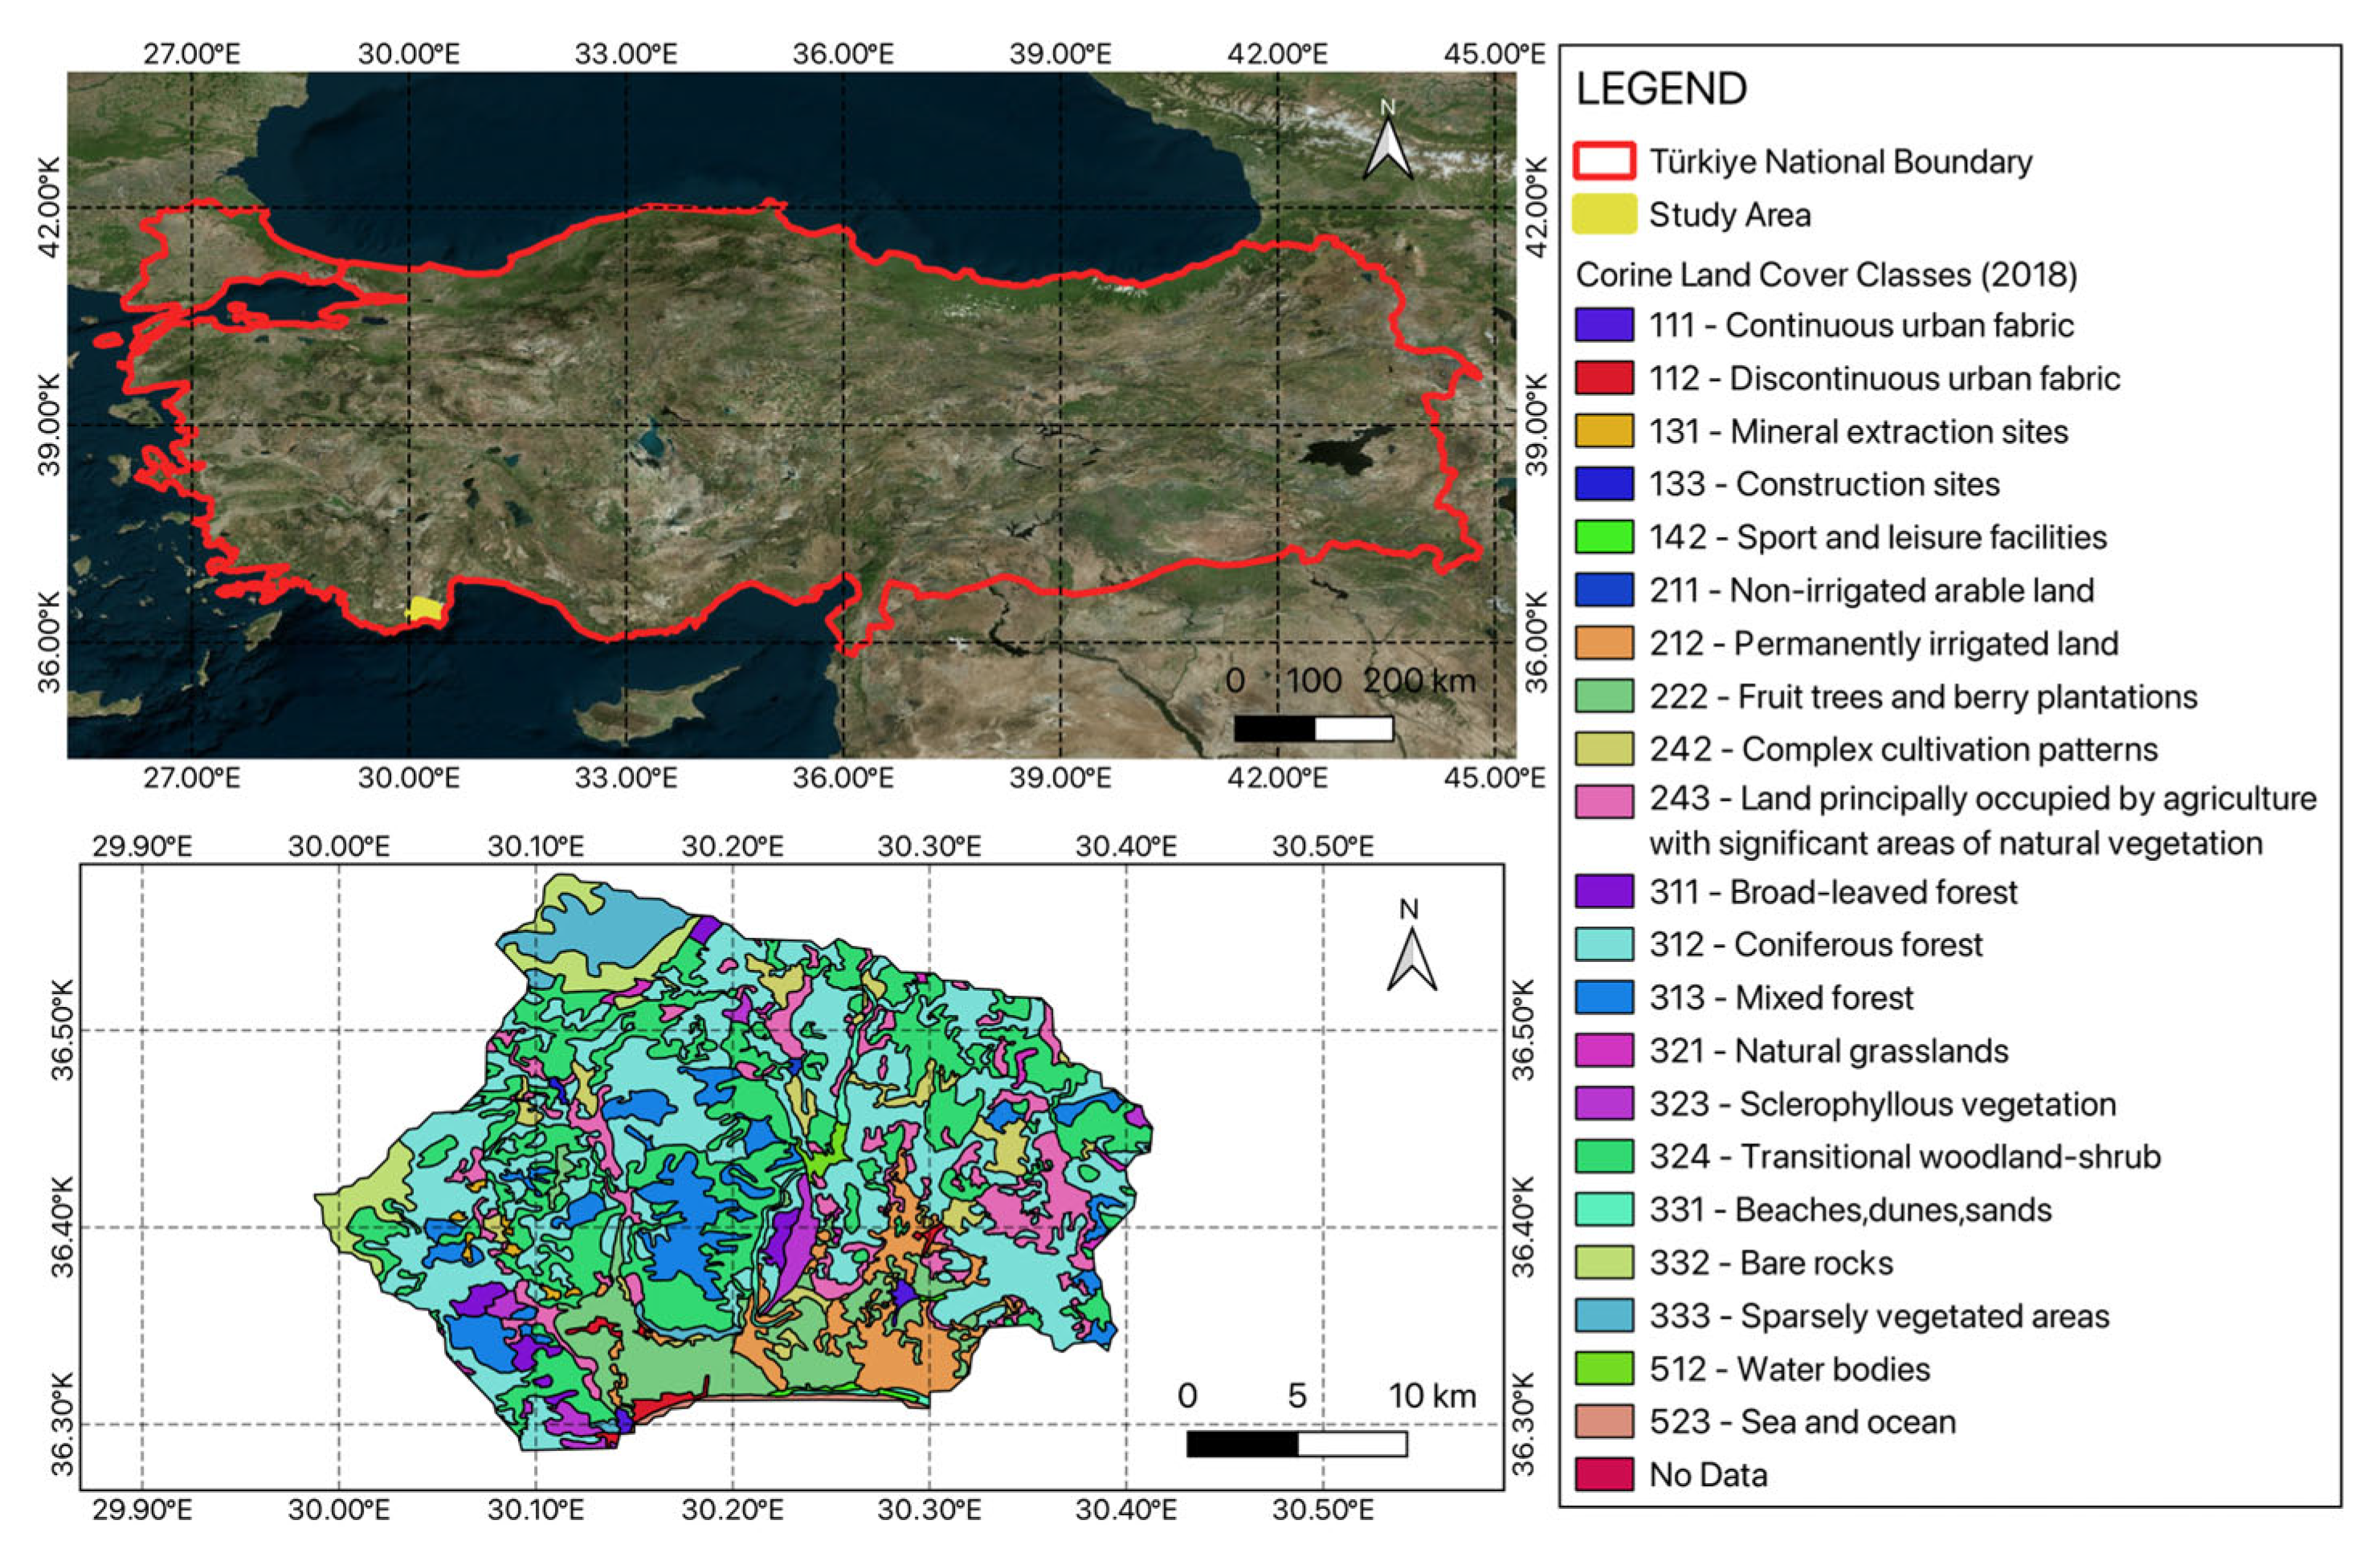
Figure 1. Location of the study area within Türkiye and corresponding CORINE Land Cover (2018) classification.
Hydrology 12 00288 g001
Figure 2. Annual time series of SM, LST, and P in the AOI (2001–2023).
Hydrology 12 00288 g002
Figure 3. Annual and seasonal soil moisture (SM) in the AOI (2016–2023).
Hydrology 12 00288 g003
Figure 4. Seasonal time series of SM, LST, and P in the Antalya Agricultural Basin (2001–2023).
Hydrology 12 00288 g004
Figure 5. Methodological framework for agricultural drought assessment in the AOI.
Hydrology 12 00288 g005
Figure 6. NDDI values annual and seasonal averages between 2001 and 2023.
Hydrology 12 00288 g006
Figure 7. PCI values annual and seasonal averages between 2001 and 2023.
Hydrology 12 00288 g007
Figure 8. TCI values annual and seasonal averages between 2001 and 2023.
Hydrology 12 00288 g008
Figure 9. VHI values annual and seasonal averages between 2001 and 2023.
Hydrology 12 00288 g009
Figure 10. VCI values annual and seasonal averages between 2001 and 2023.
Hydrology 12 00288 g010
Figure 11. SDCI values annual and seasonal averages between 2001 and 2023.
Hydrology 12 00288 g011
Figure 12. SMCI values annual and seasonal averages for the AOI during 2001–2022.
Hydrology 12 00288 g012
Figure 13. Spatial distribution of summer drought severity based on NDDI, VHI, and SDCI indices across the AOI.
Hydrology 12 00288 g013
Table 1. Data sets used in the study.
DATAData UtilitySpatial ResolutionTemporal ResolutionSource
CHIRPSPrecipitation5 kmDaily/MonthlyCHIRPS [44]
MODIS MOD11A2.061 Terra Land
Surface Temperature and Emissivity
LST1 km8-day/MonthlyMODIS [45]
MODIS MOD09A1.061 Terra Surface
Reflectance
NDVI, NDWI500 m8-day/MonthlyMODIS [46]
SMAP 1 kmSoil Moisture1 kmDailyNSIDC [47]
ERA5-LandSoil Moisture 9 km Hourly/MonthlyECMWF [48]
Table 2. Remote sensing-based drought indices and formulations.
Remote Sensing IndicesFormulaNumber
NDVI N I R R e d N I R + R e d (1)
NDWI N I R G r e e n N I R + G r e e n (2)
NDDI N D V I N D W I N D V I + N D W I (3)
VCI N D V I i N D V I m i n N D V I m a x + N D V I m i n × 100 (4)
TCI L S T m a x L S T j L S T m a x L S T m i n × 100 (5)
VHI a   V C I + 1 a T C I (6)
PCI C H I R P S i C H I R P S m i n C H I R P S m a x C H I R P S m i n × 100 (7)
SDCI a × V C I +   β × T C I +   γ   × P C I (8)
SMCI S M t S M m i n S M m a x S M m i n × 100 (9)
Table 3. Drought classification based on NDDI values [29].
Drought ClassNDDI Values
Non Drought−1 < NDDI < 0.2
Mild Drought0.2 ≤ NDDI < 0.3
Moderate Drought0.3 ≤ NDDI < 0.4
Severe Drought0.4 ≤ NDDI < 0.5
Extreme Drought0.5 ≤ NDDI < 1
Table 4. Drought classification thresholds for multi-indices (VCI, TCI, VHI, PCI, SDCI, SMCI) [20].
Drought CategorySDCI, SMCI, TCI, VCI, VHI ValuesPCI Values
Extreme Drought0 < SDCI, SMCI, TCI, VCI, VHI < 100 < PCI < 10
Severe Drought10 ≤ SDCI, SMCI, TCI, VCI, VHI < 2010 ≤ PCI < 20
Moderate Drought20 ≤ SDCI, SMCI, TCI, VCI, VHI < 3020 ≤ PCI < 30
Mild Drought30 ≤ SDCI, SMCI, TCI, VCI, VHI < 4030 ≤ PCI < 40
Near Normal40 ≤ SDCI, SMCI, TCI, VCI, VHI < 6040 ≤ PCI < 50
Non Drought60 ≤ SDCI, SMCI, TCI, VCI, VHI < 10050 ≤ PCI < 100
Table 5. Summary of Long-Term Seasonal and Annual Means (2001–2023).
NDDIVCITCIVHIPCISDCISMCI
Winter0.02460.53986.76773.71540.9457.31889.64
Spring−0.0255.34252.45453.85612.36833.11975.21
Summer−0.01948.95511.49230.1551.12415.64338.44
Autumn−0.01757.67446.35452.00613.46732.74154.33
Annual−0.00855.62849.26752.43316.97534.70564.28
Table 6. Summary of Index-Based Findings (2001–2023).
IndexAnnualWinterSpringSummerAutumn
NDDI * non-drought conditionalDry: 2018
Wet: 2022
Dry: 2018
Wet: 2001
Dry: 2011
Wet: 2022
Dry: 2017
Wet: 2020, 2011
Dry: 2013
Wet: 2007
VCI * near normalDry: 2010
Wet: 2015
Dry: 2005
Wet: 2013
Dry: 2002
Wet: 2018, 2022
Dry: 2008
Wet: 2015
Dry: 2001
Wet: 2015
TCI * near normalDry: 2018, 2020 Wet: 2011Dry: 2014, 2023 Wet: 2004, 2012Dry: 2018
Wet: 2011
Dry: 2001, 2008 Wet: 2015Dry: 2020
Wet: 2014
VHI * near normalDry: 2010
Wet: 2011, 2015
Dry: 2005, 2010
Wet: 2012, 2013
Dry: 2010
Wet: 2011
Dry: 2001, 2008 Wet: 2015 Dry: 2020
Wet: 2014, 2015
PCI * severe and moderate droughtDry: 2008, 2016
Wet: 2009, 2012
Dry: 2008, 2016 Wet: 2009, 2012Dry: 2010
Wet: 2003
Dry: 2008
Wet: 2018
Dry: 2016
Wet: 2001
SDCI * mild droughtDry: 2008, 2016 Wet: 2009, 2012Dry: 2008, 2016 Wet: 2009, 2012Dry: 2010
Wet: 2003, 2011
Dry: 2008
Wet: 2015, 2019
Dry: 2016
Wet: 2006
SMCI * non-droughtDry: 2021
Wet: 2019
Dry: 2008
Wet: 2009, 2019
Dry: 2021
Wet: 2011
Dry: 2008
Wet: 2015
Dry: 2020
Wet: 2006
The asterisk (*) indicates the dominant drought category for each index.
Table 7. Annual and seasonal correlation coefficients among drought indices (2001–2023).
PairAnnualWinterSpringSummerAutumn
NDDI–PCI0.069−0.011−0.162−0.0460.015
NDDI–SDCI0.074−0.024−0.204−0.0820.104
NDDI–SMCI0.070.208−0.118−0.1080.118
NDDI–TCI0.053−0.013−0.251−0.1430.126
NDDI–VCI0.093−0.0530.069−0.0060.272
NDDI–VHI0.069−0.053−0.201−0.0850.184
PCI–SDCI0.9390.9640.8820.7830.909
PCI–SMCI0.7050.4140.6890.8230.696
PCI–TCI0.7560.3780.6850.6840.636
PCI–VCI0.3710.003−0.0450.5000.420
PCI–VHI0.7280.1740.6050.6670.592
SDCI–SMCI0.8510.3830.8470.8910.872
SDCI–TCI0.9230.4860.9050.8990.888
SDCI–VCI0.570.2440.2250.8530.721
SDCI–VHI0.9190.4290.9090.9860.874
SMCI–TCI0.9160.5220.8510.8320.874
SMCI–VCI0.48−0.2550.1240.6660.75
SMCI–VHI0.8890.0150.8210.8450.875
TCI–VCI0.5370.0790.0330.5810.788
TCI–VHI0.9740.5150.9220.8920.975
VCI–VHI0.7130.8950.4190.8860.904
Table 8. Summary of Recommended Measures for Improving Irrigation Efficiency in Semi-Arid Agricultural Basins.
Measure TitleDescription and PurposeExpected Benefit
Traditional Deficit Irrigation (TDI)Applies less water than full evapotranspiration, targeting stages less sensitive to water stress.Expands irrigable area under limited water availability; maintains acceptable yields.
Partial Root Zone Drying (PRD)Alternates irrigation sides of the root zone, triggering Abscisic Acid (ABA) signals to reduce transpiration.Enhances water-use efficiency while maintaining plant health and yield.
Irrigation Infrastructure RehabilitationReplaces open-channel systems with pressurized closed-pipe networks.Reduces losses from evaporation and seepage; improves delivery control.
Parcel Transmission Lines and Field ValvesInstalls pipelines and control valves at the farm level to deliver and measure irrigation water.Enables precise water delivery and individual consumption monitoring.
Supervisory Control and Data Acquisition systems (SCADA)-Based Automation and TelecontrolIntroduces centralized and field-level control of pumps, valves, flow, and pressure through remote sensing and data logging.Optimizes water distribution and reduces unauthorized use or system inefficiencies.
Meteorological Station IntegrationDeploys on-site weather stations to collect local climate data for irrigation planning.Supports climate-based, demand-driven irrigation scheduling.
Water Measurement and MeteringImplements flow meters at field, intake, and mainline points to measure consumption accurately.Enables transparent pricing and identifies leakages or unaccounted use.
Disclaimer/Publisher’s Note: The statements, opinions and data contained in all publications are solely those of the individual author(s) and contributor(s) and not of MDPI and/or the editor(s). MDPI and/or the editor(s) disclaim responsibility for any injury to people or property resulting from any ideas, methods, instructions or products referred to in the content.