1. Introduction
The Mediterranean climate is characterized by its accentuated inter-annual variability with hot and dry summers and mild and rainy winters. Moreover, the Mediterranean region is considered one of the world’s hot spots of climate change. At the end of this century, climate models project an increase in air temperature (ranging between 2.2 and 5.1 °C), a decrease in rainfall (ranging between 4% and 27%), and an increase in drought periods [
1]. Consequently, climate change impacts on the Mediterranean region will particularly affect the availability of water resources.
In Alentejo and Algarve, in southern Portugal, where a Mediterranean climate prevails, the availability of water relies on man-made infrastructures, such as dams and reservoirs, which are strategic elements for securing urban and industrial water supply, irrigation, and energy generation due to the challenges presented by water scarcity in this region [
2,
3,
4,
5]. However, the construction of reservoirs alters the water balance of the region and increases the loss of water resources to the atmosphere through evaporation. Evaporation from an open water body, also known as lake evaporation and referred to as reservoir evaporation throughout this paper, is one of the most important components of the water balance. According to statistics, the annual evaporation losses of the reservoirs in arid and semiarid regions account for about 40% of the total usage volume [
6].
Classical studies estimating evaporation can use different approaches, including aerodynamic mass transfer formulations, energy balance formulations, or a combination of both. Based on these approaches, various methods have been developed for quantifying evaporation in reservoirs, which are classified according to theoretical developments, as discussed by [
7]: (1) water balance applied to the water body, (2) energy balance applied to the water body in the reservoir, (3) aerodynamic functions (mass transfer), (4) hybrid with energy balance and aerodynamic, (5) thermic as a function of the temperature, and (6) direct measurements. Most of these methods have significant limitations. Methods based on energy balance depend on energy sources that can be solar radiation, atmospheric radiation, the sensible heat of the overlying air layer, and/or energy stored in the water body. All the methods require site-specific measurements of several meteorological variables, such as air/water temperature, humidity, wind speed, and/or solar radiation, that are not commonly available at the reservoir’s water surface [
8,
9].
This paper presents and discusses six of these methods. The conservation energy law accounts for incoming and outgoing energy, which are balanced by the amount of energy stored in the system.
The energy balance herein considered can be expressed as
where
is the net radiation,
is the heat storage change in the water body,
H is the sensible heat flux,
is the latent heat flux,
is the net heat flux carried by surface water and groundwater and,
is the net heat flux resulting from precipitation. All fluxes are in units of W m
.
The last two terms of Equation (
1) are usually neglected because of their relatively small magnitudes compared to the other terms in the balance [
10,
11,
12]. Consequently, the energy balance equation can be simplified:
One of many approaches is the relation between the flux of sensible heat (
H) and the latent heat flux (
) through the Bowen ratio (
) (
Table 1) [
13,
14]. Although some limitations have been identified in previous research [
8,
15,
16,
17], the Bowen Ratio Energy Budget (BREB) method has been applied and selected as the reference. This method is generally regarded as one of the most robust and accurate techniques for determining evaporation [
8,
18,
19,
20]. BREB-derived evaporation estimates are typically within 10% of true values when averaged over a season and within 15% when averaged over a month [
8,
21].
The Mass Transfer method (MT) (
Table 1) [
22,
30] is one of the most widely used approaches for estimating open water evaporation due to its simplicity and reasonable accuracy. The input variables are wind speed and the difference of vapor pressure between actual and saturated vapor pressure [
31]. This method assumes that the evaporation rates are a linear function of the wind speed at 2 m above the water surface, the difference between the vapor pressure at the water surface and the atmosphere, and the empirical mass transfer coefficient. The mass transfer coefficient,
N, is usually site-dependent on various factors such as the lake shape, location and height of meteorological measurements, and climatic conditions [
15]. An example of an equation to calculate
N as a function of surface area is
for the Lake Mirror, Lake Hefner, Lake Mead and Lake Vergoritis reservoirs ([
15,
18,
32]).
Penman [
22,
33] developed a combined approach of the Mass Transfer and Energy Budget methods that eliminated the need for water surface temperature in estimating open water evaporation. The Penman equation (
Table 1) consists of two terms, which are commonly referred as the “energy term” and the “aerodynamic term”. The first term represents the minimum possible evaporation rate, which is also known as the “equilibrium rate”. The second term accounts for the influence of wind on evaporation through a wind function and the drying capacity of the atmosphere. The success of the Penman equation (PEN) in various locations is due to its solid physical foundation because it combines the Mass Transfer and Energy Budget methods [
34].
Priestley and Taylor [
24] proposed a simpler version of Penman’s equation by considering evaporation as a function of the energy term only, as they believed the aerodynamic term could be approximated as a fixed fraction of the total evaporation. Suggesting that the aerodynamic term contributes 21% of the total evaporation, then an empirically derived parameter,
, with an averaged value of 1.26, was introduced for the energy component [
35]. The Priestley–Taylor equation (PT) (
Table 1) does not require wind speed data or the determination of the wind function for its application. Ref. [
25] formulated the PT method as a truncated version of the Penman equation, where the aerodynamic component was dropped, but a coefficient greater than 1.0 is included as a multiplier.
The Thornthwaite method (THOR) (
Table 1) [
26] is a widely used method for estimating monthly potential evapotranspiration. This method correlates mean monthly temperature with evapotranspiration, which is determined from the water balance for valleys with sufficient moisture to maintain active transpiration [
36]. Ref. [
37] provided estimates of lake evaporation using the THOR formula and compared them with estimates from other models, concluding that lake evaporation was underestimated by approximately 20% relative to the other models.
The most used evaporation method is the standard pan evaporation (PE) approach (
Table 1) [
29,
38,
39]. Pan evaporation (measured US class A pan evaporation) has been widely used to monitor reservoir evaporation operationally [
40,
41,
42] and in lake modeling studies [
43]. Commonly, a reduction coefficient is applied to minimize the “oasis effect” caused by the advective heat and account for the large quantities of energy received through the base and sides of the pan. In lake studies [
34,
44], a value of 0.7 for the annual pan coefficient is usually used. However, several authors [
45,
46] state that pan coefficients vary throughout the year and should be calculated for each month individually. While many studies have identified the limitations of this approach [
46,
47,
48,
49], it remains widely used as a source for large-scale validations due to its simplicity and moderate data requirements [
41]. Recently, an interesting study was developed to estimate evaporative losses from reservoirs by subtracting the actual natural evapotranspiration that would have occurred on land from the evaporation caused by the flooded surface [
50]. Re-analyzed climate data have also been used. Ref. [
51] developed linear models (LMs) and random forest models (RFMs) to estimate reservoir evaporation in the Czech Republic.
The direct method has been applied, but, taking into account the great cost of the equipment, it is applied punctually for research aims. As an example, eddy covariance was applied to calculate Alqueva reservoir evaporation, allowing the definition of a pan coefficient for each month [
42].
Ref. [
52] presents a holistic overview of basin water balance, emphasizing reservoir evaporation as a topic of great relevance to researchers, consulting hydrologists, and practicing engineers. The authors highlight several issues associated with traditional methods, particularly the influence of water body heat storage on surface energy fluxes, which is rarely well quantified [
52,
53].
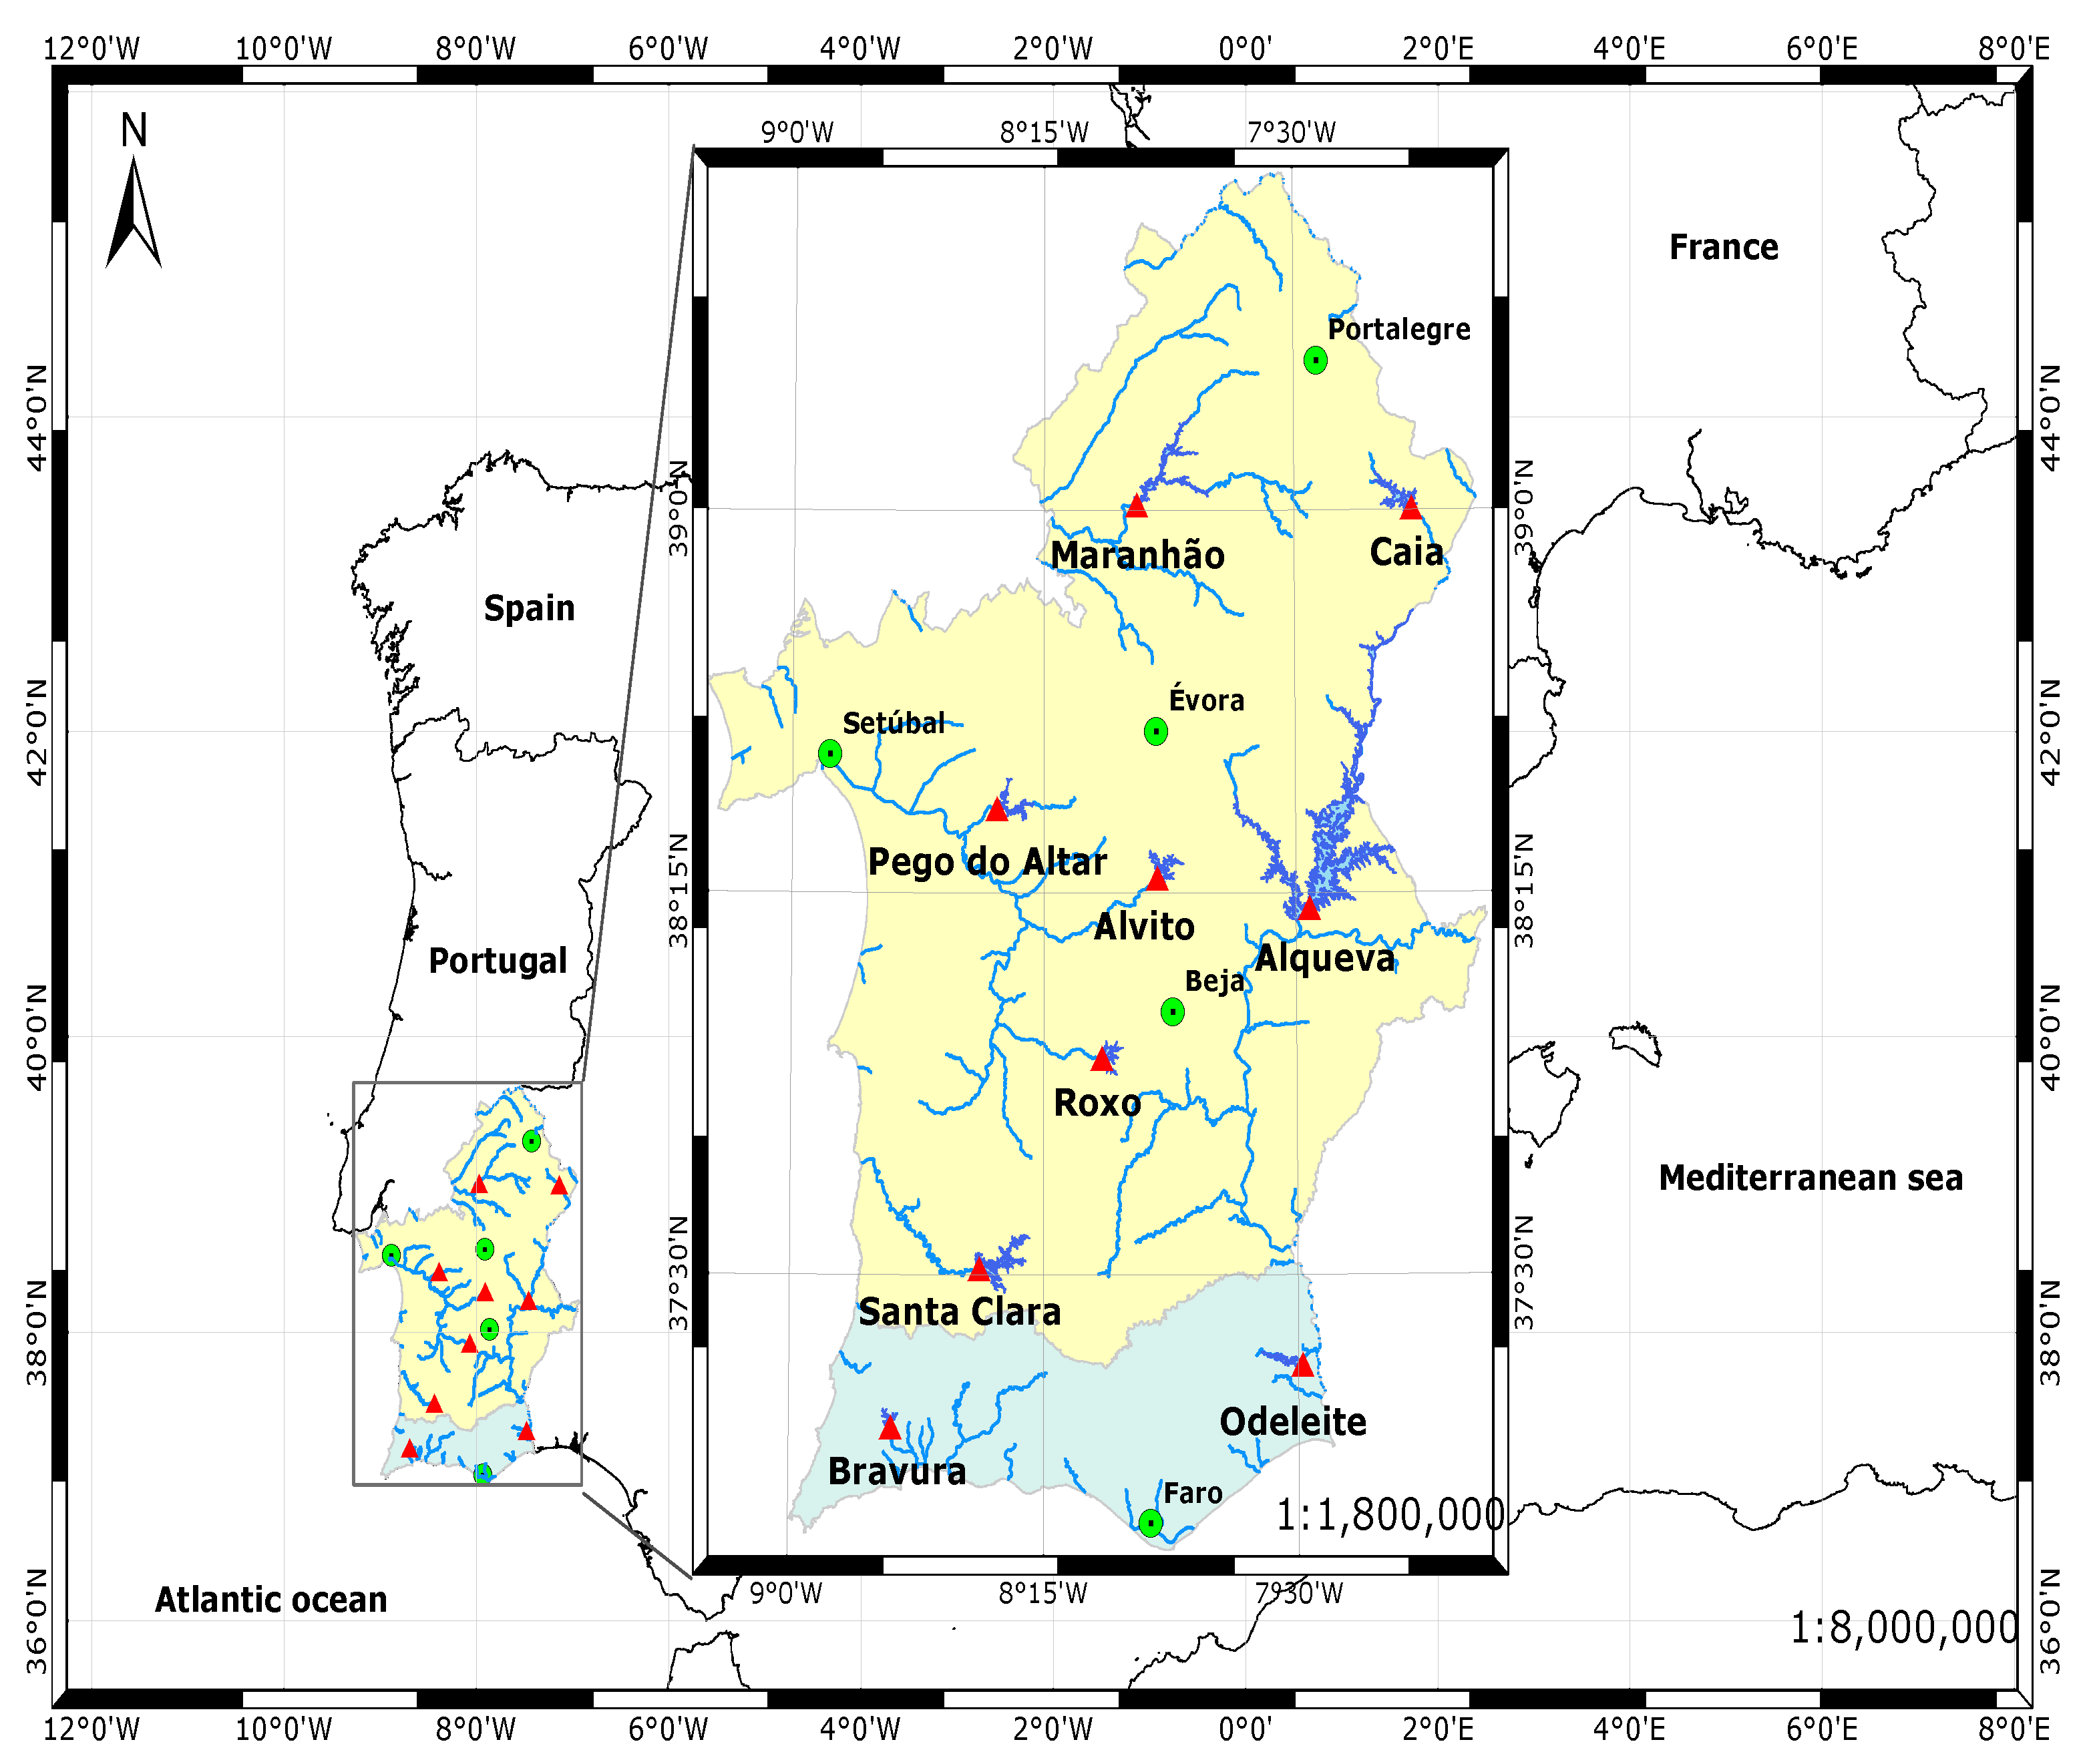
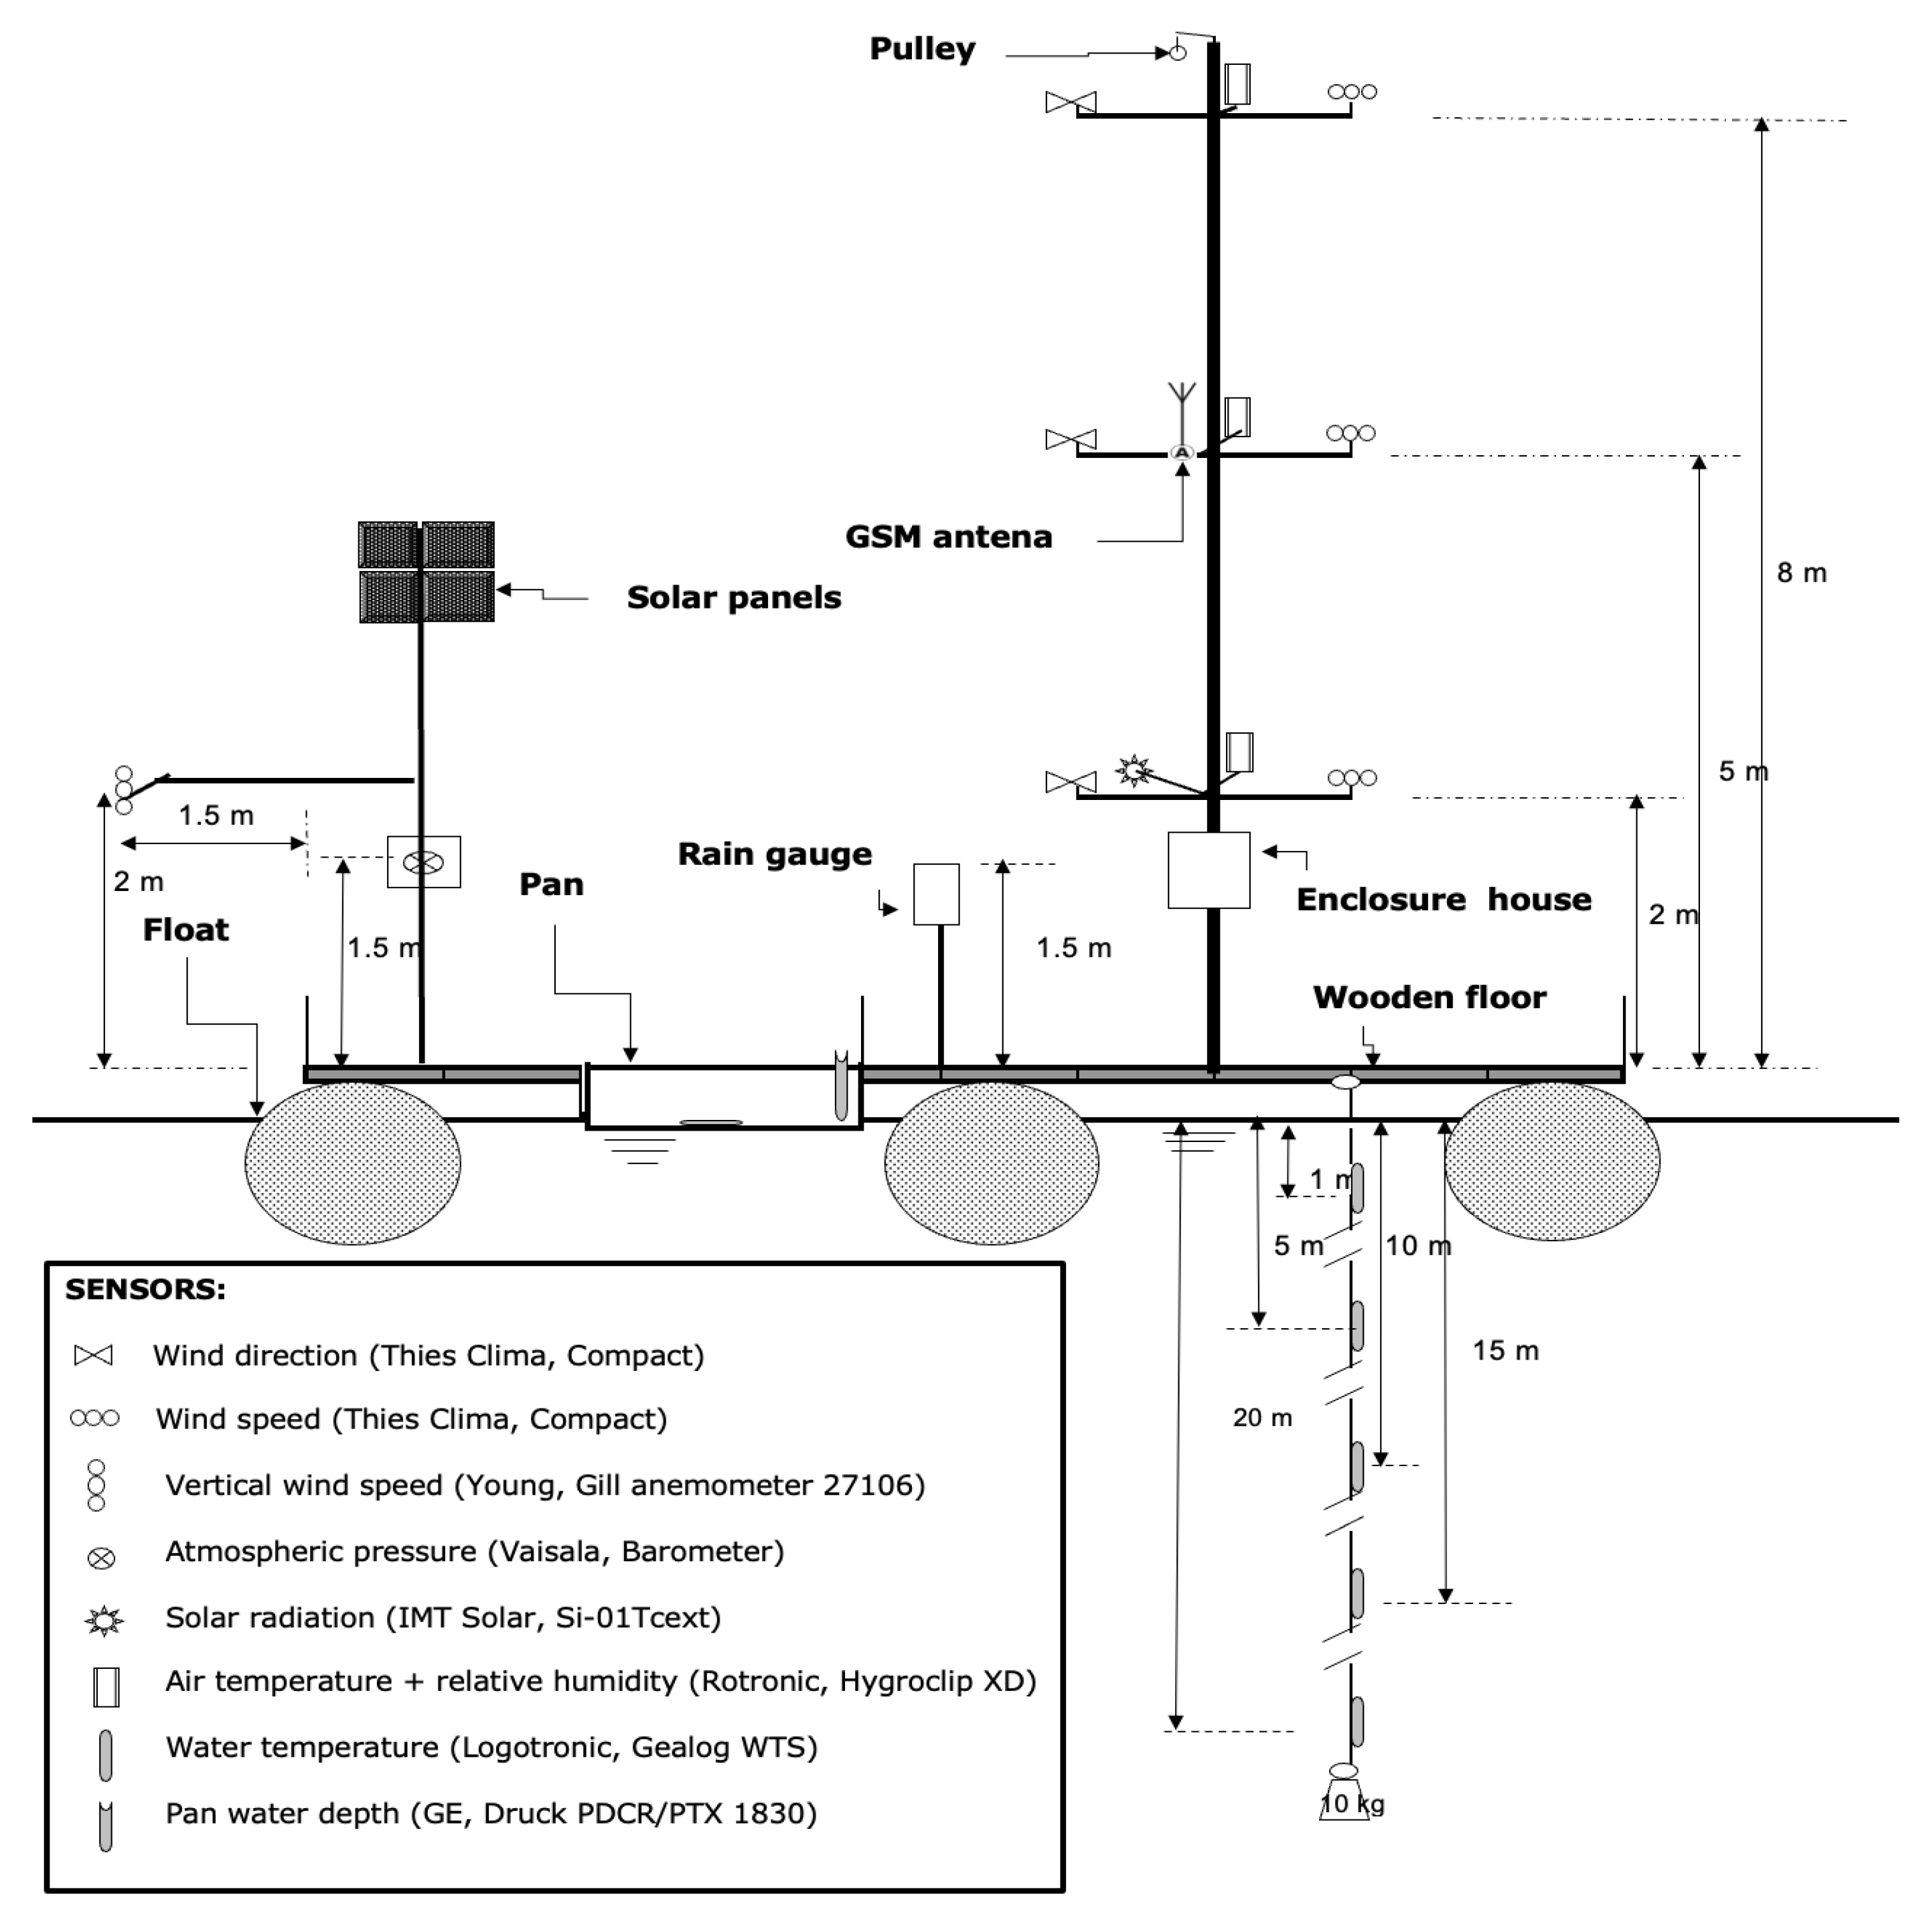
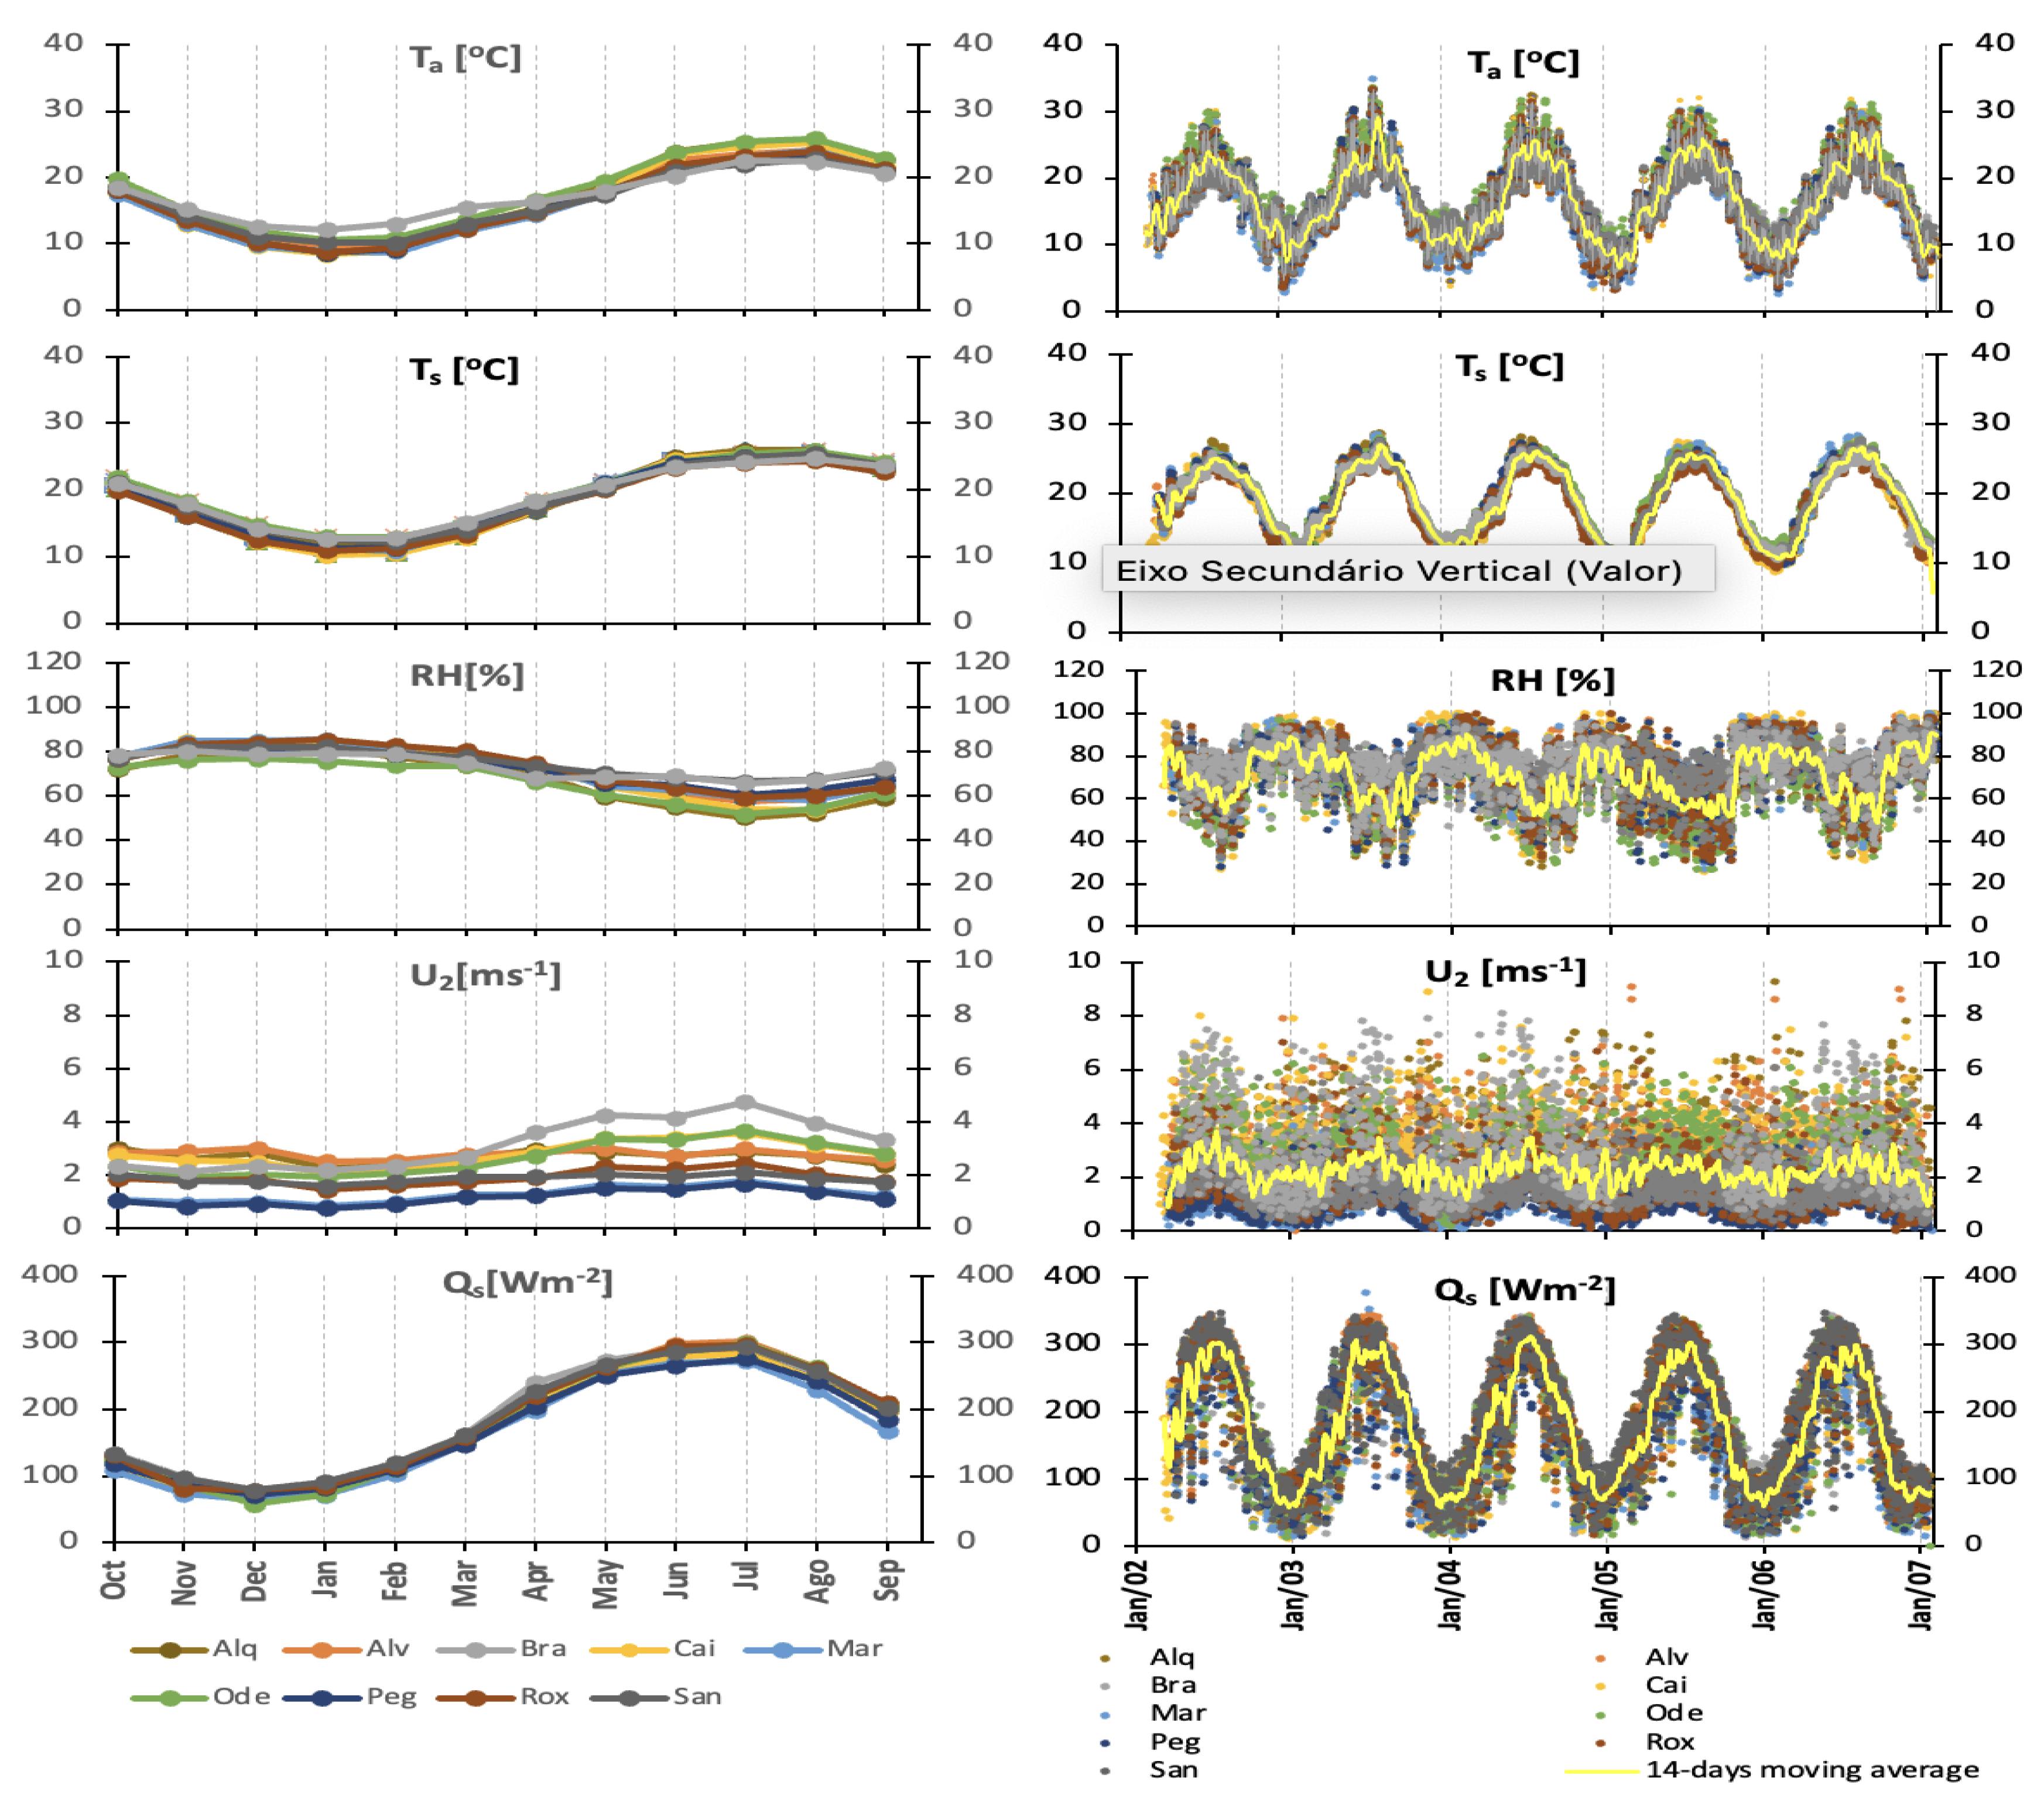
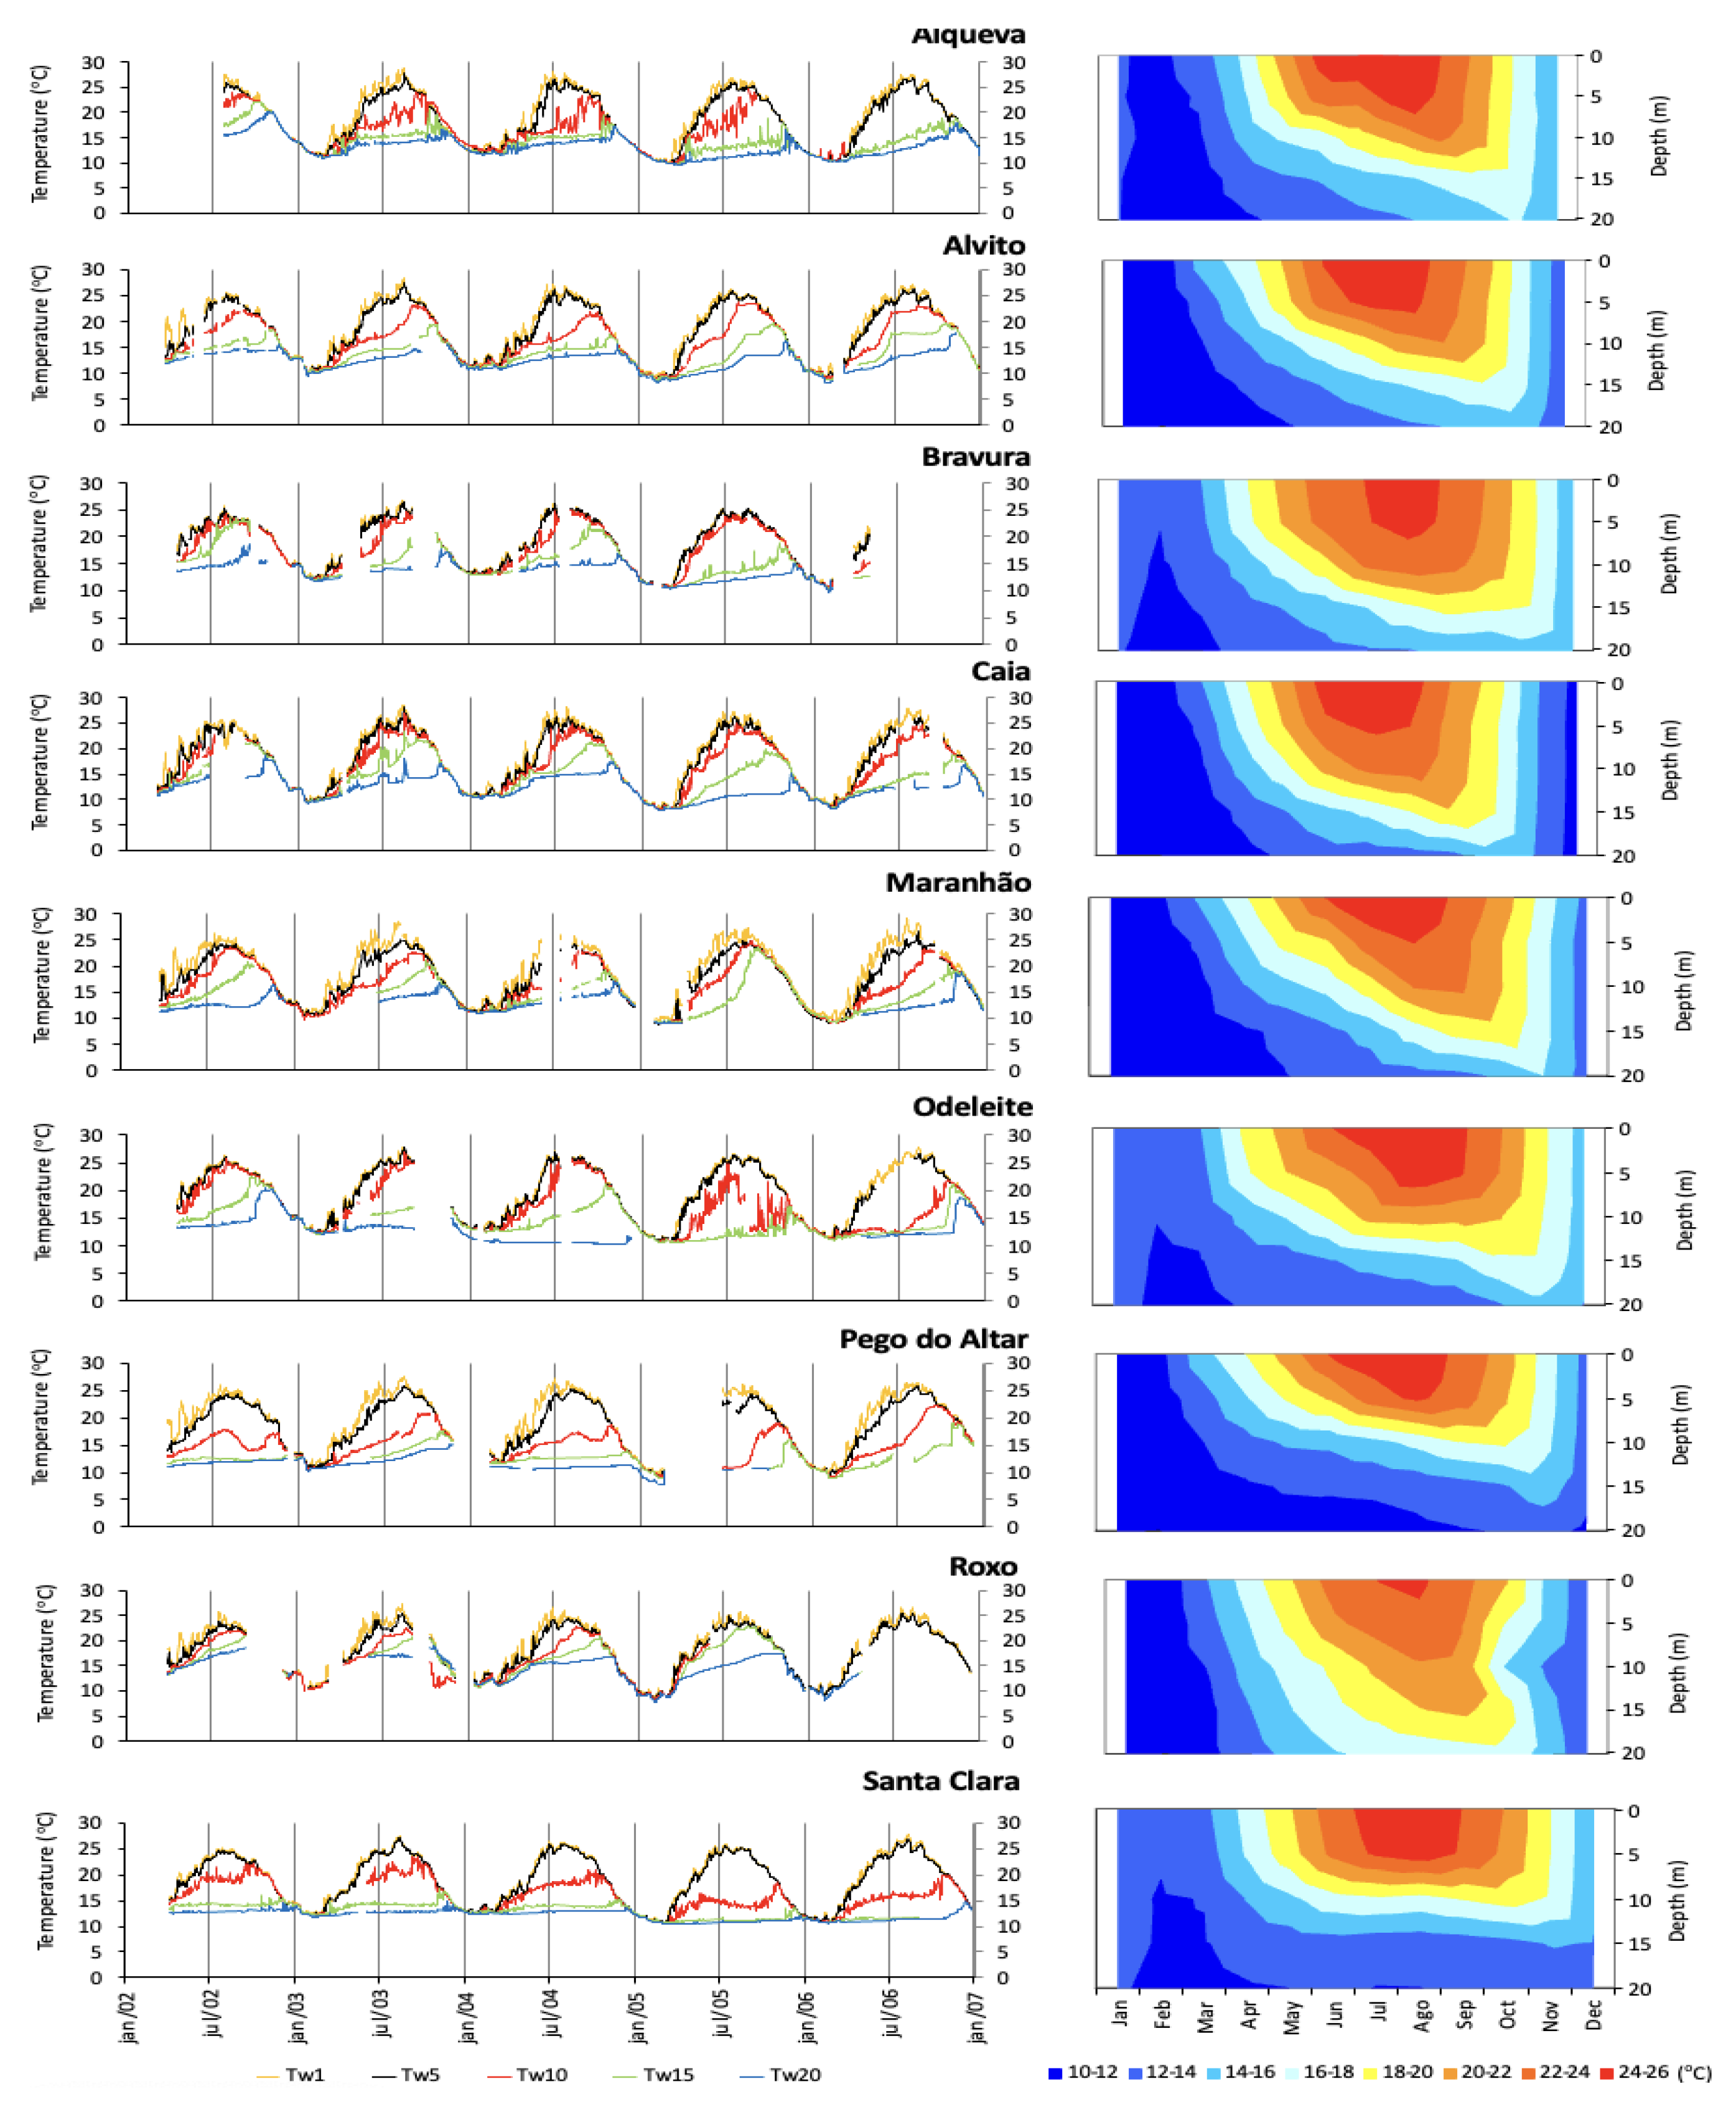
To overcome the limitations mentioned above, this study was based on data collected from floating weather stations on instrumented platforms across nine reservoirs in Alentejo and Algarve for the period 2002–2006. The complementary water temperature profile measurements are collected at the floating platforms, too. This dataset allows researchers to estimate reservoir evaporation at nine reservoirs by the energy balance method, find parameters to apply, and then compare the results of easier to apply and less demanding data-indirect methods [
8,
54,
55], as Mass Transfer (MT), Penman (PEN), Priestley and Taylor (PT), Thornthwaite (THOR), and Pan Evaporation (PE). The results of the energy balance analysis allow for the characterization of reservoir evaporation patterns in southern Portugal. In most reservoirs, the available datasets are limited, and managers require a better understanding of reservoir evaporation. The findings of this study can be applied to other locations with similar climatic conditions. For each specific case, reservoir managers can identify the most appropriate indirect model for assessing evaporative losses and develop recommendations for operational practices in Mediterranean climate regions.
The paper is organized as follows:
Section 1 presented the reservoir evaporation processes and most common methods along with the data source and objectives of this research.
Section 2 describes the study area, the floating stations built in the reservoirs, the dataset and the statistic descriptors to evaluate the performance of indirect methods in relation to the estimation reservoir evaporation obtained by the energy balance and offshore measures. The pattern of reservoir evaporation in southern Portugal, and the results of the monthly benchmarking results, are presented and discussed in
Section 3. Finally,
Section 4 summarizes the major conclusions.
3. Results and Discussion
3.1. Patterns of Reservoir Evaporation in Southern Portugal
Considering the energy balance,
Table 5 shows the annual mean energy fluxes for the nine reservoirs. In the absence of on-site atmospheric radiation (
) measurements, the European Centre for Medium-Range Weather Forecasts (ECMWF) analysis was used (
https://www.ecmwf.int/en/forecasts/charts, last accessed: 21 March 2025). The energy balance closure (EBC) was calculated by
For most reservoirs, the heat storage change () is close to zero, confirming that the net heat flux carried by surface water and groundwater () and the net heat flux resulting from precipitation () can be neglected. The shows good results for almost reservoirs except for Bravura, Caia, and Maranhão. Comparing Bravura and Odeleite, despite Bravura being located under a more Atlantic influence with a different wind pattern and a smaller surface area, the latent heat flux can be overestimated. For the Caia and Maranhão reservoirs, which are located at higher latitudes, the incoming atmospheric radiation may be underestimated when compared to Pego do Altar, which lies further inland at a much higher altitude. These findings allow us to conclude that even for these reservoirs, the net heat flux carried by the surface water and groundwater () and the net heat flux resulting from precipitation () can be neglected.
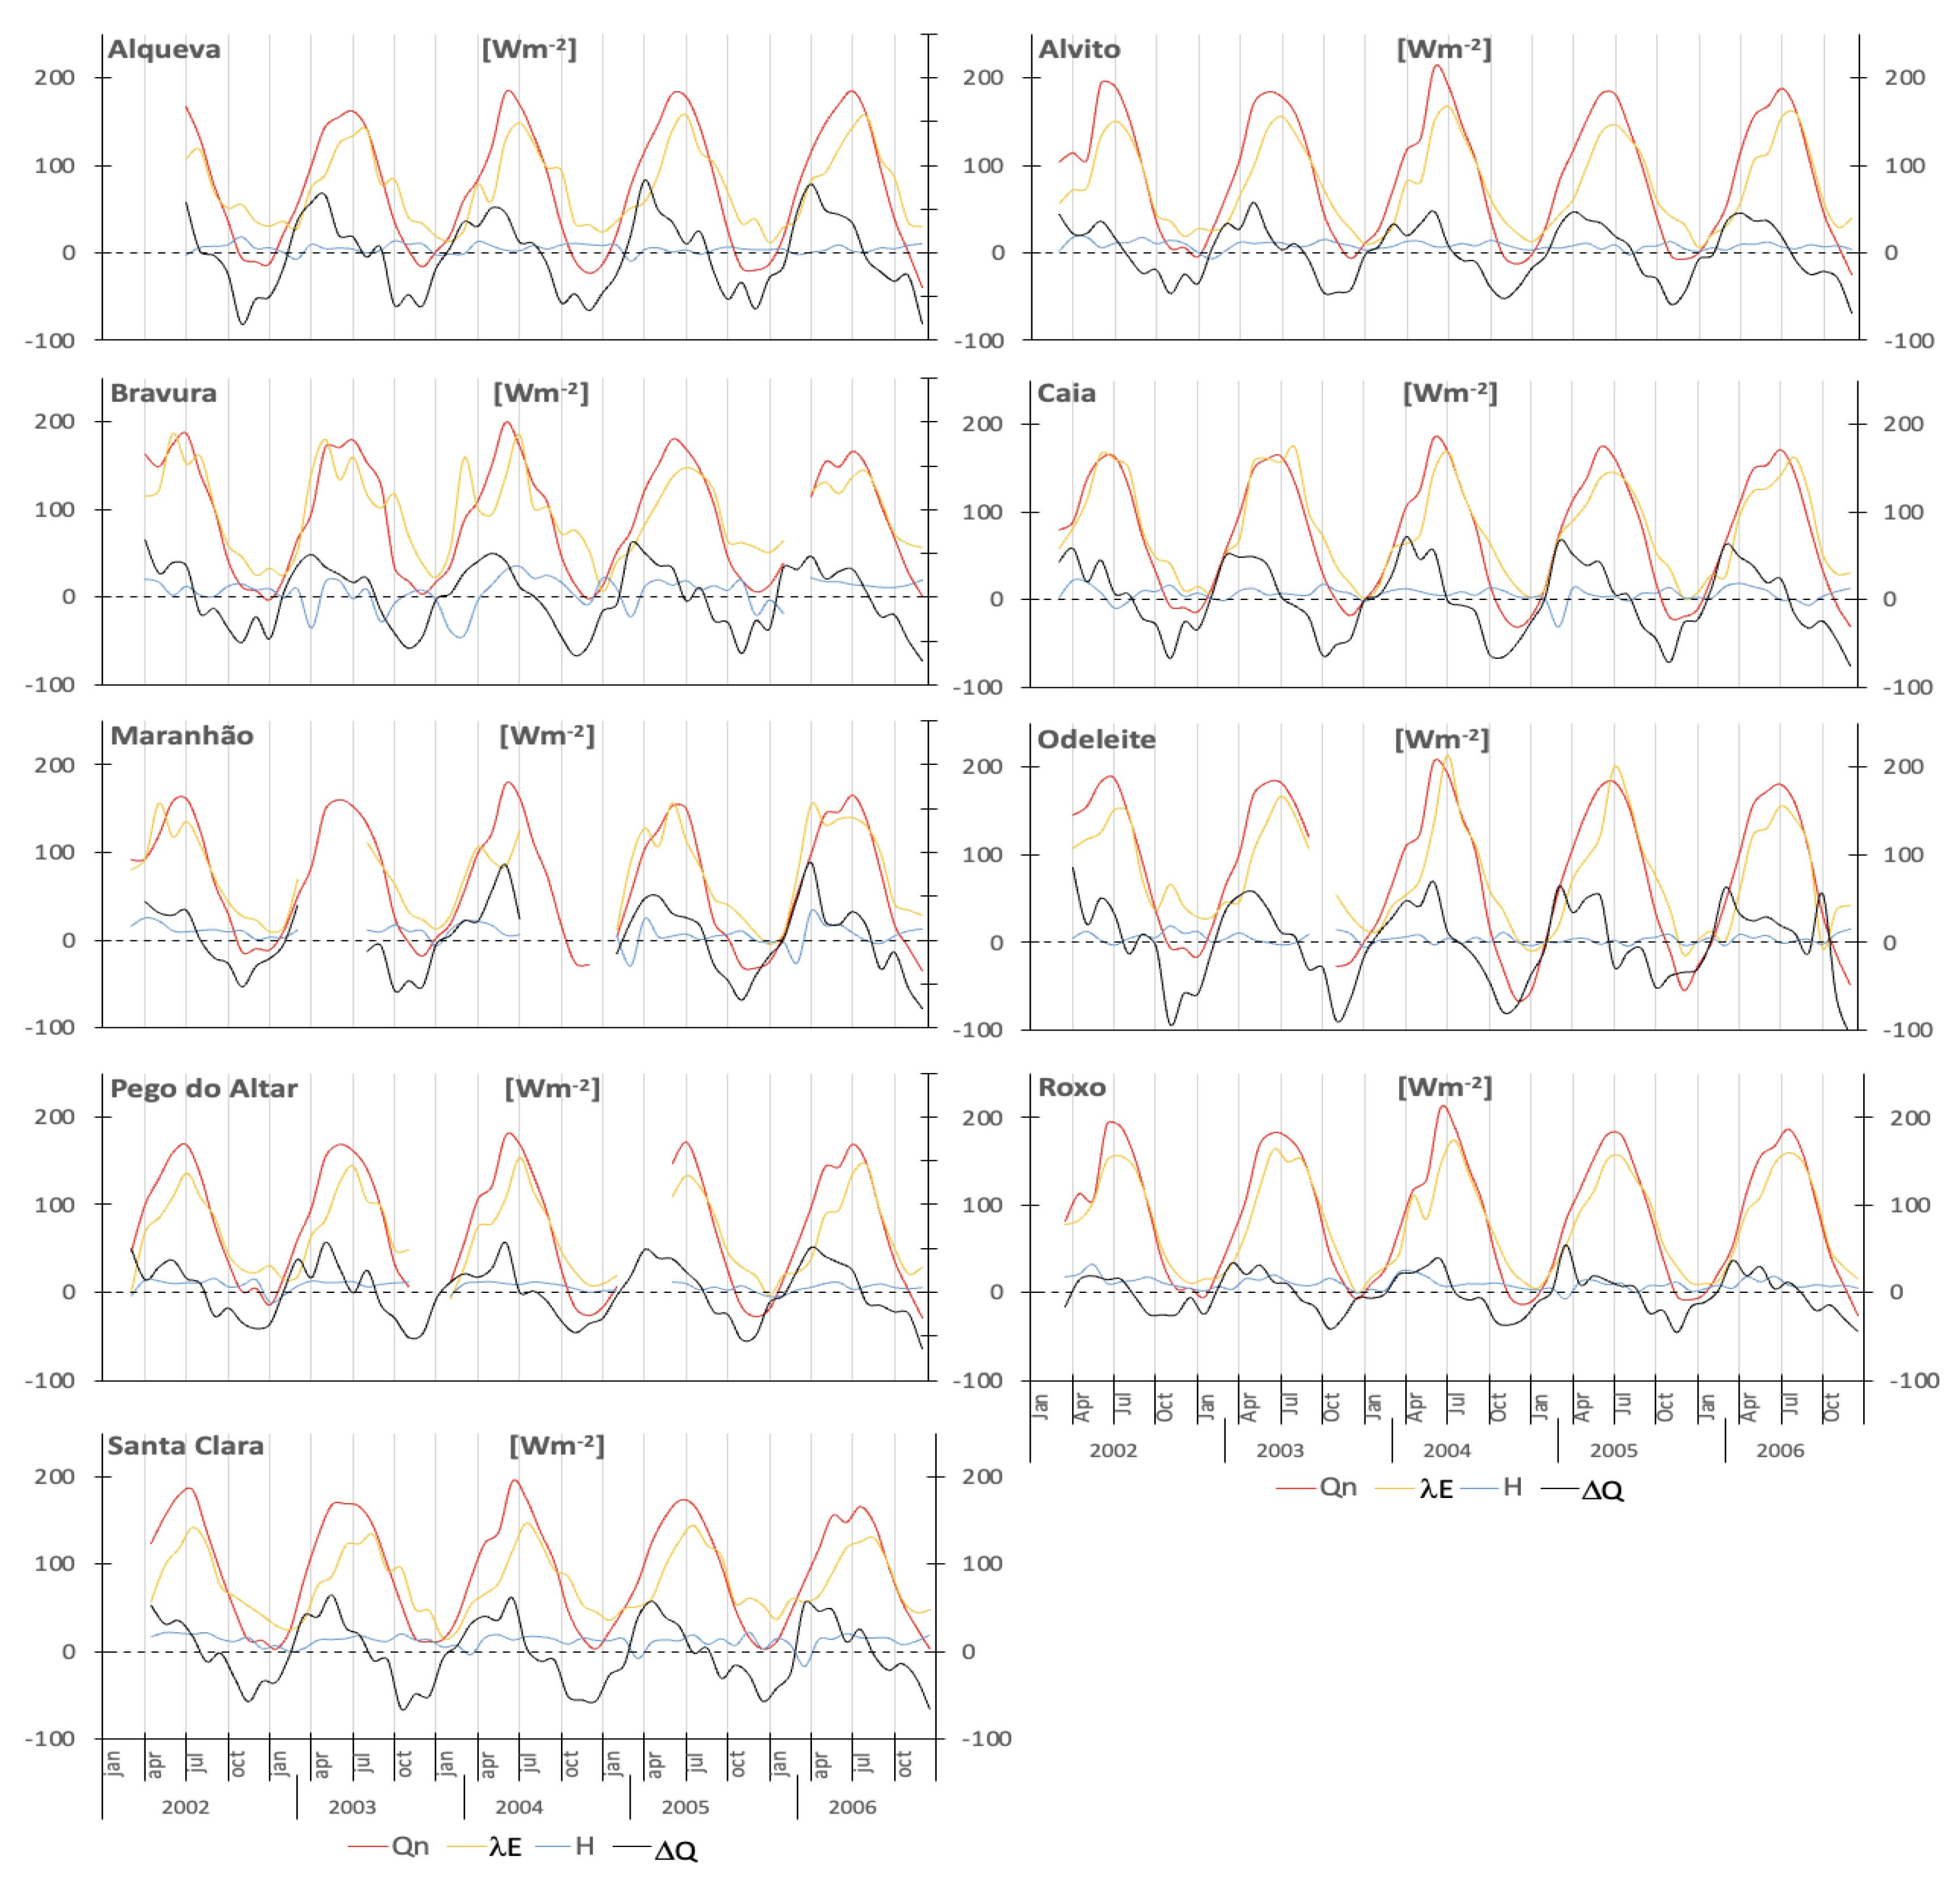
The monthly values for the different components of the heat budget, including net radiation, latent heat, sensible heat, and heat storage change, are illustrated in
Figure 5.
The monthly variation of latent heat flux () exhibits a strong seasonality that aligns with the net radiation (), which is the primary energy source for the heat balance. The maximum flux typically lags the peak values of . On the other hand, the minimum flux is primarily influenced by the heat storage change (). In most reservoirs, the annual approaches zero, indicating a null balance between energy gains and losses throughout the years. The energy dynamics of the reservoirs can be understood by analyzing the gains and losses of energy by the water body over the year. During spring, the reservoirs experience an energy gain and storage phase driven by net radiation and low evaporation rates. Generally, the energy begins to increase from February or March until August, reaching its maximum around April (although this timing can vary across years and reservoirs, sometimes occurring in May or June). From September onwards, the energy storage variation reverses, and the water mass undergoes an energy reduction, typically lasting until January, with the maximum energy loss occurring in November. exhibits large positive and negative values, ranging from 55.2 to 88.8 W m and −45.7 to −93.1 W m, respectively. During autumn, as solar radiation decreases, the energy required for evaporation is sourced from the release of in the form of and, to a lesser extent, H. fluxes display seasonal trends, with the highest values observed in summer, following a similar pattern to solar radiation (). However, in some winter months, negative values of can be observed.
The annual mean
ranges from 68 to 92 W m
for all reservoirs, as shown in
Table 5.
H depends on the temperature difference between the water surface (
) and the air (
).
H has relatively low values compared to other components of the energy balance. It is generally positive since, on average,
is higher than
. Under these conditions (
), the sensible heat flow occurs from the water surface to the atmosphere, resulting in energy loss from the lake.
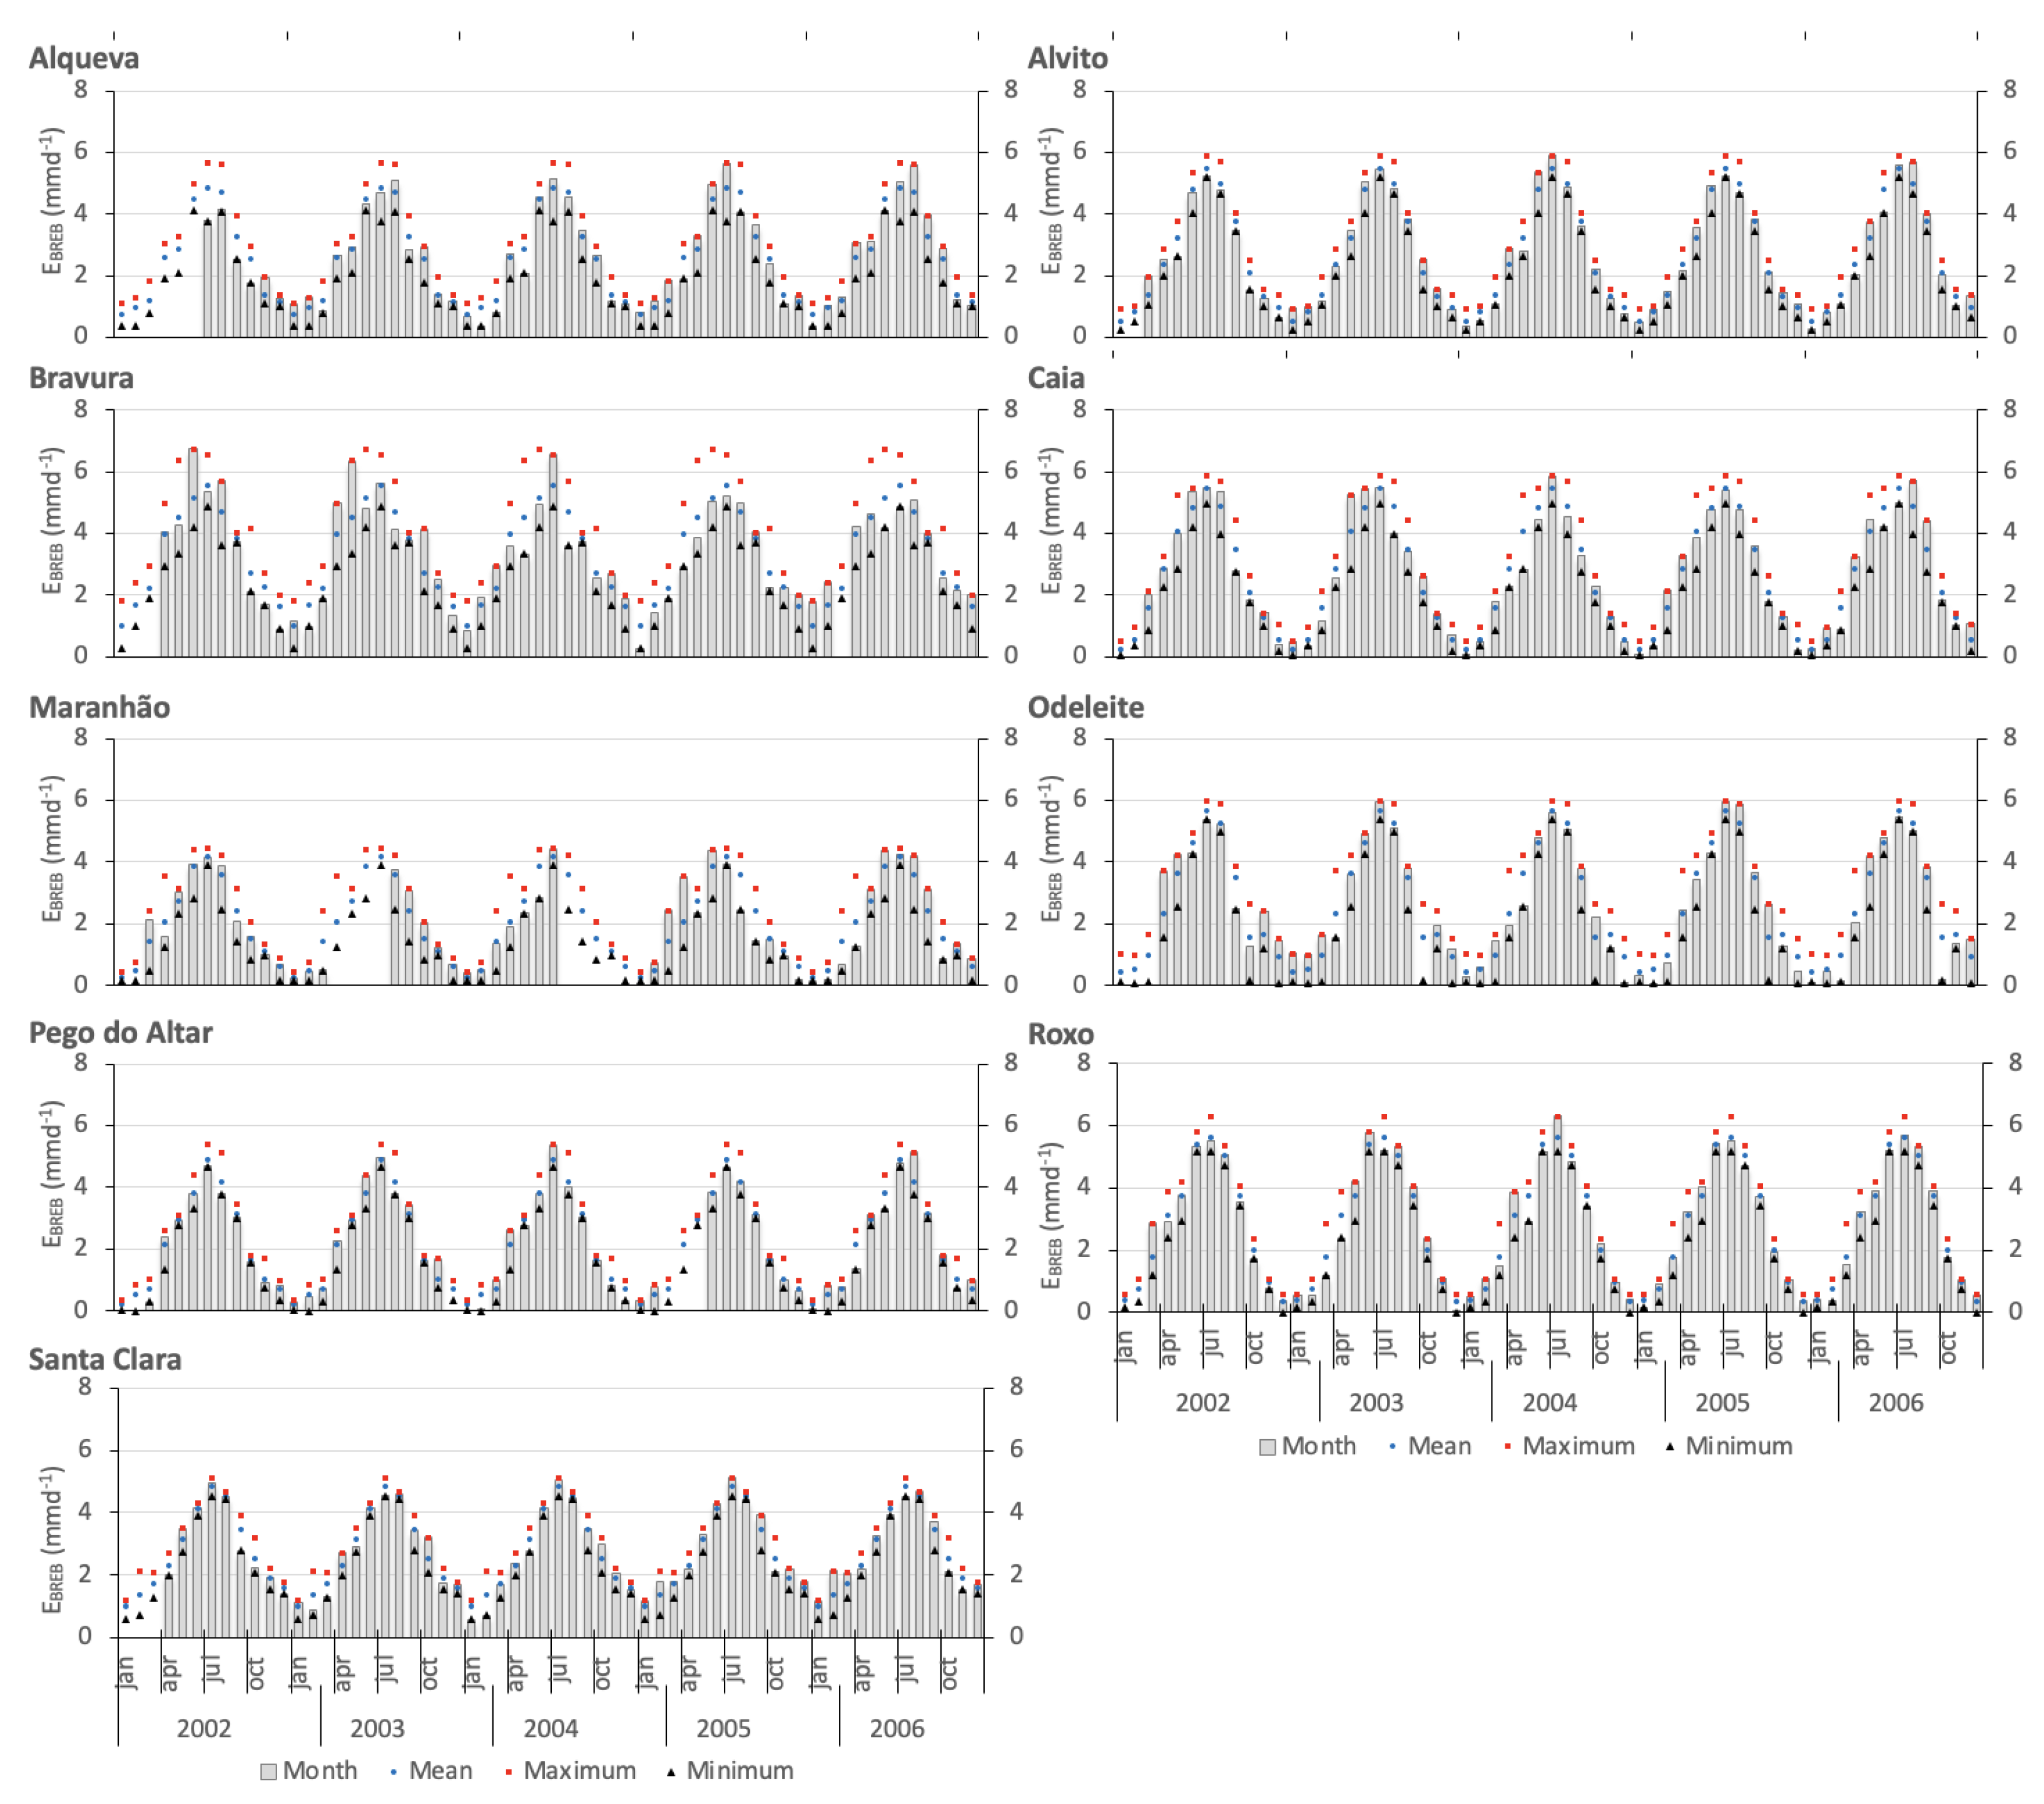
Daily evaporation values were determined for all reservoirs using the BREB method, as described by Equation (3). The monthly evaporation is presented in
Figure 6. To identify possible outliers, the annual cycles of mean, maximum, and minimum evaporation were also presented. Although there are no substantial inter-annual variations in evaporation, a pronounced seasonality is evident. The highest evaporation rates are observed from June to August, while the lowest rates occur between December and February. Generally, the monthly mean evaporation falls within the expected range for each respective month, indicating a reasonable consistency throughout the period.
When comparing the monthly evaporation rates shown in
Figure 7, it is evident that July has the highest evaporation values, while January experiences the lowest rates. The maximum monthly evaporation ranges from 4.4 mm d
in the Maranhão reservoir to 6.7 mm d
in the Bravura reservoir. In general, the minimum monthly evaporation is nearly zero for most reservoirs, except for Alqueva and Santa Clara, which have values ranging from 0.4 to 0.6 mm d
, respectively. Across all reservoirs, the monthly evaporation varies from 0.8 mm d
in winter to 4.0 mm d
in summer with an average of 2.7 mm d
. These values align with other measurements in the Mediterranean region, as reported in studies by [
57] or [
58]. The latter authors studied the Mediterranean region of Sardinia, Italy, and concluded that evaporation ranged from 0.58 mm d
in winter to 4.96 mm d
in summer with an average of 2.63 mm d
.
Figure 8 illustrates the spatial distribution of mean seasonal reservoir evaporation values in southern Portugal. The values were obtained through inverse distance interpolation for the dry and wet semesters, respectively.
Figure 9 displays the spatial distribution of mean annual reservoir evaporation values. The patterns of reservoir evaporation exhibit distinct seasonal and spatial variations. Throughout the year, a clear minimum is observed in the northern part of the region, while the maximum values are concentrated in the southwest Algarve region. This spatial pattern is consistent in both the dry and wet semesters. The annual evaporation losses range from 750 to 1230 mm, showing a significant positive gradient from the northern part of the region toward the southwest Algarve region. This indicates that the reservoirs in the Algarve region experience higher evaporation rates compared to those in the northern areas. These differences can be explained by the higher solar radiation typically observed in the southern areas compared to the north and by the stronger wind regimes along the coastal zones, which enhance evaporation rates.
3.2. Benchmarking of Indirect Methods
Given that the measured parameters required for direct estimation are often unavailable, a monthly benchmarking analysis was conducted to evaluate the performance of different indirect methods for estimating reservoir evaporation. Five evaporation models, as summarized in
Table 1, were applied to compute reservoir evaporation for the nine reservoirs included in this study.
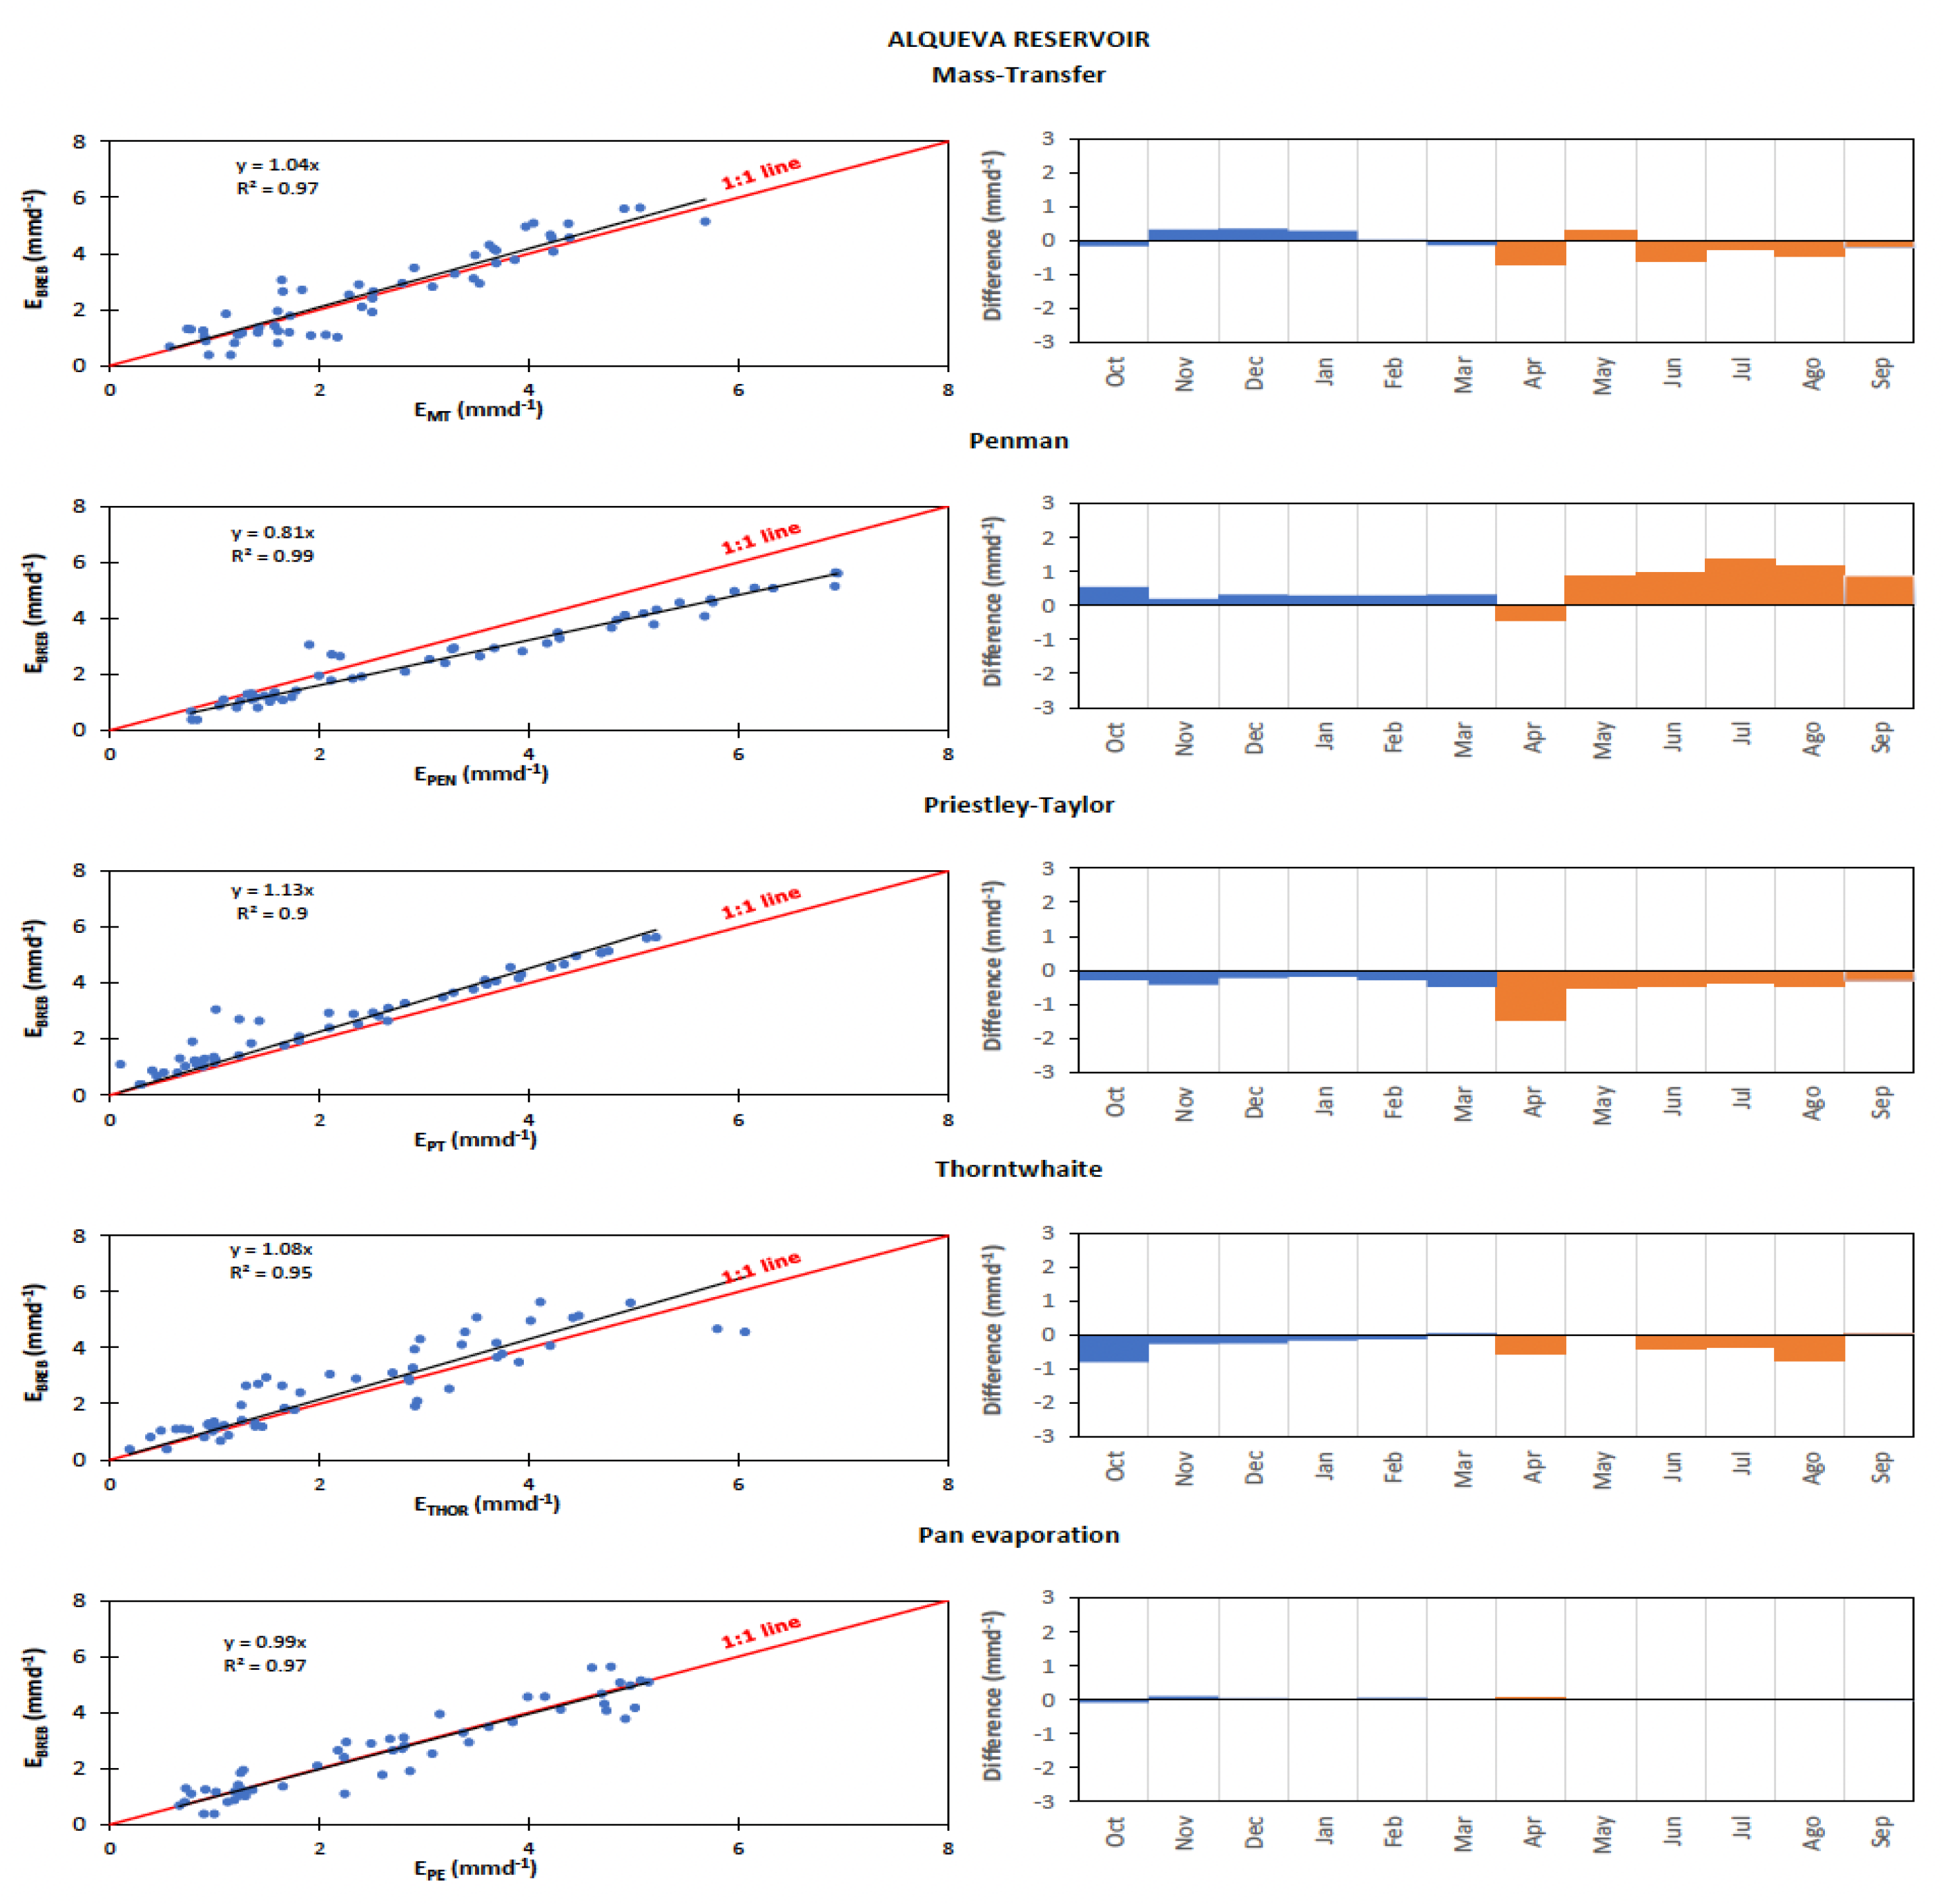
Figure 10 illustrates the comparison between monthly evaporation estimates obtained from the five indirect methods and the evaporation estimated with the BREB method, using the Alqueva reservoir as an example. The figure displays the trend line and the 1:1 line (left) and the differences in average monthly evaporation for both the wet and dry semesters (right).
Table 6 presents the same results for all reservoirs.
Table 7 presents the estimation of the mass transfer coefficient (
N) for each reservoir. There is a strong correlation (
) between the evaporation rates estimated by the Energy Budget method and the Mass Transfer product
. However, variations in
N were observed among the reservoirs, which can be attributed to differences in exposure to prevailing winds and physiographic characteristics of the water bodies. It was observed that the mass transfer coefficient decreases with an increase in the water surface area of the reservoirs, which is consistent with the findings from studies conducted on lakes in the USA (Mirror, Hefner, Mead) [
15] and the Greek lake Vegoritis [
59]. The calculated
N value for these lakes was slightly higher than the values obtained in our study, resulting in higher evaporation rate estimates for those cases. This discrepancy can be attributed to differences in measurement procedures, such as the measurement of atmospheric humidity being conducted on the shore upwind of those lakes, while in our study, all measurements were made offshore in the reservoir.
An overall relationship between
N and the reservoir water surface area (
) was established to be applied in the Mediterranean climate region:
The comparison between monthly evaporation estimated using the MT method and the evaporation estimated using the BREB method is presented in
Figure 10 and
Table 6. The trend lines closely follow the 1:1 line, indicating a high level of accuracy in the MT method’s estimation of evaporation for all nine reservoirs. However, there is a slight underestimation observed for the largest studied reservoir (Alqueva), and some overestimation was observed for the smaller studied reservoir (Bravura). In addition to the differences in reservoir size, the higher wind speeds observed at the Bravura site, as discussed in
Section 3.1, may contribute to these discrepancies in evaporation estimates by the MT method. Regarding the average monthly, the differences were ±1 mm d
for all reservoirs.
In this study, due to specific pan settlement on the floating platform, as previously referred in to
Section 2.2, the measured evaporation at the pan should be identical to real evaporation over the inundated area at the site. The factors that determine high pan evaporation rates usually observed on terrestrial frameworks are minimized here as the pan was placed offshore, on the floating platform, in contact with the water body surface. The best estimates of evaporation using the PEN method are obtained for reservoirs where the wind speed is consistently lower. This can be attributed to the reduced aerodynamic term in the Penman equation, which leads to smaller evaporation estimates and reduces the bias compared to the BREB values. Reservoirs such as Pego do Altar and Santa Clara exhibit nearly zero bias in evaporation estimates when using the PEN method.
Monthly average evaporation rates estimated by the PT method and BREB show a good fit, and it can be observed that in eight out of nine reservoirs, there is a consistent underestimation of evaporation throughout the year. This finding is contrary to what is typically reported in the literature [
8]. The standard coefficient (
) value of 1.26 used in the PT method takes into account the proportion of energy mobilized for evaporation through advection [
60,
61]. However, in our specific conditions, this coefficient seems to be insufficient. The observed underestimations of evaporation using the PT method indicate the need to increase the standard coefficient (
) value by 10%, suggesting that moderate advection occurs at the reservoir sites.
The THOR method, based on the Thornthwaite formula using air temperature measurements only, tended to underestimate evaporation during the dry semester in most reservoirs, except for Maranhão and Pego do Altar, where the fit was good. The underestimation was more pronounced in the Bravura and Santa Clara reservoirs, with average biases of −1.10 mm d and −1.04 mm d, respectively.
In the PE method, the trend lines closely align with the 1:1 line, indicating a strong positive correlation between pan measured evaporation and BREB estimated evaporation for eight reservoirs ( values greater than 0.95). However, in the Maranhão reservoir, the pan measured evaporation exceeded the estimated evaporation by 24%. When considering the average monthly difference, there is nearly zero annual bias in most reservoirs except for the Bravura and Maranhão reservoirs. In Bravura, the dry semester exhibits the highest negative bias (−1.38 mm d), while in Maranhão, the maximum bias is positive (0.59 mm d), also occurring in the dry semester.
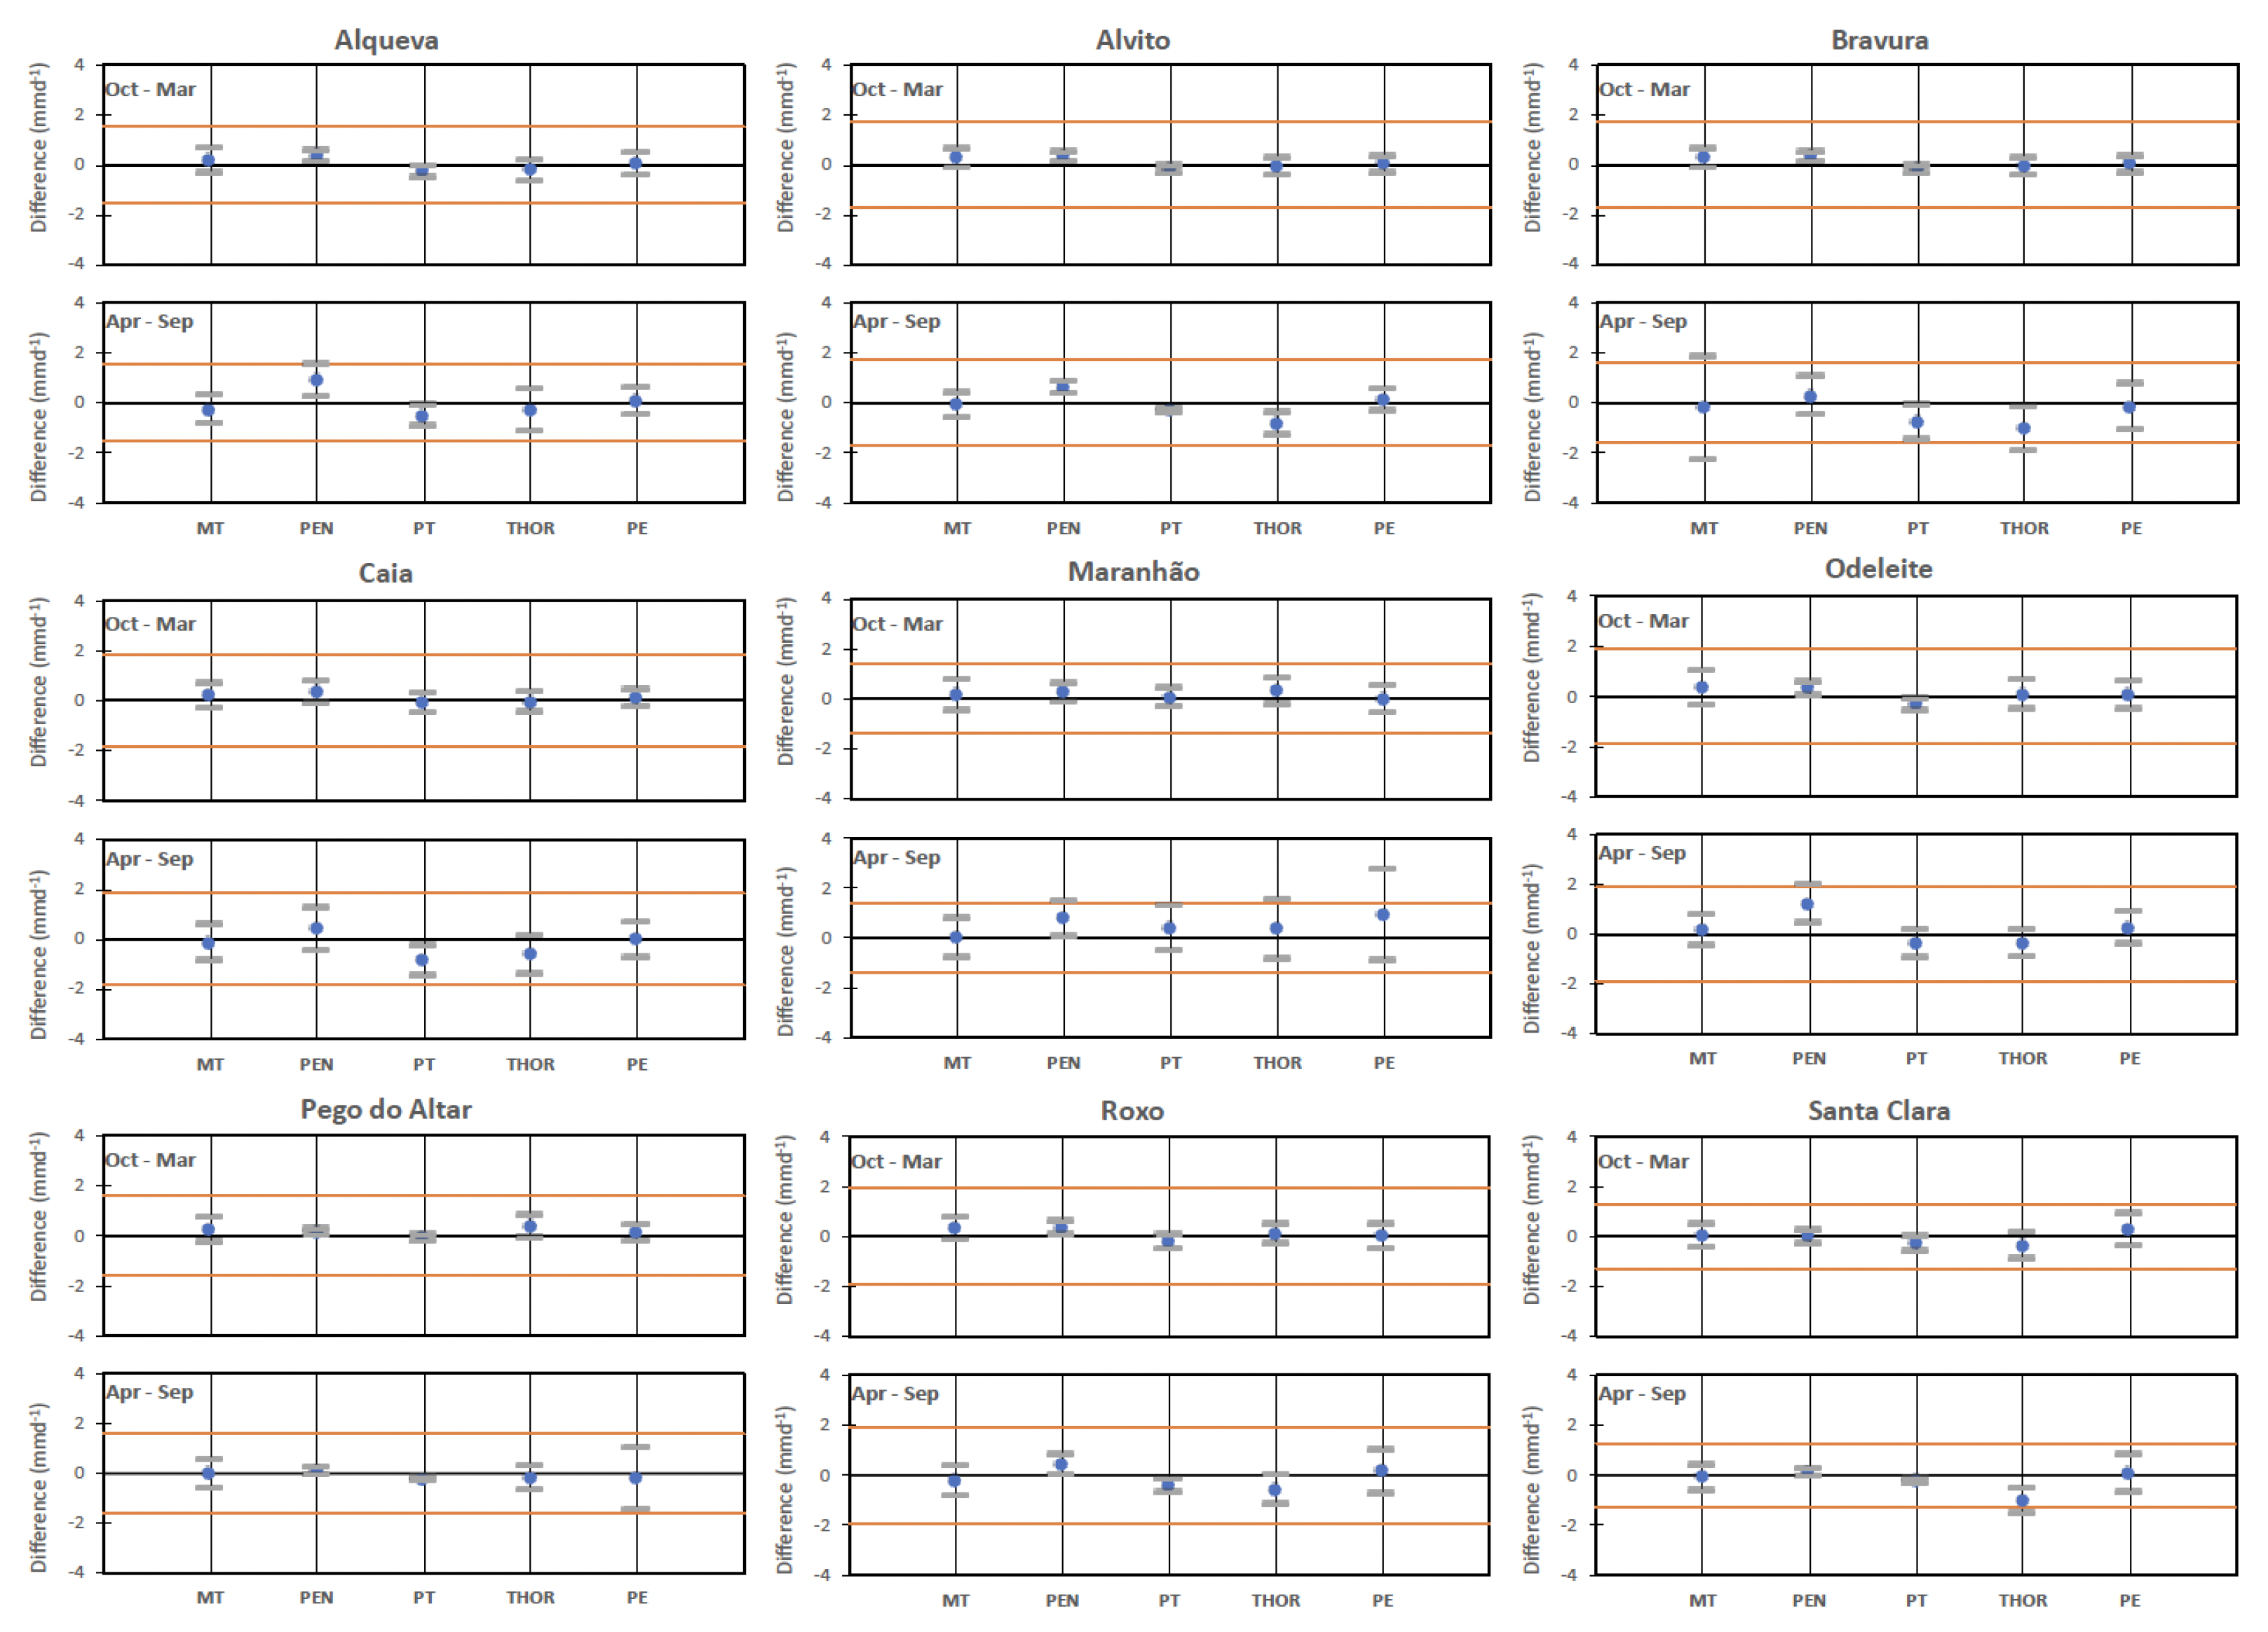
Figure 11 shows the average and standard deviation of the monthly differences between BREB evaporation values and estimates obtained from the five alternative evaporation methods. All methods yield evaporation estimates identical to BREB values during the wet semester regardless of the reservoir considered. In the dry semester, all methods provide small biases, but the standard deviations vary substantially depending on the reservoir. Larger standard deviations can be observed in the MT evaporation estimates for the Bravura reservoir and in the PEN values for the Maranhão and Pego do Altar reservoirs.
The evaluation of evaporation methods is presented using the statistical descriptors in
Table 3.
Table 8 provides the statistics and performance of the methods for all reservoirs. The MT method exhibits the highest Root Mean Square Error (RMSE) value of 1.6 mm d
in the Bravura reservoir, while the PEN method shows the lowest value of 0.16 mm d
in the Pego do Altar reservoir. The range of RMSE varies from 0.25 to 0.44 mm d
for most reservoirs, except for Santa Clara and Bravura, which have values of 0.73 mm d
and 0.95 mm d
, respectively.
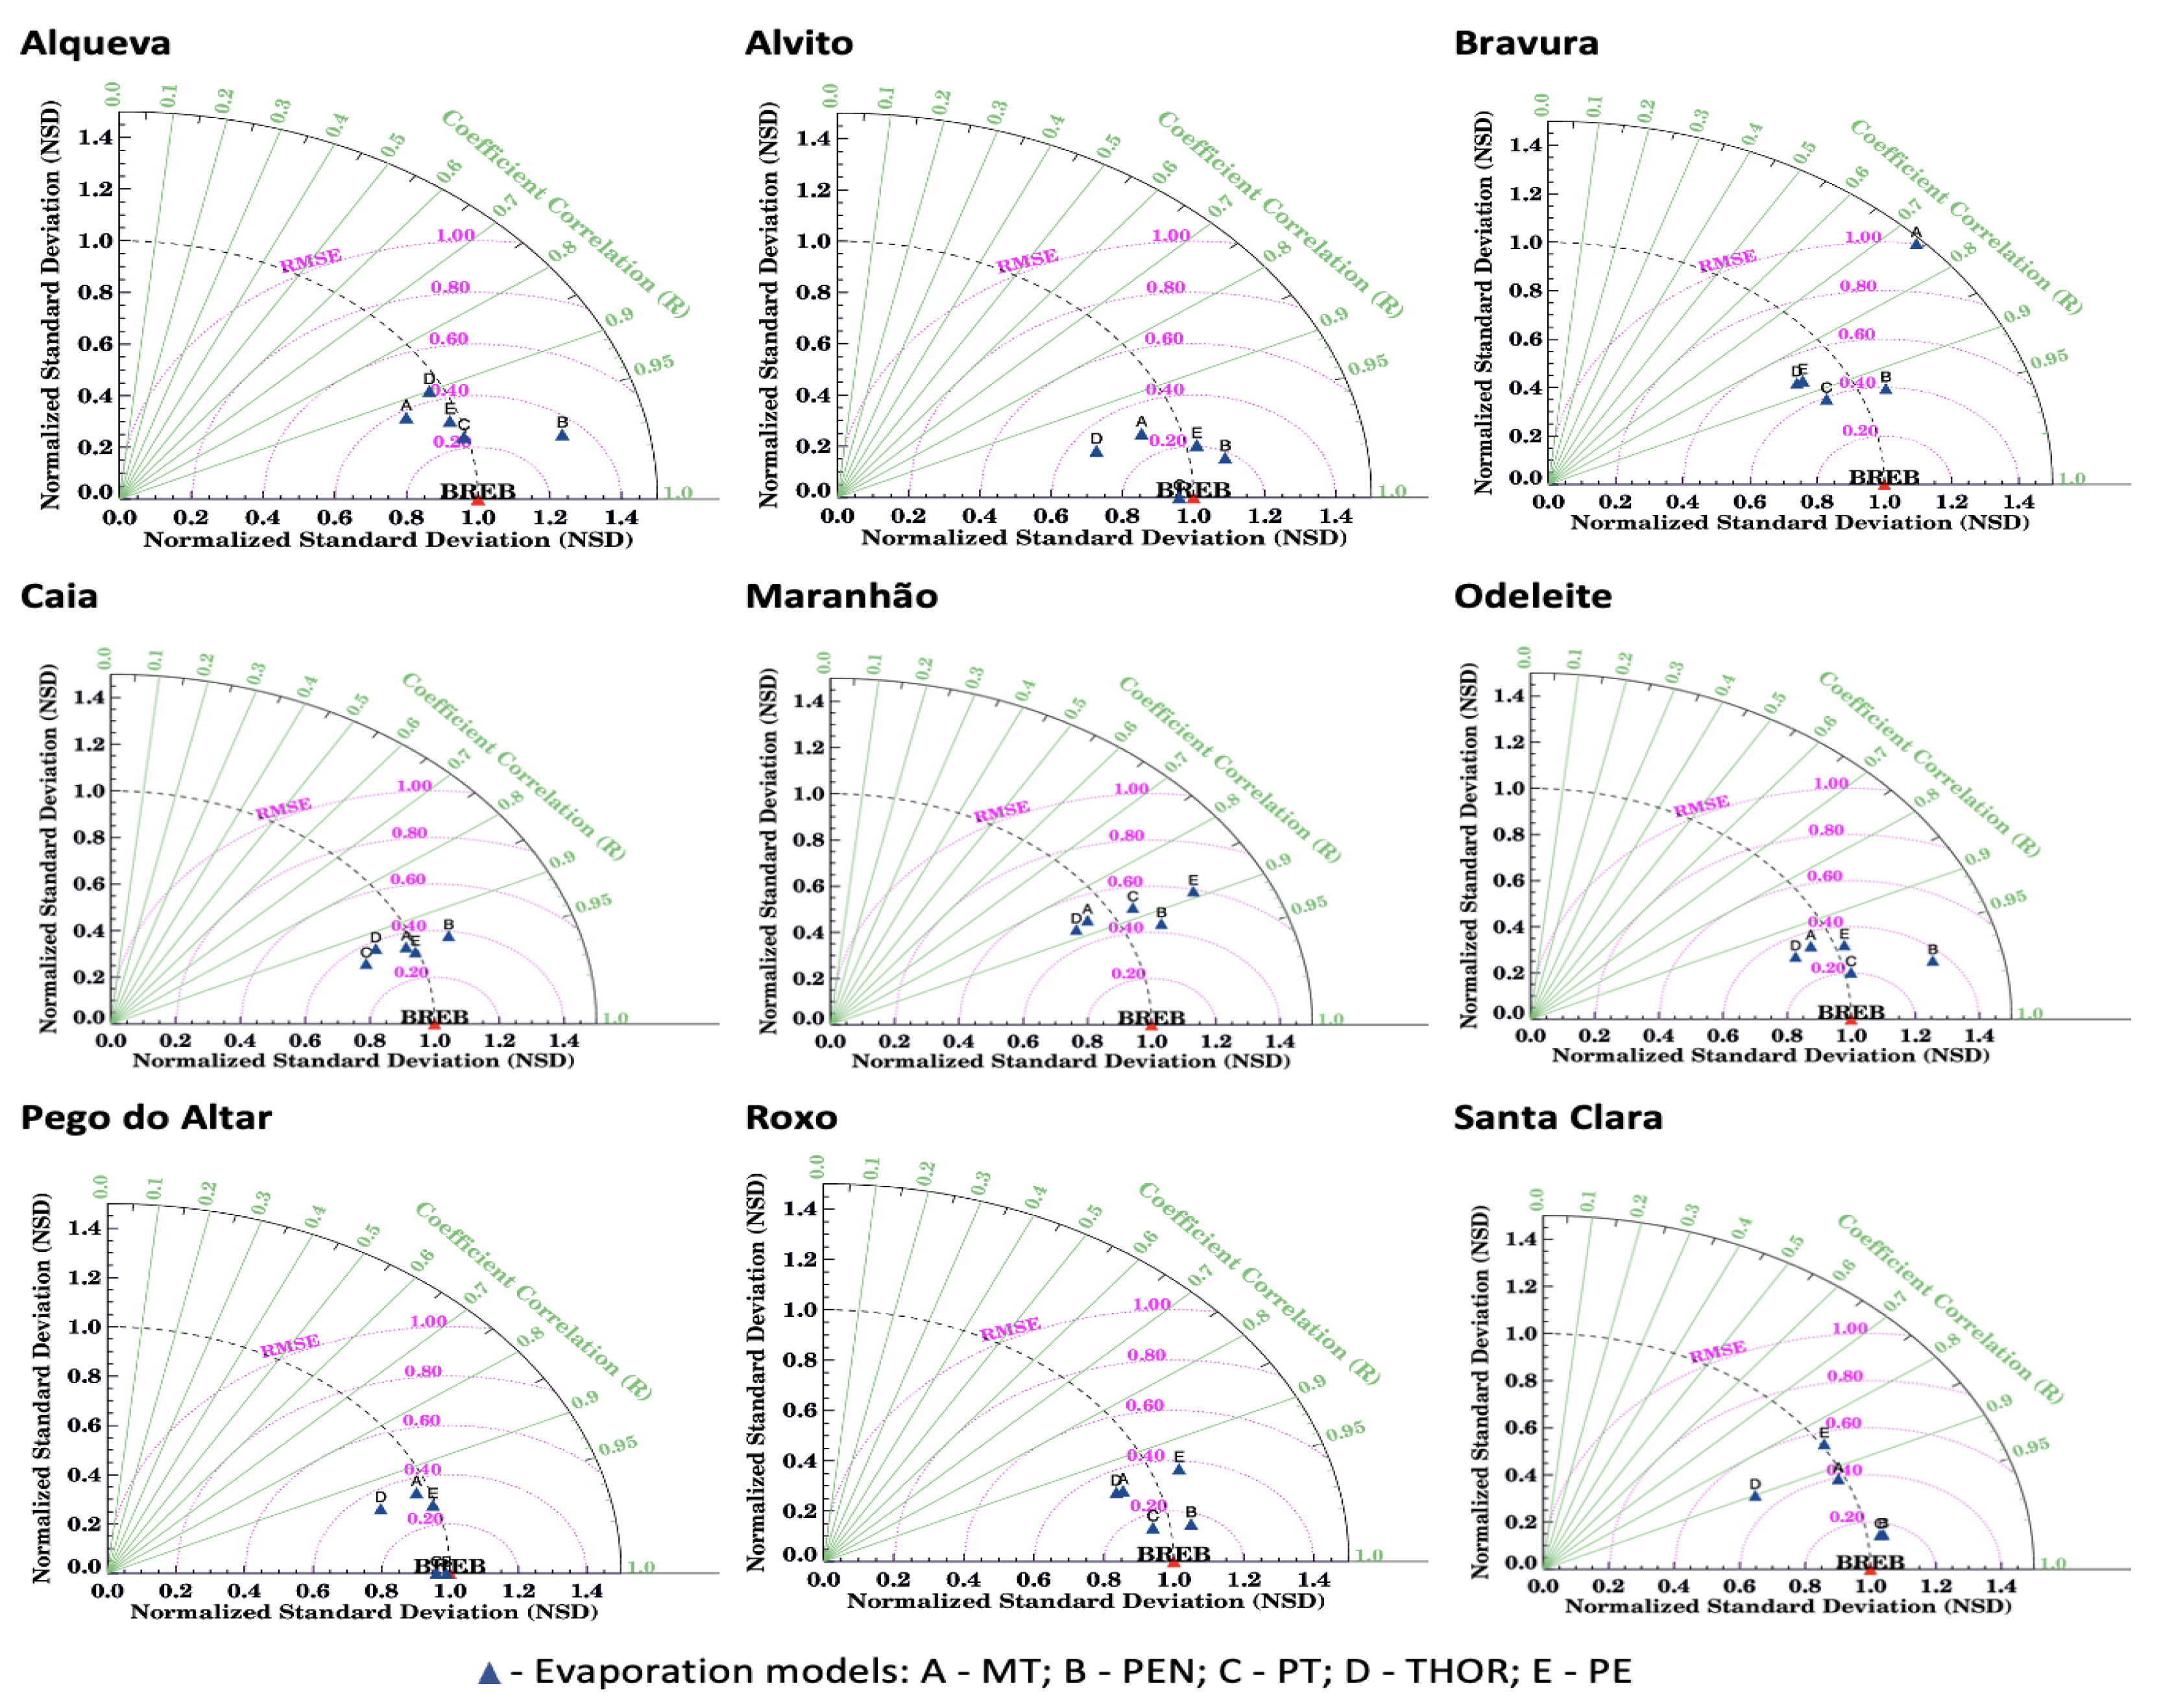
The ranking of methods was determined based on the Index of Performance (
d) (
Table 8) and the Taylor diagram [
62] (
Figure 12).
The performance of the five methods was classified as
Excellent for the Alvito, Caia, Odeleite, Pego do Altar and Roxo reservoirs. The PEN and/or PT methods generally performed better, except for the Caia reservoir, where the PE method showed better performance (
Table 8). These findings are consistent with the results from the Taylor diagram (
Figure 12).
The Taylor diagram enables stakeholders to identify the better method to apply by considering the study objectives, data availability, and time scale. For instance, in the Alqueva reservoir, the PT, THOR, and PE methods provide an excellent representation of variability, although the PEN method shows a stronger correlation. In Pego do Altar, the PEN and PT methods achieve a correlation coefficient and an NSD equal to one, with an RMSE close to zero, indicating an almost perfect agreement with the observed data.
4. Conclusions
This study presents a set of offshore meteorological data—namely, pan evaporation, downward solar radiation, atmospheric pressure, precipitation, air temperature, air relative humidity, wind speed, wind direction, and reservoir water temperature on different levels (1, 5, 10, 15, and 20 m)—obtained in nine meteorological and water temperature floating stations built in nine reservoirs located in southern Portugal. The nine reservoirs are Alqueva, Alvito, Bravura, Caia, Maranhão, Odeleite, Pego do Altar, Roxo, and Santa Clara.
At an annual scale, the simplified four-term energy balance model accurately represented the evaporation process in the reservoirs. There are three exceptions: Bravura, Caia and Maranhão that must be carefully considered.
The monthly analysis of the heat budget revealed significant variations in the latent heat flux (), which closely aligned with the changes in net radiation (). The peak values of generally occurred shortly after the peak values, indicating a slight time lag. On the other hand, the minimum flux was predominantly influenced by the heat storage change () within the reservoir system. Most reservoirs exhibited an annual approaching zero, indicating a null balance between energy gains and losses throughout the years. The sensible heat flux (H) showed relatively low values compared to other components of the energy balance. Reservoir evaporation losses demonstrate noticeable seasonal and spatial variations. The results reveal a clear seasonal pattern, with July consistently exhibiting the highest evaporation values, while January experiences the lowest rates. Across all reservoirs, the monthly evaporation varies from 0.8 mm d in winter to 4.0 mm d in summer with an average of 2.7 mm d. The northern part of the region consistently exhibits a minimum evaporation throughout the year, while the southwest Algarve region shows maximum values. This spatial pattern remains consistent during both the dry and wet seasons. The annual evaporation values span from 750 to 1230 mm, indicating a significant positive gradient from the northern part of the region toward the southwest Algarve.
Water reservoir managers often do not have access to these data; for that reason a benchmarking analysis of indirect methods [Mass Transfer (MT), Penman (PEN), Priestley and Taylor (PT), Thornthwaite (THOR), and Pan Evaporation (PE)] was carried out. The performance of the methods was evaluated by the d index and the Taylor diagram. Concerning the MT method, an equation for the mass transfer coefficient (N) function of the reservoir water surface area () was established for each reservoir, and a general overall equation to Mediterranean climate region was established, too. The reservoir evaporation estimated by the MT method showed a strong correlation with the Bowen Ratio Energy Budget (BREB) method, indicating its accuracy in estimating evaporation rates. However, slight underestimation was observed in the largest reservoir (Alqueva), and there was some overestimation in the smaller reservoir (Bravura), which may be attributed to differences in wind speed and reservoir size. The PEN method overestimated the annual evaporation rates, particularly during the dry season. The best estimates were observed for reservoirs with lower wind speeds, suggesting that the reduced aerodynamic term in the Penman equation contributed to smaller evaporation estimates. The PT method consistently underestimated evaporation rates throughout the year for most reservoirs, being more pronounced in the Bravura and Santa Clara reservoirs. The THOR method showed a tendency to underestimate the evaporation rate during the dry semester for most reservoirs, except for the Maranhão and Pego do Altar reservoirs. The offshore measured PE rates showed a strong positive correlation with the BREB estimated evaporation rates for most reservoirs, demonstrating that it is a good practice to build a offshore pan evaporation.
